Embed Size (px)
Citation preview
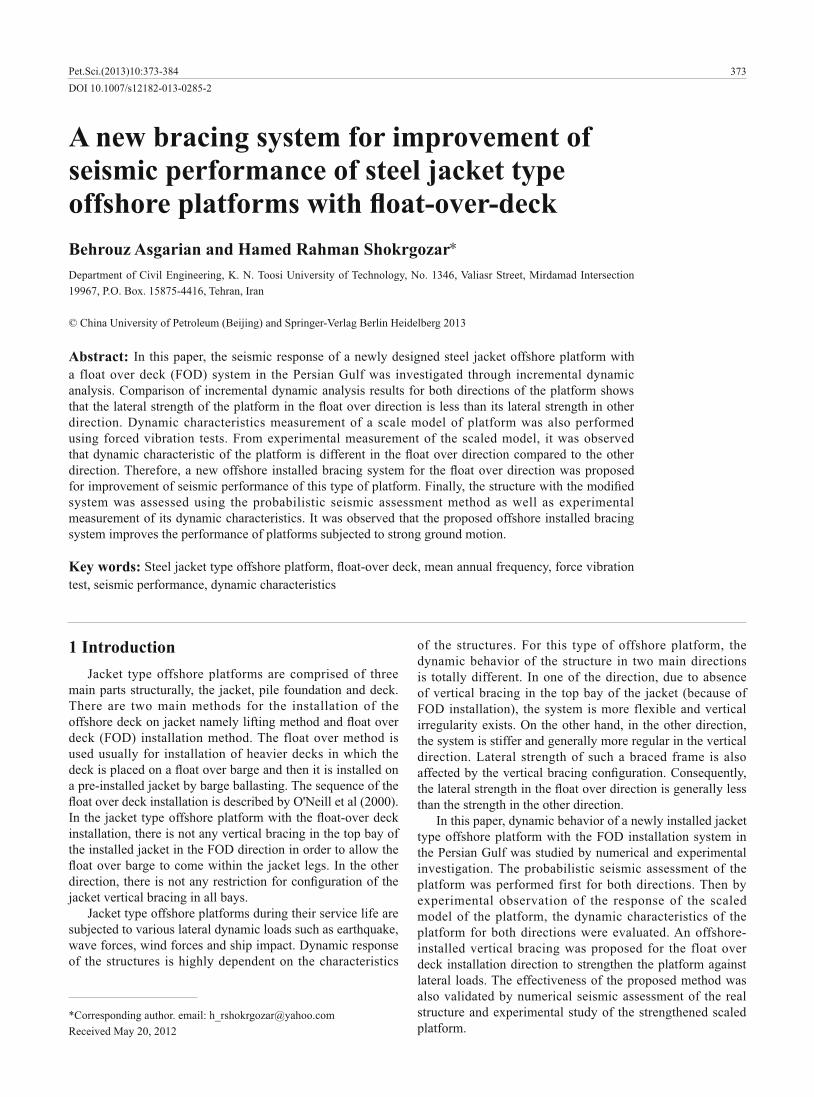
373
Behrouz Asgarian and Hamed Rahman Shokrgozar
© China University of Petroleum (Beijing) and Springer-Verlag Berlin Heidelberg 2013
Abstract: In this paper, the seismic response of a newly designed steel jacket offshore platform with a float over deck (FOD) system in the Persian Gulf was investigated through incremental dynamic analysis. Comparison of incremental dynamic analysis results for both directions of the platform shows
direction. Dynamic characteristics measurement of a scale model of platform was also performed using forced vibration tests. From experimental measurement of the scaled model, it was observed
system was assessed using the probabilistic seismic assessment method as well as experimental measurement of its dynamic characteristics. It was observed that the proposed offshore installed bracing system improves the performance of platforms subjected to strong ground motion.
Key words:test, seismic performance, dynamic characteristics
A new bracing system for improvement of seismic performance of steel jacket type
*Corresponding author. email: [email protected]
of the structures. For this type of offshore platform, the dynamic behavior of the structure in two main directions is totally different. In one of the direction, due to absence of vertical bracing in the top bay of the jacket (because of FOD installation), the system is more flexible and vertical irregularity exists. On the other hand, in the other direction, the system is stiffer and generally more regular in the vertical direction. Lateral strength of such a braced frame is also
than the strength in the other direction. In this paper, dynamic behavior of a newly installed jacket
type offshore platform with the FOD installation system in the Persian Gulf was studied by numerical and experimental investigation. The probabilistic seismic assessment of the platform was performed first for both directions. Then by experimental observation of the response of the scaled model of the platform, the dynamic characteristics of the platform for both directions were evaluated. An offshore-installed vertical bracing was proposed for the float over deck installation direction to strengthen the platform against lateral loads. The effectiveness of the proposed method was also validated by numerical seismic assessment of the real structure and experimental study of the strengthened scaled platform.
1 IntroductionJacket type offshore platforms are comprised of three
main parts structurally, the jacket, pile foundation and deck. There are two main methods for the installation of the
deck (FOD) installation method. The float over method is used usually for installation of heavier decks in which the
a pre-installed jacket by barge ballasting. The sequence of the
installation, there is not any vertical bracing in the top bay of the installed jacket in the FOD direction in order to allow the
jacket vertical bracing in all bays. Jacket type offshore platforms during their service life are
subjected to various lateral dynamic loads such as earthquake, wave forces, wind forces and ship impact. Dynamic response of the structures is highly dependent on the characteristics
374
2 Probabilistic seismic assessment of an offshore platform with a FOD system
In order to evaluate the seismic performance of structures,
closed form probabilistic assessment method. In this method
objective of the structures is stated in terms of mean annual
and Cornell (2003) presented a closed-form analytical solution for mean annual frequency of exceedance by taking into account both the aleatory and epistemic uncertainties. The mean annual frequency of exceeding a specified limit state HLS
(1)LS [ ] [ ] ( )d�� � � � � � � � � �
where [ ]� � � is the probability of the exceedance of demand (D) rather capacity (Cfc(c) is the probability density function.
HLS can be determined by decomposing the above equation into tractable pieces, the seismological part and structural engineering part, and using the total probability theorem (TPT) (Jalayer and Cornell, 2003).
The above equation can be solved by separating it into three elements, demand, capacity variable, and spectral acceleration hazard. The closed-form analytical expression of HLS after solving above equation is as follows:
(2) 2 2
2 2 2 22 RD UD RC UCUH 2 21 11 ( ) ( )2 22
LS 0 ( ) e e eC
k kk b b
aH k S
where a and b are parameters of the power-law model that expresses the relationship between spectral acceleration
( ) �� � UD,
RD, UC, and RC are uncertainty and randomness in drift k0 and k are parameters that
relationship ( 0( ) [ ]
�� � � � � � ) and UH is the
uncertainty in the spectral acceleration hazard (Jalayer and Cornell, 2003).
2.1 Platform description
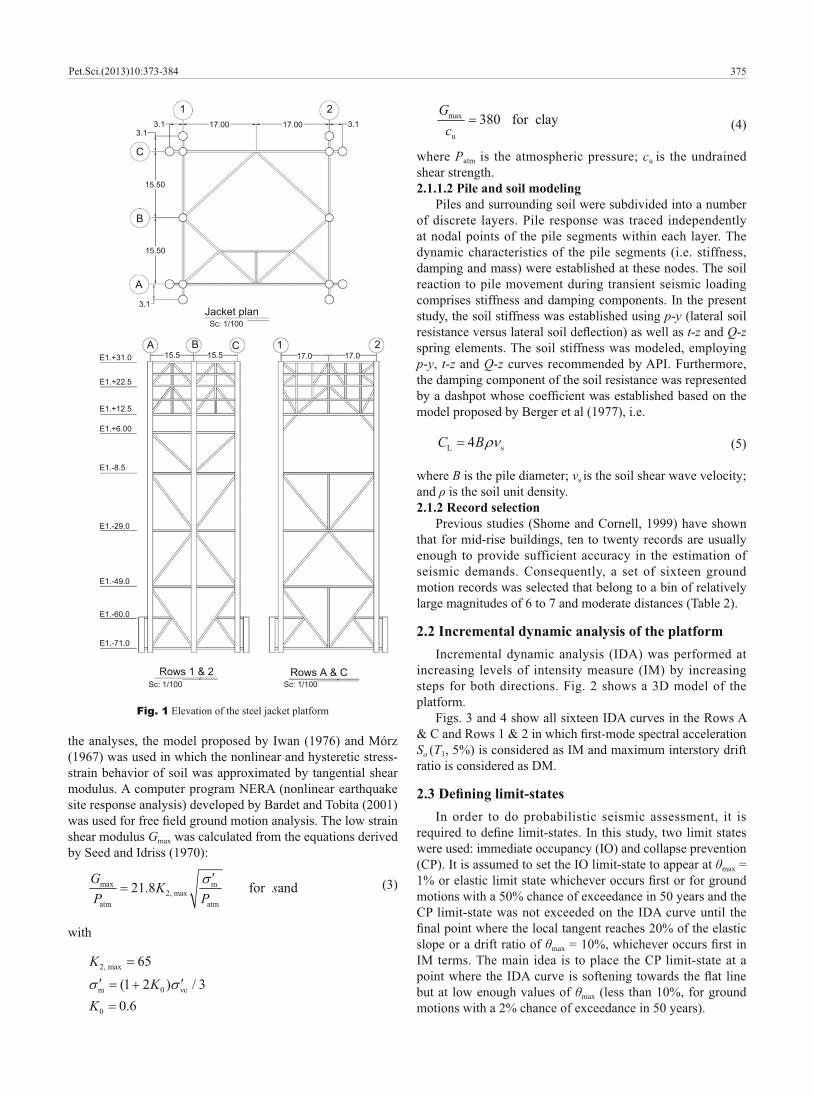
state of a newly designed jacket type offshore platform with a float over deck installation system in Persian Gulf was evaluated. For this purpose, the full 3D-model of the jacket, deck, pile foundation and its interaction with surrounding soil was developed. The height of the structure (jacket and deck) is about 102 m and the water depth is about 72 m. The jacket plan and the vertical elevation of structure are shown in Fig.
The platform has five-story deck and four-story jacket. To install the heavy deck using the float over method, there cannot be any vertical bracing element at sea level (top bay of the jacket) of Rows A & C. Due to absence of the vertical
deformation in this direction. The main characteristics of the
offshore platform are listed in Table 1.
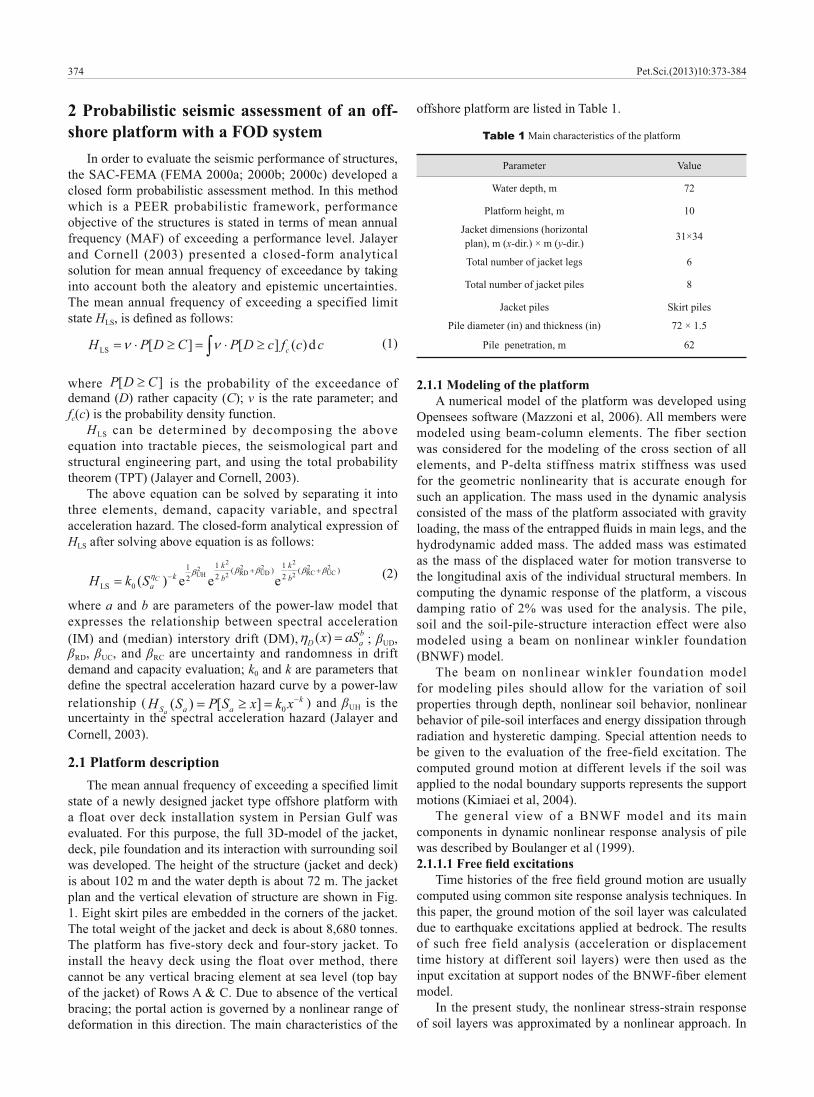
Table 1
Parameter Value
Water depth, m 72
Platform height, m 10
Jacket dimensions (horizontalplan), m (x-dir.) × m (y-dir.) 31×34
Total number of jacket legs 6
Total number of jacket piles
Jacket piles Skirt piles
Pile diameter (in) and thickness (in)
Pile penetration, m
72 × 1.5
62
2.1.1 Modeling of the platformA numerical model of the platform was developed using
modeled using beam-column elements. The fiber section was considered for the modeling of the cross section of all elements, and P-delta stiffness matrix stiffness was used for the geometric nonlinearity that is accurate enough for such an application. The mass used in the dynamic analysis consisted of the mass of the platform associated with gravity
hydrodynamic added mass. The added mass was estimated as the mass of the displaced water for motion transverse to the longitudinal axis of the individual structural members. In computing the dynamic response of the platform, a viscous damping ratio of 2% was used for the analysis. The pile, soil and the soil-pile-structure interaction effect were also modeled using a beam on nonlinear winkler foundation (BNWF) model.
The beam on nonlinear winkler foundation model for modeling piles should allow for the variation of soil properties through depth, nonlinear soil behavior, nonlinear behavior of pile-soil interfaces and energy dissipation through radiation and hysteretic damping. Special attention needs to be given to the evaluation of the free-field excitation. The computed ground motion at different levels if the soil was applied to the nodal boundary supports represents the support motions (Kimiaei et al, 2004).
The general view of a BNWF model and its main components in dynamic nonlinear response analysis of pile
computed using common site response analysis techniques. In this paper, the ground motion of the soil layer was calculated due to earthquake excitations applied at bedrock. The results of such free field analysis (acceleration or displacement time history at different soil layers) were then used as the
model.In the present study, the nonlinear stress-strain response
of soil layers was approximated by a nonlinear approach. In
375
strain behavior of soil was approximated by tangential shear
site response analysis) developed by Bardet and Tobita (2001)
shear modulus Gmax was calculated from the equations derived
(3)max m2, max
atm atm
21.8 for and � �� �
with
2, max
m 0 c
0
65
(1 2 ) / 30.6
��
�
max
u
380 for clay � (4)
where Patm cu is the undrained shear strength.2.1.1.2 Pile and soil modeling
Piles and surrounding soil were subdivided into a number of discrete layers. Pile response was traced independently at nodal points of the pile segments within each layer. The dynamic characteristics of the pile segments (i.e. stiffness, damping and mass) were established at these nodes. The soil reaction to pile movement during transient seismic loading comprises stiffness and damping components. In the present study, the soil stiffness was established using p-y (lateral soil
t-z and Q-z spring elements. The soil stiffness was modeled, employing p-y, t-z and Q-z curves recommended by API. Furthermore, the damping component of the soil resistance was represented
(5)L s4� �
where B vs
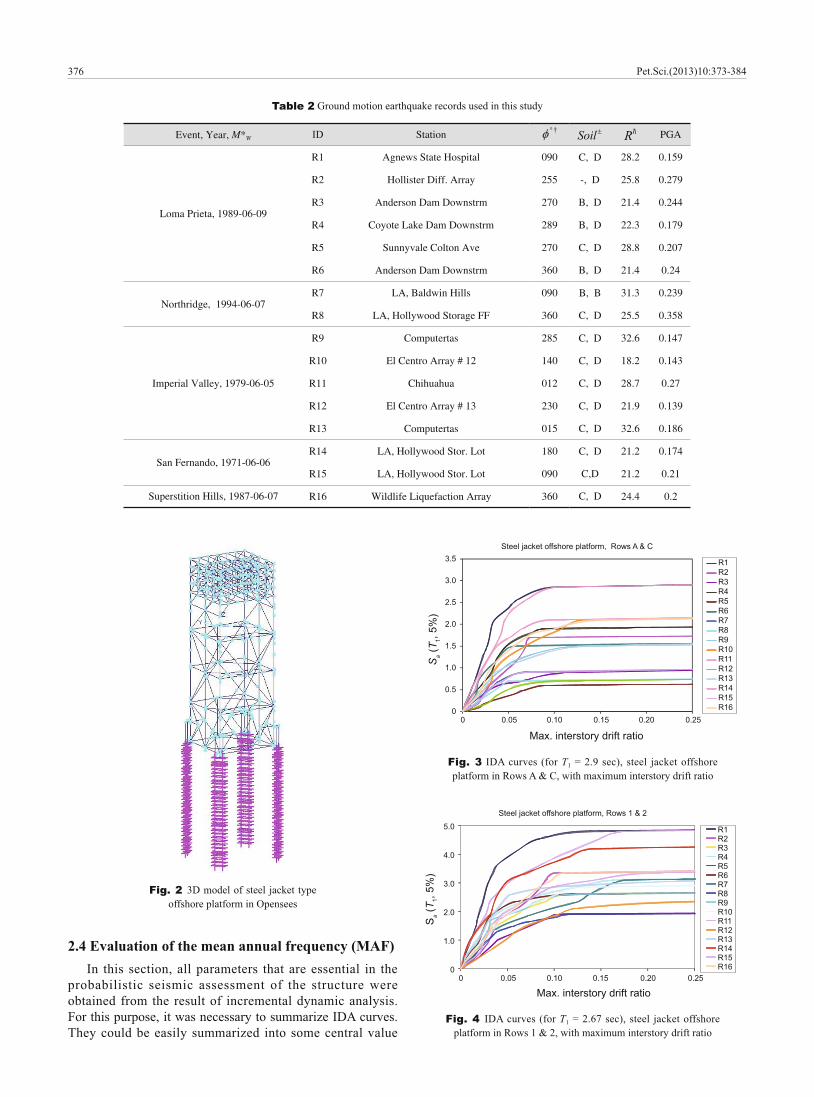
and is the soil unit density.2.1.2 Record selection
that for mid-rise buildings, ten to twenty records are usually enough to provide sufficient accuracy in the estimation of seismic demands. Consequently, a set of sixteen ground motion records was selected that belong to a bin of relatively large magnitudes of 6 to 7 and moderate distances (Table 2).
2.2 Incremental dynamic analysis of the platformIncremental dynamic analysis (IDA) was performed at
steps for both directions. Fig. 2 shows a 3D model of the platform.
Figs. 3 and 4 show all sixteen IDA curves in the Rows A
Sa (T1
In order to do probabilistic seismic assessment, it is
were used: immediate occupancy (IO) and collapse prevention (CP). It is assumed to set the IO limit-state to appear at max =
motions with a 50% chance of exceedance in 50 years and the CP limit-state was not exceeded on the IDA curve until the
slope or a drift ratio of max
but at low enough values of max (less than 10%, for ground motions with a 2% chance of exceedance in 50 years).
Fig. 1
1 23.1 17.00 17.00 3.1
3.1
C
B
15.50
15.50
3.1
A
Jacket planSc: 1/100
A B C 1 215.5 15.5 17.0 17.0E1.+31.0
E1.+22.5
E1.+12.5
E1.+6.00
E1.-8.5
E1.-29.0
E1.-49.0
E1.-60.0
E1.-71.0
Rows 1 & 2 Rows A & CSc: 1/100 Sc: 1/100
376
2.4 Evaluation of the mean annual frequency (MAF)In this section, all parameters that are essential in the
probabilistic seismic assessment of the structure were obtained from the result of incremental dynamic analysis. For this purpose, it was necessary to summarize IDA curves. They could be easily summarized into some central value
Table 2 Ground motion earthquake records used in this study
Event, Year, M*W ID Station † ���� � PGA
Loma Prieta, 1989-06-09
R1 Agnews State Hospital 090 C, D 28.2 0.159
R2 Hollister Diff. Array 255 -, D 25.8 0.279
R3 Anderson Dam Downstrm 270 B, D 21.4 0.244
R4 Coyote Lake Dam Downstrm 289 B, D 22.3 0.179
R5 Sunnyvale Colton Ave 270 C, D 28.8 0.207
R6 Anderson Dam Downstrm 360 B, D 21.4 0.24
Northridge, 1994-06-07R7 LA, Baldwin Hills 090 B, B 31.3 0.239
R8 LA, Hollywood Storage FF 360 C, D 25.5 0.358
Imperial Valley, 1979-06-05
R9 Computertas 285 C, D 32.6 0.147
R10 El Centro Array # 12 140 C, D 18.2 0.143
R11 Chihuahua 012 C, D 28.7 0.27
R12 El Centro Array # 13 230 C, D 21.9 0.139
R13 Computertas 015 C, D 32.6 0.186
San Fernando, 1971-06-06R14 LA, Hollywood Stor. Lot 180 C, D 21.2 0.174
R15 LA, Hollywood Stor. Lot 090 C,D 21.2 0.21
Superstition Hills, 1987-06-07 R16 Wildlife Liquefaction Array 360 C, D 24.4 0.2
Fig. 2 3D model of steel jacket type offshore platform in Opensees
0
0.5
1.0
1.5
2.0
2.5
3.0
3.5
0 0.05 0.10 0.15 0.20 0.25
Sa (
T 1, 5%
)
Max. interstory drift ratio
Steel jacket offshore platform, Rows A & C
R1R2R3R4R5R6R7R8R9R10R11R12R13R14R15R16
Fig. 3 IDA curves (for T1
platform in Rows A & C, with maximum interstory drift ratio
Fig. 4 IDA curves (for T1 = 2.67 sec), steel jacket offshore platform in Rows 1 & 2, with maximum interstory drift ratio
0
1.0
2.0
3.0
4.0
5.0
0 0.05 0.10 0.15 0.20 0.25
Max. interstory drift ratio
Steel jacket offshore platform, Rows 1 & 2
R1R2R3R4R5R6R7R8R9R10R11R12R13R14R15R16
Sa (
T 1, 5%
)
377
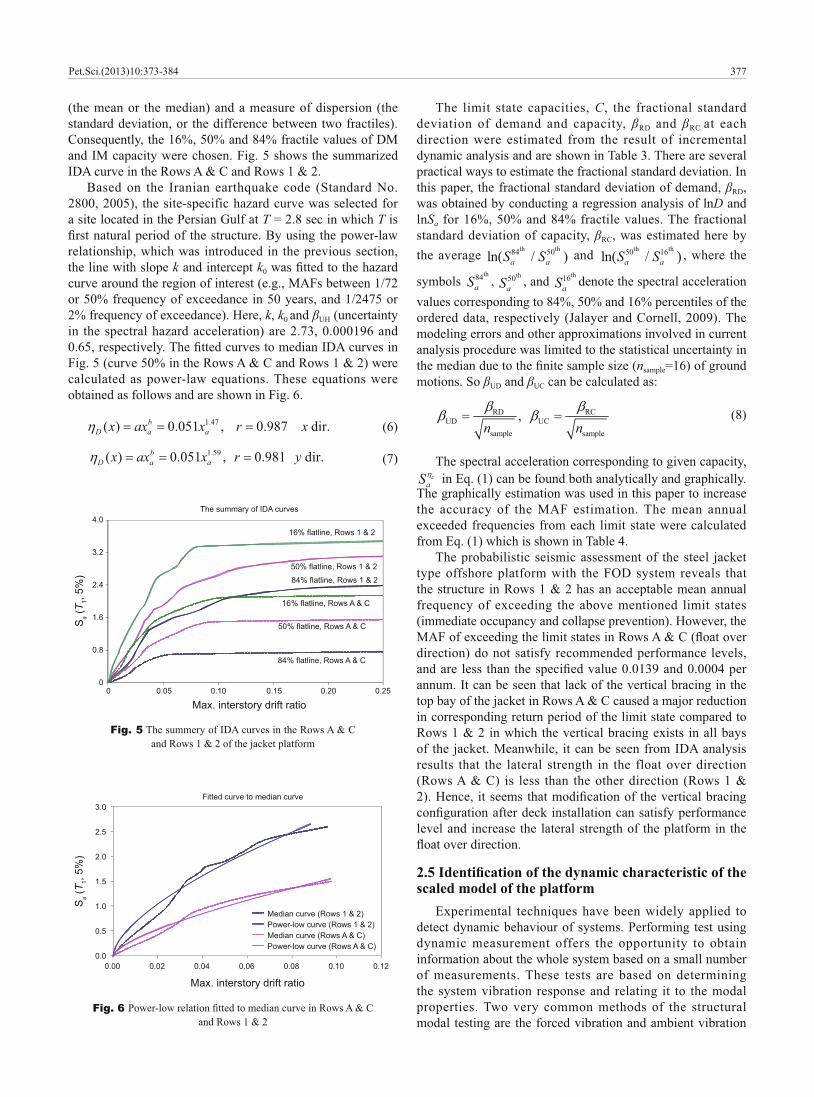
(the mean or the median) and a measure of dispersion (the standard deviation, or the difference between two fractiles).
IDA curve in the Rows A & C and Rows 1 & 2.Based on the Iranian earthquake code (Standard No.
a site located in the Persian Gulf at T T is
relationship, which was introduced in the previous section, the line with slope k and intercept k0
or 50% frequency of exceedance in 50 years, and 1/2475 or 2% frequency of exceedance). Here, k, k0 and UH (uncertainty
Fig. 5 (curve 50% in the Rows A & C and Rows 1 & 2) were calculated as power-law equations. These equations were obtained as follows and are shown in Fig. 6.
1.47( ) 0.051 , 0.987 dir.�� �
(6)
1.59( ) 0.051 , 0.981 dir.�� � � (7)
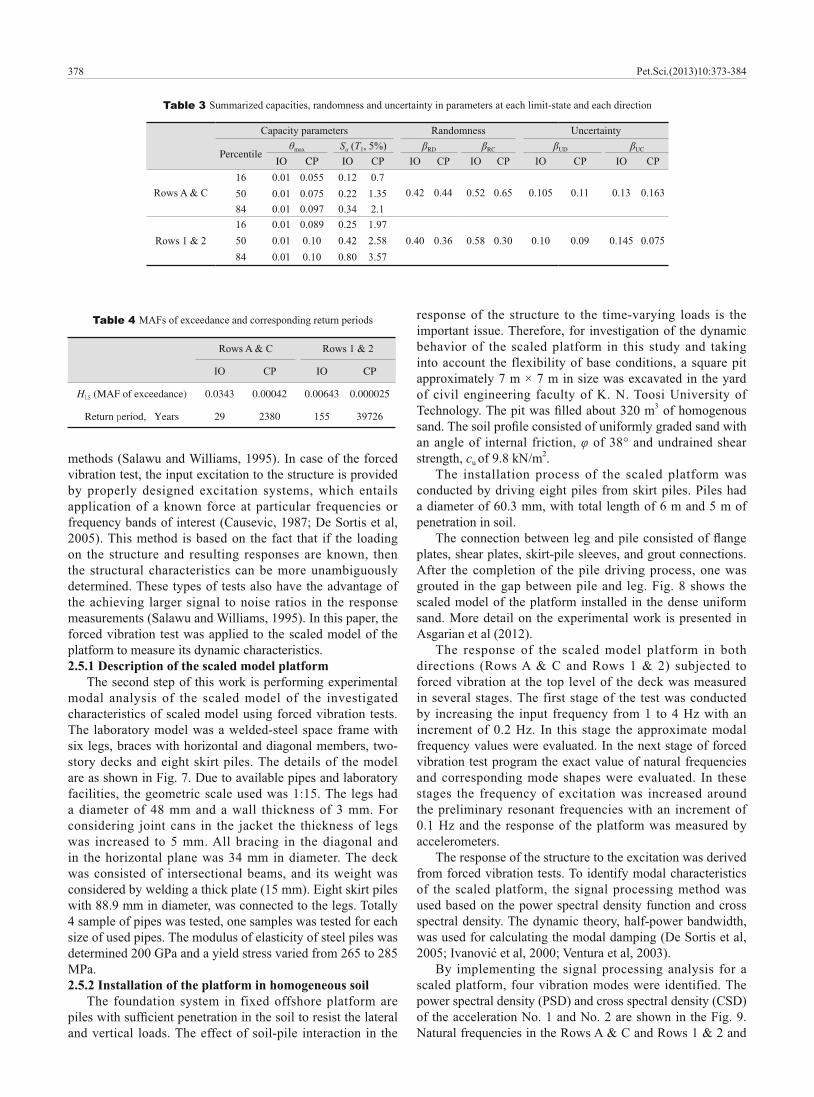
The limit state capacities, C, the fractional standard deviation of demand and capacity, RD and RC at each direction were estimated from the result of incremental dynamic analysis and are shown in Table 3. There are several practical ways to estimate the fractional standard deviation. In this paper, the fractional standard deviation of demand, RD, was obtained by conducting a regression analysis of lnD and lnSa standard deviation of capacity, RC, was estimated here by the average th th84 50ln( / ) � � and th th50 16ln( / ) � � , where the
symbols th84
� , th50� , and th16
� denote the spectral acceleration
modeling errors and other approximations involved in current analysis procedure was limited to the statistical uncertainty in
nsample=16) of ground motions. So UD and UC can be calculated as:
RCRDUD UC
sample sample
,� �
The spectral acceleration corresponding to given capacity, �
�The graphically estimation was used in this paper to increase
exceeded frequencies from each limit state were calculated
The probabilistic seismic assessment of the steel jacket type offshore platform with the FOD system reveals that the structure in Rows 1 & 2 has an acceptable mean annual frequency of exceeding the above mentioned limit states (immediate occupancy and collapse prevention). However, the
direction) do not satisfy recommended performance levels,
annum. It can be seen that lack of the vertical bracing in the top bay of the jacket in Rows A & C caused a major reduction in corresponding return period of the limit state compared to Rows 1 & 2 in which the vertical bracing exists in all bays
results that the lateral strength in the float over direction (Rows A & C) is less than the other direction (Rows 1 &
level and increase the lateral strength of the platform in the
scaled model of the platform
detect dynamic behaviour of systems. Performing test using dynamic measurement offers the opportunity to obtain information about the whole system based on a small number of measurements. These tests are based on determining the system vibration response and relating it to the modal properties. Two very common methods of the structural modal testing are the forced vibration and ambient vibration
Fig. 5 The summery of IDA curves in the Rows A & C and Rows 1 & 2 of the jacket platform
0
0.8
1.6
2.4
3.2
4.0
0 0.05 0.10 0.15 0.20 0.25
Max. interstory drift ratio
The summary of IDA curves
84% flatline, Rows A & C
16% flatline, Rows 1 & 2
50% flatline, Rows 1 & 2
84% flatline, Rows 1 & 2
50% flatline, Rows A & C
16% flatline, Rows A & C
Sa (
T 1, 5%
)
Fig. 6 and Rows 1 & 2
0.0
0.5
1.0
1.5
2.0
2.5
3.0
0.00 0.02 0.04 0.06 0.08 0.10 0.12
Max. interstory drift ratio
Fitted curve to median curve
Median curve (Rows 1 & 2)Power-low curve (Rows 1 & 2)Median curve (Rows A & C)Power-low curve (Rows A & C)
Sa (
T 1, 5%
)
vibration test, the input excitation to the structure is provided by properly designed excitation systems, which entails application of a known force at particular frequencies or
2005). This method is based on the fact that if the loading on the structure and resulting responses are known, then the structural characteristics can be more unambiguously determined. These types of tests also have the advantage of the achieving larger signal to noise ratios in the response
forced vibration test was applied to the scaled model of the platform to measure its dynamic characteristics.2.5.1 Description of the scaled model platform
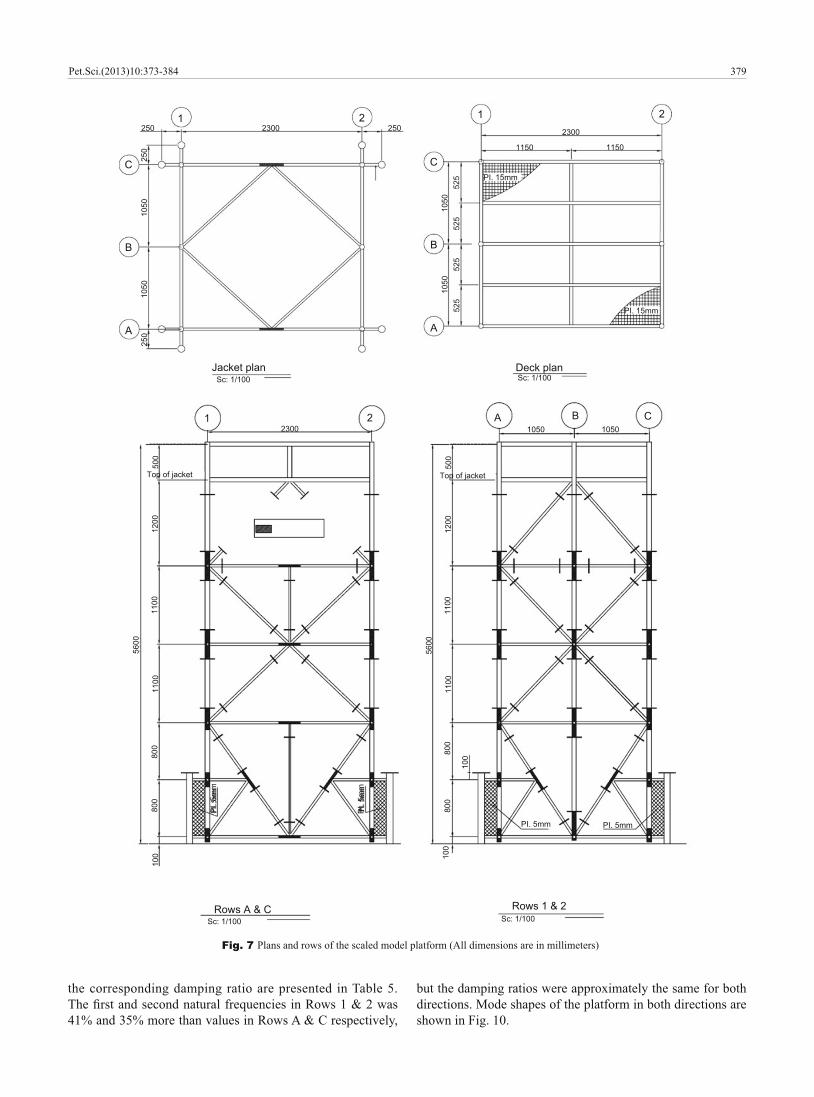
The second step of this work is performing experimental modal analysis of the scaled model of the investigated characteristics of scaled model using forced vibration tests. The laboratory model was a welded-steel space frame with six legs, braces with horizontal and diagonal members, two-story decks and eight skirt piles. The details of the model are as shown in Fig. 7. Due to available pipes and laboratory facilities, the geometric scale used was 1:15. The legs had
considering joint cans in the jacket the thickness of legs was increased to 5 mm. All bracing in the diagonal and in the horizontal plane was 34 mm in diameter. The deck was consisted of intersectional beams, and its weight was
4 sample of pipes was tested, one samples was tested for each size of used pipes. The modulus of elasticity of steel piles was
2.5.2 Installation of the platform in homogeneous soil The foundation system in fixed offshore platform are
and vertical loads. The effect of soil-pile interaction in the
response of the structure to the time-varying loads is the important issue. Therefore, for investigation of the dynamic behavior of the scaled platform in this study and taking into account the flexibility of base conditions, a square pit approximately 7 m × 7 m in size was excavated in the yard of civil engineering faculty of K. N. Toosi University of
3 of homogenous
an angle of internal friction, strength, cu
2. The installation process of the scaled platform was
conducted by driving eight piles from skirt piles. Piles had a diameter of 60.3 mm, with total length of 6 m and 5 m of penetration in soil.
plates, shear plates, skirt-pile sleeves, and grout connections. After the completion of the pile driving process, one was
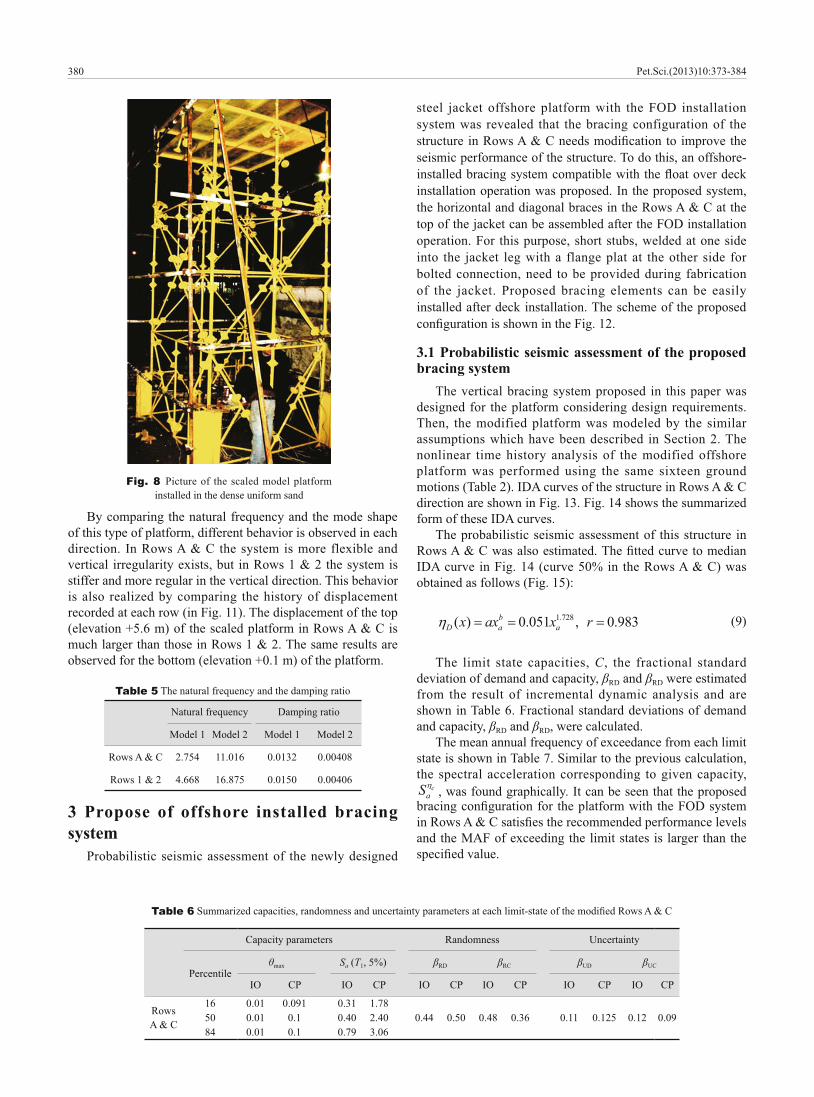
scaled model of the platform installed in the dense uniform
Asgarian et al (2012).The response of the scaled model platform in both
directions (Rows A & C and Rows 1 & 2) subjected to forced vibration at the top level of the deck was measured in several stages. The first stage of the test was conducted by increasing the input frequency from 1 to 4 Hz with an increment of 0.2 Hz. In this stage the approximate modal frequency values were evaluated. In the next stage of forced vibration test program the exact value of natural frequencies and corresponding mode shapes were evaluated. In these stages the frequency of excitation was increased around the preliminary resonant frequencies with an increment of 0.1 Hz and the response of the platform was measured by accelerometers.
The response of the structure to the excitation was derived from forced vibration tests. To identify modal characteristics of the scaled platform, the signal processing method was used based on the power spectral density function and cross spectral density. The dynamic theory, half-power bandwidth, was used for calculating the modal damping (De Sortis et al,
By implementing the signal processing analysis for a scaled platform, four vibration modes were identified. The power spectral density (PSD) and cross spectral density (CSD)
Natural frequencies in the Rows A & C and Rows 1 & 2 and
Table 3 Summarized capacities, randomness and uncertainty in parameters at each limit-state and each direction
Capacity parameters Randomness Uncertainty
Percentilemax Sa (T1, 5%) RD RC UD UC
IO CP IO CP IO CP IO CP IO CP IO CP
Rows A & C16 0.01 0.055 0.12 0.7
0.42 0.44 0.52 0.65 0.105 0.11 0.13 0.16350 0.01 0.075 0.22 1.350.01 0.34 2.1
Rows 1 & 216 0.01 0.25
0.40 0.36 0.30 0.10 0.145 0.07550 0.01 0.10 0.420.01 0.10 3.57
Table 4
Rows A & C Rows 1 & 2
IO CP IO CP
H (MAF of exceedance) 0.0343 0.00042 0.00643 0.000025
Return eriod Years 29 2380 155
the corresponding damping ratio are presented in Table 5.
41% and 35% more than values in Rows A & C respectively,
but the damping ratios were approximately the same for both
shown in Fig. 10.
Fig. 7 Plans and rows of the scaled model platform (All dimensions are in millimeters)
1 2
1050
250 2300 250
250
1050
C
B
A
C
B
A
250
Jacket planSc: 1/100
Deck planSc: 1/100
1050
1050
525
525
525
525
2300
1150 1150
PI. 15mm
PI. 15mm
1 2
1 2 A B C1050 10502300
500
Top of jacket
1200
1100
1100
800
800
100
5600
PI.
5mm
PI.
5mm
Rows 1 & 2Sc: 1/100
Rows A & CSc: 1/100
500
Top of jacket
1200
1100
1100
800
800
100
5600
PI. 5mm PI. 5mm
100
By comparing the natural frequency and the mode shape of this type of platform, different behavior is observed in each direction. In Rows A & C the system is more flexible and vertical irregularity exists, but in Rows 1 & 2 the system is stiffer and more regular in the vertical direction. This behavior is also realized by comparing the history of displacement recorded at each row (in Fig. 11). The displacement of the top (elevation +5.6 m) of the scaled platform in Rows A & C is much larger than those in Rows 1 & 2. The same results are observed for the bottom (elevation +0.1 m) of the platform.
Table 5 The natural frequency and the damping ratio
Natural frequency Damping ratio
Rows A & C 2.754 11.016 0.0132
Rows 1 & 2 0.0150 0.00406
3 Propose of offshore installed bracing system
Probabilistic seismic assessment of the newly designed
steel jacket offshore platform with the FOD installation system was revealed that the bracing configuration of the
seismic performance of the structure. To do this, an offshore-
installation operation was proposed. In the proposed system, the horizontal and diagonal braces in the Rows A & C at the top of the jacket can be assembled after the FOD installation operation. For this purpose, short stubs, welded at one side into the jacket leg with a flange plat at the other side for bolted connection, need to be provided during fabrication of the jacket. Proposed bracing elements can be easily installed after deck installation. The scheme of the proposed
3.1 Probabilistic seismic assessment of the proposed bracing system
The vertical bracing system proposed in this paper was designed for the platform considering design requirements. Then, the modified platform was modeled by the similar assumptions which have been described in Section 2. The nonlinear time history analysis of the modified offshore platform was performed using the same sixteen ground motions (Table 2). IDA curves of the structure in Rows A & C direction are shown in Fig. 13. Fig. 14 shows the summarized form of these IDA curves.
The probabilistic seismic assessment of this structure in
IDA curve in Fig. 14 (curve 50% in the Rows A & C) was obtained as follows (Fig. 15):
1.728( ) 0.051 , 0.983�� �
The limit state capacities, C, the fractional standard deviation of demand and capacity, RD and RD were estimated from the result of incremental dynamic analysis and are shown in Table 6. Fractional standard deviations of demand and capacity, RD and RD, were calculated.
The mean annual frequency of exceedance from each limit state is shown in Table 7. Similar to the previous calculation, the spectral acceleration corresponding to given capacity,
�� , was found graphically. It can be seen that the proposed
Fig. 8 Picture of the scaled model platform installed in the dense uniform sand
Table 6
Capacity parameters Randomness Uncertainty
Percentilemax Sa (T1, 5%) RD RC UD UC
IO CP IO CP IO CP IO CP IO CP IO CP
RowsA & C
16 0.01 0.310.44 0.50 0.36 0.11 0.125 0.1250 0.01 0.1 0.40 2.40
0.01 0.1 3.06
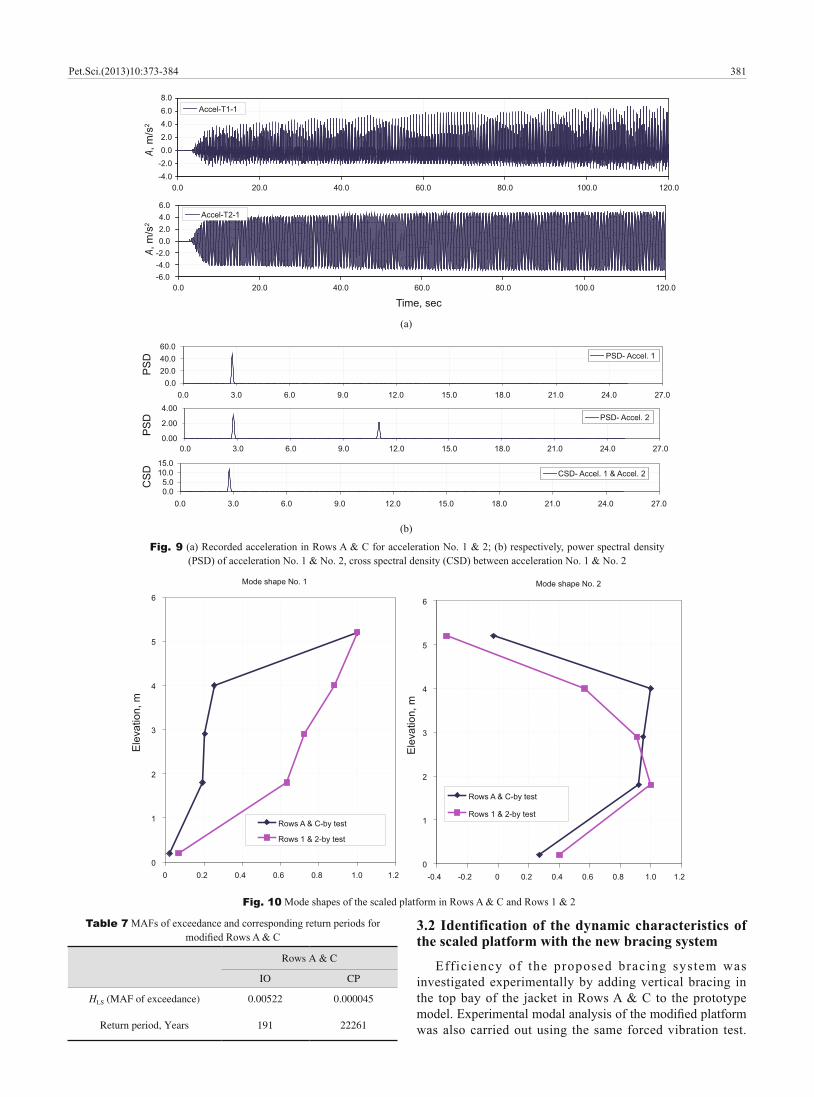
Table 7
Rows A & C
IO CP
HLS (MAF of exceedance) 0.00522 0.000045
Return period, Years 191 22261
Fig. 9(PSD) of acceleration No. 1 & No. 2, cross spectral density (CSD) between acceleration No. 1 & No. 2
-4.0-2.00.02.04.06.08.0
0.0 20.0 40.0 60.0 80.0 100.0 120.0
A, m
/s2
Accel-T1-1
-6.0-4.0-2.00.02.04.06.0
0.0 20.0 40.0 60.0 80.0 100.0 120.0
Time, sec
Accel-T2-1
A, m
/s2
0.020.040.060.0
0.0 3.0 6.0 9.0 12.0 15.0 18.0 21.0 24.0 27.0
PSD- Accel. 1
0.00
2.00
4.00
0.0 3.0 6.0 9.0 12.0 15.0 18.0 21.0 24.0 27.0
PSD- Accel. 2
0.05.0
10.015.0
0.0 3.0 6.0 9.0 12.0 15.0 18.0 21.0 24.0 27.0
CSD- Accel. 1 & Accel. 2
PS
DP
SD
CS
D
(a)
(b)
3.2 Identification of the dynamic characteristics of the scaled platform with the new bracing system
investigated experimentally by adding vertical bracing in the top bay of the jacket in Rows A & C to the prototype
was also carried out using the same forced vibration test.
Fig. 10
Mode shape No. 1
0
1
2
3
4
5
6
0 0.2 0.4 0.6 0.8 1.0 1.2
Ele
vatio
n, m
Rows A & C-by test
Rows 1 & 2-by test
Mode shape No. 2
0
1
2
3
4
5
6
-0.4 -0.2 0 0.2 0.4 0.6 0.8 1.0 1.2
Rows A & C-by test
Rows 1 & 2-by test
Ele
vatio
n, m
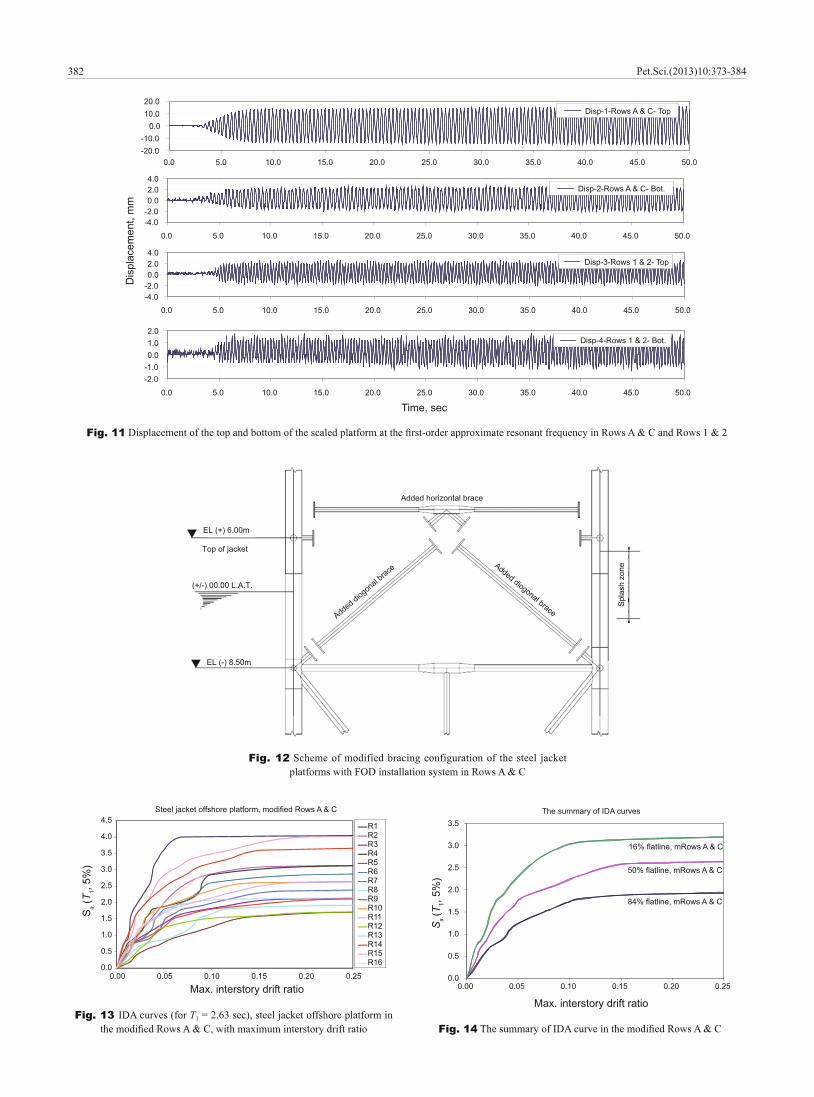
Fig. 11
-20.0-10.0
0.010.020.0
0.0 5.0 10.0 15.0 20.0 25.0 30.0 35.0 40.0 45.0 50.0
Disp-1-Rows A & C- Top
-4.0-2.00.02.04.0
0.0 5.0 10.0 15.0 20.0 25.0 30.0 35.0 40.0 45.0 50.0
Disp-2-Rows A & C- Bot.
-4.0-2.00.02.04.0
0.0 5.0 10.0 15.0 20.0 25.0 30.0 35.0 40.0 45.0 50.0
Disp-3-Rows 1 & 2- Top
-2.0-1.00.01.02.0
0.0 5.0 10.0 15.0 20.0 25.0 30.0 35.0 40.0 45.0 50.0
Time, sec
Disp-4-Rows 1 & 2- Bot.
Dis
plac
emen
t, m
m
Fig. 12 Scheme of modified bracing configuration of the steel jacket platforms with FOD installation system in Rows A & C
EL (+) 6.00m
Top of jacket
(+/-) 00.00 L.A.T.
EL (-) 8.50m
Added horizontal brace
Added diogonal brace
Added diogonal braceS
plas
h zo
ne
0.0
0.5
1.0
1.5
2.0
2.5
3.0
3.5
4.0
4.5
0.00 0.05 0.10 0.15 0.20 0.25
Sa (
T 1, 5%
)
Max. interstory drift ratio
Steel jacket offshore platform, modified Rows A & C
R1R2R3R4R5R6R7R8R9R10R11R12R13R14R15R16
Fig. 13 IDA curves (for T1 = 2.63 sec), steel jacket offshore platform in Fig. 14
0.0
0.5
1.0
1.5
2.0
2.5
3.0
3.5
0.00 0.05 0.10 0.15 0.20 0.25
Max. interstory drift ratio
The summary of IDA curves
84% flatline, mRows A & C
50% flatline, mRows A & C
16% flatline, mRows A & C
Sa (T
1, 5%
)
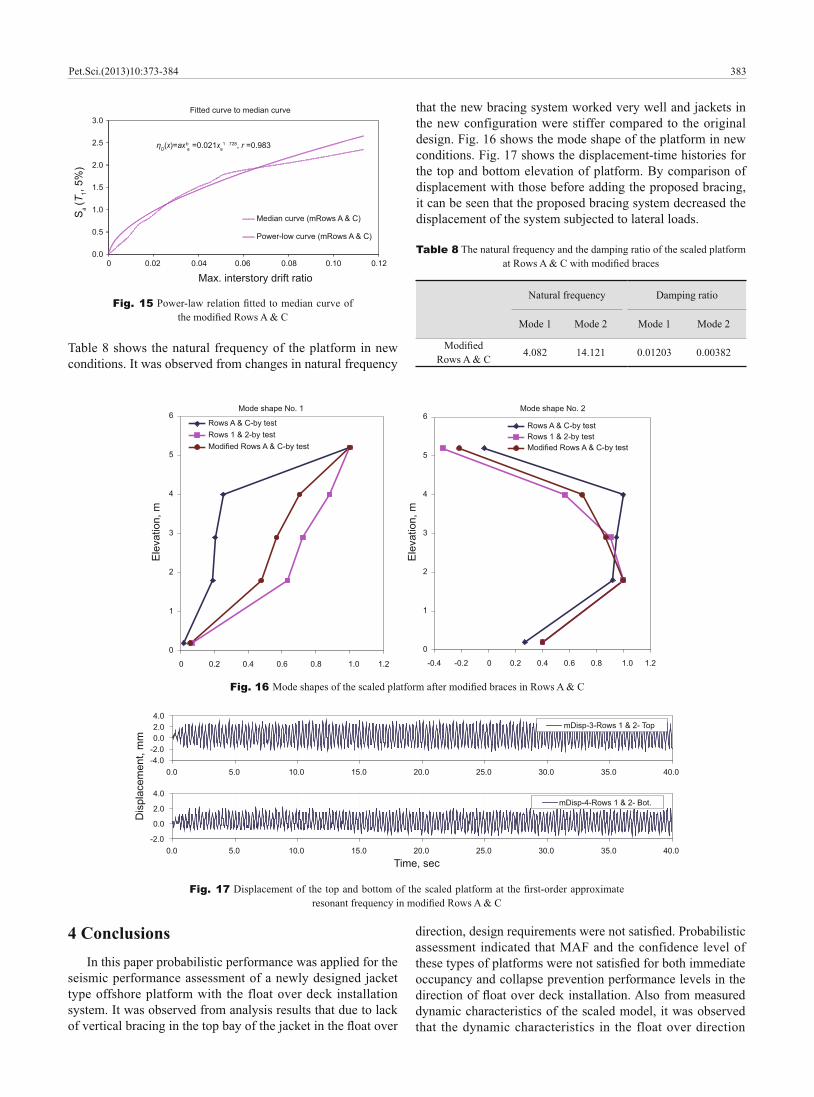
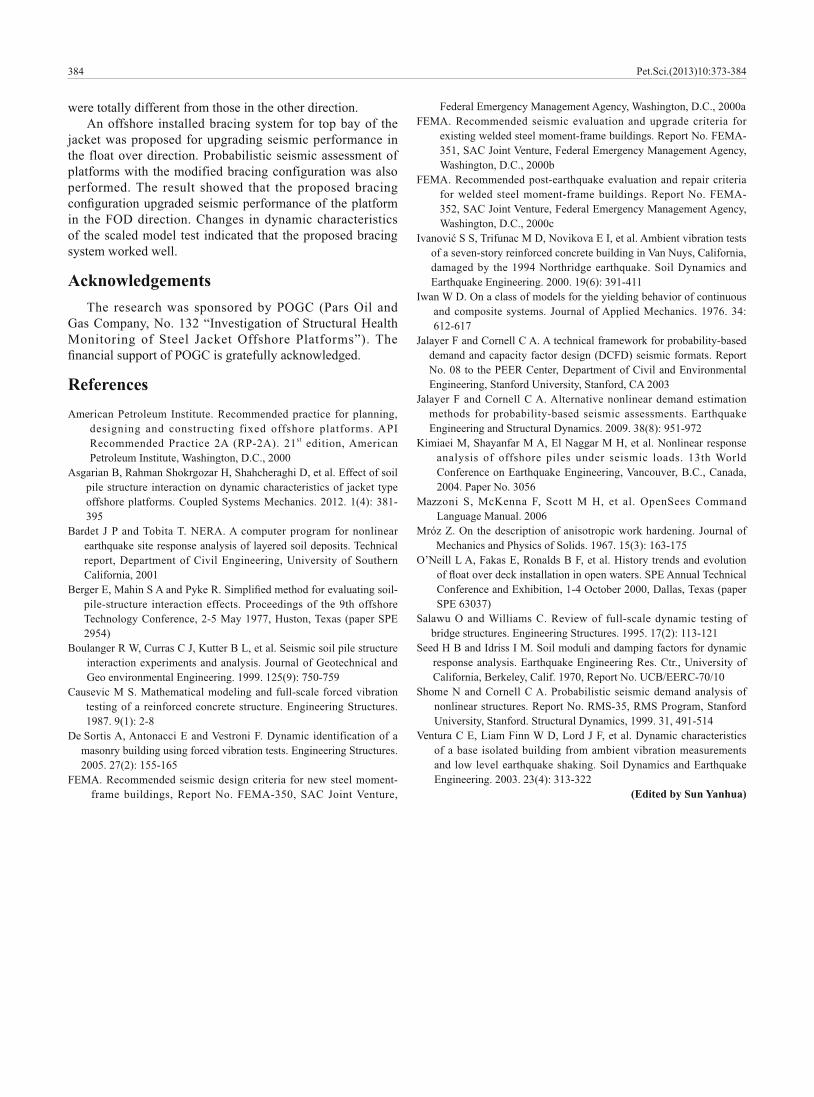
conditions. It was observed from changes in natural frequency
that the new bracing system worked very well and jackets in the new configuration were stiffer compared to the original design. Fig. 16 shows the mode shape of the platform in new conditions. Fig. 17 shows the displacement-time histories for the top and bottom elevation of platform. By comparison of displacement with those before adding the proposed bracing, it can be seen that the proposed bracing system decreased the displacement of the system subjected to lateral loads.
Table 8 The natural frequency and the damping ratio of the scaled platform
Natural frequency Damping ratio
Rows A & C 14.121 0.01203
Fig. 15
0.0
0.5
1.0
1.5
2.0
2.5
3.0
0 0.02 0.04 0.06 0.08 0.10 0.12
Max. interstory drift ratio
Fitted curve to median curve
Median curve (mRows A & C)
Power-low curve (mRows A & C)
D(x)=ax ba =0.021xa
1 .728, r =0.983
Sa (T
1, 5%
)
Mode shape No. 1
0
1
2
3
4
5
6
0 0.2 0.4 0.6 0.8 1.0 1.2
Ele
vatio
n, m
Rows A & C-by testRows 1 & 2-by testModified Rows A & C-by test
Mode shape No. 2
0
1
2
3
4
5
6
-0.4 -0.2 0 0.2 0.4 0.6 0.8 1.0 1.2
Rows A & C-by testRows 1 & 2-by testModified Rows A & C-by test
Ele
vatio
n, m
Fig. 16
Fig. 17
Dis
plac
emen
t, m
m
-4.0-2.00.02.04.0
0.0 5.0 10.0 15.0 20.0 25.0 30.0 35.0 40.0
mDisp-3-Rows 1 & 2- Top
-2.0
0.0
2.0
4.0
0.0 5.0 10.0 15.0 20.0 25.0 30.0 35.0 40.0
Time, sec
mDisp-4-Rows 1 & 2- Bot.
4 ConclusionsIn this paper probabilistic performance was applied for the
seismic performance assessment of a newly designed jacket type offshore platform with the float over deck installation system. It was observed from analysis results that due to lack
occupancy and collapse prevention performance levels in the
dynamic characteristics of the scaled model, it was observed that the dynamic characteristics in the float over direction
were totally different from those in the other direction. An offshore installed bracing system for top bay of the
jacket was proposed for upgrading seismic performance in the float over direction. Probabilistic seismic assessment of platforms with the modified bracing configuration was also performed. The result showed that the proposed bracing
in the FOD direction. Changes in dynamic characteristics of the scaled model test indicated that the proposed bracing system worked well.
AcknowledgementsThe research was sponsored by POGC (Pars Oil and
Gas Company, No. 132 “Investigation of Structural Health
ReferencesAme rican Petroleum Institute. Recommended practice for planning,
designing and constructing fixed offshore platforms. API Recommended Practice 2A (RP-2A). 21st edition, American Petroleum Institute, Washington, D.C., 2000
pile structure interaction on dynamic characteristics of jacket type
earthquake site response analysis of layered soil deposits. Technical
California, 2001
Bou langer R W, Curras C J, Kutter B L, et al. Seismic soil pile structure interaction experiments and analysis. Journal of Geotechnical and
2005. 27(2): 155-165
Washington, D.C., 2000b
Washington, D.C., 2000c
of a seven-story reinforced concrete building in Van Nuys, California,
Iwa n W D. On a class of models for the yielding behavior of continuous
612-617Jal ayer F and Cornell C A. A technical framework for probability-based
demand and capacity factor design (DCFD) seismic formats. Report
Jal ayer F and Cornell C A. Alternative nonlinear demand estimation
analysis of offshore piles under seismic loads. 13th World
2004. Paper No. 3056
Sal awu O and Williams C. Review of full-scale dynamic testing of
Sho me N and Cornell C A. Probabilistic seismic demand analysis of
of a base isolated building from ambient vibration measurements
(Edited by Sun Yanhua)