Embed Size (px)
Citation preview

A New Beginning:A Report on the East Ramapo
Central School District
March 13, 2017

Key Findings
• Parents care strongly about their children getting a quality education
• Chapter 89 of the Laws of 2016 is making a difference
• Improved instructional leadership is in place
– Formative assessments and data analysis
– Professional development strengthened
– Academic performance varies across subjects and student subgroups
• Balanced budget but on a thin cushion
– Improved fiscal stress status
– Better financial controls and systems are in place
• $59 million capital project a first step on renovating facilities
• Students are poorer, more ELL, but enrollment is growing – for now.
• Significant work remains to be done by the board to gain the trust of
the community and rebuild the academic, student support and
extracurricular programs
2
Chapter 89 Laws of 2016
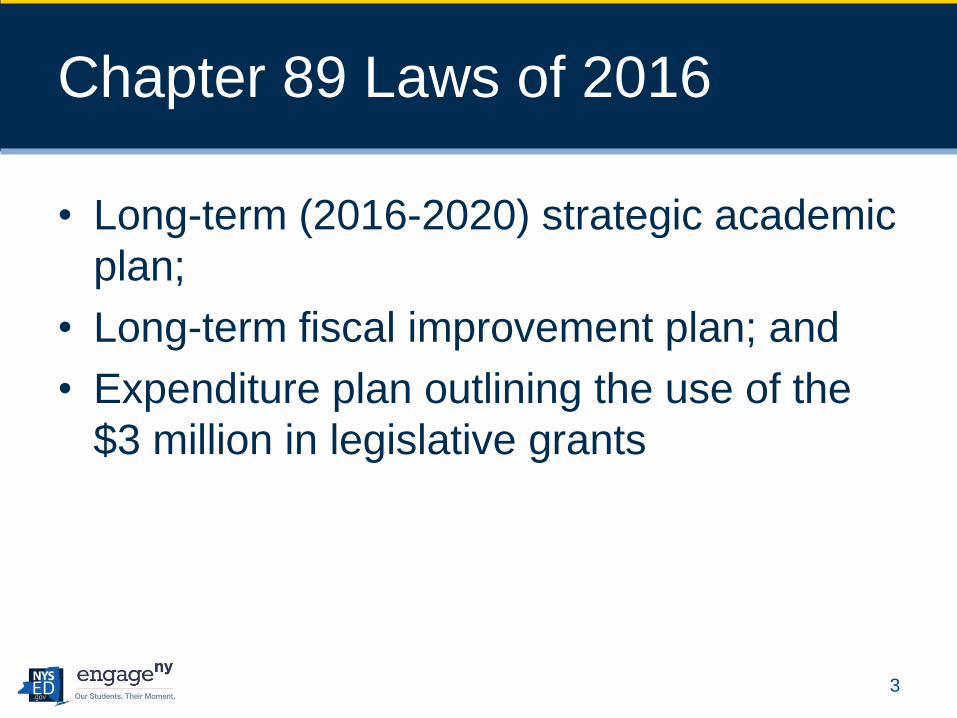
• Long-term (2016-2020) strategic academic
plan;
• Long-term fiscal improvement plan; and
• Expenditure plan outlining the use of the
$3 million in legislative grants
3
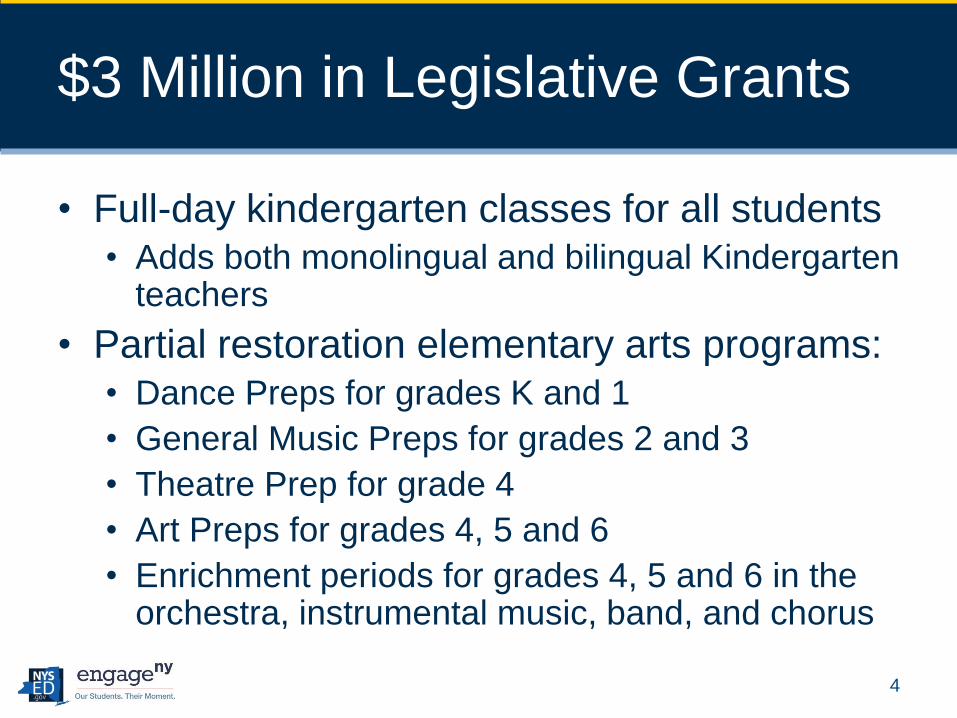
$3 Million in Legislative Grants
• Full-day kindergarten classes for all students• Adds both monolingual and bilingual Kindergarten
teachers
• Partial restoration elementary arts programs:• Dance Preps for grades K and 1
• General Music Preps for grades 2 and 3
• Theatre Prep for grade 4
• Art Preps for grades 4, 5 and 6
• Enrichment periods for grades 4, 5 and 6 in the orchestra, instrumental music, band, and chorus
4

Academic Accountability
(14 schools plus Early Childhood Center)
Focus Priority
GRANDVIEW ELEMENTARY SCHOOL MARGETTS ELEMENTARY SCHOOL CHESTNUT RIDGE MIDDLE SCHOOL SPRING VALLEY HIGH SCHOOL POMONA MIDDLE SCHOOL ELMWOOD ELEMENTARY SCHOOL RAMAPO HIGH SCHOOL ELDORADO ELEMENTARY SCHOOL
5
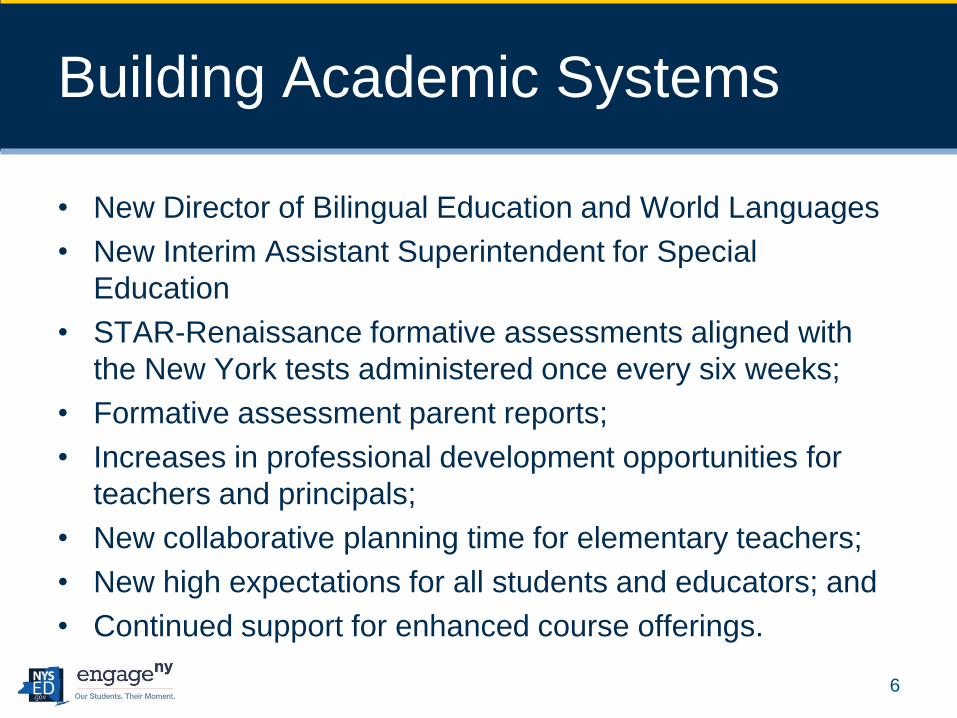
Building Academic Systems
• New Director of Bilingual Education and World Languages
• New Interim Assistant Superintendent for Special
Education
• STAR-Renaissance formative assessments aligned with
the New York tests administered once every six weeks;
• Formative assessment parent reports;
• Increases in professional development opportunities for
teachers and principals;
• New collaborative planning time for elementary teachers;
• New high expectations for all students and educators; and
• Continued support for enhanced course offerings.
6

Fiscal Condition
• Comptroller DiNapoli says the East Ramapo Central School District has gone from "significant" fiscal stress in June 2015 to "moderate" levels in June 2016 (87% to 67% to 57%)1
• In June 2016, the District had an unassigned fund balance of $4,150,436
• New systems reduced spending by $1.3 million without impacting academic programs
Note 1: January 25, 2017 Comptroller’s press release
7

Fiscal Improvement Plan
• Decisions for hiring new staff are made after a thorough assessment of budgeted resources and realistic costs projections;
• Monthly budgetary reports show underspent and overspent amounts for each budgetary account;
• Implements every internal auditor’s recommendation this fiscal year;
• Requires written instead of verbal quotations for items not subject to competitive bidding;
• Monitor, analyze and assess on an annual basis the District’s long-term liabilities including but not limited to compensated absences;
• Implement during the 2016-17 school year the State Monitors’ recommendation to explore longer-term transportation contracts with public approval while a third large-scale busing contractor is also being sought to enhance competition for services; and
• Board of Education adopted a new accounting policy.
8

$59 Million: Capital Improvements
• Window replacements at Spring Valley HS, Summit Park, Ramapo HS, Fleetwood,
Chestnut Ridge MS, Kakiat and Administration building. Window hardware
replacements at Eldorado, Hempstead, Elmwood and Lime Kiln;
• Roof replacements or renovations at the District's 14 schools and Administration
Building. Skylight replacement at Chestnut Ridge MS and Kakiat;
• Boiler replacements in Fleetwood, Pomona MS, Summit Park, Chestnut Ridge MS,
Grandview, Hempstead, Elmwood, Kakiat, Lime Kiln, Ramapo HS, Eldorado and
Administration Building;
• Replacement of heating/ventilation units at Lime Kiln, Eldorado and Chestnut Ridge
MS;
• Bleacher replacement at high school athletic fields, broken sidewalk replacements,
installation of artificial turf fields at the high schools;
• Upgraded security system, renovations in K-8 classrooms to add science labs and
special education classrooms and installation of a Wi-Fi network for every classroom
and office; and
• Replace windows and doors at Kakiat and Fleetwood.
9
Challenges
• Rebuilding trust in the school board and healing community divisions
• Undesignated fund balance less than 2% of the budget
• Rebuilding adequate local financial support
• Rapidly expanding ELL population and need for quality teachers and programs
• Providing supplemental educational services to prepare all students for enriched coursework
10

Ongoing Work
1.Review curriculum and instructional practices
2.Develop the 2017-18 School Budget and a sustainable five-year fiscal
plan
3.Review textbook purchase orders and inventory
4.Focus on the performance of English Language Learners and Special
Education Students
5. Identify resources for providing supplementary educational services
6. Improve the efficiency of the student transportation system
7.Study options for the weighting of nonpublic students in state aid
formulas
8.Monitor the school renovation work, ensure the District maximizes state
building aid and addresses concerns from the public
9.Review of all major contracts and have begun reviewing the contracts
and the request for proposals to procure the contracts
11

Recommendations
• Continuation of state monitors with emphasis on improving teaching and learning for all students, increasing transparency and communication with the community
• Continuation of $3 million in legislative grants
– Kindergarten students will generate additional foundation aid as the formula is phased-in
– Additional aid and savings due to systems improvements should be directed towards new programs
12
Appendix
• Benchmarking
– Spending
– Academic Proficiency
– Dropout Rate
• Demographic Changes
• Enrollment
• Budget votes and tax rates
• Fund balance and local effort
13
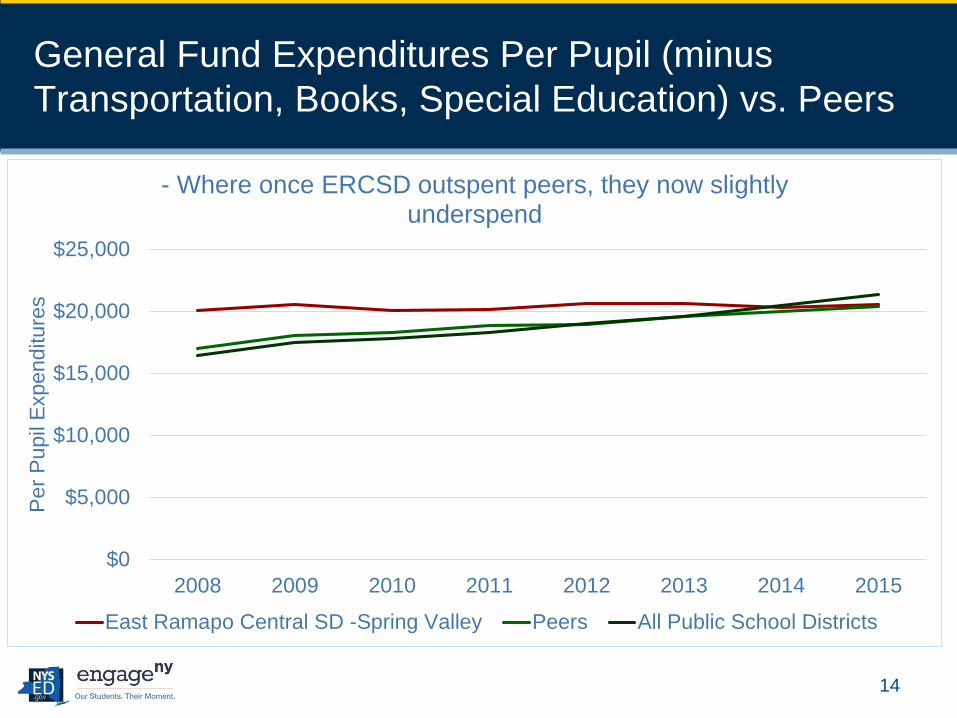
General Fund Expenditures Per Pupil (minus
Transportation, Books, Special Education) vs. Peers
14
$0
$5,000
$10,000
$15,000
$20,000
$25,000
2008 2009 2010 2011 2012 2013 2014 2015
Per
Pupil
Expenditure
s
- Where once ERCSD outspent peers, they now slightly underspend
East Ramapo Central SD -Spring Valley Peers All Public School Districts

3-8 Proficiency by Regional Cost-
Adjusted Expenditures
15
0%
5%
10%
15%
20%
25%
30%
35%
40%
$6,000 $7,000 $8,000 $9,000 $10,000 $11,000 $12,000 $13,000 $14,000 $15,000 $16,000
% P
rofi
cie
nt
Instructional Dollars/Student
East Ramapo

3-8 Achievement Relative to
Benchmark Districts
16
-8%
-7%
-6%
-5%
-4%
-3%
-2%
-1%
0%
1%
Perc
ent
Above o
r B
eow
B
enchm
ark
s
ELA performance better than Mathematics
ELA Mathematics
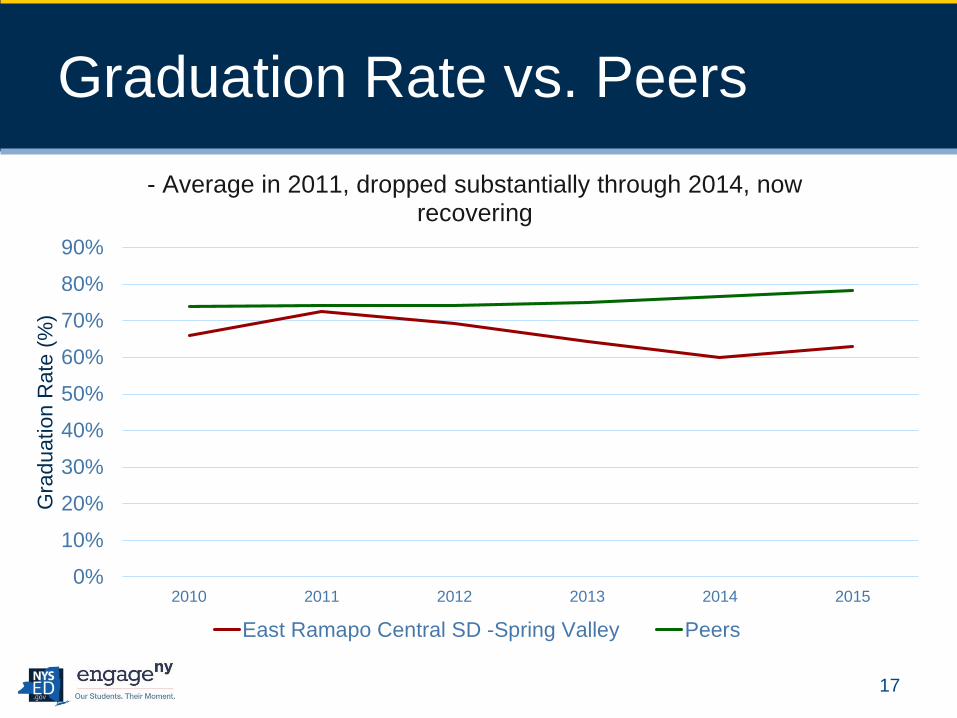
Graduation Rate vs. Peers
17
0%
10%
20%
30%
40%
50%
60%
70%
80%
90%
2010 2011 2012 2013 2014 2015
Gra
duation R
ate
(%
)
- Average in 2011, dropped substantially through 2014, now recovering
East Ramapo Central SD -Spring Valley Peers
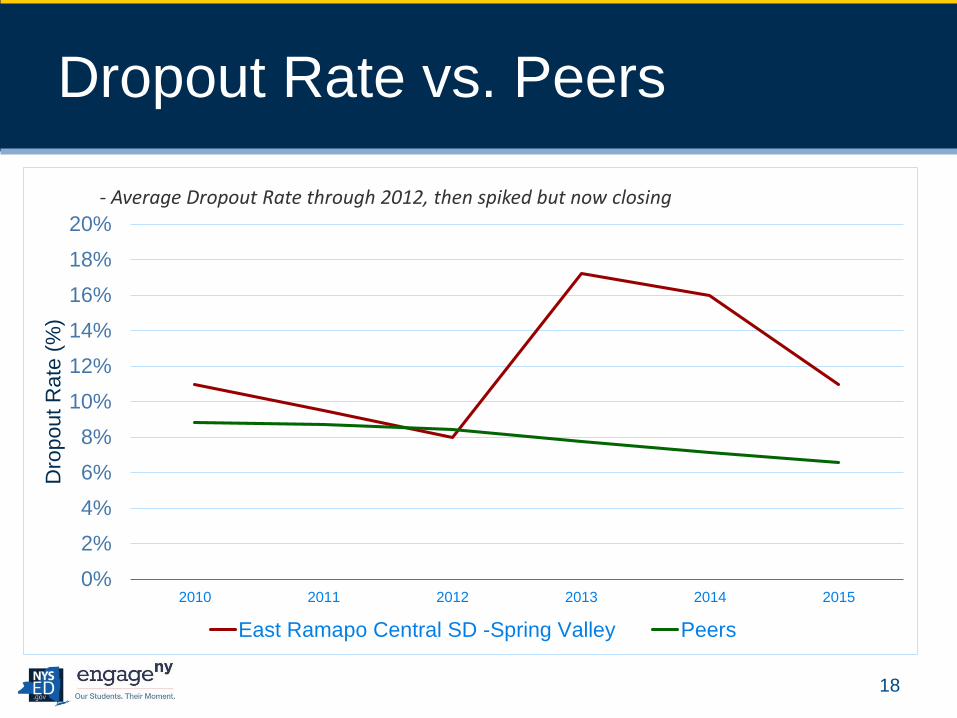
Dropout Rate vs. Peers
18
0%
2%
4%
6%
8%
10%
12%
14%
16%
18%
20%
2010 2011 2012 2013 2014 2015
Dro
pout
Rate
(%
)
- Average Dropout Rate through 2012, then spiked but now closing
East Ramapo Central SD -Spring Valley Peers

Achievement – Relative to
Benchmarks
• 3-8 ELA – Comparable
• 3-8 Math – Below Peers
• English Regents – 5% above peers, better for children above the free or reduced price lunch threshold
• Living Environment – Had been above, now average.
• Chemistry & Physics – well below average
19
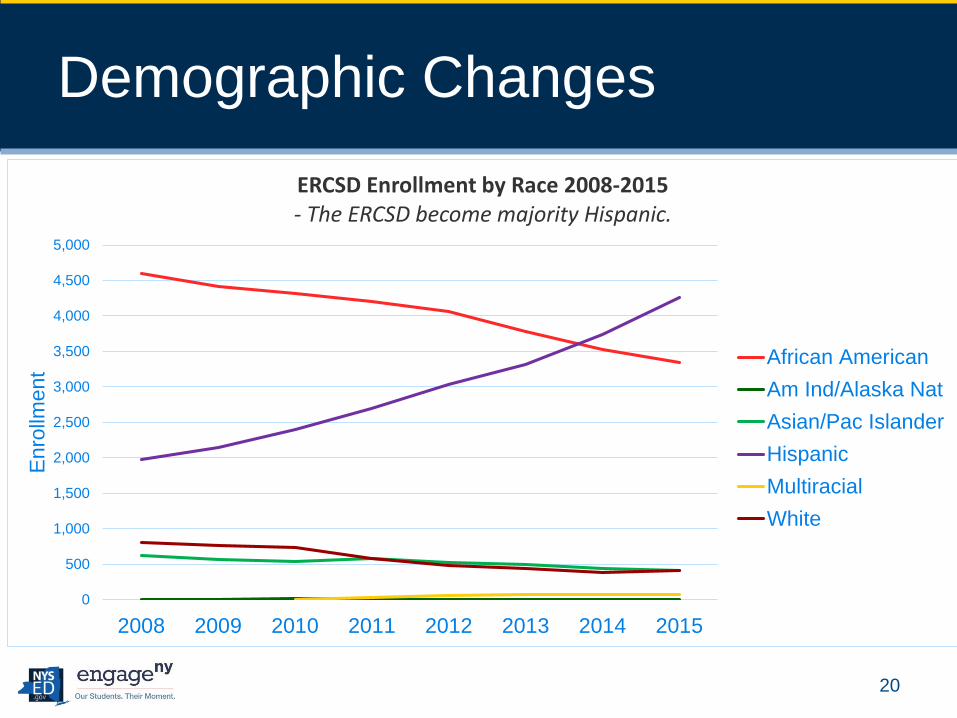
Demographic Changes
20
0
500
1,000
1,500
2,000
2,500
3,000
3,500
4,000
4,500
5,000
2008 2009 2010 2011 2012 2013 2014 2015
Enro
llment
ERCSD Enrollment by Race 2008-2015- The ERCSD become majority Hispanic.
African American
Am Ind/Alaska Nat
Asian/Pac Islander
Hispanic
Multiracial
White

Demographic Changes
21
0
1000
2000
3000
4000
5000
6000
7000
8000
Poverty and English Language Learner Enrollments
Not proficient in English Free or reduced lunch

Enrollment Change
22
-12
-10
-8
-6
-4
-2
0
2
4
6
Perc
en
t C
han
ge
Average Three-Year Change in K-12 Enrollment

Cost of Defeated Budget Votes
Budget re-votes/contingency budgets: 2005-06 to 2012-13
– May 2004-05 budget voted down.
• Adopted (June) budget (-1,835,294)
– May 2005-06 budget voted down.
• Adopted (June) budget (-$1,708,000)
– May 2008-09 budget voted down.
• Contingent budget, no 2nd vote (-$716,078)
– May 2010-11 budget voted down.
• Adopted (June) budget (-$2,778,287)
– May 2011-12 budget voted down.
• Contingent budget no 2nd vote (-$1,637,580)
– May 2012-13 budget voted down.
• Same budget was offered to the voters with no cuts
• Total “Lost” dollars from budget rejections -$ 8,675,264
23
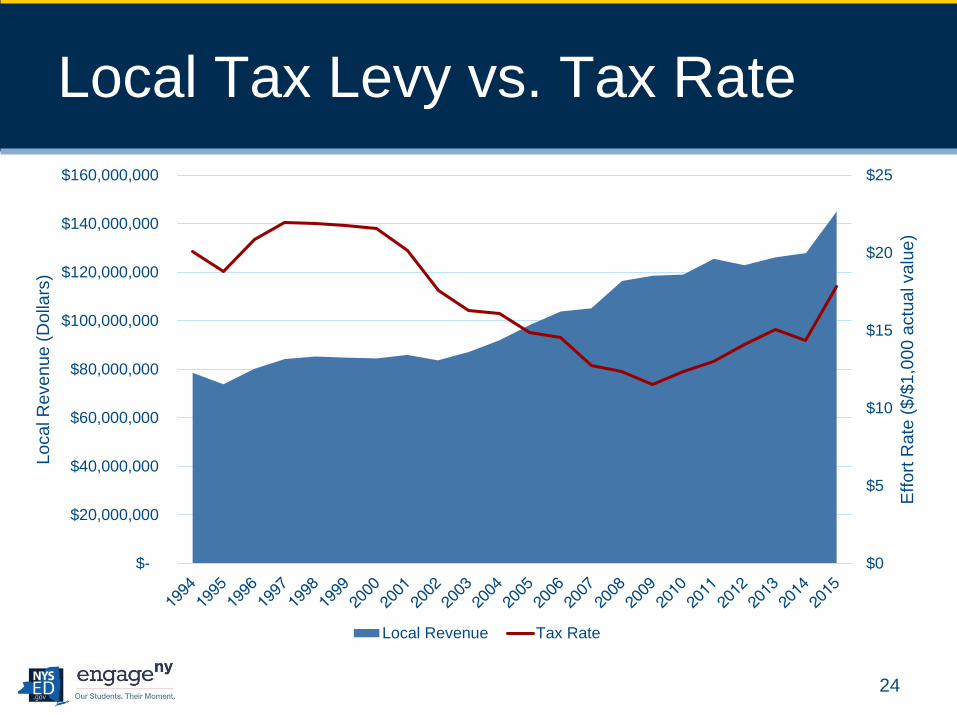
Local Tax Levy vs. Tax Rate
24
$0
$5
$10
$15
$20
$25
$-
$20,000,000
$40,000,000
$60,000,000
$80,000,000
$100,000,000
$120,000,000
$140,000,000
$160,000,000
Effo
rt R
ate
($/$
1,0
00
actu
al valu
e)
Lo
cal R
even
ue
(D
olla
rs)
Local Revenue Tax Rate
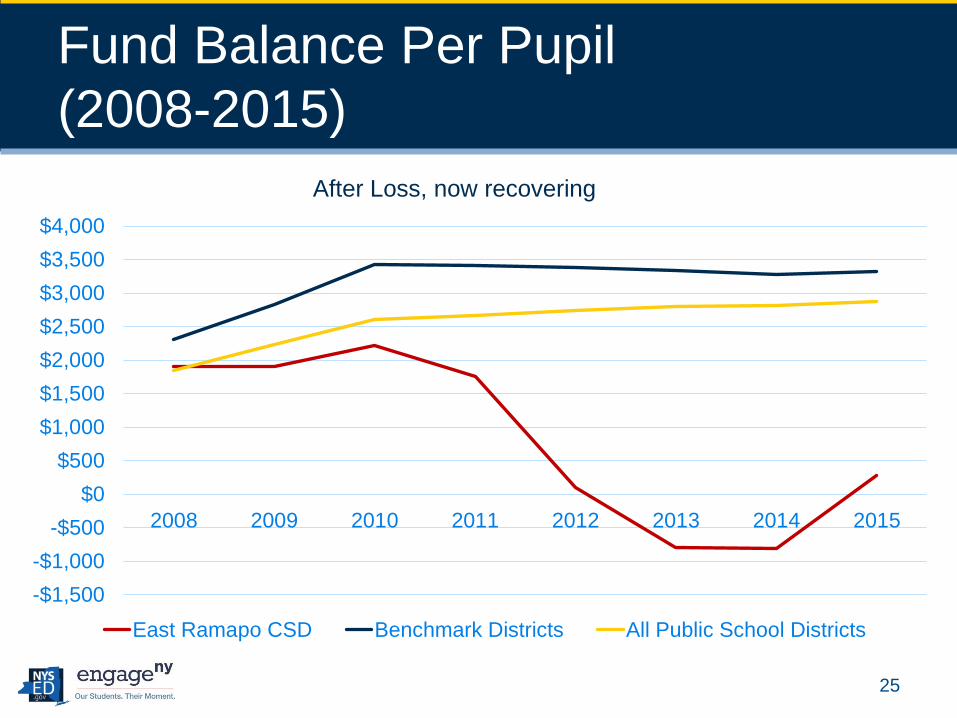
Fund Balance Per Pupil
(2008-2015)
25
-$1,500
-$1,000
-$500
$0
$500
$1,000
$1,500
$2,000
$2,500
$3,000
$3,500
$4,000
2008 2009 2010 2011 2012 2013 2014 2015
East Ramapo CSD Benchmark Districts All Public School Districts
After Loss, now recovering
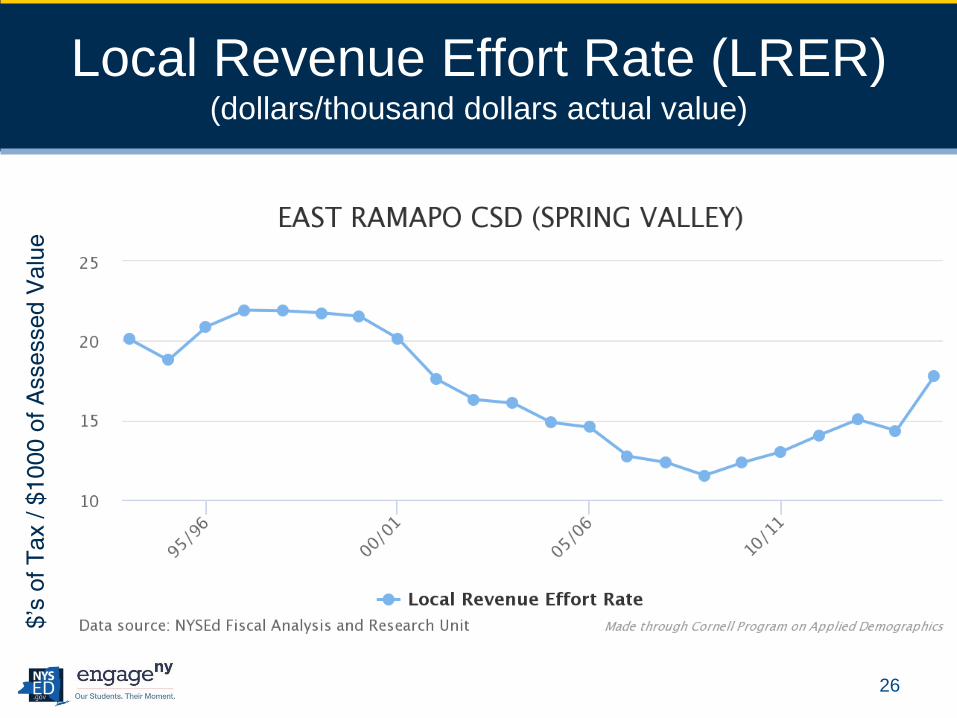
Local Revenue Effort Rate (LRER)(dollars/thousand dollars actual value)
26
$’s
of
Ta
x /
$1000 o
f A
ssessed V
alu
e

LRER (Tax Rate) Across their BOCES(dollars/thousand dollars actual value)
27


![Ramapo College of New Jersey · Ramapo College of 2011-2012 CLA INSTITUTIONAL REPORT [cla] New Jersey. 2 2011-2012 CLA Institutional Report ... known as hierarchical linear modeling](https://img.pdfslide.us/doc/110x75/5ea64c4174fbde30f66f07d3/ramapo-college-of-new-jersey-ramapo-college-of-2011-2012-cla-institutional-report.jpg)