Embed Size (px)
Citation preview
A NEW APPROACH TO PERFORMANCE MEASUREMENT USING DATA ENVELOPMENT
ANALYSIS:
Implications for Organisation Behaviour, Corporate Governance and Supply Chain Management
Alex Manzoni Victoria Graduate School of Business
Faculty of Business and Law Victoria University
A thesis submitted in partial fulfillment for the degree of Doctor of Business
Administration, Victoria University, March 2007
ii
Doctor of Business Administration Declaration I Alex Manzoni declare that the DBA thesis entitled A New Approach to Performance
Measurement Using Data Envelopment Analysis: Implications for Organisation
Behaviour, Corporate Governance and Supply Chain Management is no more than
65,000 words in length including quotes and exclusive of tables, figures, appendices,
bibliography, references and footnotes. The thesis contains no material that has been
submitted previously, in whole or in part, for the award of any other academic degree or
diploma. Except where otherwise indicated, this thesis is my own work.
Alex Manzoni
Signed …………………………….
Date ……18 July 2007
iii
Acknowledgements I am indebted to many people who have helped me in many ways to complete this work.
After a long and successful career it is but fitting to complete a thesis in a discipline I
have found exciting all my working life. I would like to acknowledge and thank all those
people I have dealt with that have made this field special to me. I group the contributions
of these people into four categories: supervisory support and guidance, academic and
professional colleagues, friends, and family.
My supervisors Professor Sardar Islam and Dr Ian Sadler have helped me in
complementary ways. Dr Sadler as a friend and work colleague is responsible for
instigating this study and supporting me in dealing with the stumbling blocks created by
bureaucracy. As the secondary supervisor his role has also been to give an alternative
viewpoint and to be scathingly critical when asked. I am sure this has helped me.
Professor Sardar (Naz) Islam has brought to my study his wealth of experience in
supervising doctoral students and a guiding path to the completion of this type of
academic venture. His background knowledge and experience in tangential fields has
been an inspiration for me to broaden the scope of my own research. Both supervisors
have been invaluable resources providing me with superlative mentoring and practical
help. I can proudly say that they also belong to the other categories of colleagues and
friends.
It is impossible to overemphasize the contribution of my academic colleagues and friends
in my career, spanning vocational education, training, lecturing, and consulting for
industry. There have been too many acquaintances to name them individually, but it
would be remiss of me to not acknowledge them collectively. I thank them all.
This research required long periods of uninterrupted work, usually after already having
completed a day’s employment and always on weekends. My family has been
wonderfully supportive throughout this journey. Jenny, Jess and Nick have all motivated
me in different ways and on occasions providing me with the necessary distractions that
are needed to interrupt the work ethic required to complete such a project.
iv
Publications arising from this thesis Refereed Publications in Proceedings of International Conferences 1 Manzoni, A 2005, ‘A Performance Scorecard in the Australian Context: the role of DEA’, Victoria University Business Research Conference, Victoria Graduate School of Business, Victoria University, Melbourne, 29 November.
2 Manzoni, A and Sadler, I 2005, ‘An Improved Performance Scorecard in the Australian Context’, in Proceedings of the 19th ANZAM Conference, University of Canberra, Canberra, 7-10 December.
3 Manzoni, A and Islam, SMN 2006, ‘An Improved Performance Scorecard for Supply Chain Networks in the Australian Context’, in Proceedings of the International Conference on Logistics and SCM (LSCM2006), Department of Industrial and Manufacturing Systems Engineering, The University of Hong Kong, Hong Kong, 5-7 January.
4 Manzoni, A and Islam, SMN 2006, ‘Measuring the Performance of Supply Chain Networks in Australia: A Business Process Model using DEA’, in Proceeding of the 4th International Conference on SCM and Information Systems (SCMIS 2006), National Chung Hsing University, Taiwan, 5-7 July.
5 Manzoni, A and Islam, SMN 2006, ‘Measuring the Performance of Collaborative Relationships in Supply Chain Networks Using DEA: A CG Perspective’, in Proceedings of the 4th International Logistics and Supply Chain Congress, Izmir University of Economics, Turkey, 29 November to 1 December.
International Journal Publications (invited and refereed) 1 Manzoni, A and Islam, SMN 2007, ‘Measuring the Effectiveness of Collaborative Relationships in the Logistics of Globalised Supply Networks: an Application of DEA’, International Journal of Logistics, Economics and Globalisation. Vol.1, no.1, pp. 77-911 (invited submission).
2 Manzoni, A and Islam, SMN 2007, ‘Measuring the Performance of Supply Chain Networks in Australia: A Business Process Model using DEA’, International Journal of Value Chain Management. (accepted, publication pending)
3 Tan, HB, Hooy, CW, Islam, SMN and Manzoni, A 2007, ‘Relative Efficiency Measures for the Knowledge Economies in the Asia Pacific Region’, Journal of Modelling in Management. (accepted, publication forthcoming)
Papers Under Review in International Journals (refereed) 1 Manzoni, A and Islam, SMN 2006 ‘An Improved PM Model for Supply Chain
Networks in an Australian Context’, The International Journal of Logistics Management
v
Table of Contents A New Approach to Performance Measurement using Data Envelopment Analysis: Implications for Organisation Behaviour, Corporate Governance and Supply Chain Management Statement of Original Authorship ....................................................................................... ii Acknowledgements............................................................................................................ iii Publications Arising from this Thesis................................................................................ iv Table of Contents…………………………………………………………………………..v List of Tables ...................................................................................................................... x Table of Figures ................................................................................................................. xi Key to Acronyms .............................................................................................................. xii Abstract ............................................................................................................................ xiv Chapter 1 Performance Issues in the Global Knowledge Economy:The Need for an Extended Framework for Enterprises 1.1 Introduction................................................................................................................... 1
1.1.1 Background: The Global Knowledge Economy ..................................................... 1 1.1.2 The Behaviour of Management and the Role of Companies in Society................. 3 1.1.3 The Supply Chain Imperative ................................................................................. 4 1.1.4 Organisational Performance Management and Measurement ................................ 7 1.1.5 The Elements of Performance................................................................................. 9 1.1.6 Measures of Performance...................................................................................... 10 1.1.7 Data Envelopment Analysis.................................................................................. 12
1.2 Objectives ................................................................................................................... 14 1.3 Methodology ............................................................................................................... 15 1.4 Contribution of this Thesis.......................................................................................... 16
1.4.1 Limitations of Existing Literature......................................................................... 16 1.4.2 A New Approach-Overcoming the Limitations.................................................... 17
1.5 Structure of the Dissertation ....................................................................................... 18 Chapter 2 Critical Literature Review: OB, CG and SCM in the Measurement of Performance for Commercial Enterprises in a Global Knowledge Economy 2.1 Introduction: Issues and Developments in Contemporary Global Knowledge Economics and Business...................................................................................................................... 21 2.2 The Emergence of a Global Knowledge Economy..................................................... 23
2.2.1 Globalisation of Australian Business.................................................................... 23 2.2.2 Competition for Australian Business in a Global Economy................................. 26 2.2.3 The Emergence of Global Knowledge as Capital................................................. 29
2.3 The Emergence of an OSTS Approach to OB ............................................................ 33 2.3.1 Introduction........................................................................................................... 33
vi
2.3.2 The Founding Fathers; Weber, Durkheim and Pareto .......................................... 34 2.3.3 The Human Relations School and the Tavistock Institute.................................... 35 2.3.4 Systems Theory..................................................................................................... 36 2.3.5 Open Socio-Technical Systems ............................................................................ 38
2.4 The Corporate Governance and Social Responsibility Approach to Organisation Performance Strategy........................................................................................................ 44
2.4.1 Introduction........................................................................................................... 44 2.4.2 The Current Corporate Governance Forum .......................................................... 45 2.4.3 Ethics and Morality in Business ........................................................................... 48
2.5 The SCM Approach to Organisation Performance ..................................................... 50 2.5.1 Introduction........................................................................................................... 50
2.6 The Measurement of Organisation Performance ........................................................ 59 2.6.1 Introduction........................................................................................................... 59
2.7 DEA and the Measurement of Efficiency ................................................................... 64 2.7.1 Introduction: Background and Brief History of the Model................................... 64 2.7.2 Recent Research and Model Development ........................................................... 66
2.8 Conclusion .................................................................................................................. 69 Chapter 3 Conceptual Framework and Research Methodology: A New Approach to Performance Measurement 3.1 Introduction................................................................................................................. 70 3.2 Conceptual Framework for PM................................................................................... 71 3.3 The OBPM Model....................................................................................................... 75
3.3.1 Research Study Postulates .................................................................................... 77 3.4 The Optimization Model of Business using DEA ...................................................... 79
3.4.1 Stages of an Applied Operations Research Study................................................. 79 3.4.2 The Procedure for DEA Application .................................................................... 82
3.5 Linear Programming and DEA ................................................................................... 83 3.5.1 Linear Programming ............................................................................................. 83 3.5.2 Linear Programming for DEA .............................................................................. 85 3.5.3 Mathematical Programming with Spreadsheets.................................................... 87
3.6 Alternative Methodologies for Measuring Efficiency ................................................ 87 3.6.1 Ratio Analysis and Efficiency Evaluation with Multiple Input and Multiple Output........................................................................................................................................ 88 3.6.2 The Pure Programming Approach ........................................................................ 89 3.6.3 Regression Analysis with Multi Inputs and Outputs ............................................ 91 3.6.4 The Deterministic Statistical Frontier Approach .................................................. 92 3.6.5 The Stochastic Frontier Approach ........................................................................ 93
3.7 Other Related Mathematical Models .......................................................................... 94 3.8 Research Data for this Study..................................................................................... 100
3.8.1 The Data Source.................................................................................................. 100 3.8.2 The DEA Data..................................................................................................... 102 3.8.3 Validating the DEA Model ................................................................................. 102
3.9 Conclusion ................................................................................................................ 104
vii
Chapter 4 DEA: Theory, Methods and Applications 4.1 Introduction............................................................................................................... 105 4.2 The Basic Model ....................................................................................................... 106
4.2.1 DEA for One Output and Two Inputs................................................................. 110 4.2.2 DEA for Two Outputs and One Input................................................................. 113
4.3 Extensions to the Base Model................................................................................... 116 4.3.1 Technical and Allocative Efficiencies: Input and Output Orientations .............. 116 4.3.2 Slack.................................................................................................................... 119 4.3.3 Returns to Scale .................................................................................................. 120 4.3.4 Weighting the DMUs.......................................................................................... 122 4.3.5 Setting the DMU weights.................................................................................... 123
4.4 DEA: Assumptions, Strengths and Limitations ........................................................ 125 4.4.1 Assumptions and Precautions of DEA................................................................ 126 4.4.2 Strengths and Advantages of DEA ..................................................................... 127 4.4.3 Weaknesses and Limitations of DEA ................................................................. 128
4.5 Other Models and Issues ........................................................................................... 129 4.5.1 Other Models....................................................................................................... 129 4.5.2 Other Issues......................................................................................................... 130
4.6 Conclusion ................................................................................................................ 131 Chapter 5 DEA of Corporate Governance: The Model and its Application 5.1 Introduction............................................................................................................... 133 5.2 Corporate Social Responsibility ............................................................................... 134 5.3 The DEA of Corporate Social Responsibility........................................................... 141
5.3.1 The CSR Database .............................................................................................. 141 5.3.2 The DEA Justification......................................................................................... 143
5.4 Applying DEA .......................................................................................................... 145 5.4.1 Pilot Tests and Variable Selection ...................................................................... 145 5.4.2 The DEA-Solver-LV Program............................................................................ 147 5.4.3 Test Trials of Data using DEA-Solver-LV ......................................................... 149
5.5 DEA of CSR using DEA-Solver-Pro 4.1 .................................................................. 152 5.6 Conclusion: the DEA for CG.................................................................................... 158 Chapter 6 Results and Validation of DEA Application to Corporate Social Responsibility 6.1 Introduction............................................................................................................... 161 6.2 The DEA Application to CSR in the OSTS.............................................................. 162
6.2.1 The Findings of DEA Application to CSR ......................................................... 162 6.2.2 The Findings of DEA in the OSTS ..................................................................... 164
6.3 Technical Considerations of the Findings................................................................. 164 6.3.1 Heuristics for DEA to Succeed: The Rules of Thumb........................................ 164 6.3.2 Different DEA models ........................................................................................ 165 6.3.3 The Extreme Point Technique of DEA............................................................... 167 6.3.4 The Aggregation and De-Aggregation Impact.................................................... 168 6.3.5 The Quantification of Qualitative Data............................................................... 170 6.3.6 Explaining Efficiency versus Describing Efficiency.......................................... 171
viii
6.3.7 The Effect of Input Congestion and Exogenous Factors .................................... 172 6.3.8. Efficiency versus Productivity ........................................................................... 173
6.4 The CSR Construct ................................................................................................... 174 6.4.1 Correlations for Trial 1 ....................................................................................... 176 6.4.2 Correlations for Trial 2 ....................................................................................... 177 6.4.3 Correlations for Trial 3 ....................................................................................... 181 6.4.4 Correlation Summaries for all Trials .................................................................. 182
6.5 Conclusion ................................................................................................................ 184 Chapter 7 Implications for OBPM, SCM and Organisation Design 7.1 Introduction............................................................................................................... 188 7.2 Implications of the Results........................................................................................ 188
7.2.1 The Need for Further Development .................................................................... 189 7.2.2 Strategy for Organisation Design of the Future .................................................. 191 7.2.3 Integrating the PMS into the OSTS Designed Enterprise................................... 195 7.2.4 Integrating the Supply Network into the OSTS Designed Enterprise ................ 198 7.2.5 Integrating CG into the OSTS Designed Enterprise ........................................... 199
7.3 Conclusion ................................................................................................................ 201 Chapter 8 Summary, Conclusion and Future Research 8.1 Introduction............................................................................................................... 202
8.1.1 Foundations in a Global Knowledge Economy .................................................. 202 8.1.2 Critical Review of the Literature ........................................................................ 203
8.2 A New Approach to PM............................................................................................ 205 8.2.1 The Conceptual Framework for the Measurement Methodology....................... 205 8.2.2 DEA .................................................................................................................... 205
8.3 DEACSR Model and Results.................................................................................... 206 8.3.1 DEA for Corporate Governance ......................................................................... 206 8.3.2 The DEACSR Model .......................................................................................... 207
8.4 Performance Measurement and Organisation Behaviour ......................................... 208 8.5 Limitations and Areas for Further Research ............................................................. 209
8.5.1 Limitations of the Present Research.................................................................... 209 8.5.2 Implications and Direction for Future Research ................................................. 211
8.6 Conclusion ................................................................................................................ 213 Bibliography .................................................................................................................. 215 Appendices
Appendix 1: Definitions of Key Terms........................................................................ 245 Appendix 2a: Spreadsheet Modeling of DEA in Linear Programming....................... 249 Appendix 2b DEA Solver Pro 4.1................................................................................ 259 Appendix 3 Summary of Business Units-Average Scores........................................... 263 Appendix 4 All Business Units-Reversed.................................................................... 264 Appendix 5 Sample with 48 DMUs............................................................................. 265 Appendix 6 Minimum Average Maximum Scores ...................................................... 266

ix
Appendix 7 Service History of More than Five years ................................................. 267 Appendix 8 Trial 1 ....................................................................................................... 273 Appendix 9 Trial 2 ....................................................................................................... 274 Appendix 10 Trial 3 ..................................................................................................... 279 Appendix 11 The Balanced Scorecard of Kaplan and Norton..................................... 280
Appendix 12 The Performance Prism of Cranfield University.................................... 285 Appendix 13 The Construct of CSR Management Capacity…………………………288
x
List of Tables Table 3.1 Ratio Analysis for Two DMUs 88 Table 3.2 Classification of Models 96 Table 4.1 Two Inputs and One Output 111 Table 4.2 Two Outputs and One Input Data 113 Table 5.1 Social Responsiveness Dimensions and Indicators 139 Table 5.2 Breakdown of CSRCM Variables in the Study 142 Table 5.3 Parameters of the CSR Variables 145 Table 5.4 Cohort breakdown by Decision Making Unit 147 Table 5.5 DEA Models on DEA-Solver LV 147 Table 5.6 Test 1 Summary for Business Units with Averaged Scores 149 Table 5.7 Test 2 Summary for Business Units with Averaged Scores but Reversed Input and Output Factors 149 Table 5.8 Test 3 for all DMUs. 150 Table 5.9 Test 4 Sample of DMU Dataset to Overcome the 50 DMU Limit. 150 Table 5.10a Results of Test 5 for Minimum, Average and Maximum Scores in Each Business Unit. 152 Table 5.10b Results of Test 5 using DEA-Solver LV for Less than 50 DMUs per Business Unit 152 Table 5.11 Whole of Cohort Results of 6 Inputs(I) and 1 Output(O) 154 Table 5.12 Cohort-wide Efficiencies from Individual Business Units 154 Table 5.13 Aggregated Eficiencies after Testing at Individual Business Unit Level 155 Table 5.14 Individual Business Unit Comparisons Aggregated 155 Table 5.15 Comparison of Whole cohort to Individual Units 156 Table 5.16 Trial 3, the Eight Indicative Factors of CSRMC 156 Table 5.17 Indicative Factor Efficiencies by Business Units Origin 157 Table 5.18 Comparison of Different DEA Trials 157 Table 5.19 Comparison of Efficient DMUs by Trial Condition 158 Table 6.1 Summary of Trial Structures and Efficiency Results 162 Table 6.2 Summary of DMU Efficiencies by Trial 163 Table 6.3 Correlations for Trial 1 176 Table 6.4 Correlations for Trial 2 Unit A 177 Table 6.6 Correlations for Trial 2 Unit C 178 Table 6.7 Correlations for Trial 2 Unit D 179 Table 6.8 Correlations for Trial 2 Unit E 179 Table 6.9 Correlations for Trial 2 UnitF 179 Table 6.10 Correlations for Trial 3, Expanded Output Factors 181 Table 6.11 Summary of Acceptable Correlations for Trial 1 182 Table 6.12 Summary of Acceptable Correlations in Trial 2 and Trial 3 183 Table 6.13 Aggregated Correlations of All Trials for Six Input Factors 183 Table 6.14 Trial 3 Correlations of Output Factors to Inputs 184 Table 7.1 Organisation Design for the 21st Century 194
xi
Table of Figures Figure 1.1 Generalized Model of the Supply network 6 Figure 1.2 The Extended OBPM Framework structured as the Performance Pyramid 10 Figure 1.3 Structure of the Dissertation 19 Figure 2.1 The connected elements of PM 23 Figure 3.1 PM Conceptual Framework 73 Figure 3.2 The Integrated OSTS for the OBPM Model 74 Figure 3.3 Generalized Steps in Modeling Optimization for DEA 80 Figure 3.4 The DEA Application Flow Chart 83 Figure 4.1 Farrell’s Isoquant Diagram 106 Figure 4.2 Data Enveloped by the Efficiency Frontier 110 Figure 4.3 Efficiency Frontier for Six DMUs with One Output and Two Inputs 111 Figure 4.4 Efficiency Improvement possible for 1 DMU 112 Figure 4.5 Efficiency Frontier for Seven DMUs with Two Outputs and One Input 114 Figure 4.6 Technical and Allocative Efficiency for Input Orientation 117 Figure 4.7 Technical and Allocative Efficiency for Output Orientation 118 Figure 4.8 Slack 119 Figure 4.9 Slack Identification of Improvement Potential 120 Figure 4.10 Models that Assume a Piecewise Linear Envelopment Surface 122 Figure 5.1 Model for CSR (from Black 2004) 137 Figure 5.2 The CSRMC Model of Black (2004) 139 Figure 5.3 Sample Data Sheet for DEA Solver LV 148 Figure A3.4 A Spreadsheet Model for the ABCo 251 Figure A3.5 Summary of Solver’s View of the Model 252 Figure A3.6 Invoking Solver from the Tools Dropdown Menu 253 Figure A3.7 Solver Parameters Dialogue Box Click Premium 253 Figure A3.8 Solver Parameters Dialogue Box Select LP Option 254 Figure A3.9 Specify the Set Cell 254 Figure A3.10 Specify the Variable Cells 255 Figure A3.11 Specify the Constraint Cells 255 Figure A3.12 Add the Non-negativity Conditions 256 Figure A3.13 Summary of how Solver Views the Model 257 Figure A3.14 The Solver Options Dialogue Box 257 Figure A3.15 The Optimal Solution 258 Figure A11 The Four Perspectives of the Balanced Scorecard 282 Figure A12a The Five Facets of the Performance Prism 285 Figure A12b Stakeholder Satisfaction 286
xii
Key to Acronyms ABC Activity Based Costing ABS Australian Bureau of Statistics AE Allocative Efficiency AHP Analytical Hierarchy Process AM Additive Model ASCI Australian Council of Superannuation Investors ASX Australian Stock Exchange B2B Business to Business B2C Business to Customer B2E Business to Employee BCC Banker, Charnes and Cooper BITC Business in the Community BM Benchmarking BPR Business Process Re-engineering BSC Balanced Scorecard C2C Customer to Customer CA Comparative Advantage CCR Charnes Cooper Rhodes (DEA Model ) CG Corporate Governance CI Consistency Index CR Consistency Ratio CRI Corporate Responsibility Index CRS Constant Returns to Scale CSF Critical Success Factors CSR Corporate Social Responsibility CSRMC CSR Management Capacity DEA Data Envelopment Analysis DEACSR DEACSR model DJSI Dow Jones Sustainability Index DMU Decision Making Unit DP Dynamic Programming DRS Decreasing Returns to Scale EDI Electronic Data Interchange EE Economic Efficiency ERP Enterprise Resources Planning ESRC Economic and Social Research Council EVA Economic Value Added FTSE4 Global Index of London Stock Exchange and Financial Times GDP Gross Domestic Product GSCF Global Supply Chain Forum GP Goal Programming ICT Information Communication Technologies IFSA Investment and Finance Services Association IMF International Monetary Fund IO Input Oriented
xiii
IP Integer Programming IPMS Integrated PM System IRS Increasing Returns to Scale KE Knowledge Economy KM Knowledge Management KPI Key Performance Indicator LHS Left Hand Side LP Linear Programming MIP Multiple Integer Programming MM Matrix Model MNE Multinational Enterprises MOP Multiobjective Programming NLP Non-linear Programming OB Organisation Behaviour OBPM Organisation Behaviour Performance Measurement Model OECD Organisation for Economic Cooperation and Development OEEC Organisation for European Economic Cooperation OLS Ordinary Least Squares OO Output Oriented OR Operations Research OSTS Open Socio-Technical Systems P2P Person to Person PDEA Parametric DEA PE Price Efficiency PM Performance Measurement PMS Performance Measurement System PP Partial Productivity RHS Right Hand Side RTS Returns to Scale SBM Slack-Based Model SBS Socio-technical Business Systems SC Supply Chain SCC Supply Chain Council SCM Supply Chain Management SN Supply Networks SDWT Self Directed Work Teams SP Stochastic Programming SRI Social Responsibility Index STS Socio-Technical System TBL Triple Bottom Line TdeB Tableau de Bord TFP Total Factor Productivity TD Technological Determinism TE Technical Efficiency TOC Theory of Constraints TP Total Productivity TQM Total Quality Management VRS Variable Returns to Scale
xiv
Abstract Background, Issues, Existing Literature and Limitations
Traditionally, the operational performance of enterprises has been measured in terms of financial
accountability and profit since they provide a monetary yardstick of performance evaluation and
comparisons. However, in the global knowledge economy, performance should be analysed
beyond financial ratios criteria and systems, and should be measured in terms of corporate
governance (CG), organisation behaviour (OB) and supply chain management (SCM) because
these factors determine the performance of enterprises in the broader socio-economic perspective
generally, and corporate social responsibility (CSR) specifically.
Conceptual and Theoretical Framework – A New Approach to Performance Measurement
An integrated approach to performance measurement requires an assessment of the contributions
of stakeholders and the major tenets of modern organisation theory, namely OB, CG, SCM and
corporate social responsibility because these are determinants of performance and missing in
previous work.
This dissertation develops a contemporary organisation behaviour performance measurement
(OBPM) framework for enterprises in the emerging global knowledge economy. It integrates the
dimensions of OB, CG and SCM by the development of an open socio-technical systems (OSTS)
framework within a new model called ‘data envelopment analysis of corporate social
responsibility’ (DEACSR). This framework addresses the importance of stakeholders at various
stages of the supply chain, the style of management and design of organisation, as well as the
need to be able to measure qualitative contributors, such as CSR, to organisation performance. In
all instances of performance management however, present levels of performance must be
measured before they can be improved. Therefore, this proposed framework embeds extended
appropriate dimensions of measures of corporate operations and performance in the
contemporary world.
xv
The Methodology and Data
To implement the OBPM framework, the data envelopment analysis (DEA) linear programming
technique of operations research is used to generate a ranking of CSR-related efficient
performing business units. DEA is widely regarded as an effective modelling technique for the
measurement of efficiencies in similar decision-making units (DMUs). The software, DEA
Solver Pro 4.1, was applied to the ‘corporate social responsibility management capacity’
(CSRMC) dimensions of the OBPM framework in an Australian bank with national and
international operations, thus providing a new application. DEA was applied to 231 DMUs of the
bank to identify which were the most efficient CSR performers even though the bank itself, has
achieved premier gold star ratings on national CSR indices for the last four years.
Results and Implications
The DEA results have listed 11 fully efficient (100%) units and rank ordered the remainder. The
efficient units have strong characteristics of humanistic participative management, organisational
support and empowerment, a commitment to business ethics and stakeholder acknowledgement
and support. In addition, inter-item correlations of these characteristics for the efficient DMUs
show that the results are not only plausible, but comprehensive and intuitively correct. Therefore
the results support an OBPM framework on the basis that:
1) DEA is an effective instrument in the operations research methodology used to elicit
efficiently performing business units; since
2) CSR is validated as a significant dimension of corporate governance; due to
3) the organisational behaviour inherent in an humanistic OSTS-designed enterprise which
enhances corporate citizenship.
The implications of an OBPM framework and the DEA results obtained by applying this
framework are as follows:
1) The OBPM framework is consistent with the need to redesign the corporation of the future, as
the OSTS-designed organisation can display synergies in the technical and social subsystems
xvi
through the enhanced performance of collaborative relationships within the organisation and the
whole supply network.
2) Humanistic styles of management, with the characteristics of business ethics and stakeholder
empowerment, contributes to organisation performance.
3) CSR is a platform for stakeholder engagement and an essential element of organisation
performance.
Limitation, Contribution and Conclusion
The limitation to this study is that the non-parametric nature of DEA means it is not applicable to
the measurement of performance in every instance.
This thesis has made an original contribution to the literature in the area of performance
measurement theory; by developing a new approach to performance measurement which goes
beyond traditional financial measures, by implying new developments in OB and management
theory, CG, and SCM, and by implementing this new performance measurement approach with
DEA.
The quest for enterprises to be competitive in the contemporary global economy will inevitably
lead them to a reconfiguration of the OSTS design presented in this thesis.
1
Chapter 1
Performance Issues in the Global Knowledge Economy:
The Need for an Extended Framework for Enterprises
I keep the subject of my inquiry constantly before me, and wait till the first dawning opens gradually, by little and little, into a full and clear light. Sir Isaac Newton 1643-1727
1.1 Introduction
The subject of this dissertation is the development of an extended organisation behaviour
(OB) and performance measurement (PM) model for a commercial enterprise in an
Australian supply chain by the use of DEA. The chapter is structured to present the
background to PM in the Australian context against the backdrop of international
competitiveness in a global business environment. It also identifies the movement
towards governance and corporate citizenship with their implications for OB and
management style. The limitations of traditional methods for measuring performance are
visited to introduce a measurement approach for the extended organization behaviour
performance measurement (OBPM) framework. It then lists the objectives of this
research followed by the methodology that is adopted. The chapter concludes with the
contribution of this study and an outline of the structure for the thesis.
1.1.1 Background: The Global Knowledge Economy
Australia has experienced a period of unprecedented economic growth and commercial
prosperity. It has sustained and enjoyed a positive economic growth trend since 1990
(ABS 2006b) and been the envy of many other nations. It is ranked 13th in the top 100
economies and 7th most attractive market worldwide (World Bank 2004). The OECD has
applauded Australia’s initiatives to maintain this impetus. Business and commerce in
2
Australia are booming with productivity growth surging in the second half of the 1990s,
and real gross domestic product (GDP) growth averaging 4% since the turn of the
millennium. Living standards now surpass all G7 countries with the single exception of
the United States (OECD 2006b). In this modern economic era, Australian enterprises
find a commercial world where survival is contingent on performing to standards of
‘world best practice’, while navigating the forces of multiple stakeholders. Whether
proactive in pursuing political and trade agendas or reactive in assessing, diagnosing and
responding to extraneous forces, Australia’s commercial enterprises have reaped the
benefits of adopting sound business principles.
The concept of competitive advantage is familiar to businesses which for many years
enjoyed the protections of the ‘barriers of distance’ and have recently recognized that
these barriers no longer exist. Business has also learned the lesson that there is no ‘level
playing field’ and the ruthless pursuit to win or serve customers is the only chance for
success. Integral to the quest for betterment and the need to outdo competitors in their
industry, is the assessment of one company against its peers. The comparisons that
organisations make in an evaluation of their own standing against their competitors is in
fact a measure of performance. PM, in its most ubiquitous sense, is the simple process of
comparison; comparison to some standard that is meaningful and of value to the entity
making the comparison. For the individual employee the measure informs about their
own behaviour against the organisation’s goals, for the organisation it informs about the
performance of various units, departments or cost centres, against corporate goals
(Inman and Simmering 2006), while for the corporation it provides feedback on the
degree to which it is fulfilling its stakeholders’ expectations. But, performance is not a
unitary concept. To some it is related to results, such as the financial achievements over
a given period, while others are focused on the determinants of such results, i.e. factors
such as quality, responsiveness, flexibility and innovation, while still others discuss the
increasing relevance of governance and partnership relationships. The differences
suggest that there is a need for an inclusive framework which caters for all.
In business, the result of these performance comparisons becomes a harbinger of decline
or a catalyst for change-it is a challenge. Fortunately, to date Australia has accepted the
challenge and responded in a rewarding fashion. Today the challenge is one posed by the
3
advent of the globalisation of business furnished by the international corporatization of
companies and the networking of their supply chains. Some of these multi-national
enterprises (MNEs) have economic power bigger than many sovereign nations. Global
competitiveness is the mantra which distinguishes this economic era from previous ones.
What has been responsible for the Australian achievement outlined at the beginning of
this section? The key drivers for such a sustained effort are many and all subject to
academic, political and social debate (OECD 2006b; Parham 1999, 2002). However, in
all arenas there is agreement that progress has been made because of sound management
and leading performance practices. Managers have adopted and used techniques that
create and sustain superior performance within the organisation and transplanted these to
partners in the supply network (Porter 2004). Performances have been measured by
benchmarking comparisons but achieved by utilizing all resources effectively. The
human resource with its knowledge capital should not be dimmed on this agenda. In
other words, the mechanistic techniques for achieving competitiveness should be
synthesized with the OB cultures that promote them.
1.1.2 The Behaviour of Management and the Role of Companies in Society
In the developed world there is now a re-thinking of the best way to optimize the human
resource. The ‘productivity-through-people’ strategy recognizes the importance and
value of the ‘knowledge capital’ available to firms through its employees (Senior and
Swailes 2004). OB theories have moved in favour of teams, based on empowered
employees as the linchpin which gives a competitive advantage against the threat of low-
cost unskilled labour. In this sense, competitiveness is about fully utilizing knowledge
capital and harnessing the synergy of teams.
This is the kernel of paradigms such as the open socio-technical systems (OSTS) theory
adopted in this research. OSTS is a convergence of: 1) the socio-technical model
propounded by Fred Emery (1982) of the Tavistock Institute and developed by Dutch
researchers; 2) Ludwig Bertalanffy’s (1968) general systems theory; and 3) Jay
Forrester’s (1961,1968) provision for information feedback and mathematical modeling.
4
Organisation theory posits that outcomes and achievements are the consequences of
organisation structure, policies, management culture and leadership style. The OSTS
model prescribes a joint optimisation of technical and social subsystems. The social
subsystem is one where the employee stakeholders bring knowledge, skills, attitudes,
values and personal relationships to the work environment, which has hierarchical and
organisational structures but which operates on humanistic principles of industrial
democracy. Humanistic values within the firm and its management according to these
principles, translates into an associative, democratic style where external stakeholders
have a strong influence on corporate decision-making. In the transactional environment
the stakeholders have an immediate connection with the firm as partners in the supply
chain, whereas in the contextual environment the connection is a more nebulous one with
the community and the general economy.
Corporate governance (CG) is the way in which the firm is controlled, and therefore
reflective of the leadership and culture of the organisation. It is the stewardship of the
firm, in a system comprising formal and informal institutions, laws, regulations and rules,
ownership, and delegated power, to achieve financial, environmental and social goals.
These goals are often stated as ‘the triple bottom line’. It is much touted to underpin
organisational competitiveness and success, yet its measurement is frequently myopic,
usually dimensionally-limited and often qualitative. However, its importance stipulates
that it be included in any framework that claims to view organisational performance
from a holistic vantage. In this study it forms the foundations for a performance model.
1.1.3 The Supply Chain Imperative
Supply chains (SC) have existed and been important for millennia but it is since the
industrial revolution that business practices evolved into refined 20th century commercial
systems characterized by an emergence of partly integrated supply chains. The supply
chain concept has an intrinsic appeal because it encompasses all business transactions
and has the potential to service and add value to customer needs. The concept implies an
efficient and effective network of business linkages which, through the productivities of
specialization, core competencies and economies of scale, provide valuable end-
customer services and products. The traditional SC business model is one where the raw
5
materials, components and other resources journey through value adding processes, such
as manufacturing or service extensions, through distribution conduits to end users.
Typically material, product and service flows go from suppliers to end users while
financial flows are reversed, from customers to initial suppliers. Information and
knowledge, on the other hand, is bi-directional (Hakansson and Person 2004).
In the 1990s the world of commerce was irrevocably changed by the impact of
computerization and information communication technologies (ICT). The internet
provided a myriad of inexpensive information transferring capabilities. The speed,
flexibility, accessibility, accuracy and reliability of web-based communication
established the norm in conducting business transactions. The impact on business is
immediate, pervasive and unavoidable (Paganetto 2004). As opportunities have
expanded through the globalisation of markets, so have the global competitors become
more threatening to local businesses. The firm that operates as an independent entity
with loosely-linked arrangements with suppliers and customers is facing the threat of
becoming economically unable to survive, a small backwater business, or being taken
over by a more competitive and efficient company. While in the past the pursuit of
operational excellence may have kept a firm competitive against others that had a similar
goal, it no longer succeeds with such a strategy when the others have tackled the goal of
attaining greater efficiencies by challenging performances along the whole supply chain.
Traditionally the field of operations management has been concerned with the effective
planning, organizing and controlling of the resources and activities necessary to produce
goods/services for customers. The framework of a systems model reflecting this
typically comprises Input (resources)-Transformation-Output (goods/services) with a
feedback loop, This effectively defines the organisation and establishes its operational
imperative, that of converting and using resources to provide quality products to
customers, as efficiently as possible (Kidd, Richter and Stumm. 2003). It should be noted
that this input-output model becomes seminal to this thesis as detailed later. However,
there are numerous aspects and various determinants of organisational performance
within the conventional supply chain and many of these are now outdated with the
advent of ICT and the internet. The sheer pervasiveness and economy of ICT has
launched new business models based on various e-commerce platforms (Croon 2001).
6
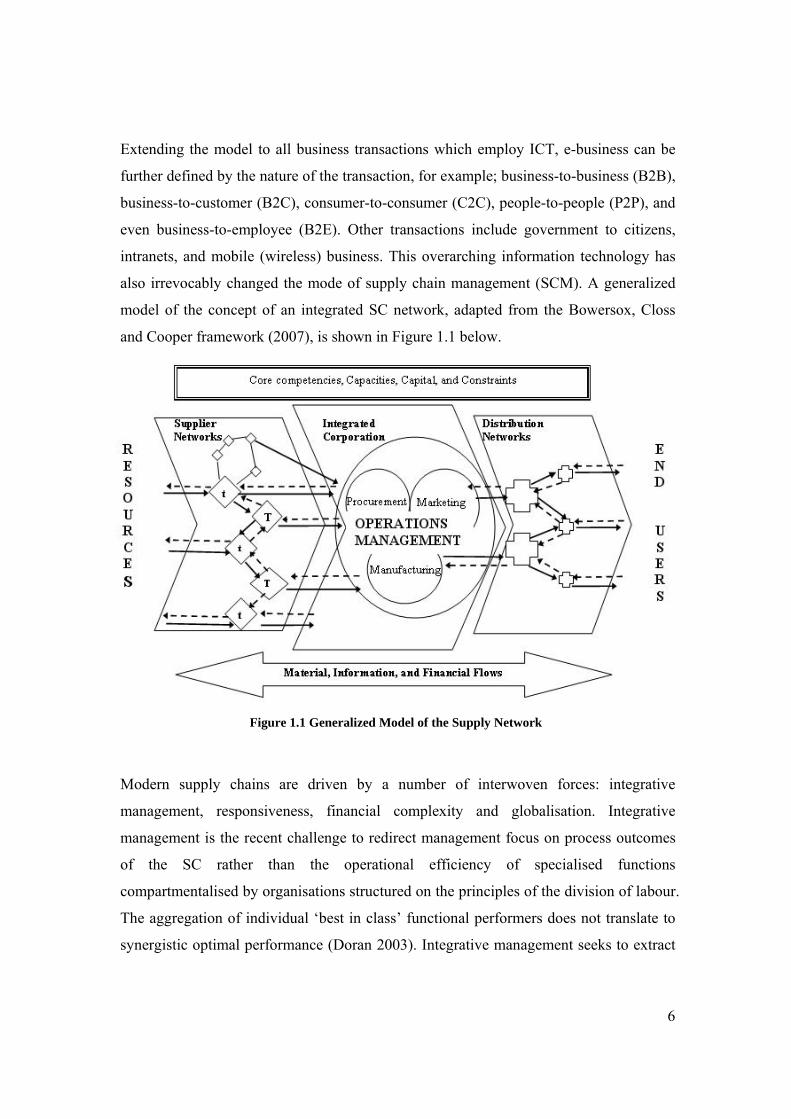
Extending the model to all business transactions which employ ICT, e-business can be
further defined by the nature of the transaction, for example; business-to-business (B2B),
business-to-customer (B2C), consumer-to-consumer (C2C), people-to-people (P2P), and
even business-to-employee (B2E). Other transactions include government to citizens,
intranets, and mobile (wireless) business. This overarching information technology has
also irrevocably changed the mode of supply chain management (SCM). A generalized
model of the concept of an integrated SC network, adapted from the Bowersox, Closs
and Cooper framework (2007), is shown in Figure 1.1 below.
Figure 1.1 Generalized Model of the Supply Network
Modern supply chains are driven by a number of interwoven forces: integrative
management, responsiveness, financial complexity and globalisation. Integrative
management is the recent challenge to redirect management focus on process outcomes
of the SC rather than the operational efficiency of specialised functions
compartmentalised by organisations structured on the principles of the division of labour.
The aggregation of individual ‘best in class’ functional performers does not translate to
synergistic optimal performance (Doran 2003). Integrative management seeks to extract
7
efficiencies through collaboration with partners, extending the enterprise by crossing
ownership boundaries, and integrating service providers by outsourcing. Responsiveness
can be an outcome of integrative management. Traditional business practices were based
on predicting customer demands and therefore then performing essential work in
anticipation of future requirements. This anticipatory work was duplicated along the SC.
Joint planning and rapid information exchange between SC partners can, through
synchronization of operations, provide a response-based business model that reacts to
committed demand (Duffy and Fearne 2004). The customer not only initiates the order,
but specifies its degree of customization as well. This also augers well for financial
investment.
Since fast delivery means less ‘turnaround’ time, the time it takes for the investment to
achieve its return is also reduced, hence a higher return on investment. Utilisation is a SC
measure of the ratio of time an asset is idle to the time it takes to complete its task.
Reducing time across the SC reduces investment necessary for it to perform its role and
thus releases capital. This investment benefit is sometimes referred to as ‘cash spin’. The
main enabler of the integrated SC is ICT as the force that drives globalisation.
Globalisation can be seen as normal social evolution, albeit exponentially rapid in recent
times, or a new force driven by technological innovation. Irrespective of definition, it is
acknowledged as part and parcel of the current business arena and must be addressed.
There are challenges which are significantly different to regional or even national
operations. Distances are longer, governing authorities have laws and regulations which
can complicate business transactions, consumers may exhibit different demand
characteristics, and cultural diversity can be significant (Macbeth, 2002). Under these
conditions and with these broader jurisdictions management has had to re-define itself
and its role, and embrace more collaborative relationships with stakeholders.
1.1.4 Organisational Performance Management and Measurement
The need for PM to communicate achievements, good and poor, has never been greater,
yet the field of PM is not new. It has been a human activity as long as humanity itself but
perhaps more formalized since the publication of Domenico Manzoni’s 1540 AD
Quaderno, which explains the expository technique of ‘double entry book-keeping’ still
8
practiced today. But the finance discipline is not the only discipline involved in PM.
There are many others (Lowson 2002). The diversity of disciplines includes organisation
theory, strategic management, operations management, human resource management,
economics, operations research and information systems. Relatively new to the literature
is performance management in its own right and the emergence of productivity theory.
To view organisational performance solely from any of these perspectives would be
simplistic and myopic.
This thesis recognizes the importance of performance being studied by a multi-
disciplinary approach and attempts to do so by crossing boundaries where necessary.
The management of performance is hinged on the knowledge of what it currently is, at
what level the competitors are performing, and what performance could and should be. In
other words, the management of performance is centred on its measured values, hence the
importance of measurement above all else. It is the umbilical cord for improvement
(Neely, Bourne and Adams 2003b). Often the measurement of performance has been
viewed as simply the systematic collection of numbers to operational functions, resulting
in metrics which purportedly allows meaningful comparisons. The accounting, financial
and economic fraternities certainly accept that the financial metrics are suitable indicators
of comparative performances amongst companies, industries and nations. Why is it so
difficult to get meaningful information? Sink (1985) perceptively observed that most
people who address the task of developing measurement systems eventually come to the
conclusion that measurement is a mystery, and he notes that experts readily admit that
measurement is complex, frustrating, difficult, challengingly important, abused and
misused.
Performance, its perception, measurement, and management, is pertinent at every stage
of the supply chain, from the primary supplier to the ultimate end-user (Neef 2004). At
every stage and in every way there are stakeholders that are making comparative
judgments. Consequently it is not dismissive to state that performance must be measured
at various stages of the supply chain but also at the different levels within each process
of those stages. In other words, it should be measured in a multi-faceted and multi-
dimensional way. This should imply a multitude of measures and some mechanism for
9
their synthesis. However, simply doing the exercise and obtaining them for ‘their own
sake’ will not provide the motivational impetus to improve.
1.1.5 The Elements of Performance
The need for new measures of performance arises because of the change of direction
from introspectively focused operational analysis of functional processes, individually
within the firms of the supply chain, to customer-centred orientations which commence at
the start of the supply chain through to the end-user (Hill and Alexander 2000). Every
link in the chain has a customer at one end, including the internal customers as defined in
the quality management literature.
Strategic direction and policy setting should be encouraged by measured performance
(results) which encourage actions congruent with the company’s business strategy
(Vollmann et al. 2005) and which are critical to ‘world class competition’ (Sink 1985).
This, in a global forum, means every facet of the competitive imperative of the modern
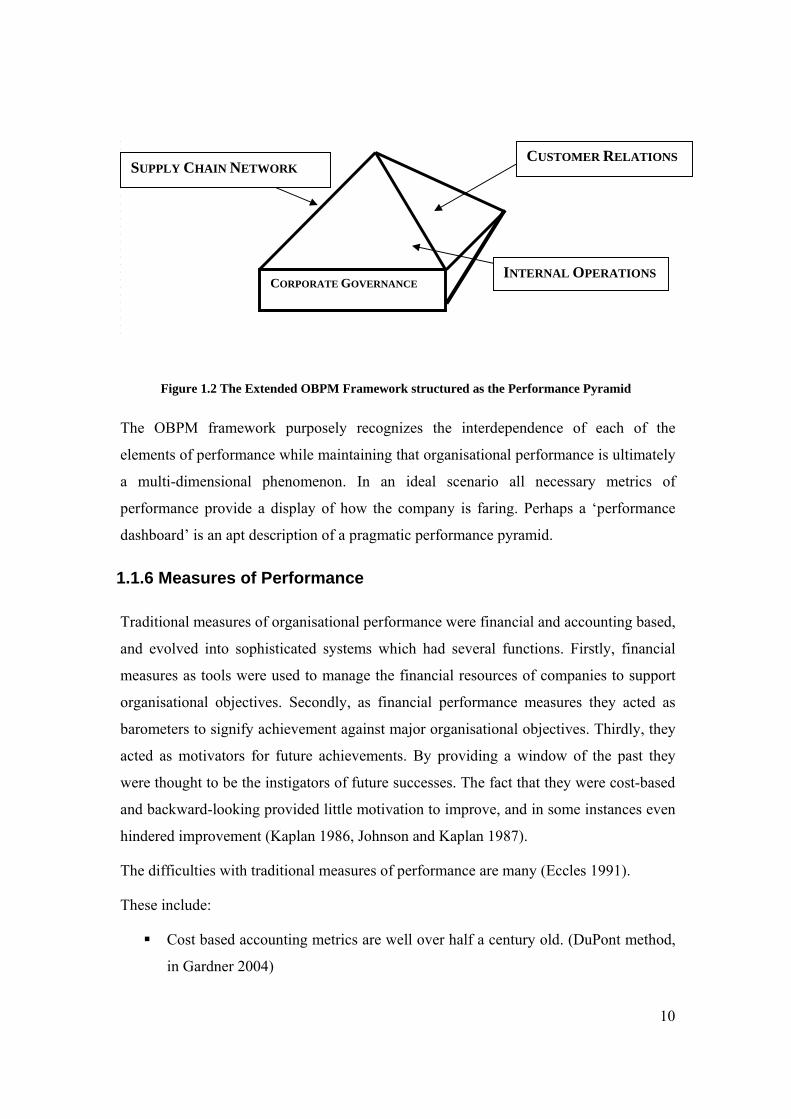
marketplace should be measured. The elements of performance are therefore; i) OB
through its application of modern management theory, ii) SCM through its relationships
with transactional stakeholders, iii) and CG for its stewardship of the firm to satisfy all
stakeholders, and through its corporate citizenship for contextual stakeholders. An
extended OBPM framework can thus be visualized as of a performance pyramid, in
Figure 1.2. Note that the foundation of the structure is CG. One of its sides reflects
internally measured performance of the firm. The other side represents the performance
of the supply chain in which the firm conducts business, while the third side of the
pyramid measures the customer relationship.
10
CORPORATE GOVERNANCE
SUPPLY CHAIN NETWORK CUSTOMER RELATIONS
INTERNAL OPERATIONS
Figure 1.2 The Extended OBPM Framework structured as the Performance Pyramid
The OBPM framework purposely recognizes the interdependence of each of the
elements of performance while maintaining that organisational performance is ultimately
a multi-dimensional phenomenon. In an ideal scenario all necessary metrics of
performance provide a display of how the company is faring. Perhaps a ‘performance
dashboard’ is an apt description of a pragmatic performance pyramid.
1.1.6 Measures of Performance
Traditional measures of organisational performance were financial and accounting based,
and evolved into sophisticated systems which had several functions. Firstly, financial
measures as tools were used to manage the financial resources of companies to support
organisational objectives. Secondly, as financial performance measures they acted as
barometers to signify achievement against major organisational objectives. Thirdly, they
acted as motivators for future achievements. By providing a window of the past they
were thought to be the instigators of future successes. The fact that they were cost-based
and backward-looking provided little motivation to improve, and in some instances even
hindered improvement (Kaplan 1986, Johnson and Kaplan 1987).
The difficulties with traditional measures of performance are many (Eccles 1991).
These include:
Cost based accounting metrics are well over half a century old. (DuPont method,
in Gardner 2004)
11
Cost accounting is still often dated and thus misleading in its information (Otley
and Fakiolas 1995).
Performance is usually isolated to individual units, rather than holistically
measured and interpreted (Otley 2002).
Many managerial decisions are historically founded in concepts such as return on
investment and payback period.
Financial information used in managerial decision making is often far removed
from operational relevance, resulting in a failure to understand the implications
on processes (Keegan et al. 1989).
The importance of the customer is often ignored or downplayed in financial
decisions (Hill and Alexander 2000).
There is no distinction in the use of management accounting rules applied to
different types of operational processes such as: service operations,
manufacturing to high volumes or wide variety, mass customisation, or other
combinations (Otley 1999).
Bottom-line financial results are historically focused when the firm should be
intent on going forward (Elkington 1997).
The inadequacies of traditional finance-based measures of performance spurred the
search for better metrics. Financial specialists adopted measures such as activity based
costing (ABC), economic value added (EVA, Otley 1999), and triple bottom line (TBL,
Elkington 1997) to their portfolio but it was the advent of the ‘balanced scorecard’ (BSC,
Kaplan and Norton 1992) that heralded an innovative approach to measuring
performance (Appendix 11). This new American framework had four dimensions, with
the financial perspective still maintained as an important one of them. The others were
the internal business perspective, customer perspective, and the innovation and learning
perspective. The BSC has been well received and drawn so much attention in the world
of commerce that it was the most cited work at the 1998, 2000, and 2002 PM
Association conferences (DeWaal 2003). The Cranfield University response to the BSC
is the ‘Performance Prism (Neely, Adams, and Crowe 2001) which has five ‘facets of
12
performance’; stakeholder satisfaction, strategies, processes, capabilities and stakeholder
contribution (Appendix 12). These PM models and other similar ones, such as the
performance tree of Lebas (1995), the performance matrix of Keegan, Eiler and Jones
(1989) or even the Tableau de Bord (TdB, Epstein and Manzoni 1997), recognize the
need for including non-tangible performance indicators in a broad-based metric. In many
ways the elements of performance mentioned in section 1.1.5 above, or their surrogates,
should be included in such models. They are not (Olve, Roy and Wetter 1999).
The BSC for example, fails to address the role and standing of competitors, and lacks
prescriptive detail (Norreklit 2000), while the performance prism and BSC both fail to
address the significance of CG. Similar arguments can be applied to other models which
generally lack methods for measuring the extended OBPM framework presented in this
study.
The approach taken in this research, namely of an extended OBPM framework, is
possible because of the use of DEA. DEA is a linear programming technique for
measuring productivity across a myriad of ‘decision making units’, and ranking the
contenders in order of their performances. The best performers are benchmarked and
assigned a rating of unity in comparison to lesser performers. This as a generic approach
is not unique (Rouse 1997), but its application is. The DEA algorithm is applicable to all
stages in the supply chain, commencing with an evaluation of CG. Such an approach has
not been attempted before. While DEA has been successfully used to measure individual
performance relationships in singular research dimensions and in different fields, it has
never been used in an extended framework of PM which covers OB, supply chains and
CSR. This is done in this dissertation.
1.1.7 Data Envelopment Analysis
DEA, an optimizing technique based on the linear programming method, was originally
designed to tackle the task that parametric models failed in, to assess relative
performance of firms which were not-for-profit organisations and where outputs are not
quantifiable in conventional measures such as dollars, volumes or quantities. The non-
commercial nature of these types of organisations rendered the traditional financially-
13
based indicators of performance inappropriate and in many ways misleading or
meaningless. Consequently, other metrics were devised for specific instances and
particular organisations but they lacked the ability to provide benchmark performance
indicators that could provide objective analytical comparisons of the roles of successful,
detrimental or influential factors.
Furthermore, they were incapable of unambiguously specifying where the poor
performers were failing and what was the scope for improvement. The other less tangible
variable in the performance matrix is the value or quality of the input resources required
to achieve the desired outputs. For example, in recent times, knowledge capital has been
touted as a valuable resource yet if fails to be successfully quantified, especially in
relation to its contribution to organisational performance. Traditional easily counted
resources such as workforce numbers, buildings, facilities and equipment have been
financially valued but inadequately evaluated in their contribution to the organisational
mission. In many ways their contributions may have been underestimated, and in some
instances over-inflated. For example, state-of-the-art technological equipment in schools
may be cited as the reason for academic excellence while life experiences and subject
knowledge of teachers may be regarded as less important. Despite the subjectivity of the
conventional metrics employed in assessing the performance of non commercial
organisations, DEA has been successful in adapting these to determine the relative
efficiencies of schools (education), health care (hospitals, clinics, etc), police forces,
transport, banking, housing and other public sector utilities. A bibliography of DEA until
1992 is provided in Charnes, Cooper, Lewin and Seiford (1994).
In more recent times DEA has been tested in wider and diverse situations such as global
economic studies, alternate technologies and environment pollution comparisons and it
has enjoyed success with such larger units of study. In all cases reported, the technique
succeeded on the basis that it made comparisons between units of the same population. It
operates as a comparative instrument which allows the best performing units to be rated
as the most efficient, equally so if there are several, and assigns the lesser performers
decreasing grades by rank. Schools were compared with other schools, police patrols
with other police patrols, hospitals with hospital, etc. The basis for comparison was the
efficiency expressed by the ratio of outputs to the inputs. The outputs were the services
14
or goods produced and often intangibly defined, and the inputs were the resources
required and used in the production of these outputs. The fundamental DEA analysis is
the ability to make comparisons of ratios with differing contributors to input resources
and some defined differences in the outputs, and then discriminate between the various
combinations to find the best ones. The best possible ratio is assigned the premier rating
of 100% (or 1) and the others ranked against this are expressed as a percentage.
The organisational unit achieving this ‘best score’ is viewed as the most efficient under
the given circumstances, and the one that others are compared against but it is not
suggested nor implied that this is the “best possible” score in absolute values. How far
others fall short of this 100% value expresses their potential for improvement under
current conditions. In a fashion the best performer is set as the ‘current benchmark
(BM)’ for others to aspire to, even though best performance is only ascribed as best
relative to the field rather than an absolute ranking.
1.2 Objectives
The objectives of this thesis are to demonstrate the development of an extended OBPM
model for a commercial enterprise in an Australian supply chain.
This will be done by:
Identifying the role of management style in creating OB which affects the
performance of the enterprise.
Identifying the competitive forces, processes and methods that drive the need for
PM in a modern business enterprise.
Identifying all stakeholder groups and their contribution and importance to every
stage of production and the supply chain.
Critically reviewing and assessing past research in the field of OB related to
performance.
Developing a new approach to analyse organisational behaviour and PM by using
DEA to embed the essential elements of CG and SCM in the measurement of
performance in a modern business enterprise.
15
Analyzing performance metrics and measurement processes, past and present.
Testing and applying the developed new approach and quantitative methodology
with field data.
Validating the framework by identifying strengths and weaknesses in the model,
and
Delineating the path forward for further research and development in this field.
1.3 Methodology
The research methodology used in this thesis is based on the positivist stance that allows
mathematical modeling of a commercial environment. Operations research techniques
are specific to this task. Here an optimization algorithm, available through the linear
programming derived DEA, is used on empirical data from a large Australian publicly
listed company to test the performance of 231 business units on their achievements in
CSR as pronounced in corporate vision and promulgated in corporate policy and
procedures. The data was originally collected and used by Black (2004) to establish a
‘Corporate Social Responsibility Management Capacity’ construct. This research uses
that data in an explanatory and evaluative identification of the key factors in the
conceptual framework of the OBPM model, the interrelationships of those factors, and
the roles played by stakeholders. Key factors from the various concepts are
operationalised and then subjected to quantitative analysis to reveal the strengths of
causal relationships among these factors.
The advent of powerful computing resources at a cheap cost has made many tedious
mathematical tasks simple through spreadsheet applications. Linear programming is such
a task, essentially a recursive process. The DEA algorithm has similar requirements but
these can be addressed through ‘plug-in’ spreadsheet applications as well as commercial
software. The commercially available software DEA-Solver PRO (professional Version
4.1) was intentionally chosen for this research because of its specificity for DEA
computation and the expansive selection of DEA models available. DEA was chosen as
the operations research technique because it allows the efficiency of selected entities to
be studied and analysed comparatively, without the need for an absolute ideal
16
performance standard. The relationships tested by DEA have origins in production
economics. Here efficiencies are depicted as the production frontier established by those
units which display the best productivity, efficiency being the ratio of input resources to
outputs of goods, services or other outcomes.
These production functions are evident in a multitude of relationships within the OBPM
model of a business enterprise operating in a supply network. The methodology adopted
in this thesis is routine operations research but novel in application. Model formulation,
as the first step, requires problem definition, selection of decision variables and
parameters, and choice of mathematical technique. The next step is data gathering,
followed by model execution to obtain the optimal solution. This in turn is validated and
tested before results are implemented. Some of the steps are iterative as new information
becomes evident and adjustments are required.
1.4 Contribution of this Thesis
The impetus for this thesis comes from the failures of past and present performance
measurement models to fully address the multi-dimensional nature of corporate
performance. While many disciplines have been interested in organisation performance
their research has been mostly myopic. Cross-fertilization of ideas has been sparse and
holistic integrative approaches rare. Further motivation comes from the inability of
current models to explain emerging issues such as the effect of globalisation and
knowledge economy on corporate governance, supply networks, organisation behaviour,
and enterprise design; let alone their ability to describe and measure performance in these
areas.
1.4.1 Limitations of Existing Literature
The critical review of the literature has revealed a number of flaws in traditional
approaches to gauging organisational achievements as a precept for competitive
performance. The major criticisms of existing models can be summarized by the
following limitations:
17
1) Short-termism. Established financial measures are historical and short-term.
They emphasize recent past performances as a basis for going forward. They are
short term focused because of accounting and regulatory practices which require
yearly reporting intervals.
2) Non contemporary. They are also accused of not being interpretive of real
business situations, presenting a veneer of everyday operations, and not
addressing emerging issues (Otley and Fakiolas 1995).
3) Non-integrated. They further fail because of their inability to integrate the
styles of management, leadership, and OB dogmas which play important roles in
making a company competitive, responsive to stakeholders, and socially attuned.
4) Stakeholder relationships. Other measures of performance fail to address the
importance and contributions of all stakeholders including the intra and inter-
relational network partners in the whole supply chain in which the modern
enterprise operates.
5) Although some recent literature has attempted to redress these failings,
particularly in commercial performance management frameworks, they are
limited because of no formal rigorous mathematical modelling, no empirical
testing, and little reporting in academic avenues.
1.4.2 A New Approach-Overcoming the Limitations
This thesis makes a significant contribution by developing a new framework for an
integrative approach to PM. It incorporates the essential elements of: OB, SCM, PM and
a novel use of operations research methodology as follows:
1) OB through a management model based on OSTS theory, and its application in
humanistic styles of management reflected in CG and CSR. This also incorporates
the concerns of all stakeholders.
2) SCM through the technical and social networks that connect stakeholders
operationally through the SC and contribute to its performance.
18
3) A PM framework developed from successful contemporary models, and built
on to integrate the critical success factors in each performance dimension.
4) An application of operations research methodology using DEA applied in a
novel situation, enabling the quantification of qualitative information through
relative, rather than statistical or absolute comparisons of efficiency, and
paving the way for future new applications of this non-parametric tool.
In addition, this approach veers away from traditional practices by focusing on the
emerging needs of a new era and developing a PM framework that is dynamic and
maintains its relevance by evolution.
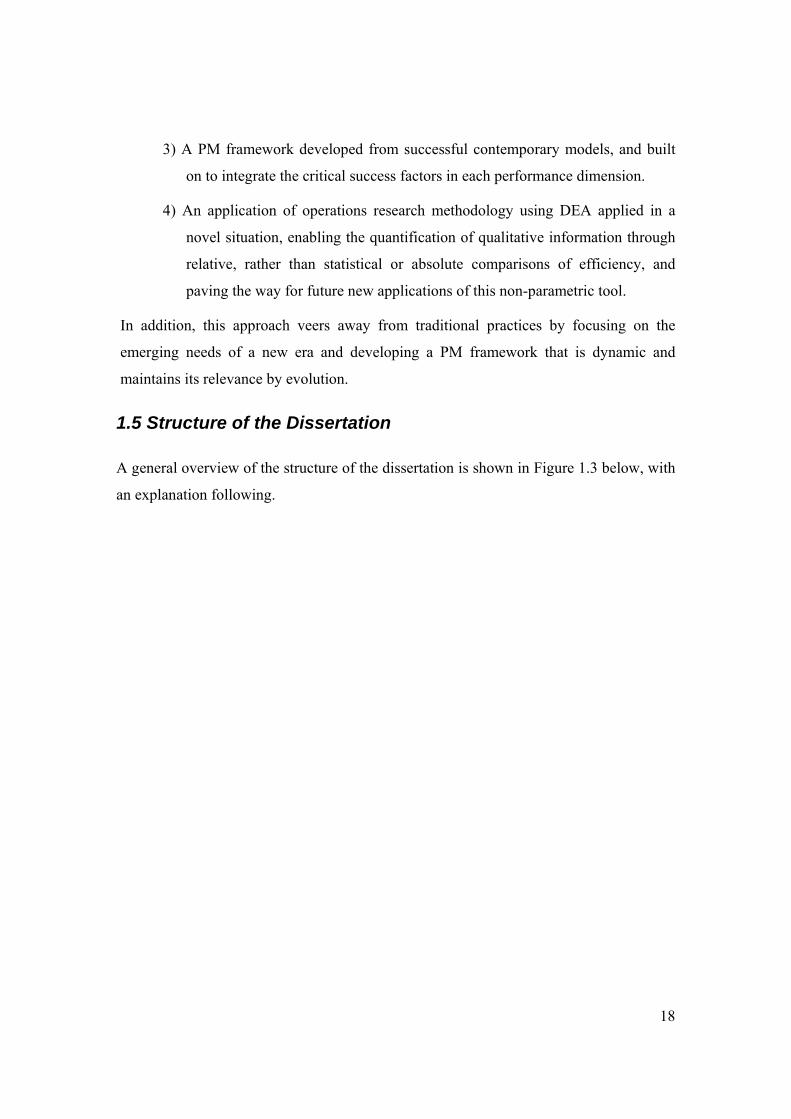
1.5 Structure of the Dissertation
A general overview of the structure of the dissertation is shown in Figure 1.3 below, with
an explanation following.
19
Figure 1.3 Structure of the Dissertation
A critical review of the literature pertaining to PM, OB, CG, SCM and the global
backdrop for Australian enterprises is presented in Chapter 2. A proposed conceptual
framework for this thesis, of an extended OBPM framework to facilitate analysis and
evaluation, is given in Chapter 3. This includes the methodology and the rationale for
using the DEA algorithm as the instrument chosen for the measurement of performance
at the various stages of the SC, commencing with the helm of the enterprise, CG.
Chapter 4 describes the workings of the DEA algorithm so that the requirement for
providing a benchmarking analysis is understood in terms of comparative efficiencies
and potentials for improvement. It also introduces the application of DEA to the study of
CSR in the chapter following.
20
Chapter 5 develops a corporate governance model of CSR so that it can be analysed
within the DEA non-parametric framework. It then describes the application of DEA
through trials and tests conducted on empirical data from a large Australian commercial
enterprise, and presents the results of all tests.
Chapter 6 reports the results of the study with an interpretation of these findings, both in
terms of CSR and the efficacy of the DEA algorithm as a diagnostic tool for this purpose.
It reinforces the findings by conducting a correlation analysis of the significant variables.
This chapter strongly supports the OBPM framework by demonstrating its positive
relationship with the humanistic management style, inherent in OSTS and CSR. This
achievement also strengthens the support for an operations research methodology by the
demonstrated success of DEA.
Chapter 7 discusses the implications of the DEA and CSR findings in the previous
chapter as an opportunity to redesign the organisation to meet its future needs. The
strategy for redesign is to integrate the PMS into OSTS and adopt this design for both
CG and the supply network. DEA becomes the measurement instrument for pivotal
points in the integrated PM framework. This integrated framework provides the basis for
an holistic ‘enterprise performance scorecard’. In this fashion it contributes to the
advancement of knowledge in this field with a concept that has not been previously
proposed.
Chapter 8 provides a summary of the thesis with an integration of the diverse concepts. It
also discusses the limitations to the present research. It concludes with a proposed
optimization model as the recommendation for future direction.
21
Chapter 2
Critical Literature Review:
OB, CG and SCM in the Measurement of Performance for Commercial Enterprises in a Global Knowledge Economy
Between knowledge of what really exists and ignorance of what does not exist lies the domain of opinion. It is more obscure than knowledge, but clearer than ignorance. Plato 428-348 BC
2.1 Introduction: Issues and Developments in Contemporary
Global Knowledge Economics and Business
This chapter will present a critical review of the contemporary literature for
measurement of performance of modern commercial enterprises as they strive to succeed
in the competitive global knowledge economy. The review will commence with issues
and developments in the contemporary global economic and business marketplace in
which commercial enterprises must now compete. This is discussed in the first section
where the new business arena is preponderant with information communication
technologies (ICT) and their rapid evolutionary benefactions. The evidence of this is
witnessed through the emergence of a global knowledge economy. With this backdrop,
how management handles the task of running the firm is studied through the contribution
of OB to organisational performance by the emergence of new OSTS paradigms, and is
reviewed next.
This is then followed by an analysis of how the emerging issues and new developments
are changing society. In particular, the research focuses on CG and citizenship and the
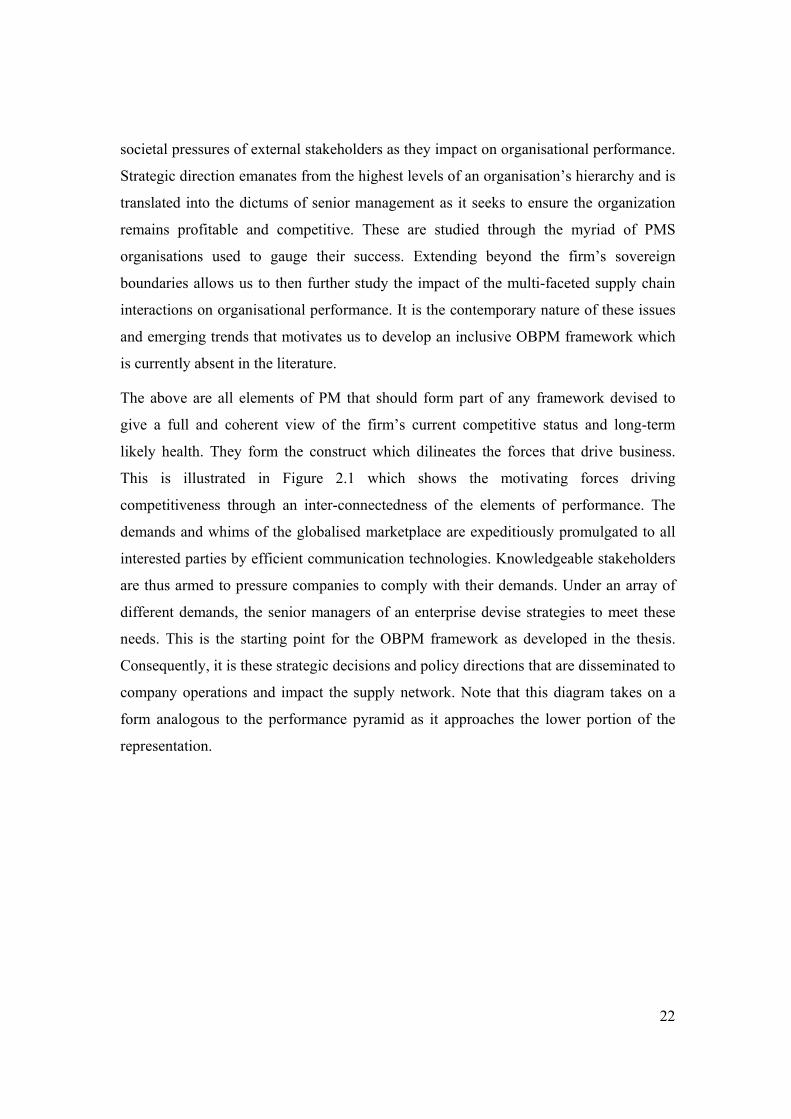
22
societal pressures of external stakeholders as they impact on organisational performance.
Strategic direction emanates from the highest levels of an organisation’s hierarchy and is
translated into the dictums of senior management as it seeks to ensure the organization
remains profitable and competitive. These are studied through the myriad of PMS
organisations used to gauge their success. Extending beyond the firm’s sovereign
boundaries allows us to then further study the impact of the multi-faceted supply chain
interactions on organisational performance. It is the contemporary nature of these issues
and emerging trends that motivates us to develop an inclusive OBPM framework which
is currently absent in the literature.
The above are all elements of PM that should form part of any framework devised to
give a full and coherent view of the firm’s current competitive status and long-term
likely health. They form the construct which dilineates the forces that drive business.
This is illustrated in Figure 2.1 which shows the motivating forces driving
competitiveness through an inter-connectedness of the elements of performance. The
demands and whims of the globalised marketplace are expeditiously promulgated to all
interested parties by efficient communication technologies. Knowledgeable stakeholders
are thus armed to pressure companies to comply with their demands. Under an array of
different demands, the senior managers of an enterprise devise strategies to meet these
needs. This is the starting point for the OBPM framework as developed in the thesis.
Consequently, it is these strategic decisions and policy directions that are disseminated to
company operations and impact the supply network. Note that this diagram takes on a
form analogous to the performance pyramid as it approaches the lower portion of the
representation.
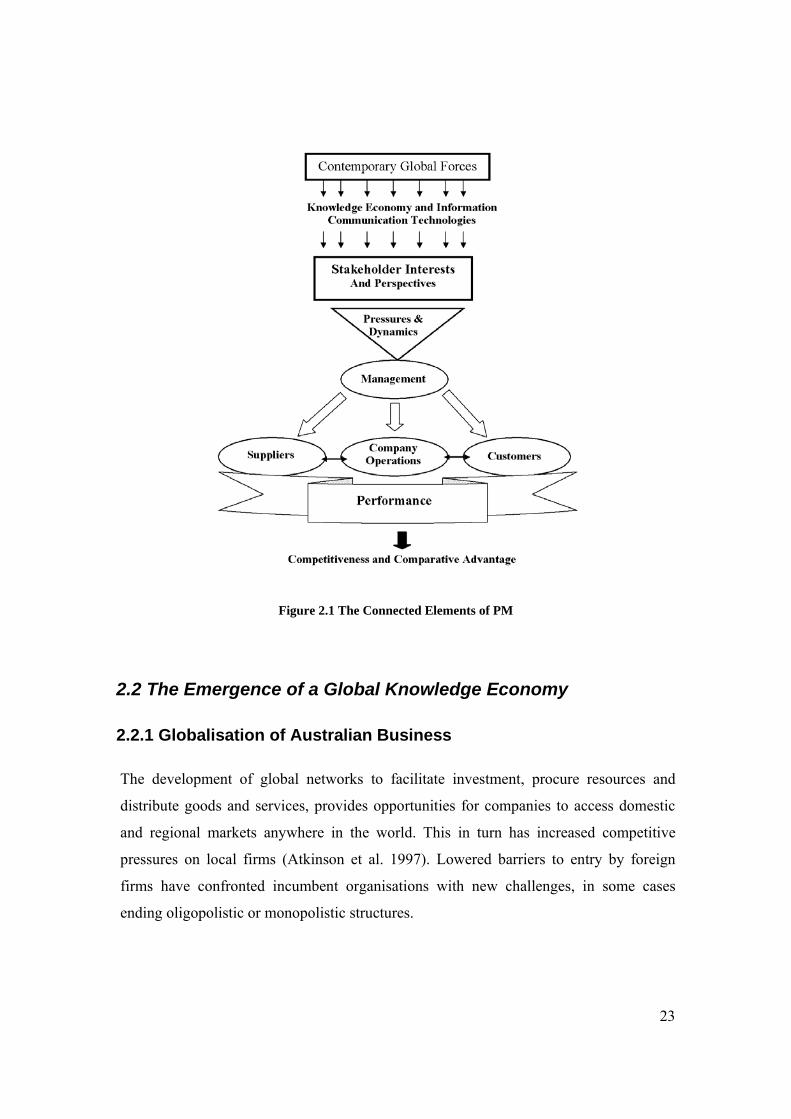
23
Figure 2.1 The Connected Elements of PM
2.2 The Emergence of a Global Knowledge Economy
2.2.1 Globalisation of Australian Business
The development of global networks to facilitate investment, procure resources and
distribute goods and services, provides opportunities for companies to access domestic
and regional markets anywhere in the world. This in turn has increased competitive
pressures on local firms (Atkinson et al. 1997). Lowered barriers to entry by foreign
firms have confronted incumbent organisations with new challenges, in some cases
ending oligopolistic or monopolistic structures.
24
New reporting standards have emerged (see IIA 2004 and ISEW 2004 for reference to
AA 1000) and comparisons between competitors have been conducted. The need for PM
to communicate achievements, good and poor, has never been greater.
Globalisation is the economic and social phenomena which diminishes the impact of
distance on trade and difference insocial cross-border interactions to the extent that inter-
regional and transcontinental trade, investment and flow of capital act as if they are
always part of the local economic business environment (Ricks 2003). The International
Monetary Fund (IMF) describes it as the growth in interdependence of countries through
the increasing cross border transactions in volumes and variety of goods and services,
and international capital flows expedited through the pervasiveness of ICT. This
interdependence also means that CG mechanisms need to reflect fairness, transparency
and social responsibility (Sgro 2003). To this extent it is responsible for increasing the
competitive forces on business strategy to the world. In Australia for example, this trend
can be traced to the unilateral lowering of tariffs in 1986 (Oxley 2000).
In simple neoclassical economic terms, the beneficiaries of capital inflow, investment
and business development, are those countries where domestic costs are lower than
elsewhere. These countries have a comparative advantage (CA) and benefit at the
expense of those that have lost business because they are not cost competitive. These are
not necessarily only the poorer countries. Investment and international trade are seen as
the engines of world growth. While it is credited that globalisation has been responsible
for the elevation from poverty of three billion people over the last 50 years it is also
estimated that if trade were liberalized further by a reduction of 50% in protection levels,
Australia would benefit to the value of $7 billion per year (Globalisation Guide 2005).
Rich and poor both benefit. Wolf (2004) sums this up by saying that never before have
so many people or so large a proportion of the world’s population enjoyed such large
rises in their standard of living. This dictum of capitalism can only promote further
globalisation. It is therefore necessary to view this phenomenon as a major force in the
contemporary business arena.
The fluidity of capital flow and the ease with which commercial investments can target
regions has created a platform of instability for many companies.
25
Companiesare constantly under scrutiny for their operational performance and are liable
to face closure or relocation to less costly regions. The only strategy for self preservation,
predominantly within control of the organisation, is that of performing well and adopting
a ‘competitive advantage’ ethos.
Michael Porter’s (1998) seminal work on CA has lower costs and product differentiation
as locational advantages which describe the organisation’s leadership standing in its
industry. How a company achieves an advantage pertains to the way in which it uses its
resources and capabilities in the form of distinctive competencies which enable it to
create value in its own activities as well as the value system of upstream suppliers and
downstream channel members (Gunasekaran, Patel and Tirtiroglu 2001). Implicit in the
processes of striving for CA are methods of comparative analyses including those
referred to as benchmarking. Sometimes alternative strategies involve a rethinking of
how the firm conducts business (Hammer and Champy 1993) or seeking the value
streams in all company operations (Hines et al. 2000).
Benchmarking can take various forms but it generally entails making comparisons of
processes or functions against recognized best practitioners. While at the higher level
these comparisons can be made across industries and with competitors, there are often
obstacles to disclosure of information. Subsequently, the comparisons are made at
cascading lower levels where operational information is less confidential. Since the value
of comparative information relates proportionally to its hierarchical level, it invites
organisations to aim for the highest level where meaningful and accurate information is
available. Unfortunately, this often restricts the company to its own operations with little
scope for including supply chain partners (MacAdam and Bailie 2002). And, when
access to information at this level is not hindered, it may simply not exist. Since
benchmarking requires a comparison to identify the gap in performance, if a metric is
missing then the comparison is not possible. This highlights the need for performance
metrics for functions and processes at all levels of company operations (Grunberg 2004).
Accordingly, they are created as needed and when required. They are commonly referred
to as key performance indicators and are usually used to measure areas of strategic
importance regarded as critical success factors (CSF) (Maull, Tranfield andMaull. 2003).
26
The benchmarking strategy is ideally suited to DEA methodology as described in this
study.
2.2.2 Competition for Australian Business in a Global Economy
While globalisation has added a new element to the force of competition, it has merely
strengthened the business imperative of creating wealth for the owners of commercial
enterprises. Some organisations are capable of providing product differentiation through
mechanisms such as brand imaging or genuine uniqueness of product or service. The
majority of other organizations do not have this ability and when the only option left is
to seek a cost advantage, we see a strategy of profit maximization through cost reduction
and operational efficiency improvements. Initially this attention may be inwardly
focused and rewarding but as incremental improvements are achieved at diminishing
rates of return on effort, the focal area broadens to include the complete supply chain in
its global setting. Inefficiencies in the supply chain resulting from firms operating in a
self-centered fashion are there to be exposed and exploited to the benefit of the partners,
albeit not necessarily in equal proportions.
The Australian commercial environment is based on free market economics, within
government regulation, where the firm has to compete and survive on the basis of some
local advantage, be it knowledge and expertise, responsiveness, service or some other
feature. The transnational and global corporations that operate in Australia have, in a
fashion, the luxury to respond to international pressures in a fluid and dynamic way
which serves the corporation at the expense of the host nation, and avails them of a
multitude of strategies to combat competition. Local industries are not so fortunate. They
are impacted by the forces of international business yet limited in their response
capability (Porter 2004). Most often they are not players on the international scene yet
are subject to some of its pressures. Their survival mechanism is to operate locally, in a
cost effective and customer-service focused way, so that their product or service has a
local identity attraction.
To some degree this may entail an attempt at product differentiation (as a short-term
strategy) but to a large extent this must be a cost neutral offering of a product that has
27
overseas-manufactured rivals. If the product is overly costly, and hence not cost
competitive, then its attractiveness can only lie in other features for which customers are
willing to pay. Stability of government, reliability of supply, cheapness of resources and
an educated workforce displaying a capital of knowledge, are examples of factors of
attractiveness which can counter the cheaper option.
An Australian commercial enterprise is a valid candidate for research in this field.
Australia’s share of global GDP is 2% yet it has a population approaching 21 million
(ESRC 2005), only a fraction (0.33%) of the world’s 6.4 billion. It is a developed
country with an advanced economy and high global trade. It thus displays many features
that are common to other advanced economies, and benchmarks for developing countries.
There were 610 893 operating businesses in Australia in 2001 (ABS 2006a) and by 2003
had grown 6% (ABS 2006b). Large businesses contributed 38% to the national income
(ABS 2006c) and manufacturing industries were the largest contributors to export
earnings, 53% of total exports in 2004-2005 (Year Book Australia, ABS 2006e). Many
of these are foreign owned and operate globally. The other locally owned enterprises that
operate in the Australian market must compete with the international best. They must
operate competitively, meaning they must offer similar but preferably superior products
and services. How do they do this? In the most embryonic of strategies this is done by an
analysis of how well the company fares compared against the offerings of competitors
(Terzvioski 2002). If this comparative analysis is taken further and to a more
sophisticated level then the application of benchmarking as an alternative strategy, is
often adopted. As a comparative tool for improvement, benchmarking is well established
and widely used, even though it is a ‘satisficing’ rather than optimizing technique. It
compares performances and then identifies and measures the gap. Attempting to close
this differential becomes the motivating force that drives changes in an attempt to
instigate improvements. And in so doing, firms can often embrace the current
fashionable management mantras which promise a ‘quick fix’ to their woes, or the
‘technology fix’, or both. Unfortunately these rarely provide the solution and often act as
mere distractions to the fundamental task of establishing a system of sound managerial
control based on measures of performance.
28
Other times, firms may focus on process management through philosophies based on
quality, teams, empowerment and continuous improvement (Evans and Lindsay 2005;
Evans 2008) and benefit from such strategies.
Measuring the performance of a firm is not new (Neely, Gregory and Platts 1995; Carter,
Klein and Day 1992; Dixon, Nanni and Vollman 1990). In fact the financial and
accounting functions that pertain to business are probably as old as business itself.
Financial record-keeping and the managerial controls associated with it have been a
stalwart of commerce in the modern era to the extent that they were regarded as the only
measures of performance of any value. Australian businesses have been no different in
this respect and have treated them as equally paramount. But, like all commerce that was
managed on past performances and past successes, the rising profitable strategies of
visionary competitors cannot be matched by simply adopting historically dated policies
and projecting them forward (Kaplan 1990).
The comparisons that are made against market leaders show that they have had vision
while the others have had established but possibly entrenched structures. Forward
thinking, innovation and forecasting skills have provided successful companies with a
winning formula that others have found hard to match (Kaplan and Norton 1996;
Lowson 2002). And these strategies have been cemented in managerial idiom with
discourses about ‘balanced’ approaches to managing and directing companies. The
Balanced Scorecard of Kaplan and Norton (1992) for example, has been so prolific in
this respect that it has achieved its own icon status in performance management,
especially in America, while in Europe a similar approach is reflected in the Performance
Prism. Financial and accounting perspectives have also been invigorated by innovations
such as Activity Based Costing and Economic Value Added. These are discussed in
Section 2.6.
29
2.2.3 The Emergence of Global Knowledge as Capital
Thomas Friedman (1999) provides a view of globalisation that is widely held. He says it
is:
…the inexorable integration of markets, nation-states, and technologies to a degree never
witnessed before - in a way that is enabling individuals, corporations and nation-states to
reach around the world farther, faster, deeper and cheaper than ever before...the spread of
free-market capitalism to virtually every country in the world. (p 7)
What has facilitated this integration? It is the advent of the enormously powerful
technology of computerization and the exponential growth of the associated information
technologies. Information communication technology has witnessed a process of general
cumulative advances rather than a succession of discrete unlinked innovations. It has
expanded contagiously, taking an increasingly integrative form, offering substantial
contributions to the systematic coordination of business functions. It is a contemporary
view of an established concept in economic geography where the ‘flattening of the
world’ means that “we are now connecting all the knowledge centers on the planet
together into a single global network” (Friedman 2005, p. 8). It is so pervasive that
authors such as Jones (1999) claim that we are now in the post-industrial ‘information
age’ of intense intellectual, cultural and political activity. It has the characteristics of a
shift in employment patterns, from capital intensive employment for production to
increases in services in sophisticated economies.
The description of a global knowledge economy is increasingly being used to label the
present economic era. In Australia more people are engaged in collecting, processing,
storing and retrieving information i.e., in creating knowledge than are engaged in
agriculture and manufacturing,. The knowledge economy sees the emergence of new
structures, arrangements, and processes for the creation, production, and distribution of
goods and services. It is characterised by an intensification of knowledge globally
(Houghton and Sheehan 2000) and is a contributor to increases in labour productivity as
measured by value-added per employee. For example, in the Asian region, China’s
productivity (real GDP/employee) grew by 7.3% per annum for the 1995 to 2000 period
(Grewal et al. 2002).
30
The emergence of MNEs with their economic and knowledge power, greater than many
nations, unleashed by instantaneous communication has led to an international division
of labour dictating where and how business will be conducted. ‘Information rich’
employees who understand the new technology will be more valuable, while the
unskilled ‘information poor’ computer illiterates will become the new lumpenproletariat
(Marx’s ragged workers). The gap widens and knowledge becomes capital in Drucker’s
(1968) knowledge economy. How has information technology contributed to this
intensification of knowledge? Sheehan et al. (1995) attribute enhanced economic growth
to five features of the information technology revolution.
These are:
1) chip technology where miniaturisation through micro-electronics has provided
exponential increases in output at decreasing capital investment;
2) photonic communication technologies facilitated by optic fibre and wireless
networks;
3) digitisation of products, processes and services through open-system integrated
circuits;
4) a convergence of standards and protocols, supporting technologies, such as the
capture, storage and display of data, augmenting other technological advances;
and
5) continuing software development to enable these technologies.
Kuhn (1970) suggests that this break with continuity from the past is unprecedented in
economic history and provides a ‘paradigm shift’ in the way we live, work and do
business. The drop in the cost of technology while at the same time improving its
reliability, capacity and range, as depicted by ‘Moore’s Law’, will mean the
simplification and integration of manufacturing, the displacement of labour and the
growth of an international economy. Alvin Toffler (1971) coined the term ‘future shock’
to illustrate the impact of the ‘information explosion’ where people are no longer capable
of making rational choices from the vast array of information thrust at them. The sheer
volume of information leads to ‘reductionism’ where the ideas are so complex that they
can only be fully understood by analysing their components.
31
Alternatively, a greater reliance is placed on specialists who are experts in their field but
who lack the wider picture. In an organisational sense, as the enterprise becomes too
large and complex for decision-makers to have a synoptic vision of all factors relevant
for policy-making, it adopts a ‘disjointed incrementalism’ as its modus operandi. The
specialists who are experts in their field but do not understand the whole, take power
from the generalists who do not understand the parts but are responsible for the whole.
The key is the power of information through its application as knowledge.
Information has four inherent properties that make self propagation possible and
knowledge dissemination fragmented. It is inconsumable because it does not reduce or
disappear with use. It is also non-transferable because while it moves from A to B it still
remains at A. Information is indivisible because it can only be used as a complete unit or
set but these units are cumulative. It can be used over again, to be added to and to grow,
as a building block of knowledge. The computer provides concentration, dispersion,
circulation and feedback, all at exceptional speeds. Together with these four additional
properties provided by computers it becomes the almost completely flexible tool for all
configurations of communication. The technological capacity now available primes us
for a ‘technological determinism’ where basic decisions are shaped by the technology at
hand and every problem has a technological fix (Sheehan et al. 1995). The more complex
the problem the more high tech the fix. For example, augmented cognition focuses on
the computer deducing a decision-maker’s cognitive state with the aim of somehow
enhancing it because we live in an era of ‘continuous partial attention’ where
information is flowing in faster than the person can absorb, and therefore needs
programmed assistance in decision making.
Knowledge management (KM) is a term increasingly used in the literature to explain
those processes of capturing or creating knowledge, storing and protecting it, updating it
and using it whenever necessary. Since 1975, 2727 authors have contributed to this
discussion (Nonaka and Peltokorpi 2006). Knowledge is collected and created from
internal and external sources and facilitated by ICT. As the repository for the firm’s
information and a vehicle for its dissemination, ICT allows knowledge to be shared
between employees, customers and business partners (Lee and Whang 2000).
32
The payoff potential of this is huge, with improvements in customer service, shorter
delivery cycle times and increased collaboration within the firm and with external
partners. Knowledge can also be sold or traded, as well as shared. It is for this reason
that the ‘information stream’ is now regarded as one of the key elements of supply
networks and a critical characteristic for global supply chains (Rungtusanathan et al.
2003, Ross, Venkataramanan and Einstberger, 1998). However while information is
personality-free, as a construction of data building blocks that simply reside in databases,
knowledge is the human value-added interpretation of information, and resident in
mortal beings (Carr and Pearson 1999). Knowledge is thus organic, fluid and reflective,
within the human vessel where it resides. It is subject to all things human and used in all
ways human. It is therefore, the basis for how employees of the organisation behave,
individually, collectively and culturally, and a contributing factor in OB (Mitchell and
Nault 2003). It is a feature of the learning organisation. It is the modus operandi of the
organisation through its people and is as idiosyncratic of the organisation as of its
members. Organisations, like people, differ in every possible way. They have uniqueness
yet commonality. Uniqueness is the synergistic sum of all the individual features of the
organisation while commonality is the similarity of individual characteristics. This
suggests a need for the study of OB and the theories of management which explain these
behaviours in the new economic era.
There are many theories of OB which attempt to explain why managers behave in
particular ways, yet few ascribe styles of management to organisational performance.
Those that are performance-focused appear to display a re-emerging theme, one of the
importance and valued contribution of the individual employee. Recent organisation
theory sees a renewal in themes of ‘empowerment’ (Mumford 1995), collectivism,
through teams such as ‘quality circles’, and other job-enriching policies aimed at
enhancing the human resource and utilising its knowledge capital (Niepce and Molleman
1998). It is therefore imperative that OB be included in a study of organisational
performance but not at the exclusion of other determinants of performance, such as
technological advantages. Few theories, other than sociotechnical systems-type
paradigms, acknowledge the symbiosis of the social and technical subsystems and their
conjunctive roles (Mumford 2003).
33
2.3 The Emergence of an OSTS Approach to OB
2.3.1 Introduction
The competitiveness of the corporation and its performance is judged by comparison
with its peers and against world best practice, but its standing is bedded in more than the
governance that directs it and the global supply networks it operates in. It is genotypic
organisational theory which subsumes its existence. Therefore, results of any PM study
should be analysed within the interdisciplinary boundaries of organisation theory, SCM
and PM. Is the organisation modeled on the bureaucratic ideas and formist (ideal type
typologies centered on bureaucracy) images of Max Weber, or the structured
functionalism of Talcott Parsons? Alternatively, does the modern version of Newton’s
17th century mechanistic science express itself through an enriched Tayloristic ‘scientific
management’, facilitated by advances in information technology (Niepce and Molleman
1998)? Or, does the organic metaphor of the firm provided by Henri Fayol suffice? This
section traces the development of organisation theory to arrive at the paradigm of OSTS
as the one that has a substrate of CG which permeates the performance of organisations
trading in the commercial field of global supply networks.
This section also examines the origins of OSTS through conventional organisation
theory, and develops a systems approach which encompasses the Human Relations
‘humanistic’ school of thought with the ‘mechanistic’ one which posits that
technologically efficient processes dictate the efficient resource, information and
financial flows in a supply network. An integrated approach to the application of an
OSTS stance and its productive fit for the management of the supply chain is developed
to address the measurement of firm performance through the adoption of a PM
conceptual framework. Such a concept caters for the needs of all supply chain partners
and provides a mechanism for organisations to measure performance by iterative
applications of a performance pyramid.
34
2.3.2 The Founding Fathers: Weber, Durkheim and Pareto
Max Weber, Emile Durkheim and Vilfredo Pareto are the sociological theorists of the
19th Century who provide us with the legitimate cornerstone of organisational theory
(Wren 1994). This intellectual triad gave us ‘bureaucracy’, ‘organic and mechanical’
societal types and the notion of ‘social systems’. Weber’s version of scientific
management, which was being promulgated in America while he was working on his
book on economics and society, was the standardisation and rationalization of large scale
undertakings by pronouncing management to be by position rather than by person. His
conceptualisation of ‘bureaucracy’ was posited in three types of legitimate authority:
rational-legal, traditional and charismatic, because some form of authority was a
necessity for any organisation. Without an authority structure the organisation could not
be guided to its objective. He also put forward the notion of the Protestant work ethic.
Durkheim divided societies into two types; ‘organic’ and ‘mechanical’. Mechanical
societies were characterized by friendliness, kinship and neighbourliness, and dominated
by a collective consciousness, while organic ones were those characterized by
specialization, the division of labour and societal interdependence. According to
Durkheim the lack of solidarity in organic organisation led to a state of confusion,
insecurity and normlessness which he called ‘anomie’. The restoration of social
solidarity in these organic societies must come from the ‘collective consciousness’ which
created and imposed norms and values on the individual. Durkheim’s idea of groups as
the source of values and norms was later used by Mayo to prescribe industrial solidarity
(Smith 1998).
Vilfredo Pareto provided the notion of the ‘social system’, a state of society which
changes over time and is characterized by mutually interdependent but variable units
which contribute to the goal of achieving equilibrium between the parts. Disturbances to
the system would create such an imbalance that the system would work towards re-
establishing the equilibrium. Talcott Parsons, George Homans and Elton Mayo were
converts to the ideas of Pareto and saw organisations as interacting social systems. A
35
colleague of Mayo, Fritz Roethlisberger, together with the chief of employee relations
research at the Hawthorne Plant, William Dickson, gave impetus to the connection
between technical efficiency and the workplace as a social system (Sonnenfeld 1985).
The technical needs for efficiency and economic return should be seen as interrelated
with a concern for the human aspect of organisation, and these need to be maintained in
equilibrium. Economic goals should be achieved “while maintaining the equilibrium of
the social organisation so that individuals through contributing services to this common
purpose obtain personal satisfaction that makes them willing to cooperate”
(Roethlisberger and Dickson 1939, p 569).
2.3.3 The Human Relations School and the Tavistock Institute
Elton Mayo borrowed Durkheim’s ‘anomie’ to develop his thesis for human
collaboration. He maintained that anomie represented the social disorganisation in
personal lives and communities which was brought about by industrialization and the
technically-oriented and engineering interpretation of the meaning of work. Because the
social needs of the individual were pushed into the background, the capacity for
collaboration in work was reduced. A ‘new administrator’, being trained in
understanding the social and human problem, would be able to restore collaboration by
recognizing people’s need for social solidarity in work and life. He stressed the need for
humanistic leadership to overcome anomie and social disorganisation and reached one of
the same goals as Frederick Taylor, that of collaboration and cooperation in industry.
The philosophical rationale for the ensuing human relations movement was the goal of
effective human collaboration as the means of restoring a social code which facilitated
adjustment to industrial life (Niepce and Molleman 1998). This social concept of
organisation was further supported by Chester Barnard. He said that “the formal
organisation is that kind of cooperation among men that is conscious, deliberate, and
purposeful” (Wren 1994, p. 266). The formal organisation survives by maintaining an
‘equilibrium of complex character’ in a continuously fluctuating environment,
examining the external forces to adjust to, and analyzing the functions of all executives
in managing and controlling the organisation.
36
Barnard’s notion of internal equilibrium and external adjustment was contrary to the
traditional view at the time that organisations had boundaries and that analysis of the
organisation should be contained within these boundaries. His construction of the
collaborative system included investors, suppliers, customers, employees and other
contributors to the firm interacting in a social relationship to a community contract. This
is not unlike one contemporary ‘stakeholder’, the modern supply chain. The Tavistock
Institute (Trist 1981), through the efforts of Bamford, Trist and Emery, provided
empirical support for Barnard’s theory by finding that social adaptation, facilitated by
the redesign of social relationships, was necessary for the successful introduction of
technological and organisational changes (Trist and Murray 1993). It was from this work
that Emery coined the word ‘empowerment’ to represent the situation where workers
have a greater say in how work is done and accept a greater responsibility for its
performance. This devolution of power to employees results in their ownership of these
jobs and a feeling that by accepting the authority to control work related decisions they
can share and contribute to the purpose of the enterprise.
2.3.4 Systems Theory
While the early theorists provided the seeds for current thinking on the theory of
organisations, it was the biologist Ludwig Bertalanffy (1968) that observed similar
characteristics of systems across various disciplines. The parallelism in systems that
germinated his “general systems theory” showed the similarities to include:
1) a study of the whole organism;
2) a tendency towards steady state or equilibrium; and
3) an openness of all systems in that the organism affects, and is affected by, the
environment in which it operates.
While the open system theory of organisation may present an environment that is placid,
benevolent, turbulent or even harsh, the survival of the organisation depends on
matching the congruent factors of organisational and environmental characteristics
which best suit these settings. Organisational factors should match environmental ones.
Such a congruence would suit the Darwinian analogy of ‘survival of the fittest’ without
37
Darwin’s additional constraint imposed by the requirement of an ‘ecological niche’.
Social organisations are unfettered by the niche constraint because they are able to
contrive to achieve economic, social or political ends. Nevertheless there is much
sympathy with the biological model of systems. In 1950 Norbert Weiner for example,
coined a word ‘cybernetics’ to convey the idea that all systems are designed to control
themselves through a communications loop which feeds information back to the
organism so that it can adjust to the new environment (Weiner 1967). This feedback loop
means organisations are able to learn and adapt to future situations. General systems
theory provided the theoretical and philosophical framework for recognizing the
openness of systems and their ability to achieve steady state, while cybernetics identified
the mechanism by which feedback was provided. Technology would provide the means
for communication and control by knowledge transfer.
Jay Forrester (1961, 1968) took general systems theory one step further. By focusing on
the information-feedback system he was able to model industrial and economic systems
mathematically to understand decision-making processes and gauge their impact. His
‘industrial dynamics’ is the study of information-feedback characteristics in an industrial
framework to show how the structure of the organisation, amplification through policies
and delays in decisions and actions, interact to govern the success of the firm. The
interaction factors are: the information flows, materials, customer orders, human
resources and capital equipment in a company, industry or economy. It is an
experimental and quantitative approach to understanding how organisational structures
and corporate policies affect growth and stability. He believes that there are four
foundations on which to draw an understanding of social systems as represented by
organisations:
1) a theory of information-feedback systems;
2) a knowledge of decision-making processes;
3) mathematical modeling of complex systems; and
4) advances in computing speed and power.
38
The concept of an information-feedback system is the crux of his approach so he defines
it explicitly:
An information-feedback system exists whenever the environment leads to a decision that
results in action which affects the environment and thereby influences future decisions.
(1968, p 14)
It encompasses every conscious and subconscious decision and through iteration leads to
new decisions and new results in a way that maintains the system in a dynamic state. It is
principal to the other foundations and dictates their interpretation and application. In all,
if reflecting on the value of industrial dynamics to the sociotechnical theory of
organisation, it could be asserted that it is primarily focused on the technical sub-system
without regard to its interaction with the social subsystem. This may provide an
illustration of the ‘technological determinism (TD)’ of business. TD is broadly
understood as the extent to which a society’s technology determines its social, cultural,
political and economic form (Smith and Marx 1994).
2.3.5 Open Socio-technical Systems
Contingency and other theories may have attempted to appropriate mechanistic and
organic ideas into other formalisms but they purportedly lack the framework required for
an analysis of the modern corporation. Open Systems Theory (OST), based on general
systems theory, seems to be a more appropriate approach (Van Der Zwaan 1975; Van
Der Zwaan and Vries 1999). An interpretation and development of OST forms the
foundation on which this thesis is built.
OST in its simplistic interpretation is the metaphor provided by the reductionist labels:
input-transformation-output, feedback cycles, differentiation and integration. From this
perspective it is often criticized for grossly simplifying the multiplicity of incoherencies,
fragmentations and pluralities of the ‘real living system’. But these criticisms can be
negated if OST is reformulated to include its social and economic origins in the
sociotechnical field. Sociotechnical Systems (STS) theory predates the open systems
model and is rooted in the Human Relations School which emanated from the
Hawthorne Studies (Smith 1998) and earlier as discussed above. It views the social and
39
technical sub-systems as independent constituents of complex large human-machine
organisational systems which operate in ‘turbulent’ environments that change at an ever
increasing pace. The technical sub-system includes the tools, techniques and
technologies needed to transform inputs into outputs in a value-adding way so that the
organisation is economically rewarded. The social sub-system comprises those structures
created by employee stakeholders and includes the knowledge, skills, attitudes, values
and personal relationships they bring to the work environment, notwithstanding that
these operate within organisational authority and reward structures (Adler and Docherty
1998). By broadening the definition to include other stakeholders, i.e. customers,
suppliers, regulators and the community, STS approaches the concept of ‘open system’.
The main tenet of STS is based on two principles: The first principle is that work
processes are best represented by social and technical dimensions, and that these
dimensions are interdependent (Cherns 1987). The second principle, named ‘joint
optimization’, states that the reciprocally interdependent dimensions must be designed
conjointly. The goal is to integrate the social requirements of people doing work with the
technical requirements necessary for work processes to be viable in their operational
environment. Although intuitively the attraction is to study work processes along these
dimensions separately, attempts to optimize each dimension in isolation will result in the
suboptimization of the sociotechnical whole. Because each dimension also performs to
fit the requirements of the other, optimal results come from the ‘best fit’ of these
dimensions working in harmony. In this sense ‘joint optimization’ is an idiosyncratic
concept where each situation can claim individuality.
The STS approach has had a number of criticisms, from being a reductionist set of
categories, an abstract analytical construct, to a gross metaphor for a conflict-excluding
ideological unitary model of organisations (Adler and Docherty 1998). Often, it seems
that these arise because of the attention fettered to the two sub-dimensions unequally, or
the subjugation of these by an overall system. For example, the social sub-system,
promoted by the belief that humanistic principles and industrial democracy are
paramount, competes with the technical subsystem proposition which says that
efficiency attainment through technological advances is the goal.
40
In a case of ‘technological determinism’ for example, the organisation is structured to
meet the efficiency dictates of the current prescriptive technology. Human values versus
mechanical efficiency seems to be the mantra, when in fact STS explicitly states that
‘joint optimization’ is the dominant goal. Additionally, modern STS theorists expand this
proposition by accepting that there is not only an important inter-connected relationship
between the two sub-systems, but also one with the outside environment (Van
Amelsvoort 2000). These modern versions of STS have been sometimes labeled modern
sociotechnical (MTS) or sociotechnical business (SBS) systems. Consequently the OSTS,
as introduced in this thesis, is a more fitting description of an organisation in its natural
setting.
Fred Emery (1982), an original proponent of STS at the Tavistock Institute, believed that
the ‘turbulent environments’ in which most companies operate, require a ‘redundancy of
functions’, or multi-skilling as we now know it, to enable the system to cope with
unexpected occurrences and in which to handle change. This concept was later labeled
‘adaptive strategic planning’. Another significant development was the concept of
Herbst’s ‘minimal critical specification’ (Emery and Thorsrud 1976) which stipulated
that over-specified work designs were obsolete, meaning that workers were the best
judges of how things should be done and this task should be left to them. This concept is
now widespread in the fashion, that work now involves work groups, matrical
arrangements and networks (Emery 1995). The primary work groups are the members
who can do all tasks of that group, and thus are multi-skilled. The matricies are these
groups when they include some tasks which are specialized and allow only certain
members of the group to perform them. Networks are when the tasks require assistance
from outside the group and this is available collaboratively elsewhere in the organisation,
where they may be considered specialists in their own field.
Albert Cherns (1987), another associate of the Tavistock Institute (same as the
originators of STS), brought all the ideas associated with this approach into a set of
principles as follows.
1) Compatibility: where the process must align with its objectives.
2) Minimal critical specification: where only the absolutely necessary is specified.
41
3) Socio-technical criterion: where, if variances cannot be eliminated, they should
be minimized as close to the point of origin as possible.
4) Multifunctionality: where work needs to be planned in the multi-skilled
redundancy mode.
5) Boundary location: where there are natural perimeters to knowledge and
experience.
6) Information: where it goes and where it is needed.
7) Support congruence: where social support must be available to reinforce
desired behaviours.
8) Design and human values: which dictates high quality work identifying:
jobs that are reasonably demanding
an opportunity to learn
scope for decision-making
social support
relating work to social life, and
jobs that have a future
9) Incompletion: the acceptance that this is an ongoing process of discovery.
These authors maintain that traditional organisations are designed to be overly complex,
with a hierarchy that encourages greater demarcation of functions and more specialised
jobs based on principles of division of labour. Consequently, this results in increases in
control and a tightening of hierarchical power, more rules and regulation formalizing and
standardizing procedures, creating various buffers between process links, and
establishing specialist functions to expand the ever wanting problem-solving capacity.
Van Amelsvoort (2000, p. 39) purports that this complexity can be measured by a
relationship expressed as:
C = f(E, R, St, Sp) (2.1)
where: C is complexity;
E is the number of elements that can interact in a network
(known as intersection of interfaces in systems theory);
R is the number of relations;
42
St is stability (the capacity for variation and predictability); and
Sp is specificity (the degree of precision in timeliness, quality,
reliability and completeness).
Some of these principles are evident in the characteristics of the work groups studied in
this thesis as seen by a cursory review of the model adopted in Chapter 5, and
particularly by the listed variables in Table 5.3.
Adler and Docherty (1998) note that contemporary STS seems to have evolved into three
streams: the North American model with an emphasis on high commitment, high
performance and empowered work groups, a human resources approach (Passmore 1982,
1988); the Dutch model with affinities to operations management, logistics and planning
and control, an engineering approach: and the Scandinavian model with a focus on
worker participation and union co-determination through programs designed to
encourage ‘the social dialogue’ (Van Amelsvoort 2000). These views are consistent with
the general development of giving primary work groups increased control of the links
with key groups in the organisation’s operational arena, of giving these primary groups
discretion in decisions concerning customers, and with giving these groups discretion in
learning and knowledge development. Not interfacing with customers, not having
performance feedback and not sharing information have been criticisms of STS design in
the past (Passmore 1988). Adler and Docherty (1998) claim that the new STS dispels
previous criticisms. They define the Sociotechnical Business Systems (SBS) as:
… systems in which primary work groups have a high degree of actual control over
purpose, context, and system dynamics…which creates prerequisites for primary work
groups to perform business discretion within the top management vision. (p. 326)
In these systems all users of technology, at all levels, will play a major role in the design
of the system ensuring that compatible, well-functioning elements form part of the design
(Mumford 1995).
All businesses are subject to the powerful economic climate of the time. This greatly
affects how they operate. For example, the efficient production of goods and services
may come under threat by the cheaper import of such goods and services.
43
This may in turn entice the firm to operate more bureaucratically by enforcing greater and
more defined job specifications while reducing the resources to provide them. In fact a
regression to bureaucracy seems a more comfortable approach than the over-risky
humanistic approaches. However, the evidence from organisations with good governance
and a trust in the workforce suggests the contrary.
Associative democracy, seen as an extension of the humanistic values within the firm,
allows the stakeholders outside the firm to have a powerful voice in how it is run. The
community-oriented economy transfers powers of big government to civic groups and
powers of corporations to its stakeholders. Profit-sharing, co-ownership and corporate
citizenship demonstrate the strong links between local communities and the decisions of
organisations. These links have strong bearings on the decisions made by the corporation,
and not always with primacy for the shareholders. As an extension of the humanistic
values of STS within the corporation, these ideas become congruent with the concept of
CG as we now know it (Thomsen 2004).
The organisation is now seen as a system which interacts with its transactional and
contextual environments (Trist 1981). The transactional environment involves those
specific stakeholders who have an immediate connection with the firm, (e.g.
shareholders, customers, suppliers) and those who have a relationship with the
organisation and expectations from it. The contextual environment involves those
developments in society and the global economy in general, which are relevant to the
organisation but not specifically targeted to it. For example, a new foreign trade
agreement may have imponderable ramifications on the organisation. The OSTS
organisational model now takes as axiomatic that organisations can be usefully modeled
as social systems consisting of people acting in roles that allow them to use the
technology and knowledge available to achieve the organisational goals of economic
pursuit and the social expectations of community purpose (Pitelis 2004). Implicit in this
axiom is the expectation that organisations have available to them, the resources required
from the environment, the customers to export output, and a discourse with the many
stakeholders.
The true OSTS organisation is one that recognizes it has multiple stakeholders and
therefore multiple relationships and responsibilities. Not the least of these is the supply
44
network in which it has traditionally operated and which is becoming increasingly
important for the firm’s global competitiveness. There are many parallels between the
way an organisation’s philosophy on the conduct of business governs its internal
operations and how it deals with its supply chain partners and other stakeholders. In all
organisations the philosophy, vision, mission and strategic directions emanate from the
highest level of management, usually the board of directors, as stewards for the owners.
This field of study, with origins possibly in the seminal work of Jensen and Mecklin
(1976) has been of academic interest for well over 25 years (Denis 2001) and is
described as corporate governance.
2.4 The Corporate Governance and Social Responsibility
Approach to Organisation Performance Strategy
2.4.1 Introduction
Corporate governance is a system. It consists of those formal and informal institutions,
laws and rules that determine those organisational forms which assign ownership,
delegate power and monitor decision-making, while auditing and releasing information,
and distributing profits and benefits (Cornelius and Kogut 2003). Australia has adopted a
‘market-centric’ framework modeled on the styles of CG practiced in the UK and USA
where ownership of equity is diffused across a variety of shareholders while its control is
severed from them. This detachment of the ownership of the corporation from the
running of it, has spawned many treatises on the efficacy of its operations. Studies in
agency theory, stewardship, director board composition and executive compensation, and
stakeholder engagement to mention a few, have attempted to provide an explanation of
those organisational mechanisms which impact on corporate efficiency and sustainability.
Also, the emergence of MNEs, the globalisation of trade and the reduction or elimination
of trade barriers, have also drawn the attention of important global economic
organisations such as the World Trade Organisation, World Bank, the International
Monetary Fund and the OECD (Sgro 2003). Often however, studies of these issues have
only provided myopic exegeses.
45
2.4.2 The Current Corporate Governance Forum
There are many ways in which CG can be studied. Its scope is so broad that a review of
all important theories of CG is beyond this thesis, but a working model can be advanced.
As a system of controls, it adopts certain standards, including business ethics, which
regulate how the enterprise functions in the wider socio-economic community. “Firms are
being forced to recognize a ‘triple bottom line’ of financial, environmental, and social
performance” (Cornelius and Kogut 2003, p. 19). Sound CG is now viewed in the broader
social context where performance is monitored and deviant behaviour ostracized by
affected stakeholders (Fitsgerald and Storbeck 2003), while still maintaining the more
traditional financial view (Williamson 1988). It is however, also viewed in the context of
global economics (Business Sector Advisory Group 1998). The stakeholder perspective
provides a useful basis for the taxonomy of research to date. The groupings of this
perspective are the economic shareholder studies with a grounding in agency theory, the
political and regulatory enforcements of responsible authorities, and the societal and
community pressures of the environment in which the firm operates. The author believes
that an appropriate breakdown may be subsumed under six dimensions, one of which
will be the subject of this study:
1) legal and regulatory compliance;
2) equity and ownership structures;
3) profitability and performance;
4) control mechanisms;
5) operational processes; and
6) CSR, the dimension analysed in this thesis.
The legal and regulatory compliance factors dictating CG standards can include the
impact of authorities such as CLERP9, the ASX (2003) principles, the Investment and
Finance Services Association, Australian Council of Superannuation Investors and the
external impact of requirements as set out by the Sarbanes-Oxley Act 2002, as well as the
Heugens and Otten (2005) review of global reforms.
46
The equity and ownership structures dimension has roots in the whole principal-agent
debate (Jensen and Meckling 1976) where owners’ control of the organisation is severed
and management of the firm is delegated to a board of directors duly authorised to act on
behalf of the best interests of the owners (stockholders) and parties with financial
interests in the organisation (Hirschey 2003; Agrawal and Knoeber 1996; Keasey and
Wright 1993). For example, Stapleton (2005) asks: how does a Packer family 37%
ownership of PBL, a 50.1% Government ownership of Telstra, or a 34% ownership of
Coca Cola Amatil by Coca Cola affect the CG of the company? Ownership is a core
issue (Caplan 2002).
Profitability and performance are well analysed and widely discussed dimensions. They
are typically summarized in the mandatory annual reporting of performance in financial
and accounting statements. These public documents invite scrutiny, analysis and debate
about how well the company is performing. But, it is the question of how much CG
contributes to organisation performance that is widely debated (Leblanc 2005;
Donaldson 2005; Alves and Mendes 2004; Bradley 2004; Brown and Caylor 2004; Letza,
Sun and Kirkbride 2004; Young 2003; Morin and Jarrell 2001, Keasey and Wright 1993).
The contribution debate is also viewed from the stance of major corporate failures. In
Australia of recent times, HIH Insurance, OneTel and Harris Scarfe are examples of
companies that have failed because of poor CG (Buchanan 2004).
The control mechanisms that organisations institute are those processes which give
feedback to the ultimate authority, the board, so that it can judge performance against
established standards or goals. Thus studies focusing on the Board are prevalent (Conger,
Finegold and Lawler et al. 1998, Core, Holthausen and Larker 1999; Duleweiz and
Herbert 2004). As a mechanism for the management of risk it is also responsible for the
conduct of audits and other similar activities. It also debates the value of diverse
participants in the auditing function as it does the composition of the board itself. There
are various debates about the independence of directors, conflicts of interest, the number
and status of the directors and how they should best be remunerated to undertake their
duties diligently (Leblanc 2005). Their roles, abilities and contributions are often debated.
47
Further into the functioning of the organisation are the operational processes which
impact CG (Bhasa 2004; Grant 2003; Bain and Band 1996). The level, depth and
intensity of communication with all parties, the transparency of processes, and the
varying degrees of employee satisfaction, as well as the appreciation and development of
knowledge capital, are reflections of a corporate culture which dictates CG at the grass
roots level. Technological responsiveness at this level for example, may be an indicator
of an innovative and learning organisation in phase with economic, social and
environmental trends. As an entrenched corporate reality CG factors now invite
measurement (Sonnenfeld 2004), with attempts to even use scorecard metrology
(Strenger 2004).
The final dimension that has come to the forefront in recent times is that of CSR
(Maignan, Ferrell and Hult 1999; Hirschey 2003). In the socio-political and economic
global environment that a corporation operates in, the CSR of the corporation is seen as
its ability to fulfill its financial and legal responsibilities to all stakeholders (Evans 2007)
and how well it manages the workplace, the environment and its supply chain
relationships (Gettler 2005a, 2005b). There is a sound business case for acting in
publicly socially-responsible ways (Arthur D Little 2003), just as there is for social
cohesion amongst the stakeholders (Oketch 2004). Even though there are international
differences ascribed to CSR in different countries, there is nonetheless an increasing
interest in the firm’s social and environmental actions (Aguilera et al. 2006). There are
also “socially responsible” investors who could enhance the stakeholder accountability
of the firm by pressuring it to engage in stakeholder-oriented governance (Mclaren 2004).
The reputation the organisation has for conducting business is integral to sustainable
wealth creation (Pitelis 2004). CSR is often regarded as an indicator of competitiveness
and firm performance (Brown and Caylor 2005; Bradley 2004; OECD 2006b). The
reputation and performance of the organisation is often publicized (Larker, Richardson
and Tuna 2005) through a number of independent indices (Sherman 2004). The St James
Ethics Centre (2005) for example, publishes a yearly Corporate Responsibility Index
(2004, 2005 and 2006) for Australian companies and the perennial winner of this award
(Zonneveldt 2004) is the subject of this thesis. The British have an equivalent in the
Business In The Community (2003) rating, as well as the FTSE (2005), while others
48
include the Governance Metrics International (2005) index and the Dow Jones
Sustainability Index (DJSI 2005).
As CSR is now widely accepted as an index of corporate performance, it is not
unexpected that it has drawn academic attention (Batten and Fetherston 2003) and the
attention of business consultancies (Arthur D Little 2003; Ernst and Young 2005).
2.4.3 Ethics and Morality in Business
The moral problems in business are complex and difficult to resolve because business
actions can inherently hurt or harm individuals and groups associated with the firm.
Managers faced with a course of action that can cause hurt, often rely on their view of
what is ‘right’, ‘just’ and ‘firm’ but these moral standards are subjective and personal
(Hosmer 2000). They are the way individuals intuitively feel about standards of
behaviour and differ between people because the goals, norms, beliefs and values on
which they are premised changes with variations in cultural and religious traditions as
well as social and economic situations in the individual’s environment. In business these
are the ethical duties incumbent on all company employees, and displayed by the
behaviour of managers (Ethics Digest 2006). As Hosmer (2006) would argue, it is
leadership that is essential for ethics in business, and this is reflected in the following six
universal conditions.
1) Personal virtues from Aristotle (384-322 BC), which can be expressed as
“never take any action that is not honest, open and truthful, and that you would
not be proud to see reported widely” (p. 14). These arise from normative
philosophy (and prescribe how we think and should behave) and the
incontrovertible principles of right and wrong, justness and fairness established
since the time of Socrates.
2) Religious injunction, from St Augustine and St Thomas Aquinas, which can be
expressed as “never take any action that is not kind, and that does not build a
sense of community, a sense of all of us working together for a commonly
accepted goal” (p. 14)
49
3) Unitarian benefits, where the action is right if it leads to greater net social
benefits than social harms, also known as “the greatest good for the greatest
number”.
4) Universal rules (Kant 1723-1804), which state that net social benefit theory is
elegant but should be ‘universalized’ by eliminating the self interest of the
decision maker.
5) Distributive justice, Which states do not take any action which will harm the
least of us. In economic theory this is often referred to as Pareto optimality, a
condition in which scarce resources of production and the distribution of them is
done so efficiently that it would be impossible to make any single person better
off without making some other person worse off. With this concept the theory
points to a means of achieving the social goal of the maximum benefit of most
wanted goods and services produced at the minimum cost of least wanted
resources.
6) Contributive liberty, which provides for the freedom to follow one’s self
interest within the constraints of the law and social contract and which does not
interfere with others’ rights to do the same.
First however, we must distinguish between morality and ethics. While morality refers to
the standards of behaviour by which people are judged, particularly in relation to others,
ethics encompasses the system of beliefs which supports a particular view of morality
(Beauchamp and Bowie 1993). Since ethics is the basis for morality it follows that
business ethics is the determinant of moral standards for business decisions.
Ethics is the system of interrelated beliefs that supports an acceptance of particular
behaviours and should thus form part of a CG model (Ernst and Young 2005). Beliefs
themselves are idiosyncratic to the time and place. Different groups in different countries
and various locations, at different stages of social, economical and political development,
and in different eras will have different beliefs. These will be reflected in their ethics and
the behaviours they instigate. This ‘ethical relativism’ works against the quest for
universal principles to construct a system of ethics applicable to all groups which, in turn,
makes possible the unifying of competing moral standards. However, there is one
50
principle that seems to exist across all situations mentioned above, and which forms part
of every ethical system.
It is the belief that members of a group do bear some responsibility for the well-being of
other members of that group. It is acknowledged across cultures and across time that
cooperation is necessary for survival. This is no less applicable to the transactions
between internal and external groups of the corporation and relationships with its
stakeholders. There are established standards which attempt to achieve this such as
SA8000 (SAI 2004). It therefore seems logical that a ‘business ethics’ aspect be included
in the PM framework.
2.5 The SCM Approach to Organisation Performance
2.5.1 Introduction
SCM provides a framework for businesses and their suppliers to bring goods, services
and information efficiently and effectively to customers, by firms collaborating to
improve operational efficiencies and to leverage strategic positioning (Soonhong et al.
2005). For each SC member the B2B relationship represents a strategic choice of
position in the supply channel, based on acknowledged dependency and the requirements
of domestic and global customer accommodation (Gardner 2004). This SCM is heavily
dependent on ICT/internet and the instantaneous and inexpensive transmittal of
information which economizes the conduct of business (Frohlich and Westbrook 2002).
Increasingly it is also having to deal with global CG differences (Neef 2004), as well as
cultural and ethical issues that arise from global alliances (Kidd, Richter and Stumm
2003). In concept, SCM can be a highly efficient and effective network of business
linkages which serve to improve efficiencies by eliminating duplication and non-
productive, non value-adding work. It is seen by many senior managers as a strategic
approach to competitive success (Keah, Lyman and Wisner 2002). In practice however,
this is a challenge.
51
In the integrated supply chain model there are generally three related flow streams:
Materials, information and finances. The first is usually the material flow stream is
usually the first and involves the purchase of materials, components and services from
external suppliers. This continues with the transformation of these supplies into
manufactured and assembled finished goods. The last stage in this stream is the
distribution of the finished product to customers. Note that it is not a major step in
applying this description of supply chains to service industries where suppliers may
provide data services as well as materials, and the transformation is the conversion of
data to a form suitable for distribution. The supply network can be very complex with
many suppliers and subcontractors, and even more customers. The SC network
comprises the B2B links and the relationships that ensue.
The second flow stream is that of information flow which operates to a great extent in
reverse to the physical flow. This B2B link is facilitated by electronic data interchange
(EDI) and the internet (Sanders and Premus 2005). It has become increasingly important
because advances in the necessary technologies have provided expediency and economy.
Communication channels have become ‘information superhighways’. The third flow
stream in the SC is financial flow. The payment to suppliers and subcontractors and the
receipts of payment from retailers and customers, as well as internal financial flows have
equally been affected by advances in global information communication technologies.
This whole integrated SC model requires management and leadership (Bowersox et al.
2007).
In the past SCM has not fully provided the benefits promised. Traditionally the B2B
groups were linked loosely and independently by multiple arrangements with many
different firms. The greater the independence of the operation the greater the possibility
the group had a ‘fragmented supply chain’. A common approach to handling these
multiple arrangements and containing any fragmentation was to establish specialised
functions with specific roles in the SC. Relationships were maintained by incumbents of
these specialised positions and it was implicit in their duties that their primary objective
was to ‘get the best deal’ for their employer (Carr and Pearson 1999). The adversarial
nature of negotiations consequent to such an agenda, perverted the possibility of
collaborative relationships and corrupted the structure that they operated in. Some firms
52
were treated discriminately, based on the nature of the relationship and the power base
(Cox 1999). Not uncommonly, issues that arose included questions of loyalty,
confidentiality and conflicts of interest. Another approach was to outsource ‘non core’
functions.
Not only does this tend to insulate the buying company from poor supplier behaviour
and from being held responsible for the latters egregious violations, it further fragments
the supply chain eroding any competitive operational advantage this strategy held.
Difficulties in achieving efficiencies in the SC were recognised. One approach used to
overcome them was to vertically integrate the organisation so that all SC members
belonged to the same corporation. Benefits of this arrangement are intuitive: functional
responsiveness and accountability was kept within the corporation, financial
sophistication, transfer pricing and the ability to control and shift costs became available,
and transfer of information could be conducted without loss of integrity. Additionally,
the corporation was able to operate globally and employ improvement techniques such
as Just-in-Time to achieve strategic advantage (Arnheiter and Maleyeff 2005; deWaal
2004; Crawford and Cox 1990). However, practices such as stockpiling inventory to
insure against unpredictable markets were maintained, and remained unchallenged
because no viable alternatives existed. As consumer affluence increased, this long
standing passive acceptance of service changed to an expectation that there would be
active involvement in design and delivery of products and services (Dornier, Fender and
Kouvelis 1998). This too was facilitated by the expediency of communication facilitated
by the internet. But, if the supply chain is seen as catering only for a particular product
group, as in a single path through the supply network from suppliers to distributors, then
pockets of inefficiencies and waste can still exist.
In terms of operational performance of the supply chain, the logic that prevailed assumed
that, if the individual members of the SC were efficient, then the whole supply chain
would benefit. Overall chain process efficiency was considered to be the sum of the
individual efficiencies of members of the chain. Hence PM focused on the individual
components of the SC (Grunberg 2004; Gunasekaran, Patel and Tirtiroglue 2001,). For
example, cost per unit to manufacture and cost per unit to transport were analysed
53
independently and not as part of the complete SC. Sometimes this invited an accounting
game where spreading and sharing of costs through overhead allocations and burden
rates were used to diffuse the true costs of non-viable operations. This is contraindicative
of the objective which should be to achieve performances that provide the overall lowest
cost for the total supply chain.
The quest for integrated SCM is to provide mechanisms where the cost of a product is
reduced, the quality maintained or exceeded, and the expectation of ultimate consumers
satisfied. This can only be achieved by collaboration of partners within the supply
network, extending the enterprise beyond traditional organisational boundaries, and
integrating the services of all providers by the facilitation of ICT (Sanders and Premus
2005). It is this ICT that has manifested paradigm shifts in thinking about the
possibilities – the move from a supply chain to a value chain to a network (VN) has
significant strategic advantages (Towill 1997). It is more pragmatic to regard these
chains as networks because of the myriad of complex structures that describe the direct
and indirect elements of transactions in the interdependent relationships between firms.
There is technical and social content in these relationships. The technical ones are the
mechanisms that control supply functions while the social ones involve trust,
commitment, collaboration and power. Good relationships may be an asset (Kanter 1994)
because the time spent on activities of both parties can be optimized by minimizing pre-
qualification and credential checking and process auditing, while accessing the pooled
the need to allocate resources of both parties to allow a division of tasks and a reduction
in duplication. On the other hand, the disadvantage of this closeness is a restriction on
company autonomy, resources to maintain the relationship and coordinate ongoing
processes, and the real possibility of future indebtedness to the other. There is also the
cost of termination of the relationship should it be unmanageable. However, the
relationships between firms that interconnect to form networks display common
characteristics which feature in collaboration as outlined below:
1) Reciprocity – each partner is expected to contribute some balanced share
to the specific transactions. This may include different proportions at
different periods of time and at different stages in the supply process.
54
2) Interdependence – the parties are knowledgeable of each others’
capabilities and operations and may draw on these to help solve process
problems.
3) Loose coupling – while maintaining rudimentary legal formal obligations
there is a reasonably stable framework for interaction and communication.
4) Power – a supply chain has inherent power relations which can be
exploited positively or negatively, usually to the whim of an
‘orchestrating’ key partner.
5) Boundedness – boundaries of the network are defined by the demarcation
of operations of individual partners within the common supply chain.
These characteristics highlight the necessity for communication and collaboration in
these relationships with a commitment to trust, shared values and aligned goals.
The fundamental rationale behind collaboration is that a single company cannot
successfully compete by itself. Customers are more demanding; competition is escalating.
Thus many firms seek to coordinate cross-firm activities and work reciprocally over time
to produce superior performance. (Min, et al. 2005, p. 238)
The importance of collaboration is such that along with the other variables it has been
studied by various researchers (Simatupang and Sridharan 2002). These researchers for
instance (Simatupang and Sridharan 2005), have developed a collaboration index (CI)
which has the three dimensions of information sharing (10 items), decision
synchronization (9 items), and incentive alignment (6 items). They structure the
quantitatively validated relationship as:
CI = f(IS, DS, IA) (2.2)
Traditional ‘anticipatory-based’ business practices can now be surpassed by ‘response-
based’ business models. The anticipatory model required a forecast to initiate material
purchases, program manufacturing, and plan warehousing and distribution, at high cost,
in the expectation of those forecast sales. It was based on a ‘push’ strategy. The
alternative response–based model works on a ‘pull’ strategy. In this approach customer
55
requirements are not misjudged by questionable forecasts because the orders are
confirmed. The response-based business model is the fruit of low cost information.
Managers can share information rapidly to improve forecasts or eliminate them in an
effort to minimize inventories (Basu 2001). By reducing the reliance on forecasts
because of speedy accurate information, the response-based model mimics the traditional
‘build-to-order’ manufacturing without its disadvantages (Holweg 2005). The
contemporary response-based system operates faster than build-to-order and gives
meaning to the oxymoron ‘mass customisation’. Direct connectivity with end users via
web-based communications allows such customisation with the added benefit that the
customer is no longer simply a passive participant (Fundin and Bergman 2003).
While these in themselves are noteworthy achievements, the benefits expand.
Manufacturing postponement, delayed logistical fulfillment, the financial sophistications
of cash-to-cash conversion, dwell time minimization and cash spin are at the heart of
response-time based capabilities. A manufacturing postponement strategy reduces the
anticipatory risk in traditional SCs because the working arrangements available through
response-based orders allow the postponement of final manufacture or shipment of the
product until receipt of the customer order. The operational tactic allowed by this
strategy is to maintain the product in a non-committed or neutral state as long as possible,
thus allowing economies of scale while accommodating a variety of product
configurations to satisfy individual customisation. The result is a reduction in the number
of stock-keeping units in logistics inventory while supporting broad product variety.
Delayed logistical fulfilment through logistics postponement works contrary to
manufacturing postponement in that the full line of inventory is built but stocked at one
or few strategic locations and available for accelerated delivery upon receipt of customer
order. This is also known as geographical postponement and often suited to products
such as service and replacement parts. This approach reduces overall inventory
investment yet achieves reliable customer service (Beamon 1998).
What are the financial benefits of time-based strategies for SC operations? The financial
benefits are straightforward; speedy delivery means less inventory and reduced
distribution facilities, and quicker to customer means less working capital in the supply
chain. These are expressed in the financial sophistications of cash-to-cash, dwell time
56
minimisation, and cash spin. Cash-to-cash conversion is the time taken for the
conversion of raw material to sales and relates to inventory turn. The higher the
‘inventory turn’ the faster the cash conversion.
This can be achieved by designing the SC so that the cycle time from receipt of customer
order to the delivery of goods is reduced. Reducing cycle time can be achieved by
minimizing dwell time. Dwell time is the ratio of time that an asset waits idly to the time
required to complete the cycle or parts of the cycle being measured. Reducing the assets
across the SC also provides a benefit referred to as cash spin.
If some asset in the SC is eliminated or reduced by re-engineering existing processes, the
capital freed by their absence becomes available for other investment. Such changes are
reflective of trends in the new operating environment (Bamford and Forrester 2003).
An alternative to ‘anticipatory-based’ and ‘response-based’ business models is the
‘process-oriented’ framework. Lambert, Garcia-Dastugue and Croxton (2005) evaluate
the framework of the Global Supply Chain Forum (GSCF) against that provided by the
Supply-Chain Council (SCC). The GSCF classifies SC processes as: customer
relationship management, customer service management, demand management, order
fulfilment, manufacturing flow management, supplier relationship management, product
development and commercialization, and returns management. The SCC has five supply
chain operations references: plan, source, make, deliver and return, which can be
analysed on four levels with each level based on the three components of process
reengineering, benchmarking and best practice. Lambert Garcia-Dastugue and Croxton
conclude that the differences are merely a distinction between a strategic approach to
SCM versus a tactical approach, and both are applicable to any firm depending on its
requirements at a particular time.
The financial attractiveness of strategic and tactical changes to SC operations should be
sufficient to stimulate collaboration between member firms and an impetus to challenge
tradition (Duffy and Fearne 2004; Basu 2001). The arguments for collaboration as a
mutually beneficial strategy in network relationships are often presented as compelling
(Manzoni and Islam, 2006a, 2006b, 2006c). However, the obstacles to cross
organisational collaboration are many. The issues include management and leadership,
57
confidentiality, trust and loyalty, reward and risk sharing, and measuring the
performance of the supply chain.
A collaborative framework requires good management, integrative leadership and an
acceptance that the framework is unique to that particular supply chain (Lambert,
Knemeyer and Gardiner 2004). Since the primal issues are ones of power and risk, the
integrative leader will be the supply chain partner that has significant power through its
role in the SC or delegated power from other members that are willing to allow this firm
to act as the collaborative leader.
One challenge for the collaborative leader is to distribute equitably the rewards and risks.
If process innovation is successful what is a fair share of benefits? If a venture fails, what
is a fair apportionment of risk absorption? In traditional modes, one method of sharing
risk and rewards is transfer pricing. It is guided by market forces and works for
transaction-driven business relationships. The collaborative SC works at a higher level of
commitment and on a different basis to transaction driven business. Confidentiality, trust
and loyalty are higher parameters, as is joint strategic planning to achieve future goals of
survival, growth and profit. The collaborative SC will have participant firms that are
simultaneously engaged in other networks and commonly with direct competitors. There
is genuine overlap and potential for conflict and breaches of confidentiality. The
conceptual simplicity of neat linear supply chains quickly dissolves into a quagmire of
competitive complexity and a maze of operational interactions. It is in these relationships
that integrative leadership can launch, nurture and sustain collaborative initiatives.
Management of the relationships in multiple supply chains with these potentials for
damage can be achieved by ‘partitioning’ organisational structures to specifically focus
on particular collaborative relationships (Doran 2003). The cross functional integration
and optimising of the supply chain is an evolution which needs to be ‘orchestrated’
(Schmitz and Platts 2003). Orchestration is the role of the partner in the dyad that makes
the key decisions but not on the basis of a power game (O’Reagan and Ghobadian 2004),
rather on the basis of mutual benefit to the whole SC. Whereas integration was once
discussed as an inter-departmental and intra-firm objective it is now openly accepted that
it extends beyond the firm itself (Daugherty, Ellinger and Gustin 1996). Once integration
is under way, the common interest in measuring performance may commence with
58
choosing information reporting capabilities which align with the needs of the SC
partners (Griffis et al. 2004).
Once issues of jurisdiction are resolved there remains the question of how to measure the
performance of the supply chain. Accepting that the performance of the SC is not simply
the summation of individual firms’ performances, and that it operates in a globalised
knowledge economy, negates conventional measurement devices for supply chains.
There are however, concepts of functional integration which approach SCM from a
systems perspective, not dissimilar to this thesis. Min and Mentzer (2004) propose a
system where ‘supply chain orientation’, expressed through trust, commitment,
cooperative norms, organisation compatibility and top management support, is a
precursor to the upstream and downstream performance of the SC, where the customer
focus is perceived as equally important in the long-term relationships of partners. The
measurement metrics must assess performance as the collective synthesis of the
synchronised SC while being able to isolate and identify individual contributions. Min
and Mintzer suggest metrics such as growth, profitability, timeliness, availability and
product/service offerings. Other approaches to measurement may be quantitative. Li,
Kumar and Lim (2002) build a ‘scenario model’ which defines organisational entities as
supply chain nodes, distinguished from each other by the attributes of product/service,
organisation specialization and location, that are engaged in a complex set of multi-
layered interdependencies, represented by numerous equations of mathematical
integration. Alternatively, Chan and Qi (2003) use fuzzy logic to build a PM hierarchy of
judgments in the supply chain with inputs such as time, labour and capital costs, and
outputs such as value of finished and semi-finished product, as a quantitative approach to
SC measurement.
Most companies realize that in order to evolve an efficient and effective supply chain,
they need to assess its performance (Beach and Muhleman 2000), but it is notable that
the development of meaningful performance metrics for supply chains is in its infancy
(Cigolini, Cozzi and Perona 2004).
59
2.6 The Measurement of Organisation Performance
2.6.1 Introduction
Performance management is a diverse and debatable subject which crosses disciplines
and offers perspectives from various specializations. Traditionally the accounting
framework has been the mainstay of quantitative PM with financial planning and control
maintaining its central role so that managers can deliver returns to shareholders and other
stakeholders. However in recent times this approach has been severely criticized for
being inadequate.
Financial control requires monitoring and corrective action and is thus ‘backward-
looking’. The major criticism of this traditional approach is paraphrased in the question
“How can the firm go forward if it is always looking backwards?” In fact, as
commentary on the accounting approach Otley (2002) states that:
There is no definitive set of financial ratios that can be said to measure the performance
of a business. Rather, a set of measures can be devised to assess different aspects of
financial performance from different perspectives. (p. 8)
He maintains that there is still a need for these financial measures since they provide
tools for the efficient use of resources, provide measures against organisational
objectives, act as motivation and control mechanisms in the organisation, and assist in
achieving the needs of outsiders (to the organisation) such as shareholders, bankers, etc.
Through audited financial statements there is also the opportunity to comply with CG
requirements as encapsulated in agency theory. And, while financial specialists are
aware of the criticisms they are actively trying to introduce new means of economic PM.
The EVA model and ‘triple bottom line’ are examples of this, just as ABC was earlier.
If the task is simply to provide measures then the objective is obscured. Meyer (2002)
identifies a total of 117 top level measures comprising 17 financial, 17 customer related,
19 internal processes, 35 renewal and development, and 26 human resources. This may
be symptomatic of what Neely and Austin (2002) note as “we measure everything that
walks and moves, but nothing that matters” (p. 48).
60
In addressing SC performance from customers to suppliers, customer satisfaction attracts
a large and continuing academic interest (Hill and Alexander 2000). The underlying
notion is that customer satisfaction is about meeting expectations for services and
products, and performance is how well these expectations have been met. This paradigm
of ‘disconfirmation-of-expectations’ has had mixed results and this may be a distraction
from a true measure of performance of the SC, with the consequence that the quest is to
find what really affects cash flow and what really matters to performance.
While there is a richness of sophisticated measures of market performance,
… this richness brings with it confusion as researchers and managers struggle to find a set
of measures that is comprehensive enough to be accurate, yet simple enough to be usable.
(Clark 2002, p. 36)
In the analysis of supply chain performance, the literature abounds with measures that
apply to the central orchestrating firm, the main player. Measures for the operations of
individual firms, viewed in isolation of the supply chain, have congregated around the
concept of the balanced scorecard applications (Kaplan and Norton 1993) because it is
credited with structuring a functional array of performance measures (Amaratunga,
Baldry ans Sarshar 2001). These include: the explicit link between espoused strategies
and the performance measures for these, the four major areas of measurement which
match stakeholder concerns, the main drivers for future performance (unlike simple
financial measures), and the key success factors being limited to only four performance
areas rather than the prolific KPIs of other measurement systems. It is even possible that
the EVA metric could be used as one of the financial measures in a BSC formulation.
This interest in a BSC as a PM metric is emphasized by the increasing availability of
enterprise resource planning (ERP) software with the capability of reporting on these
scores (Curran and Lald 2000). For example, SAP, Oracle, Peoplesoft and Baan have
such software modules. Programs such as these should simplify the process of designing
an optimal PM system. Such a system would have relatively few measures, three
financial and three non-financial for example, with the financial ones as backward
performance indicators and the non-financial ones as forward performance indicators.
These measures should pervade the supply network uniformly to permit comparison
across organisational units, and should be stable enough to reveal true performances at
61
focal points in time yet responsive enough to evolve as the integrated network of firms
does. The intuitive reasoning for a minimum of three of each financial and non-financial
indicators is that the supply chain can be broadly viewed as the three parties: suppliers,
orchestrating firm, and customers, with each segment having a financial and non-
financial metric. Non-financial measures have often been shied away from because they
were considered intangibles (Eskildsen, Westlund and Kristensen 2003).
The financial and non-financial dyad can be further supported by viewing the progress
through the SC as a generic three-stage causal model with foundations (suppliers),
processes (orchestrating firm), and outcomes (consumer product), as represented by the
‘performance tree’ of Lebas (1995). The tree analogy was chosen to illustrate process
complexity entwined with growth and change. The generic model incorporates
traditional conceptualizations from the economic and financial requirements of
shareholders and company stewards, as well as other conceptualizations from the
perspective of non-fiduciary stakeholders such as social, environmental and political or
regulatory organisations.
Modeling performance as a tree offers the scope to visualize performance as a complex
concept which both defines and legitimizes it as a social construct. This allows the
articulation of performance as a set of propositions pronounced by various researchers in
recent times and enunciated by Lebas and Euske (2002). One proposition is that
performance can only be expressed as indicators of processes through which various
outcomes are achieved. The next proposition is that performance exhibits a causal
relationship. Actions today influence results in the future. The third proposition is that
performance is user-defined because as a social construct its application depends on the
user’s objective. For example, the acceptability of an organisation’s performance could
be assessed antithetically by shareholders and environmental groups. This suggests that
another proposition supposes performance is different when evaluated from inside and
outside the firm. The fifth proposition is that performance is always connected to a
domain of responsibility. The domains in an organisation are the teams, functional
specializations, or departments, and other sub-models within the greater structural
hierarchy.
62
The Taylorist view, still widely held, is that these sub-models are additive while the
contemporary view is that they overlap in networks of cross-functional processes
represented by ‘domains of responsibility’. Similar to Lord Kelvin’s statement: “if you
cannot measure it, it does not exist”, Lebas and Euske’s proposition six states that
performance only exists if it can be described or measured (2002, p. 74). Proposition
seven requires that the model needs to be continuously validated to remain relevant and
proposition eight states that these metrics should be accepted as being only partially
descriptive of performance. Their final proposition is that:
…performance is a relative concept requiring judgment and interpretation…[and]…
contradictions among temporal measures and other indicators are inevitable. (p. 77)
An acceptance of these performance propositions can be productive in establishing a set
of basic principles for PM. Austin and Gittell (2002) list three.
1) Performance should be clearly defined in advance and to agreed criteria.
2) Performance should be accurately measured, in a way to convey maximum
information.
3) Rewards should be contingent on measured performance.
These principles can be perfunctorily applied in balanced PM systems so that decisions
made and actions taken in the past are quantifiably expressed as efficiencies and
effectiveness of the results in the present. These organisational results would be the
aggregation of PM for the individual domains of responsibility and reflect the ability of
the ICT infrastructure to enable data acquisition, collation, analysis, interpretation and
dissemination to be exploited. In an economic fashion this has been achieved by models
such as Dupont’s pyramid of financial ratios.
How can existing knowledge of PM help in attaining practical metrics in supply
networks? Surprisingly, a comparison of the popular measurement frameworks reveals a
congruence among models which can be drawn on. Deficiencies in the Dupont pyramid,
particularly the focus on historical financial performance and its prodigy ‘short-termism’,
has led to models which pronounce a more balanced approach with the inclusion of non-
financial indicators.
63
The Matrix Model (MM) of Keegan, Eiler and Jones (1989) provided a simple
framework with cost, non-cost, and external and internal dimensions to give greater
balance. Lynch and Cross (1991) similarly provide for internal and external measures
with ‘cascading’ measures down the organisation to departmental and work centre levels,
similar to the domains of responsibility mention earlier. The balanced scorecard of
Kaplan and Norton (1992, Appendix 11), widely adopted since the early 1990’s, has a
similarity to and a development from the Tableau de Bord (Epstein and Manzoni 1997)
established in France earlier last century and still widely applied.
But, contemporary thinking (Kennerley and Neely 2002, 2003) has criticized these
models on a number of shortcomings (Krause 2003), in particular the need to address the
increasing demands of stakeholder satisfaction. The Cranfield University model
(Appendix 12) that adopts the stakeholder-centric view is the Performance Prism (Neely,
Bourne and Adams 2003; Adams and Neely 2000). It recognizes the growing power and
importance of regulators and significant pressure groups by attributing two of the five
facets of performance to stakeholder issues.
An in-depth analysis of the above models allowed Bitici et al. (1997) to identify common
features and study the dynamics of PM systems (Bititci, Turner and Begemann 2000).
From a review of over 260 publications across many disciplines Bititci, Carrie and
Turner (2002) uncovered numerous fragmented concepts and principles of PM but
…very few publications provided a complete and structured view for an integrated PM
system…[and]…none of the existing models or approaches completely addresses the
requirements identified (p. 177).
This then, provides an opportunity to develop a framework which addresses these
deficiencies. This is the aim of this thesis.
64
2.7 DEA and the Measurement of Efficiency
2.7.1 Introduction: Background and Brief History of the Model
The term data envelopment analysis (DEA) was first used and reported in the European
Journal of Operations Research by Charnes, Cooper and Rhodes (1978) based on
Rhodes’ PhD dissertation research “A DEA Approach to Evaluation of the Program
Follow Through Experiment in U.S. Public School Education”. It was the failure of all
the statistical-econometric approaches tried previously that led Rhodes to suggest
Farrell’s (1957) work ‘The Measurement of Productive Efficiency” as an alternative to
analyzing efficiency as a measure of performance expressed in a ratio of single output to
single input. Farrell identified two components of efficiency: a technical efficiency (TE)
which showed the ability to maximize output from a given input, and a price efficiency
which reflects the use of inputs allocated in optimal proportions (and hence also referred
to as allocative efficiency) (see Chapter 4). Considered together these measures provide
an overall (or economic) efficiency. These ideas were developed further in later DEA
models and explained well in texts by Cooper, Seiford and Tone (2000, 2006), and Zhu
(2003), as well as the milestone text by Charnes, Cooper, Lewin and Seiford (1994). The
Australian contributions include Coelli et al. (2005), and Avkiran (2006). These are
reviewed later in this section.
At this time the concept of efficiency as a ratio of the output goods and services to input
resources, to be termed productivity, was gaining credence. It was the work of the
Organisation for European Economic Cooperation (OEEC) to promote productivity in
the 1950s that led many European and Asian nations to establish Productivity Centres
and Councils (Sumanth 1984). As a concept it became an economic tool for the
measurement and comparisons of productivity at international, national and industrial
levels, but only to a minor degree was it used at the company level.
The obstacle to general acceptance was the difficulty in arriving at a productivity ratio
which could include all the different input resources and the various outputs, and be
universally accepted or have comparability (Nyhan and Martin 1999). The productivity
ratio takes the form of three different types: partial productivity (PP) which is the ratio
65
of output to a single selected input, e.g. units per labour hour, units per tonne, etc.; total-
factor productivity (TFP) which is the net output to the aggregated labour and capital
inputs; and total productivity (TP) which is the ratio of all outputs to the sum of all
inputs (Sumanth 1984).
The partial productivity ratio has become the most widely used because of its ease to
calculate, understand and obtain data, especially since it relates output to a single input.
However it may mislead and fail to give a true picture of the situation. Total factor
productivity, as defined in the early literature, is less meaningful to operational managers
because only labour and capital inputs are represented. This may not always be
appropriate, for example when there is a large materials input. This meaning of TFP
seems to have waned and has been replaced by what was originally total productivity, a
measure representative of the organisation’s true economic position.
The measurement of total factor productivity (or total productivity) is quite difficult to
achieve because of the quantity and availability of the information required and also
because TFP is not able to quantify important intangible factors of input or output.
Nevertheless the concept that efficiency can be expressed as a ratio of all output goods
and services to the sum of the total inputs (beyond only tangible resources) is widely
accepted and rarely challenged. In commercial spheres for example, the financial index
of the aggregated dollar value of sales to the aggregated dollar value of inputs is often
calculated and used in some fashion, but global measures such as this provide little
insight into the firm’s efficiency at the operational level and a better diagnosis of the
output/input relationship would be helpful. The contemporary, generally agreed
measures of productivity are PP and TPF, noting that the latter is now regarded as
inclusive of all inputs and all outputs. These distinctions become important in later
research because they are tied to efficiency and performance.
Charnes, Cooper and Rhoder (1978) were able to by-pass the shackles of financially
focused metrics and partial productivity measures by optimizing individual ratios, as
defined by the researcher, to generalize from single outputs/inputs to multiple
outputs/inputs by the use of ‘virtual’ surrogate units that represented multiple outputs
and multiple inputs. The discrete units to be measured are those decision making units
66
(DMUs) that are defined by the researcher according to the output-input relationship that
warrants investigation (Gass and Harris 2001). In fact all DMUs in DEA are the
discretionary inputs and outputs as assigned by the researcher.
By 1992, 14 years later, 472 publications on DEA reflected a growing interest in this tool.
Its rapid acceptance was attributed to the development of extensions to the original
model, and variations to it, when problems in its application were encountered (Charnes
et al. 1994). By 1999, over 800 citations were recorded, and by 2001 the publication list
stood at more than 3200 (Tavares 2003, cited in Avkiran 2006; and Cooper, Seiford and
Tone 2006). These publications have addressed a great variety of research interests by
over 1600 authors in 42 countries. Yet this field is barely tapped. Emrouznejad and
Podinovski (2004) for example, report that at the 4th International Symposium of DEA
there were more than 190 papers submitted, spanning the boundaries of academic
disciplines. Sixty of these are published in their proceedings.
This author (2006a, 2006b, 2006c; Manzoni and Sadler, 2005) has added to this by
presenting DEA applications of PM, SCM, and CG to a number of international and
national conferences (). The volume of work reflected in the above figures and the
diversity in applications reported suggests strong support for the technique as a
diagnostic instrument and one with broad applicability. Additional bibliographic listings
are available at DEAzone (2005) and Emrouznejad and Thanassoulis (2005).
2.7.2 Recent Research and Model Development
Some recent studies show the potential for future research. Sarkis (1999) applies DEA in
the study of environmentally friendly manufacturing, while Tone (2001) shows how to
deal with undesirable outputs in DEA, other than treating them as negative inputs. Eilat,
Golany and Shtub (2006) show how an extended DEA can be used to quantify some
qualitative concepts embedded in R&D project portfolios. Quantification of qualitative
concepts was earlier discussed in the generalized multiple criteria model of Greenberg
and Nunamaker (1987).
Efficiencies in the Australian finance sector are studied by Brown (2001) while the
Industry Commission (1997) shows how DEA can be applied to measure
67
Commonwealth/State government service provision. Rickards (2003) used DEA to
evaluate benchmarks and balanced scorecards
The DEA literature is diverse because of all the disciplines it transcends, being a
quantitative diagnostic instrument. In very broad terms however, DEA research may be
categorized as: learning and technical development of the mathematical model, joining it
with complementary mathematical techniques, traditional widespread and popular
applications, and emerging novel applications. Some themes naturally, become more
popular as new research is published and applicability established, and many overlap
categories.
The technical development has seen many versions and new variations to the Charnes
Cooper Rhodes (CCR) model (Charnes et al. 1985; Seiford and Lewin 1997; Zhang and
Bartels 1998; Frei and Harker 1999; Pastor and Sirvent 1999; Ahmad, Berg and Simons
2006). Those that have passed academic scrutiny have usually been expanded in
specialized texts.
For example, the recent text of Zhu (2003) develops DEA so that managers can conduct
performance evaluation and analyze decision alternatives by the easy use of spreadsheets.
DEA Excel Solver is supplied to calculate 150 different model versions providing various
contexts to allow benchmarking. The Cooper, Seiford and Tone (2000, 2006) texts are
similar in that they provide instruction and software but also build on the earlier work of
Charnes et al. (1994) which provided a multitude of examples of application in very
diverse fields, including a valuable DEA bibliography from 1978 to 1992. The included
software in the recent text is for limited use by its reader to test the DEA application,
while the advanced professional version for purchase, is provided for real-world larger
applications. This is the DEA Solver Pro used in this thesis. The text also explores some
developments in theory and methodology including sensitivity analysis, statistical
approaches such as OLS regressions, stochastic frontier regressions and window analysis,
to name a few. Cooper, Seiford and Tone (2000) adds to the earlier version by providing
additional material from more recent developments. The concept of ‘super-efficiency’
where E>1 for example, makes it possible to ascertain the consequences of eliminating a
complete DMU – especially an efficient one.
68
Avkiran (2006) provides an Australian text with DEA as the productivity analysis
technique which captures the complex interplay between multiple inputs and outputs. It is
designed as an introductory text, suitable for the classroom, with case studies from the
services sector. It presents the areas of banking, education and research centres,
hospitality and tourism, public transport, police stations, telecommunications, Olympics,
public libraries and others. This list draws on work in journals, monographs, conference
proceedings and other sources, identified by Avkiran, other researchers and by this
researcher. It is not a comprehensive list but it does illustrate the diversity of the DEA
applicability. Another Australian text by Coelli et al. (2005) is the second edition of a
book written for people wishing to study efficiency and productivity analysis by four
different methods: econometric estimation of average response models, index numbers,
DEA and stochastic frontiers. It starts with the basic concept, gives simple examples, then
extends the method with a number of detailed empirical applications using real-world
data.
The Sengupta (2003) monograph integrates the theory of firm efficiency and industry
equilibrium, emphasizing a dynamic setting, and incorporating uncertainty of market
demand and prices. It also discusses the implications for shared investments; all of these
with the parametric and semi-parametric methods of estimating production and cost
frontiers using DEA. The Ramanathan (2003) text, on the other hand, is a tool for
practitioners who need to know the merits and pitfalls of the technique but must first gain
an understanding of the algorithm. Another basic explanation for practitioners is provided
by Anderson (2005).
Many facets of DEA have been debated but a recurring one is how to allocate the correct
weighting to the DMU’s input and output factors. While there is general acceptance that
the algorithm performs satisfactorily with its self assignment of weights thus providing a
conservative result, there has been ongoing attention to the best approach. Golany and
Roll’s (1989) procedure for DEA discusses this and introduces the idea of using the
Analytical Hierarchy Process (AHP) for assigning weights. Cheng and Li (2001),
Yurdakul and Tc (2005), and Sarkis (1999) for example, use AHP to assign weights.
Entani and Tanaka (2006) however, demonstrate how the bounds of efficiency can be
changed by adjusting weights on non-efficient DMUs, in particular by adjustments to
69
inputs and outputs, while Troutt, Ehie and Brandyberry (2007) propose a ‘winner take all’
optimization for determining the most productive unit. They simultaneously assign input
and output factor weights along with optimal intensity values for the virtual composite
unit to achieve the ‘maximally productive input-output units’.
2.8 Conclusion
This chapter presented a review of the contemporary literature on the various topics
encompassing this thesis. It reviewed the emergence of a global knowledge economy as
the foundation for new management theory and PM practices. In particular, it studied the
impact of the global knowledge economy on Australia in recent times and the emergence
of a new system of OB through OSTS. This system was presented as a development
from established contemporary theories of management with ideas from more recent
schools of thought. General systems theory and its developments were incorporated with
STS to present OSTS as a theory for the management of a whole supply network in the
21st century. The SN was described in terms of the over-riding system in which the
organisation operates, and therefore its performance is contingent on the performance of
this bigger system.
This was followed by a review of previous and recent methods of measuring
performance, with an analysis of their successes and limitations, thus providing a basis
for the positivistic methodology of DEA. DEA is an established technique for making
efficiency comparisons and was reviewed from its origins in 1957 to the present time.
This review covered the historical development of the technique with some specific
issues relevant to that period. The next chapter presents the conceptual framework and
research methodology for the model developed in this research.
70
Chapter 3
Conceptual Framework and Research Methodology: A New Approach to PM
As far as the laws of mathematics refer to reality, they are not certain, and as far as they are not certain, they do not refer to reality. Albert Einstein 1879-1955
3.1 Introduction
This chapter describes the research methodology used in this thesis to test and justify the
conceptual framework of the performance pyramid as a valid metric for measuring
organisational performance. Based on positivistic foundations and research data
available from other work, a quantitative analysis using mathematical modeling is
undertaken. Operations research techniques are assessed for their suitability and an
optimization algorithm available through the linear programming approach of DEA is
used. This is a new approach to the measurement of performance in a framework which
is integral to an OSTS.
The chapter is structured on the basis that a new conceptual framework for the
performance of a firm can be defined and that certain postulates of PM can be tested by
the use of an operations research methodology. These postulates are discussed in Section
3.3.1 below after the development of the conceptual framework. An optimization model
of business is then developed through a number of stages, amplified in later chapters, to
show how linear programming can be used to apply DEA. It is then further refined by
demonstrating how mathematical programming is now simplified by the advent of
spreadsheet software.
The detailed illustration of how DEA can be applied using a spreadsheet application, is
demonstrated in Appendix 2a but the task is made more efficient by the availability of
71
commercial software designed specifically for DEA-type studies. Alternative
methodologies for measuring efficiency and other related mathematical models are then
discussed to support the choice of DEA for this study.
The chapter concludes by discussing and supporting the data to be used in this study, as
applied in Chapter 5. It also discusses the need for model validation as a precursor to
later chapters where this is done.
3.2 Conceptual Framework for PM
An integrated performance measurement system(IPMS) model as proposed by Bititci,
Carrie and McDevitt (1997), Bititci, Turner and Begemann (2000) and Bititci, Carrie and
Turner (2002) tested in over 30 organisations, suggests that an auditable reference model
can be developed. Drawing on total systems intervention theory they conclude that an
IPMS should include all the following.
Reflect stakeholder requirements to maximize their satisfaction.
Reflect the firm’s existing competitive position.
Facilitate an input to company strategy.
Align strategic objectives with business processes.
Distinguish between control and improvement.
Focus on critical areas.
Encourage wide understanding to maximize ownership.
Facilitate the provision or resources to activities critical to performance.
Facilitate performance planning based on constraint management.
Promote proactive management.
Accommodate qualitative with quantitative measurement.
Measure capability and organisational learning.
Ensure measures are used at the appropriate levels.
Promote an understanding of the causal relationships between measures.
72
Facilitate simple reporting.
Be dynamic and responsive to changes in the internal and external environment.
Organisational performance is indisputably the consequence of combining of a means of
addressing the requirements of an IPMS type model together with the features of those
others discussed earlier, i.e. the balanced scorecard, performance prism, Tableau de Bord,
measurement matrix, etc., into one that can be applied to the supply network. The
structure of a conceptual framework that can do this is presented in Figure 3.1, where the
performance pyramid presents a baseline scorecard of all stakeholder needs. This novel
concept, presented for the first time in this thesis, is able to successfully address each of
Bititci’s requisites for a system that will work. In this figure the process for measuring
performance commences with knowledgeable stakeholders pressing the organisation for
outcomes that satisfy their diverse needs. To achieve this, the firm must develop a sound
strategy and adopt effective operational plans. It also needs measures of performance to
gauge its achievement against set objectives. The critical success factors shown to the
left of the figure indicate what needs to be measured, namely financial and non-financial
factors, and CG of the firm. The right of the figure demonstrates the integrative roles of
human factors and computerization (Bititci, Nudurupati, Turner and Creighton, 2002).
Central to the figure and concept is: the recognized need to measure performance, an
understanding of what needs to be measured – CSFs shown as PM content, and the
means by which PM can be facilitated, shown as process. This results in a system which
addresses the requirements of a PM model, as stated by Bititci et al. (1997) and others
(Bititci et al. 2000; Bourne et al. 2000). This is illustrated as the performance scorecard.
The Performance Pyramid represents the application of the PMS to all affected members
of the complete supply chain (Franco and Bourne 2003).
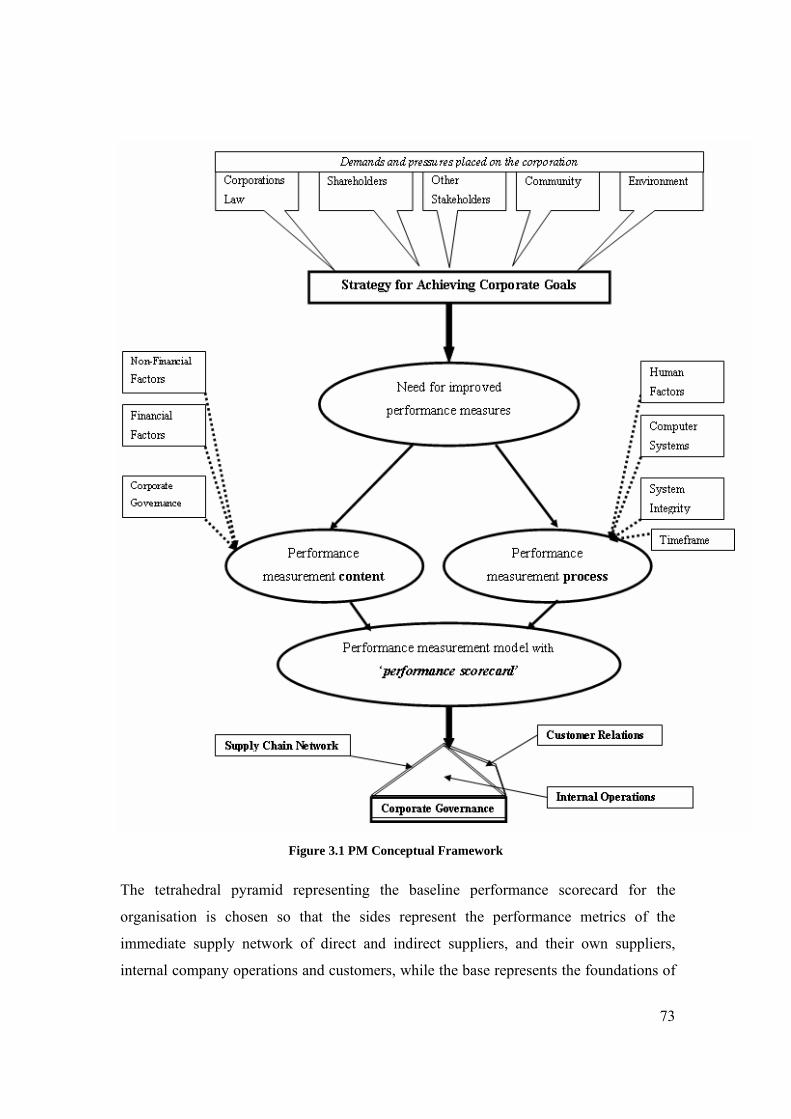
73
Figure 3.1 PM Conceptual Framework
The tetrahedral pyramid representing the baseline performance scorecard for the
organisation is chosen so that the sides represent the performance metrics of the
immediate supply network of direct and indirect suppliers, and their own suppliers,
internal company operations and customers, while the base represents the foundations of
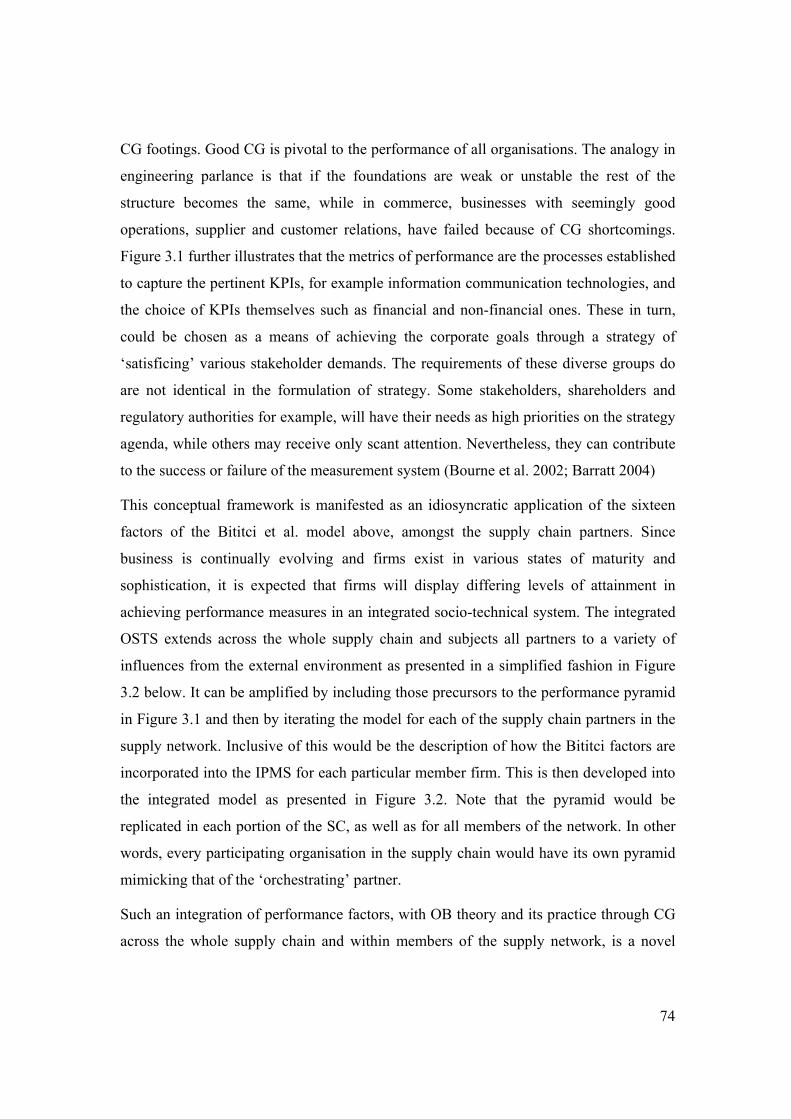
74
CG footings. Good CG is pivotal to the performance of all organisations. The analogy in
engineering parlance is that if the foundations are weak or unstable the rest of the
structure becomes the same, while in commerce, businesses with seemingly good
operations, supplier and customer relations, have failed because of CG shortcomings.
Figure 3.1 further illustrates that the metrics of performance are the processes established
to capture the pertinent KPIs, for example information communication technologies, and
the choice of KPIs themselves such as financial and non-financial ones. These in turn,
could be chosen as a means of achieving the corporate goals through a strategy of
‘satisficing’ various stakeholder demands. The requirements of these diverse groups do
are not identical in the formulation of strategy. Some stakeholders, shareholders and
regulatory authorities for example, will have their needs as high priorities on the strategy
agenda, while others may receive only scant attention. Nevertheless, they can contribute
to the success or failure of the measurement system (Bourne et al. 2002; Barratt 2004)
This conceptual framework is manifested as an idiosyncratic application of the sixteen
factors of the Bititci et al. model above, amongst the supply chain partners. Since
business is continually evolving and firms exist in various states of maturity and
sophistication, it is expected that firms will display differing levels of attainment in
achieving performance measures in an integrated socio-technical system. The integrated
OSTS extends across the whole supply chain and subjects all partners to a variety of
influences from the external environment as presented in a simplified fashion in Figure
3.2 below. It can be amplified by including those precursors to the performance pyramid
in Figure 3.1 and then by iterating the model for each of the supply chain partners in the
supply network. Inclusive of this would be the description of how the Bititci factors are
incorporated into the IPMS for each particular member firm. This is then developed into
the integrated model as presented in Figure 3.2. Note that the pyramid would be
replicated in each portion of the SC, as well as for all members of the network. In other
words, every participating organisation in the supply chain would have its own pyramid
mimicking that of the ‘orchestrating’ partner.
Such an integration of performance factors, with OB theory and its practice through CG
across the whole supply chain and within members of the supply network, is a novel
75
concept and a contribution to the discipline. Previous studies have investigated restricted
portions of the concept presented here.
Figure 3.2 The Integrated OSTS for the OBPM model
3.3 The OBPM Model
The OSTS as a theory of organisation has many proponents. Its strength lies in an
acceptance that the firm does not exist in isolation but is affected by a myriad of external
factors. These influential factors range from those that are malleable to pressures from
the firm to those that are impervious. The sociotechnical system of the firm, as a subset
of OSTS, also has proponents who support the concept of the two subsystems, technical
and social, that operate inter dependently in the organisation and allow it to function
idiosyncratically. The STS view also accommodates the human relations approach,
especially that of the Tavistock Institute of Human Relations, which elevates the
importance of people working collaboratively under humanistic leadership to align and
attain economic and social goals and extends this beyond the organisation itself (deWaal
2003).
76
SCM is the managerial function of those processes which span functional areas within
individual firms and link trading partners and customers across organisational
boundaries to elicit improved operational efficiencies.
Working collaboratively, each of the firms in the supply chain can leverage its strategic
position by working within a framework where key resources are shared and the
operational alignment of customers, and distributive and supply networks provide
competitive advantage through enhanced value. Value in the supply chain results from
the synergies of the critical flows; information, product, service, finance and knowledge
(Neely and Powell 2004). This is facilitated by the emergence in recent times of
powerful information communication technologies which have empowered an
integrative management able to respond speedily across the globe and to adopt digital
business transformation where possible (Lau et al. 2001). Sophisticated financial
transactions and economies of scale are also enhanced by digitization in the supply chain.
This ‘extended enterprise’ paradigm of the supply network can be interpreted as a
specialized stream within the context of the OSTS theoretical explanation of
organisations, and is consistent with that theory.
The primary determinants of SC performance are those established by the integrated
procurement, manufacturing and marketing strategies which interlock capabilities across
the network within a framework of total cost minimization through joint optimization of
all resources. In this fashion core competencies can be exploited (Mills et al. 2002). A
total cost analysis across functional groups can be achieved by deploying performance
measures at key stages of flows within the supply chain. Typically the key points are
those that, according to the theory of constraints, are the significant bottlenecks.
However, since all firms are users of resources whose scarcity dictates that they be
effectively utilized, the measures of performance needed suggest a role for operations
research techniques. Linear programming, mixed integer programming, simulation,
network optimization, as well as heuristic techniques are already applied to measure the
performance of the technical subsystems of the OSTS, so they can be extended into the
supply network. Similarly, the social subsystems within the SC should be assessed. This
thesis contends that OR techniques such as the DEA application of linear programming
can be used to evaluate DMUs which in the social subset can be defined as functional
77
work groups (MacBryde and Mendibil 2003), or preferably in accord with STS
nomenclature, ‘self directed work teams’ (SDWT). The capacity to use psychometric
measures of human resources and work relationships is only limited to the extent of their
importance as characteristics common across SC partners. Once these characteristics are
enumerated, conventional benchmarking techniques and ‘best practice’ comparisons can
be employed to provide performance measures (Franco and Bourne 2003; Maleyeff 2003;
Malina and Selto 2004).
In this fashion one is able to recognize the benefactions of integrating organisation
theory, SCM and PM into a coherent perspective of a PM model for a productive unit of
an enterprise in Australia using DEA.
This section has argued that an OSTS approach to organisation design enables
humanistic management, in concert with modern technological advances, to pursue
performance efficiencies available in the integrated supply network. The effective
integration of such a network requires a management philosophy which views
collaboration as a vehicle of ethics, trust, business morality and strategic alignment as
foundation stones for enhanced corporate performance. It further proposes that, in accord
with the methodologies cited in the earlier chapters these features, and the dynamics they
present, are measurable using operations research techniques. The principles of good CG
are precursors rather than consequences of leading performance in business. Support for
this contention is provided in the following chapters together with the analyses and
discussions of the results of the empirical research presented.
3.3.1 Research Study Postulates
There are multitudes of factors which affect performance (Figure 3.1), and some means
of identifying salient factors is required – thus the quest for a framework upon which the
concept of PM can be structured. This structure is the performance pyramid, a
tetrahedron with CG as the foundations and the sides representing company operations,
customer relations and supplier networks.
The base of the key firm also supports the supply network in which the firm operates.
This study attempts to validate the claim that organisational performance has its roots in
78
CG above all else, and therefore measurement of this dimension is required before
proceeding to other critical success factors. It follows that if DEA is able to measure
efficiency on this criteria, which has been argued to be qualitative and thus intangible,
then it can be more stoichiometrically applied to tangible dimensions of performance
higher on the performance pyramid, and ultimately to the supply network in which the
organisation operates.
The objective of validating the PM construct for supply networks is predicated on the
following postulates.
Postulate 1: Organisational performance is founded on a base of CG.
Postulate 2: Performance is measurable.
Postulate 3: Organisational performance is measured by productivity.
Postulate 4: Productivity is the ratio of all outputs to all inputs, i.e. all goods
and services to all resources used in achieving these.
Postulate 5: Improvements in productivity lead to improvements in
performance.
It is these postulates that are tested in this study. The first postulate is tested on the basis
that CG, as the means by which corporate values are communicated throughout the
organisation and displayed in policies, procedures and responsibilities, is the foundation
of performance. One of the factors of CG is CSR, and this is measured in this study. The
second postulate is supported through the measures that show a score for corporation
social responsiveness. Because CSR is an output result contingent on the inputs of
various factors, it supports a productivity-based measure of organisational performance.
Only CSR will be tested, in part because not all CG factors are self-evident nor are they
conveniently available. The methodology to test these postulates is described in the
remainder of this chapter.
79
3.4 The Optimization Model of Business using DEA
Operations research can be described as the scientific approach to decision making in an
attempt to determine how best to design and operate a system under conditions which
usually require an allocation of finite resources. It is characterized by the use of
mathematical models which are chosen to best represent the decision environment. In
this thesis the decision environment is the commercial business system as it exists in a
market-centric economy in Australia. In today’s competitive environment, businesses
have limited resources available to them so it becomes increasingly important that these
resources are used as effectively as possible. Linear programming is the operations
research approach to making business decisions which will result in the optimal or best
use of limited resources in achieving the organisational objective. The measurement of
business performance through the optimization model of LP using DEA will be
developed below.
3.4.1 Stages of an Applied Operations Research Study
There are five stages in the generalized mathematical programming approach. The
optimization process for DEA conforms with the established operations research steps as
shown in Figure 3.3 (Winston 1991).
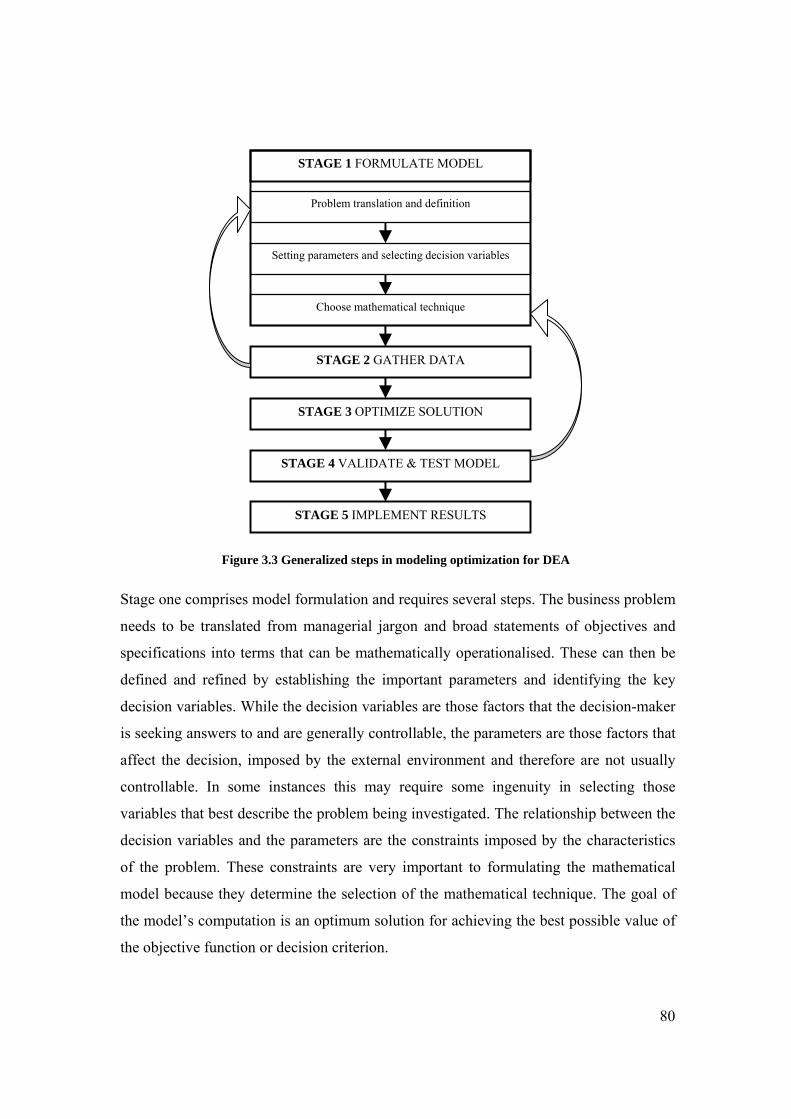
80
Figure 3.3 Generalized steps in modeling optimization for DEA
Stage one comprises model formulation and requires several steps. The business problem
needs to be translated from managerial jargon and broad statements of objectives and
specifications into terms that can be mathematically operationalised. These can then be
defined and refined by establishing the important parameters and identifying the key
decision variables. While the decision variables are those factors that the decision-maker
is seeking answers to and are generally controllable, the parameters are those factors that
affect the decision, imposed by the external environment and therefore are not usually
controllable. In some instances this may require some ingenuity in selecting those
variables that best describe the problem being investigated. The relationship between the
decision variables and the parameters are the constraints imposed by the characteristics
of the problem. These constraints are very important to formulating the mathematical
model because they determine the selection of the mathematical technique. The goal of
the model’s computation is an optimum solution for achieving the best possible value of
the objective function or decision criterion.
STAGE 1 FORMULATE MODEL
Problem translation and definition
Setting parameters and selecting decision variables
Choose mathematical technique
STAGE 2 GATHER DATA
STAGE 3 OPTIMIZE SOLUTION
STAGE 4 VALIDATE & TEST MODEL
STAGE 5 IMPLEMENT RESULTS
81
This stage is developed in Section 3.4.2 using the Golany and Roll (1989) procedure and
in Section 3.5 for the linear programming formulation of DEA.
Stage two is the gathering of data as defined by the problem parameters. This involves
the constraints or matrix coefficients, the coefficients for the objective function, and the
values for the right-hand side of the mathematical programming model. Data collection
is usually time consuming and can be costly, so if secondary data is readily available and
can be suitably adapted, it should be considered. This is described in Section 3.9.
Stage three is obtaining an optimal solution. After dutiful scrutiny and careful selection,
data can now be entered into the model so that the optimum solution is computed. This is
shown in Chapter 5.
Stage four is validation and testing of the model through an assessment of how well the
recommended course of action provided by the computed solution relates to the real
situation and provides an answer applicable to the problem as originally specified. Model
validation is an important step in OR because it justifies the mathematical interpretation
of reality. According to Hazell and Norton (1986), validation of a model leads to a
numerical report of its fidelity to historical data, a potential for improvement if initial
validation fails, and a qualitative judgment of how reliably the model achieves its
designed purpose. The theoretical validation of DEA for this study is done in Chapter 4
and testing of the DEA through trial experiments is shown in Chapter 5 prior to running
the program for the optimal solution. A review of other OR models leading to the choice
of DEA as the most suitable for this study is discussed in Section 3.7.
As shown in Figure 3.3 some of these steps are iterative, so adjustments required are
made as new information becomes evident. For example, the specifications of the
original problem may have changed as a consequence of trying to formulate reality in
mathematical terms, or because the operational reality itself has changed.
Also, new parameters may be necessary for better problem definition, or budgetary
constraints may curtail the project. Some allowances may also be made for ‘point in
time’ calculations giving static answers to a dynamic system. A sensitivity analysis of
the optimum solution may gauge this influence.
82
When testing is complete and the model has been validated, the implementation stage
can commence. Implementation may be ‘once-off’ or continual upon repeated use of the
model. The outcome of business decisions made on the basis of modeled solutions will
determine the model’s efficacy and future use. However, on going monitoring of results
and incorporating changes as required should follow in pursuit of keeping the model
current.
3.4.2 The Procedure for DEA Application
When the generalized approach to model formulation is systematized for the specific
applications of DEA, the stages become a pragmatic rehearsal of three phases of carrying
out an efficiency study as espoused by Golany and Roll (1989). Their flow chart of the
entire procedure is presented in Figure 3.4 and their validation of this protocol is shown
in Section 3.5.
The three phases comprise a number of steps which include heuristic, rule of thumb,
selections of the appropriate number of DMUs, physical organisational boundaries, and
the time horizon for the application. They also caution that an initial selection may not
be ‘correct’ and that the proposed procedure is iterative, as mentioned for the generalized
model earlier.
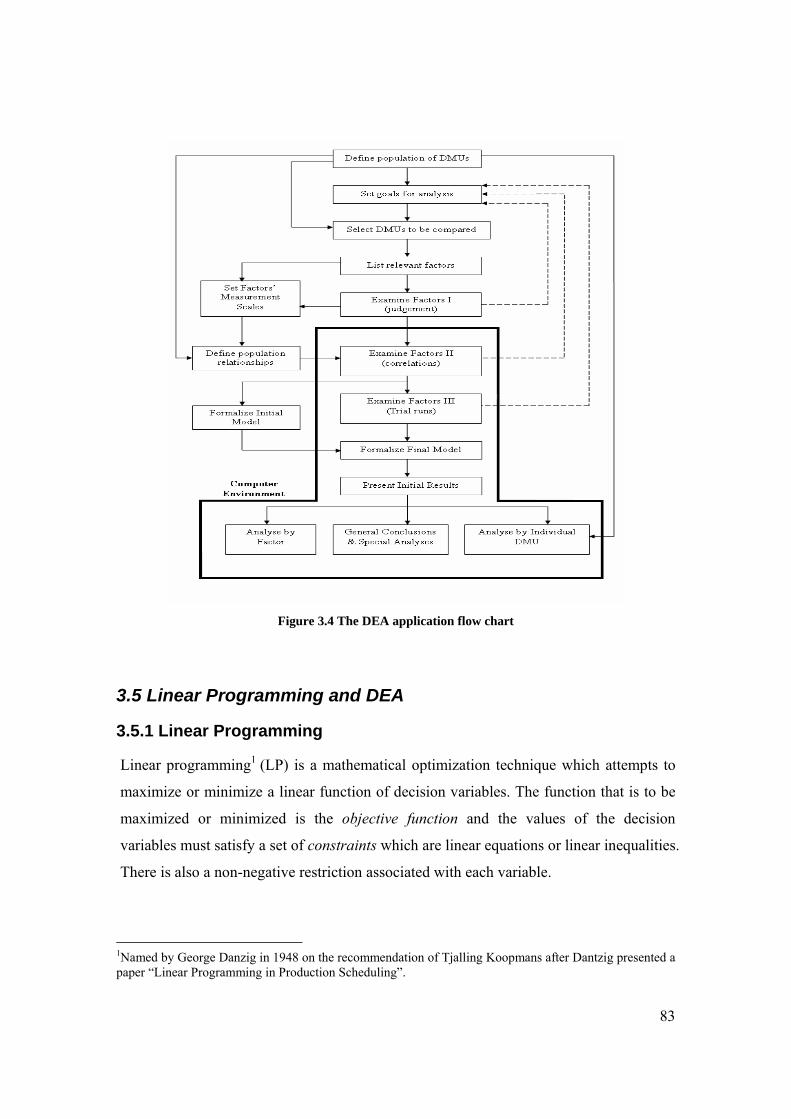
83
Figure 3.4 The DEA application flow chart
3.5 Linear Programming and DEA
3.5.1 Linear Programming
Linear programming1 (LP) is a mathematical optimization technique which attempts to
maximize or minimize a linear function of decision variables. The function that is to be
maximized or minimized is the objective function and the values of the decision
variables must satisfy a set of constraints which are linear equations or linear inequalities.
There is also a non-negative restriction associated with each variable.
1Named by George Danzig in 1948 on the recommendation of Tjalling Koopmans after Dantzig presented a paper “Linear Programming in Production Scheduling”.
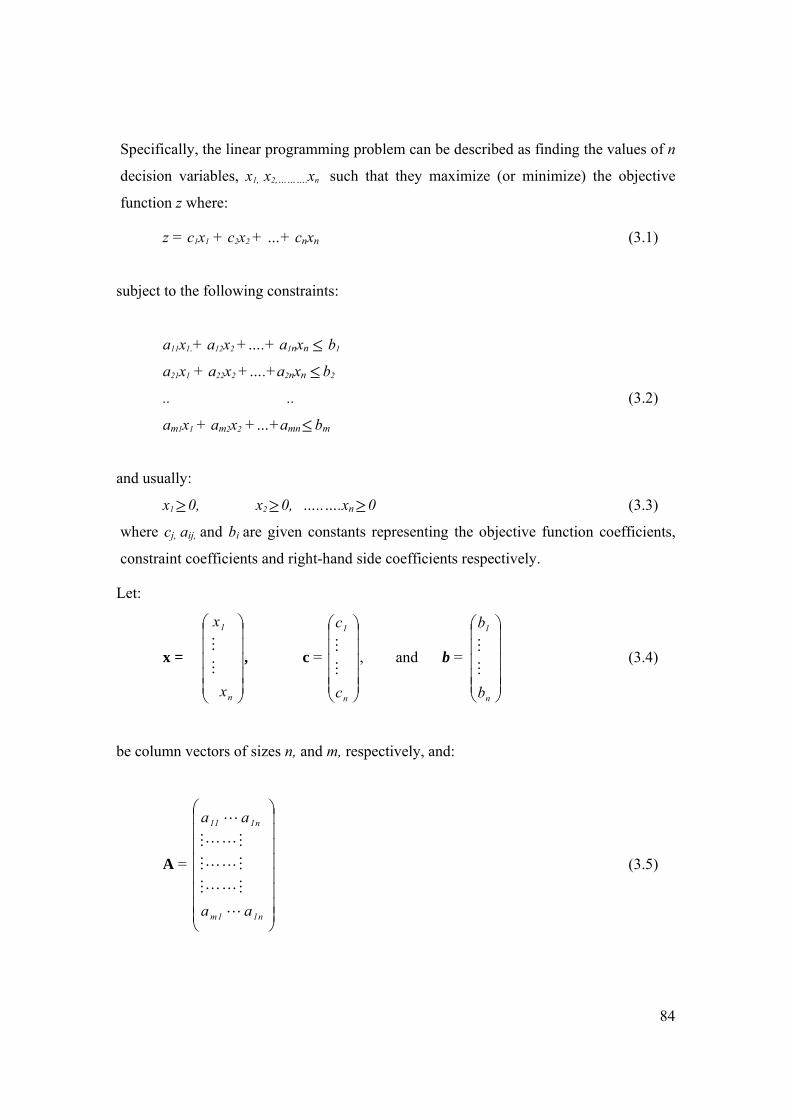
84
Specifically, the linear programming problem can be described as finding the values of n
decision variables, x1, x2,……….xn such that they maximize (or minimize) the objective
function z where:
z = c1x1 + c2x2 + …+ cnxn (3.1)
subject to the following constraints:
a11x1.+ a12x2 +….+ a1nxn ≤ b1
a21x1 + a22x2 +….+a2nxn ≤b2
.. .. (3.2)
am1x1 + am2x2 +…+amn≤bm
and usually:
x1≥0, x2≥0, …..….xn≥0 (3.3)
where cj, aij, and bi are given constants representing the objective function coefficients,
constraint coefficients and right-hand side coefficients respectively.
Let:
x =
⎟⎟⎟⎟⎟
⎠
⎞
⎜⎜⎜⎜⎜
⎝
⎛
n
1
x
x
M
M, c =
⎟⎟⎟⎟⎟
⎠
⎞
⎜⎜⎜⎜⎜
⎝
⎛
n
1
c
c
M
M, and b =
⎟⎟⎟⎟⎟
⎠
⎞
⎜⎜⎜⎜⎜
⎝
⎛
n
1
b
b
M
M (3.4)
be column vectors of sizes n, and m, respectively, and:
A =
⎟⎟⎟⎟⎟⎟⎟⎟
⎠
⎞
⎜⎜⎜⎜⎜⎜⎜⎜
⎝
⎛
n11m
n111
aa
aa
L
MLLM
MLLM
MLLM
L
(3.5)
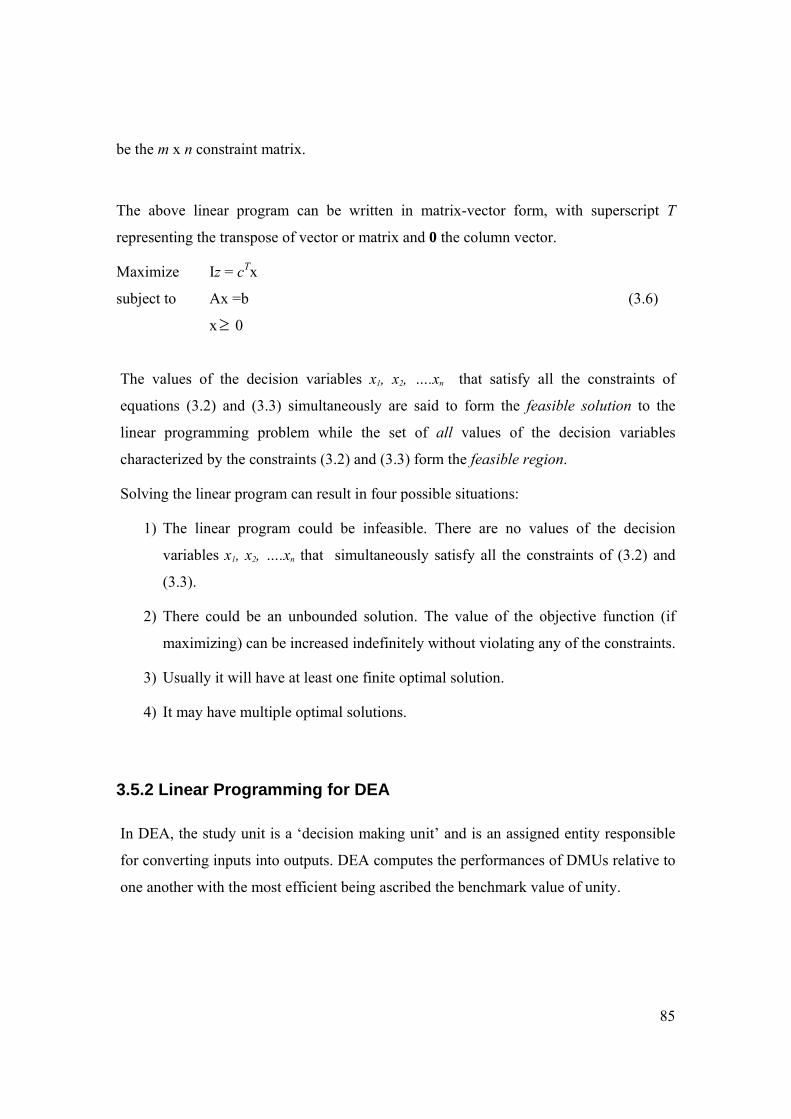
85
be the m x n constraint matrix.
The above linear program can be written in matrix-vector form, with superscript T
representing the transpose of vector or matrix and 0 the column vector.
Maximize Iz = cTx
subject to Ax =b (3.6)
x≥ 0
The values of the decision variables x1, x2, ….xn that satisfy all the constraints of
equations (3.2) and (3.3) simultaneously are said to form the feasible solution to the
linear programming problem while the set of all values of the decision variables
characterized by the constraints (3.2) and (3.3) form the feasible region.
Solving the linear program can result in four possible situations:
1) The linear program could be infeasible. There are no values of the decision
variables x1, x2, ….xn that simultaneously satisfy all the constraints of (3.2) and
(3.3).
2) There could be an unbounded solution. The value of the objective function (if
maximizing) can be increased indefinitely without violating any of the constraints.
3) Usually it will have at least one finite optimal solution.
4) It may have multiple optimal solutions.
3.5.2 Linear Programming for DEA
In DEA, the study unit is a ‘decision making unit’ and is an assigned entity responsible
for converting inputs into outputs. DEA computes the performances of DMUs relative to
one another with the most efficient being ascribed the benchmark value of unity.
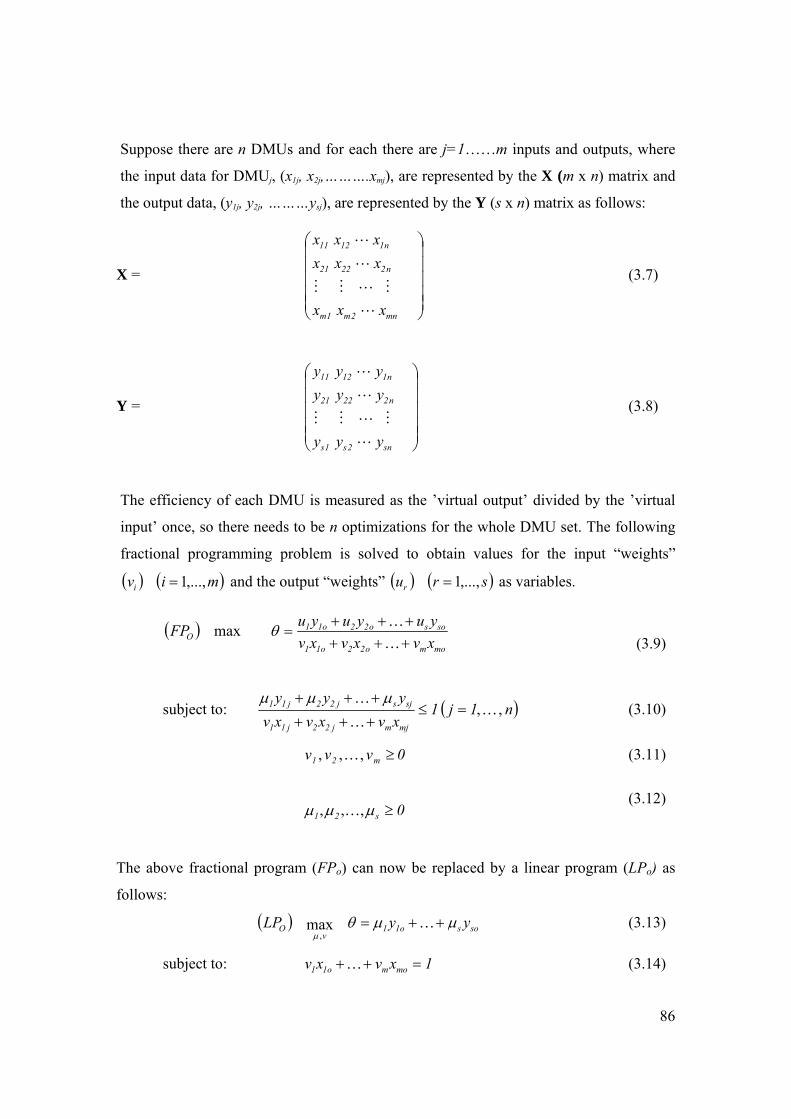
86
Suppose there are n DMUs and for each there are j=1……m inputs and outputs, where
the input data for DMUj, (x1j, x2j,……….xmj), are represented by the X (m x n) matrix and
the output data, (y1j, y2j, ………ysj), are represented by the Y (s x n) matrix as follows:
X =
⎟⎟⎟⎟⎟
⎠
⎞
⎜⎜⎜⎜⎜
⎝
⎛
mn2m1m
n22221
n11211
xxx
xxxxxx
L
MLMM
L
L
(3.7)
Y =
⎟⎟⎟⎟⎟
⎠
⎞
⎜⎜⎜⎜⎜
⎝
⎛
sn2s1s
n22221
n11211
yyy
yyyyyy
L
MLMM
L
L
(3.8)
The efficiency of each DMU is measured as the ’virtual output’ divided by the ’virtual
input’ once, so there needs to be n optimizations for the whole DMU set. The following
fractional programming problem is solved to obtain values for the input “weights”
( ) ( )mivi ,...,1= and the output “weights” ( ) ( )srur ,...,1= as variables.
( )
momo22o11
soso22o11O xvxvxv
yuyuyuFP++++++
=K
Kθmax (3.9)
subject to: ( )n1j1xvxvxvyyy
mjmj22j11
sjsj22j11 ,,KK
K=≤
+++
+++ μμμ (3.10)
0vvv m21 ≥,,, K (3.11)
0s21 ≥μμμ ,,, K
(3.12)
The above fractional program (FPo) can now be replaced by a linear program (LPo) as
follows:
( ) soso11v
O yyLP μμθμ
++= Kmax,
(3.13)
subject to: 1xvxv momo11 =++K (3.14)
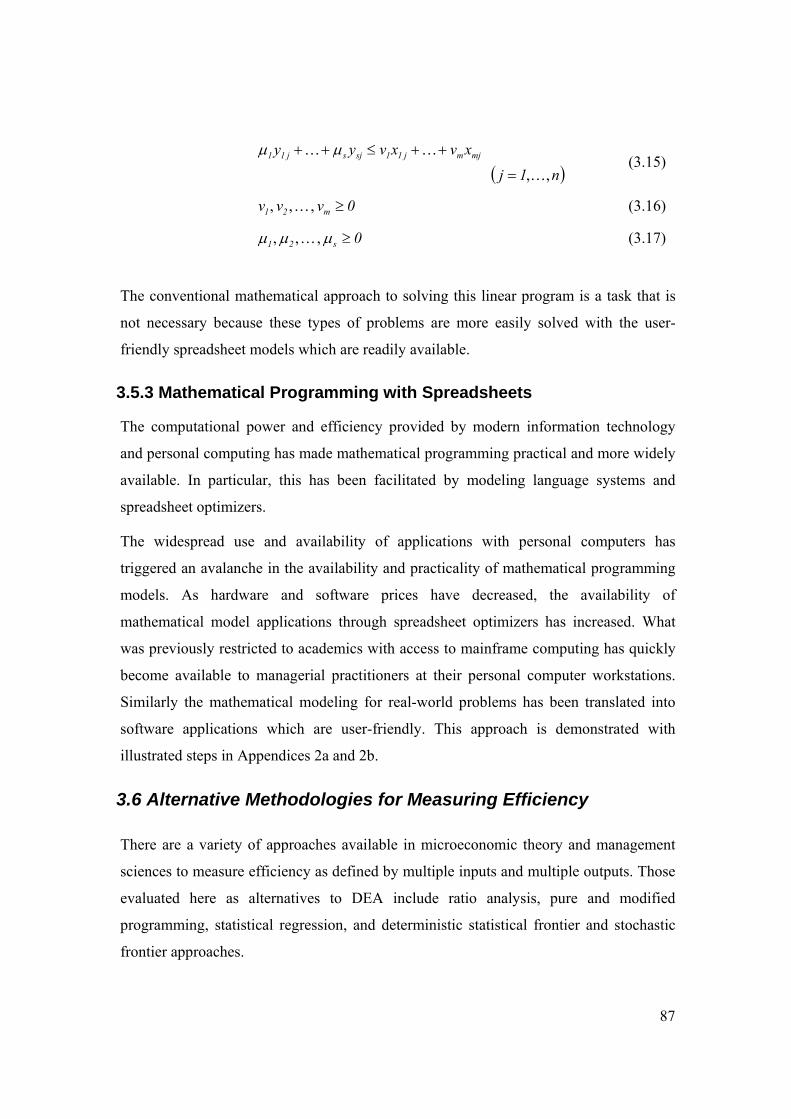
87
( )n1j
xvxvyy mjmj11sjsj11
,,K
KK
=
++≤++ μμ (3.15)
0vvv m21 ≥,,, K (3.16)
0s21 ≥μμμ ,,, K (3.17)
The conventional mathematical approach to solving this linear program is a task that is
not necessary because these types of problems are more easily solved with the user-
friendly spreadsheet models which are readily available.
3.5.3 Mathematical Programming with Spreadsheets
The computational power and efficiency provided by modern information technology
and personal computing has made mathematical programming practical and more widely
available. In particular, this has been facilitated by modeling language systems and
spreadsheet optimizers.
The widespread use and availability of applications with personal computers has
triggered an avalanche in the availability and practicality of mathematical programming
models. As hardware and software prices have decreased, the availability of
mathematical model applications through spreadsheet optimizers has increased. What
was previously restricted to academics with access to mainframe computing has quickly
become available to managerial practitioners at their personal computer workstations.
Similarly the mathematical modeling for real-world problems has been translated into
software applications which are user-friendly. This approach is demonstrated with
illustrated steps in Appendices 2a and 2b.
3.6 Alternative Methodologies for Measuring Efficiency
There are a variety of approaches available in microeconomic theory and management
sciences to measure efficiency as defined by multiple inputs and multiple outputs. Those
evaluated here as alternatives to DEA include ratio analysis, pure and modified
programming, statistical regression, and deterministic statistical frontier and stochastic
frontier approaches.
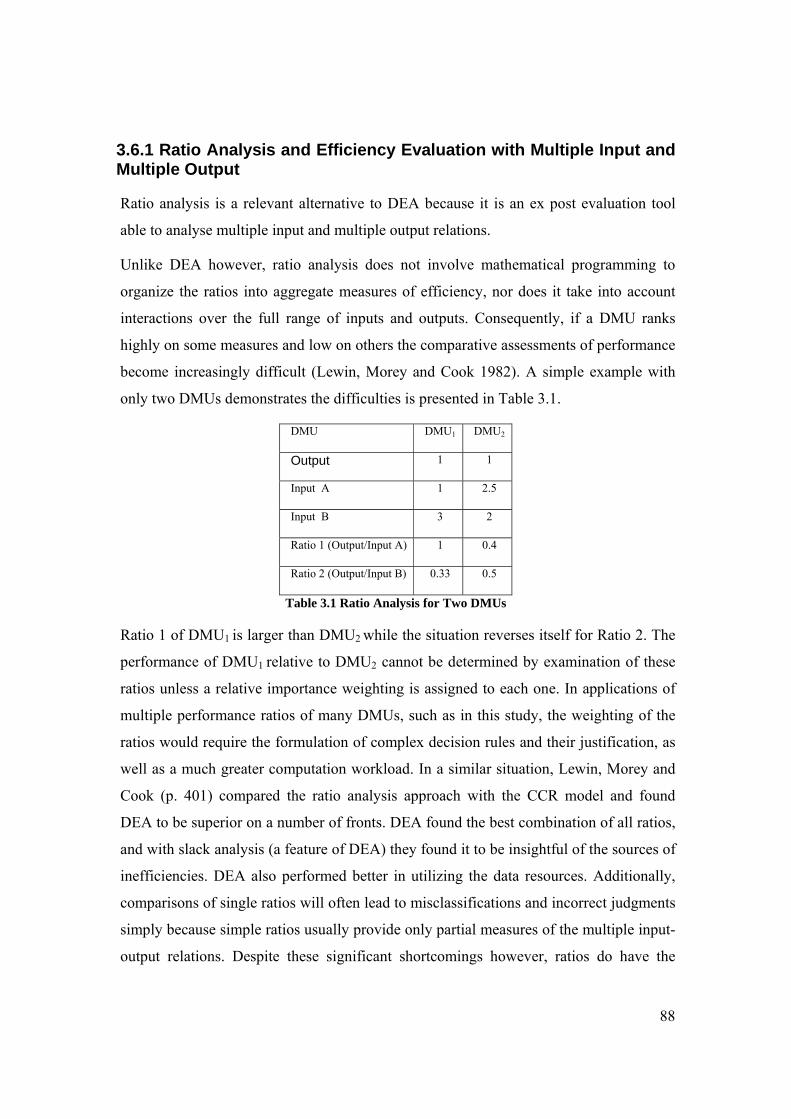
88
3.6.1 Ratio Analysis and Efficiency Evaluation with Multiple Input and Multiple Output
Ratio analysis is a relevant alternative to DEA because it is an ex post evaluation tool
able to analyse multiple input and multiple output relations.
Unlike DEA however, ratio analysis does not involve mathematical programming to
organize the ratios into aggregate measures of efficiency, nor does it take into account
interactions over the full range of inputs and outputs. Consequently, if a DMU ranks
highly on some measures and low on others the comparative assessments of performance
become increasingly difficult (Lewin, Morey and Cook 1982). A simple example with
only two DMUs demonstrates the difficulties is presented in Table 3.1.
DMU DMU1 DMU2
Output 1 1
Input A 1 2.5
Input B 3 2
Ratio 1 (Output/Input A) 1 0.4
Ratio 2 (Output/Input B) 0.33 0.5
Table 3.1 Ratio Analysis for Two DMUs
Ratio 1 of DMU1 is larger than DMU2 while the situation reverses itself for Ratio 2. The
performance of DMU1 relative to DMU2 cannot be determined by examination of these
ratios unless a relative importance weighting is assigned to each one. In applications of
multiple performance ratios of many DMUs, such as in this study, the weighting of the
ratios would require the formulation of complex decision rules and their justification, as
well as a much greater computation workload. In a similar situation, Lewin, Morey and
Cook (p. 401) compared the ratio analysis approach with the CCR model and found
DEA to be superior on a number of fronts. DEA found the best combination of all ratios,
and with slack analysis (a feature of DEA) they found it to be insightful of the sources of
inefficiencies. DEA also performed better in utilizing the data resources. Additionally,
comparisons of single ratios will often lead to misclassifications and incorrect judgments
simply because simple ratios usually provide only partial measures of the multiple input-
output relations. Despite these significant shortcomings however, ratios do have the
89
advantage that they are commonly used because of their ease of use ordinarily and their
simplicity.
3.6.2 The Pure Programming Approach
Based on the technique proposed by Farrell (1957) and developed further by Charnes,
Cooper and Rhodes (1978), this approach uses a sequence of linear programs to
construct a transformation frontier and to compute primal and dual efficiency relative to
the frontier. It represents an earlier approach to the commonly described version in
Section 3.5.
Consider a sample of n production units, each with variable inputs x=(x1..xm) ∈ mR+ in the
production of outputs y= (y1….ys)∈ sR+ . For notation let xij represent the amount of input i
used by unit j (j=1,…n), and let yrj represent the amount of output r produced by j. We
assume technology is known and may be modeled by an input correspondence
y→L(y)⊆ mR+
or inversely by an output correspondence x→ p(x) ⊆ sR+ . L(y) is the
subset of all input vectors capable of producing at least output vector y, and p(x) is the
subset of all output vectors obtainable from input vector x.
The relationship between the input correspondence and the output correspondence of
each production unit can be written as ( ) ( ) xpymRxyL ∈+∈= : and inversely as
( ) ( ) yLxRyxp s ∈∈= + : .
Two subsets of L(y) of interest are: the isoquant and the efficient subset. These can be
defined as:
( ) ( ) ( ) 10yLxyLxxyIsoqL <≤∉∈= λλ ,,: (3.18)
( ) ( ) ( ) 0yyLuxuyLxxyEffL ≥∉⇒≤∈= ,: (3.19)
From (3.18) and (3.19), EffL(y) ⊆ IsoqL(y) and so x∈ IsoqL(y) ≠> x∈EffL(y). This
property is important for the measurement of primal efficiency because the input vector x
is said to be technically efficient in the production of output vector y if x∈EffL(y).
Similarly, the output y is said to be technically efficient for input vector x if y∈Effp(x).
90
The pure programming approach to efficiency measurement starts by constructing the
input set L(y) for any y. The sample data are bounded, or ‘enveloped’ by a convex weak-
disposal hull consisting of a series of facets. The input set constructed is the smallest set
that includes all n observations in the sample, and which satisfies properties of any well
behaved input set.
Technology is well behaved in the sense that the input correspondence is assumed to
satisfy (3.20).
* 0∈L(y), y≥0, and L(0)= nR+
* ( ) empty isas1
11 |||| I+∞
=
⇒+∞→∞+→l
yLlu (3.20)
* x∈L(y)⇒ μ x L(y), μ ≥1
* L is a closed correspondence
*L(θ y)⊆ L(y), θ ≥1
Because this method constructs the smallest possible input set containing all the data
(consistent with regularity conditions in 3.20), the pure programming approach generates
upper bounds to the true but unknown efficiencies. The resulting input set is piecewise
linear, and the construction process achieves considerable flexibility because the breaks
among the pieces are determined endogenously so as to fit the data as closely as possible.
The Farrell technical efficiency measure is computed for each production unit by solving
the programming problem :
Te(x,y)=minμ : μ x∈L(y), μ ≥0 where for the sample of n units,
L(y)=x: yrj≤ ∑jλ j yrj , ∑
jλ j xij≤ xij , ∑
jλ j=1 (3.21)
λ ∈ nR+ , r=1,……s; i=1……m; j=1……n (3.22)
The construction process guarantees that EffL(y) ⊆ IsoqL(y) but that EffL(y)≠ IsoqL(y).
This being the case, it is possible to obtain Te(x,y)=1 though xk∈ EffL(yk) for some k.
91
This can happen if the minimum value of μ is one and there are non-zero slacks in the
linear programming problem equivalent to (3.21).
One of the problems with the pure programming approach results from the fact that the
sample data are enveloped by a maximum production possibility frontier. Consequently,
the entire deviation of an observation from the frontier is attributed to inefficiency.
Since the frontier is non-stochastic, no accommodation is made for issues such as
random external shocks, measurement error, omitted variables or noise in data. Every
possible influence beyond the control of the production unit is incorporated into
inefficiency and referred to as inefficiency. This may lead to under or over statements of
true inefficiency. An alternative to the pure programming approach is a development
called the modified programming approach. This approach is similar to that above except
that the frontier constructed in this approach is parametric. It was first suggested by
Farrell and extended in later studies (Aigner and Chu 1968; Forsund and Jansen 1977;
Forsund and Hjalmarsson 1979). This approach is again purely deterministic and makes
no allowance for noise, measurement error, etc., as earlier. The main concern with this
approach however, is that it is unable to easily deal with multiple outputs.
3.6.3 Regression Analysis with Multi-Inputs and Outputs
Significant work has been done using ordinary least squares to assess comparative
performances of DMUs which use a single input or produce a single output. In the single
input case, the output levels may be regressed on input levels and with the appropriate
model, the output level of each DMU can be estimated from its input. Research reports
however, that the biggest problem in regression based studies comes from the need to
collapse multiple outputs into a single output measure, and if there are interactions
among the outcomes in production then the estimation for single outcomes makes
interpretation difficult. Bessent et al. (1982) indicate that major difficulties arise when
OLS is used in multiple output cases because of the implicit impact on outputs having
the same input resources. Where OLS techniques can be modified to accommodate
multiple inputs and multiple outputs, there may result a similarity to a DEA result,
except that OLS allows for random noise while DEA assumes it reflects inefficiency.
Where OLS results have agreed with the DEA study, it has been observed that DEA,
92
being non-parametric, requires less severe assumptions as do OLS techniques and the
results are usually more informative.
3.6.4 The Deterministic Statistical Frontier Approach
This approach uses statistical techniques to estimate a transformation frontier and to
estimate primal and dual efficiency relative to the estimated frontier (Afriat 1972;
Richmond 1974; Greene 1980). Consider the same sample as in Section 3.6.2 but
producing a single output y∈R+. The input set L(y) is defined as ( )⎪⎭
⎪⎬⎫
⎪⎩
⎪⎨⎧
∏≤= ia
i ixyxyL :
where the Cobb-Douglas specification for )(xφ is arbitrary. Next, the actual output
obtained from the input vector x is expressed as ( )εexp1a
i ixAy ∏= where ε ≤0 is a
disturbance term having some specified one-sided distribution, such as a truncated
normal or exponential. Here ε represents technical efficiency relative to the
deterministic (full) production frontier )(xφ . The data are enveloped by a parametric
deterministic frontier which is estimated. )(xφ and f( ε ) (the density of ε ) may be
estimated by corrected ordinary least squares or maximum likelihood (Lovell and
Schmidt 1988).
The way that the deterministic statistical frontier approach differs from the other
approaches earlier is that the primal and dual frontier and related efficiencies are
estimated by statistical techniques rather than computed by programming techniques. For
statistical reasons the sample size should be large. This is a distinct disadvantage, as is
the attempt to specify a distribution for technical efficiency (a form for f( ε )) if a
production frontier is estimated. Specification of such would have to be based on
knowledge of the factors that generate inefficiency but this knowledge is rarely available.
No a priori consideration is made for choice of a particular distribution; choice typically
being based on analytical tractability. Estimates of the parameters of )(xφ and of the
magnitude of efficiency are not invariant with respect to the specification of a
distribution for the efficiency term. The deterministic statistical frontier approach shares
the same weakness of the modified programming approach, that is, it assumes a
93
deterministic frontier, and all deviations from the frontier are attributed to technical
inefficiency. No allowance is made for noise or measurement error.
3.6.5 The Stochastic Frontier Approach
As with the previous approach, the stochastic frontier approach uses statistical
techniques to estimate a transformation frontier and to estimate efficiency relative to the
estimated stochastic frontier. This technique was a development from those studies
mentioned earlier (Aigner Lovell and Schmidt 1977; Meeusen and Van den Broeck 1977;
Jondrow et al. 1982, Huang 1984). Considering the same sample explained earlier, but
producing a single output y ∈ R+, the input set L(y) is defined as
( ) ⎭⎬⎫
⎩⎨⎧
∏≤= 1i1a
ixAyxyL εexp: where the Cobb-Douglas specification for )(xφ is
arbitrary. Here the symmetric disturbance term 1ε permits random variation for the
production frontier across observations, and captures the effects of noise, measurement
error and exogenous shocks beyond the control of the production unit. The actual output
obtained from input vector x is defined as
211a
i ixAy εε +∏= exp (3.23)
where 2ε ≤ 0 is a one-sided disturbance term that captures the effects of technical
inefficiency relative to the stochastic production frontier. The data generated in this
approach is bounded by a stochastic frontier. The deviation of an observation from the
deterministic kernel of the stochastic frontier may be observed from two sources: a)
random variation of the deterministic kernel across observations captured by the
component 1ε ; and b) technical inefficiency captured by the component 2ε . It may be
observed that the deterministic statistical frontier model is a special case of the stochastic
frontier model for which 1ε =0.
A valuable characteristic of this approach is the introduction of a disturbance term
representing noise, measurement error and exogenous shocks beyond the control of the
production unit. This phenomenon permits decomposition of the deviation of an
94
observation from the deterministic kernel of the frontier into two components,
inefficiency and noise. Without this accommodation the statistical noise would be
counted as inefficiency.
Disadvantages of this approach are that it requires a large sample, and structures are
imposed on technology as well as the distribution of technical inefficiency. This
approach also has that same difficulty of dealing with multiple outputs.
3.7 Other Related Mathematical Models
Models are simplified representations of the world and model-building is an attempt to
capture the most significant decision variables by way of mathematical abstraction.
Typically an iterative process, model-building allows a mathematical solution to the
problem and attempts to achieve as complete and realistic representation of essential
characteristics of the decision environment as possible. A model is also a less expensive
way of analyzing decision problems and can deliver needed information on a timely
basis. More importantly, models are often helpful in examining situations which may be
difficult in the real world and thus provide an insight and understanding about the
decision problem being investigated. This section reviews other OR models to judge
their suitability.
Models can be broadly categorized according to the extent that they portray realism in
the representation of a problem. They range from operational exercises, to gaming,
simulation, and analytical models. In the operational exercise the modeling effort
involves undertaking a series of experiments in the decision environment and measuring
and interpreting the results, for example the blending of various grains to meet a market
requirement. It is an inductive learning process embedded in the empirical research
approach of the natural sciences which allows for a generalization to be drawn from
observations of a particular phenomenon. The high degree of realism however, comes at
a high cost, inviting simplification of the external abstractions and possibly resulting in
sub-optimizing decisions being made. It would not be suitable for PM because of its high
cost and lack of ‘generalizability’.
95
Gaming, as the second type of model, involves the abstraction and simplification of the
real environment to evaluate the effectiveness of alternative proposals.
It loses some degree of realism by simplification but the speed of measuring alternative
performances is increased and the cost of processing is decreased. It is not suited to
measuring performance since these models do not require a comparison of alternative
strategies but rather the best use of resources.
Simulation models resemble gaming models in the simplification of reality but they
differ in that there are no human decision-making interventions in the process. As with
the previous two, simulation does not provide optimum solutions nor empirical
alternatives. The results of these models need human decision-making for the final
judgment of suitable strategy and may find applications in system dynamics as discussed
in Chapter 6.
Analytical models on the other hand, present reality in completely mathematical terms.
Usually an objective or criterion is to be maximized or minimized, subject to a set of
constraints that are there to portray the conditions which have to be satisfied so that
decisions can be made. This model computes the optimal solution, that is, a solution
which satisfies all of the given constraints, to provide the best objective function. Linear
programming has been one of the most popular of these analytical models in recent times.
The analytical model of operations research suits the present study because the thesis
objective ‘to develop a model that will measure performances achieved under given
business conditions so as to optimize resources in attaining operational efficiencies’
meets all the conditions necessary for this style of mathematical analysis.
The pragmatic approach to business modeling is to adopt some aspect of optimization
theory where the scientific solution to a real world problem is attempted through an
analysis utilising the most suitable mathematical techniques available from a number of
alternatives.
The mathematical programming models that can be employed are pervasive in that they
are now accepted in a diversity of industries as valid ways of interpreting business
operations, enhancing efficiencies and hence improving productivity.
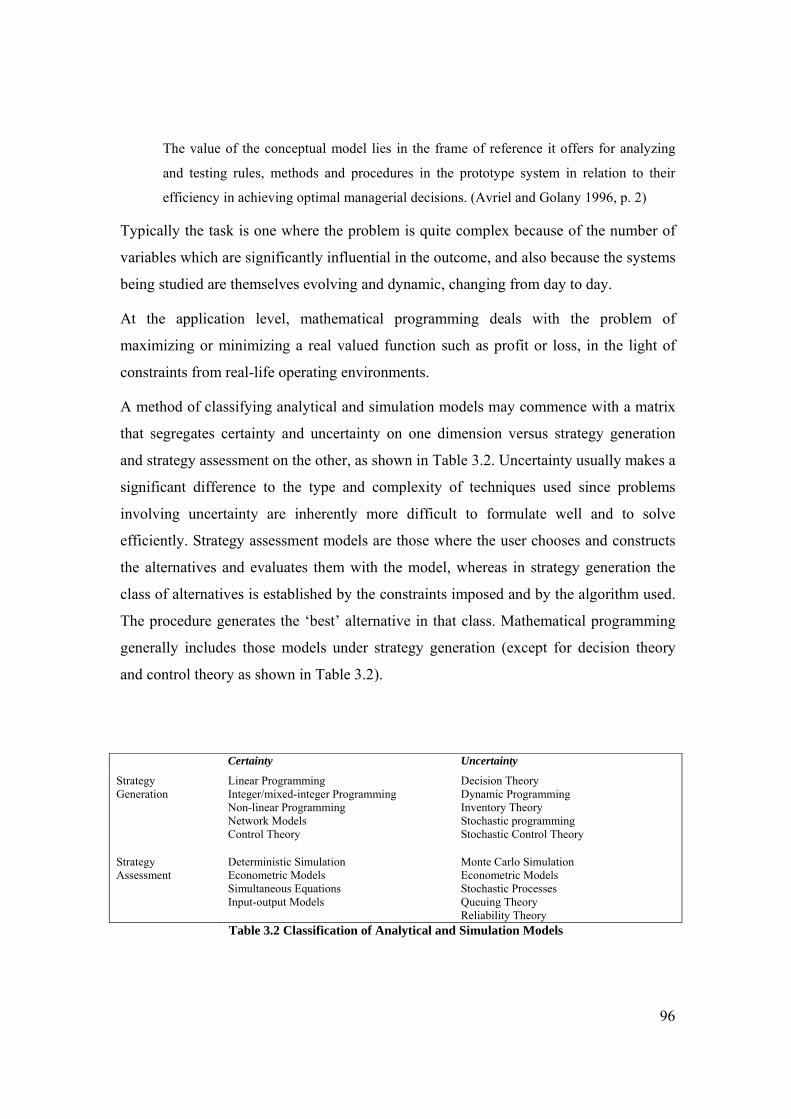
96
The value of the conceptual model lies in the frame of reference it offers for analyzing
and testing rules, methods and procedures in the prototype system in relation to their
efficiency in achieving optimal managerial decisions. (Avriel and Golany 1996, p. 2)
Typically the task is one where the problem is quite complex because of the number of
variables which are significantly influential in the outcome, and also because the systems
being studied are themselves evolving and dynamic, changing from day to day.
At the application level, mathematical programming deals with the problem of
maximizing or minimizing a real valued function such as profit or loss, in the light of
constraints from real-life operating environments.
A method of classifying analytical and simulation models may commence with a matrix
that segregates certainty and uncertainty on one dimension versus strategy generation
and strategy assessment on the other, as shown in Table 3.2. Uncertainty usually makes a
significant difference to the type and complexity of techniques used since problems
involving uncertainty are inherently more difficult to formulate well and to solve
efficiently. Strategy assessment models are those where the user chooses and constructs
the alternatives and evaluates them with the model, whereas in strategy generation the
class of alternatives is established by the constraints imposed and by the algorithm used.
The procedure generates the ‘best’ alternative in that class. Mathematical programming
generally includes those models under strategy generation (except for decision theory
and control theory as shown in Table 3.2).
Certainty Uncertainty
Strategy Generation
Linear Programming Integer/mixed-integer Programming Non-linear Programming Network Models Control Theory
Decision Theory Dynamic Programming Inventory Theory Stochastic programming Stochastic Control Theory
Strategy Assessment
Deterministic Simulation Econometric Models Simultaneous Equations Input-output Models
Monte Carlo Simulation Econometric Models Stochastic Processes Queuing Theory Reliability Theory
Table 3.2 Classification of Analytical and Simulation Models
97
For some real-world problems it may be difficult to find an optimal solution using the
conventional linear program approach because the characterization of reality cannot be
represented by a linear function, non-negativity or other certainty requirements of the
linear programming algorithm. In cases such as these there are other models which are
better suited to the optimization task. These are described in the following paragraphs to
show their suited applications but more importantly to show why they were not chosen
for the present PM (which uses the DEA form of linear programming).
The models include integer programming, dynamic programming, non-linear
programming, multi-objective programming, stochastic programming, heuristic models,
graph theory and networks.
Integer programming (IP) is the extension to LP that admits an additional class of
variables which are restricted to integers. The requirement for discreteness pervades
many classes of problems and provides wide application across scientific and
commercial disciplines. However, unlike LP, the IP problems are practically and
theoretically more difficult to optimize and no single methodology is appropriate for all
problems. DEA is not bound by an integer restriction.
Mixed integer programming (MIP) is a form of integer programming where some of the
variables are integers and others are the more conventional continuous variables. Since
the variables for PM do not have the integer limitation, the DEA linear programming is
sufficient.
Dynammic programming (DP)2 is the name given to those mathematical techniques
which require sequential decision processes. The stage-wise optimization of the problem
is required to describe the governed transition of stage to stage under which the system
operates. There are two classes of DP, one where uncertainty is crucial and the other
where uncertainty is incidental. The ‘functional equation’ which describes the DP
process is a specific ‘recursion’, where “a set of one or more equations in which the
unknown quantity or qualities appear just to the left of the equal sign and also to the
right-hand side” (Denardo 1996, p. 308).
2 “Richard Bellman is credited with creating the field of dynamic programming and coining the language that describes it.” (Denardo, 1996, p. 322).
98
The characteristics of DP applications include the following.
1) The problem can be divided into stages with a decision required at each stage.
2) Each stage has a number of states associated with it.
3) The decision chosen at any stage describes how the state at the current stage is
transformed into the state of the next stage.
4) Given the current state, the optimal decision for each of the remaining stages
must not depend on previously reached states or previously chosen decisions.
Performance measures for study in this thesis will be taken at an instant in time and
without recursive decision processes, so a dynamic programming approach is not
relevant.
Non-linear programming (NLP) differs to LP in the requirement that the problem to be
solved has a non-linear objective function and one or more non-linear constraints,
consequently, while LP solutions occur at the corner points of the feasible region, the
NLP feasible region may be curvilinear with optimal solutions possibly occurring within
this region. The general form of the NLP is not applicable to DEA which has the
assumption of linearity as shown in the ‘production frontiers’ of DEA development in
Chapter 4.
Multiobjective programming (MOP) comes from the scientific discipline in management
better known as multiple-criteria decision making where an action or course of actions is
selected from a set of alternatives so that a satisfactory result for some criteria of
optimization is achieved. The ‘satisficing’ 3 result may be the compromise between
criteria which are in conflict. There are a number of techniques in this class and goal
programming (GP) is one of the more popular because of its similarity to linear
programming. GP extends the LP formulation to accommodate mathematical
programming with multiple objectives.
It minimizes the deviations of the compromise solution from target goals, weighted and
prioritized by the decision maker. There are two categories of constraints, namely
structural/system constraints (strict and rigid as in traditional LP) and the so-called goal
3 Satisficing is a notion of satisfaction based on fair sacrifice.
99
constraints, which are expressions of the original objective functions with target goals set
a priori and negative and positive deviational variables built into them to accommodate
possible over or underachievement. (Tabucanon 1996, p. 494)
If the measures of organisational performance were expanded to include goals in
addition to efficiency then MOP could be considered as an alternative to DEA. Presently
this is not the case.
Stochastic programming (SP) explicitly considers uncertainty in the optimization
procedure as a means of accommodating the fundamental random characteristics of the
problem being solved. Unlike deterministic programs, SP does not anticipate future
outcomes so the quality of the results depends on the successful portrayal of the random
variables over time. PM does not generally accommodate randomness in the allocation
of resources but may do so if part of the study objective is any of the approaches below.
There are generally four approaches to dynamic modeling of the stochastic parameters:
1) econometrics and related time series methods which rely heavily on historical
data;
2) diffusion and stochastic processes using historical and expert information to
calibrate the system;
3) stochastic simulation models; and
4) expert opinion relies on judgment by experts regarding the possible realizations
of random variables.
It is assumed that performance is not significantly affected by random factors so a
stochastic approach is not suitable in this study.
Heuristic models are those that are best suited when it is unlikely that an algorithm
which provides optimal solutions can be developed quickly. They are generally ‘rule of
thumb’ methods which aim at finding reasonably good solutions in a relatively short
time. There are many of these techniques with the following three clusters as examples
of this approach.
The myopic rules cluster describes those styles where the solution to the problem is
constructed in a progressive manner with each iteration producing a part of the solution.
100
This is then extended by selecting one of a number of options available. In scheduling
activities, for example the myopic rules are often called dispatching rules where the
overall objective of minimum completion time is achieved by the best sequence of set-up
and processing times. The heuristics used may be; ‘shortest set-up time first’, or ‘longest
processing time first’, or ‘most important order first’.
Another cluster of heuristics is based on local search which attempts to find a solution
better than the current one through a search in the ‘neighbourhood’. The best journey for
the traveling salesman, or the best schedule for a single machine, are examples of this
approach which is also known in the literature as the 2-opt, 3-opt or k-opt procedures.
The branch and bound heuristics are widely used methods for obtaining solutions to
scheduling type problems where all jobs not yet scheduled are scheduled using some
composite dispatching rule. An heuristic approach to PM could be a possible
methodology in situations where performance-seeking behaviours may be displayed as
‘rule-of-thumb’ strategies by managers.
Graph theory and network optimization has wide practical applications. On a graph the
circles which represent sources, destinations and intermediate points of a network are
called nodes and numerically identified. These nodes are connected by arrows and called
arcs. The resultant graph provides a network which can be the characterization of many
flow problems. Examples of this approach include: minimum-cost flow problem, the
transportation problem, the maximal flow problem, the assignment problem, the shortest
path problem and the critical path method. Such an approach has little relevance to PM
of a single commercial entity, as focused and investigated in this paper, but is of possible
value when considering the performance of the supply chain in which the organisation
exists.
3.8 Research Data for this Study
3.8.1 The Data Source
The research method employing mathematical models relies heavily on the value of the
data used. If there are legitimate concerns about the quality of data being used the whole
model becomes questionable and the research findings untenable. It was for these reasons
101
that the secondary data available from the recently completed doctoral thesis of a fellow
researcher was meticulously scrutinized. The research methodology adopted by Black
(Black 2004) to produce the empirical data required for theory formulation and validation
follows. There were a number of epistemological assumptions that founded her thesis and
led to the critical realist approach of theory formulation known as adaptive theory.
Adaptive theory uses an iterative cycle of qualitative and quantitative investigation to
develop and test embryonic theory. It builds on existing frameworks and adjusts
interpretations of data to test against the emerging theory. It employs ongoing data
collection and development through multiple research strategies that use qualitative and
quantitative methods. In this instance there were a number of studies. The first study was
exploratory and used in-depth interviews to develop grounded theory ‘sensitizing’
concepts of the construct. After Q sort analysis to refine the categories identified in
transcripts, a total of five detailed models had been constructed. These were synthesized
with research literature to establish constructs which could be tested psychometrically.
Psychometric testing was developed because of its suitability for measuring abstract
attitudinal and behavioural constructs. Psychometric surveys rely on respondents to
answer multiple statements to indicate their level of agreement to a concept. A multi-
item seven-point Likert scale was the instrument used for this purpose. Varimax rotation,
which reduces cross-loading of items across multiple factors to clarify the factor
structure, and factor analysis, with a threshold of 0.7 coefficient alpha, were used to
identify patterns of relationships in the data set. The final scale comprised 24 items.
A pilot self-report mail survey of 602 produced a response rate of 34%. Results were
used to refine the constructs and make improvements. The researcher was now able to
develop the testable hypotheses. Two large well-known Australian organisations were
used as case studies. They were tested comparatively, and together with in-depth
interviews, they provided a richness and understanding of the phenomena being
investigated. In addition, good case research design requires construct, internal and
external validity which is enhanced by multiple sources of evidence and careful attention
to case study protocol. This should allow ‘theoretical generalizability’.
In this instance a multiple case study design using psychometric instruments and
interviews provided triangulation of data sources within each case and across cases. A
102
survey instrument was prepared and with discriminant and predictive validity established,
the variables were operationalised. A test-retest procedure was conducted at two week
intervals and across seven groups and provided additional precision for estimating
measurement error.
The final web-enabled survey distributed by a hotlink embedded in company email was
sent to 767 participants who represented four levels of management. The 245 usable
replies (later trimmed to 231), representing a response rate of 32%, were used to finalize
that research and support the theory by conventional hypothesis testing.
3.8.2 The DEA Data
The raw data from the Black (2004) thesis was provided to this researcher on a SPSS
spreadsheet and transferred untarnished to an Excel™ spreadsheet as required by DEA-
Solver™. This data was the basis for establishing DEA as a valid algorithm in the
assessment of PM. The availability of the secondary data from the Black source was
opportune because this thesis argues that PM commences on a foundation of CG, as the
base of the performance pyramid described in the previous chapter. While Black used the
data to establish a construct of corporate social responsiveness and a measure of
corporate social responsiveness management capacity (CSRMC™) (Black 2004), the
statistical support for her construct came from a tradition of hypothesis testing and factor
analysis.
This study shows that a quantitative methodology through the operations research tool of
DEA can provide support for a PM construct, known widely as productivity and
axiomatic in the relationship between inputs and outputs. The computations are shown in
Chapter 5.
3.8.3 Validating the DEA Model
Implicit in assessing the validity of OR models is the conclusion of where models are not
suitable. The last section demonstrated choice of model, i.e. others against the chosen
DEA linear programming model for this thesis. This section describes the validation for
the DEA approach used in this thesis.
103
Validation criteria for all models can include descriptive, analytical and experimental
validation (Gass and Harris 2001). Descriptive validation addresses the attainment of the
model’s objectives and the plausibility of the results, as well as the suitability of the
model structure. Analytical validation again tests the plausibility of results but also their
robustness and characteristics. Experimental validation assesses accuracy and efficiency
of implementation, costs, data transfer and storage and methodological tests of model
documentation.
These validations are done for DEA: in Chapter 4 for structural robustness, Chapter 5 for
experimental application, and Chapter 6 for plausibility of results against indicators
obtained elsewhere. Such a validation is in agreement with the Golany and Roll (1989)
refinement which stipulates judgmental screening, non-DEA quantitative analysis, and a
DEA based analysis. The judgmental analysis may be exercised inter alia along the
following lines,
a) Is the factor related to, or contributing to, one or more of the objectives set for
the application?
b) Is the factor conveying pertinent information not included in other factors?
c) Does the factor contain elements (e.g. price) which interfere with the notion of
technical efficiency?
d) Are data on the factor readily available and generally reliable?
The non-DEA quantitative methods can include simple regression analysis to indicate
the strength of factors in the relationship being investigated, as was done when
comparing the DEA results against the regressions of Black (2004).
The DEA based analyses can test the discriminating power of different factors by
grouping them in a series of combinations which identify the candidates eligible for
elimination. This was done, and is explained in Chapter 5, where the factors were
subjected to trials which would elicit the antecedent and consequence factors of
corporate social responsiveness management capacity as defined by Black.
104
All the validations that have been conducted on the DEA model are described in its
procedural application in Chapter 5.
3.9 Conclusion
This chapter has approached the task of applying a methodology to the research in this
thesis. The methodology is traditionally supported, contemporarily based, but
academically rare. It has shown a new approach to measuring performance in a novel
conceptual setting. By using a model of the business environment in an optimization
setting, it has expanded the virtues of adopting an operations research methodology
which has substantive support of theory quantification through mathematical dogma. A
number of operations research techniques were investigated to arrive at the mathematical
programming model most suited to the task of this thesis. Linear programming through
its particular specialization of DEA was chosen. DEA was judged as the most suitable
means of measuring performance, as defined by the productivity paradigm, because of its
strength of mathematical sophistication and the maturity demonstrated by its commercial
availability, DEA was seen as the most adept at achieving the measurement requirements
stipulated by this study. It is not incidental that its commercial availability, through
‘user-friendly’ spreadsheet applications software, has led to its choice for this particular
investigation, and others of the same ilk. The development of DEA as the diagnostic tool,
through its theoretical foundations to its technical robustness, is discussed in Chapter 4,
and its validation testing and practical application for this thesis, as conducted for the
CSR subset of CG, is reported in Chapter 5.
105
Chapter 4
DEA: Theory, Methods and Applications
Whenever you can, count. Sir Francis Galton 1822-1911
4.1 Introduction
This chapter describes the mathematical foundations for performance expressed as an
efficiency computation. The latter is based on the underlying relationship between inputs
and outputs, and is often described as productivity. The chapter also shows an increasing
use of the mathematical application known as DEA, that was developed initially as a
measurement tool for application in organisations which do not have a profit-driven
mission yet need to operate according to principles of business efficiency. The
distinction of these organisations from the more conventional commercial ventures is not
only the absence of profit-driven strategies but the explicit enunciation of other less
tangible objectives, often conveyed in the corporate vision statement. The tenet of this
thesis is that if performance can be sucessfully measured under the conditions of not-for-
profit, how much better would such a measure be for those organisations that have the
added luxury of financial and other tangible metrics.
The Total factor productivity considers all inputs and output’s and presents a ratio allows
an investigation of a multitude of combinations of these factors, as viewed from vantages
which are often bounded by external constraints. To understand these different
perspectives it is necessary to know how the factors interact and what are the key
determinants of particular outcomes. This can be done by extrapolating from a basic
model and incrementally changing the parameters. For example, there is much value in
simplifying the decision variables to two dimensions so that the various outcomes can be
visualized graphically.
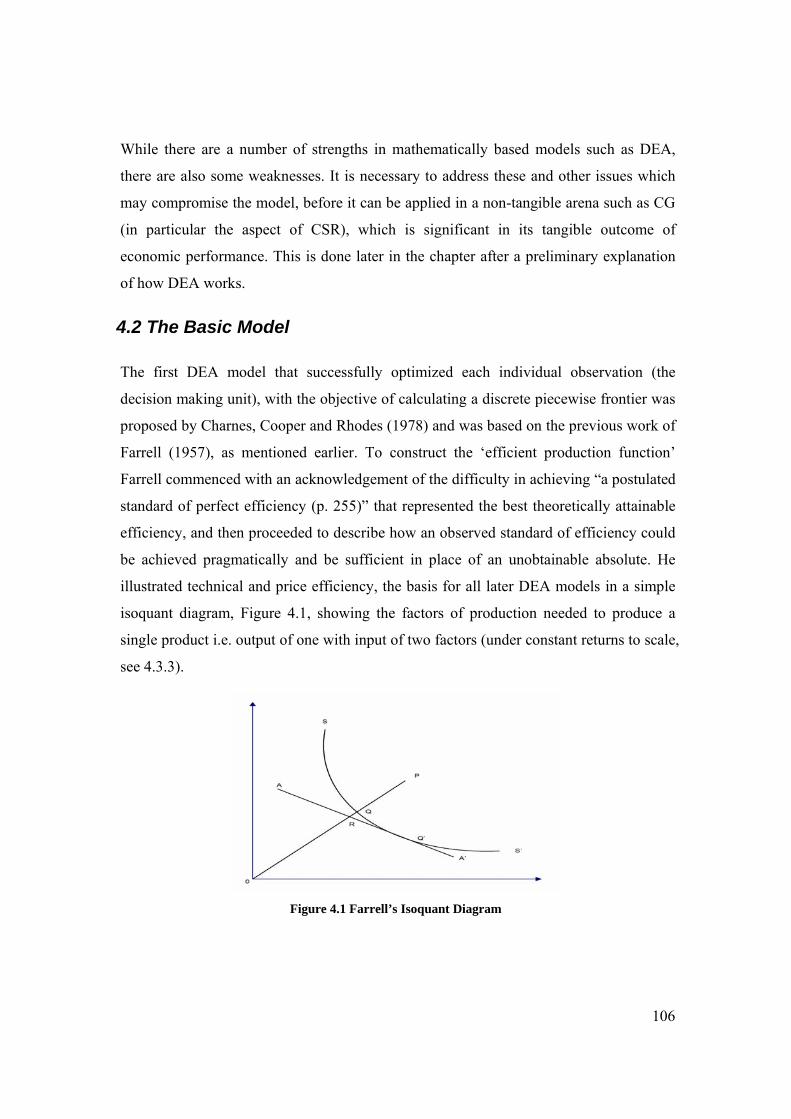
106
While there are a number of strengths in mathematically based models such as DEA,
there are also some weaknesses. It is necessary to address these and other issues which
may compromise the model, before it can be applied in a non-tangible arena such as CG
(in particular the aspect of CSR), which is significant in its tangible outcome of
economic performance. This is done later in the chapter after a preliminary explanation
of how DEA works.
4.2 The Basic Model
The first DEA model that successfully optimized each individual observation (the
decision making unit), with the objective of calculating a discrete piecewise frontier was
proposed by Charnes, Cooper and Rhodes (1978) and was based on the previous work of
Farrell (1957), as mentioned earlier. To construct the ‘efficient production function’
Farrell commenced with an acknowledgement of the difficulty in achieving “a postulated
standard of perfect efficiency (p. 255)” that represented the best theoretically attainable
efficiency, and then proceeded to describe how an observed standard of efficiency could
be achieved pragmatically and be sufficient in place of an unobtainable absolute. He
illustrated technical and price efficiency, the basis for all later DEA models in a simple
isoquant diagram, Figure 4.1, showing the factors of production needed to produce a
single product i.e. output of one with input of two factors (under constant returns to scale,
see 4.3.3).
Figure 4.1 Farrell’s Isoquant Diagram
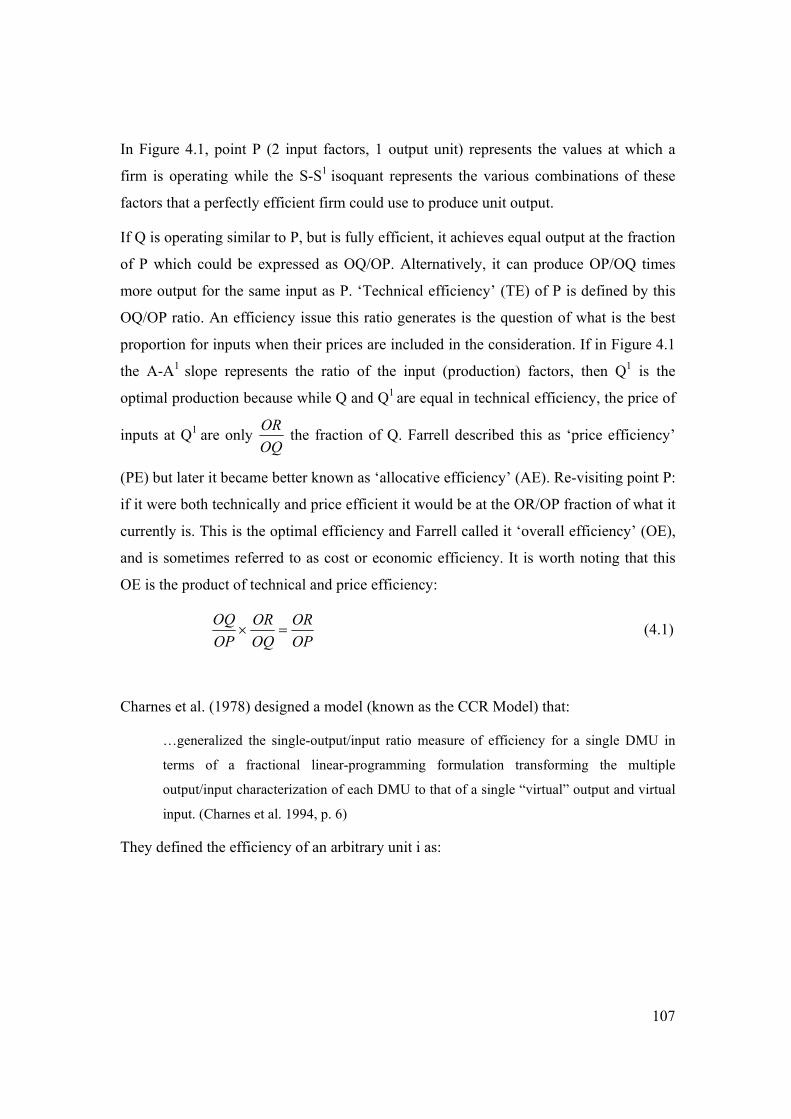
107
In Figure 4.1, point P (2 input factors, 1 output unit) represents the values at which a
firm is operating while the S-S1 isoquant represents the various combinations of these
factors that a perfectly efficient firm could use to produce unit output.
If Q is operating similar to P, but is fully efficient, it achieves equal output at the fraction
of P which could be expressed as OQ/OP. Alternatively, it can produce OP/OQ times
more output for the same input as P. ‘Technical efficiency’ (TE) of P is defined by this
OQ/OP ratio. An efficiency issue this ratio generates is the question of what is the best
proportion for inputs when their prices are included in the consideration. If in Figure 4.1
the A-A1 slope represents the ratio of the input (production) factors, then Q1 is the
optimal production because while Q and Q1 are equal in technical efficiency, the price of
inputs at Q1 are only OQOR the fraction of Q. Farrell described this as ‘price efficiency’
(PE) but later it became better known as ‘allocative efficiency’ (AE). Re-visiting point P:
if it were both technically and price efficient it would be at the OR/OP fraction of what it
currently is. This is the optimal efficiency and Farrell called it ‘overall efficiency’ (OE),
and is sometimes referred to as cost or economic efficiency. It is worth noting that this
OE is the product of technical and price efficiency:
OPOR
OQOR
OPOQ
=× (4.1)
Charnes et al. (1978) designed a model (known as the CCR Model) that:
…generalized the single-output/input ratio measure of efficiency for a single DMU in
terms of a fractional linear-programming formulation transforming the multiple
output/input characterization of each DMU to that of a single “virtual” output and virtual
input. (Charnes et al. 1994, p. 6)
They defined the efficiency of an arbitrary unit i as:
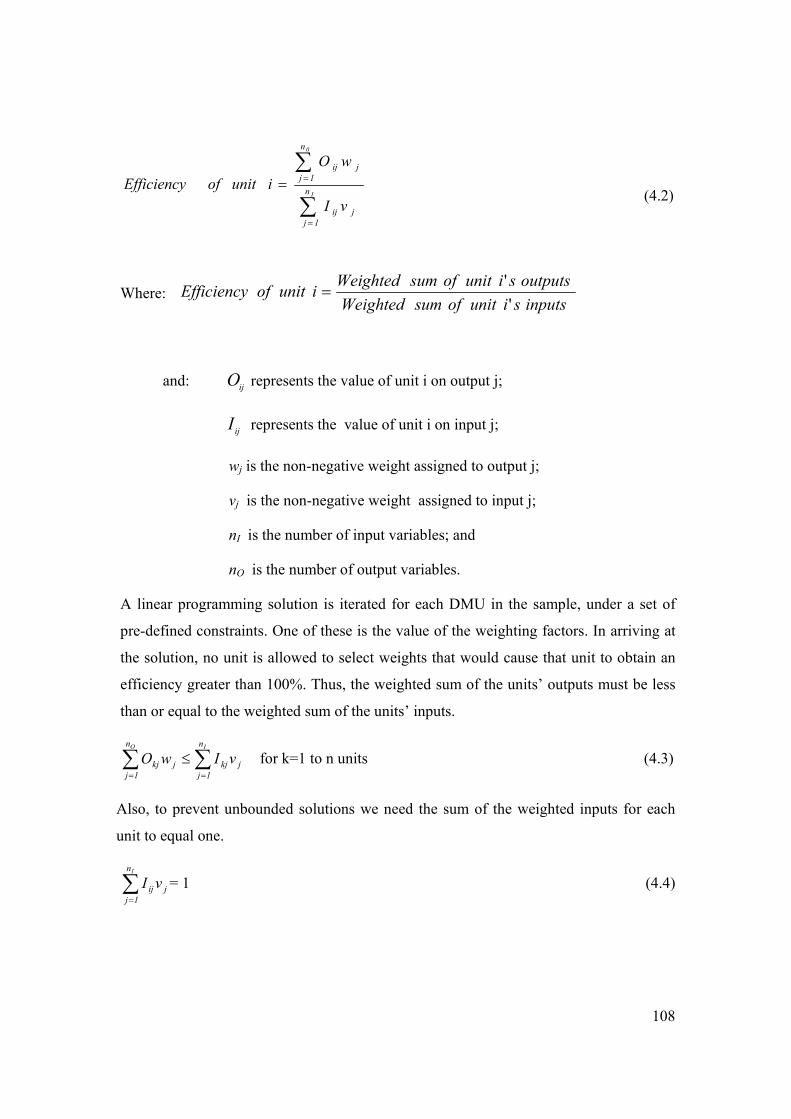
108
∑
∑
=
==I
0
n
1jjij
n
1jjij
vI
wOiunitofEfficiency
(4.2)
Where: inputssiunitofsumWeighted
outputssiunitofsumWeightediunitofEfficiency'
'=
and: ijO represents the value of unit i on output j;
ijI represents the value of unit i on input j;
wj is the non-negative weight assigned to output j;
vj is the non-negative weight assigned to input j;
nI is the number of input variables; and
nO is the number of output variables.
A linear programming solution is iterated for each DMU in the sample, under a set of
pre-defined constraints. One of these is the value of the weighting factors. In arriving at
the solution, no unit is allowed to select weights that would cause that unit to obtain an
efficiency greater than 100%. Thus, the weighted sum of the units’ outputs must be less
than or equal to the weighted sum of the units’ inputs.
j
n
1jkjj
n
1jkj vIwO
IO
∑∑==
≤ for k=1 to n units (4.3)
Also, to prevent unbounded solutions we need the sum of the weighted inputs for each
unit to equal one.
j
n
1jij vI
I
∑=
= 1 (4.4)
109
Note that since DEA also assumes that for input variables ‘less is better’ and for output
variables ’more is better’, the variables chosen should conform to this logic4.
The arbitrary unit for which the efficiency is calculated (DMU) is typically any
productive entity that is chosen by the researcher contingent on which aspects of the
output and input factors is of interest. Researchers sometimes refer to this unit as the
‘firm’ or other such descriptors but the DMU allows for the broadest application in all
DEA models. This allows the researcher to investigate efficiency relationships beyond
traditional views, an important feature noticeable in later and more recent research.
Needless to say, there are a number (usually many) of DMUs in the study cohort as it is
implicit in the DEA technique that these are assessed and ranked relative to one another.
The number of DMUs can be as few as 15 or 20 and as many as 10 000 (Beasley 1990),
but is important because it impacts on the model’s ability to discriminate between them.
There are some rules of thumb to suggest the optimum quantity of DMUs (sample size),
along with their input and output factors. The sample size should be greater than the sum
of inputs times outputs. The sample size should also be equal to or greater than three
times the sum of inputs and outputs. Finally, the one third rule states that the sample size
is acceptable if the number of fully efficient DMUs is no greater than one third of the
total number of DMUs in the sample (Cooper, Seiford and Tone 2006; Avkiran 2006;
Ramanathan 2003).
Each DMU is characterized by output and input factors which are of differing
importance to the best operational efficiency of the unit given that DEA automatically
assigns weights to each factor to optimize the overall efficiency of the unit (in the CCR
model). How weights are assigned and their importance has generated vigorous debate
and is discussed later in Section 4.3.4.
If we return to Farrell’s original diagram in Figure 4.2 we see the inclusion of data points
for other DMUs and notice how they are ‘enveloped’ by the isoquant S-S1 which is the
efficiency frontier at which they aspire to operate. Hence, Charnes, Seiford and Tone’s
(1978) choice of DEA is an apt name for this approach.
4 This has been addressed in the most recent models so that ’more is worse’ can be an output factor. For example, pollution generated in a production process fits this reality.
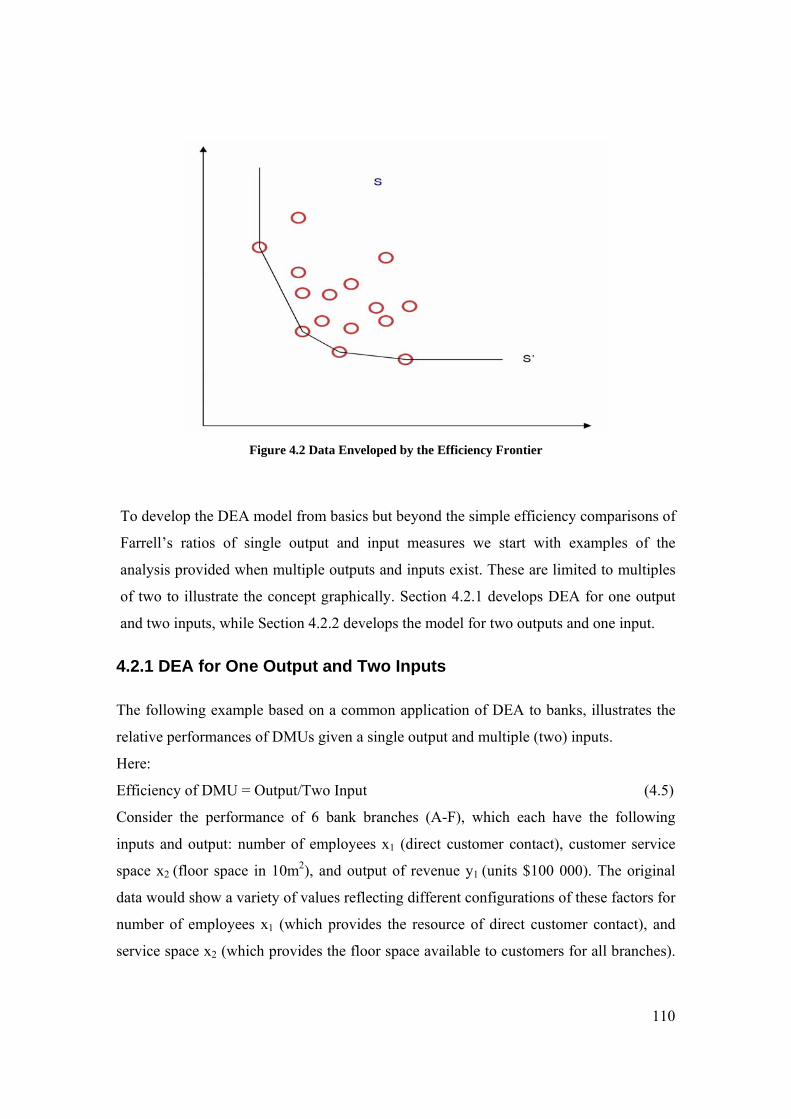
110
Figure 4.2 Data Enveloped by the Efficiency Frontier
To develop the DEA model from basics but beyond the simple efficiency comparisons of
Farrell’s ratios of single output and input measures we start with examples of the
analysis provided when multiple outputs and inputs exist. These are limited to multiples
of two to illustrate the concept graphically. Section 4.2.1 develops DEA for one output
and two inputs, while Section 4.2.2 develops the model for two outputs and one input.
4.2.1 DEA for One Output and Two Inputs
The following example based on a common application of DEA to banks, illustrates the
relative performances of DMUs given a single output and multiple (two) inputs.
Here:
Efficiency of DMU = Output/Two Input (4.5)
Consider the performance of 6 bank branches (A-F), which each have the following
inputs and output: number of employees x1 (direct customer contact), customer service
space x2 (floor space in 10m2), and output of revenue y1 (units $100 000). The original
data would show a variety of values reflecting different configurations of these factors for
number of employees x1 (which provides the resource of direct customer contact), and
service space x2 (which provides the floor space available to customers for all branches).
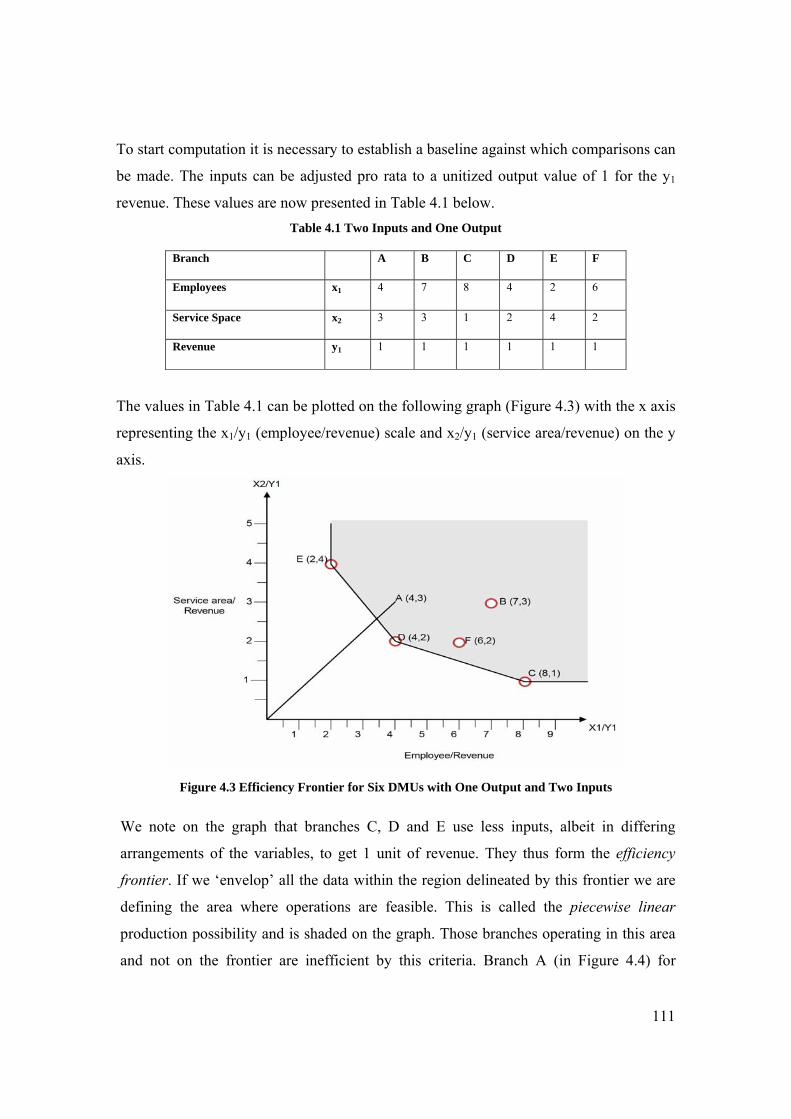
111
To start computation it is necessary to establish a baseline against which comparisons can
be made. The inputs can be adjusted pro rata to a unitized output value of 1 for the y1
revenue. These values are now presented in Table 4.1 below. Table 4.1 Two Inputs and One Output
Branch A B C D E F
Employees x1 4 7 8 4 2 6
Service Space x2 3 3 1 2 4 2
Revenue y1 1 1 1 1 1 1
The values in Table 4.1 can be plotted on the following graph (Figure 4.3) with the x axis
representing the x1/y1 (employee/revenue) scale and x2/y1 (service area/revenue) on the y
axis.
Figure 4.3 Efficiency Frontier for Six DMUs with One Output and Two Inputs
We note on the graph that branches C, D and E use less inputs, albeit in differing
arrangements of the variables, to get 1 unit of revenue. They thus form the efficiency
frontier. If we ‘envelop’ all the data within the region delineated by this frontier we are
defining the area where operations are feasible. This is called the piecewise linear
production possibility and is shaded on the graph. Those branches operating in this area
and not on the frontier are inefficient by this criteria. Branch A (in Figure 4.4) for
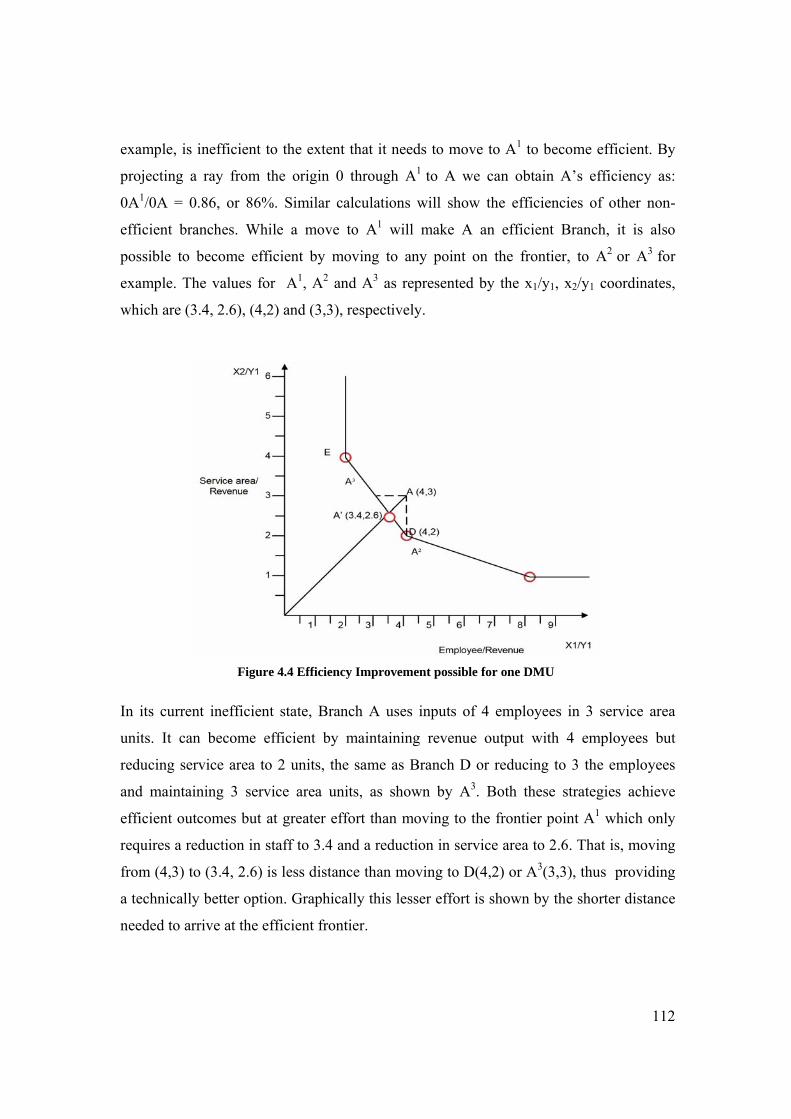
112
example, is inefficient to the extent that it needs to move to A1 to become efficient. By
projecting a ray from the origin 0 through A1 to A we can obtain A’s efficiency as:
0A1/0A = 0.86, or 86%. Similar calculations will show the efficiencies of other non-
efficient branches. While a move to A1 will make A an efficient Branch, it is also
possible to become efficient by moving to any point on the frontier, to A2 or A3 for
example. The values for A1, A2 and A3 as represented by the x1/y1, x2/y1 coordinates,
which are (3.4, 2.6), (4,2) and (3,3), respectively.
Figure 4.4 Efficiency Improvement possible for one DMU
In its current inefficient state, Branch A uses inputs of 4 employees in 3 service area
units. It can become efficient by maintaining revenue output with 4 employees but
reducing service area to 2 units, the same as Branch D or reducing to 3 the employees
and maintaining 3 service area units, as shown by A3. Both these strategies achieve
efficient outcomes but at greater effort than moving to the frontier point A1 which only
requires a reduction in staff to 3.4 and a reduction in service area to 2.6. That is, moving
from (4,3) to (3.4, 2.6) is less distance than moving to D(4,2) or A3(3,3), thus providing
a technically better option. Graphically this lesser effort is shown by the shorter distance
needed to arrive at the efficient frontier.
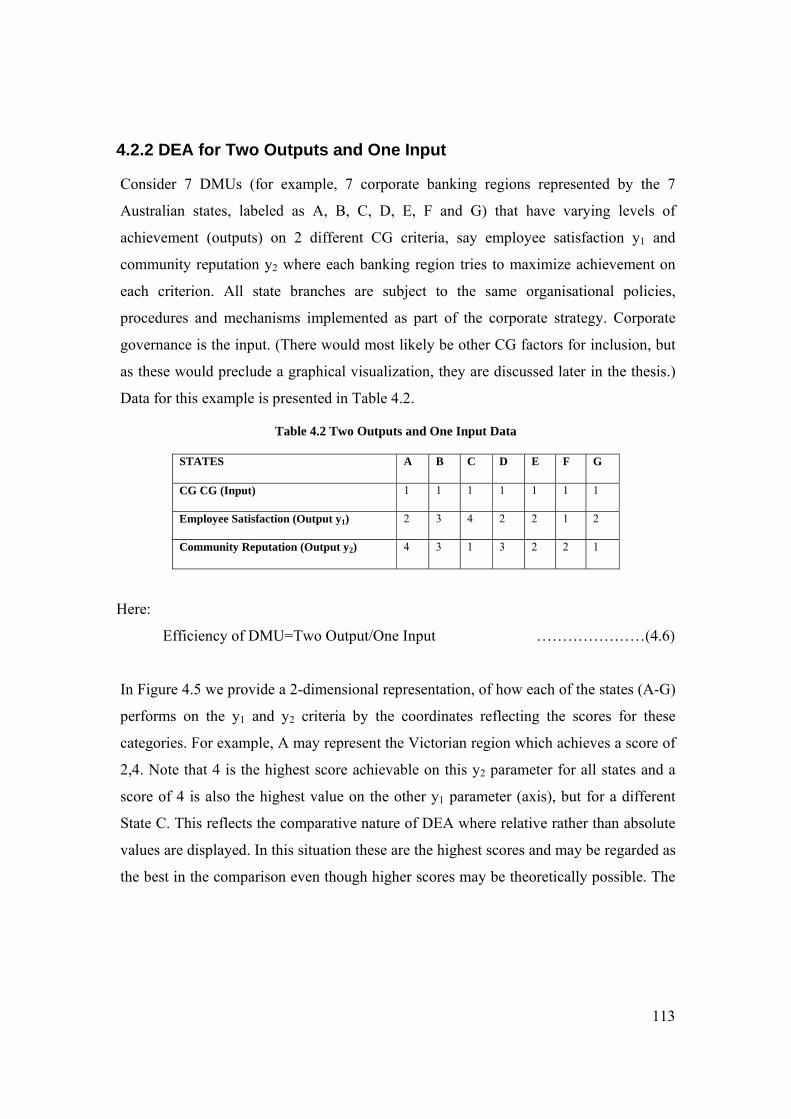
113
4.2.2 DEA for Two Outputs and One Input
Consider 7 DMUs (for example, 7 corporate banking regions represented by the 7
Australian states, labeled as A, B, C, D, E, F and G) that have varying levels of
achievement (outputs) on 2 different CG criteria, say employee satisfaction y1 and
community reputation y2 where each banking region tries to maximize achievement on
each criterion. All state branches are subject to the same organisational policies,
procedures and mechanisms implemented as part of the corporate strategy. Corporate
governance is the input. (There would most likely be other CG factors for inclusion, but
as these would preclude a graphical visualization, they are discussed later in the thesis.)
Data for this example is presented in Table 4.2.
Table 4.2 Two Outputs and One Input Data
STATES A B C D E F G
CG CG (Input) 1 1 1 1 1 1 1
Employee Satisfaction (Output y1) 2 3 4 2 2 1 2
Community Reputation (Output y2) 4 3 1 3 2 2 1
Here:
Efficiency of DMU=Two Output/One Input …………………(4.6)
In Figure 4.5 we provide a 2-dimensional representation, of how each of the states (A-G)
performs on the y1 and y2 criteria by the coordinates reflecting the scores for these
categories. For example, A may represent the Victorian region which achieves a score of
2,4. Note that 4 is the highest score achievable on this y2 parameter for all states and a
score of 4 is also the highest value on the other y1 parameter (axis), but for a different
State C. This reflects the comparative nature of DEA where relative rather than absolute
values are displayed. In this situation these are the highest scores and may be regarded as
the best in the comparison even though higher scores may be theoretically possible. The
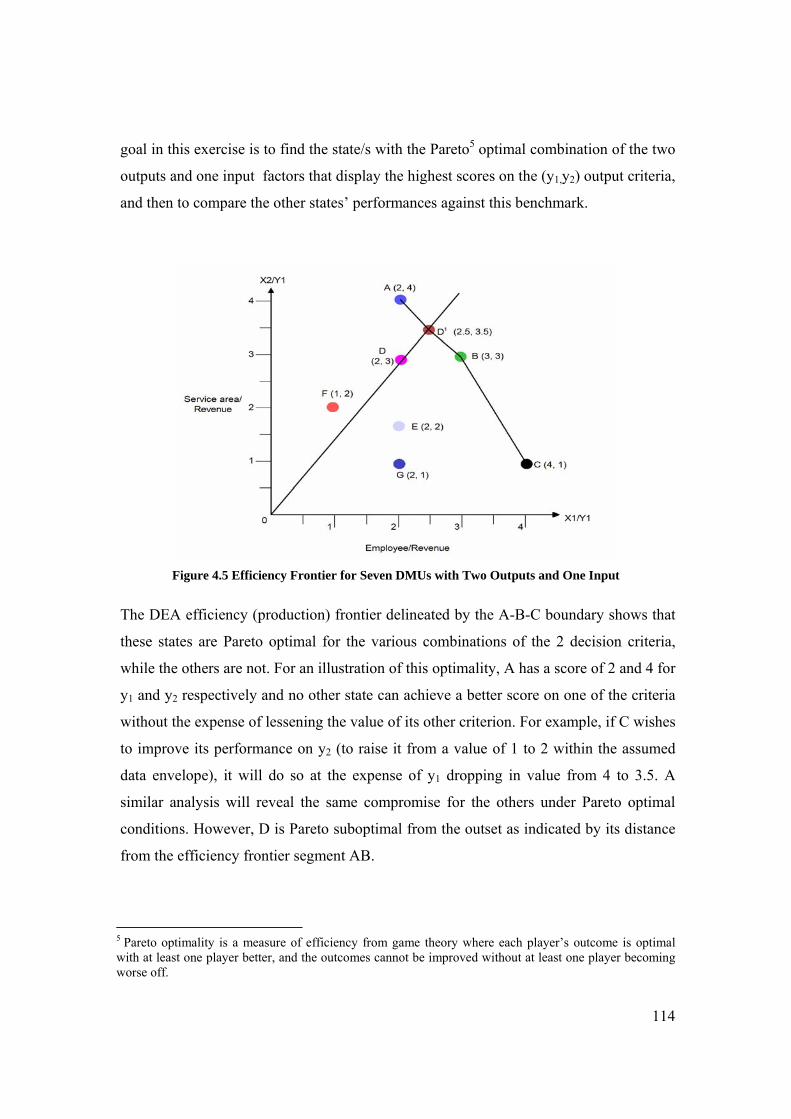
114
goal in this exercise is to find the state/s with the Pareto5 optimal combination of the two
outputs and one input factors that display the highest scores on the (y1,y2) output criteria,
and then to compare the other states’ performances against this benchmark.
Figure 4.5 Efficiency Frontier for Seven DMUs with Two Outputs and One Input
The DEA efficiency (production) frontier delineated by the A-B-C boundary shows that
these states are Pareto optimal for the various combinations of the 2 decision criteria,
while the others are not. For an illustration of this optimality, A has a score of 2 and 4 for
y1 and y2 respectively and no other state can achieve a better score on one of the criteria
without the expense of lessening the value of its other criterion. For example, if C wishes
to improve its performance on y2 (to raise it from a value of 1 to 2 within the assumed
data envelope), it will do so at the expense of y1 dropping in value from 4 to 3.5. A
similar analysis will reveal the same compromise for the others under Pareto optimal
conditions. However, D is Pareto suboptimal from the outset as indicated by its distance
from the efficiency frontier segment AB.
5 Pareto optimality is a measure of efficiency from game theory where each player’s outcome is optimal with at least one player better, and the outcomes cannot be improved without at least one player becoming worse off.
115
D could achieve optimality by mimicking A’s values (2,4) or B’s values (3,3) but the
movement to these positions requires more effort than to achieve optimality by moving
to D1 which is at the intersect of the extrapolation of OD and the segment AB.
Measuring this vector shows that D is located at 5/6th of the distance from 0 to D1
(through the vector equation of 2,4 for A and 3,3 for B). Alternatively, it can be surmised
that D is operating at 83.3% (5/6th) of its Pareto optimal performance suggesting a scope
for improvement of 16.7% on these CG criteria. Furthermore, the extrapolation shows
that D would attain 100% efficiency at y1y2 values of 2.5 and 3.5 pointing the way for an
improvement strategy.
There is no difference in the strategy for both examples in sections 4.2.1 and 4.2.2, of
achieving efficiency by movement to the production frontier, simply a difference in
direction. While the first example shows that efficiency can be obtained by movement
toward the origin on the graph, the second example shows that a movement away from
the origin achieves the same objective. These objectives reflect the type of improvement
imperative and are referred to as technical and allocative efficiency, as discussed earlier.
The calculations illustrated thus far and the Pareto optimal endpoints for each of the
DMUs are not known a priori and would not be evident until all the linear programming
computations conducted by the DEA algorithm are completed. The DEA formulation
itself assigns weights in the computation of the Pareto optimal reference points (by
solving vector equations as shown earlier) and reveals the optimal surface which houses
the most efficient DMUs. The assigning of weights is also discussed later in Section
4.3.4.
The result of a typical DEA computation is multi-dimensional, representing the multiple
inputs and outputs that have been analysed, not the two dimensions as illustrated in these
graphical examples. The full DEA matrix can only be shown in a tabular form, as
presented in the spreadsheet output of various computer programs, and while it is not
possible to visualize the output in a graphical form, it nonetheless presents an ability to
make countless comparisons.

116
4.3 Extensions to the Base Model
4.3.1 Technical and Allocative Efficiencies: Input and Output Orientations
One important reason for doing a DEA study is to find inefficient DMUs so that they can
be projected onto the efficient frontier. Fully efficient DMUs all lie on this frontier so all
others are inefficient. The amount by which these are inefficient is represented by their
distance from the frontier. To reach the frontier, movement must be origin-seeking, i.e.
input focused, or origin-leaving, i.e. output focused. Both distances can be computed. If
a DMU is closer to the origin, and needs to travel outwards to achieve efficiency, it is
seeking to better use existing resources. More output can be achieved from the same
inputs so that this technical efficiency represents a score of under-achievement. For
example, a technical efficiency of 80% suggests that 20% more output is possible from
the existing inputs.
When the output quantities are acceptable and need to be maintained, the inefficiency
displayed by a DMU is interpreted as the achievement of this output at a cost of inputs
higher than efficient DMUs. Allocative (price) efficiency therefore shows how much
reduction in inputs is necessary for the DMU to become efficient. For example, an
allocative efficiency of 70% suggests that inputs can be reduced by 30% for the DMU to
achieve full efficiency compared to other DMUs. This ‘price efficiency’ usually shows
how the DMU falls short of achieving efficiency due to a failure to make input
substitutions or reallocations, in other words, to find better priced equivalent alternatives.
The third efficiency (after technical and allocative efficiencies) is the overall efficiency
discussed earlier.
These examples have all measured efficiency along the ray from the origin to the data
point of the DMU. In doing so, the measures along the ray maintain proportionality
depending on their position along that ray. This occurs because the origin of all rays is
fixed at the intersect of the two axes. These radial efficiency measures have a significant
advantage; the measures are units invariant. That is, the changing of measurement units
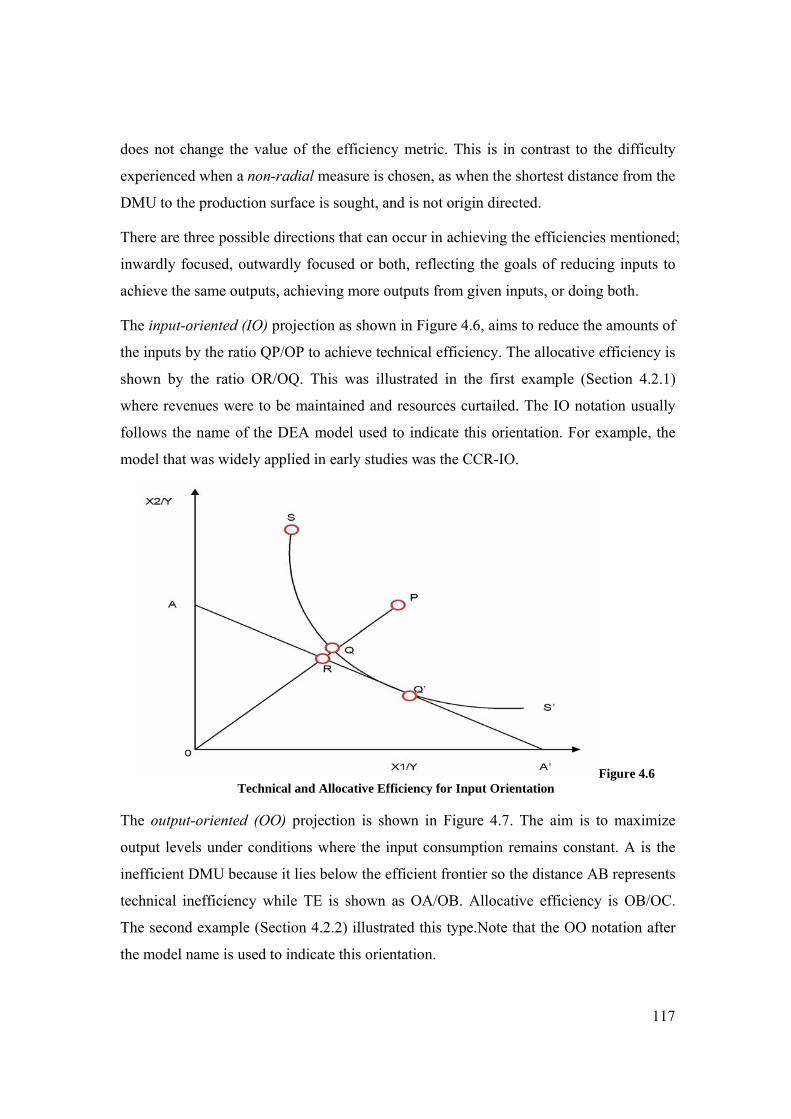
117
does not change the value of the efficiency metric. This is in contrast to the difficulty
experienced when a non-radial measure is chosen, as when the shortest distance from the
DMU to the production surface is sought, and is not origin directed.
There are three possible directions that can occur in achieving the efficiencies mentioned;
inwardly focused, outwardly focused or both, reflecting the goals of reducing inputs to
achieve the same outputs, achieving more outputs from given inputs, or doing both.
The input-oriented (IO) projection as shown in Figure 4.6, aims to reduce the amounts of
the inputs by the ratio QP/OP to achieve technical efficiency. The allocative efficiency is
shown by the ratio OR/OQ. This was illustrated in the first example (Section 4.2.1)
where revenues were to be maintained and resources curtailed. The IO notation usually
follows the name of the DEA model used to indicate this orientation. For example, the
model that was widely applied in early studies was the CCR-IO.
Figure 4.6 Technical and Allocative Efficiency for Input Orientation
The output-oriented (OO) projection is shown in Figure 4.7. The aim is to maximize
output levels under conditions where the input consumption remains constant. A is the
inefficient DMU because it lies below the efficient frontier so the distance AB represents
technical inefficiency while TE is shown as OA/OB. Allocative efficiency is OB/OC.
The second example (Section 4.2.2) illustrated this type.Note that the OO notation after
the model name is used to indicate this orientation.
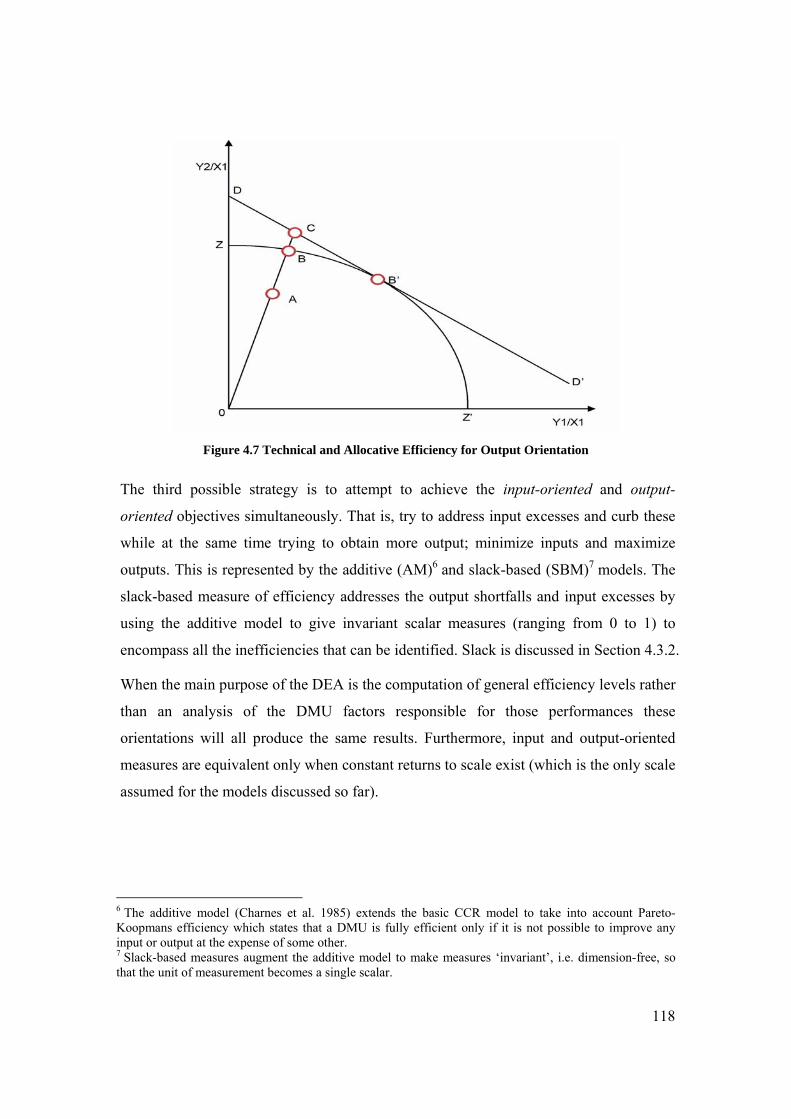
118
Figure 4.7 Technical and Allocative Efficiency for Output Orientation
The third possible strategy is to attempt to achieve the input-oriented and output-
oriented objectives simultaneously. That is, try to address input excesses and curb these
while at the same time trying to obtain more output; minimize inputs and maximize
outputs. This is represented by the additive (AM)6 and slack-based (SBM)7 models. The
slack-based measure of efficiency addresses the output shortfalls and input excesses by
using the additive model to give invariant scalar measures (ranging from 0 to 1) to
encompass all the inefficiencies that can be identified. Slack is discussed in Section 4.3.2.
When the main purpose of the DEA is the computation of general efficiency levels rather
than an analysis of the DMU factors responsible for those performances these
orientations will all produce the same results. Furthermore, input and output-oriented
measures are equivalent only when constant returns to scale exist (which is the only scale
assumed for the models discussed so far).
6 The additive model (Charnes et al. 1985) extends the basic CCR model to take into account Pareto-Koopmans efficiency which states that a DMU is fully efficient only if it is not possible to improve any input or output at the expense of some other. 7 Slack-based measures augment the additive model to make measures ‘invariant’, i.e. dimension-free, so that the unit of measurement becomes a single scalar.
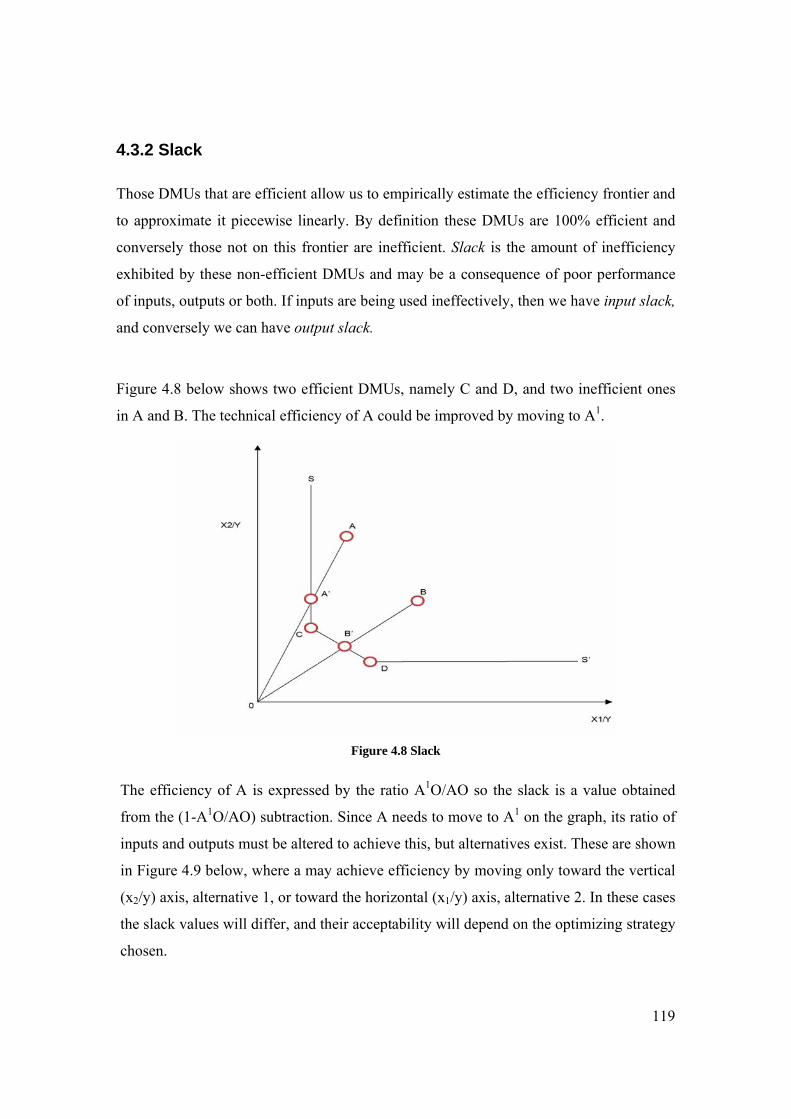
119
4.3.2 Slack
Those DMUs that are efficient allow us to empirically estimate the efficiency frontier and
to approximate it piecewise linearly. By definition these DMUs are 100% efficient and
conversely those not on this frontier are inefficient. Slack is the amount of inefficiency
exhibited by these non-efficient DMUs and may be a consequence of poor performance
of inputs, outputs or both. If inputs are being used ineffectively, then we have input slack,
and conversely we can have output slack.
Figure 4.8 below shows two efficient DMUs, namely C and D, and two inefficient ones
in A and B. The technical efficiency of A could be improved by moving to A1.
Figure 4.8 Slack
The efficiency of A is expressed by the ratio A1O/AO so the slack is a value obtained
from the (1-A1O/AO) subtraction. Since A needs to move to A1 on the graph, its ratio of
inputs and outputs must be altered to achieve this, but alternatives exist. These are shown
in Figure 4.9 below, where a may achieve efficiency by moving only toward the vertical
(x2/y) axis, alternative 1, or toward the horizontal (x1/y) axis, alternative 2. In these cases
the slack values will differ, and their acceptability will depend on the optimizing strategy
chosen.
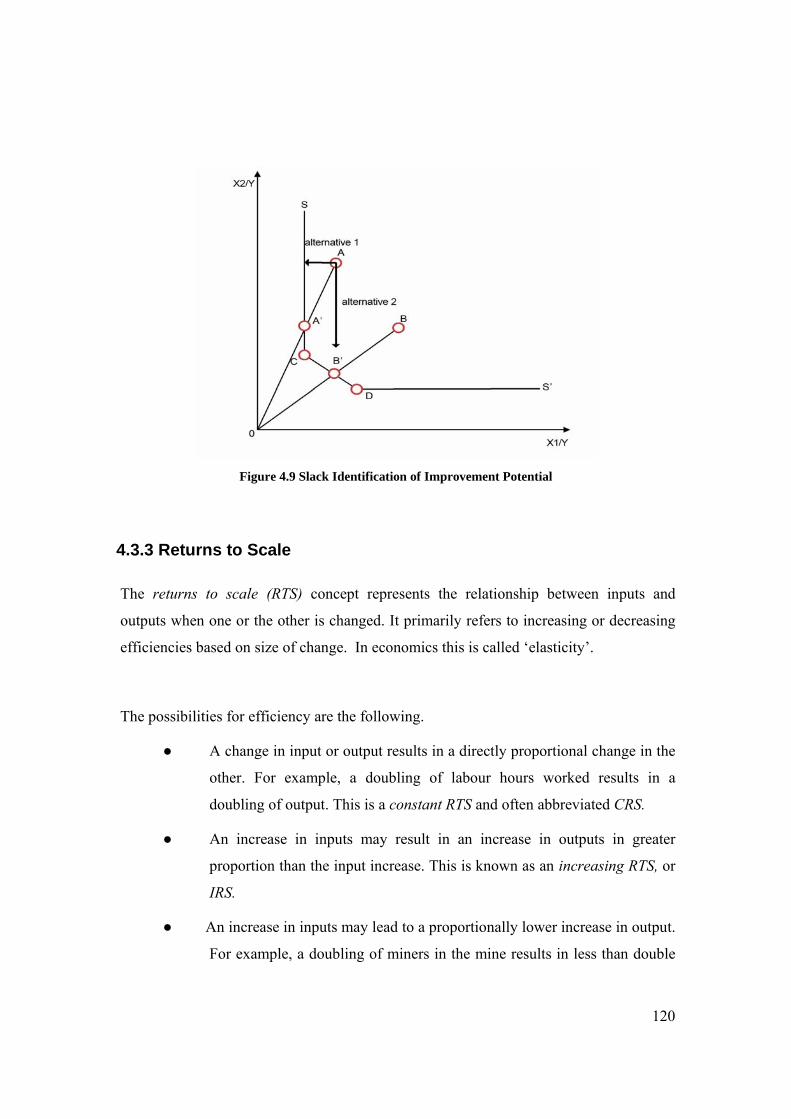
120
Figure 4.9 Slack Identification of Improvement Potential
4.3.3 Returns to Scale
The returns to scale (RTS) concept represents the relationship between inputs and
outputs when one or the other is changed. It primarily refers to increasing or decreasing
efficiencies based on size of change. In economics this is called ‘elasticity’.
The possibilities for efficiency are the following.
A change in input or output results in a directly proportional change in the
other. For example, a doubling of labour hours worked results in a
doubling of output. This is a constant RTS and often abbreviated CRS.
An increase in inputs may result in an increase in outputs in greater
proportion than the input increase. This is known as an increasing RTS, or
IRS.
An increase in inputs may lead to a proportionally lower increase in output.
For example, a doubling of miners in the mine results in less than double
121
output because of congestion at the workplace. This is known as
decreasing RTS or DRS.
The RTS properties that an organisation possesses may reflect the nature of the industry,
the size of the company, its mode of operation, and a variety of other attributes which
constrain efficiency-seeking strategies. The CRS assumption for example, is only
appropriate when firms are operating at optimal scale with no imperfect competition, no
constraints on supplies, labour or finance, etc. If constraints do exist, then a variable RTS
DEA model that Banker, Charnes and Cooper (1984) (BCC) developed after the CCR
model avoids the difficulties of scale efficiency and confounding measures that could
otherwise arise. It is no wonder the VRS model was the most commonly used during the
1990s.
A classification of the models that assume a piecewise linear envelopment surface, as
presented by RTS and I-O orientations can be represented diagrammatically as follows in
Figure 4.10.

122
Figure 4.10 Models that Assume a Piecewise Linear Envelopment Surface
4.3.4 Weighting the DMUs
How much of the efficiency rating of a DMU is due to the data and how much is due to
the weights? The typical DEA model (CCR) uses variable weights derived directly from
the data. Apart from obviating the need to set weights a priori, this allows DEA to
choose weights so that the optimum outcome is possible for each DMU. This means that
the input:output ratio is maximized relative to other DMUs under the conditions: that all
data and weights are non-negative: the values lie between zero and unity: and the same
weights are applied to all. To illustrate the process we use the widely applied input-
oriented CRS model.
For the ith DMU in a population of n:
Efficiency DMUi = wOi/vIi (4.7)
123
where: Oi is the output for the DMU, and w a vector of output weights; and
Ii is the input for the DMU, and v a vector of input weights.
The optimal weights are obtained by solving the problem:
maxwv(wOi/vIi)
s.t. wOi/vIi≤1
w, v ≥ 1 (4.8)
To avoid an infinite number of solutions a further constraint vIi = 1 can be imposed.
This leads to a different linear programming problem (known as the multiplier form):
maxwv(wOi)
s.t. vIi = 1
wOi – vIi ≤ 0
w.v ≥ 0 (4.9)
Thus the efficiency measure for the ith DMU is maximized subject to the constraints that
all efficiency measures must be less than or equal to one.
4.3.5 Setting the DMU weights
A major stream of DEA literature revolves around concerns about allowing the basic
CCR model to assign the weights to input/output data. Since the model is knowledge-
free of the actual transformation processes, it is claimed that it may underestimate the
relative efficiency of some DMUs and possibly even reduce the feasible solution space
(Tracy and Chen 2005). While this feature may be an advantage in situations where there
is no managerial process knowledge or judgment available, the reality is that some
process knowledge is the norm rather than the exception. The exclusion of this
information could significantly disadvantage the results. Consequently studies have
partly addressed this problem by adding to the blend of models that allow for weight
restrictions. The Greenberg and Nunamaker (1987) transformation for example allows
for the articulation of those indicators that managers think constitute good performance
or are considered to have a greater impact on performance by accepting surrogate factors
124
expressed in a quantified form. In other words enumerated rankings reflecting the
importance of subjectively rated factors are allowed.
This is important because:
Ignoring the interrelationships among performance measures and limitations on their
possible combination may result in specification of weights vastly different from those
which would have been specified had these aspects been considered. (Greenberg and
Nunameker 1987, p. 333)
Although this flaw has been evident for some time, the application of modified models
remains relatively unrealized. Tracy and Chen (2005) propose a parametric DEA (PDEA)
which addresses this problem with a ‘generalized linear weight restriction’. They design
a weight restriction in the form:
Ω = (u,v) : α ≤aTu + bTv≤ β (4.10)
where a and b are vectors (T) of appropriate dimensions and α and β are scalars. The
restriction above is of a general form which can be divided into two categories:
Type 1 constraints are those where the input weights are not related to the output weights
(u,v separable). Type 2 constraints are those where the input and output weights are
related (u,v linked). (p. 391)
Type 1 are presented in the form:
aTu ≤ α , bTv≤ β (4.11)
Type 2 constraints are typically:
aur ≥ bvl (4.12)
They maintain however, that as weight restrictions can contribute to significant problems
in DEA formulation further research is warranted. Alternatively, other mathematical
techniques not specifically designed to overcome DEA difficulties may be tested in this
situation. The analytical hierarchy process (AHP) (Zahir 2006) is possibly one way of
quantifying the Greenberg and Nunamaker (1987) transformation and validating its
application, while a broader approach could be to use uncertainty principles from the
125
physical sciences (Palmer and Parker 2001). Ragsdale (2004), a mathematician rather
than a proponent of DEA per se, recommends AHP for “the decision maker who finds it
hard to subjectively determine the criterion scores and weights needed in the
multicriteria scoring model” (p 809), and while it primarily targets the criteria scores it
can apply exactly the same structured approach to determining criteria weights.
The AHP approach has the following steps:
1) create a pairwise comparison matrix for each of the alternative weight values on
a scale of 1 to 9 (1 = equally preferred, 5 = strongly preferred, 9 = extremely
preferred);
2) normalize comparisons;
3) check for consistency using; Consistency Index (CI) and Consistency Ratio (CR);
4) repeat for each of the alternative weights; and
5) calculate the weighted average scores for the alternatives and select the best.
This thesis acknowledges the importance of weight restrictions in the determination of
relative efficiencies. However, it is prepared to take the conservative stance that comes
from the DEA algorithm assigning DMU weights because the computational output is
claimed to present a conservative ‘worse case scenario’ which adds robustness to the
results.
4.4 DEA: Assumptions, Strengths and Limitations
The unique feature of DEA is that it has a reported usefulness in cases where other tools
have failed because of the complexity and often unknown nature of the relationship
between multiple input and output variables. In fact this robustness is demonstrated in
the ability of DEA to use data of imperfect knowledge to the extent that such data may
be expressed in ordinal relations such as ‘more than’ or ‘less than’ for some DMUs and
more conventional tangible data for others. The levels of measurement, i.e. nominal,
126
ordinal interval and ratio for DMUs, may differ but the ability to include them in the data
set ensures that the efficiency calculation for each DMU occurs with the contributions of
all factors weighted according to their individual influence.
DEA was designed to measure the relative efficiency where market prices are not
available [but] by its ability to model multiple-input and multiple-output relationships
without a priori underlying functional form assumption, DEA has also been widely
applied to other areas. (Zhu 2003, p 4)
4.4.1 Assumptions and Precautions of DEA
The fundamental assumption underlying DEA is that as an ’extreme point’ method if one
DMU is capable of achieving 100% efficiency through the correct ratio of output and
input factors optimally weighted, then other inefficient DMUs should be capable of
doing the same if they operate efficiently. Implicit in this assumption is that the inputs
and outputs are homogeneous, when in fact there may be differing amounts of
heterogeneity not in only the factors of the DMUs but within the DMUs themselves.
Other considerations that warrant attention when applying DEA include the following.
The exclusion or poor selection of input and output data, by design or omission,
may produce a bias in the results.
Measurement error in the data can produce biased results.
Extraneous environmental (e.g. regulatory or physical) factors may impact on
operational performances of different DMUs.
Efficiencies of DMUs are cohort dependent and could be quite different if the
wider population were included.
The DEA computation does not necessarily account for operational decisions
regarding management’s risk aversion or longitudinal optimization strategies.
127
4.4.2 Strengths and Advantages of DEA
DEA is a powerful non-parametric tool for analyzing efficiencies of DMUs in the same
cohort by allowing direct peer and peer to grouped-peers comparisons, on the basis of a
multitude of input and output factors through a now diverse range of models.
An a priori knowledge or assignment of weights is not necessary (although sometimes
preferable) for the model as results are still legitimate, albeit arguably conservative. This
may be particularly valuable when inputs and outputs are of different measurement units.
There is no need to make assumptions about the functional form of the inputs or outputs
and their relational analysis provides different perspectives of efficiency (TE, AE and
EE), revealing opportunities for improvement.
Charnes et al. (1994, p. 8) provide twelve strengths of DEA as listed below.
1) The focus is on individual DMUs in contrast to population averages.
2) Each DMU has a single aggregate measure for the utilization of input
factors (independent variables) to produce desired outputs (dependent
variables).
3) DEA can simultaneously utilize multiple outputs and multiple inputs with
each being stated in different units of measurement.
4) Adjustments can be made for extraneous variables.
5) Categorical (dummy) variables can be included.
6) Computations are value-free and do not require specification or knowledge
of a priori weights of prices for the inputs or outputs.
7) There is no restriction on the functional form of the production
relationship.
8) DEA can accommodate judgment when desired.
9) DEA can produce specific estimates for desired changes in inputs and/or
outputs for projecting DMUs below the efficient frontier onto the efficient
frontier.
128
10) Results are Pareto optimal.
11) Focus is on revealed best-practice frontiers rather than on central-tendency
properties of frontiers.
12) It satisfies strict equity criteria in the relative evaluation of each DMU.
4.4.3 Weaknesses and Limitations of DEA
The non-parametric nature of DEA means it does not allow the application of inferential
statistics and traditional mechanisms such as hypothesis testing, etc. As an extreme point
technique it can be significantly influenced by outliers and is susceptible to the ‘noise’
(even symmetrical noise with zero mean) such as measurement error. DEA is good at
estimating relative efficiencies but poor with absolute values. It converges slowly
to ’absolute efficiency’ not allowing a comparison to the ‘theoretical maximum’ and
DEA requires that each DMU has a separate linear programming formulation, thus
resulting in many LP iterations. For large problems with many DMUs this can be
computationally intensive and demanding, and sometimes beyond the capabilities of
some programs. Another concern is the lack of definitive operational parameters. While
there are rules-of-thumb that give guidance to the application of DEA there appears to be
a lack of a definitive boundary.
For example, Cooper, Seiford and Tone (2000) say that:
If the number of DMUs (n) is less than the combined number of inputs plus outputs
(m+s), a large portion of the DMUs will be identified as efficient and efficiency
discrimination among DMUs is lost. (p. 103)
Their answer is ‘trial and error’. Try a small set of input and output items and gradually
increase the number, observing the effects. While these weaknesses and limitations may
be inimical to the successful application of DEA, it should be noted that an
understanding of their threat and possible impact also means that they can be ameliorated
for the betterment of the investigation. There is also the option of overcoming some
weaknesses by applying DEA in concert with other optimization techniques.
129
4.5 Other Models and Issues
4.5.1 Other Models
DEA can be regarded as a body of concepts and methodologies that has evolved since
the seminal work of Charnes, Cooper and Rhodes (1978). The CCR ratio model has been
the focus of this dissertation to highlight the fundamental mechanisms that have
propelled the application of DEA. It has yielded objective evaluations of efficiencies and
thus inefficiencies of decision making units. By revealing the inadequacies of the non-
performing units it provides a path for improvement. The flaw in the original model
however, was the assumption that movements (toward efficiency) were at constant
returns to scale. The CCR yields a piecewise linear constant RTS surface. CCR type
models, under radial efficiency, do not take into account input excesses and output
shortfalls, i.e. non-zero slacks. The slacks-based measure (SMB) addressed this by using
the additive model “to give scalar measures from 0 to 1 that identify all of the
inefficiencies that the model can identify” (Cooper, Seiford and Tone 2006, p. 104).
The Banker-Charnes-Cooper (BCC) model (1984) distinguished between technical and
scale inefficiencies. It estimated TE at given scales of operations by evaluating the
benefits of using decreasing, increasing or constant returns-to-scale to enhance efficiency.
The BCC yields a piecewise linear variable RTS envelopment surface.
The multiplicative models use piecewise log-linear or piecewise Cobb-Douglas
envelopment instead of the traditional linear piecewise surface.
The additive and extended additive model relates to the CCR model but incorporates
Pareto’s economic concept and Koopman’s earlier work.
An evolution of the DEA concept and methodologies in the first 15 years of this
approach is detailed in Charnes et al. (1994, p.12), with other authors mentioned earlier
(Emrouznejad and Thanassoulis 2005; DEAzone 2005) adding to this list in later years.
130
4.5.2 Other Issues
The body of knowledge surrounding DEA and its applications is growing steadily and
becoming diverse. It is not expected that this paper can fully explore all the issues but
some additional commentary may give a perspective of DEA’s applicability. The earlier
models were implicit in the notion that more outputs and less inputs were positive
achievements, and consequently were designed around this axiom with no provision for
alternatives. In recent times the focus on operational efficiencies has broadened to
include the impact of these efficiencies beyond the organisation. For example, increased
productive output may be seen positively by stockholders, economists, and government
and company staff, yet be frowned upon by the community. Increased output may mean
increased waste, pollution or environmental damage consequent opun acheiving the
perceived affordability of a decrease in the purchase cost per unit. Traditional DEA
models could not accommodate such negative outputs. Consequently, strategies such as
loading the inputs or inversing outputs to become inputs, e.g. pollution becomes an input
cost to compensate, were adopted. Undesirable inputs/outputs in variable returns to scale
(VRS) envelopment models have now been developed (Zhu 2003).
DEA purposely identifies the best-practice frontier and performance is measured against
this. It is usual to have more than one DMU on the efficient frontier. If all the efficient
DMUs define the frontier and occupy different positions on it, which is the best of the
efficient DMUs? Fortunately a way of ranking efficient DMUs through a context-
dependent analysis allows a form of first tier, second tier and so on, elimination until the
‘best of the best’ is left.
Congestion in economics refers to situations where reductions in inputs can actually
increase outputs. For example, an oversupply of fertilizer may actually reduce output.
The VRS model can be re-written to account for this and to include the impact of (input)
slack on (input) congestion.
Supply chain efficiencies, in particular those value-adding processes that are available
through an analysis of the total supply chain, have been elusive due to the existence of
multiple and different measures that members of the chain use, and the adversarial nature
of contractual negotiations. Zhu (2003) contends that traditional DEA fails to correctly
131
characterize the performance of the supply chain because the efficient performance of
individual components of the chain may not be correctly identified. He presents models
that can address this.
Non-discretionary inputs and outputs are those situations where exogenously fixed or
non-management-controlled environments impact on possible efficiencies of the DMUs.
Traditional DEA models assume that all inputs and outputs can be varied at the
discretion of management or others, but ‘non-discretionary variables’ not subject to
management control may be significant enough to be included in consideration. These
variables may be as diverse as weather conditions for flying aircraft, the demographics of
a regional customer bases, the age of storage facilities, etc. A mathematical treatment of
the data to minimize the influence of non-discretionary input excesses or output slacks is
possible and has been formulated for CCR and BCC models (Charnes et al. 1994).
4.6 Conclusion
This chapter has demonstrated that DEA is founded on a statistical base which defines
productivity as a measure of efficiency represented by the ratio of inputs to outputs. The
history and development of DEA shows a strong grounding in the study of the
efficiencies represented by these ratios, in organisations which are traditionally not
regarded as profit driven commercial enterprises and so a limited choice of suitable PM
processes. The commercial organisations on the other hand, through their profit
motivated missions, have had a plethora of PM instruments at their disposal.
Nevertheless, the growth in DEA has demonstrated its acceptance as not only an
effective diagnostic tool for non-commercial organizations, but more recently as a
valuable addition to measuring efficiencies and efficiency-like relationships in a variety
of commercial environments.
The production or efficiency frontier displayed by DEA, in so far as it can be displayed
in simple two-dimensional graphical models, shows that there are conditions where the
achievable efficiencies under existing conditions are as good as can be expected, while
maintaining a Pareto optimality.
132
Technical and allocative efficiencies with input and output orientations show how
efficiencies are calculated, and subsequently how inefficiencies can be improved in non-
performing units.
The weighting of factors and its significance was discussed, together with suggestions as
to how this could be addressed in the future. It was also highlighted that this study would
not pursue the course of formulating a strategy for calculating weights since the DEA
algorithm’s assignment of values for these weightings provides a solution that is
regarded as conservative.
DEA is not without weaknesses. These were delineated with suggestions that could help
ameliorate the difficulties they present. Alternatively the strengths of DEA were
highlighted to show why such an optimization technique is appropriate and ideal for any
analysis of efficiencies which represent performance. And, while DEA is not the only
model that is capable of these revelations, it is one that is finding support in areas as
diverse as SCM and CG.
Finally, the DEA application is linked to the study of CG through one of its dimensions –
that of CSR. The CSR study is presented in the next chapter, along with how it was
applied using the successful procedural steps advanced by Golany and Roll in 1989.
133
Chapter 5
DEA of Corporate Governance: The Model and its Application Thus, the task is not so much to see what no one has yet seen,
but to think what nobody has yet thought, about that which
everybody sees.
Edwin Schrodinger 1887-1961
5.1 Introduction
This chapter shows how the DEA model can be applied to that facet of CG known as
CSR through the application of specialized proprietary software used to circumvent
arduous in-depth mathematical computations. The initial discussion focuses on CSR as a
pillar of CG through the stance of ethics and morality in business. The model that is
adopted for CSR is that the company-wide capability for people, processes, and
resources to meet its social obligations to all stakeholders, can be judged as a measure of
corporate citizenship. CSRMC™ (Black 2004) is the framework on which DEA is tested
as a suitable instrument for measuring CSR. This is the ‘DEACSR’ model unique to this
thesis. A series of tests are conducted using the DEA-Solver LV program (Cooper,
Seiford and Tone 2006) to assess its suitability, and once its applicability is justified the
final trials are conducted with the professional program DEA-Solver Pro 4.1 (Appendix
2b). The data used in the final trials are the sanitized scores of the empirical results from
the full cohort of an Australian bank study. The final results are presented for analysis
and discussion in Chapter 6.
CG is a topical subject about organisational stewardship that is vigorously debated in
current academic, business and government forums (Thomsen 2004). Its wide
jurisdiction covering the institutions, laws, rules, policies and procedures governing the
134
operations and running of the company, allows it to be analysed and discussed from
numerous vantages.
CG is also multi-faceted thus allowing it to be studied at different strata and with
restricted foci. It is much touted to underpin organisational competitiveness (Young
2003; Williamson 1988) and success, yet its dialogues are legal, financial, economic or
social, and discussions are usually limited to these singular perspectives. And, while
these dimensions are all contributors to corporate performance, not one of them alone is
influential enough to be a significant gauge of corporate effectiveness, yet each has often
been studied and promoted as if it were. It is intuitively attractive to regard each of these
as indicators of particular aspects of a multi-factorial CG matrix where each factor is
weighted according to its contribution to overall efficiency. To the author’s knowledge
this has not been done before. The potential for a mathematical model to achieve this is
promoted in this thesis with the application of DEA for one dimension of CG, that of
CSR. That is, this thesis investigates the efficiency of CG from the vantage of its CSR
efficacy using DEA as the diagnostic tool. CSR, and its corollary corporate citizenship,
is taken in this thesis as the extent to which the enterprise defines its ethical, legal,
economic and stakeholder responsibilities, and how well it performs against these
standards. The CSR model chosen for this purpose proposes that there are measurable
‘antecedents’ of CSR, displayed through identifiable ‘indicators’, which result in outputs
displayed through ‘consequences’ of CSR. DEA is applied to a database of 231 decision
making units across 39 variables in six business divisions. The procedure pursues five
test runs to validate the model followed by three comprehensive trials to test the primary
data. All trials succeeded in identifying efficient DMUs in each cohort.
5.2 Corporate Social Responsibility
Corporate social responsibility is one of the many dimensions of CG. It describes the
way in which an organisation engages with stakeholders and the environment in which
the firm operates. According to Robert Davies at the World Economic Forum (2004),
CSR has migrated from the philanthropy arena to mainstream and strategic corporate practice
for the most of the successful companies in the financial marketplace.”
135
It is often personified in the label of corporate citizenship which Maignan and Ferrell
(2001) define as “the extent to which businesses assume the economic, legal, ethical, and
discretionary responsibilities imposed on them by their stakeholders” (p. 38).
Basically, the economic responsibilities are those obligations the organisation has to be
productive and meet the expectations of shareholders and investors. The legal
responsibilities are those which allow it to meet its economic mission within the legal
framework that governs it. The ethical responsibility is society’s expectation that it
performs inside established moral standards. Discretionary responsibilities are those that
extend beyond the ones mentioned above and are for the general betterment of society
(Donaldson 2005). These can be seen as a continuum from reactive to proactive
citizenship.
The proactive corporate citizen for example, is dedicated to fair treatment of employees
(O’Sullivan 2003) in economic, ethical, legal and discretionary matters. Economically it
may offer secure employment and competitive rates of pay as well as procedures that
ensure it meets and exceeds contractual obligations (legal citizenship). It may have
work-life-balance programs which encourage family centric initiatives and offer
discretionary benefits such as employee share privileges and other benefits packages. It
goes beyond the minimum expected by all stakeholders (Dean and Clarke 2004).
The reactive corporate citizen on the other hand, is one that would espouse the same
values as above but only on the basis that they ‘make a business case’ and link directly to
the bottom line. It sees citizenship as benevolence equated to profitability plus
compliance plus philanthropy and possibly a piecemeal response to stakeholder demands.
It may give lip service to the ethos of multiple social contracts: between the corporation
and society, and government, and stakeholder groups (Quazi 2003).
The socially responsible corporation is one that displays high levels of social
responsiveness to the demands of its stakeholders and an understanding of them. It
experiences positive consequences as a result.
Lasting relationships with primary stakeholders has been shown to be a major source of
competitive advantage in today’s highly competitive environment (Oketch 2004). In
studies of over 160 organisations with high social responsiveness capabilities, as
136
mentioned earlier, Black (2004) found improvements in business performance, increases
in employee commitment with a greater alignment between employer and employee
values, and an improved perception of the employer by its employees. There was a
reduced intent for employees to resign and a general reduction in conflict with
stakeholders. In her particular study, managers identified benefits as tangible and
intangible. They believed the company benefited tangibly by a greater financial literacy
(for shareholders), improved shareholder value, increased involvement in company
decision making, products developed to customer specifications, reduced conflict, and
increased trust, as well as a likelihood of decreased government regulation and a general
reduction in business risk. This is not in contradiction with features of an advanced
knowledge economy, which would merit its own study. An inclusion in the Dow Jones
Sustainability Index (DJSI) was also welcomed. The intangible benefits were better
organisational identity and reputation, with employee pride and an employer of choice
status, as well as an attractiveness to customers and a learning organisation. She
proposed a model based on the organisation having a cultural mindset reflected in an
antecedent platform which predisposed it to corporate social responsiveness and resulted
in positive consequences. This is represented in Figure 5.1 below.
137
Figure 5.1 Model for CSR (from Black 2004)
The antecedents of CSR in Black’s model emerged out of the perceptions of the culture
within the firm held by internal organisational stakeholders. They viewed the firm as
humanistic and supportive where communications flowed freely and the commitment to
justice and business ethics was displayed by the integration of ethics in business
practices and procedures. Employees felt that they were supported by the organisation.
The consequences of such a culture were beneficial, as explained earlier, and included
low staff turnover, an identification with the organisation which was trustworthy, had a
good public image, and was willing to invest in employees and to communicate with
them openly. In Black’s model these consequences were the behavioural outcomes
identified and measured across the organisational sample, noting that some of these were
internal perceptions of how the organisation fared externally.
There is an organisation theory that explains Black’s observations and aligns well with
the firm she describes. It is OSTS theory, a development from the traditional
sociotechnical systems advanced by the Tavistock Institute, with inclusion of parts of
open systems theory as discussed earlier.
ANTECEDENTS Communication Humanistic org Org support Integrated ethics Justice Commitment to Ethics
Corporate Social
Responsiveness
INDICATORS Stakeholder Identity Stakeholder Management Ethics Atmosphere Ethics Commitment Social Accountability Social reporting Value Attuned Dialogue
CONSEQUENCES Corp image Trust Org commitment Communication openness Turnover Org identification Investment in employees
138
The sociotechnical view of the organisation is one where there are two independent sub-
systems which operate interdependently and reciprocally. The social subsystem
comprises the groupings of individuals in different roles, the knowledge, attitudes,
relationships and authority structures that govern what people do in the organisation. The
technical sub-system comprises the technical mechanisms, including tools, techniques
and technology, which help people do their jobs. These subsystems do not operate in
isolation, an aspect worth noting with regard to CSR.
When Mumford (2003) observes how firms operate she states that “every socio-technical
system is embedded in an environment that affects the way it behaves…[which]…also
includes the environment external to the firm” (p. 23).
This observation is akin to saying that there are stakeholders beyond the firm that have
an interaction with it, and as such this tenet is in parallel with this thesis’ ideas about CG
and organisational performance.
Corporate social responsiveness can be described as the corporate strategy that enables
the company to behave as a corporate citizen and meet its social obligations to all
stakeholders. These capabilities can be measured by a psychometric tool developed and
successfully tested by Black (2004) for this specific purpose. Known as ‘CSR
Management Capacity™’ this system-based diagnostic tool measures 5 dimensions of
social responsiveness embedded in the integrated structural and cultural kernel of the
company. These dimensions are the capabilities displayed in Figure 5.2, represented
below, abbreviated and labelled for the study in Table 5.1, and defined thereafter.
1) Stakeholder engagement:
a. stakeholder identity b. stakeholder management,
2) Ethical business behaviour: a. ethics atmosphere b. ethics commitment,
3) Social accountability:
a. sense of accountability and b. accountability reporting
4) Value attuned communication
5) Dialogue
139
Figure 5.2 Black’s CSRMC Model (2004)
The stakeholder, ethical business and social accountability dimensions each have dual
components providing the separate but important perspectives of the cultural and
structural aspects of the same dimension. Thus, a total of eight indicative factors provide
for a measure of social responsiveness, an indicator of CSR. This is summarised in Table
5.1, together with the labels used in the actual study and discussed later.
Table 5.1 Social Responsiveness Dimensions and Indicators
Dimensions of Social Responsiveness Indicative Factors Factor Label
Stakeholder Identity Stakid Stakeholder Engagement
Stakeholder Management Stakman
Ethics Atmosphere Ethicatm Ethical Business Behaviour
Ethics Commitment Ethiccom
Accountability Sense of Social Accountability Acctyid
Reporting and Verification Acctyrep
Value Attuned Public Relations Value Attuned Valuatt
Dialogue Communication Dialogue
The aggregation of the eight indicative factors of the five dimensional values has been
used to assign a single CSRMC algorithm as an overall performance score.
140
However, the researcher Black notes that these factors have not been subjected8 to any
weightings accorded the importance of the eight different factors.
It is not clear from the studies to date whether each of the capabilities should be weighted
equally…[and]…future research needs to understand how they should be weighted and
what conditions indicate variations in weighting. (Black, 2004 p. 255)
These hierarchical levels of measurement (dimensions converted to indicative factors)
can provide deep levels of analysis of social responsiveness for the various DMUs of the
business but not without some regard for the differences in importance of each factor.
Fortunately, DEA arbitrarily assigns the optimum weighting for each factor if a
researcher is unable or fails to assign such a weighting a priori. In this thesis the DMUs
are individual managerial units across the organisation. The original 243 management
units of Black’s study provided a DEA usable sample of 208 DMUs across 6 business
divisions once corrupt and incomplete data were rejected. An explanation of the
dimensions and their factors follows.
Stakeholder Engagement This dimension gauges the relationship of the firm with its stakeholders, through
stakeholder identity and stakeholder management. One indicative factor is stakeholder
identity which allows the firm to understand the needs of its stakeholders and incorporate
these into the firm’s business decisions, recognising that both their futures are linked.
The firm needs to understand the stakeholder perspective in making decisions.
Stakeholder management relates to how involved and empowered the stakeholders are in
the decision-making process. For example good management skills may prevent
stakeholder ignorance fostering unrealistic expectations.
Ethical Business Behaviour This dimension also has two components, ethics compliance and ethics atmosphere.
Compliance is the conformance to formal systems of reward and punishment used to
reinforce ethical behaviour. Often it is the code of conduct prescribed in some corporate
8 It may be noted that this non-assignment of weighted factors was influential in deciding to use an
aggregated CSRMC score later in this research.
141
compliance handbook. Ethics atmosphere is the degree to which people sincerely care
about the well being of others independent of what the rules say. It is possible that these
two are de-coupled. A code for business ethics may be prescribed but observable
behaviours reveal that interests are self-centred. Such a code of ethics without a
supporting culture is generally ineffective.
Accountability There are two elements to social accountability, the reporting of social impacts by the
company and the sense of social accountability towards stakeholders held by
management. Social reporting is how the firm substantively accounts for its
performances truthfully even when the evidence is not good. Social accountability is the
degree to which managers feel accountable to stakeholders for the firm’s social impacts.
Value Attuned Public Relations This dimension describes the ability of staff at the forefront of public affairs to detect
and transmit value-pertinent information from stakeholders to organisational decision-
makers. Well-developed environmental scanning and issues management skills can help
senior managers recognise stakeholder aspirations and attune with these to achieve a
congruence of corporate and stakeholder values. For example, a firm may symbolically
and substantively authorise the entry of certain values into organisational decision-
making by establishing a CSR committee that reports directly to the Board.
Dialogue Dialogue is how a respectful attitude for stakeholders as equal partners is dealt with in
communications about issues of mutual concern. It is the relationship between
stakeholders and the firm’s staff at the operational business level.
5.3 The DEA of Corporate Social Responsibility
5.3.1 The CSR Database
We take the opportunity presented by Black’s (2004) doctoral research thesis of a large
Australian commercial organisation to test the DEA model. The organisation she studied
was a bank which consistently scored highly on an Australian national Social
Responsibility Index, including several first ‘gold star’ performances. Her objective was
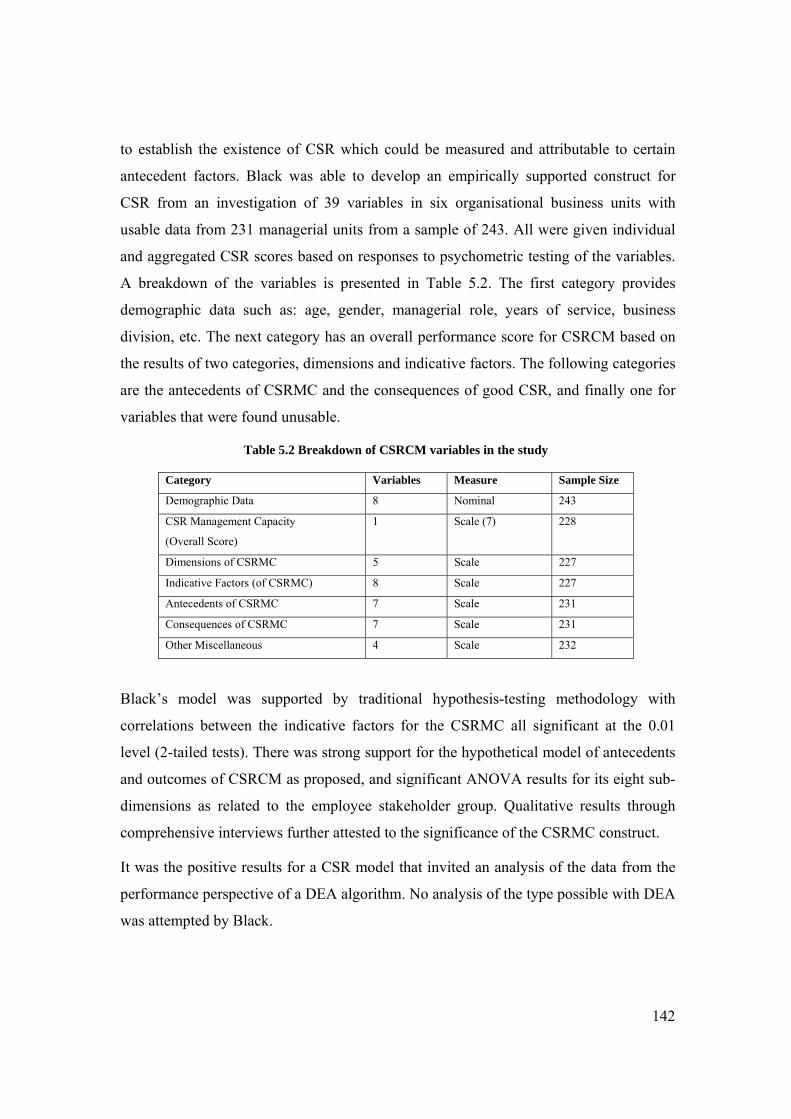
142
to establish the existence of CSR which could be measured and attributable to certain
antecedent factors. Black was able to develop an empirically supported construct for
CSR from an investigation of 39 variables in six organisational business units with
usable data from 231 managerial units from a sample of 243. All were given individual
and aggregated CSR scores based on responses to psychometric testing of the variables.
A breakdown of the variables is presented in Table 5.2. The first category provides
demographic data such as: age, gender, managerial role, years of service, business
division, etc. The next category has an overall performance score for CSRCM based on
the results of two categories, dimensions and indicative factors. The following categories
are the antecedents of CSRMC and the consequences of good CSR, and finally one for
variables that were found unusable.
Table 5.2 Breakdown of CSRCM variables in the study
Category Variables Measure Sample Size
Demographic Data 8 Nominal 243
CSR Management Capacity
(Overall Score)
1 Scale (7) 228
Dimensions of CSRMC 5 Scale 227
Indicative Factors (of CSRMC) 8 Scale 227
Antecedents of CSRMC 7 Scale 231
Consequences of CSRMC 7 Scale 231
Other Miscellaneous 4 Scale 232
Black’s model was supported by traditional hypothesis-testing methodology with
correlations between the indicative factors for the CSRMC all significant at the 0.01
level (2-tailed tests). There was strong support for the hypothetical model of antecedents
and outcomes of CSRCM as proposed, and significant ANOVA results for its eight sub-
dimensions as related to the employee stakeholder group. Qualitative results through
comprehensive interviews further attested to the significance of the CSRMC construct.
It was the positive results for a CSR model that invited an analysis of the data from the
performance perspective of a DEA algorithm. No analysis of the type possible with DEA
was attempted by Black.
143
5.3.2 The DEA Justification
Little seems to have been reported on studies of CG based on a diagnostic tool such as
DEA. Perhaps this is because of the mathematical nature of the operations research based
technique, as explained earlier, or because commercial firms have had CG traditionally
examined from a non-quantifiable perspective. There also may have been little
awareness of a need to use DEA because of its obscurity to researchers in the CG
discipline, or because other established and research-rich investigative frameworks
existed, e.g. board composition, independence and remuneration, stock holding
participants, government, regulatory and other stakeholder influences.
This thesis, however, attempts to legitimize the use of DEA within the firm because of
its attraction as a multi-criteria decision analysis technique with the benefit of weightings
to assign a ranked position to the measured units. Adopting and applying the Golany and
Roll (1989) procedure (see figures 3.3 and 3.4), DEA can perform well in the analysis of
non-commensurate multiple inputs and outputs to give a measure of efficiency which
reflects some aspect of organisational performance. The procedure for DEACSR is:
establish the population of DMUs as managerial units within the organization;
set the goals for analysis as efficiency;
select the number DMUs for comparison (231 from a mail response pool of 245);
define the input and output factors: the antecedent variables and the output the
aggregated CSRMC variable;
examine those factors:
by subjective judgment;
by correlations; and
by trial runs;
formalise the final model;
present initial results;
analyse the factors and individual DMUs; and
144
reach conclusions.
The output-input relationship that subsumes the DEA approach is grounded in the
mathematical ratio form. This allows it to be generalized into a broader multiple criteria
control model by using the Greenberg and Nunamaker (1987) transformation. Here the
output-input factors themselves can be expressions of a ratio form as surrogates for the
(difficult to obtain) exact measures of quantified tangible inputs and outputs. For
example, scores from attitudinal surveys using instruments such as the popular Likert
scale may be used by converting these scores into individual or aggregated ratios. In
effect the supplanting of traditional metrics by surrogate factors expressed in a quantified
form allows an articulation of those indicators that managers consider constitute good
performance. Managers are often able to elicit what factors are contributors to overall
good performance, and to rate these hierarchically but not absolutely. For example, two
managers may score ‘motivation’ differently on some scale say 8/10 and 6/10, yet these
scores are moot if both rate motivation ahead of ‘punctuality’.
Managers also know that some factors have a greater impact on performance than others
but often feel that they are unable to gauge the weightings of importance for these factors.
But:
…ignoring the interrelationships among performance measures and limitations on their
possible combination may result in specification of weights vastly different from those
which would have been specified had these aspects been considered. (Greenberg and
Nunamaker 1987, p. 333)
Since the optimum set of weights can vary depending on a number of issues (even
simple ones such as which measurement scales are used), managers may be unable,
rather than unwilling, to assimilate the information in the specification of weights for
different indicators.
The cognitive complexity of this task, together with managerial inexperience or lack of
data may render it unassailable for these decision makers, and thus the task is not
attempted or attempted rudimentarily.
145
DEA does not require the a priori assignment of relative weights to individual measures
because the technique itself identifies the subset of performances that are Pareto optimal9
and these can be regarded by managers as those performance benchmarks which are
indicators of good performance. Should the current factors not be Pareto optimal, the
model shows where improvement is needed to achieve this condition. The degree of sub-
optimality is also the amount of improvement possible and is referred to as slack,
discussed previously.
This slack is only displayed by a non-efficient DMU. Improvement is possible by
various alternate strategies such as achieving more from the same resources or by
maintaining a stable output and reducing the resources required, and thus removing slack.
DEA will be used to investigate the relationship between inputs and outputs for CSR
where the eight indicative factors of the five dimensions would be considered in the
aggregated CSRMC score as output and the antecedents as input factors. Black’s results
were all expressed as inferential statistics thus allowing the transformation possible by
DEA.
Each of Black’s sample managerial units is regarded as a DMU for the DEA
computation.
5.4 Applying DEA
5.4.1 Pilot Tests and Variable Selection
The original database on an SPSS file was accessed and interpreted. It presented raw
scores for 246 subjects across 39 variables. The variables as labelled on SPSS were
pasted into an Excel spreadsheet and described in detail in Table 5.3.
Table 5.3 Parameters of the CSR variables
Note:. * (O) represents the indicative factors that comprise the CSRMC, **(I) the input factors.
Variable Variable Label Parametric Description
1 Id Identity of sample unit
9 Pareto optimality is a measure of efficiency from game theory where each player’s outcome is optimal with at least one player better, and the outcomes cannot be improved without at least one player becoming worse off.
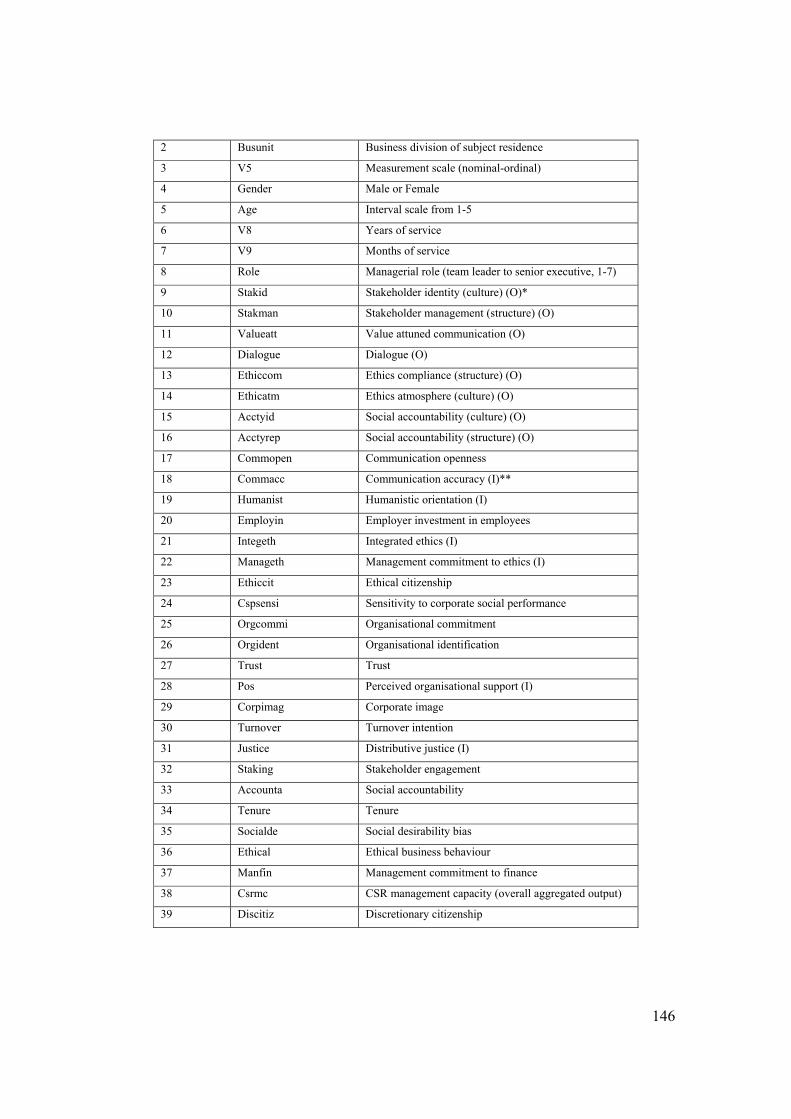
146
2 Busunit Business division of subject residence
3 V5 Measurement scale (nominal-ordinal)
4 Gender Male or Female
5 Age Interval scale from 1-5
6 V8 Years of service
7 V9 Months of service
8 Role Managerial role (team leader to senior executive, 1-7)
9 Stakid Stakeholder identity (culture) (O)*
10 Stakman Stakeholder management (structure) (O)
11 Valueatt Value attuned communication (O)
12 Dialogue Dialogue (O)
13 Ethiccom Ethics compliance (structure) (O)
14 Ethicatm Ethics atmosphere (culture) (O)
15 Acctyid Social accountability (culture) (O)
16 Acctyrep Social accountability (structure) (O)
17 Commopen Communication openness
18 Commacc Communication accuracy (I)**
19 Humanist Humanistic orientation (I)
20 Employin Employer investment in employees
21 Integeth Integrated ethics (I)
22 Manageth Management commitment to ethics (I)
23 Ethiccit Ethical citizenship
24 Cspsensi Sensitivity to corporate social performance
25 Orgcommi Organisational commitment
26 Orgident Organisational identification
27 Trust Trust
28 Pos Perceived organisational support (I)
29 Corpimag Corporate image
30 Turnover Turnover intention
31 Justice Distributive justice (I)
32 Staking Stakeholder engagement
33 Accounta Social accountability
34 Tenure Tenure
35 Socialde Social desirability bias
36 Ethical Ethical business behaviour
37 Manfin Management commitment to finance
38 Csrmc CSR management capacity (overall aggregated output)
39 Discitiz Discretionary citizenship
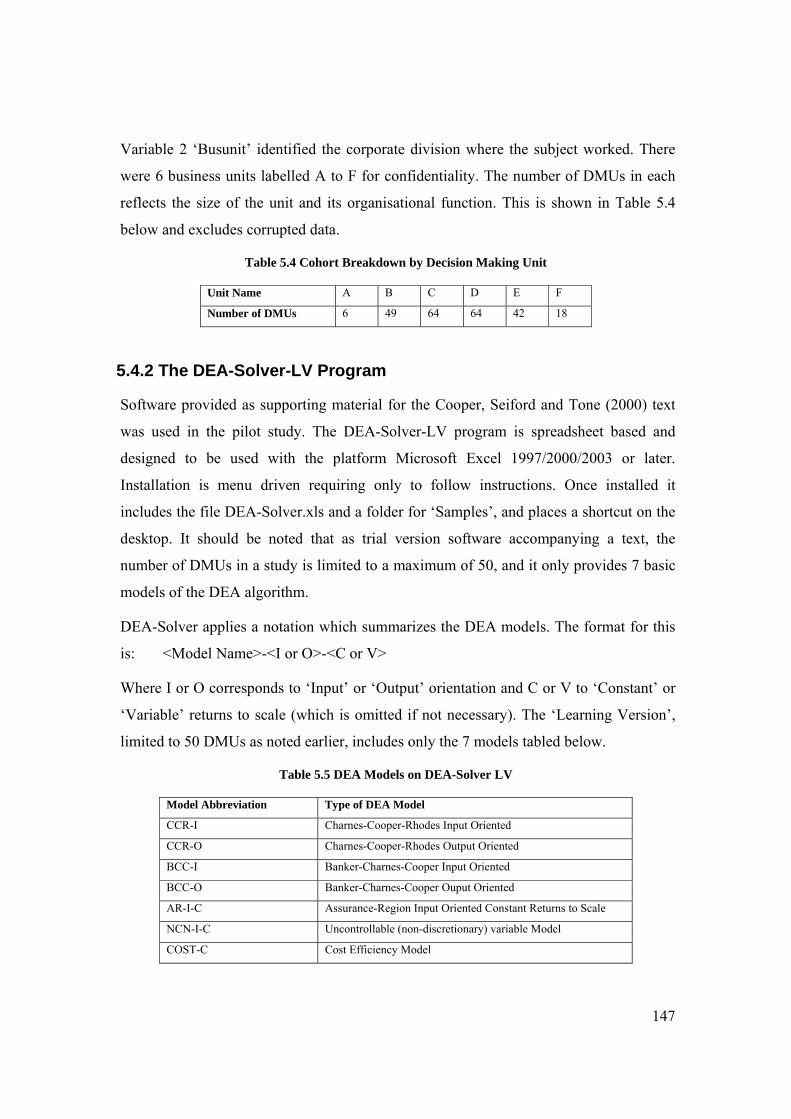
147
Variable 2 ‘Busunit’ identified the corporate division where the subject worked. There
were 6 business units labelled A to F for confidentiality. The number of DMUs in each
reflects the size of the unit and its organisational function. This is shown in Table 5.4
below and excludes corrupted data.
Table 5.4 Cohort Breakdown by Decision Making Unit
Unit Name A B C D E F
Number of DMUs 6 49 64 64 42 18
5.4.2 The DEA-Solver-LV Program
Software provided as supporting material for the Cooper, Seiford and Tone (2000) text
was used in the pilot study. The DEA-Solver-LV program is spreadsheet based and
designed to be used with the platform Microsoft Excel 1997/2000/2003 or later.
Installation is menu driven requiring only to follow instructions. Once installed it
includes the file DEA-Solver.xls and a folder for ‘Samples’, and places a shortcut on the
desktop. It should be noted that as trial version software accompanying a text, the
number of DMUs in a study is limited to a maximum of 50, and it only provides 7 basic
models of the DEA algorithm.
DEA-Solver applies a notation which summarizes the DEA models. The format for this
is: <Model Name>-<I or O>-<C or V>
Where I or O corresponds to ‘Input’ or ‘Output’ orientation and C or V to ‘Constant’ or
‘Variable’ returns to scale (which is omitted if not necessary). The ‘Learning Version’,
limited to 50 DMUs as noted earlier, includes only the 7 models tabled below.
Table 5.5 DEA Models on DEA-Solver LV
Model Abbreviation Type of DEA Model
CCR-I Charnes-Cooper-Rhodes Input Oriented
CCR-O Charnes-Cooper-Rhodes Output Oriented
BCC-I Banker-Charnes-Cooper Input Oriented
BCC-O Banker-Charnes-Cooper Ouput Oriented
AR-I-C Assurance-Region Input Oriented Constant Returns to Scale
NCN-I-C Uncontrollable (non-discretionary) variable Model
COST-C Cost Efficiency Model
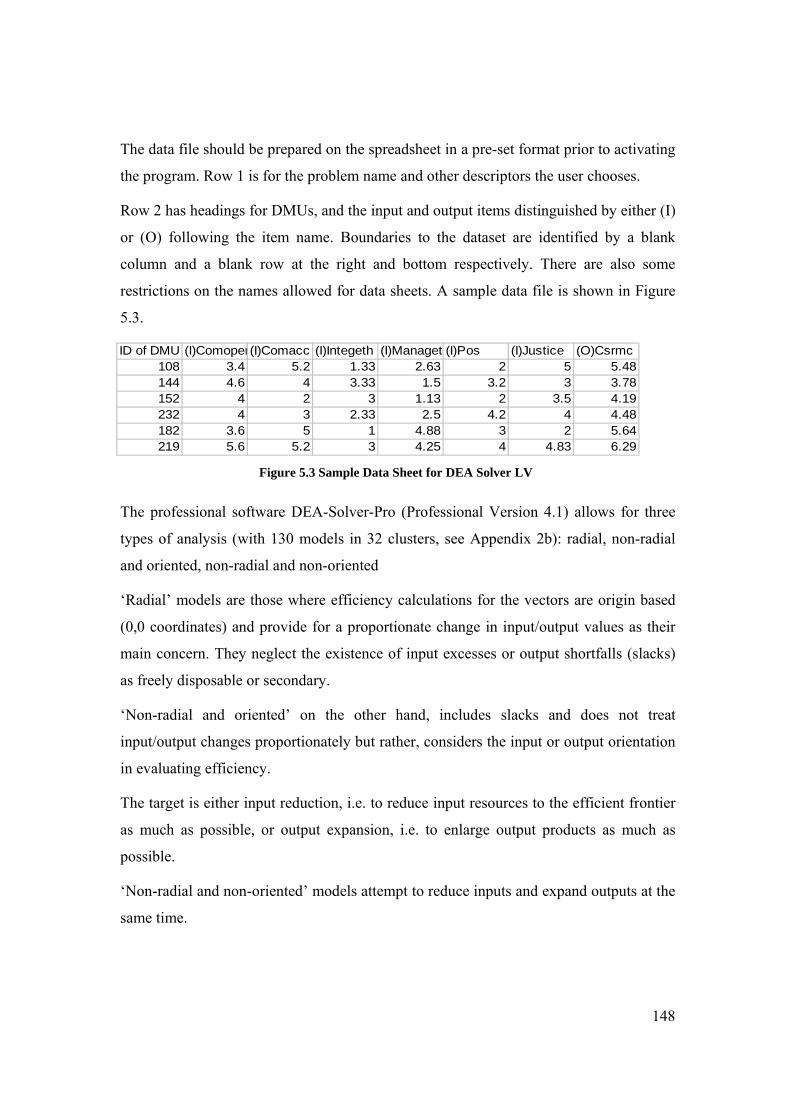
148
The data file should be prepared on the spreadsheet in a pre-set format prior to activating
the program. Row 1 is for the problem name and other descriptors the user chooses.
Row 2 has headings for DMUs, and the input and output items distinguished by either (I)
or (O) following the item name. Boundaries to the dataset are identified by a blank
column and a blank row at the right and bottom respectively. There are also some
restrictions on the names allowed for data sheets. A sample data file is shown in Figure
5.3.
ID of DMU (I)Comopen(I)Comacc (I)Integeth (I)Managet (I)Pos (I)Justice (O)Csrmc108 3.4 5.2 1.33 2.63 2 5 5.48144 4.6 4 3.33 1.5 3.2 3 3.78152 4 2 3 1.13 2 3.5 4.19232 4 3 2.33 2.5 4.2 4 4.48182 3.6 5 1 4.88 3 2 5.64219 5.6 5.2 3 4.25 4 4.83 6.29
Figure 5.3 Sample Data Sheet for DEA Solver LV
The professional software DEA-Solver-Pro (Professional Version 4.1) allows for three
types of analysis (with 130 models in 32 clusters, see Appendix 2b): radial, non-radial
and oriented, non-radial and non-oriented
‘Radial’ models are those where efficiency calculations for the vectors are origin based
(0,0 coordinates) and provide for a proportionate change in input/output values as their
main concern. They neglect the existence of input excesses or output shortfalls (slacks)
as freely disposable or secondary.
‘Non-radial and oriented’ on the other hand, includes slacks and does not treat
input/output changes proportionately but rather, considers the input or output orientation
in evaluating efficiency.
The target is either input reduction, i.e. to reduce input resources to the efficient frontier
as much as possible, or output expansion, i.e. to enlarge output products as much as
possible.
‘Non-radial and non-oriented’ models attempt to reduce inputs and expand outputs at the
same time.
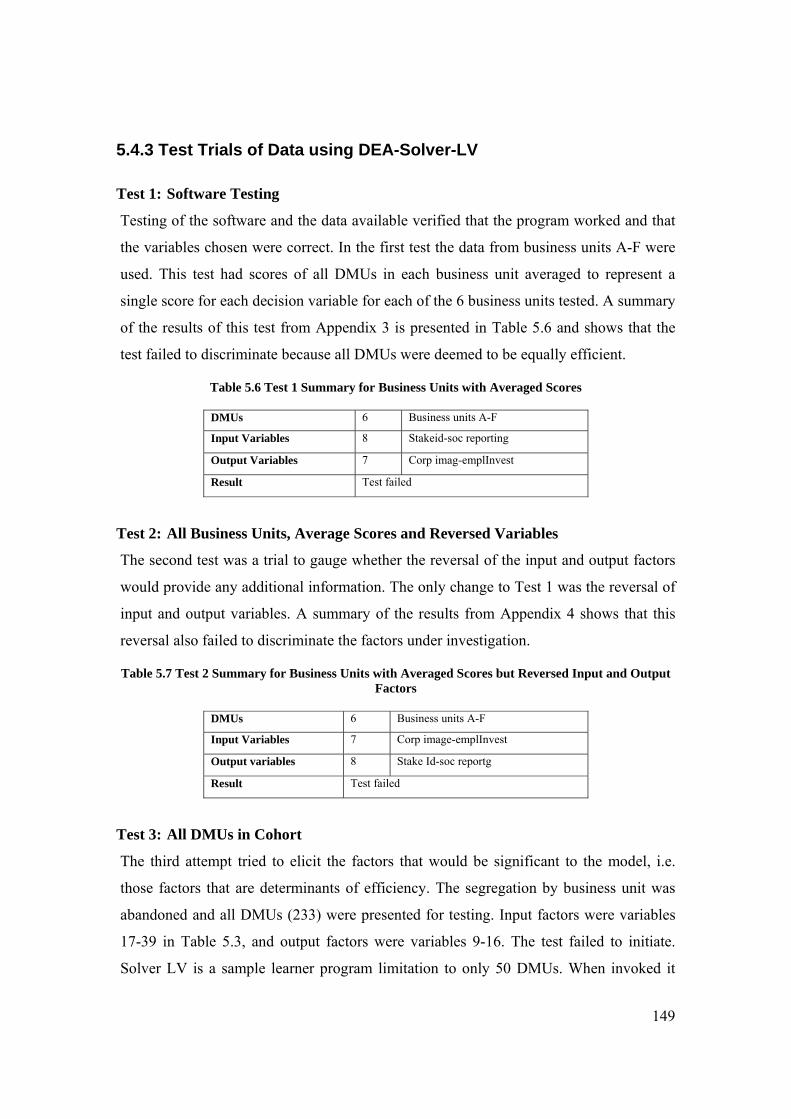
149
5.4.3 Test Trials of Data using DEA-Solver-LV
Test 1: Software Testing
Testing of the software and the data available verified that the program worked and that
the variables chosen were correct. In the first test the data from business units A-F were
used. This test had scores of all DMUs in each business unit averaged to represent a
single score for each decision variable for each of the 6 business units tested. A summary
of the results of this test from Appendix 3 is presented in Table 5.6 and shows that the
test failed to discriminate because all DMUs were deemed to be equally efficient.
Table 5.6 Test 1 Summary for Business Units with Averaged Scores
DMUs 6 Business units A-F
Input Variables 8 Stakeid-soc reporting
Output Variables 7 Corp imag-emplInvest
Result Test failed
Test 2: All Business Units, Average Scores and Reversed Variables
The second test was a trial to gauge whether the reversal of the input and output factors
would provide any additional information. The only change to Test 1 was the reversal of
input and output variables. A summary of the results from Appendix 4 shows that this
reversal also failed to discriminate the factors under investigation.
Table 5.7 Test 2 Summary for Business Units with Averaged Scores but Reversed Input and Output Factors
DMUs 6 Business units A-F
Input Variables 7 Corp image-emplInvest
Output variables 8 Stake Id-soc reportg
Result Test failed
Test 3: All DMUs in Cohort
The third attempt tried to elicit the factors that would be significant to the model, i.e.
those factors that are determinants of efficiency. The segregation by business unit was
abandoned and all DMUs (233) were presented for testing. Input factors were variables
17-39 in Table 5.3, and output factors were variables 9-16. The test failed to initiate.
Solver LV is a sample learner program limitation to only 50 DMUs. When invoked it
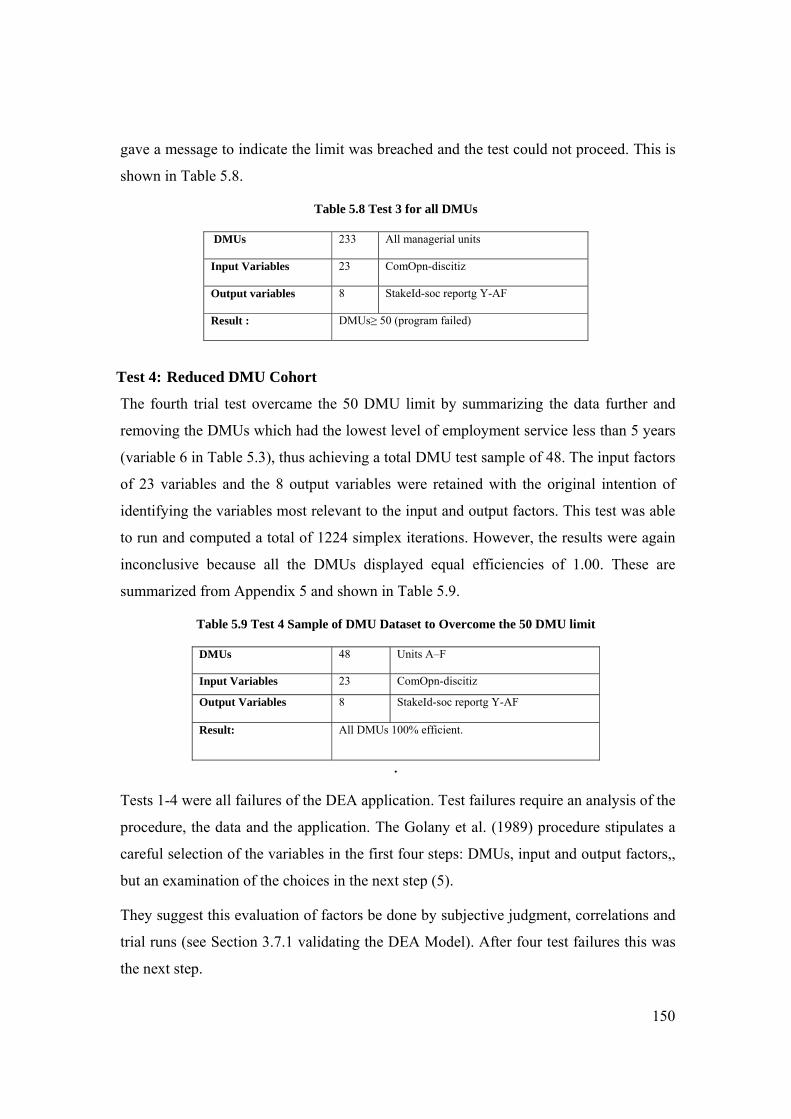
150
gave a message to indicate the limit was breached and the test could not proceed. This is
shown in Table 5.8.
Table 5.8 Test 3 for all DMUs
DMUs 233 All managerial units
Input Variables 23 ComOpn-discitiz
Output variables 8 StakeId-soc reportg Y-AF
Result : DMUs≥ 50 (program failed)
Test 4: Reduced DMU Cohort
The fourth trial test overcame the 50 DMU limit by summarizing the data further and
removing the DMUs which had the lowest level of employment service less than 5 years
(variable 6 in Table 5.3), thus achieving a total DMU test sample of 48. The input factors
of 23 variables and the 8 output variables were retained with the original intention of
identifying the variables most relevant to the input and output factors. This test was able
to run and computed a total of 1224 simplex iterations. However, the results were again
inconclusive because all the DMUs displayed equal efficiencies of 1.00. These are
summarized from Appendix 5 and shown in Table 5.9.
Table 5.9 Test 4 Sample of DMU Dataset to Overcome the 50 DMU limit
DMUs 48 Units A–F
Input Variables 23 ComOpn-discitiz
Output Variables 8 StakeId-soc reportg Y-AF
Result: All DMUs 100% efficient.
.
Tests 1-4 were all failures of the DEA application. Test failures require an analysis of the
procedure, the data and the application. The Golany et al. (1989) procedure stipulates a
careful selection of the variables in the first four steps: DMUs, input and output factors,,
but an examination of the choices in the next step (5).
They suggest this evaluation of factors be done by subjective judgment, correlations and
trial runs (see Section 3.7.1 validating the DEA Model). After four test failures this was
the next step.
151
Test 5: One CSRMC Output Variable and Six Antecedent Variables
The analysis of the four trial-runs shown in tests 1-4 above and a reassessment of the
data available suggests that the chosen DMUs are still appropriate but that input and
output factors may have been mismatched. It was decided that the appropriate output
factor should be the value expressed by Black’s aggregated score for the CSRMC
variable (shown as variable 38 in Table 5.1). The input factors should be those variables
seen as precursors to CSR and later discussed as the 6 antecedents. Those selected were
the two communication, two ethics and the organisational support and justice variables
(shown as numbers 18, 19, 21, 22, 28, 31 in Table 5.1) and identified by the notation (I).
To overcome the limitation on the number of DMUs allowable under the DEA-Solver-
LV program it was further decided that the DEA iterations would be conducted in two
phases with two models as follows.
The whole cohort was to be tested but using the minimum, average and maximum scores
for each decision variable of the DMUs in each business unit. This meant that every
business unit (6) had three values, thus a total cohort of 18 DMUs were able to be run in
the program (Appendix 6).
The whole cohort was to be tested iteratively by separate business units rather than the
whole organisation. To ensure that the number of DMUs per business unit were
acceptable at less than 50, units C and D which had 64 DMUs were trimmed to 49 and
48 by excluding DMUs which had a service history of less than five years (Appendix 7).
The two tests above were conducted for the CCR-I and CCR-O models of DEA-Solver.
Both models in both phases worked equally well in that input CCR-I or output CCR-O
orientations made no difference. Phases one and two also revealed efficient and non-
efficient DMUs. Test 5 was thus successful in showing the program worked and was
able to discriminate between efficiencies of DMUs.
The summarized results of Phase 1 from Appendix 6 are shown in Table 5.10a and those
for Phase 2 from Appendix 7 in Table 5.10b.
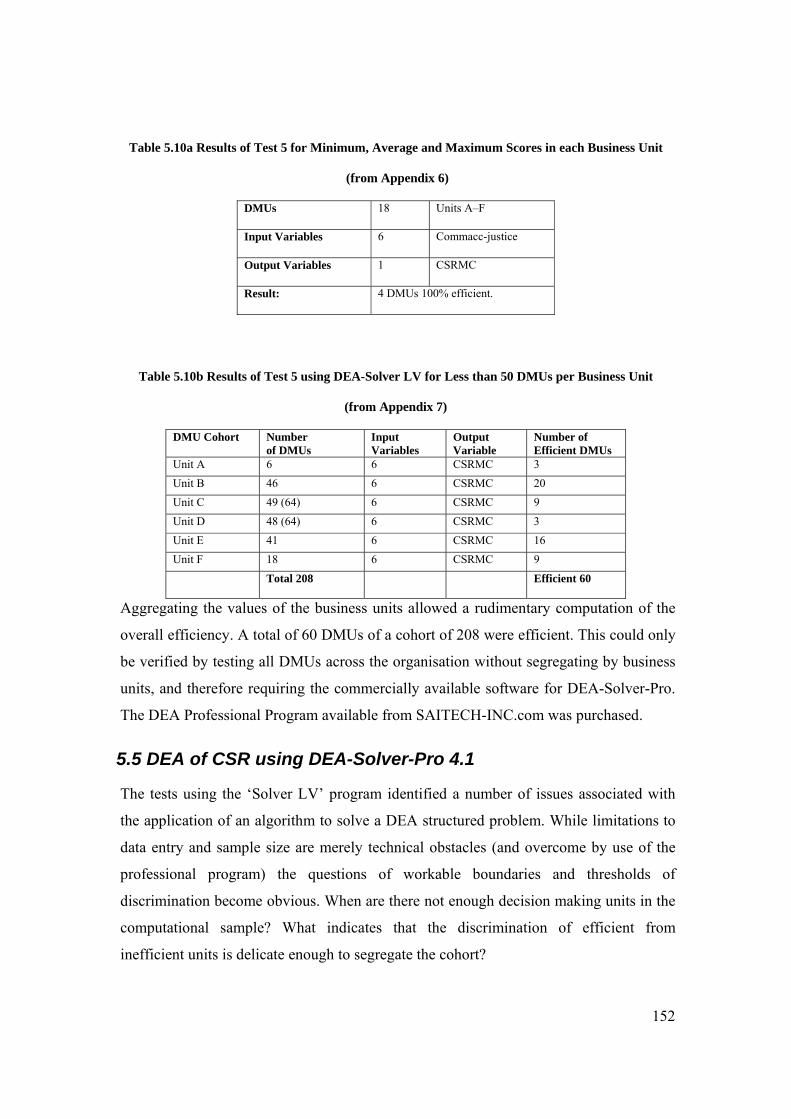
152
Table 5.10a Results of Test 5 for Minimum, Average and Maximum Scores in each Business Unit
(from Appendix 6)
DMUs 18 Units A–F
Input Variables 6 Commacc-justice
Output Variables 1 CSRMC
Result: 4 DMUs 100% efficient.
Table 5.10b Results of Test 5 using DEA-Solver LV for Less than 50 DMUs per Business Unit
(from Appendix 7)
DMU Cohort Number of DMUs
Input Variables
Output Variable
Number of Efficient DMUs
Unit A 6 6 CSRMC 3 Unit B 46 6 CSRMC 20 Unit C 49 (64) 6 CSRMC 9 Unit D 48 (64) 6 CSRMC 3 Unit E 41 6 CSRMC 16 Unit F 18 6 CSRMC 9 Total 208 Efficient 60
Aggregating the values of the business units allowed a rudimentary computation of the
overall efficiency. A total of 60 DMUs of a cohort of 208 were efficient. This could only
be verified by testing all DMUs across the organisation without segregating by business
units, and therefore requiring the commercially available software for DEA-Solver-Pro.
The DEA Professional Program available from SAITECH-INC.com was purchased.
5.5 DEA of CSR using DEA-Solver-Pro 4.1
The tests using the ‘Solver LV’ program identified a number of issues associated with
the application of an algorithm to solve a DEA structured problem. While limitations to
data entry and sample size are merely technical obstacles (and overcome by use of the
professional program) the questions of workable boundaries and thresholds of
discrimination become obvious. When are there not enough decision making units in the
computational sample? What indicates that the discrimination of efficient from
inefficient units is delicate enough to segregate the cohort?
153
Cooper et al. (2006) suggest rules of thumb as guidelines for the DEA model to work
successfully. There are three: R1, R2, and R3.
R1: The sample size should be greater than the product of inputs and outputs
otherwise the model loses its discretionary power:
Ss ≥ I*O
R2: The sample size should be greater than or equal to three times the sum of input
and output factors:
Ss ≥ 3(I+O)
R3: The one third rule suggests that the sample size is acceptable if the number
of fully efficient DMUs is not greater than one-third the sample size:
Eff DMUs ≤ 1/3*Ss
Ramanathan (2003) also supports the first two rules but is more lenient with R2 saying
that the sample should be greater by 2 or 3 times the summation. These heuristics would
be used in trials that were now possible with the professional program DEA–Solver-Pro
4.1.
Trial 1 presented the opportunity to test all 231 DMUs unhampered by learning program
limits. It considered the inputs to be the 6 antecedents to CSRMC as defined by Black,
and the outputs to be the aggregated value of the indicative factors that comprise the
CSRMC.
The 6 antecedents were:
1) communication accuracy: honest, accurate and understandable communication;
2) humanistic orientation: where the organisation is managed in a participative
manner and people support one another;
3) integrated ethics: by incorporating ethics into everyday practices and assessed in
individual performances;
4) management commitment to ethics: talking and demonstrating ethics for the good
of the company and society;
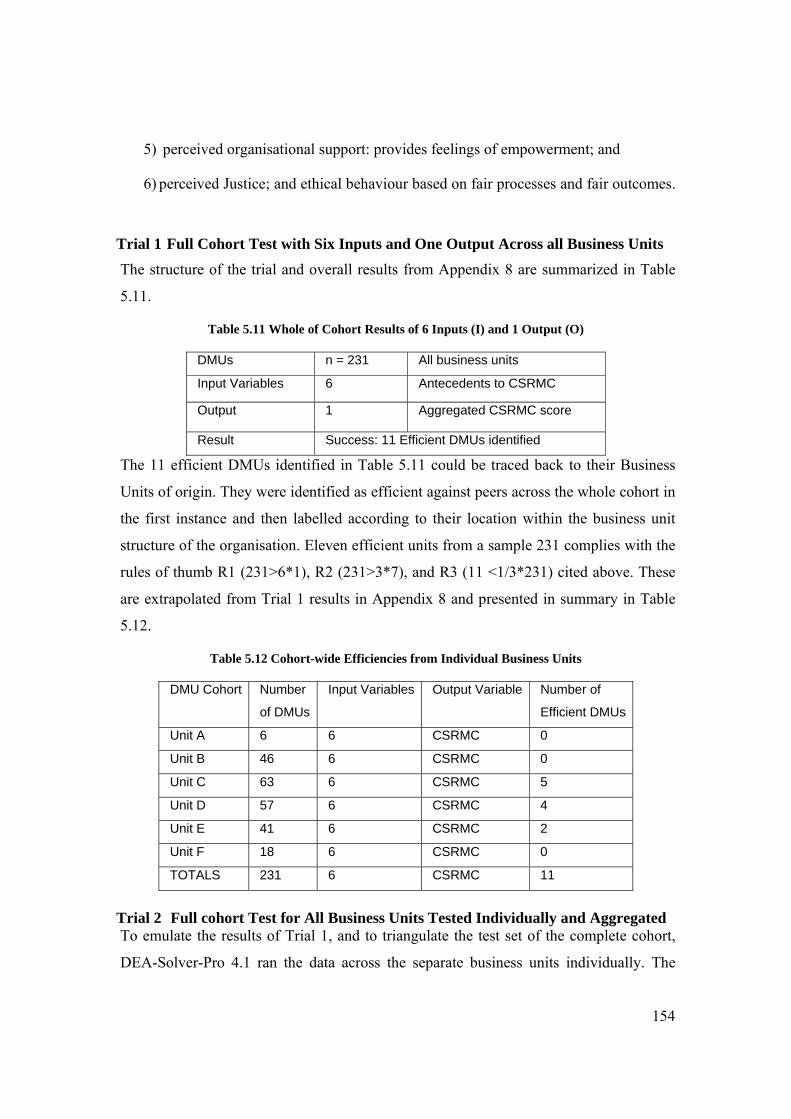
154
5) perceived organisational support: provides feelings of empowerment; and
6) perceived Justice; and ethical behaviour based on fair processes and fair outcomes.
Trial 1 Full Cohort Test with Six Inputs and One Output Across all Business Units
The structure of the trial and overall results from Appendix 8 are summarized in Table
5.11.
Table 5.11 Whole of Cohort Results of 6 Inputs (I) and 1 Output (O)
DMUs n = 231 All business units
Input Variables 6 Antecedents to CSRMC
Output 1 Aggregated CSRMC score
Result Success: 11 Efficient DMUs identified
The 11 efficient DMUs identified in Table 5.11 could be traced back to their Business
Units of origin. They were identified as efficient against peers across the whole cohort in
the first instance and then labelled according to their location within the business unit
structure of the organisation. Eleven efficient units from a sample 231 complies with the
rules of thumb R1 (231>6*1), R2 (231>3*7), and R3 (11 <1/3*231) cited above. These
are extrapolated from Trial 1 results in Appendix 8 and presented in summary in Table
5.12.
Table 5.12 Cohort-wide Efficiencies from Individual Business Units
DMU Cohort Number
of DMUs
Input Variables Output Variable Number of
Efficient DMUs
Unit A 6 6 CSRMC 0
Unit B 46 6 CSRMC 0
Unit C 63 6 CSRMC 5
Unit D 57 6 CSRMC 4
Unit E 41 6 CSRMC 2
Unit F 18 6 CSRMC 0
TOTALS 231 6 CSRMC 11
Trial 2 Full cohort Test for All Business Units Tested Individually and Aggregated To emulate the results of Trial 1, and to triangulate the test set of the complete cohort,
DEA-Solver-Pro 4.1 ran the data across the separate business units individually. The
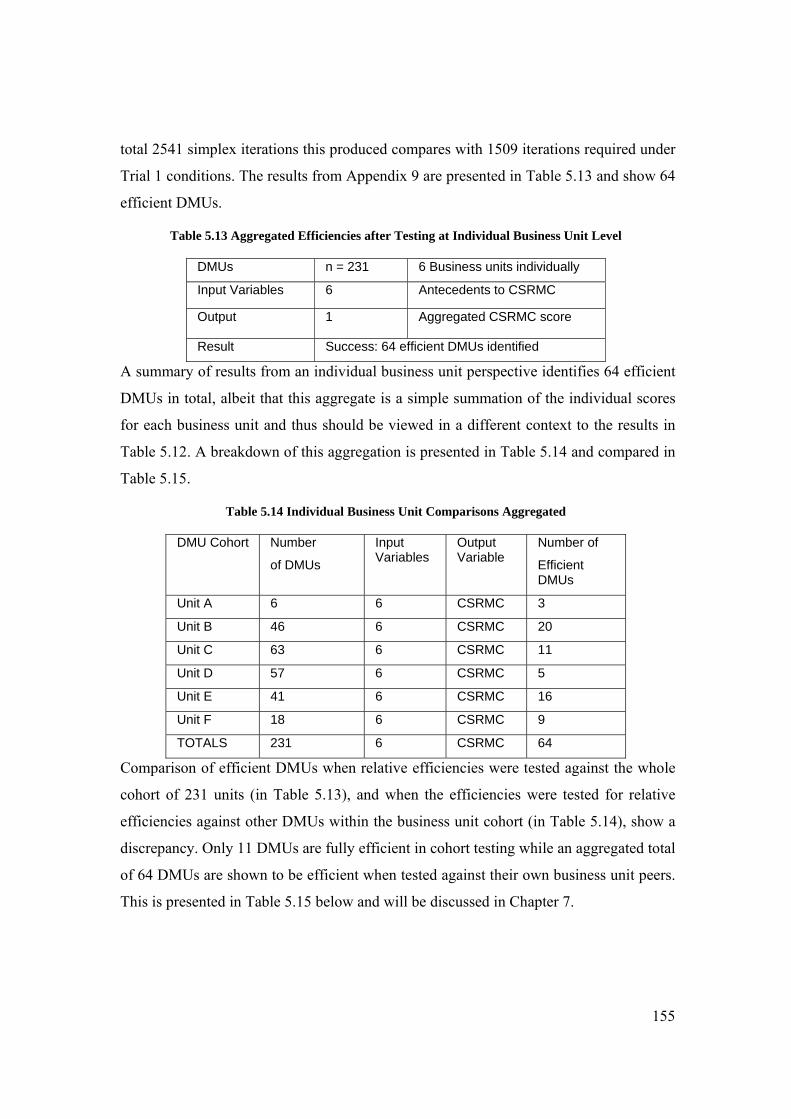
155
total 2541 simplex iterations this produced compares with 1509 iterations required under
Trial 1 conditions. The results from Appendix 9 are presented in Table 5.13 and show 64
efficient DMUs.
Table 5.13 Aggregated Efficiencies after Testing at Individual Business Unit Level
DMUs n = 231 6 Business units individually
Input Variables 6 Antecedents to CSRMC
Output 1 Aggregated CSRMC score
Result Success: 64 efficient DMUs identified
A summary of results from an individual business unit perspective identifies 64 efficient
DMUs in total, albeit that this aggregate is a simple summation of the individual scores
for each business unit and thus should be viewed in a different context to the results in
Table 5.12. A breakdown of this aggregation is presented in Table 5.14 and compared in
Table 5.15.
Table 5.14 Individual Business Unit Comparisons Aggregated
DMU Cohort Number
of DMUs
Input Variables
Output Variable
Number of
Efficient DMUs
Unit A 6 6 CSRMC 3
Unit B 46 6 CSRMC 20
Unit C 63 6 CSRMC 11
Unit D 57 6 CSRMC 5
Unit E 41 6 CSRMC 16
Unit F 18 6 CSRMC 9
TOTALS 231 6 CSRMC 64
Comparison of efficient DMUs when relative efficiencies were tested against the whole
cohort of 231 units (in Table 5.13), and when the efficiencies were tested for relative
efficiencies against other DMUs within the business unit cohort (in Table 5.14), show a
discrepancy. Only 11 DMUs are fully efficient in cohort testing while an aggregated total
of 64 DMUs are shown to be efficient when tested against their own business unit peers.
This is presented in Table 5.15 below and will be discussed in Chapter 7.
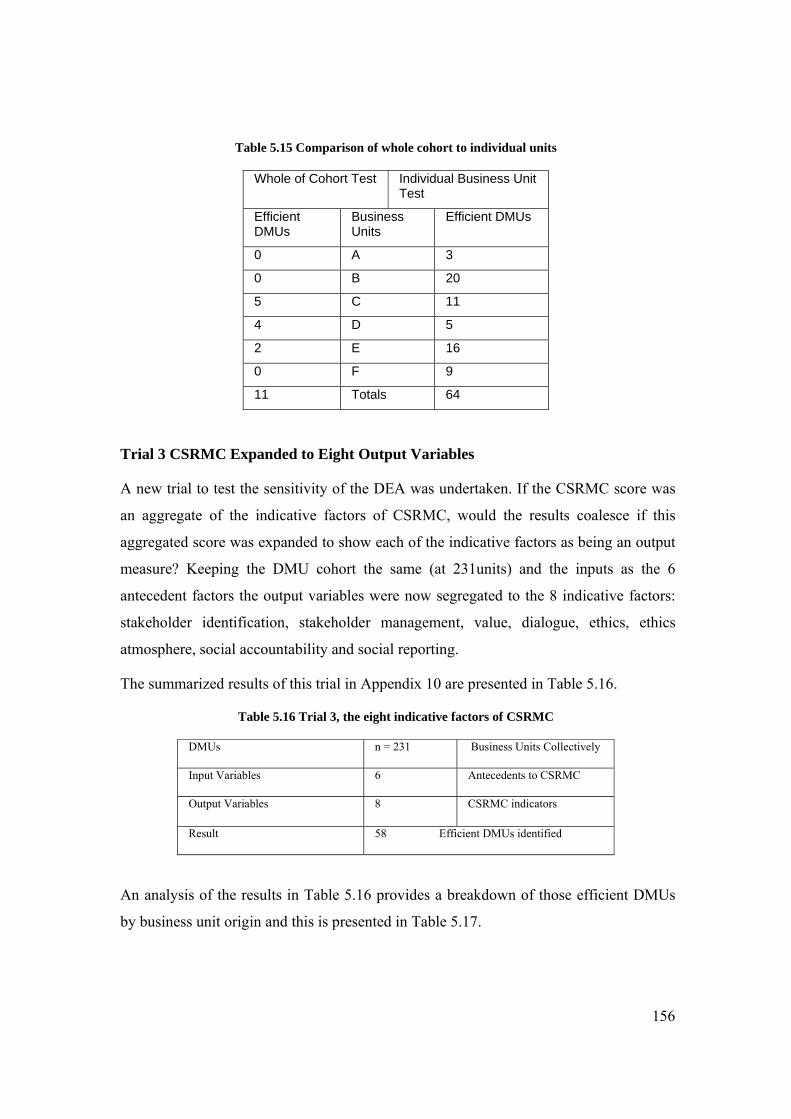
156
Table 5.15 Comparison of whole cohort to individual units
Whole of Cohort Test Individual Business Unit Test
Efficient DMUs
Business Units
Efficient DMUs
0 A 3
0 B 20
5 C 11
4 D 5
2 E 16
0 F 9
11 Totals 64
Trial 3 CSRMC Expanded to Eight Output Variables
A new trial to test the sensitivity of the DEA was undertaken. If the CSRMC score was
an aggregate of the indicative factors of CSRMC, would the results coalesce if this
aggregated score was expanded to show each of the indicative factors as being an output
measure? Keeping the DMU cohort the same (at 231units) and the inputs as the 6
antecedent factors the output variables were now segregated to the 8 indicative factors:
stakeholder identification, stakeholder management, value, dialogue, ethics, ethics
atmosphere, social accountability and social reporting.
The summarized results of this trial in Appendix 10 are presented in Table 5.16.
Table 5.16 Trial 3, the eight indicative factors of CSRMC
DMUs n = 231 Business Units Collectively
Input Variables 6 Antecedents to CSRMC
Output Variables 8 CSRMC indicators
Result 58 Efficient DMUs identified
An analysis of the results in Table 5.16 provides a breakdown of those efficient DMUs
by business unit origin and this is presented in Table 5.17.
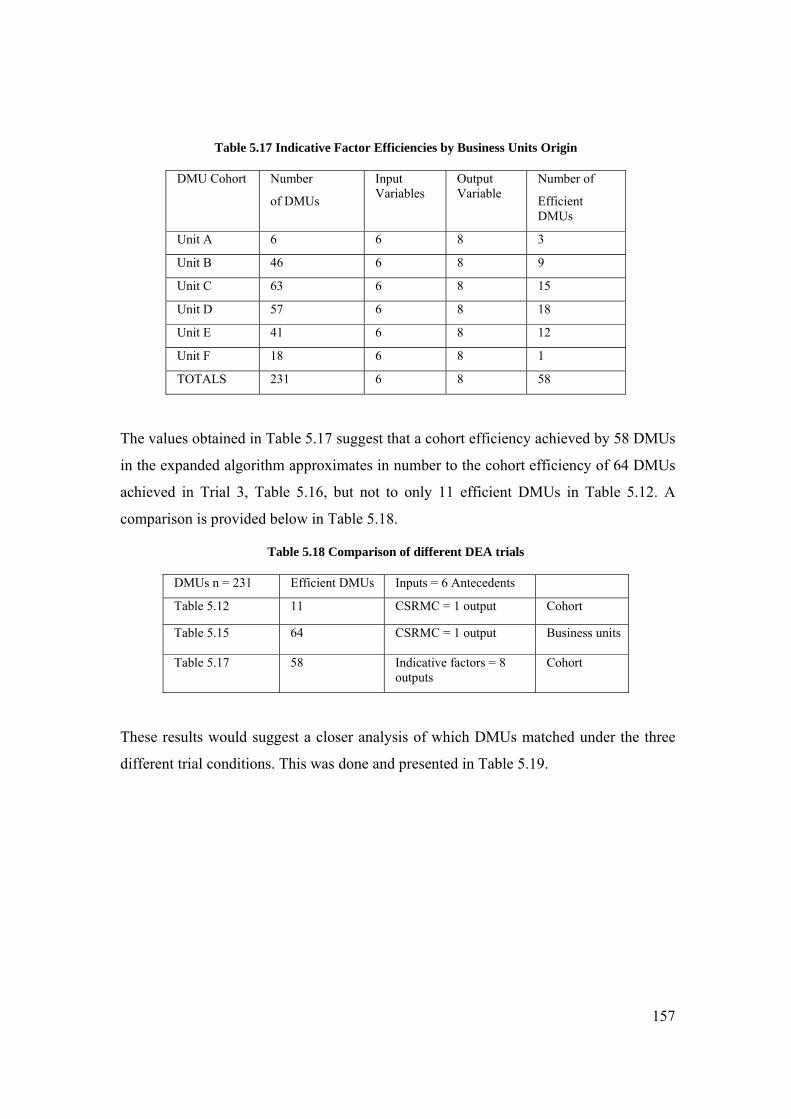
157
Table 5.17 Indicative Factor Efficiencies by Business Units Origin
DMU Cohort Number
of DMUs
Input Variables
Output Variable
Number of
Efficient DMUs
Unit A 6 6 8 3
Unit B 46 6 8 9
Unit C 63 6 8 15
Unit D 57 6 8 18
Unit E 41 6 8 12
Unit F 18 6 8 1
TOTALS 231 6 8 58
The values obtained in Table 5.17 suggest that a cohort efficiency achieved by 58 DMUs
in the expanded algorithm approximates in number to the cohort efficiency of 64 DMUs
achieved in Trial 3, Table 5.16, but not to only 11 efficient DMUs in Table 5.12. A
comparison is provided below in Table 5.18.
Table 5.18 Comparison of different DEA trials
DMUs n = 231 Efficient DMUs Inputs = 6 Antecedents
Table 5.12 11 CSRMC = 1 output Cohort
Table 5.15 64 CSRMC = 1 output Business units
Table 5.17 58 Indicative factors = 8 outputs
Cohort
These results would suggest a closer analysis of which DMUs matched under the three
different trial conditions. This was done and presented in Table 5.19.
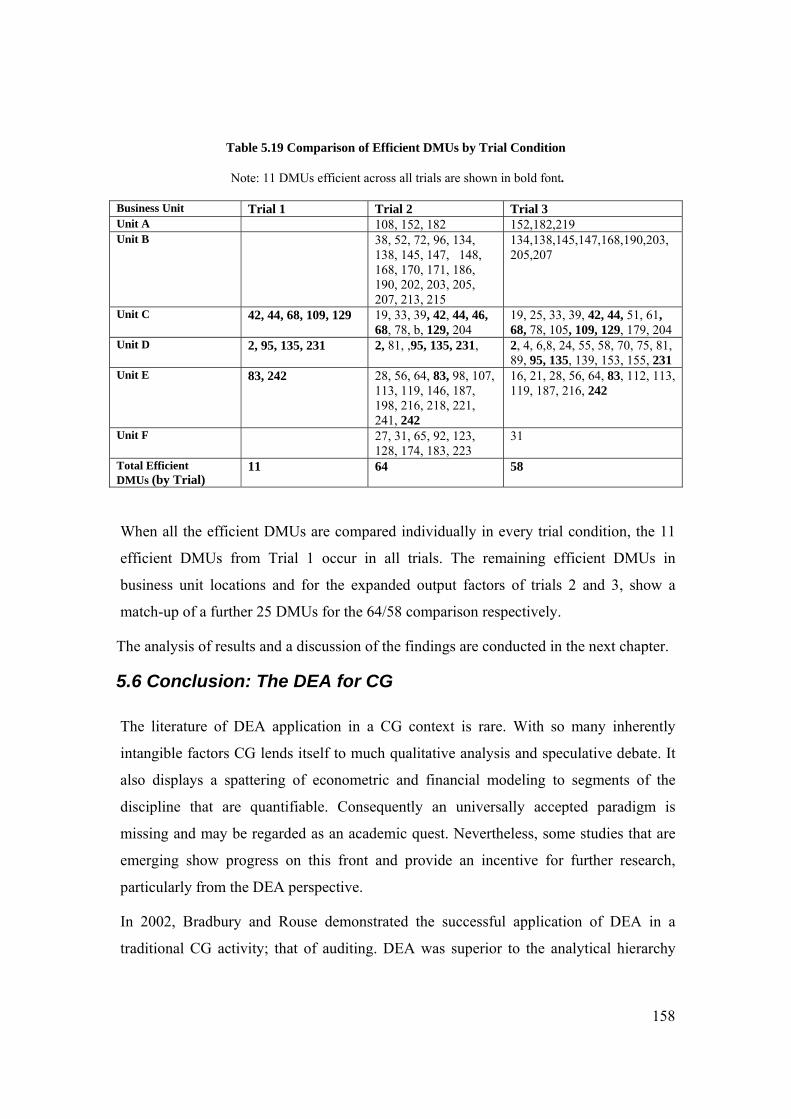
158
Table 5.19 Comparison of Efficient DMUs by Trial Condition
Note: 11 DMUs efficient across all trials are shown in bold font.
Business Unit Trial 1 Trial 2 Trial 3 Unit A 108, 152, 182 152,182,219 Unit B 38, 52, 72, 96, 134,
138, 145, 147, 148, 168, 170, 171, 186, 190, 202, 203, 205, 207, 213, 215
134,138,145,147,168,190,203, 205,207
Unit C 42, 44, 68, 109, 129 19, 33, 39, 42, 44, 46, 68, 78, b, 129, 204
19, 25, 33, 39, 42, 44, 51, 61, 68, 78, 105, 109, 129, 179, 204
Unit D 2, 95, 135, 231 2, 81, ,95, 135, 231, 2, 4, 6,8, 24, 55, 58, 70, 75, 81, 89, 95, 135, 139, 153, 155, 231
Unit E 83, 242 28, 56, 64, 83, 98, 107, 113, 119, 146, 187, 198, 216, 218, 221, 241, 242
16, 21, 28, 56, 64, 83, 112, 113, 119, 187, 216, 242
Unit F 27, 31, 65, 92, 123, 128, 174, 183, 223
31
Total Efficient DMUs (by Trial)
11 64 58
When all the efficient DMUs are compared individually in every trial condition, the 11
efficient DMUs from Trial 1 occur in all trials. The remaining efficient DMUs in
business unit locations and for the expanded output factors of trials 2 and 3, show a
match-up of a further 25 DMUs for the 64/58 comparison respectively.
The analysis of results and a discussion of the findings are conducted in the next chapter.
5.6 Conclusion: The DEA for CG
The literature of DEA application in a CG context is rare. With so many inherently
intangible factors CG lends itself to much qualitative analysis and speculative debate. It
also displays a spattering of econometric and financial modeling to segments of the
discipline that are quantifiable. Consequently an universally accepted paradigm is
missing and may be regarded as an academic quest. Nevertheless, some studies that are
emerging show progress on this front and provide an incentive for further research,
particularly from the DEA perspective.
In 2002, Bradbury and Rouse demonstrated the successful application of DEA in a
traditional CG activity; that of auditing. DEA was superior to the analytical hierarchy
159
process in weighting the audit risk factors when planning an audit process. The
analytical hierarchy was discussed in Chapter 4. It used the individual evaluation of risk
factors by separate auditors, who rated each of the six factors; size, control, change,
environment, pressure and scope, on a scale of 1-5 according to their own perceptions of
audit risk. The median ratings from all auditors on the six risk factors were then used as
the input values for the DEA computation. The audit risk index provided by DEA
resulted in a “more representative view of the audit experts’ opinions” (p. 274) and
subsequently a better performance in the preparation of an audit process.
In a working paper on preferred policy portfolios Bosetti and Buchner (2005)
demonstrated the usefulness of two DEA analyses in assessing the relative efficiency of
alternate policies (on global warming). The first application was coupled to a cost benefit
analysis while the next computed social and environmental benefits. Together these
presented agreed future implications of alternate policies and provided a basis for sound
decision-making.
Bosetti and Buchner contend that DEA demonstrates its utility as a decision enhancing
tool and one that is flexible enough to be adopted in policy design and evaluation. From
a CG perspective this study illustrates how DEA could be used as a template for policy
formulation. For example, in evaluating the impact and suitability of a particular CSR
policy the organisation could find value in using DEA as the diagnostic tool.
This chapter applied the DEA algorithm to CSR as measured by the CSRMC construct.
A series of trials testing the model and the correct input and output factors were
conducted following the procedure established by Goleny and Roll (1989) and to the
rules suggested by Cooper, Seiford and Tone (2006). The failures in the initial test-trials
provided direction for the selection of the correct model and decision variables, as well
as the choice and number of input and output factors to be analysed. This was done and
final trials were successful in discriminating efficient from non-efficient DMUs in all
cases. These findings are discussed in the context of their application to CG in particular,
and to their significance in the supply network in general, which is done in Chapter 7.
The general conclusion however, supports the applicability of DEA as a diagnostic tool
which identifies those business entities within the organisation which are efficient
160
exponents of the CSR component of the CG policy of the Australian bank investigated.
This is in accord with its consistent high performance and premier achievement on other
measures, such as the corporate responsibility index (CRI 2004, 2005, 2006 and 2007),
published annually in Australia by The Age and Sydney Morning Herald newspapers for
the St James Ethics Centre.
The next chapter analyses the results presented in terms of the application of the DEA
algorithm to the construct of CSR. It diagnoses the findings simply from the perspective
of how successful the linear programming was in identifying efficient DMUs, inefficient
DMUs and those that may exhibit efficiency under certain conditions. It then presents
correlation data to support the factors chosen and used to measure CSR.
161
Chapter 6
Results and Validation of DEA Application to Corporate Social Responsibility Not everything that counts, can be counted, and not everything that can be counted counts. Albert Einstein 1879-1955
6.1 Introduction
This chapter analyses the results of an application of DEA to CSR as conducted in
Chapter 5. It is structured so that the evidence obtained from the computations of the
empirical data of a successful Australian bank, recognised for its leadership in CG, is
used to assess the efficacy of an operations research technique. The objective is to
identify which decision making units are efficient and which are not, through the
application of the DEA variant of traditional linear programming, as a legitimate
stepping stone for the study of organisational performance viewed as the optimal ratio of
output to input relationships across the supply chain in which the bank operates. The
analysis of results from using existing data in three separate trials should provide this
categorisation. Non-efficiency rated DMUs and those disputably efficient must also be
analysed and possibly explained. This analysis will take the form of:
assessing the application of DEA to CSR;
applying heuristics to the DEA results;
evaluating the suitability of the DEA model employed and others available;
commenting on idiosyncratic features of DEA; and
evaluating the correlations of the input-output factors as computed by the DEA
algorithm.
The discussion will then be continued in the next chapter where issues that arise from
this evaluation are debated.
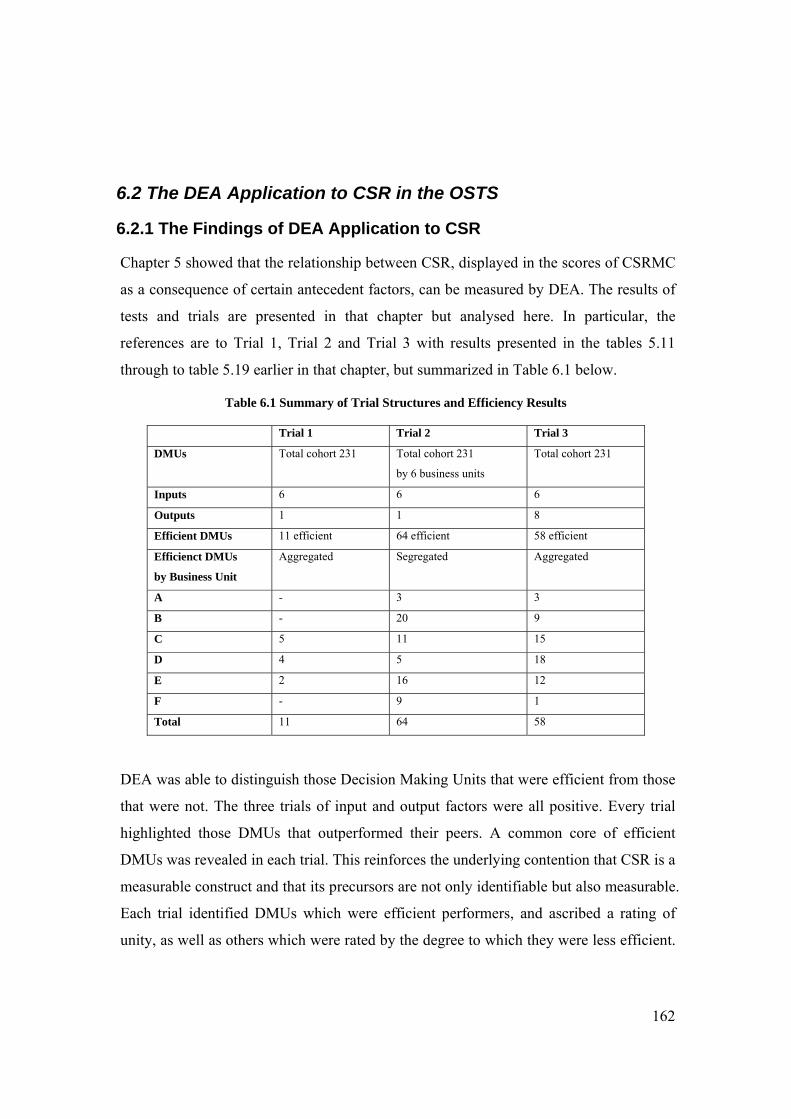
162
6.2 The DEA Application to CSR in the OSTS
6.2.1 The Findings of DEA Application to CSR
Chapter 5 showed that the relationship between CSR, displayed in the scores of CSRMC
as a consequence of certain antecedent factors, can be measured by DEA. The results of
tests and trials are presented in that chapter but analysed here. In particular, the
references are to Trial 1, Trial 2 and Trial 3 with results presented in the tables 5.11
through to table 5.19 earlier in that chapter, but summarized in Table 6.1 below.
Table 6.1 Summary of Trial Structures and Efficiency Results
Trial 1 Trial 2 Trial 3
DMUs Total cohort 231 Total cohort 231
by 6 business units
Total cohort 231
Inputs 6 6 6
Outputs 1 1 8
Efficient DMUs 11 efficient 64 efficient 58 efficient
Efficienct DMUs
by Business Unit
Aggregated Segregated Aggregated
A - 3 3
B - 20 9
C 5 11 15
D 4 5 18
E 2 16 12
F - 9 1
Total 11 64 58
DEA was able to distinguish those Decision Making Units that were efficient from those
that were not. The three trials of input and output factors were all positive. Every trial
highlighted those DMUs that outperformed their peers. A common core of efficient
DMUs was revealed in each trial. This reinforces the underlying contention that CSR is a
measurable construct and that its precursors are not only identifiable but also measurable.
Each trial identified DMUs which were efficient performers, and ascribed a rating of
unity, as well as others which were rated by the degree to which they were less efficient.
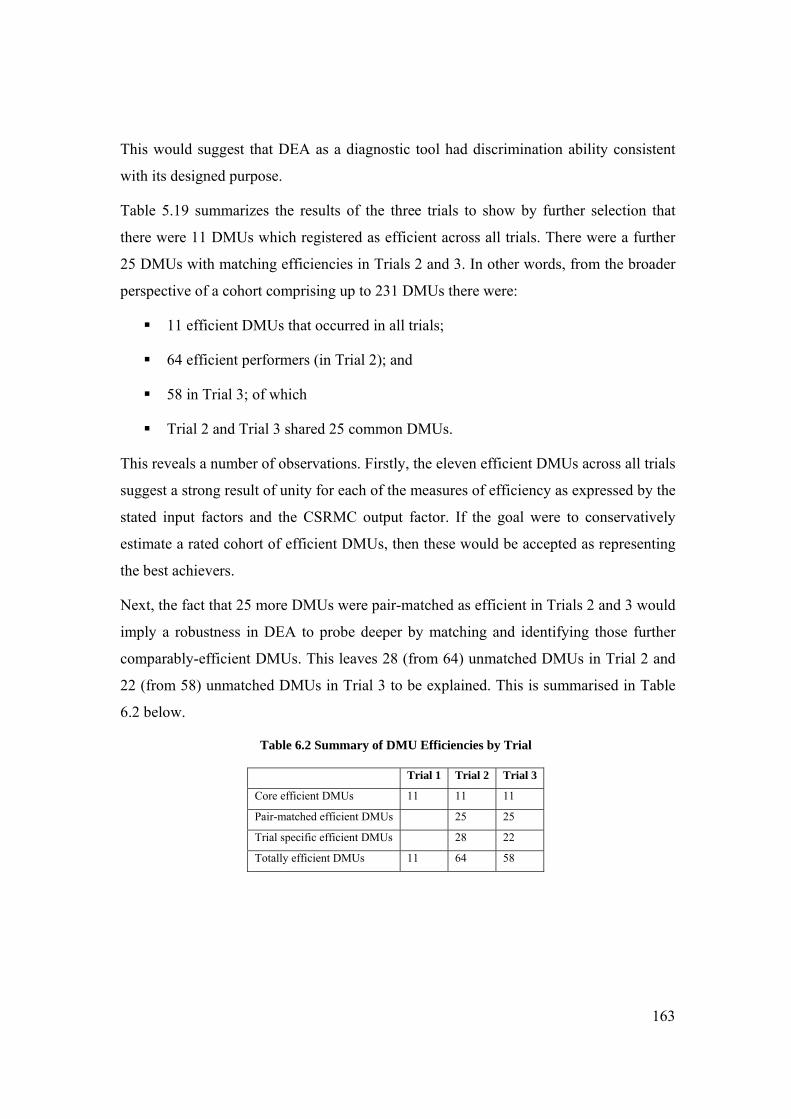
163
This would suggest that DEA as a diagnostic tool had discrimination ability consistent
with its designed purpose.
Table 5.19 summarizes the results of the three trials to show by further selection that
there were 11 DMUs which registered as efficient across all trials. There were a further
25 DMUs with matching efficiencies in Trials 2 and 3. In other words, from the broader
perspective of a cohort comprising up to 231 DMUs there were:
11 efficient DMUs that occurred in all trials;
64 efficient performers (in Trial 2); and
58 in Trial 3; of which
Trial 2 and Trial 3 shared 25 common DMUs.
This reveals a number of observations. Firstly, the eleven efficient DMUs across all trials
suggest a strong result of unity for each of the measures of efficiency as expressed by the
stated input factors and the CSRMC output factor. If the goal were to conservatively
estimate a rated cohort of efficient DMUs, then these would be accepted as representing
the best achievers.
Next, the fact that 25 more DMUs were pair-matched as efficient in Trials 2 and 3 would
imply a robustness in DEA to probe deeper by matching and identifying those further
comparably-efficient DMUs. This leaves 28 (from 64) unmatched DMUs in Trial 2 and
22 (from 58) unmatched DMUs in Trial 3 to be explained. This is summarised in Table
6.2 below.
Table 6.2 Summary of DMU Efficiencies by Trial
Trial 1 Trial 2 Trial 3
Core efficient DMUs 11 11 11
Pair-matched efficient DMUs 25 25
Trial specific efficient DMUs 28 22
Totally efficient DMUs 11 64 58
164
6.2.2 The Findings of DEA in the OSTS
It has been discussed in Chapter 2 that the dynamics of organisation function and
performance are best viewed from an OSTS perspective. In particular, the organisation
operates as a conjunction of two subsystems, the humanistic-organic and technological-
mechanistic subsystems. The former allows for the individualisation of work and the
empowerment of workers to choose, to a certain extent, how to do their tasks, while the
latter defines what tasks need to be done to achieve organisational objectives. So, there
are organisational requirements for CG and CSR that are prescribed in policy and
procedures and there are the interpretative ways in which these are adhered to by the
employees in all DMUs, including the cohort sampled in this study. Consequently, the
fluid nature of a humanistic style of management together with an evolving corporate
mission may provide some explanation for the appearance of additional DMUs which
display efficiencies of unity. In a sense this supports the contention that it is difficult to
fully quantify a qualitative construct such as CSR. In retrospect it should be expected
that this type of a result would be achieved. There was also no detailed biographical
profile of the DMUs undertaken in this study. The analysis of such data may have
provided an insight into the humanistic stance of the subjects. Furthermore, there are
numerous technical reasons why the results are not fully coherent and these are discussed
next.
6.3 Technical Considerations of the Findings
6.3.1 Heuristics for DEA to Succeed: The Rules of Thumb
The acceptability of the quantities of DMUs, input and output factors, that work best in
the DEA algorithm is not well established, yet pertinent to the results. In Section 5.5 it
was mentioned that while there are no fixed rules for choices of these quantities, there
appears to be heuristics supporting three rules of thumb. R1 mentions that the number of
DMUs in the sample should be greater than the product of inputs and outputs. This
condition was satisfied in all three trials. R2 states that the number of DMUs should be
165
greater than or equal to three times the sum of input and output factors.10 This condition
was only achieved in trials 1 and 3. Trial 2 showed business units A and F as those
segmented and individually tested cohorts which breached this rule. These units showed
three and nine efficient DMUs when Trial 1 showed none and Trial 3 showed three and
one efficient DMUs in units A and F respectively.
R3 suggests the sample size is acceptable if the number of fully efficient DMUs is no
greater than one-third the sample size. This condition was met by all three trials,
including Trial 2 which had sample quantities ranging from six DMUs in Business Unit
A to sixty three DMUs in Business Unit C. Thus, Trial 2 with individual business units
being tested separately and the results aggregated, was the only one that breached the
conditions. Three DMUs in Unit A and nine in Unit F are additionally identified as
efficient. These extraneous DMUs were not rated as efficient in any of the other trials.
This total of 12 units can explain the presence of some of the 28 unmatched DMUs in
Trial 2 above, leaving only a further 16 efficiency-rated DMUs unexplained.
The trial conditions and the results were sent to two cited researchers for verification that
these complied with conventional applications of the model generally, and with the
quantities of DMUs, inputs and outputs in particular. In personal communication with
Professor Coelli from the Centre for Efficiency and Productivity Analysis, University of
Queensland, on the 7th September 2006, and Dr Necri Avkiran from the Queensland
University Business School, on the 9th September 2006, they both stated that the
quantities for DMUs, inputs and outputs were acceptable and the results were also within
acceptable parameters.
6.3.2 Different DEA Models
When DMUs are ranked similarly by different models of DEA, the efficiency
evaluations are “an indication of the robustness of the technique” (Golany and Roll 1989,
p. 244). Trials 1, 2 and 3 were all conducted using the CCR-I and the CCR-O models
with no discernable difference. The CCR-I model emphasizes input reduction while the
10 Golany and Roll (1989) suggest that the number of DMUs in the sample should be at least twice the sum of the number of input and output factors whereas Cooper, Seiford and Tone (2000) state that the number of DMUs should exceed the combined number of inputs and outputs.
166
CCR-O model emphasizes output enhancement, but in this instance the results were
identical. Different DEA models have different specific characterizations. For example,
the multiplicative and weighted additive models focus on the impact of the weighting
factors, thus the choice of model may have a bearing on the rating of relative efficiencies.
The BCC model takes into account the most productive scale size while simultaneously
identifying technical inefficiency, such that ‘variable’ returns to scale rather than
‘constant’ returns to scale (VRS or CRS, see Section 4.5) will produce results reflecting
the contribution of factors such as the size of the DMU. The Additive model is an
extension to the BCC model and has VRS, but its difference is in seeking to project the
DMU values to the closest point of efficiency on the envelopment surface. Consequently
while each of the three models has the same production function displayed by the
piecewise linear envelopment surface, the measures of efficiency may differ. Generally,
CRS assumes a linear relationship to increasing inputs or outputs and thus tends to lower
scores whereas VRS tends to raise them.
In the data analysed for this study, the size of individual units was not gathered and
hence not available for analysis. However, it is likely that different DMUs in different
business units, and even different geographical regions of branches where the bank
operated and sample data were obtained, would have the local operations of each DMU
differ to some degree in various respects, e.g. size counts. For example, if the study
DMU were a management unit where the customer base was expansive and demanding
of specific bank services, it would seem sensible that this particular DMU would have
greater technological support to provide these services than in a case where this may be a
minor requirement for another DMU. Specifically, with regards to CSR there may be
regional forces that pressure the bank to be more responsive to stakeholder demands.
Coelli et al. (1998) recognise the impact of ‘environmental’ factors which can “influence
the efficiency of the firm, where such factors are not traditional inputs and are assumed
not under the control of the manager” (p. 166), and illustrate this with examples that
correspond to our description of stakeholders. This is discussed further in Section 7.3.7.
The CRS model also assumes that all DMUs are operating at an optimal scale when the
discussion above suggests this may not be the case because of a variety of imperfect
conditions. This situation has been identified by many authors (in Coelli et al. 2005), and
167
adjustments to CRS to account for scale efficiencies have been suggested. One is to run
the CRS and the VRS models concurrently and if there is a difference in the scores,
decompose them into two components (scale inefficiency and pure technical
inefficiency), to indicate which DMUs exhibit scale inefficiencies. This was not done in
the present study. More importantly the CRS model assumes linearity, suggesting that
CSR has a linear relationship between antecedent factors and the CSRMC factor that
represents the concept. While linearity is often a good approximation of non-linear
relationships over a limited range, it fails to endorse non-linear functions over the
broader spectrum. The concept of the mathematical modeling of CSR for this purpose
may warrant further research.
6.3.3 The Extreme Point Technique of DEA
DEA is a powerful tool but has some characteristics which may create problems. As an
extreme point technique it is susceptible to system ‘noise’ even if the noise is
symmetrical with mean zero. It can be similarly affected by the ‘outliers’, those far
points on the production frontier representing unusual DMUs and usually units that
deviate from the general characteristics of the group, and are included in the comparisons.
In particular, the threat and impact of outliers is greater when there are smaller numbers
of DMUs in the cohort, as was the case in Trial 2 with individual business units being
tested rather than the whole as one group, i.e. when Trial 2 was conducted the efficiency
comparisons were made relative to DMUs within the same business unit cohort yet
comparisons relative to the total cohort were not computed. This could explain why
more efficiencies were recorded when aggregating those from individual business units
as smaller cohorts. Some that were included in the aggregation process would possibly
have been filtered out if compared to the more efficient DMUs in all business units as
one cohort. This is discussed in the next section.
There is an equally strong argument presented concerning the outlier impact when the
number of DMUs increases dramatically. This is because as the number of units in the
analysed set increases “the lower the homogeneity within the set, increasing the
possibility that results may be affected by some extraneous factors which are not of
interest” (Golany and Roll 1989, p. 239). Some outliers or extraneous factors in the
168
larger cohort may exist on the production frontier thus changing the envelopment surface
used for peer comparisons and affecting which ones are rated as efficient. This does not
seem to have occurred in Trial 1 with 231 DMUs because the ‘core 11 efficient’ ones
were stable across all the three trials.
Trial 3 was conducted with greater numbers of output factors, eight instead of the one
CSRMC. While the number of DMUs remained the same at 231, the opportunity for an
outlier effect may come from the extreme measures presented in any of these additional
variables. This may project a DMU to the production frontier because of the new
computation by the DEA algorithm. Some of these de-segregated variables may thus
distort the results by providing DMUs with an efficiency rating of unity which they
would have not otherwise achieved. The possibility that this has occurred will be
evaluated in Section 6.4.3 where correlations for input and output factors are presented.
6.3.4 The Aggregation and De-aggregation Impact
The purpose of such categorisation is twofold: one is to gain a better relative assessment
of efficiency, by comparing performance within sub-groups of units operating under
similar conditions…The other is a comparison between categories. (Golany and Roll
1989, p. 245)
There are implications from this statement that apply to aggregation of variables and
values. Trial 2 was conducted with efficiency comparisons made relative to DMUs
within the same business unit cohort, of different sample quantities, and results were
later aggregated for comparisons against other trials results. In this trial the computations
excluded any ratings relative to the total cohort. This could explain why more
efficiencies were recorded. As mentioned earlier, those additional DMUs which were
identified as efficient when compared ‘relatively’ to others in a smaller sample would
have failed in comparisons to a greater sample. This phenomenon is also reported by
Golany and Roll (1989). When aggregating individual business units to compare against
trials one and three, some of the DMUs included in the aggregation process should
possibly have been excluded. This aggregation could explain the efficient DMUs
additional to the robust 11 DMUs identified as efficient across all trials.
169
Trial 3 was based on the de-aggregation of the output factor CSRMC into the component
factors that were viewed as variables indicative of CSR. While the ‘robust 11’ were
again supported, additional DMUs not previously identified were rated as efficient. Why
are new DMUs revealed?
It is suggested that this is the consequence of reversed aggregation. The CSRMC
variable as originally defined and tested was a holistic measure, in part to capture the
output as a whole, rather than individual components of CSR which are then aggregated.
There are a number of possibilities for these newly rated efficient DMUs:
the de-aggregated variables include ‘outliers’, as described in Section 6.3.3;
the de-aggregation variables are assigned weightings by the DEA algorithm
where, in the absence of proscription by the researcher, DEA selects weights that
will maximize efficiency outcomes;
this process has responded to the distortion of introducing variables not strongly
correlated to CSR but claiming to be so; and
the extent to which the input and output factors are continuous or discrete
variables is unknown.
The de-aggregation of variables also means that, in accordance with the DEA
computation, each is weighted relative to its influence on the final efficiency calculation.
This obviates the discretionary weighting of these particular factors that the managers of
the DMUs may have imposed, potentially overemphasizing some variables while
devaluing others, resulting in some DMUs being elevated to a higher status. In other
words, some variables are under greater control of managers while others are not. DEA
can cope with discretionary and non-discretionary variables such as these, provided they
are segregated at the outset. This was not done nor considered in the design of the
investigation for this thesis. In addition to the possible explanations above, the additional
efficient DMUs may reflect the discord between CSRMC as an unique holistic measure
and those variables chosen as its components. This suggests that those variables now
representing the output factor of CSR may not be strongly correlated to CSRMC. Hence,
it may be pertinent to have done a correlation analysis of those factors that were going to
170
represent the de-aggregated CSRMC. In the absence of those variables having
correlation support, it can be posited that not all of them are related to CSR as
represented by the CSRMC construct and thus impose a distortion to the final list of
efficiently rated DMUs.11 Not withstanding this, it must be remembered that the ‘robust
11’ are part of the final list and that there are also additional DMUs that exist in both
Trial 2 and Trial 3. Coelli et al (2005) discuss the importance of correct aggregation and
suggest that there are some guidelines for admissible aggregation. For example, in the
aggregation of input and output factors of commodities the Hicks and Leontief
conditions provide a guide but such a guide, does not seem to exist for CSR.
Trial 3 disaggregated CSRMC into a number of composites resulting in additional
DMUs being identified as efficient. Does CSRMC represent a continuous dimension
which is not simply the summation of a number of discrete variables? Or, if CSRMC can
be a summation of discrete variables, do the ones presented in Trial 3 fully cover
CSRMC? These are unanswerable questions in the current study but may provide some
explanation for efficient DMUs that appear only in Trial 3 and again would warrant
further research as suggested in Section 6.3.2 earlier.
6.3.5 The Quantification of Qualitative Data
An oft cited criticism of DEA is that:
DEA yields relative efficiencies only, within the examined group of DMUs. Outcomes
are also dependent on the factors entered into an analysis and the numerical values
accorded to qualitative factors. (Golany and Roll 1989, p. 247)
The implication of this statement is that of factor selection. This has been discussed in
Section 3.3.2 and shown in Figure 3.2. While the factors should be screened in the
validation process, factor selection may still be pertinent to the results of this study
because of the quantification of qualitative values in a construct such as CSR. This has
been discussed previously in sections 5.2.2 and 5.3.1 but is worth reiterating.
Quantification of a qualitative value is a novelty of the DEA technique which gives it
strength because qualitative factors can now participate in the mathematical evaluation 11 Note that this is later revealed when the DEA computation as part of its printout produces correlation results which support this premise.
171
of efficiency. However, this may result in a disproportionate representation of the impact
of these factors in comparisons made relative to other quantitative factors.
While the usual practice is to locate some measurable surrogate variable that bears some
known relation to the varying levels of the qualitative factor, the choice of factor should
reflect a significant degree of congruence between the factor and the surrogate as well as
the ability to express this in some functional form. How well this is done is uncertain,
particularly when dealing with certain variables in CSR that are inherently qualitative.
Consequently, this also raises the issue of weighting the factors (as discussed in Section
4.6.1). Instead of allowing the DEA algorithm to assign weights according to an overall
beneficial outcome per DMU, which “can be viewed in some cases as covering up the
most serious deficiencies of the DMU being analysed” (Golany and Roll 1989, p. 245), it
may be more appropriate to specify weights by a method such as the analytical hierarchy
process (AHP). If knowledgeable judges are available for factor selection a recursive
technique such as the Delphi method could also be employed.
6.3.6 Explaining Efficiency versus Describing Efficiency
‘Factors determining efficiency versus factors explaining efficiency’ is often a problem
of distinction. Those that explain efficiency may “blur the overall picture and reduce the
distinction between compared units” (Golany and Roll 1989, p. 241). Trials 1 and 2
retained the output factor to a single CSRMC value that was derived by the original
author (Black 2004) as an overall measure of CSR. In Trial 3 the eight output variables
were selected as indicative factors of CSRMC (see Tables 5.2 and 5.3). These could
possibly be explaining factors as described by Golany and Roll, in which case they
obscure the way some factors affect performance. This phenomenon, if present in the
current study, could partially explain the 22 unmatched DMU efficiencies in Trial 3.
Furthermore, if descriptive factors are generally used in the comparisons there is a
chance that a descriptive factor which appears different to a determinant factor is
actually the same factor but named differently. The effect of a variable that appears say
twice in a different guise is to amplify the contribution of that variable. This type of
problem has been identified (Golan and Roll 1989) and a remedy proposed. The
172
procedure is to carry out a series of regression analyses on known input and output
factors, one at a time.
A weak relation to inputs and strong relation to outputs indicates a leaning towards
classifying that factor as an input. Similarly, an opposite result would indicate a leaning
towards an output classification. Additionally, a weak relation to all factors should
suggest a re-examination of that factor or its elimination, while strong relations would
indicate the opposite. Fortunately the DEA-Solver-Pro program used in this thesis
provides tabulated correlations of factors in the summaries of the computations needed
to identify the efficient DMUs.
Black’s (2004) regression of factors, in Section 5.3.1, showed correlations of the
indicative factors to all be significant at the 0.01 level, with significant ANOVA support
for the 8 dimensions of CSRMC. This is pertinent to section 6.4.
6.3.7 The Effect of Input Congestion and Exogenous Factors
The curve representing a production function is the piece-wise frontier constructed by
DEA as discussed in Chapter 4, so that efficiency measures can be calculated relative to
this surface. In some instances the production function may turn downwards presenting a
negative slope for some values and thus causing the “isoquants to bend backwards and
obtain a positive slope at some point” (Coelli et al. 2005, p. 195). This can be explained
as being due to congestion in the use of the input to the extent that it has a negative
marginal product. It is usually argued to exist because of constraints not under the
control of management, in situations where pressures from outside the organisation limit
efficiency-seeking strategies. The ‘congestion inefficiencies’ in these instances are
contrary to the assumption of strong disposability in inputs and outputs, implicit in
standard DEA models. Such external factors may explain some discrepancies in Trials 1
and 2 where DMU efficiencies may reflect responses to pressures from external
stakeholders who are acknowledged as having an interest in CSR. This type of problem
can be addressed by changing the inequalities in the linear programming equations for
inputs, so that strong disposability in the input assumption is replaced with weak
173
disposability. Analogous output disposability assumptions can be similarly
accommodated.
Furthermore, the basic DEA models have an implicit assumption that all inputs and
outputs are discretionary, i.e. controlled by management.
“However, there may exist exogenously fixed or non-discretionary inputs or outputs that
are beyond the control of a DMU’s management (Charnes et al. 1994, p. 50).” This could
further explain some of the results in Trial 2 and Trial 3.
6.3.8. Efficiency versus Productivity
The study of the piece-wise frontier representing the production function is also
important because of a common misunderstanding of the fundamental difference
between productivity and efficiency. Productivity is the ratio measure of output to inputs
and when all (input and output) factors of production are considered it becomes known
as total factor productivity. Efficiency has erroneously become synonymous with this
measure. By referring to the early diagrams in Chapter 4 the technical efficiencies are
shown as the rays from the origin to the positions on the production frontier where the
efficient DMUs operate. Other, non-efficient DMUs are not on this surface and therefore
are inefficient by the amount of distance to the nearest point on the production frontier
where they are headed. But while all points on the frontier are technically efficient, some
have higher productivity. The gradient of the ray from origin to this frontier represents
the ratio of the x axis variable to the y axis variable and hence productivity. At different
points on the frontier this gradient may be greater than at other points and therefore show
higher productivity but equal efficiency. This is possible because the higher productivity
DMUs are exploiting scale economies and operating under these more favourable
conditions. This presents the formal argument and support for the discussion of VRS in
Section 6.3.2 earlier.
The implication of the results for the trials in this study is that different DMUs in the
cohort come from samples of different operational departments and divisions within the
organisation which, implicit by the very nature of their functional duties, operate on
different levels of economic scale. There is particular difficulty in assessing this
174
influence since the data was not originally obtained with this purpose in mind. The
relationships between CSR and economies of scale may warrant a separate study in its
own right.
6.4 The CSR Construct
The argument supporting CSR as a construct of CG has been presented in Chapter 5. The
identification of the factors underlying CSR was then developed from the work of Black
(2004) and previous researchers, discussed in Chapter 2. The measurement of these
factors was then undertaken with DEA, and the results of trials and tests are shown in
Chapter 5. A summary and review of these may assist further analysis and interpretation
of the results.
The final trials were conducted on a refined selection of input and output factors. There
were six input factors and one output factor of CSRMC, except when this was expanded
to eight output variables for Trial 3. The most conservative and strongly supported
results were presented in Trial 1. These findings are considered the most suitable to
benchmark against as they identified 11 efficient DMUs from the study cohort of 231.
The same 11 also turned up in the next two trials thus giving strong support that they
were truly the best performers. From this stance we can make observations of the results
and compare findings.
The input and output factors as determinants of efficiency using DEA are listed here for
convenience.
Input Factors (with study abbreviations and brief descriptions from Table 5.3):
1) Commacc Communication accuracy where communication is understandable,
honest and accurate.
2) Humanist Humanistic orientation indicating a participative style of
management.
3) Integeth Integrated ethics which includes ethics in everyday practices.
4) Manageth Management commitment to ethics by talking and demonstrating
ethics for the good of the company and society.
175
5) Pos Perceived organisational support through feelings of empowerment.
6) Justice Distributive justice and ethical behaviour based on fairness of
process and outcome.
Output Factors CSR Management Capacity when expanded to its eight indicative
factors (as described by Black 2004)
1) Stakid Stakeholder Identity – people understand how the firm’s future is
linked with its stakeholders.
2) Stakman Stakeholder Management – business decisions take stakeholder
needs into consideration.
3) Valueatt Value Attuned Public Affairs – public affairs contribute to business
strategy with information about stakeholder values.
4) Dialogue A respectful attitude and power-sharing over the agenda for
discussion.
5) Ethicomm Ethics Compliance – ethical behaviour is reinforced through
formal systems of rewards and punishments.
6) Ethicatm Ethics Atmosphere – people sincerely care about the wellbeing of
others
7) Acctyid Sense of Social Accountability – managers feel accountable to
stakeholders for the firm’s social impacts.
8) Acctyre Social Accountability Reporting – people perceive that the firm
substantively accounts for its social performance without spin.
The computation of DEA rated efficiency scores for DMUs provided by DEA–Solver-
Pro also produces a number of additional reports as shown in Section 5.4.2. One of these
that becomes useful at this stage of diagnosing the efficiencies and inefficiencies of all
the DMUs, as well as presenting figures that support or weaken the inclusion of the
chosen variables, is the table of correlations (see below). The descriptive statistics of
maximum and minimum rating scales, with average and standard deviation scores, are
presented as precursors to the correlation table which shows inter-item correlations as
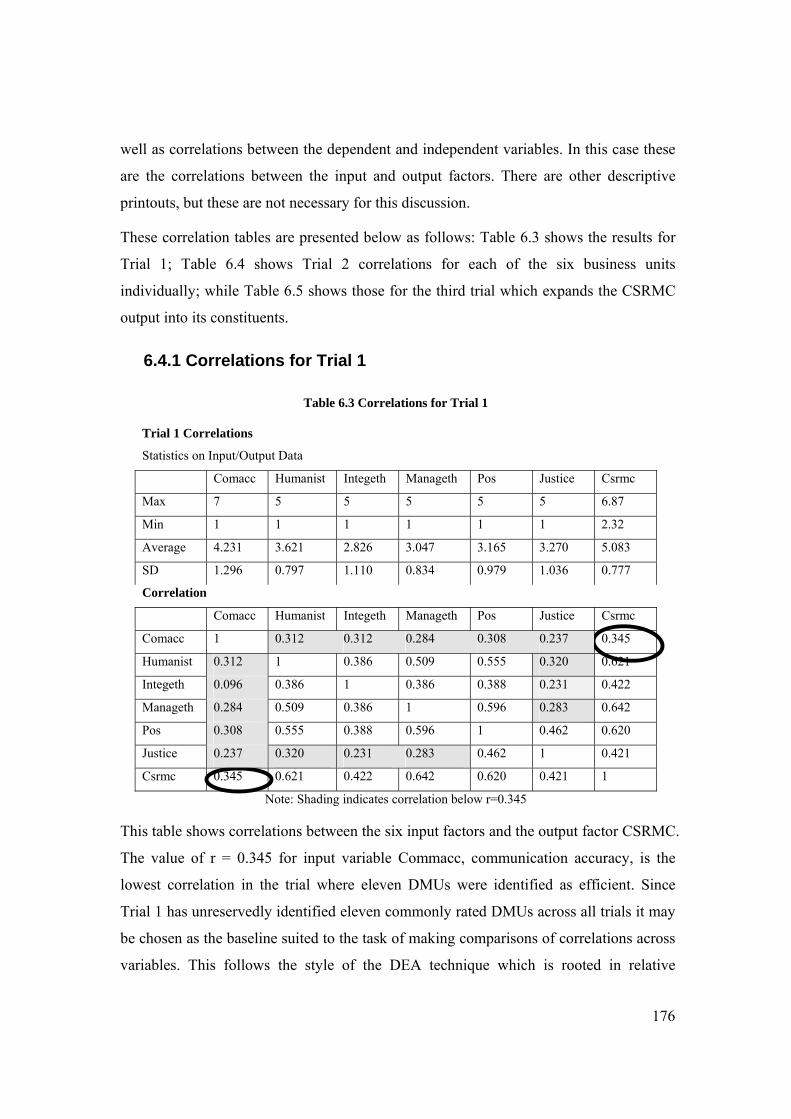
176
well as correlations between the dependent and independent variables. In this case these
are the correlations between the input and output factors. There are other descriptive
printouts, but these are not necessary for this discussion.
These correlation tables are presented below as follows: Table 6.3 shows the results for
Trial 1; Table 6.4 shows Trial 2 correlations for each of the six business units
individually; while Table 6.5 shows those for the third trial which expands the CSRMC
output into its constituents.
6.4.1 Correlations for Trial 1
Table 6.3 Correlations for Trial 1
Trial 1 Correlations
Statistics on Input/Output Data
Comacc Humanist Integeth Manageth Pos Justice Csrmc
Max 7 5 5 5 5 5 6.87
Min 1 1 1 1 1 1 2.32
Average 4.231 3.621 2.826 3.047 3.165 3.270 5.083
SD 1.296 0.797 1.110 0.834 0.979 1.036 0.777
Correlation
Comacc Humanist Integeth Manageth Pos Justice Csrmc
Comacc 1 0.312 0.312 0.284 0.308 0.237 0.345
Humanist 0.312 1 0.386 0.509 0.555 0.320 0.621
Integeth 0.096 0.386 1 0.386 0.388 0.231 0.422
Manageth 0.284 0.509 0.386 1 0.596 0.283 0.642
Pos 0.308 0.555 0.388 0.596 1 0.462 0.620
Justice 0.237 0.320 0.231 0.283 0.462 1 0.421
Csrmc 0.345 0.621 0.422 0.642 0.620 0.421 1
Note: Shading indicates correlation below r=0.345
This table shows correlations between the six input factors and the output factor CSRMC.
The value of r = 0.345 for input variable Commacc, communication accuracy, is the
lowest correlation in the trial where eleven DMUs were identified as efficient. Since
Trial 1 has unreservedly identified eleven commonly rated DMUs across all trials it may
be chosen as the baseline suited to the task of making comparisons of correlations across
variables. This follows the style of the DEA technique which is rooted in relative
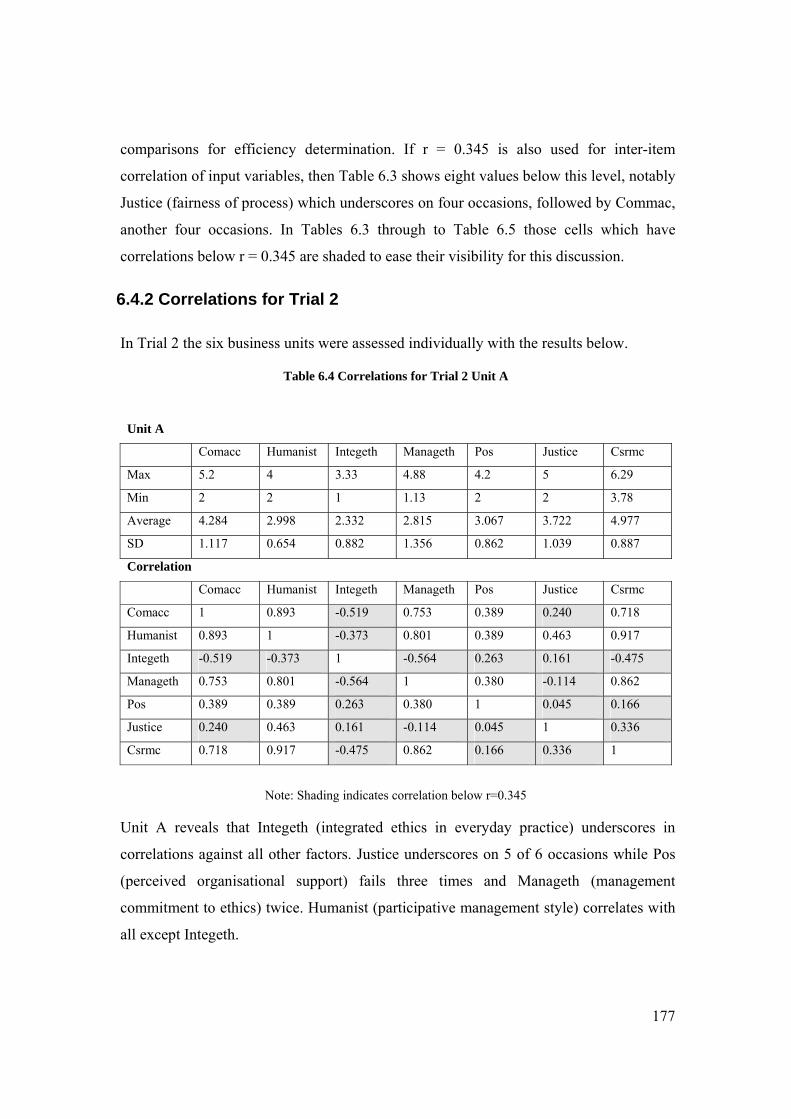
177
comparisons for efficiency determination. If r = 0.345 is also used for inter-item
correlation of input variables, then Table 6.3 shows eight values below this level, notably
Justice (fairness of process) which underscores on four occasions, followed by Commac,
another four occasions. In Tables 6.3 through to Table 6.5 those cells which have
correlations below r = 0.345 are shaded to ease their visibility for this discussion.
6.4.2 Correlations for Trial 2
In Trial 2 the six business units were assessed individually with the results below.
Table 6.4 Correlations for Trial 2 Unit A
Unit A
Comacc Humanist Integeth Manageth Pos Justice Csrmc
Max 5.2 4 3.33 4.88 4.2 5 6.29
Min 2 2 1 1.13 2 2 3.78
Average 4.284 2.998 2.332 2.815 3.067 3.722 4.977
SD 1.117 0.654 0.882 1.356 0.862 1.039 0.887
Correlation
Comacc Humanist Integeth Manageth Pos Justice Csrmc
Comacc 1 0.893 -0.519 0.753 0.389 0.240 0.718
Humanist 0.893 1 -0.373 0.801 0.389 0.463 0.917
Integeth -0.519 -0.373 1 -0.564 0.263 0.161 -0.475
Manageth 0.753 0.801 -0.564 1 0.380 -0.114 0.862
Pos 0.389 0.389 0.263 0.380 1 0.045 0.166
Justice 0.240 0.463 0.161 -0.114 0.045 1 0.336
Csrmc 0.718 0.917 -0.475 0.862 0.166 0.336 1
Note: Shading indicates correlation below r=0.345
Unit A reveals that Integeth (integrated ethics in everyday practice) underscores in
correlations against all other factors. Justice underscores on 5 of 6 occasions while Pos
(perceived organisational support) fails three times and Manageth (management
commitment to ethics) twice. Humanist (participative management style) correlates with
all except Integeth.
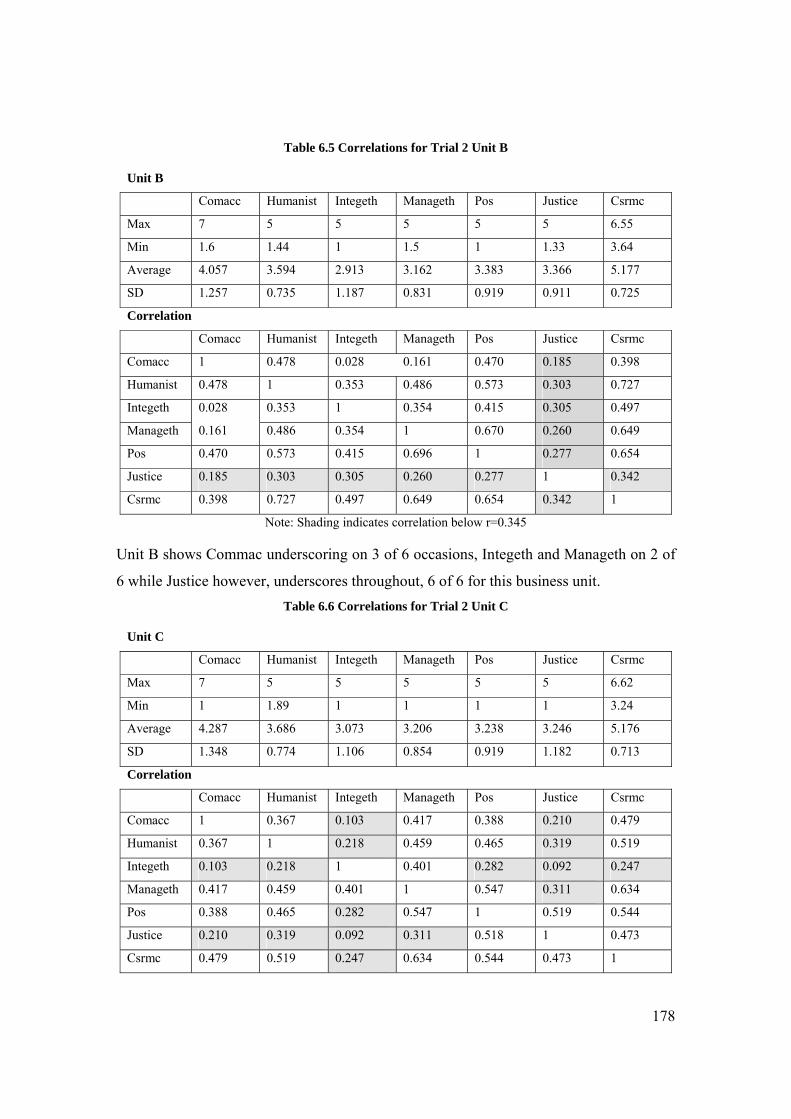
178
Table 6.5 Correlations for Trial 2 Unit B
Unit B
Comacc Humanist Integeth Manageth Pos Justice Csrmc
Max 7 5 5 5 5 5 6.55
Min 1.6 1.44 1 1.5 1 1.33 3.64
Average 4.057 3.594 2.913 3.162 3.383 3.366 5.177
SD 1.257 0.735 1.187 0.831 0.919 0.911 0.725
Correlation
Comacc Humanist Integeth Manageth Pos Justice Csrmc
Comacc 1 0.478 0.028 0.161 0.470 0.185 0.398
Humanist 0.478 1 0.353 0.486 0.573 0.303 0.727
Integeth 0.028 0.353 1 0.354 0.415 0.305 0.497
Manageth 0.161 0.486 0.354 1 0.670 0.260 0.649
Pos 0.470 0.573 0.415 0.696 1 0.277 0.654
Justice 0.185 0.303 0.305 0.260 0.277 1 0.342
Csrmc 0.398 0.727 0.497 0.649 0.654 0.342 1
Note: Shading indicates correlation below r=0.345
Unit B shows Commac underscoring on 3 of 6 occasions, Integeth and Manageth on 2 of
6 while Justice however, underscores throughout, 6 of 6 for this business unit. Table 6.6 Correlations for Trial 2 Unit C
Unit C
Comacc Humanist Integeth Manageth Pos Justice Csrmc
Max 7 5 5 5 5 5 6.62
Min 1 1.89 1 1 1 1 3.24
Average 4.287 3.686 3.073 3.206 3.238 3.246 5.176
SD 1.348 0.774 1.106 0.854 0.919 1.182 0.713
Correlation
Comacc Humanist Integeth Manageth Pos Justice Csrmc
Comacc 1 0.367 0.103 0.417 0.388 0.210 0.479
Humanist 0.367 1 0.218 0.459 0.465 0.319 0.519
Integeth 0.103 0.218 1 0.401 0.282 0.092 0.247
Manageth 0.417 0.459 0.401 1 0.547 0.311 0.634
Pos 0.388 0.465 0.282 0.547 1 0.519 0.544
Justice 0.210 0.319 0.092 0.311 0.518 1 0.473
Csrmc 0.479 0.519 0.247 0.634 0.544 0.473 1
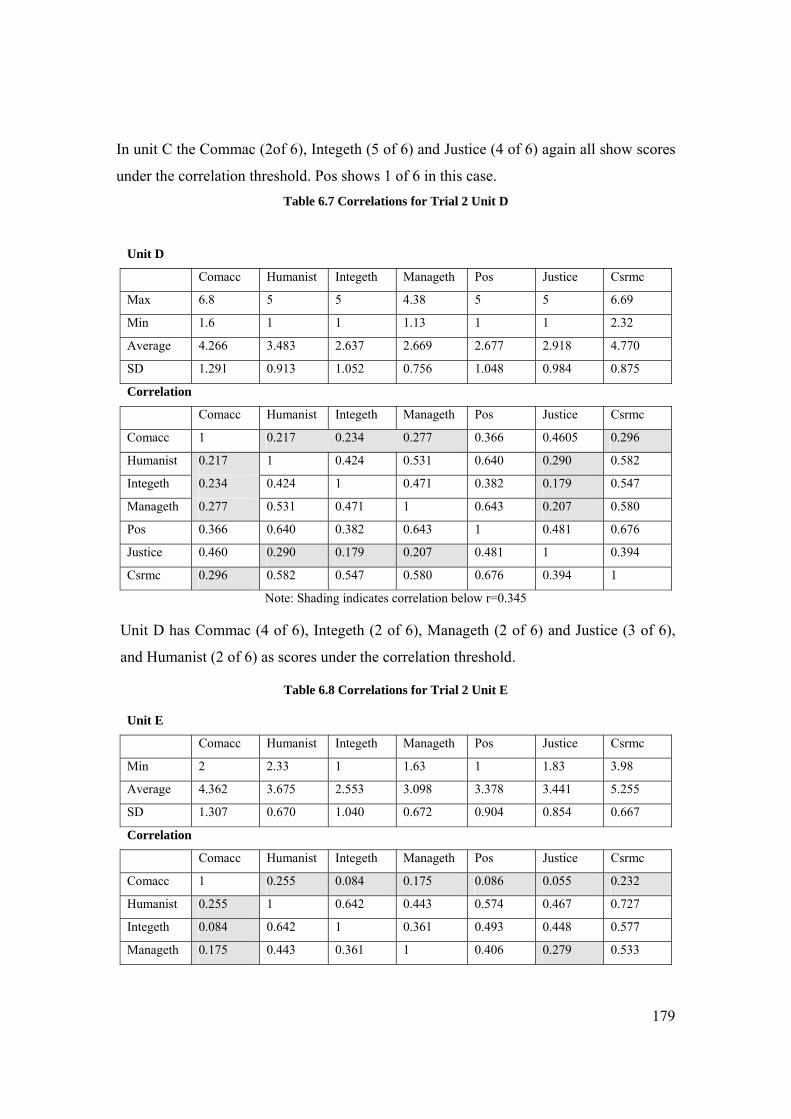
179
In unit C the Commac (2of 6), Integeth (5 of 6) and Justice (4 of 6) again all show scores
under the correlation threshold. Pos shows 1 of 6 in this case. Table 6.7 Correlations for Trial 2 Unit D
Unit D
Comacc Humanist Integeth Manageth Pos Justice Csrmc
Max 6.8 5 5 4.38 5 5 6.69
Min 1.6 1 1 1.13 1 1 2.32
Average 4.266 3.483 2.637 2.669 2.677 2.918 4.770
SD 1.291 0.913 1.052 0.756 1.048 0.984 0.875
Correlation
Comacc Humanist Integeth Manageth Pos Justice Csrmc
Comacc 1 0.217 0.234 0.277 0.366 0.4605 0.296
Humanist 0.217 1 0.424 0.531 0.640 0.290 0.582
Integeth 0.234 0.424 1 0.471 0.382 0.179 0.547
Manageth 0.277 0.531 0.471 1 0.643 0.207 0.580
Pos 0.366 0.640 0.382 0.643 1 0.481 0.676
Justice 0.460 0.290 0.179 0.207 0.481 1 0.394
Csrmc 0.296 0.582 0.547 0.580 0.676 0.394 1
Note: Shading indicates correlation below r=0.345
Unit D has Commac (4 of 6), Integeth (2 of 6), Manageth (2 of 6) and Justice (3 of 6),
and Humanist (2 of 6) as scores under the correlation threshold.
Table 6.8 Correlations for Trial 2 Unit E
Unit E
Comacc Humanist Integeth Manageth Pos Justice Csrmc
Min 2 2.33 1 1.63 1 1.83 3.98
Average 4.362 3.675 2.553 3.098 3.378 3.441 5.255
SD 1.307 0.670 1.040 0.672 0.904 0.854 0.667
Correlation
Comacc Humanist Integeth Manageth Pos Justice Csrmc
Comacc 1 0.255 0.084 0.175 0.086 0.055 0.232
Humanist 0.255 1 0.642 0.443 0.574 0.467 0.727
Integeth 0.084 0.642 1 0.361 0.493 0.448 0.577
Manageth 0.175 0.443 0.361 1 0.406 0.279 0.533
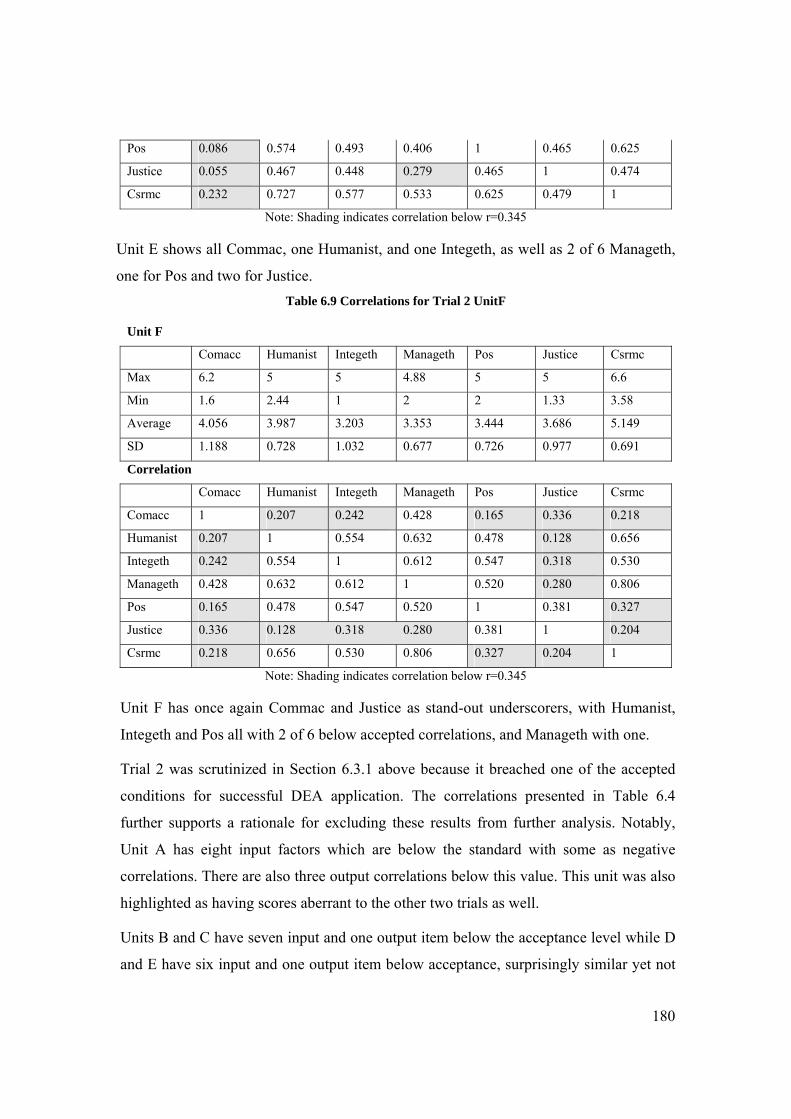
180
Pos 0.086 0.574 0.493 0.406 1 0.465 0.625
Justice 0.055 0.467 0.448 0.279 0.465 1 0.474
Csrmc 0.232 0.727 0.577 0.533 0.625 0.479 1
Note: Shading indicates correlation below r=0.345
Unit E shows all Commac, one Humanist, and one Integeth, as well as 2 of 6 Manageth,
one for Pos and two for Justice. Table 6.9 Correlations for Trial 2 UnitF
Unit F
Comacc Humanist Integeth Manageth Pos Justice Csrmc
Max 6.2 5 5 4.88 5 5 6.6
Min 1.6 2.44 1 2 2 1.33 3.58
Average 4.056 3.987 3.203 3.353 3.444 3.686 5.149
SD 1.188 0.728 1.032 0.677 0.726 0.977 0.691
Correlation
Comacc Humanist Integeth Manageth Pos Justice Csrmc
Comacc 1 0.207 0.242 0.428 0.165 0.336 0.218
Humanist 0.207 1 0.554 0.632 0.478 0.128 0.656
Integeth 0.242 0.554 1 0.612 0.547 0.318 0.530
Manageth 0.428 0.632 0.612 1 0.520 0.280 0.806
Pos 0.165 0.478 0.547 0.520 1 0.381 0.327
Justice 0.336 0.128 0.318 0.280 0.381 1 0.204
Csrmc 0.218 0.656 0.530 0.806 0.327 0.204 1
Note: Shading indicates correlation below r=0.345
Unit F has once again Commac and Justice as stand-out underscorers, with Humanist,
Integeth and Pos all with 2 of 6 below accepted correlations, and Manageth with one.
Trial 2 was scrutinized in Section 6.3.1 above because it breached one of the accepted
conditions for successful DEA application. The correlations presented in Table 6.4
further supports a rationale for excluding these results from further analysis. Notably,
Unit A has eight input factors which are below the standard with some as negative
correlations. There are also three output correlations below this value. This unit was also
highlighted as having scores aberrant to the other two trials as well.
Units B and C have seven input and one output item below the acceptance level while D
and E have six input and one output item below acceptance, surprisingly similar yet not
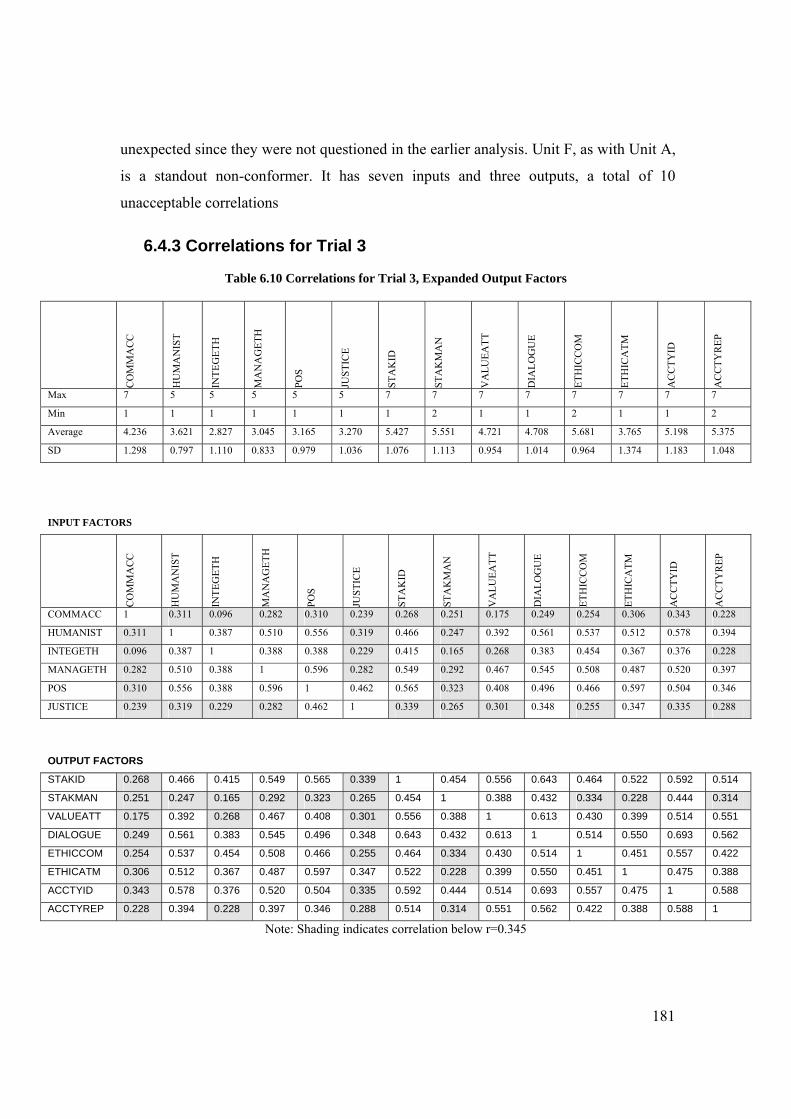
181
unexpected since they were not questioned in the earlier analysis. Unit F, as with Unit A,
is a standout non-conformer. It has seven inputs and three outputs, a total of 10
unacceptable correlations
6.4.3 Correlations for Trial 3
Table 6.10 Correlations for Trial 3, Expanded Output Factors
CO
MM
AC
C
HU
MA
NIS
T
INTE
GET
H
MA
NA
GET
H
POS
JUST
ICE
STA
KID
STA
KM
AN
VA
LUEA
TT
DIA
LOG
UE
ETH
ICC
OM
ETH
ICA
TM
AC
CTY
ID
AC
CTY
REP
Max 7 5 5 5 5 5 7 7 7 7 7 7 7 7
Min 1 1 1 1 1 1 1 2 1 1 2 1 1 2
Average 4.236 3.621 2.827 3.045 3.165 3.270 5.427 5.551 4.721 4.708 5.681 3.765 5.198 5.375
SD 1.298 0.797 1.110 0.833 0.979 1.036 1.076 1.113 0.954 1.014 0.964 1.374 1.183 1.048
INPUT FACTORS
CO
MM
AC
C
HU
MA
NIS
T
INTE
GET
H
MA
NA
GET
H
POS
JUST
ICE
STA
KID
STA
KM
AN
VA
LUEA
TT
DIA
LOG
UE
ETH
ICC
OM
ETH
ICA
TM
AC
CTY
ID
AC
CTY
REP
COMMACC 1 0.311 0.096 0.282 0.310 0.239 0.268 0.251 0.175 0.249 0.254 0.306 0.343 0.228
HUMANIST 0.311 1 0.387 0.510 0.556 0.319 0.466 0.247 0.392 0.561 0.537 0.512 0.578 0.394
INTEGETH 0.096 0.387 1 0.388 0.388 0.229 0.415 0.165 0.268 0.383 0.454 0.367 0.376 0.228
MANAGETH 0.282 0.510 0.388 1 0.596 0.282 0.549 0.292 0.467 0.545 0.508 0.487 0.520 0.397
POS 0.310 0.556 0.388 0.596 1 0.462 0.565 0.323 0.408 0.496 0.466 0.597 0.504 0.346
JUSTICE 0.239 0.319 0.229 0.282 0.462 1 0.339 0.265 0.301 0.348 0.255 0.347 0.335 0.288
OUTPUT FACTORS
STAKID 0.268 0.466 0.415 0.549 0.565 0.339 1 0.454 0.556 0.643 0.464 0.522 0.592 0.514
STAKMAN 0.251 0.247 0.165 0.292 0.323 0.265 0.454 1 0.388 0.432 0.334 0.228 0.444 0.314
VALUEATT 0.175 0.392 0.268 0.467 0.408 0.301 0.556 0.388 1 0.613 0.430 0.399 0.514 0.551
DIALOGUE 0.249 0.561 0.383 0.545 0.496 0.348 0.643 0.432 0.613 1 0.514 0.550 0.693 0.562
ETHICCOM 0.254 0.537 0.454 0.508 0.466 0.255 0.464 0.334 0.430 0.514 1 0.451 0.557 0.422
ETHICATM 0.306 0.512 0.367 0.487 0.597 0.347 0.522 0.228 0.399 0.550 0.451 1 0.475 0.388
ACCTYID 0.343 0.578 0.376 0.520 0.504 0.335 0.592 0.444 0.514 0.693 0.557 0.475 1 0.588
ACCTYREP 0.228 0.394 0.228 0.397 0.346 0.288 0.514 0.314 0.551 0.562 0.422 0.388 0.588 1
Note: Shading indicates correlation below r=0.345
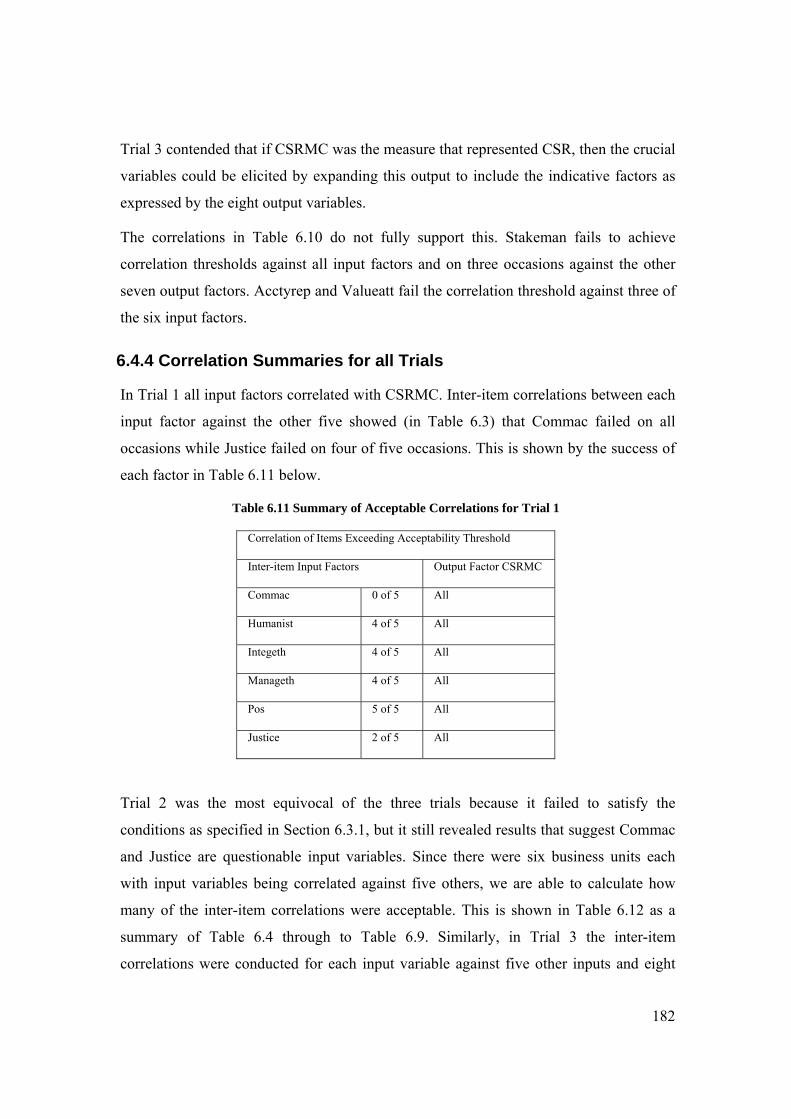
182
Trial 3 contended that if CSRMC was the measure that represented CSR, then the crucial
variables could be elicited by expanding this output to include the indicative factors as
expressed by the eight output variables.
The correlations in Table 6.10 do not fully support this. Stakeman fails to achieve
correlation thresholds against all input factors and on three occasions against the other
seven output factors. Acctyrep and Valueatt fail the correlation threshold against three of
the six input factors.
6.4.4 Correlation Summaries for all Trials
In Trial 1 all input factors correlated with CSRMC. Inter-item correlations between each
input factor against the other five showed (in Table 6.3) that Commac failed on all
occasions while Justice failed on four of five occasions. This is shown by the success of
each factor in Table 6.11 below.
Table 6.11 Summary of Acceptable Correlations for Trial 1
Correlation of Items Exceeding Acceptability Threshold
Inter-item Input Factors Output Factor CSRMC
Commac 0 of 5 All
Humanist 4 of 5 All
Integeth 4 of 5 All
Manageth 4 of 5 All
Pos 5 of 5 All
Justice 2 of 5 All
Trial 2 was the most equivocal of the three trials because it failed to satisfy the
conditions as specified in Section 6.3.1, but it still revealed results that suggest Commac
and Justice are questionable input variables. Since there were six business units each
with input variables being correlated against five others, we are able to calculate how
many of the inter-item correlations were acceptable. This is shown in Table 6.12 as a
summary of Table 6.4 through to Table 6.9. Similarly, in Trial 3 the inter-item
correlations were conducted for each input variable against five other inputs and eight
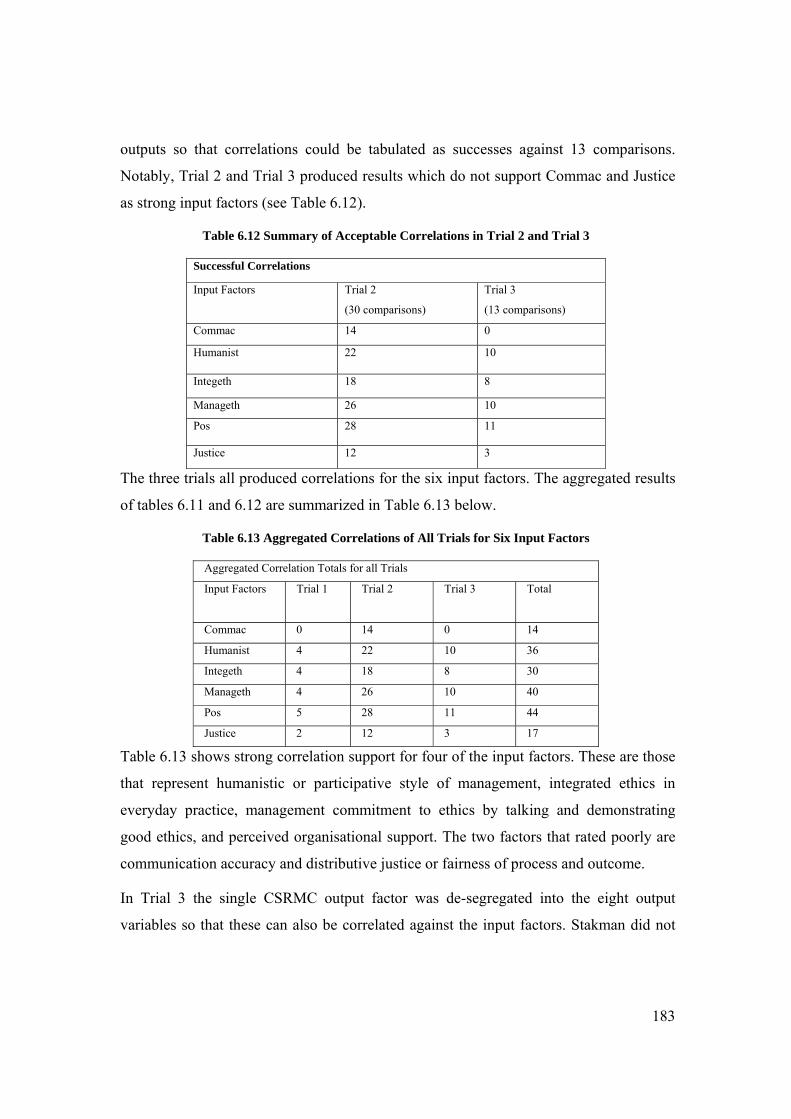
183
outputs so that correlations could be tabulated as successes against 13 comparisons.
Notably, Trial 2 and Trial 3 produced results which do not support Commac and Justice
as strong input factors (see Table 6.12).
Table 6.12 Summary of Acceptable Correlations in Trial 2 and Trial 3
Successful Correlations
Input Factors Trial 2
(30 comparisons)
Trial 3
(13 comparisons)
Commac 14 0
Humanist 22 10
Integeth 18 8
Manageth 26 10
Pos 28 11
Justice 12 3
The three trials all produced correlations for the six input factors. The aggregated results
of tables 6.11 and 6.12 are summarized in Table 6.13 below.
Table 6.13 Aggregated Correlations of All Trials for Six Input Factors
Aggregated Correlation Totals for all Trials
Input Factors Trial 1 Trial 2 Trial 3 Total
Commac 0 14 0 14
Humanist 4 22 10 36
Integeth 4 18 8 30
Manageth 4 26 10 40
Pos 5 28 11 44
Justice 2 12 3 17
Table 6.13 shows strong correlation support for four of the input factors. These are those
that represent humanistic or participative style of management, integrated ethics in
everyday practice, management commitment to ethics by talking and demonstrating
good ethics, and perceived organisational support. The two factors that rated poorly are
communication accuracy and distributive justice or fairness of process and outcome.
In Trial 3 the single CSRMC output factor was de-segregated into the eight output
variables so that these can also be correlated against the input factors. Stakman did not
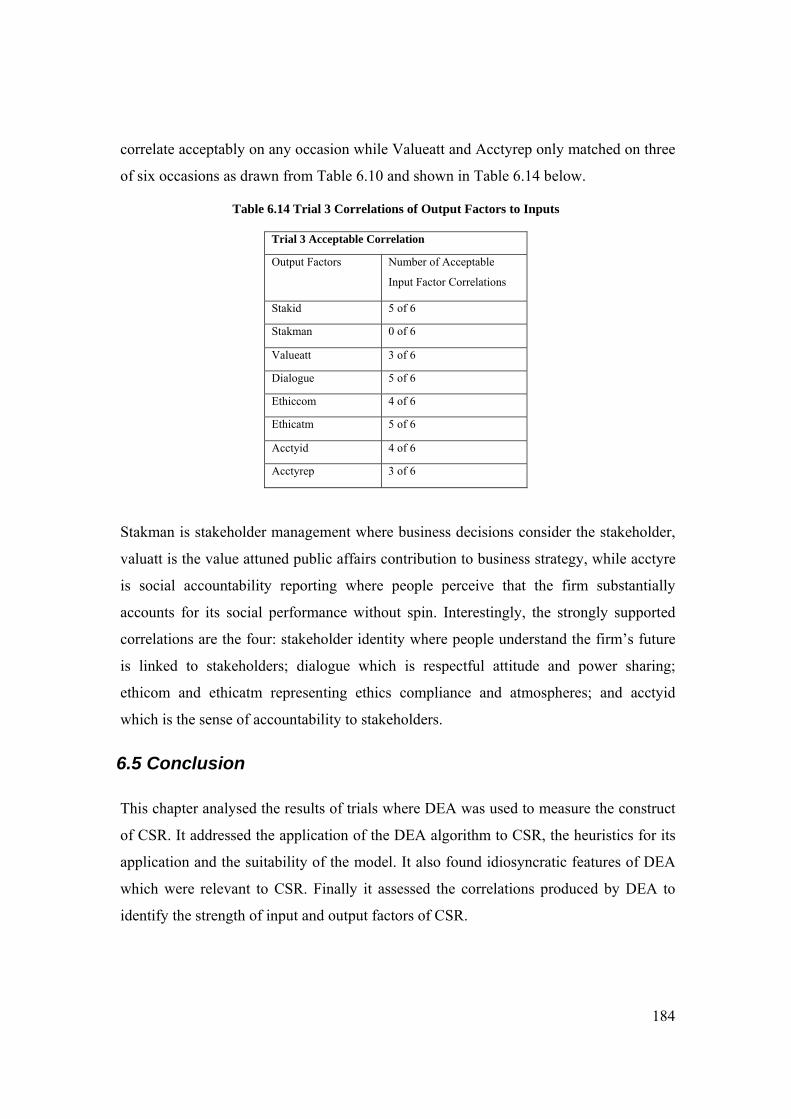
184
correlate acceptably on any occasion while Valueatt and Acctyrep only matched on three
of six occasions as drawn from Table 6.10 and shown in Table 6.14 below.
Table 6.14 Trial 3 Correlations of Output Factors to Inputs
Trial 3 Acceptable Correlation
Output Factors Number of Acceptable
Input Factor Correlations
Stakid 5 of 6
Stakman 0 of 6
Valueatt 3 of 6
Dialogue 5 of 6
Ethiccom 4 of 6
Ethicatm 5 of 6
Acctyid 4 of 6
Acctyrep 3 of 6
Stakman is stakeholder management where business decisions consider the stakeholder,
valuatt is the value attuned public affairs contribution to business strategy, while acctyre
is social accountability reporting where people perceive that the firm substantially
accounts for its social performance without spin. Interestingly, the strongly supported
correlations are the four: stakeholder identity where people understand the firm’s future
is linked to stakeholders; dialogue which is respectful attitude and power sharing;
ethicom and ethicatm representing ethics compliance and atmospheres; and acctyid
which is the sense of accountability to stakeholders.
6.5 Conclusion
This chapter analysed the results of trials where DEA was used to measure the construct
of CSR. It addressed the application of the DEA algorithm to CSR, the heuristics for its
application and the suitability of the model. It also found idiosyncratic features of DEA
which were relevant to CSR. Finally it assessed the correlations produced by DEA to
identify the strength of input and output factors of CSR.
185
The application of DEA to CSR proved successful in identifying 11 efficient DMUs in
all trials. This was a robust result. It identified further efficient DMUs, 25 common ones
in the later trials with a maximum of 64 in one trial. The possible explanations for the
additional efficient DMUs came from further analysis. In relation to CSR the DEA
algorithm measured a construct with factors such as communication, humanistic
management, practices demonstrating integrated ethics and organisational support,
leading to a metric for CSRMC. By their very nature these factors are qualitative
descriptors with amorphous characteristics, yet DEA was able to solicit efficient DMUs.
The CCRDEA model is the most strict and conservative version of the algorithm and
thus usually of first choice. In this case the relationship between the input and output
factors is assumed to be linear but may not be necessarily so. Other versions such as the
Cobb Douglas model could be more appropriate.
There are heuristics which are claimed to assist in structuring the DEA problem, but no
formal rules as such. The necessary task of selecting the appropriate DMUs, the proper
input and output variables, and the number of each, is often undertaken by ‘trial and
error’. The three ‘rules of thumb’ adopted for this study showed that Trial 2 was in
breach of one of the rules and anecdotally was less in accord with the results produced
by the other two trials. This would suggest that the findings of this trial, additional to
those consistent with the other two trials, are questionable and should be discarded for
the purposes of this thesis. It should be noted however, that those findings of Trial 2
consistent with the other trials actually reinforce their acceptance since a poor trial still
endorses the ‘core 11 efficient DMUs’.
DEA as a non-parametric technique has some idiosyncratic features which stands it apart
from other methods such as regression analysis and hypothesis testing. It is an extreme
point technique which can be adversely affected by deviant DMUs. Usually labelled as
‘outliers’, these DMUs that exist on the production frontier and have characteristics
unlike those common to the group can significantly impact the categorization of efficient
units. DEA also is unique in its attribution of weights or ‘multipliers’ to the input and
output factors. In the absence of defined weight constraints, it selects the weights which
enhances each DMU’s movment toward the efficient frontier, but which can be assigned
a priori by the researcher.
186
DEA also assumes that all the variables can be varied at the discretion of management or
others, when in fact there exist ‘non-discretionary’ variables not subject to management
control. These ‘exogenously fixed’ variables can be included by formulating a
modification to the CCR or BCC model.
There are many versions of the DEA model developed since its inception and designed
to accommodate the characteristics of ‘real world’ problems. It is no different in this
situation. The CCR DEA model was chosen because of its historical strength. It has been
used and validated extensively since its inception. It also provides the strictest and
therefore the most conservative criteria for unit efficiency comparisons. One
characteristic of the CCR model is its constant returns to scale which reflects the
linearity of the relationship between inputs and outputs. The analysis suggests that the
BCC model may have been more appropriate because through VRS it does not stipulate
linearity as a requirement. Furthermore, the additive model as an extension to the BBC
model would also explain the differences between efficiency and productivity discussed
earlier. It could similarly accommodate the input congestion phenomenon.
A novelty of DEA is its ability to work with qualitative values. They have to be assigned
numerical values to participate in the mathematical evaluation of efficiency. The usual
practice is to find a measurable surrogate with a known relation to the qualitative factor.
This is particularly appropriate to CSR and the success of DEA hinges on the validated
quantification of these variables.
When all factors for CSR were analysed for correlations above the r = 0.345 baseline, the
support for the construct was strengthened. The value of 0.345 was chosen as the
threshold for acceptable inter-item correlations because this was the lowest correlation
value for the CSRMC metric. In doing so, all trials fully supported the choice of the
‘core 11 efficient’ DMUs while identifying Commacc and Justice as questionable input
variables. Many correlation values below the acceptance threshold in Trial 2 supported
the exclusion of the results from this trial. On the other hand, Trial 3 supported most of
the factors indicative of CSRMC with the exception of Stakman, Acctyrep and Valueatt.
Generally, the analysis of correlations provides support for the findings discussed above.

187
The implications of these findings and their bearing on the construct will be discussed in
the following chapter.
188
Chapter 7
Implications for OBPM, SCM and Organisation Design
If I have seen further than others it is by standing upon the shoulders of giants. Sir Isaac Newton 1642-1727
7.1 Introduction
This chapter will discuss the research findings in terms of the implications of an OBPM
model for enterprises in the contemporary global knowledge economy. It will answer the
question of what the results of the research mean and how the findings can be
extrapolated to further develop the model and broaden its applicability to any firm
operating in the new era of global knowledge economics. The need to develop this new
framework is argued on the basis that practices of the past are inappropriate for
businesses of the future, and that the major findings of this research support a new
approach based on the tenets of this thesis. The way forward is then viewed as a series of
steps defined in a proactive strategy focused on corporate change to the new mode of
operations. What must change is discussed, as is the ultimate objective.
7.2 Implications of the Results
The research investigating the framework for an OBPM model of productive units in the
supply chain of an Australian enterprise achieved its objectives. It identified the
humanistic management style as the participative mode of organisational behaviour
enhancing the performance of the enterprise. In particular, through CSR, with the
indicative factors of CG including stakeholder engagement, ethical business behaviour,
social accountability, value communication and dialogue, DEA was able to distinguish
the organisational business units which were at the forefront of efficiency in the
enterprise, and that communication and dialogue were only minor factors. This ability to
identify the successful DMUs supports the PM methodology of OR through the DEA
189
algorithm. The enterprise which was the subject of this research is a major Australian
bank operating nationally and globally.
To be successful it must be responsive to the competitive forces, processes and methods
that drive performance in a modern global business, as well as being able to address
stakeholder concerns. It is clearly responding to these as demonstrated by its
achievement of a number of national and international awards. Its performance and
accolades reflect that it takes the interests of stakeholder groups along with their
contribution and importance to every stage of the production and supply chain.
The critical review and assessment of past research in the field of OB theory and supply
chain performance in a contemporary global environment, with its emphasis on rapid
knowledge transference, governance and sustainability, led to the development of a new
approach to analysing organisational performance by using DEA to measure this
performance in a modern enterprise. Other performance metrics and measurement
processes were found to be myopic and often fragmented, reflecting the use of historical
modalities to analyse contemporary systems.
The new model was tested, and the new approach applied quantitative methodology to
field data, thus validating the framework by identifying strengths and weaknesses in the
model. However, this research covered only one aspect of corporate operations and
would need further study of the same nature to confidently exptrapolate the model to the
rest of the organisation and its SC.
7.2.1 The Need for Further Development
Globalisation, the encroachment of knowledge-empowered advanced economies on
world affairs, and the quest for sustainability of operations globally, reaffirms the need
for a new approach to doing business. The OECD’s (2006b) ‘Conference on
Globalization and the Knowledge Economy’ identifies one facet of globalization that
remains in relative obscurity; what is the link between innovation, structural change and
productivity growth on the one hand and cross-border linkages? The Issues Paper of that
conference commences with new evidence on globalization and its impacts: current
globalization is driven by strong growth in trade and foreign investment; value chains are
190
becoming increasingly globalised through ICT facilitation, meaning the production
process is fragmented across many countries; international outsourcing of inputs create
arms-length relationships; and there are more intermediaries in the value chain.
Global value chains positively affect some countries (those starting from a low base) but
this is mitigated by the intensity of the technology required in particular industry sectors,
and while globalization contributes to falling manufacturing employment its de-
industrialisation effect is largely domestic. Finally, there are a variety of positive as well
as negative effects, with the negative ones generally regarded as relatively short term.
Globalisation results in higher firm productivity but for advanced knowledge economies
this means moving up the value chain (Porter 1998) because specialization in traditional
cost-based industries is a much less viable option. The shift should be to more
technology and more knowledge intensive activities, but globalization also means that
the related R&D activities, including R&D facilities and investments, will also become
globalised. Furthermore, Manning and Baines (2004) note that the 2002 Commission of
the European Communities’ statement of the goal for the EU to “become the most
competitive and knowledge based economy in the world, capable of sustainable
economic growth with more and better jobs and greater social cohesion” identifies CSR
as a major strategy for meeting this goal. The bank studied in this research has recently
(2007) begun advertising its number one global rating for CSR.
Industries should integrate into a single policy the social and environmental concerns in
their operations and their interface with internal and external stakeholders. The costs of
social and welfare legislation are key factors in an organisation’s competitiveness. To
quote Manning and Baines:
Global governance and the interrelationship between foreign direct investment, trade and
sustainable development are key dynamics to CSR policy and the demands of both
internal stakeholders and those of external stakeholders for more sustainable investments,
compliance with internationally accepted standards and agreed instruments. The interest
in CSR benchmarking for social and environmental performance has led to an increase in
guidelines and codes of practice and also to social accountability. (p. 12)
These observations and projections support the contention of this thesis that the present
and future strategies of businesses in advanced knowledge economies do not benefit by
191
using antiquated management theories, traditional supply chain concepts and stultified
division of labour principles. Instead there is a need to redesign organisations, advance
holistic frameworks as a means of measuring the performance of these resurrected
organisations, and to support further work on developing optimization models such as
DEA. The redesign of the enterprise should commence with its commercial position in
the global knowledge economy and its standing with regards to governance and
sustainability. The redesign of an enterprise for the 21st century follows.
7.2.2 Strategy for Organisation Design of the Future
Setting organisational direction and establishing priorities is a difficult task at the best of
times. Planning for the future under incumbent scenarios requires effort at the helms of
industry. The senior managers of the organisation need to set future strategy with
foresight. They should adopt an OBPM-based strategy and plan for change since there is
no question that change is needed. OBPM as described in this thesis is an all-
encompassing construct based on certain axiomatic requirements which ultimately
dictate the use of quantification through optimisation models. These axioms include
empowerment, empathy, business ethics and support for employees. This is no small task
and challenging to the best of organisations. Some guidance in undertaking such a
strategic change comes from the experiences of Kaplan and Norton (2001) who state that
the:
…key to executing your strategy is to have people in your organisation who understand it,
including the crucial but perplexing processes by which intangible assets will be
converted into tangible outcomes. (p. 167)
In the knowledge economy businesses must increasingly create and deploy intangible
assets such as customer relationships, employee skills and knowledge capital, ICT, and a
corporate culture based on humanistic management and its encouragement of localized
problem-solving and organisational improvement. An OSTS model considers this as
seminal to organisational performance. In fact it encourages it through the vessels of
knowledge capital of people and technologically refined processes. We should not be
bound to the developments in the 20th century which were based on the optimization of
ideas and assumptions of 19th century principles (Van Amelsvoort 2000). The design of
192
the organisation is a critical issue. It should be a quality conscious organisation with
focus on customers, and flexible enough to be fully responsive to needs as they change.
More importantly, it must be innovative enough to produce an uniqueness in
product/service attractive to customers. This may, or may not, require some lateral
collaboration with supply chain partners.
The design of the new organisation should ideally comply with the synchronization of
four ideal-type models: the efficient organisation, the quality organisation, the flexible
organisation and the innovative organisation. Each an ideal type in the past, they evolve
and morph into the next as the company learns and grows (a Kaplan and Norton strategy
in the BSC). The organisation design for the globalised knowledge economy is one of
innovation, with tentacles into the virtual structures and transactions possible on the
internet. This is already happening as witnessed by the emergence of some of the biggest
companies the world has ever known.
The efficient organisation (type 1) is modeled on Porter’s cost leadership competitive
position which accentuates the need for efficiency of operations based on proven
strategies such as Lean, Six Sigma, JIT, BPR, and sometimes the integration of these
(Arnheiter and Maleyeff 2005) as well as the myriad of techniques that are known to
work. The efficient organisation of the future will also embrace ICT and the
computerisation of many routine tasks and processes, thus releasing human operators to
develop and apply their knowledge capital, adding to operational efficiencies. On the
next level, the quality organisation (type 2) embraces philosophies such as TQM where
good customer relationships are viewed as a competitive weapon. The quest is to provide
a quality product/service as defined by the customer and, not unlike the efficient
organisation, kaizen, or continuous improvement being the focus of attention. Again, this
invites employee participation and ownership through various teams-based approaches to
solve problems and improve processes. They are supported in their goal by a plethora of
kaizen tools, improved channels of communication, increased individual and team
responsibilities and, in typical fashion, a flattened organisation hierarchy.
The flexible organisation (type 3) is one which is able to respond to the changing
demands of a volatile market. The demands can include faster yet reliable deliveries,
193
greater product range and better service. These demands manifest themselves across the
whole supply network requiring a streamlined adaptability by the organisation.
Collaboration and cooperative relationships as well as a reduction in the number of steps
in processes can lead to reduced lead times and greater customer satisfaction. The ‘order
winners’ or ‘critical success factors’ become the primary focus, and management and
ancillary processes serve only in supporting roles. ICT can facilitate this by providing
information for decision making at the local level, thus again speeding up business
processes. This approach to flexibility and responsiveness, and an understanding of
supply chain partners’ needs, leads to an anticipatory mode of operation which bridges
the organisation to the next type, the innovative organisation (type 4). Uniqueness of
product/service provides a competitive advantage, as cited by Porter’s second strategic
position. The company can respond quickly and adapt itself to the demands of the new
situation. Temporary organisational structures can be created and formal job descriptions
diminish under increased person responsibilities. ICT also plays a role by structuring
flexibility into the information systems so that information may be readily accessed by
those that need it. The culture is customer-oriented together with a focus on the personal
development of employees so that they are more empowered and able to handle
situations that are not dictated in procedure manuals. This is a feature of humanistic style
management.
The strategic requirements to achieve the 21st century organisation design have six
dimensions, based on: structure, systems, task content and involvement, employee
knowledge and skills, working relationships, and industrial relations. How the 21st
century enterprise may look under this design is as follows in Table 7.1.
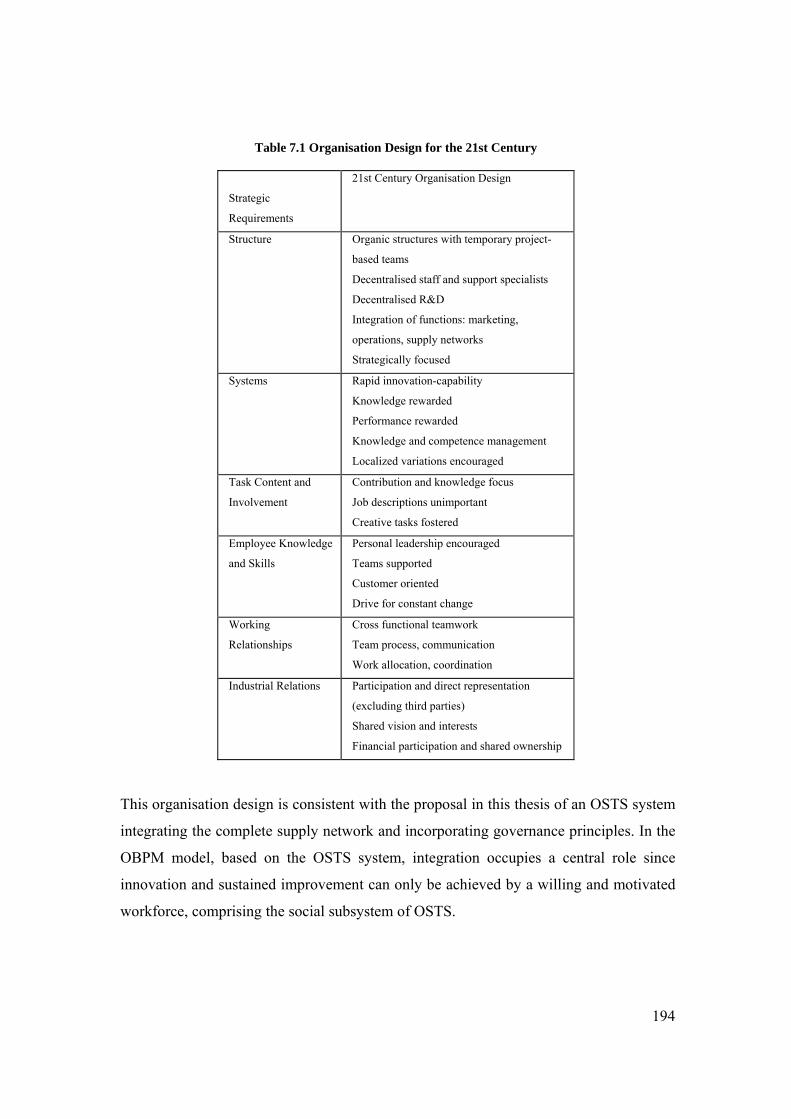
194
Table 7.1 Organisation Design for the 21st Century
Strategic
Requirements
21st Century Organisation Design
Structure Organic structures with temporary project-
based teams
Decentralised staff and support specialists
Decentralised R&D
Integration of functions: marketing,
operations, supply networks
Strategically focused
Systems Rapid innovation-capability
Knowledge rewarded
Performance rewarded
Knowledge and competence management
Localized variations encouraged
Task Content and
Involvement
Contribution and knowledge focus
Job descriptions unimportant
Creative tasks fostered
Employee Knowledge
and Skills
Personal leadership encouraged
Teams supported
Customer oriented
Drive for constant change
Working
Relationships
Cross functional teamwork
Team process, communication
Work allocation, coordination
Industrial Relations Participation and direct representation
(excluding third parties)
Shared vision and interests
Financial participation and shared ownership
This organisation design is consistent with the proposal in this thesis of an OSTS system
integrating the complete supply network and incorporating governance principles. In the
OBPM model, based on the OSTS system, integration occupies a central role since
innovation and sustained improvement can only be achieved by a willing and motivated
workforce, comprising the social subsystem of OSTS.
195
In traditional systems complexity and specialization of functions form an integral part of
a structure that has worked successfully for many decades. It has been extremely
effective because of stable environments, economies of scale, long lead times and
handicapped logistics systems. This is no longer the case, so the adaptive, responsive and
innovative system is the answer to the design of the new enterprise.
If OSTS were to be implemented in an organisation there are fundamental principles
that must be adhered to:
reduce organisation complexity;
develop and establish strong ongoing ICT support systems;
regulate locally through self managed teams;
disintegrate management but integrate management decisions by decentralizing
responsibilities;
adopt horizontal structures in coordinating decentralized decision-making;
make the self-managed team the smallest unit based on its task;
allow self-fulfilment to leadership roles in teams;
minimize rules and procedures allowing teams to set them;
promote personal growth, participation and ownership; and
measure performance on agreed results-based macro-outcomes rather than the
minutiae of individual task achievements.
A main tenet of OSTS, rooted in the original theory, is the importance of the ‘joint
optimisation’ of the social and technical subsystems. The organisation design discussed
above emphasizes the social and cultural changes needed. The technical system
requirements, especially with regard to performance management, is discussed next.
7.2.3 Integrating the PMS into the OSTS Designed Enterprise
The design of organisations in the 21st century must discard systems of the nineteenth
and twentieth centuries as mentioned in the above section. This applies equally to those
measures that are used to monitor performance of the organisation across all its
196
operations, including the SN. A system of measures, as required in any organisation
design, is also required for the OSTS design but adapted to the new environment. While
other management systems provide guidance through standards and codes, quality and
environment management standards (ISO 9000, QS 9000 and ISO 14000, in Waller
(2002)) are examples, there are no such auditable reference models available for PM
(Bititci, Carrie and Turner 2002). Those PM systems models discussed in the review
earlier, namely BSC, PP, TdeB, etc., are not universally accepted nor do they prescribe
system requirements as do auditable reference models of international standards. A new
PM system needs to be developed and can be based on the germination of this research.
The new system must mimic the OSTS design and comply with its principles. It must
use the organisation hierarchical structure, in this case very horizontal, as a template for
the structural relationships between the various measures. Preferably this would be an
integrated auditable system which would allow performance comparisons and
benchmark standards. Theses standards would reflect benchmarking methodology where
overall measures are used in making judgments, and would not be standards built up
from traditional ‘standard data’ type Taylorist systems. These benchmarks could, in
many instances be obtained from DEA studies, and in other cases from similar
operations research methodologies which provide global organisation metrics.
With the importance of knowledge capital, and the pervasiveness and benefactions of
ICT it would be integral to the system that PM be computer-based and internet-
facilitated across the complete supply network. The PM system should also facilitate
efficiency gains for all collaborative partners in the network because benchmarks of
performance could provide the drive for improvement. As an integrated system it would
also allow all stakeholders to access performance against their own particular goals, thus
maximizing ownership and facilitating proactive management. Furthermore, a PM
system should be simple to understand, incorporate control versus improvement
measures, and be user-friendly. It should be current, responsive and dynamic, allowing
for resources bargaining and movement to where they are best deployed. It should also
be able to project trends in the internal and external environments. This is best done,
easier to achieve, and most likely to succeed through ICT facilitation.
197
The PMS model which comes closest to meeting the requirements of an OSTS is the
proposal by Bititci, Carrie and Turner (2002), which adopts various systems models and
applies business process architecture to a four level hierarchy of the organisation’s
performance requirements. From the top down these metrics apply to: the business,
business units, business processes, and activities. These are described as follows.
The business operates a number of business units…each business unit operates a number
of operating processes, which are supported by a number or support processes. Finally
each business process operates a series of activities to fulfill its purpose. (p. 179)
Each of these levels has four elements.
1) Stakeholder Requirements – direction is set on an understanding of the
requirements of the stakeholders.
2) External Monitors – monitoring world best practice, competition and
developments against stakeholder needs.
3) Internal Objectives – set and deploy targets as needed, identified by gap
analysis.
4) Coordinate – monitor, review and communicate through PMS reports.
The Bititci proposal has a number of attractions that can be built on to meet the needs of
the OSTS design.
It reflects stakeholder requirements and the external competitive environment to identify
critical success criteria. It distinguishes between measures for improvement and those for
control, with the ability to distinguish between those that are leading and lagging, and
how critical these are. Qualitative measures are also accommodated. Simple
communication and direct access to metrics fosters an understanding of the relationship
between measures and promotes learning within the organisation as well. However,
while these are all valuable features of the PMS in OSTS, they are not enough. The
OSTS is embedded as a holistic model which includes all partners within the SN. The
Bititci proposal needs a fifth business level at the top of the hierarchy. This could be the
SN level. While Bititci does cater for stakeholder needs in his proposal, it appears that
this is tacit acknowledgment of stakeholders as part of the business environment rather
198
than a proactive engagement with them as part of the SN. It has been argued earlier that
corporate performance is related to supply chain performance and the latter therefore
should take part in the measurement system. The positive findings of this research,
within the Bank’s supply chain stakeholders affected by its CSR, supports that
contention. A supply network level within the business hierarchy architecture should be
included.
7.2.4 Integrating the Supply Network into the OSTS Designed Enterprise
The integration of the SC into the OSTS poses additional problems to merely asking
supply chain partners to adopt a similar management philosophy and to use common
metrics. Members of the SC are usually sovereign companies in their own right and with
idiosyncratic features which will probably differ to the main orchestrating partner and
others in the network, so it is unlikely that one model fits all. However, extensive work
by Cigolini, Cozzi and Perona (2004) has identified commonalities in over 100
companies they empirically surveyed in seven different industry sectors. They note the
schools of thought on SCM have evolved from traditional logistics to modern logistics,
where information flow joins physical flow as an important part of a system-wide
approach focusing on the customer rather than cost reduction, to the integrated process
redesign school, where radical redesign based on the pioneering work of Forrester (1961,
1968) led to the dynamic multi-echelon supply systems of quantitative models.
This was followed by the industrial organisation school with strategic alliances between
partners in the SC being based on transactional relationships stemming from discrete
transactions to cooperative arrangements to long term partnerships and ownership. This
thesis argues that the SC of the 21st century will exhibit the three latter designs with an
importance on system-wide ICT enhanced information flow, with collaborative
arrangements between partners, and with metrics such as DEA allowing chain-wide
efficiency comparisons.
There are two essential components to this new SC. These can be described as SC
system hardware and SC interfaces. The hardware relates to company choice of
operational system such as JIT, Continuous Replenishment, or Distribution
199
Requirements Planning while SC interfaces are the enablers of SC processes, whether
related to the design and configuration of the supply chain or its management. The
literature provides three broad categories of support for the SC interface. These interface
support mechanisms (ISM) are information tools, coordination and control tools and
organisation tools.
Information tools are utilized to gather, transmit and share data. They create and direct
the flow of information. Coordination and control tools are utilized to monitor and
influence the decision-making process, by measuring performances and setting rewards
based on achievement of certain results, while organisation tools are used to support
cross-company communication and coordination (Cigolini, Cozzi and Perona 2004 p. 17)..
Cigolini et al. designed a matrix to evaluate the main strategies of over 100 case studies
in their empirical survey. Essentially, they matched each company’s ISM against SC
configuration and SC management to define the SCM strategy of each organisation. All
companies used performance metrics and accounting to evaluate past performance, i.e. to
monitor performance, yet only 67% adopted performance metrics and 44% adopted SC
cost accounting systems to support vendor managed inventory or continuous
replenishment on-line. No one company met all the required criteria on the matrix, and
less than one-tenth had interface managers to facilitate the complex and articulated
relational work involved in long lasting collaborative relationships. They argue that
cross-firm performance metrics, accounting and incentive systems, are essential tools for
exploiting the full potential of an integrated supply chain.
Understanding how SCM strategies are generated and implemented can be improved. A
step forward may be to adopt the tenets of this thesis.
7.2.5 Integrating CG into the OSTS Designed Enterprise
Mainstream CG models: principal-agent, market model, executive power, and
stakeholder models (Letzo, Sun and Kirkbride 2004), rest their ideas and assumptions on
the theory of the firm which evolved from company law and classical economics in the
last century. Recent studies of CG depart from such old concepts of the firm, where the
perspective of the bounded entity of the shareholder gives way to stakeholder perspective,
and the firm is viewed as a permanent social entity which operates on universal
200
principles such as moral value and ethics, social justice and mutual trust, with ownership
rights maintained. Child and Rodrigues (2003) for example, argue for a new organisation
form which sees employees and junior partners co-opted into ownership and governance
to promote inclusive control, mutual monitoring and trust. This is not contrary to an
OSTS designed enterprise. All of this is possible within the views of the corporation as a
single entity, or an aggregation of individual entities, with blurred divisions between
inside and outside stakeholders and the environment. Once the bridge to stakeholder
acknowledgement is crossed the constructs of earlier organisation CG, such as the
agency problem, are less valid. Theories grounded on simple economic rationalism do
not account for the irrationalities of emotion, values and beliefs, culture and social
relationships, but these factors need to be included. If for no other reason, this research
shows that they must be considered in any system of corporate PM, and that they can be
measured. The task at hand is to develop this idea further so that measures become
meaningful to the CG debate and to organisation performance.
Another task is to develop a meaningful measure of CG as the stepping stone to
measuring all those other critical success factors in the whole SN. In effect a scorecard
approach is warranted. The metrics for the ultimate score could be the aggregation of the
individual DEA results of earlier studies. One of these, the CSR component of CG has
been focused on in this thesis. The empirical work for such an approach was reported at
the 1st International Conference on Corporate Governance in Birmingham 2002.
Strenger (2004) suggests a two-step approach: establish a ‘Code of Practice’ for CG and
then develop a scorecard from this code. The scorecard should: provide for investors and
analysts to be able to easily review issues of governance; enable companies to assess
their penetration to stakeholder engagement; allow scoring of performance, minimums
and benchmarks; and allow rapid communication to interested parties via enabled
internet facilities. Such an idea fits snugly with the tenets of this thesis. The relevant
metrics could be labeled as KPIs for: CG Commitment, Shareholder and General
Meeting Issues, Stakeholder Issues, Board Remunerations, Supervisory and Auditory
Standards, Transparency, and Auditing and Financial Reporting Standards. Each would
invite an efficiency performance score. These suggested indicators would necessarily
need to be weighted according to their importance and impact. Weighting, as discussed
201
earlier, is a recognized influential component of the DEA algorithm. If the DEA
approach to weighting factors is unacceptable then an alternative such as AHP is a
worthy contender, while alternative techniques such as ‘genetic algorithms’ are also
being suggested. Weighting is generally an heuristic issue. The governance metric from
these computations would provide a partial score for the overall scorecard which would
have other partial scores from the other dimensions: supply chain suppliers, customers
and internal operations of the firm. These too, would naturally be weighted for
importance of contribution. The total picture is now emerging. The scorecard is really a
‘score dashboard’ where there are a number of important indicators displaying various
aspects of performance. This novel concept is worth pursuing.
7.3 Conclusion
This chapter discussed the implications of the research findings on the development of a
contemporary OBPM model appropriate to the enterprise of the 21st century. It has
highlighted the need for a responsive, proactive and engaging organisation in the new
global knowledge economy. The first step toward this goal is through CG with CSR as a
major strategy. CSR can be measured, with operations research methodology as shown
in this thesis, so it can therefore be analysed and used in strategy formulation. The
research showed strong support for humanistic management, empowerment and business
ethics, thus enhancing the knowledge capital of employees.
This cultivates positive stakeholder relationships giving the enterprise a competitive
edge in the current economic climate. To achieve such a goal the organisation must
adopt OSTS and develop a comprehensive PM system. The PMS should cross the
dimensions of the performance pyramid to integrate CG, company operations, and the
supply network.
202
Chapter 8
Summary, Conclusion and Future Research
Science, not rule of thumb. Harmony not discord. Cooperation, not individualism.
Fredrick Winslow Taylor 1856-1915
8.1 Introduction
This chapter concludes the thesis by providing a summary of the development of the
main study and a review of its achievements. It commences with an analysis of the
contemporary business arena as the backdrop for this study. It then critically reviews
those academic disciplines and fields of study that are pertinent to this research. This
then germinates the new approach to PM which is tested with a novel optimization
model founded in econometrics and operations research. PM and OB are then discussed
in view of the results obtained from the testing of empirical data from a large Australian
commercial enterprise. The contributions of this thesis are revisited and the limitations of
the current research are discussed. It concludes by discussing emergent issues and
directions for future research.
8.1.1 Foundations in a Global Knowledge Economy
The first chapter established Australia’s position in the global economy with a review of
its unprecedented growth to become one of the world’s top economies. It identifies the
challenge of meeting the competitive demands of globalisation as the major issue for
companies in the 21st century. PM is introduced as the mechanism which allows
benchmarking for international competitiveness. At the same time, there is also a need
for a new approach to OB theory. The recognition of the value of human capital in the
knowledge-economy company means that a ‘people focused’ model is needed. How the
company is run also depends on its CG so this element is introduced here to address the
203
needs of all the different stakeholders and their pressures on the company. Systems
theory allows the firm to be viewed as part of the greater supply chain in which it
operates and where many of the stakeholders play their roles. At this point we highlight
the significant impact of developments in computerization and ICT in the recent past,
and the greater role they will play in the future global knowledge economy.
The number of failings in traditional approaches to measuring organisation performance
suggests the need for a move from traditional measures to new ones relevant to the new
era. The optimization technique of DEA, with its econometric success in the
measurement of efficiency, is introduced as a tool for the new era. This chapter then
states the objectives of this research, namely to: identify the new role of management;
identify the competitive forces driving performance; identify the stakeholders and their
involvement; and to develop a new approach to PM. By revealing the flaws in PM
approaches of the past, the study identifies the gap in knowledge which this thesis
addresses. Its contribution lies in the integration of the fields of OB and organisation
design, SCM and PM, through the positivist stance allowed in an operations research
methodology. Its contribution permits the analysis of organisation performance as
measured by pragmatic relative efficiencies of equitable business units across defined
functional and social relationships in the total supply chain. The efficiency comparisons
can be conducted in parallel with other benchmarks or key performance indicators that
already exist, but DEA provides greater insight where these are absent or unattainable by
other methods. The principal contribution however, is the new application of DEA as
part of the methodology which allows the measurement and analysis of performances of
organisations in their conduct of CSR, often viewed as a qualitative construct.
8.1.2 Critical Review of the Literature
A review of current and significant past thinking on the subject of this thesis indicates
there is much evidence to suggest that the globalization witnessed in the past few
decades is not a repeat of expansive global economic movements of the past. The
discriminating feature is the emergence of the pervasive technologies inherent in
computerization and its information communication technologies, including the
worldwide web and the internet. The exponential expansion of computing power and the
204
reciprocal decrease in computing costs has meant that processes and communications
previously burdensome, time-consuming and costly have given way to cheap, expedient
and instantaneous modern equivalents of those tasks. Going beyond the ‘information
age’, it is now argued by many that we are in a ‘knowledge age’ and thus within a global
knowledge economy. Australia has fared well because of its fluidity and responsiveness
to these developments and other factors as well, but needs to maintain the competitive
momentum as much of the rest of the world catches up. This requires a revamp of
successful past strategies to be relevant to the new globalised marketplace.
The changes require a new mode of management involving OSTS design of
organisations and the CG view of responsibilities to stakeholders and the environment.
The OSTS has a convincing foundation in the Human Relations School of Management
and the work of the Tavistock Institute, together with systems theory. This approach
posits the proposition that CG, in the modern context of ethics and morality in business,
is the procreator of successful performance in the organisation and the supply chain in
which it operates. The acceptance of an humanistic style of management also fares well
with enhancing the strengths of knowledge capital through the ‘empowerment’ of self-
directed teams. A minimalist organisation structure designed around a knowledgeable
workforce empowered to work responsibly makes for a flexible, responsive and efficient
enterprise. These issues were reviewed under the headings of globalization, OSTS of OB,
CG and CSR. The related issues that followed dealt with the SCM contribution to
organisation competitiveness and the need for its inclusion in models of efficiency
because the SC is in reality a network of stakeholders who can impact on company
operations through their operational relationships. Measures of organisation performance
have traditionally been modeled on company operations as singular units rather than
unit-parts of a network. If the established modes of measuring efficiency are lacking then
what can replace them? The answer lies in the application of operations research
methodology which provides macro-measures, rather than the aggregation of minutiae
blocks of efficiency metrics. DEA is able to perform well under these requirements, and
the literature attests to how well it has performed under extremely diverse scenarios and
often in unexpected studies. A history of the development of DEA provides an insight
205
into its suitability as a novel application for this study, and leads to discussion about the
development of DEA as the new approach to PM.
8.2 A New Approach to PM
8.2.1 The Conceptual Framework for the Measurement Methodology
The research methodology of this thesis is positivistic and empirically based. Chapter 3
describes the conceptual framework for the measurement of performance and draws on
previous research that delineates precursors for successful organisation performance
systems. As a result, a conceptual PM framework, resulting in a performance pyramid is
proposed. This framework addresses the need to include all stakeholders in corporate
strategy formulation, and to consider financial and non-financial factors as well as CG,
as the crucial success factors that need to be measured. The roles of ICT and
computerisation are acknowledged as integral to the PMS that evolves. The concept of
this framework is projected onto the supply network, from suppliers to customers, and of
course on internal company operations. The thesis postulates however, that organisation
performance is founded in CG or the way the company is run, therefore this should be
the pertinent starting point. Organisational performance is measured by productivity as
the ratio of all outputs to all inputs, i.e. of all goods and services to all resources used in
achieving these, and therefore improvements in productivity lead to improvements in
performance. The instrument to do this, through an operations research methodology, is
discussed the DEA algorithm is demonstrated as the most suitable.
8.2.2 DEA
As a linear programming methodology, the mathematics of the DEA technique is
explained and exposited. The algorithm is compared to other ways of measuring
efficiency and to other related mathematical models, concluding that they are not
suitable for the purpose of this study.
The chapter on DEA is seminal to this thesis because it discusses the basis for
performance as the efficiency computation for total factor productivity where the key
elements are the input and output factors expressed in ratios that define the production
frontier.
206
This construct of efficiency is that each DMU has a standing in relation to the production
frontier and that those that are the best performers on a particular measure are the ones
that delineate the frontier and define the levels of best performance. Others are matched
against these best performers, hence the success of the technique in that it does not try to
impose best performance but merely identify best performers, a true benchmarking
metric.
Since DEA is well established and has undergone development and refinement since the
late 1950s, the basic model explained in this chapter is extended to show the value and
impact of some of the additional work on the model, including how it can be married
with other techniques such as Analytical Hierarchy Process to strengthen its application.
There are however, some assumptions, limitations and related issues that the researcher
must be aware of and these are fully discussed in the chapter.
8.3 DEACSR Model and Results
8.3.1 DEA for Corporate Governance
As a methodology for measuring performance, DEA is fully analysed in its premise that
performance is measured by efficiency. The theory of efficiency of the input-output
transformation in production economics is scrutinized as a basis for this model’s
suitability for the research purpose. The analysis commences from the basic model to
extensions that were later developed, and an interpretation of their meanings in relation
to the study requirements. Technical and allocative efficiencies with input or output
orientations, with slack and different returns to scale were all considered as integral to
the model required. An emphasis was also placed on the importance of the weighting
factors and how these are assigned, with evidence of differing approaches from various
authors. The strengths of DEA were investigated with a precaution on the assumptions
that are made. As a non-parametric technique there is also reference to the limitations of
this type of technique and some thought given to alternatives. Other related equivocal
issues, such as numbers of DMUs and the number of input and output factors are also
discussed. Once it was established that this approach was suitable for measuring
efficiencies in dimensions of CG, it was tailored to the factors affecting CSR.
207
In particular, it was tailored to build on recently completed research which had already
established an organisational capacity for CSR. CSRMC as a concept had recently been
validated by the doctoral thesis of Dr Black at Monash University (Melbourne,
Australia). The raw data and empirical findings of her research for a major Australian
bank were made available for this study. It should be noted that there is no relationship
between the research of that thesis and this one other than the use of the same data pool.
The model developed and tested in this research is the application of DEA to the
measurement of performance of an organisation on its CSR (known as the DEACSR
model).
8.3.2 The DEACSR Model
The DEACSR model was formulated from the application of DEA methodology to the
factors governing CSR performance. The CSRMC construct identified a number of
antecedent factors which correlated with, and were predictive of CSR performance, but
while these correlations supported the construct they did not identify which were the best
performing business units, nor the combination of factors which provided an efficiency
rating of 100% for the best performing units. The application of the DEACSR model
required an analysis of all factors in the CSRMC construct to identify those that met the
criteria of input factors and those that were extraneous to efficiency calculations. The
antecedents of CSR in the CSRMC model are communication, humanistic organisation,
organisational support, integrated ethics, justice and commitment to ethics. A number of
trials were conducted to ascertain the relevant variables, resulting in six factors as input
for the singular CSR output. These input factors were: 1) communication, 2) humanistic
orientation, 3) integrated ethics, 4) commitment to ethics, 5) perceived organisation
support, and 6) distributive justice. They were then tested in a number of permutations of
all factors, including a de-segregation of the single output factor. The tests provided
unequivocal support for 11 DMUs from a cohort of 231. Others were found to be
efficient under different constraints, while some results remained debatable. The strength
of the findings was in the unambiguous support for the same eleven units in all tests, and
in the technical explanations why some others could be rated as efficient in given
circumstances.
208
These results give strong support for DEA’s ability to discriminate between efficient and
non-efficient units in the organisation, which then allows further analysis of the various
factors.
The inter-item correlations of the indicative factors across all tests allowed an analysis of
the antecedents of CSR in the CSRMC model. The results provide strong endorsement
for an humanistic organisation that is supportive of its employees. This type of
organisation is strongly committed to business ethics, and these are integrated in all
business dealings. There was little support for communication and perceived justice as
antecedents of CSR. This may be possibly explained by the view of the study
respondents that the organisation did not communicate freely with external stakeholders,
nor that it distributed justice equally.
8.4 Performance Measurement and Organisation Behaviour
The results of the trials and tests in this study were discussed in Chapter 6 but are worth
visiting in terms of their meaning to OB and the measurement of factors of performance
often judged to be qualitative. It is maintained, and supported by the literature, that styles
of management affect OB in distinctive ways. A humanistic style of management is
more empathetic and understanding of its employees and likely to encourage empowered
decision-making and more responsibility for self-directed teams. This should improve
organisation performance. Substantial support for these ideas was reported in the
findings of the 231 DMUs in six divisions of the bank, 11 of them were found to be the
most efficient. An analysis of the efficient units then revealed a number of contributing
factors which align with the contention above.
Perceived organisational support through feelings of empowerment was strongly
correlated with other factors of efficiency, exceeding the threshold in 38 of the 48 inter-
item comparisons. This was strongly followed by the two factors humanistic orientation
and management commitment to ethics, with both scoring 34 of the 48 inter-item
comparisons. Integrated ethics also exceeded the correlation threshold, while
communication accuracy and distributive justice both rated very poorly. Other factors of
significance to the OSTS model were: stakeholder identity, where the firm realizes its
209
future is linked to these groups; dialogue, which is a respectful attitude and power-
sharing; and ethics atmosphere where people sincerely care about others.
Slightly less significant were the factors of ethics compliance, meaning the formalization
of ethical systems, social accountability and reporting, and attuned public awareness of
stakeholder values. These lend support to the OB stance of the OBPM model, just as the
DEACSR supports the measurement of efficiency.
The ability of DEACSR to measure the performance of one aspect of CG suggests it has
further use in the assessment of how well other critical success factors are performing.
The OSTS-designed organisation can for example, be measured in terms of its structural
flexibility, knowledge management, team leadership and customer orientation, as well as
shared vision and a strategic focus on driving change. It may be amalgamated with other
necessary and well established measures of performance such as financial accounting,
quality, and environmental codes, which have the backing of auditable reference models
of international standards.
8.5 Limitations and Areas for Further Research
8.5.1 Limitations of the Present Research
This study provides strong support for a PM DEACSR model, but it has limitations
incurred by the constraints of a doctoral thesis: lack of resources for a more in-depth
investigation, and inherent deficiencies in some of the applications. These limitations fall
into four categories: the DEA technique and its quirks, the source and quality of
secondary data, the CSR construct itself, and the extrapolation of results to the complete
supply network.
DEA is an established powerful non-parametric technique. It is so well established that it
has had many applications and a variety of developmental changes to the base model.
There are so many versions with different criteria that the first question is ‘which is the
right model of DEA for this task?’ Should it be input or output oriented? Should it have
an increasing, decreasing, or constant returns to scale? Should the technique be one of
the more exotic models or a new adaptation? These concerns were addressed by being
conservative in choice and thus possibly being conservative in findings. But there are
210
related concerns with DEA as a technique. It is unduly influenced by outliers, such that a
single DMU with particular input-output characteristics can significantly change the
production frontier, thus rearranging the rated efficiencies of all other DMUs.
This outlier may also be hard to detect. However, there is no reason to suspect the
presence or influence of outliers in this research.
The other widely debated feature of DEA is the assignment of weightings to the various
factors. Different weights will undoubtedly affect the results of the computation. For this
reason it was decided to be conservative in the present study and allow weighting to be
assigned by the technique itself. It has been hailed for not requiring or providing absolute
scores, that its strength is in its comparative nature; but sometimes absolute values are
necessary for detailed analysis of the result. Instances where analysis may be needed
include when the homogeneity of DMUs is a concern. DEA assumes all units are
homogenous but in qualitative and poorly selected variables this may not always be true.
Its non parametric nature means that inferential statistics cannot be applied, and there are
no specific rules for its application prescribing limits on DMUs and number of input or
output variables. At best there are the heuristic ‘rules of thumb’ advised by some
researchers.
The most significant limitation of DEA however, is its inability to provide measures of
efficiency for singularly different DMUs which have no others to compare against. For
example the case of one supplier, if there are not a number of suppliers with comparable
characteristics in the supply chain then the concept of comparison against other
equivalents is untenable. Other KPIs are required.
Another limitation of this study is the data source and its quality. While secondary data
used in this study is only one step from the primary source, it will never provide the
depth of information gathered first hand with specific intent. The data was gathered for
another purpose with a focus on other needs, so it does not have all the information that
could be valuable in a study of this sort. For example, while there was no need in the
original data collection to note the physical surrounds of the DMUs and features of the
working environment, this information may have been useful in a question, as raised
above, of returns to scale: does the physical environment have a bearing on the research
211
question? The data gathering for the other study and used in this one, is assumed to be
robust and statistically validated. While that study provided the evidence to support this
notion, there is no evidence that the questionnaire design was scrutinized and
standardized for the frames of reference for this study.
The third limitation to this study is the question surrounding the CSR construct. It has
been assumed for this thesis, on the basis of solid literature, that CSR is an important
dimension of CG. Firstly, how important is it to CG, what is its weighting, and what
other factors need to be included in the CSR construct? Can it be treated as an unique
element within the CG dimension, and therefore studied as such, or is it part of the
greater concept where all the elements are intertwined? If it can be studied in isolation to
the whole CG dimension, then what other elements are significant contributors to CSR?
In this particular study however, there needs to be further analysis of the eleven efficient
DMUs to compare and contrast their input factors to understand why they were the
outstanding performers.
The final limitation is the substantiation of a major model for PM to the whole supply
network from what could be considered seminal beginnings. As discussed in the next
section, the attainment of an holistic PMS, which is applicable to all enterprises across
their respective supply chains, is a mammoth task. To extrapolate from the successful yet
relatively minor findings of this study requires more academic research.
8.5.2 Implications and Direction for Future Research
The objective of PM as described in this study, and integral to the thesis, is the value that
it places on organisational systems which are designed to make the company competitive
and responsive to changes as they speedily present themselves in a globalised knowledge
economy. The ultimate objective of measuring performance is that it provides a
benchmark against which decision-making is leveraged. The past performances are
judged against present performances and analyses, and these help in the quest forward.
In no diminished sense are these metrics used for strategy formulation. Numbers count
and “wherever you can, count” (Sir Francis Galton 1822-1911).
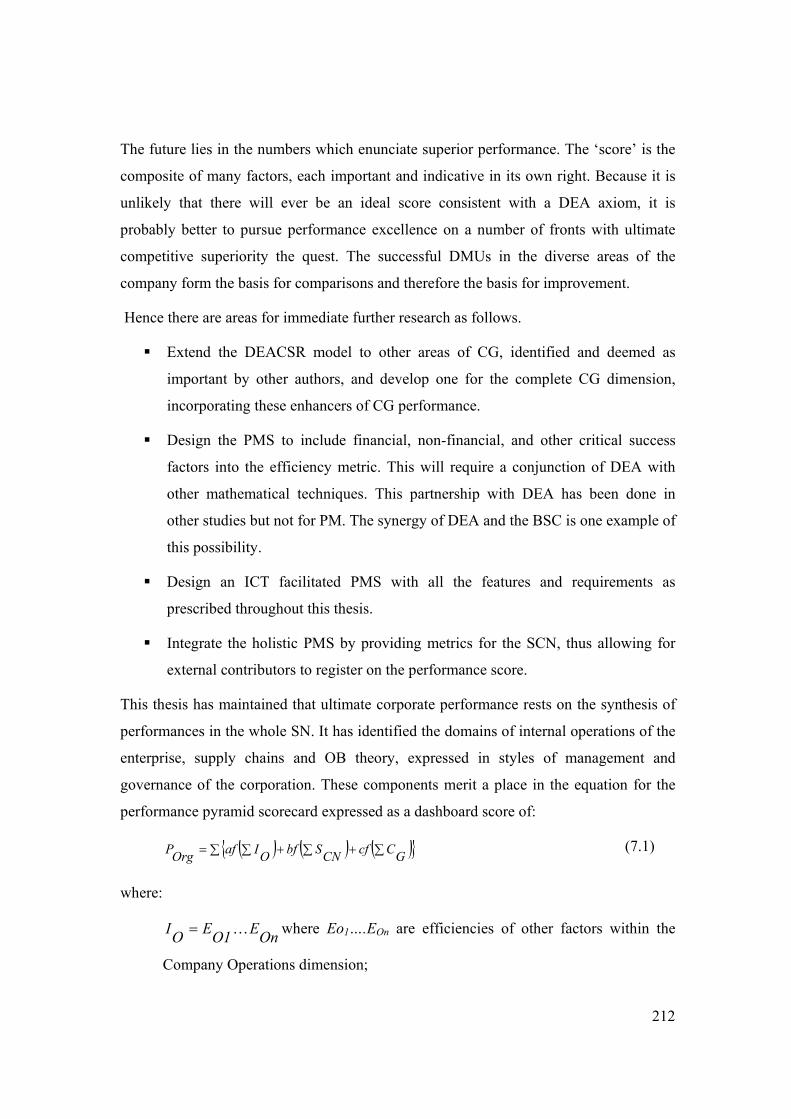
212
The future lies in the numbers which enunciate superior performance. The ‘score’ is the
composite of many factors, each important and indicative in its own right. Because it is
unlikely that there will ever be an ideal score consistent with a DEA axiom, it is
probably better to pursue performance excellence on a number of fronts with ultimate
competitive superiority the quest. The successful DMUs in the diverse areas of the
company form the basis for comparisons and therefore the basis for improvement.
Hence there are areas for immediate further research as follows.
Extend the DEACSR model to other areas of CG, identified and deemed as
important by other authors, and develop one for the complete CG dimension,
incorporating these enhancers of CG performance.
Design the PMS to include financial, non-financial, and other critical success
factors into the efficiency metric. This will require a conjunction of DEA with
other mathematical techniques. This partnership with DEA has been done in
other studies but not for PM. The synergy of DEA and the BSC is one example of
this possibility.
Design an ICT facilitated PMS with all the features and requirements as
prescribed throughout this thesis.
Integrate the holistic PMS by providing metrics for the SCN, thus allowing for
external contributors to register on the performance score.
This thesis has maintained that ultimate corporate performance rests on the synthesis of
performances in the whole SN. It has identified the domains of internal operations of the
enterprise, supply chains and OB theory, expressed in styles of management and
governance of the corporation. These components merit a place in the equation for the
performance pyramid scorecard expressed as a dashboard score of:
( ) ( ) ( ) ∑ ∑+∑+∑= GCcfCNSbfOIafOrgP (7.1)
where:
OnE1OEOI K= where Eo1….EOn are efficiencies of other factors within the
Company Operations dimension;
213
CNnE1CNECNS K= where ECN1….ECNn are efficiencies of individual SC
partners in the network;
GnE1GEGC K= where EG1….EGn are efficiencies of different CG dimensions;
POrg is the performance score for the corporation within the whole SC,
quantifying all scores across all dimensions of the pyramid;
IO is the metric indicating internal operations performance from KPIs for
O =1 to n;
SCN is the function of the supply network for N=1 to n; and
CG is the representative statistic for CG across G=1 to n; and
a, b, c are weighting factors for each efficiency dimension.
The challenge remains, not only to develop this scoring dashboard, but to generalize its
applicability to any enterprise across its supply chain. This would be the appropriate
integrated PMS for enterprises in the 21st century.
8.6 Conclusion
The new application in this research has been the development of an holistic framework
for PM of an Australian enterprise using DEA to ascertain the efficiencies of various
business units with regard to their CSR contribution to CG. This has been achieved
within the context that the firm operates in a supply network which must facilitate the
needs of all stakeholders. Such outcomes are also concomitant to the style of
management espoused by OB theory which, in this instance, involved the paradigm
factors of OSTS theory that provide the platform for competitiveness in the new global
knowledge economy.
214
The ongoing commercial success and public affirmation of the enterprise’s corporate
citizenship attest, at least in some part, to the performance achievements of business units
as studied in this thesis. This research also endorses the company’s commitment to
performance improvement through the adoption of a mantra of ‘management by
empowerment and ethics’. The success of the latter is also the test that justifies the
transfer of a theoretical construct to ‘real world’ settings and validates its application.
However, pragmatically and academically the journey has just begun.
The holistic framework provided by this thesis is the foundation for further academic
research. It allows other researchers to investigate and contribute to a number of facets of
this paradigm. There is a rich array of future research in the disciplines of OB, supply
chain and operations management, and CG. Each of these merit further investigation
from a PM stance that uses DEA in an operations research methodology. By identifying
and measuring the critical factors in each of these dimensions they may contribute to the
‘scoring dashboard’ and the ultimate performance metric. The author will continue to
research topics in this exciting fertile area and work towards stimulating and supporting
others to do likewise.
215
Bibliography
ABS, 2006a, Business Operations and Industry Performance, Australia 2000-2001, cat. no. 8140.0, Australian Bureau of Statistics, Canberra, viewed 10 Jan 2007, <www.abs.gov.au>.
ABS 2006b, Australian Industry 2004-2005, cat. no. 8155.0, Australian Bureau of
Statistics, Canberra, viewed 8 Feb 2007, <www.abs.gov.au>. ABS 2006c, Innovation in Australian Businesses 2005, cat. no. 8158.0, Australian
Bureau of Statistics, Canberra, viewed 12 Feb 2007, <www.abs.gov.au>.
ABS 2006d, Australian National Accounts: Information and Communication Technology Satellite Account 2002-2003, cat. no. 5259.0, Australian Bureau of Statistics, Canberra, viewed 11 Feb 2007, <www.abs.gov.au>.
ABS, 2006e, Year Book Australia 2006, cat. no. 1301.0, Australian Bureau of Statistics, Canberra, <www.abs.gov.au>.
Adams, C & Neely, A 2000, ‘The performance prism to boost M&A success’, Measuring Business Excellence, vol. 4, no. 3, pp. 19-23.
Adler, A & Docherty, P 1998, ‘Bringing business into sociotechnical theory and practice’, Human Relations, vol. 51, no. 3, p. viewed 20 November 2006, <http://infotrac.galegroup.com>.
Afriat, SN 1972, ‘Efficiency estimation of production functions’, International Economic Review, vol. 13, no. 3, pp. 568-598.
Agrawal, A & Knoeber, C 1996, ‘Firm performance and mechanisms to control agency problems between managers and shareholder’, Journal of Financial and Quantitative Analysis, vol. 31, no. 3, pp. 377-397.
Aguilera, RV, Williams, CA, Conley, JM & Rupp, DE 2006, ‘Corporate governance and social responsibility: a comparative analysis of the UK and the US’, Corporate Governance: An International Review, vol. 14, no. 3, pp. 147-158.
Ahmad, N, Berg, D & Simons, GR 2006, ‘The integration of analytical hierarchy process and DEA in a multi-criteria decision-making problem’, International Journal of Information Technology and Decision Making, vol. 5, no. 2, pp. 263-276.
216
Ahmed, NU, Montagno, RV & Firenze, RJ 1996, ‘Operations strategy and organisational performance: an empirical study’, International Journal of Operations and Production Management, vol. 16, no. 5, pp. 41-53.
Aigner, DJ & Chu, SF 1968, ‘On estimating the industry production function’, American Economic Review, vol. 58, pp. 826-839.
Aigner, DJ, Lovell, CAK & Schmidt, PJ 1977, ‘Formulation and estimation of stochastic frontier production function models’, Journal of Econometrics, vol. 69, July, pp. 21-37.
Allens, Arthur and Robinson 2004, ASX Corporate Governance Council: Disclosure, viewed 30 August 2004, <www.aar.com.au/corpgov/asx/disc.htm>.
Alves, C & Mendes, V 2004, ‘Corporate governance policy and company performance: the Portuguese case’, Corporate Governance, vol. 12, no. 3, pp. 290-301.
Amaratunga, D, Baldry, D & Sarshar, M 2001, ‘Process improvement through performance measurement: the balanced scorecard methodology’, Work Study, vol. 50, no. 5, pp. 179-188.
Anderson, T 2005, A DEA (DEA) Home Page, viewed 26 May 2006, <www.emp.pdx.edu/dea/homedea.html>.
Armistead, C & Machin, S 1997, ‘Implications of business process management for operations management’, International Journal of Operations and Production Management, vol. 17, no. 9, pp. 886-898.
Armistead, C, Harrison, A & Rowlands, P 1995, ‘Business process re-engineering: lessons from operations management’, International Journal of Operations and Production Management, vol. 15, no. 12, pp. 46-58.
Arnheiter, ED & Maleyeff, J 2005, ‘The integration of lean management and six sigma’, The TQM Magazine, vol. 17, no. 1, pp. 5-18.
Arthur D Little 2003, Global corporate citizenship: the leadership challenge for CEOs and boards, Beacon Press, London.
ASX CG Council 2003, Principles of Good Corporate Governance and Best Practice Recommendations, viewed 1 May 2005. <www.asx.com.au/supervision/governance/index.htm>.
217
Atkinson, AA, Banker, RD, Kaplan, RS & Young, SM 1997, Management accounting, 2nd edn, Prentice Hall, New York.
Austin, R and Gittell, K 2002, ‘When it should not work but does: anomolies of high performance’, in A Neely (ed.) Business performance measurement : theory and practice, Cambridge University Press, Cambridge, pp. 80-106.
Avkiran, NK 2006a, personal communication 9 September.
Avkiran, NK 2006b, Productivity analysis in the service sector with DEA, 3rd edn, Avkiran, Ipswich Australia.
Avriel, M & Golany, B 1996, Mathematical programming for industrial engineers, Marcel Dekker, New York.
Bain, N & Band, D 1996, Winning ways through corporate governance, Macmillan Business, Hampshire.
Bamford, DR & Forrester, PL 2003, ‘Managing planned and emergent change within an operations management environment’, International Journal of Operations and Production Management, vol. 23, no. 5, pp. 546-564.
Banker, RD, Charnes, A & Cooper, WW 1984, ‘Some models for estimating technical and scale inefficiencies in DEA’, Management Science, vol. 30, no. 9, pp. 1078-1092.
Barratt, M 2004, ‘Unveiling enablers and inhibitors of collaborative planning’, International Journal of Operations and Production Management, vol. 15, no. 1, pp. 73-90.
Basu, R 2001, ‘New criteria of performance management: a transition from enterprise to collaborative supply chain’, Measuring Business Excellence, vol. 5, no. 4, pp. 7-12.
Batten, JA & Fetherston, TA (eds) 2003, Social responsibility: corporate governance issues, vol. 17, JAI Elsevier Science, Oxford.
Beach, R & Muhlemann, AP 2000, ‘Manufacturing operations and strategic flexibility: survey and cases’, International Journal of Operations and Production Management, vol. 20, no. 1, pp.7-30.
218
Beamon, BM 1998, ‘Supply chain design and analysis: models and methods’ International Journal of Production Economics, vol. 55, no. 3, pp. 281-294.
Beasley, JE 1990, ‘Comparing university departments’, Omega, vol. 18, no. 2, pp. 171-183.
Beauchamp, TL & Bowie, NE 1993, Ethical theory and business, 4th edn, Simon & Schuster, New Jersey.
Bertalanffy, LV 1968, General systems theory: foundation, development, applications, G. Braziller, New York.
Bessent, A, Bessent, W, Kennington, J & Reagan, B 1982, ‘An application of mathematical programming to assess productivity in the Houston independent school district’, Management Science, vol. 28, no. 2, pp. 82-107.
Bhasa, M, P. 2004, ‘Understanding the CG quadliteral’, Corporate Governance, vol. 4, no. 4, pp. 7-15.
Bititci, US, Carrie AS & McDevitt, L 1997, ‘Integrated performance measurement systems: a development guide’, International Journal of Operations and Production Management, vol. 17, no. 5, pp. 522-534.
Bititci, US, Carrie, AS & Turner, TJ 2002, ‘Integrated PM systems: structure and dynamics’, in A Neely (ed.) Business PM: theory and practice, 1st edn, Cambridge University Press, Cambridge, pp. 174-197.
Bititci, US, Nudurupati, SS, Turner, TJ & Creighton, S 2002, ‘Web-enabled PM systems; management implications’, International Journal of Operations and Production Management, vol. 22, no. 11, pp. 1273-1287.
Bititci, US, Turner, TJ & Begemann, C 2000, ‘Dynamics of performance measurement systems’, International Journal of Operations and Production Management, vol. 20, no. 6, pp. 692-704.
Black, LD 2004, ‘How companies manage for good: a model of management capabilities developed from social responsiveness and public relations theory and tested in Australia’, Doctoral Thesis, Monash University.
219
Bosetti, V & Buchner, B 2005, Using DEA to assess the relative efficiency of different climate policy portfolios, Milano. Research Paper 82.2005 Fondazione Eni Enrico Mattei, viewed 9 June 2006, <http://ssrn.com=740306>
Bourne, M 2003, ‘Guest editorial: business performance measurement and management’, Management Decision, vol. 41, no. 8, pp. 679-679.
Bourne, M, Franco, M & Wilkes, J 2003, 'Corporate performance management', Measuring Business Excellence, vol. 7, no. 3, pp. 15-21.
Bourne, M, Mills, J & Faull, N 2003, ‘Operations strategy and performance: a resource-based view’, International Journal of Operations and Production Management, vol. 23, no. 9, pp. 944-946.
Bourne, M, Mills, J, Wilcox, M, Neely, A & Platts, K 2000, ‘Designing, implementing and updating performance measurement systems’, International Journal of Operations and Production Management, vol. 20, no. 7, pp. 754-771.
Bourne, M, Neely, A, Platts, K & Mills, J 2002, ‘The success and failure of performance measurement initiatives: perceptions of participating managers’, International Journal of Operations and Production Management, vol. 22, no. 11, pp. 1288-1310.
Bowersox, DJ, Closs, DJ & Cooper, MB 2007, Supply chain logistics management, 2nd edn, McGraw Hill Irwin, Boston.
Bradbury, M & Rouse, P 2002, ‘An application of DEA to the evaluation of audit risk’, Abacus, vol. 38, no. 2, pp. 263-279.
Bradley, N 2004, ‘Corporate governance scoring and the link between corporate governance and performance indicators: in search of the Holy Grail’, Corporate Governance, vol. 12, no. 1, pp. 8-10.
Briffaut, JP & Saccone, G 2002, ‘Business performance sustainability through process modeling’, Measuring Business Excellence, vol. 6, no. 2, pp. 29-36.
Brown, LD & Caylor, ML 2004, ‘Corporate governance and firm performance’, SSRN Social Science Research Network, viewed 7 April 2005, <http;//papers.ssrn.com/sol3/papers.cfm?abstract_id=586423>
Brown, R 2001, ‘DEA: application issues in the financial services sector’, University of Melbourne, Melbourne.
220
Buchanan, B 2004, ‘Australian corporate casualties’, in MJK Hirschey, & AK Makija, (eds) Corporate governance and finance; advances in financial economics, vol. 8, Elsevier, Oxford, pp. 55-79.
Burgess, TF 1998, ‘Modeling the impact of reengineering with system dynamics’, International Journal of Operations and Production Management, vol. 18, no. 9, pp. 950-963.
Business in the Community (BITC), 2003, ‘The Business Case for Corporate Responsibility’, viewed 8 August 2005, <www.bitc.org.uk/applications/dynamic/publications.rm?>.
Business Sector Advisory Group on Corporate Governance 1998, Corporate governance: improving competitiveness and access to capital in global markets, OECD, Paris.
Buxley, G 2000, ‘Strategies in an era of global competition’ International Journal of Operations and Production Management, vol. 20, no. 9/10, pp. 997-1117.
Caplan, J 2002, Whose Company Is it, Anyway?, viewed 6 March 2005, <www.cfo.com/prinTable/article.cfm/3005096?f=options>.
Carr, A & Pearson, J 1999, ‘Strategically managed buyer-supplier relationships and performance outcomes’, Journal of Operations Management, vol. 17, no. 5, pp. 497-519.
Carter, N, Klein, R & Day, P 1992, How organisations measure success, Routledge, London.
Chan, FTS & Qi, HJ 2003, ‘An innovative performance measurement method for supply chain management’, Supply Chain Management: an International Journal, vol. 8, no. 3, pp. 209-223.
Charnes, A, Cooper, WW & Rhodes, EL 1978, ‘Measuring the efficiency of decision making units’, European Journal of Operational Research, vol. 2, no. 6, pp. 429-444.
Charnes, A, Cooper, WW, Golany, B, Seiford, L & Stutz, J 1985, ‘Foundations of DEA for Pareto Koopmans efficient empirical production functions’, Journal of Econometrics, vol. 30, pp. 91-107.
221
Charnes, A, Cooper, WW, Lewin, AL & Seiford, LM 1994, DEA: theory, methodology, and application, Kluwer Academic Publishers, Boston.
Cheng, EWL & Li, H 2001, ‘Analytic hierarchy process: an approach to determine measures for business performance’, Measuring Business Excellence, vol. 5, no. 3, pp. 30-36.
Cherns, A 1987, ‘Principles of sociotechnical design revisited’, Human Relations, vol. 40, no. 3, pp. 153-161.
Child, J & Rodrigues, SB 2003, ‘Corporate governance and new organisational forms: issues of double and multiple agency’ Journal of Management and Governance, vol. 7, no.3, pp. 337-360.
Cigolini, R, Cozzi, M & Perona, M 2004, ‘A new framework for supply chain management: conceptual model and empirical test’, International Journal of Operations and Production Management, vol. 24, no. 1, pp. 7-41.
Clark, B 2002, ‘Measuring performance: the marketing perspective’, in A Neely (ed.) Business PM: theory and practice. Cambridge University Press, Cambridge, pp. 22-40.
Clarke, F & Dean, G 2004, ‘No heart and soul in the pitiless corporate body’, 1 November, Australian Financial Review, p.17.
CLERP9, 2004, Corporate Law Economic Reform Program Act 2004, viewed 9 March 2004, <www.asic.gov.au/asic_polprac.nsf/byheadline/CLERP+9?openDocument>.
Cobbold, IC & Lawrie, GJC 2004, ‘Third-generation balanced scorecard: evolution of an effective strategic control tool’, International Journal of Productivity and Performance, vol. 53, no. 7, pp. 611-623.
Coelli, TJ 2006, Personal communication 7 September.
Coelli, TJ, Rao, DSP, O'Donnell, CJ & Battese, GE 2005, An introduction to efficiency and productivity analysis, 2nd ed, Springer, New York.
Conger, JA, Finegold, D & Lawler III, EE 1998, ‘Appraising boardroom performance’, Harvard Business Review, vol. 76, no. 1, pp. 136-149.
222
Cooper, WW 2001, ‘DEA’, in SI Gass, & CM Harris, (ed.) Encyclopedia of operations research and management science, Kluwer Academic Publishers, Boston, pp. 183-194.
Cooper, WW, Seiford, LM & Tone, K 2000, DEA: a comprehensive text with models, application, references and DEA solver software, Kluwer Academic Publishers, Norwell, Massachusetts.
Cooper, WW, Seiford, LM & Tone, K 2006, Introduction to DEA and its uses with DEA-Solver software and references, Springer, New York.
Core, JE, Holthausen, RW & Larker, DF 1999, ‘Corporate Governance, chief executive officer compensation, and firm performance’, Journal of Financial Economics, vol. 51, pp. 371-406.
Cornelius, PK. & Kogut, B 2003, Corporate Governance and Capital Flows in a Global economy, Oxford University Press, New York.
Corporate Responsibility Index 2004, The Age Special Report 28 August, pp. 1-4.
Corporate Responsibility Index 2005, The Age Special Report 4 April, pp. 1-4.
Corporate Responsibility Index 2006, The Age Special Report 15 May, pp. 1-4.
Corporate Responsibility Index 2007, The Age Special Report 14 May, pp. 1-4.
Cox, A 1999, ‘Power, value and supply chain management’ International Journal of Production and Operations Management, vol. 4, no. 4, pp. 167-175.
Crawford, K & Cox, J 1990, ‘Designing performance measurement systems for just-in-time operations’, International Journal of Production Research, vol. 28, no. 11, pp. 2025-2036.
Croon, S 2001, ‘Restructuring supply chains through information channel innovation’ International Journal of Operations and Production Management, vol. 21, no.4, pp. 504-516.
Curran, T & Lald, A 2000, SAP R/3 Reporting and ebusiness intelligence, Prentice Hall PTR, Upper Saddle River.
223
Daugherty, PJ, Ellinger, AE & Gustin, CM 1996, ‘Integrated logistics: achieving logistics performance improvements’, Supply Chain Management, vol. 1, no. 3, pp. 25-33.
Davies, R 2004, ‘Why global corporate citizenship matters for shareholders: a survey of leading CEOs’, The International Business Leaders Forum.
Davis, S & Albright, T 2004, ‘An investigation of the effect of balanced scorecard implementation of financial performance’, Mangement Accounting Research, vol. 15, pp. 135-153.
Dean, G & Clarke, F 2004, ‘True, fair and harder to avoid’, August 5-11, Business Review Weekly, pp. 108.
DEA-Solver Pro (Professional Version 4.1), purchased 8 November2005, available at <www.saitech-inc.com>.
DEAzone 2005, viewed 16 March 2005, <www.DEAzone.com>.
Denardo, EV 1996, ‘Dynamic programming’, in M Avriel, & B Golany, (eds) Mathematical programming for industrial engineers, Marcel Dekker, New York, pp. 307-382.
Denis, DK 2001, ‘Twenty-five years of corporate governance research...and counting’, Review of Financial Economics, vol. 10, pp. 191-212.
deWaal, AA 2003, ‘Behavioural factors important for the successful implementation and use of performance management systems’, Management Decision, vol. 41, no. 8, pp. 688-697.
deWaal, AA 2003, ‘The future of the balanced scorecard: an interview with Professor Dr Robert S. Kaplan’, Measuring Business Excellence, vol. 7, no. 1, pp. 30-35.
deWaal, AA 2004, ‘Stimulating performance-driven behaviour to obtain better results’, International Journal of Operations and Production Management, vol. 53, no. 4, pp. 301-316.
Dine, M & Haynes, K 1999, ‘Sources of regional inefficiency: an integrated shift-share, DEA an input-output approach’, The Annals of Regional Science, vol. 33, no. 4, pp. 469-489.
224
Dixon, J, Nanni, A & Vollman, T 1990, The new performance challenge-measuring operations for world-class competition, Dow Jones-Irwin, Illinois.
DJSI 2005, Dow Jones Sustainability Indexes, viewed 17 September 2005, <www.sustainability-indexes.com/htmle/assessment/criteria.html>.
Donaldson, T 2005, ‘Defining the value of doing good business’, Financial Times, 2 June, viewed 5 June 2005, <http://news.ft.com/cms/s/74812be-d377-11d9-ad4b-000002511c8,dwp_uuid>.
Doran, D 2003, ‘Supply chain implications of modularization’, International Journal of Operations and Production Management, vol. 23, no. 3, pp. 316-327.
Dornier, PP, Fender M & Kouvelis P. 1998, Global operations and logistics: text and cases, John Wiley & Sons, New York.
Drucker, PF 1968, The practice of management, Pan Books, London.
Duffy, R & Fearne, A 2004, ‘The impact of supply chain partnerships on supplier performance’, The International Journal of Logistics Management, vol. 15, no. 1, pp.57-71.
Dulewicz, V & Herbert, P 2004, ‘Does the composition and practice of boards of directors bear any relationship to the performance of their companies?’, Corporate Governance, vol. 12, no. 3, pp. 263-280.
Easton, L, Murphy, D & Pearson, JN 2002, ‘Purchasing performance evaluation: with DEA’, European Journal of Purchasing and Supply Management, vol. 8, no. 3, pp. 123-135.
Eccles, RG 1991, ‘The PM manifesto’, Harvard Business Review, vol. 69, no. Jan/Feb, pp. 131-138.
Eilat, H, Golany, B & Shtub, A 2006, ‘Constructing and evaluating balanced portfolios of R & D projects with interactions: a DEA based methodology’, European Journal of Operational Research, vol. 172, pp. 1018-1039.
Elkington, J 1997 Cannibals with forks: the triple bottom line of 21st century business, Capstone Publishing, London.
225
Emery, FE 1982, ‘Sociotechnical foundations for a new social order’, Human Relations, vol. 35, no. 12, pp. 1095-1122.
Emery, FE 1995 ‘Participative design: effective, flexible and successful, now!’ The Journal for Quality and Participation, vol. 18, no. 1, pp. 6-12.
Emery, FE & Thorsrud, E 1976, Democracy at work, Martinus Nijhoff, Leiden, Netherlands.
Emery, FE & Trist, EL 1965, ‘The causal texture of organisational environments’ Human Relations, vol. 18, pp. 21-32.
Emjrouznejad, E & Podinovski, V (ed.) 2004, DEA and performance management, Aston University, UK.
Emrouznejad, A & Thanassoulis, E 2005, An extensive bibliography of data envelopment analysis (DEA) volume 1, working papers, viewed 22 March 2005, <www2.warwick.ac.uk/fac/soc/wbs/subjects/oris/research/dea>
Entani, T & Tanaka, H 2006, ‘Improvement of efficiency intervals based on DEA by adjusting inputs and outputs’, European Journal of Operational Research, vol. 172, pp. 1004-1017.
Epstein, MJ & Manzoni, J 1997, ‘The balanced scorecard and tableau de bord: translating strategy into action’, Management Accounting, vol. 79, no. 2, pp. 28-37.
Eriksson, H & Hansoon, J 2003, ‘The impact of TQM on financial performance’, Measuring Business Excellence, vol. 7, no. 1, pp. 36-50.
Ernst & Young 2005, ‘Corporate governance: web survey, key findings and valuable insights’, viewed 3 September 2005, <www.ey.com/global/contents.nsf/International>.
Ernst & Young 2005, ‘Effective governance model: an operating framework’, viewed 3 September 2005, <www.ey.com/global/contents.nsf/International>.
Eskildsen, J, Westlund, AH & Kristensen, K 2003, ‘The predictive power of intangibles’, Measuring Business Excellence, vol. 7, no. 2, pp. 46-54.
226
ESRC 2005, ‘World economy and global trade’, Economic and Social Research Council fact sheet, viewed 11 December 2006, <www.esrc.ac.uk/ESRCinfoCentre/facts/international/economy.aspx.>.
Ethics Digest 2006, ‘The relationship between corporate citizenship and employee commitment, customer loyalty, and financial performance’, viewed 17 February 2006, <www.e-businessethics.com/orgcitizen4.htm>.
Evans, JR 2007, Quality and performance excellence: management, organisation and strategy, 5th edn, Thomson South-Western, Ohio.
Evans, JR and Lindsay, WM 2005, The management and control of quality, 6th edn, Thomson South-Western, Ohio.
Farrell, MJ 1957, ‘The measurement of productive efficiency’, Journal of the Royal Statistical Society, vol. 120, no. 3, pp. 253-290.
Fitzgerald, L & Storbeck, JE 2003, ‘Pluralistic views of performance’, Management Decision, vol. 41, no. 8, pp. 741-750.
Forrester, JW 1961, Industrial dynamics, MIT Press, Cambridge, Mass.
Forrester, JW 1968, ‘Industrial dynamics: after the first decade’, Management Science, vol. 14, no. 7, pp. 398-415.
Forsund, FR & Hjalmarsson, L 1979, ‘Generalised Farrell measures of efficiency’, Economic Journal, vol. 89, no. June, pp. 274-315.
Forsund, FR & Jansen, ES 1977, ‘On estimating average and best practice homothetic production functions via cost functions’, International Economic Review, vol. 18, no. 2, pp. 463-476.
Franco, M & Bourne, M 2003, ‘Factors that play a role in managing through measures’, Management Decision, vol. 41, no. 8, pp. 698-710.
Frei, F & Harker, P 1999, ‘Projections onto efficiency frontiers: theoretical and computational extensions to DEA’, Journal of Productivity Analysis, vol. 11, no. 3, pp. 275-300.
Friedman, TL 1999, The Lexus and the Olive Tree: understanding globalisation, Farrer, Strauss and Giroux, New York.
227
Friedman, TL 2005, The world is flat: a brief history of the twenty-first century, Allan Lane, London.
Frohlich, MT & Westbrook, R 2002, ‘Demand chain management in manufacturing and services: web-based integration, drivers and performance’, Journal of Operations Management, vol. 20, pp. 729-745.
FTSE 2005, FTSE4Good Index Series, viewed 14 September 2005, <www.ftse.com/Indices/FTSE4Good Index Series/index.jsp.>
Fundin, AP & Bergman, BLS 2003, ‘Exploring the customer feedback process’, Measuring Business Excellence, vol. 7, no. 2, pp. 55-65.
Gardner, DL 2004, Supply chain vector, J Ross Publishing, Florida.
Garver, MS & Mentzer, JT 1999, ‘Logistics research methods: employing structural equation modeling to test for construct validity’, Journal of Business Logistics, vol. 20, no. 1, pp. 33-57.
Gass, SI & Harris, CH 2001, Encyclopedia of operations research and management science, Kluwer Academic Publishers, Boston.
Gettler, L 2005a, ‘Taking care of business’, The Age , 4 April, p. 4.
Gettler, L 2005b, ‘There's a moral in making money’, The Age , 4 June, p. 7.
Globalisation Guide, viewed 22 September 2005, <www.globalisationguide.org/>.
Golany, B & Roll, Y 1989, ‘An application procedure for DEA’, Omega, vol. 17, no. 3, pp. 237-250.
Governance Metrics International 2005, viewed 5 November 2005, <www.gmiratings.com>.
Grant, GH 2003, ‘The evolution of corporate governance and its impact on modern corporate America’, Management Decision, vol. 41, no. 9, pp. 923-934.
Greenberg, R & Numaker, T 1987, ‘A generalized multiple criteria model for control and evaluation of non-profit organisations’, Financial Accountability & Management, vol. 3, no. 4, pp. 331-342.
228
Greene, WH 1980, ‘Maximum likelihood estimation of econometric frontier functions’, Journal of Econometrics, vol. 13, May, pp. 26-57.
Grewal, B, Xue, L, Sheehan, P & Sun, S (eds) 2002, China’s future in the knowledge economy, Centre for Strategic Economic Studies, Victoria University, Melbourne.
Griffis, SE, Cooper, M, Goldsby, TJ & Closs, DJ 2004, ‘Performance measurement: measure selection based upon firm goals and information reporting needs’, Journal of Business Logistics, vol. 25, no.2, pp. 95-118.
Grunberg, T 2004, ‘Performance improvement: towards a method for finding and prioritising potential performance improvement areas in manufacturing operations’, International Journal of Operations and Production Management, vol. 53, no. 1, pp. 52-71.
Gunasekaran, A, Patel, C & Tirtiroglu, E 2001, ‘Performance measures and metrics in a supply chain environment’, International Journal of Operations and Production Management, vol. 21, no. 1, pp. 71-87.
Hakansson, H & Person, G 2004, ‘Supply chain management: the logic of supply chains and networks’, International Journal of Logistics Management, vol. 15, no. 1, pp. 11-26.
Hammer, M & Champy, J 1993, Reengineering the corporation: a manifesto for business revolution, Harper Business, New York.
Hazell, PBR & Norton, RD 1986, Mathematical programming for economic analysis in agriculture, Macmillan Publishing, New York.
Heugens, P & Otten, J 2005, ‘Corporate governance reforms around the world’, Discussion Paper Series 05-08, Tialling C Koopmans Research Institute, The Netherlands, viewed 22 April 2006, <www.koopmansinstitute.uu.nl>.
Hill, N & Alexander, J 2000, Handbook of customer satisfaction and loyalty measurement, Gower Publishing Company, Burlington.
Hines, PLR, Jones, D, Cousins, P & Rich, N 2000, ‘Value stream management: strategy and excellence in the supply chain’, Financial Times and Prentice Hall, Harlow.
229
Hirschey, M 2003 ‘Organisation structure and corporate governance: a survey’, in Hirschey, MJK & Makija, AK (eds) Corporate governance and finance: advances in financial economics, vol. 8, Elsevier, Oxford, pp. 65-112.
Holweg, M 2005, ‘The three dimensions of responsiveness’, International Journal of Operations and Production Management, vol. 25, no. 7, pp. 603-622.
Hosmer, LT 2000 ‘It’s time for empirical research in business ethics’, Business Ethics Quarterly, vol. 10, no. 1, pp. 233-242.
Hosmer, LT 2006, The ethics of management, 5th edn, McGraw Hill Irwin, Boston.
Houghton, J & Sheehan, P 2000, ‘A primer on the knowledge economy’, Centre for Strategic Economic Studies, Victoria University, Melbourne.
Huang, CJ 1984, ‘Estimation of stochastic frontier production function and technical inefficiency via the EM algorithm’, Southern Economic Journal, vol. 50, no. 3, pp. 847-856.
Hudson, M, Smart, A & Bourne, M 2001, ‘Theory and practice in SME performance measurement systems’, International Journal of Operations and Production Management, vol. 21, no. 8, pp. 1096-1115.
Industry Commission 1998, Conference on Productivity and Microeconomic Reform, Australian National University, Canberra, Australia, February.
Inman, R & Simmering, M (eds) 2006, Performance Management 5th edn, Thomson Gale, Detroit.
Institute of Internal Auditors UK and Ireland Online (IAA) 2004, AA1000, 2004a, A1000 Series, Institute of Internal Auditors UK and Ireland Online, viewed 27 May 2005, <http://www.iia.org.uk/knowledgecentre/keyissues/ethics.cfm?Action=1&ARTICLE_ID=1070>.
Institute of Social and Ethical Accountability (ISEW) 2004, AA1000 Series, London, viewed12
June 2005 <www.accountability.org.uk/aa1000/default.asp?pageid=286>.
Jensen, AJ & Sage, AP 2000, ‘A systems management approach for improvement of organisational Performance Measurement systems’, Information Knowledge Systems Management, vol. 2, no. 1, pp. 33-62.
Jensen, M & Meckling, W 1976, ‘Theory of the firm: managerial behavior, agency costs and ownership structure’, Journal of Financial Economics, vol. 3, no. 4, pp. 305-360.
230
Johnson, H & Kaplan, R 1987, Relevance lost: the rise and fall of management accounting, Harvard Business School Press, Boston.
Jondrow, J, Lovell, CAK, Materov, IS & Schmidt, P 1982, ‘On the estimation of technical inefficiency in the stochastic frontier production function model’, Journal of Econometrics, vol. 19, August, pp. 233-238.
Jones, B 1999, Sleepers, wake! technology and the future of work, Oxford University Press, Melbourne.
Kanter, RM 1994, ‘Collaborative advantage: the art of alliance’, Harvard Business Review, July-August, pp. 96-108.
Kaplan, RS 1986, ‘Accounting lag: the obsolescence of cost accounting systems’, California Management Review, vol. 28, no. 2, pp. 174-199.
Kaplan RS 1990, Measures for manufacturing excellence, Harvard Business School Press, Boston.
Kaplan, RS & Norton, D 1992, ‘The balanced scorecard: measures that drive performance’, Harvard Business Review, vol. Jan-Feb, pp. 71-79.
Kaplan, RS & Norton, D 1993, ‘Putting the balanced scorecard to work’, Harvard Business Review, vol. Sept-Oct, pp. 134-147.
Kaplan, RS & Norton, DP 1996, ‘Using the balanced scorecard as a strategic management system’, Harvard Business Review, vol. 74, no. 1, pp. 75-86.
Keah, CT, Lyman, SB & Wisner, JD 2002, ‘Supply chain management a strategic perspective’, International Journal of Operations and Production Management, vol. 22, no. 5, pp. 614-631.
Keasey, K & Wright, M 1993, ‘Issues in corporate accountability and governance: an editorial’, Accounting and Business Research, vol. 23, no. 91A, pp. 291-303.
Keegan, DP, Eiler, RG & Jones, CR 1989, ‘Are your performance measures obsolete?’, Management Accounting, June, pp. 38-43.
Kennerly, M & Neely, A 2002, ‘A framework of the factors affecting the evolution of performance measurement’, International Journal of Operations and Production Management, vol. 22, no. 11, pp. 1222-1245.
231
Kennerley, M & Neely, A 2003, ‘Measuring performance in a changing business environment'’, International Journal of Operations and Production Management, vol. 23, no. 2, pp. 213-229.
Kennerley, M, Neely, A, & Adams, C 2003, ‘Survival of the fittest: measuring performance in a changing business environment’, Measuring Business Excellence, vol. 4, no. 4, pp. 37-43.
Kidd, J, Richter, F & Stumm, M 2003, ‘Learning and trust in supply chain management disintermediation, ethics and cultural pressures in brief dynamic alliances’, International Journal of Logistics: Research and Applications, vol. 6, no. 4.
Krause, O 2003, ‘Beyond BSC: a process based approach to performance management’, Measuring Business Excellence, vol. 7, no. 3, pp. 4-14.
Kuhn, TS 1970, Structure of scientific revolutions, 2nd edn, Chicago University Press, Chicago.
Kuwaiti, ME 2004, ‘Performance measurement process: definition and ownership’, International Journal of Operations and Production Management, vol. 24, no. 1, pp. 55-78.
Lambert, DM & Pohlem, TL 2001, ‘Supply chain metrics’, International Journal of Operations and Production Management, vol. 12, no. 1, pp.1-19.
Lambert, DM, Garcia-Dastugue, SJ & Croxton, KL 2005. ‘An evaluation of process-oriented supply chain management frameworks’, Journal of Business Logistics, vol. 26, no. 1, pp. 25-51.
Lambert, DM, Knemeyer, AM & Gardner, JT 2004, ‘Supply chain partnerships: model validation and implementation’, Journal of Business Logistics, vol. 25.no. 2, pp. 21-41.
Larker, D, Richardson, S & Tuna, I 2005, ‘Ratings add fire to the governance debate’, Financial Times, 26 May, viewed 6 June 2005, <www.financialtimes.printthis.clickability.com/pt/cpt?>
Lau, HCW, Lau, PKH, Chan, FTS & Ip, RWL 2001, ‘A real time performance measurement technique for dispersed manufacturing’, Measuring Business Excellence, vol. 5, no. 1, pp. 9-15.
232
Lebas, M & Euske, K 2002, ‘A conceptual and operational delineation of performance’, in A Neely (ed.) Business performance measurement theory and practice, Cambridge University Press, Cambridge, pp. 65-79.
Lebas, MJ 1995, ‘Performance measurement and performance management’, International Journal of Production Economics, vol. 41, no. 1, pp. 23-35.
Leblanc, RW 2005, ‘What's wrong with corporate governance: a note’, Corporate Governance, vol. 12, no. 4, pp. 436-441.
Lee, HL & Whang, S 2000, ‘Information sharing in a supply chain’, International Journal of Manufacturing Technology and Management, vol. 1, no. 1, pp. 79-93.
Letza, S, Sun, X & Kirkbride, J 2004, ‘Shareholding versus stakeholding: a critical review of corporate governance’, Corporate Governance, vol. 12, no. 3, pp. 242-262.
Lewin, AY, Morey, CR & Cook, TJ 1982, ‘Evaluating the administrative efficiency of courts’, Omega, vol. 10, no. 4, pp. 401-411.
Li, Z, Kumar, A & Lin, YG 2002, ‘Supply chain modeling: a co-ordination approach’, Integrated Manufacturing Systems, vol. 13, no. 8, pp. 551-561.
Logsdon, JM & Lewellyn, PG 2000’ ‘Expanding accountability to stakeholders: trends and predictions’, Business and Society Review, vol. 105, no. 4, pp. 419-435.
Lovell, CAK & Schmidt, P (eds) 1988, A comparison of alternative approaches to the measurement of productive efficiency, Kluwer Academic Publishers, Boston.
Lowson, RH 2002, ‘Operations strategy: genealogy, classification and anatomy’, International Journal of Operations and Production Management, vol. 22, no. 10, pp. 1112-1129.
Lynch, RL & Cross, KF 1991, Measure up!, Mandarin, London.
Macbeth, DK 2002, ‘Emergent strategy in managing cooperation supply chain change’, International Journal of Operations and Production Management, vol. 22, no. 7/8, pp. 728-740.
MacBryde, J & Mendibil, K 2003 ‘Designing performance measurement systems for teams: theory and practice’, Management Decision, vol. 41, no. 8, pp. 722-733.
233
Maignan, I & Ferrell, OC 2001, ‘Antecedents and benefits of corporate citizenship: an investigation of French businesses’, Journal of Business Research, vol. 51, pp. 37-51.
Maignan, I, Ferrell, OC & Hult, GTM 1999, ‘Corporate citizenship: cultural antecedents and business benefits’, Journal of Academy of Marketing Science, vol. 27, no. 4, pp. 455-469.
Maleyeff, J 2003, ‘Benchmarking performance indices; pitfalls and solutions’, Benchmarking: An International Journal, vol. 10, no. 1, pp. 9-28.
Malina, MA & Selto, FH 2004, ‘Choice and change of measures in performance measurement models’, Management Accounting Research, vol. 15, pp. 441-469.
Manning, L & Baines, RN 2004, ‘Globalisation: a study of the poultry-meat supply chain’, British Food Journal, vol. 106, no. 10/11, pp. 819-836.
Manoochehri, G 1999, ‘Overcoming obstacles to developing effective performance measures’, Work Study, vol. 48, no. 6, pp. 223-229.
Manzoni, A & Islam, SN 2006a, ‘Measuring the performance of collaborative relationships in supply chain networks using DEA: a corporate governance perspective’, in 4th International Logistics and SCM Congress, Ismir University of Economics, Turkey.
Manzoni, A & Islam, SN 2006b, ‘Measuring the performance of supply chain networks in Australia: a business process model using DEA’, in Proceedings of the 4th International Conference on SCM & Information Systems Institute of E Commerce, National Chung Hsing University, Taichung, Taiwan.
Manzoni, A & Islam, SN 2006c, ‘An improved performance scorecard for supply chain networks in the Australian context’, in International Conference on Logistics and SCM 2006, University of Hong Kong, Hong Kong.
Manzoni, A & Sadler, I 2005, ‘An improved performance scorecard in the Australian context’, in 19th ANZAM Conference, Australian National University, Canberra.
Marr, B & Neely, A 2003, ‘Automating the balanced scorecard-selection criteria to identify appropriate software applications’, Measuring Business Excellence, vol. 7, no. 2, pp. 29-36.
234
Marr, B & Schiuma, G 2003, ‘Business performance measurement: past, present and future’, Management Decision, vol. 41, no. 8, pp. 680-687.
Maull, RS, Tranfield, DR & Maull, W 2003, ‘Factors characterising the maturity of BPR programmes’, International Journal of Operations and Production Management, vol. 23, no. 6, pp. 596-624.
McAdam, R & Bailie, B 2002, ‘Business performance measures and alignment impact on strategy’, International Journal of Operations and Production Management, vol. 22, no. 9, pp. 972-996.
Mclaren, D 2004, ‘Global stakeholders: corporate accountability and investor engagement’, Corporate Governance: An International Review, vol. 12, no. 2, pp. 191-201.
Medori, D & Steeple, D 2000, 'A Framework for auditing and enhancing performance measurement systems', International Journal of Operations & Production Management, vol. 20, no. 5, pp. 520-533.
Meeusen, W & Van den Broeck, J. 1977, ‘Technical efficiency and dimension of the firm: some results on the use of frontier production functions’, Empirical Economics, vol. 2, no. 2, pp. 109-122.
Metters, R, Frei, F & Vages, V 1999, ‘Measurement of multiple sites in service firms with DEA’, Production and Operations Management, vol. 8, no. 3, pp. 264-281.
Meyer, MM 2002, ‘Finding performance: the new discipline in management’, in A Neely (ed.) Business performance measurement: theory and practice, Cambridge University Press, Cambridge, pp. 51-62.
Mills, J, PK, Bourne, M, & Richards, H 2002, Strategy and performance: competing through competences, Cambridge University Press, Cambridge.
Mills, J, Platts, K, Neely, A, Richards, H, & Bourne, M 2002, Strategy and performance: creating a winning business formula, Cambridge University Press, Cambridge.
Min, S & Mentzer, JT 2004, ‘Developing and measuring supply chain management concepts’, Journal of Business Logistics, vol. 25, no. 1. pp. 63-99.
235
Min, S, Roath, AS, Daugherty, PJ, Genchev, SE, Chen, H & Arndt, A 2005, ‘Supply chain collaboration: what’s happening’, The International Journal of Logistics Management, vol. 16, no. 2, pp. 237-256.
Mitchell, VL & Nault, BR 2003, ‘The emergence of functional knowledge in sociotechnical systems’, Working Paper¸ viewed 23 October 2006, <www.haskayne.ucalgary.ca/research/WorkingPapers/research/media/MIS_working_papers/2003_16>.
Morin RA & Jarrell SL 2001, Driving shareholder value: value-building techniques for creating shareholder wealth, McGraw-Hill, New York.
Mumford, E 1995, Effective systems design and requirements analysis: the ETHICS approach, Macmillan, London.
Mumford, E 2003, Redesigning human systems, IRM Press, London.
Neef, D 2004, The supply chain imperative, Amacom, New York.
Neely, A (ed.) 2002, Business performance measurement: theory and practice, Cambridge University Press, Cambridge.
Neely, A, Adams, C & Crowe, P 2001, ‘The performance prism in practice’, Measuring Business Excellence, vol. 5, no. 2, pp. 6-12.
Neely, A & Austin, R 2002, ‘Measuring performance: the marketing perspective’, in A Neely (ed.) Business performance measurement: theory and practice, Cambridge University Press, Cambridge, pp. 22-40.
Neely, A & Bourne, M 2000, ‘Why measurement initiatives fail’, Measuring Business Excellence, vol. 4, no. 4, pp. 3-6.
Neely, A & Powell, S 2004, ‘The challenges of performance measurement’, Management Decision, vol. 42, no. 8, pp. 1017-1023.
Neely, A, Bourne, M & Adams, C 2003, ‘Better budgeting or beyond budgeting’, Measuring Business Excellence, vol. 7, no. 3, pp. 22-28.
Neely, A, Gregory, M & Platts, K 1995, ‘Performance measurement system design: a literature review and research agenda’, International Journal of Operations and Production Management, vol. 15, no. 4, pp. 80-116.
236
Neely, A, Mills. J, Platts. K, & Richards. H 2002, Strategy and performance: getting the measure of your business, Cambridge University Press, Cambridge.
Neely, A, Mills, J, Platts, K, Richards, H, Gregory, M, Bourne, M & Kennerley, M 2000, ‘Performance measurement system design: developing and testing a process-based approach’, International Journal of Operations and Production Management, vol. 20, no. 10, pp. 1119-1145.
Niepce, W & Molleman, E 1998, ‘Work design issues in lean production from a sociotechnical systems perspective: neo-Taylorism or the next step in sociotechnical design?’, Human Relations, vol. 51, no. 3, pp. 259-288.
Nonaka, I & Peltokorpi, V 2006, ‘Objectivity and subjectivity in knowledge management: a review of 20 top articles’, Knowledge and Process Management, vol. 13, no. 2, pp. 73-82.
Norreklit, H 2000, ‘The balance on the balanced scorecard: a critical analysis of some of its assumptions’, Management Accounting Research, vol. 11, pp. 65-88.
Nyhan, R & Martin, L 1999, ‘Comparative performance measurement: a primer on DEA’, Public Productivity and Management Review, vol. 22, no. 3, pp. 348-364.
O'Donnel, FJ & Duffy, AHB 2002, ‘Modeling design development performance’, International Journal of Operations and Production Management, vol. 22, no. 11, pp. 1198-1221.
OECD 2006a, Economic survey of Australia 2006 policy brief, Paris, viewed 15 October 2006,<www.oecd.org/publications/Policybriefs>.
OECD 2006b, ‘Conference on globalisation and the knowledge economy’, Issues Paper, Paris, October, viewed 30 November 2006, <www.oecd.org/>.
Oketch, MO 2004, ‘The corporate stake in social cohesion’, Corporate Governance, vol. 4, no. 3, pp. 5-19.
Olve, N, Roy, J & Wetter, M 1999, Performance drivers: a practical guide to using the balanced scorecard, John Wiley, Chichester.
O’Reagan, N & Ghobadian, A 2004, ‘Short- and long-term performance in manufacturing SMEs: different targets, different drivers’, International Journal of Productivity and Performance Management, vol. 53, no. 5, pp. 405-424.
237
O’Sullivan, M 2003, ‘Employees and corporate governance’, in C Kogut (ed.) Corporate governance and capital flows in a global economy, Oxford University Press, New York.
Otley, DT & Fakiolas, A 1995, ‘Reliance on accounting performance measures: dead end or new beginning’, Accounting, Organisations and Society, vol. 25, no. 4, pp. 497-510.
Otley, DT 1999, ‘Performance management: a framework for management control systems research’, Management Accounting Research, vol. 10, pp. 363-382.
Otley, DT 2002, ‘Performance measurement-functional analysis’, in A Neely (ed.) Business performance measurement: theory and practice, 1st edn, Cambridge University Press, Cambridge, pp. 3-21.
Oxley, A 2000, Seize the future: how Australia can prosper in the new century, Allen & Unwin, St Leonards, NSW.
Paganetto, L 2004, Knowledge Economy, Information Technologies and Growth, Ashgate, Hampshire, England.
Palmer, E & Parker, D 2001, ‘Understanding performance measurement systems using physical science uncertainty principles’, International Journal of Operations and Production Management, vol. 21, no. 7, pp. 981-999.
Parham, D 1999, The new economy? A new look at Australia's productivity performance, Productivity Commission Staff Research Paper, AusInfo, Canberra, May.
Parham, D 2002, Productivity growth in Australia: are we enjoying a Miracle? towards opportunity and prosperity, The Australian Conference, Melbourne Institute, 4-5 April, Melbourne.
Parker, C 2000, ‘Performance measurement’, Work Study, vol. 49, no. 2, pp. 63-66.
Passmore, WA 1982, ‘Sociotechnical systems: a North American reflection on empirical studies of the seventies’, Human Relations, vol. 35, no. 12, pp. 1179-1204.
Passmore, WA 1988, Designing effective organisations: the sociotechnical systems perspective, John Wiley, New York.
238
Pastor, JL & Sirvent, RI 1999, ‘An enhanced DEA Russell graph efficiency measure’, European Journal of Operational Research, vol. 115, no. 3, pp. 596-607.
Pitelis, C 2004, ‘(Corporate) Governance, (Shareholder) Value and (Sustainable) Economic Performance’, Corporate Governance, vol. 12, no. 2, pp. 210-223.
Porter, ME 1998, Competitive advantage: creating and sustaining superior performance, Free Press, New York.
Porter, ME 2004, ‘Location, competition, and economic development: local clusters in a global economy’, in J Cantwell (ed.) Globalization and the location of firms: globalization of the world economy, vol. 15; Cheltenham, U.K. pp. 59-78.
Quazi, A 2003, ‘Identifying the determinants of corporate managers’ perceived social obligations’, Management Decision, vol. 41, no. 9, pp. 822-831.
Ragsdale, CT 2004, Spreadsheet modeling and decision analysis, Thomson South-Western, Mason Ohio.
Ramanathan, R 2003, An introduction to DEA: a tool for performance measurement, Sage Publications India, New Delhi.
Rich, N & Bateman, N 2003, ‘Companies’ perceptions of inhibitors and enablers for process improvement activities’, International Journal of Operations and Production Management, vol. 23, no. 2, pp. 185-199.
Richmond, J 1974, ‘Estimating the efficiency of production’, International Economic Review, vol. 15, no. 2, pp. 515-521.
Rickards, RC 2003, ‘Setting benchmarks and evaluating balanced scorecards with DEA’, Benchmarking: An International Journal, vol. 10, no. 3, pp. 226-245.
Ricks, DA 2003, ‘Globalization and the role of the global corporation’, Journal of International Management, vol. 9, pp. 355-359.
Roethlisberger, FJ & Dickson, WJ 1939, Management and the worker, Harvard University Press, Cambridge.
Ross, A, Venkataramanan, MA & Ernstberger, KW 1998, ‘Reconfiguring the supply network using current performance data’, Decision Sciences, vol. 29, no. 3, pp. 707-728.
239
Rouse, APB 1997, ‘A methodological framework of performance measurement with applications using DEA’, Doctoral thesis, University of Auckland.
Rouse, P & Putterill, M 2003, ‘An integral framework for performance measurement’, Management Decision, vol. 41, no. 8, pp. 791-805.
Rungtusanathan, M, Salvador, F, Forza, C & Choi, TY 2003, ’Supply chain linkages and operational performance’, International Journal of Operations and Production Management, vol. 23, no. 9, pp. 1084-2000.
SAI 2004, Social Accountability 8000 (SA8000) Standard, New York, viewed 12 June 2004, <www.cepaa.org>
Sanders, NR & Premus, R 2005, ‘Modeling the relationship between firm IT capability, collaboration, and performance’, Journal of Business Logistics, vol. 26, no. 1.
Santos, SP, Belton, V & Howick, S 2002, ‘Adding value to performance measurement by using system dynamics and multicriteria analysis’, International Journal of Operations and Production Management, vol. 22, no. 11, pp. 1246-1272.
Sarbannes-Oxley Act 2002 (USA)
Sarkis, J 1999, ‘A methodological framework for evaluating environmentally conscious manufacturing programs’, Computers and Industrial Engineering, vol. 36, no. 4; 4, pp. 793-810.
Schmitz, J & Platts, KW 2003 ‘Roles of supplier performance measurement: indication from a study in the automotive industry’, Management Decision, vol. 41, no. 8, pp. 711-721.
Seiford, L & Lewin, A 1997, ‘Extending the frontiers of DEA’, Annals of Operations Research, vol. 73, no. 1, pp. 1-11.
Sengupta, JK 1969, Economic analysis and operations research: optimization techniques in quantitative economic models, North-Holland, Amsterdam.
Sengupta, JK 2003, New efficiency theory: with applications of DEA, Springer-Verlag, Berlin.
240
Senior, B & Swailes, S 2004, ‘The dimensions of management team performance: a repertory grid study’, International Journal of Productivity and Performance Management, vol. 53, no. 4, pp. 317-333.
Sgro, PM 2003, ‘Globalisation, the environment and recent trends in international trade’, in JA Battten, & TA Fetherston, (eds) Social responsibility: corporate governance issues, vol. 17, JAI Elsevier Science, Oxford. pp. 21-45.
Sharif, AM 2002, ‘Benchmarking performance management systems’, Benchmarking: An International Journal, vol. 9, no. 1, pp. 62-85.
Sheehan, PJ, Pappas, N, Tikhomirova, G & Sinclair, P 1995, Australia and the knowledge economy: an assessment of enhanced economic growth through science and technology, Centre for Strategic Economic Studies, Victoria University, Melbourne.
Sherman, H 2004, ‘Corporate governance ratings’, Corporate Governance, vol. 12, no. 1, pp. 5-7.
Sim, K & Koh, HC 2001, ‘Balanced scorecard: a rising trend in strategic performance measurement’, Measuring Business Excellence, vol. 5, no. 2, pp. 18.
Simatupang, TM & Sridharan, R 2002, ‘The collaborative supply chain’, International Journal of Logistics Management, vol. 13, no. 1, pp. 15-30.
Simatupang, TM & Sridharan, R 2005, ‘An integrative framework for supply chain collaboration’, International Journal of Operations and Production Management, vol. 16, no. 2, pp. 257-274.
Sink, DS 1985, Productivity management: planning measurement and evaluation, control and improvement, John Wiley, New York.
Slack, N 1994, ‘The importance-performance matrix as a determinant of improvement priority’, International Journal of Operations and Production Management, vol. 14, no. 5, pp. 59-75.
Slack, NCS & Johnston, R 2004, Operations management, 4th edn, Pearson Education Prentice Hall, Harlow.
Smith, JH 1998, ‘The enduring legacy of Elton Mayo’, Human Relations, vol. 51, no. 3, pp. 221-250.
241
Smith, MR & Marx, L 1994, Does technology drive history: the dilemma of technological determinism, MIT Press, Cambridge.
Sonnenfeld, J 1985, ‘Shedding light on the Hawthorne Studies’, Journal of Occupational Behaviour, vol. 6, pp. 111-130.
Sonnenfeld, J 2004, ‘Good governance and the misleading myths of bad metrics’, Academy of Management Executive, vol. 18, no. 1, pp. 108-113.
Soonhong, M, Roath, AS, Daugherty, PJ, Genchev, SE, Chen, H, Arndt, AD & Richey, RG 2005, ‘Supply chain collaboration: what's happening?’, The International Journal of Logistics Management, vol. 16, no. 2, pp. 237-256.
Soteriou, AC & Stavrinides, Y 1997, ‘An internal customer service quality DEA model for bank branches’, International Journal of Operations and Production Management, vol. 17, no. 8, pp. 780-789.
Soyster, AL & Ventura, JA 1996, ‘Linear programming’, in M Avriel, & B Golany, (eds) Mathematical programming for industrial engineers, Marcel Dekker, New York, pp. 11-116.
St James Ethics Centre 2005, Corporate Responsibility Index, viewed 5 October 2005, <www.corporate-responsibility.com.au>.
Stapleton, G 2005, ‘Taking an audit of the audit committee’, The Age 3 June 2005, pp. 37.
Steering Committee for the Review of Commonwealth/State Service Provision 1997, DEA: A technique for measuring the efficiency of government service delivery, AGPS, Canberra.
Strenger, C 2004, ‘The corporate governance scorecard: a tool for the implementation of corporate governance’, Corporate Governance, vol. 12, no. 1, pp. 11-15.
Sumanth, DJ 1984, Productivity engineering and management, McGraw-Hill Book Company, New York.
Tabucanon, MT 1996, ‘Multiobjective programming for industrial engineers’, in M Avriel, & B Golany (eds) Mathematical programming for industrial engineers, Marcel Dekker, New York, pp. 487-542.
242
Tangen, S 2003, ‘An overview of frequently used performance measures’ Work Study, vol. 52, no. 7, pp. 347-354.
Tarr, J 1994, ‘Developing performance measurement systems that support continuous improvement’, Hospital Material Management Quarterly, vol. 17, no. 3, pp. 59-67.
Terziovski, M 2002, ‘Achieving performance excellence through an integrated strategy of radical innovation and continuous improvement’, Measuring Business Excellence, vol. 6, no. 2, pp. 5-14.
Thomsen, S 2004, ‘Corporate values and corporate governance’, Corporate Governance, vol. 4, no. 4, pp. 29-46.
Thorpe, R & Beasley, T 2004, ‘The characteristics of performance management research: implications and challenges’, International Journal of Operations and Production Management, vol. 53, no. 4, pp. 334-344.
Toffler, A 1971, Future shock, Bantam Books, New York.
Tone, K 2001, ‘A slack-based measure of efficiency in DEA’, European Journal of Operational Research, vol.130, pp. 498-509.
Toni, AD & Tonchia, S 2001, ‘Performance measurement systems: models, characteristics and measures’, International Journal of Operations and Production Management, vol. 21, no. 1, pp. 46-71.
Towill, DR 1997, ‘The seamless supply chain-the predator’s strategic advantage’ International Journal of Technology Management, vol. 13, no. 1, pp. 15-27.
Tracy, DL & Chen, B 2005, ‘A generalized model for weight restrictions in DEA’, Journal of the Operational Research Society, vol. 56, pp. 390-396.
Trent, RJ 2004, ‘The use of organisational design features in purchasing and supply management’, The Journal of SCM, vol. 40, no. 3, pp. 4-18.
Trist, EL 1981, The evolution of socio-technical systems: perspectives on organisation design and behaviour, John Wiley, New York.
Trist, EL & Murray, H 1993, The social engagement of social science: a Tavistock anthology, vol. 2, University of Pensilvania Press, Philadelphia.
243
Troutt, MD, Ehie, IC & Brandyberry, AA 2007, ‘Maximally productive input-output units’, European Journal of Operational Research, vol. 178, no. 2, pp. 359-373.
Van Amelsvoort, P 2000, The design of work and organisation: the modern sociotechnical systems approach, 1st edn, St-Groep, The Netherlands.
Van Der Zwaan, AH 1975, ‘The sociotechnical systems approach: a critical evaluation’, International Journal of Production Research, vol. 13, no. 2, pp. 149-163.
Van Der Zwaan, AH & Vries, JDE 1999, ‘A critical assessment of the modern sociotechnical approach within production and operations management’, International Journal of Production Research, vol. 38, no. 8, pp. 1755-1767.
Van Hoek, RI 2001, ‘The contribution of performance measurement to the expansion of third party logistics alliances in the supply chain’, International Journal of Operations and Production Management, vol. 21, no. 1/2, pp. 15-29.
Verweire, K & Van den Berghe, L 2003, ‘Integrated performance management: adding a new dimension’, Management Decision, vol. 41, no. 8, pp. 782-790.
Vollman, TE, Berry, WL, Whybark, DC, & Jacobs, FR 2005, Manufacturing planning and control for SCM, McGraw-Hill Irwin, Boston.
Waller, DL 2002, Operations management: a supply chain approach, Thomson, London.
Washington, M & and Hacker, M 2000, ‘System equivalence: the application of joint optimization’, Measuring Business Excellence, vol. 4, no. 4, pp. 18-23.
Wiener, N 1950, The human use of human beings: cybernetics and human beings, Eyre and Spottiswoode, London.
Weiner, N 1967, The human use of human beings: cybernetics and society, Avon Books, New York.
Wilcox, M & Bourne, M 2003, ‘Predicting performance’, Management Decision, vol. 41, no. 8, pp. 806-816.
Williamson, OE 1988, ‘Corporate finance and corporate governance’, The Journal of Finance, vol. 43, no. 3, pp. 567-583.
244
Winston, WL 1991, Operations research: applications and algorithms, 2nd edn, PWS-Kent, Boston.
Wolf, M 2004, Why globalization works, Yale University Press, Cambridge, Mass.
Wongrassamee, S, Gardiner, PD & Simmons, JEL 2003, ‘Performance measurement tools: the balanced scorecard and the EFQM excellence model’, Measuring Business Excellence, vol. 7, no. 1, pp. 14-29.
World Bank, 2004, ‘FDI confidence index’ Global Business Policy Council, Vol. 7, viewed 17 March 2006, <http://rru.worldbank.org/PapersLinks/Open.aspx?id=4644>.
Wren, DA 1994, The evolution of management thought, 4th edn, John Wiley & Sons, New York.
Young, B 2003, ‘Corporate governance and firm performance: Is there a relationship?’, Ivey Business Journal, vol. 68, no. 1, pp. 1-5.
Yurdakul, M & Ziraat Bankasi, YT 2005, ‘Development of a performance measurement model for manufacturing companies using the AHP and TOPSIS approaches’, International Journal of Production Research, vol. 43, no. 21, pp. 4609-4642.
Zahir, S 2006, ‘Eliciting ratio preferences for the analytic hierarchy process with visual interfaces: a new mode of preference measurement’, International Journal of Information Technology and Decision Making, vol. 5, no. 2, pp. 245-261.
Zairi, M 1994, Measuring performance for business results, Chapman & Hall, London.
Zairi, M 1998, Benchmarking for best practice: continuous learning through sustainable innovation, Butterworth-Heinemann, Oxford.
Zhang, Y & Bartels, R 1998, ‘The effect of sample size on the mean efficiency in DEA with an application to electricity distribution in Australia, Sweden and New Zealand’, Journal of Productivity Analysis, vol. 9, pp. 187-204.
Zhu, J 2003, Quantitative models for performance evaluation and benchmarking, Kluwer Academic Publishers, Boston.
Zonneveldt, M 2004, ‘Westpac tops social ranking’, Herald Sun, 9 September, pp.4.
245
Appendices
Appendix 1: Definitions of Key Terms
Agency Theory. In agency theory terms, the owners are principals and the managers are agents
and there is an agency loss which is the extent to which returns to the owners fall below what
they would be if the principals as owners, exercised direct control.
Allocative Efficiency. The extent to which the DMU minimizes inputs in optimal proportions
through substitution and reallocation, given their respective prices, yet maintaining outputs. It is
calculated as the ratio of cost efficiency to technical efficiency.
Activity Based Costing. An alternative to traditional accounting by identifying activity centres
and allocating costs to them based on frequency of their transactions.
Balanced Scorecard. A strategic approach through a performance management system that
translates company vision and strategy into action by taking the 4 perspectives of finance,
customers, processes, and growth and learning. (Kaplan and Norton, 1992)
Business Process Reengineering. A fundamental rethink and radical redesign of organisational
processes to achieve dramatic improvements in performance. Information technology plays an
important part.
Comparative Advantage. A concept from Ricardian economics that states a country has a
comparative advantage over another if it is able to produce some good at a lower opportunity
cost.
Competitive Advantage. Company strategy is about taking offensive or defensive action to
create a defendable position for the company, through low cost (cost leadership) or
differentiation.
Constant Returns to Scale (CRS). Under this option the outputs change in direct proportion to
the change in inputs, regardless of the size of the DMU, assuming that the scale of operations
does not influence efficiency.
Corporate Governance. The system by which companies are directed and controlled, in the
interest of shareholders and other stakeholders, to sustain and enhance value.
246
Corporate Citizenship (CSR). Corporate activity motivated in part by a concern for the welfare
of non-owners of the company, and by an underlying commitment to basic principles such as
integrity, fairness and respect for people.
Cost Efficiency. Another name for economic efficiency
DEA. A non-parametric technique for assessing the relative efficiencies of a group of DMUs
where the units use multiple incommensurate inputs to produce incommensurate outputs
DEA Excel Solver. A Microsoft Excel Add-In for over 150 DEA models. Developed by Zhu.
DEA-Solver-PRO. DEA software for 130 DEA models in 32 clusters which uses the Microsoft
Excel platform. Developed by Tone.
Decision Making Unit. An organisational unit of research interest which can be defined by a set
of input-output characteristics which are common to other comparable units.
Decreasing Returns to Scale. When increases in inputs result in outputs increasing
proportionately less than the inputs.
Economic Efficiency (Cost Efficiency or Overall Efficiency). The total efficiency when the
allocative and technical efficiencies are combined as a ratio of the minimum production cost to
the actual production cost of the DMU.
Economic Value Added. A financial performance measurement method of calculating the true
economic value of a firm.
Globalisation. The process of global economic integration, facilitated by lower transaction costs
and lower barriers to the movement of capital, goods, services and labour, thus creating a single
market for inputs and outputs.
Increasing Returns to Scale. When increases in inputs results in proportionately greater
increases in outputs.
Input Orientation (Input Contraction or Input Minimization). When levels of outputs are
maintained and gains are achieved by trying to minimize inputs while operating in the same
environment.
Knowledge Economy. Knowledge based economies are those which are directly based on the
production, distribution and use of knowledge and information, and the role of knowledge, as
247
compared with natural resources, physical capital, and low-skill labour, has taken on greater
importance.
Knowledge Work. The work is the productive activity which is intellectual rather than physical
and results in value-creating transformation of information.
Linear Programming. A mathematical technique that seeks to maximize or minimize some
quantity (expressed as the objective function) in the presence of restrictions or constraints that
limit the achievement of the objective. It evaluates alternative courses of action under relations
that are expressed as linear equations or inequalities.
Output Orientation (Output Expansion or Output Maximization). When levels of inputs
are maintained and gains are achieved by trying to maximize outputs while operating in the
same environment.
Overall Efficiency. Another name for economic efficiency
Pareto Optimality. A measure of efficiency from game theory where each player’s outcome is
optimal with at least one player better, and the outcomes cannot be improved without at least
one becoming worse off.
Partial Productivity. A ratio of output to one class of input.
Performance Prism. A second generation PM framework which addresses all of the
organisation’s stakeholders through five facets of performance: stakeholder satisfaction,
stakeholder contribution, strategies, processes and capabilities.
Performance Pyramid. The final organisation performance aggregate scorecard measuring the
dimensions of CG, supply networks, customer relations, and internal company operations.
Productivity. The partial or total ratio of outputs to inputs.
Pure Technical Efficiency. The technical efficiency when independent of returns to scale.
Returns to Scale (RTS). A long-run concept which reflects the degree to which proportional
increases in input increases outputs. They may be constant RTS or variable RTS.
Slack. The amount of under-produced output or over-utilized input relative to the efficient
DMUs which have no slack. The amount of slack measures the improvement potential for the
inefficient DMU.
248
Stakeholders. Those groups or individuals who can affect, or are affected by, the firm’s
activities because of their material, political, affiliative, informational, symbolic or spiritual
interest in a firm. Because they have a legitimate interest, they have a moral right to managerial
attention.
Stewardship Theory. An alternative to agency theory whereby the executive manager, far from
being an opportunist at the expense of the owners, essentially wants to do a good job, and be a
good steward of corporate assets. Thus, this theory holds that performance variations arise due
to differences in the structural situation facilitating effective action by the executive.
Supply Chain Management (SCM). The multi-firm relationships of integrated networks from
upstream supplier to downstream customers that share information, product, services, finance
and knowledge.
Theory of Constraints. A model that claims changes to most variables in the organisation have
little impact on overall performance while there are a few vital ones which can have a significant
impact. These are the constraints to higher achievement and often regarded as ‘bottlenecks’.
Technical Efficiency. The extent to which the DMU obtains output from the inputs without
regard to prices and costs.
Total Factor Productivity (Total Productivity). The productivity ratio when all factors of
production are included, all inputs and all outputs.
Total Quality Management. A management philosophy with a focus on quality and the
development and adaptation of techniques for achieving customer satisfaction. It includes a
corporate culture based on self-directed work teams (SDWT) and employee participation.
Variable Returns to Scale (VRS). Changing inputs may not result in proportional changes in
outputs, a preferred DEA assumption. An Increasing RTS occurs when a proportional increase
in all inputs results in a more than proportional increase in output. A Decreasing RTS occurs
when an increase in inputs results in proportionally less increases in outputs.
249
Appendix 2a: Spreadsheet Modeling of DEA in Linear Programming
Modeling languages allow users to do mathematical programming in a straightforward manner
by the system mimicking the manual approach to solving the problem. Symbols are written
almost the same as on paper, defining the data parameters, selecting the solver to use, and
running the model.
Spreadsheet optimizers are tools readily available in the spreadsheet application of business
software suites. Probably the most well-know of these is Solver in the Microsoft Excel
application. It requires very little training as it is largely menu driven and the user defines
variables, constraints, and functions by selecting them from the available list and then invoking
Solver. Ragsdale (2004) for example, provides a strong spreadsheet-oriented text with a CD
which includes Premium Solver™ and other software.
There are several mathematical techniques that are now solvable using software programs built
into spreadsheet packages. Once the linear programming problem is formulated correctly and
communicated to the computer in the acceptable format, the large number of iterations typical of
LP problems is handled quickly and easily. LP in particular, is seen as important enough to
warrant built-in optimization tools called ‘solvers’. These are readily available in popular
spreadsheet programs such as Excel, Quattro Pro and Lotus 1-2-3 and in more specialized
packages such as CPLEX, MPSX, LINDO, MathPro, Crystal Ball Professional, etc.
There are four steps that summarize what needs to be done to implement a LP solution to a DEA
problem in a spreadsheet. These are:
1) organize the data;
2) represent the decision variables;
3) create a formula for the left-hand-side of the constraint; and
4) create a formula representing the objective function.
One of the first steps is to organize the data for the formulation of the LP problem. This consists
of the coefficients in the objective function, the coefficients in the constraints, and the right-
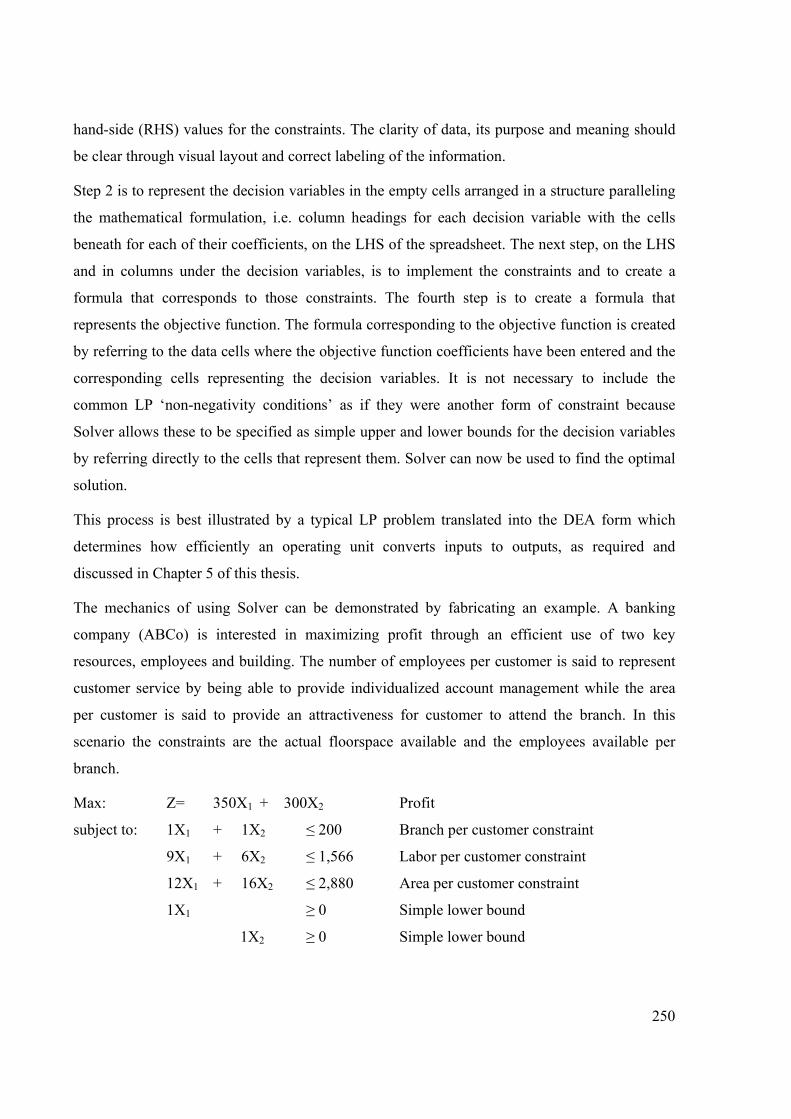
250
hand-side (RHS) values for the constraints. The clarity of data, its purpose and meaning should
be clear through visual layout and correct labeling of the information.
Step 2 is to represent the decision variables in the empty cells arranged in a structure paralleling
the mathematical formulation, i.e. column headings for each decision variable with the cells
beneath for each of their coefficients, on the LHS of the spreadsheet. The next step, on the LHS
and in columns under the decision variables, is to implement the constraints and to create a
formula that corresponds to those constraints. The fourth step is to create a formula that
represents the objective function. The formula corresponding to the objective function is created
by referring to the data cells where the objective function coefficients have been entered and the
corresponding cells representing the decision variables. It is not necessary to include the
common LP ‘non-negativity conditions’ as if they were another form of constraint because
Solver allows these to be specified as simple upper and lower bounds for the decision variables
by referring directly to the cells that represent them. Solver can now be used to find the optimal
solution.
This process is best illustrated by a typical LP problem translated into the DEA form which
determines how efficiently an operating unit converts inputs to outputs, as required and
discussed in Chapter 5 of this thesis.
The mechanics of using Solver can be demonstrated by fabricating an example. A banking
company (ABCo) is interested in maximizing profit through an efficient use of two key
resources, employees and building. The number of employees per customer is said to represent
customer service by being able to provide individualized account management while the area
per customer is said to provide an attractiveness for customer to attend the branch. In this
scenario the constraints are the actual floorspace available and the employees available per
branch.
Max: Z= 350X1 + 300X2 Profit
subject to: 1X1 + 1X2 ≤ 200 Branch per customer constraint
9X1 + 6X2 ≤ 1,566 Labor per customer constraint
12X1 + 16X2 ≤ 2,880 Area per customer constraint
1X1 ≥ 0 Simple lower bound
1X2 ≥ 0 Simple lower bound
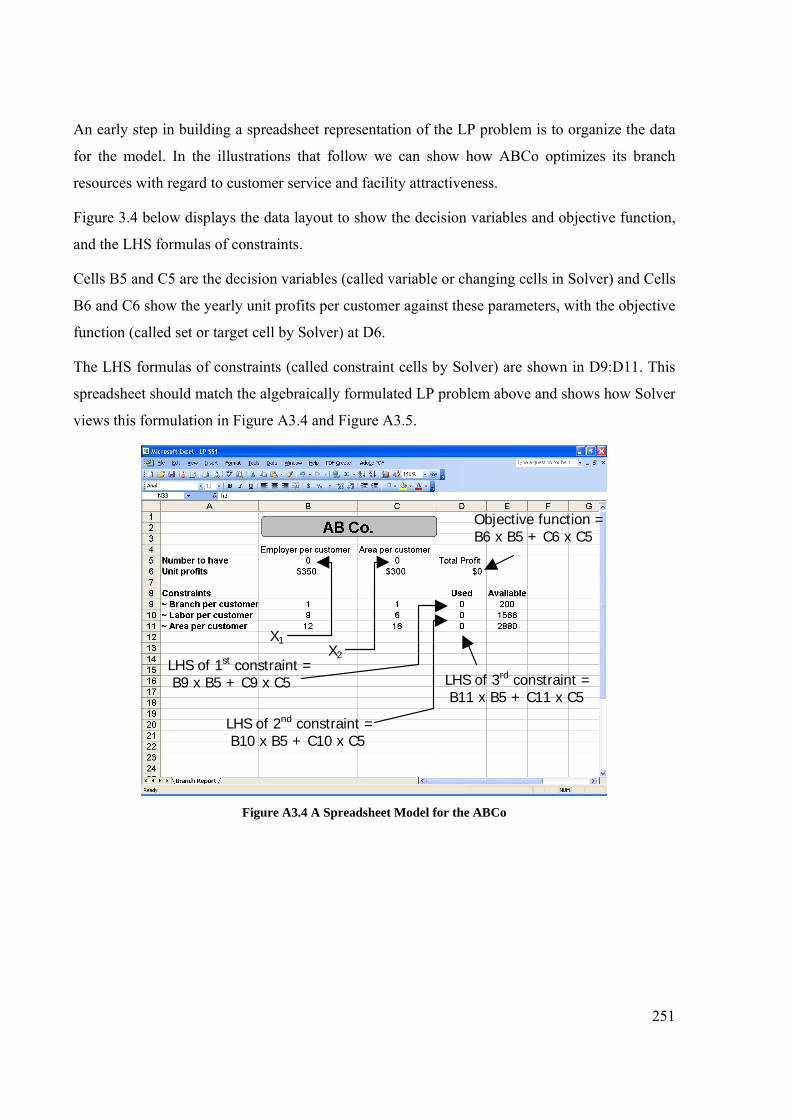
251
An early step in building a spreadsheet representation of the LP problem is to organize the data
for the model. In the illustrations that follow we can show how ABCo optimizes its branch
resources with regard to customer service and facility attractiveness.
Figure 3.4 below displays the data layout to show the decision variables and objective function,
and the LHS formulas of constraints.
Cells B5 and C5 are the decision variables (called variable or changing cells in Solver) and Cells
B6 and C6 show the yearly unit profits per customer against these parameters, with the objective
function (called set or target cell by Solver) at D6.
The LHS formulas of constraints (called constraint cells by Solver) are shown in D9:D11. This
spreadsheet should match the algebraically formulated LP problem above and shows how Solver
views this formulation in Figure A3.4 and Figure A3.5.
X1 X2
LHS of 1st constraint = B9 x B5 + C9 x C5
LHS of 2nd constraint = B10 x B5 + C10 x C5
LHS of 3rd constraint = B11 x B5 + C11 x C5
Objective function = B6 x B5 + C6 x C5
Figure A3.4 A Spreadsheet Model for the ABCo
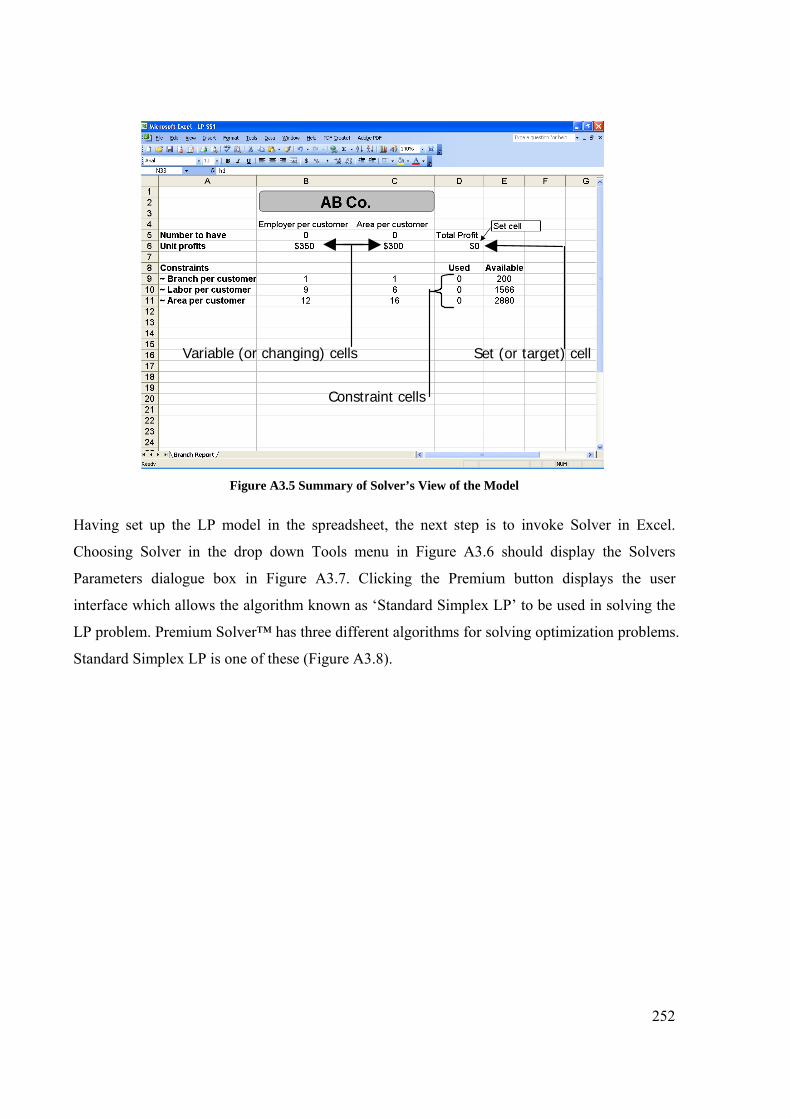
252
Variable (or changing) cells
Constraint cells
Set (or target) cell
Figure A3.5 Summary of Solver’s View of the Model
Having set up the LP model in the spreadsheet, the next step is to invoke Solver in Excel.
Choosing Solver in the drop down Tools menu in Figure A3.6 should display the Solvers
Parameters dialogue box in Figure A3.7. Clicking the Premium button displays the user
interface which allows the algorithm known as ‘Standard Simplex LP’ to be used in solving the
LP problem. Premium Solver™ has three different algorithms for solving optimization problems.
Standard Simplex LP is one of these (Figure A3.8).
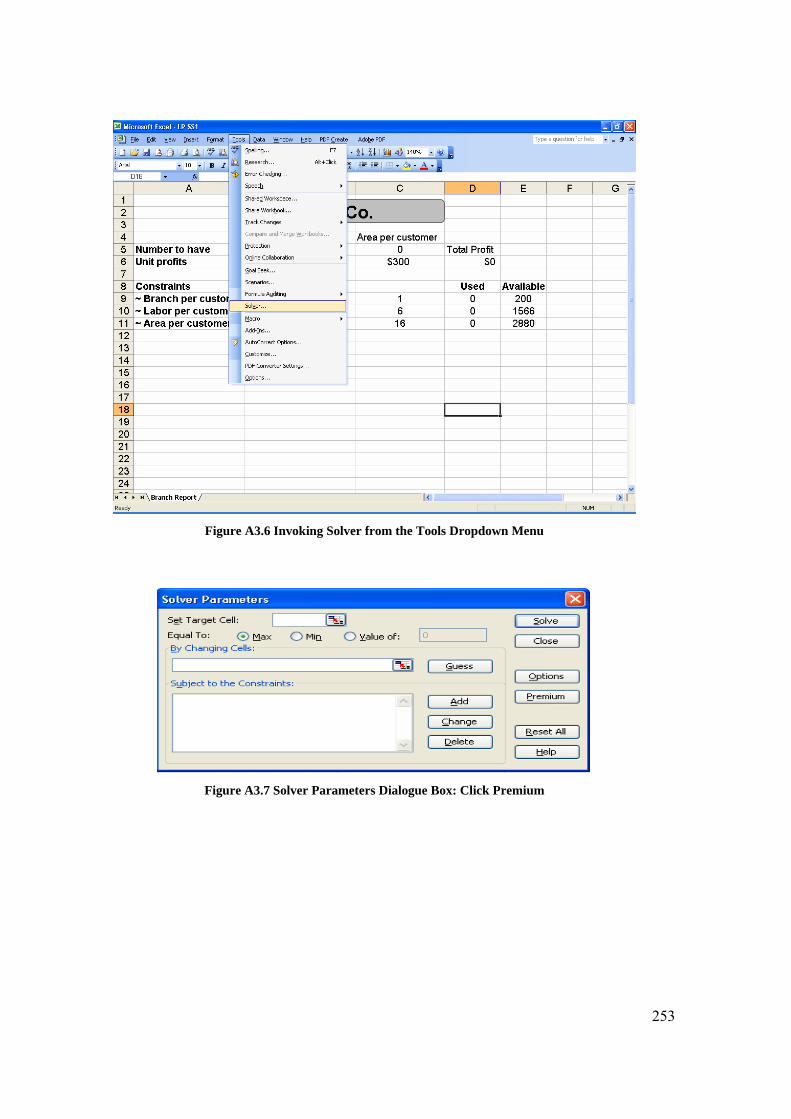
253
Figure A3.6 Invoking Solver from the Tools Dropdown Menu
Figure A3.7 Solver Parameters Dialogue Box: Click Premium
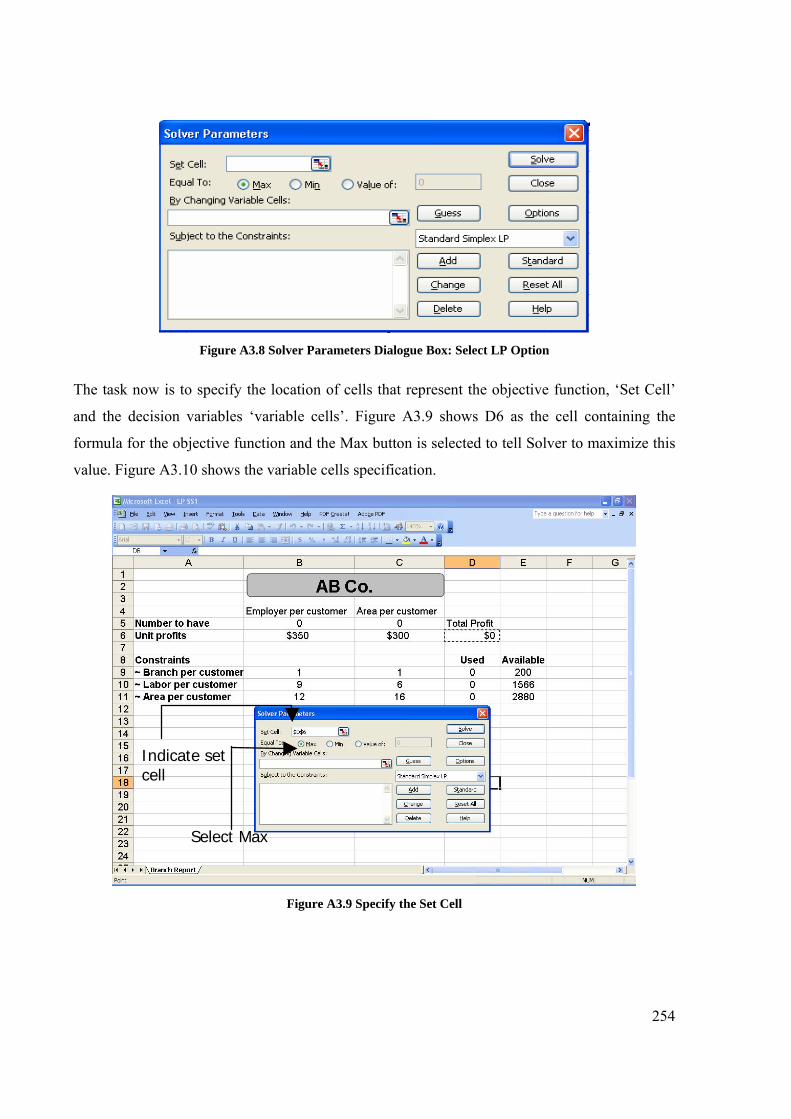
254
Figure A3.8 Solver Parameters Dialogue Box: Select LP Option
The task now is to specify the location of cells that represent the objective function, ‘Set Cell’
and the decision variables ‘variable cells’. Figure A3.9 shows D6 as the cell containing the
formula for the objective function and the Max button is selected to tell Solver to maximize this
value. Figure A3.10 shows the variable cells specification.
Indicate set cell
Select Max
Figure A3.9 Specify the Set Cell
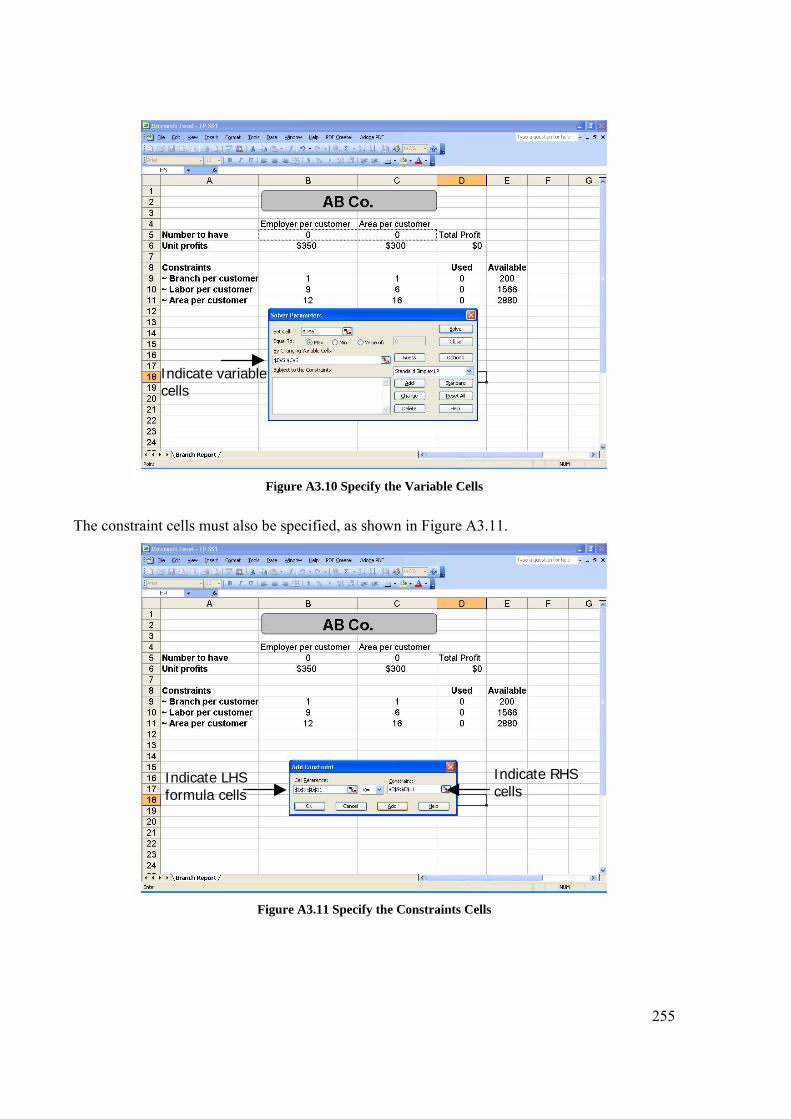
255
Indicate variable cells
Figure A3.10 Specify the Variable Cells
The constraint cells must also be specified, as shown in Figure A3.11.
Indicate LHS formula cells
Indicate RHS cells
Figure A3.11 Specify the Constraints Cells
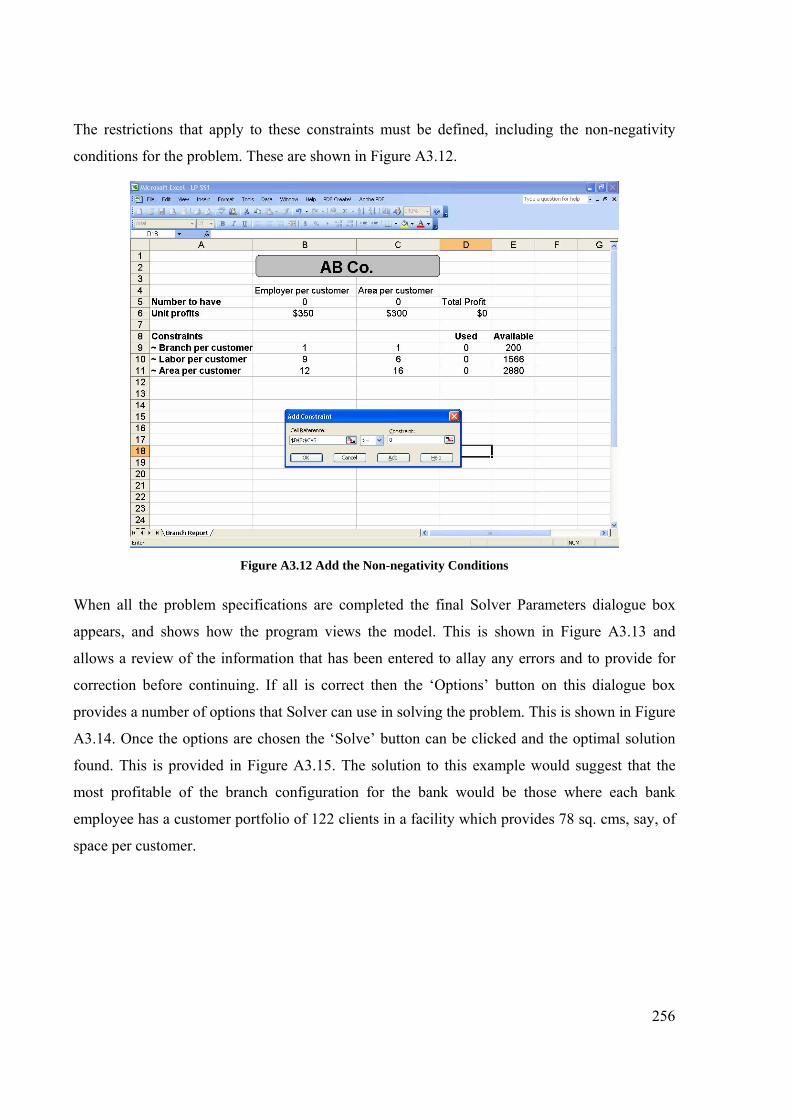
256
The restrictions that apply to these constraints must be defined, including the non-negativity
conditions for the problem. These are shown in Figure A3.12.
Figure A3.12 Add the Non-negativity Conditions
When all the problem specifications are completed the final Solver Parameters dialogue box
appears, and shows how the program views the model. This is shown in Figure A3.13 and
allows a review of the information that has been entered to allay any errors and to provide for
correction before continuing. If all is correct then the ‘Options’ button on this dialogue box
provides a number of options that Solver can use in solving the problem. This is shown in Figure
A3.14. Once the options are chosen the ‘Solve’ button can be clicked and the optimal solution
found. This is provided in Figure A3.15. The solution to this example would suggest that the
most profitable of the branch configuration for the bank would be those where each bank
employee has a customer portfolio of 122 clients in a facility which provides 78 sq. cms, say, of
space per customer.
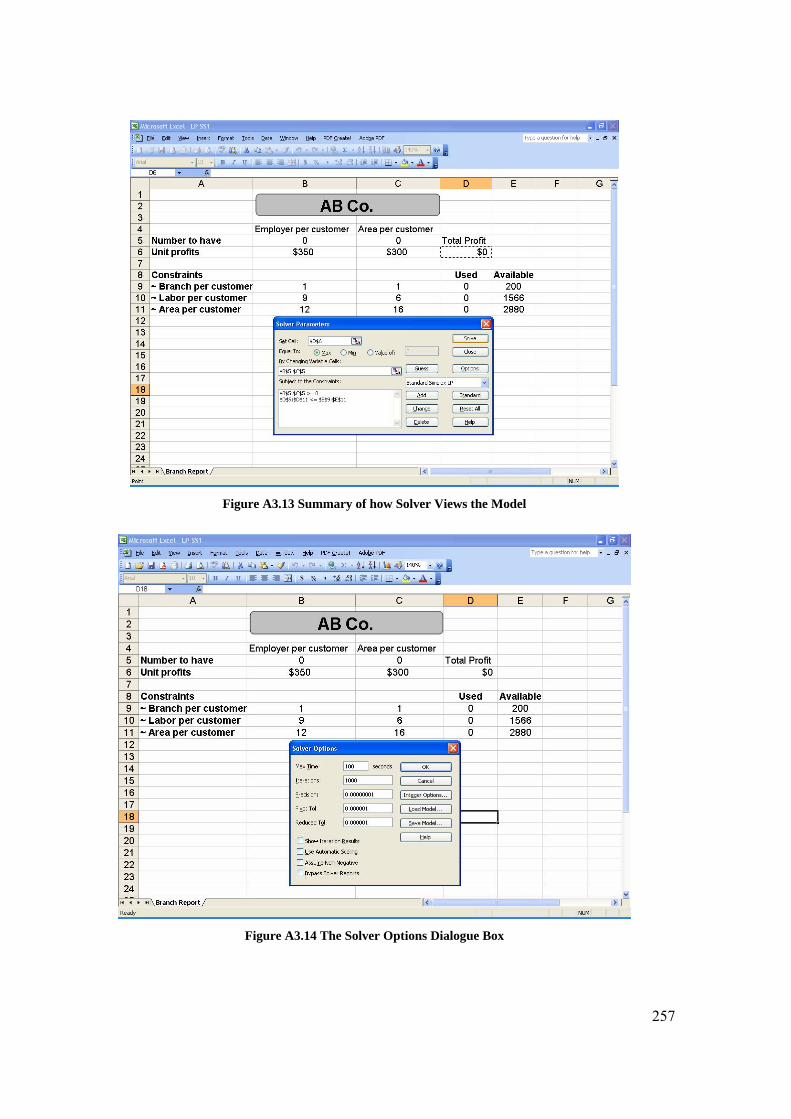
257
Figure A3.13 Summary of how Solver Views the Model
Figure A3.14 The Solver Options Dialogue Box
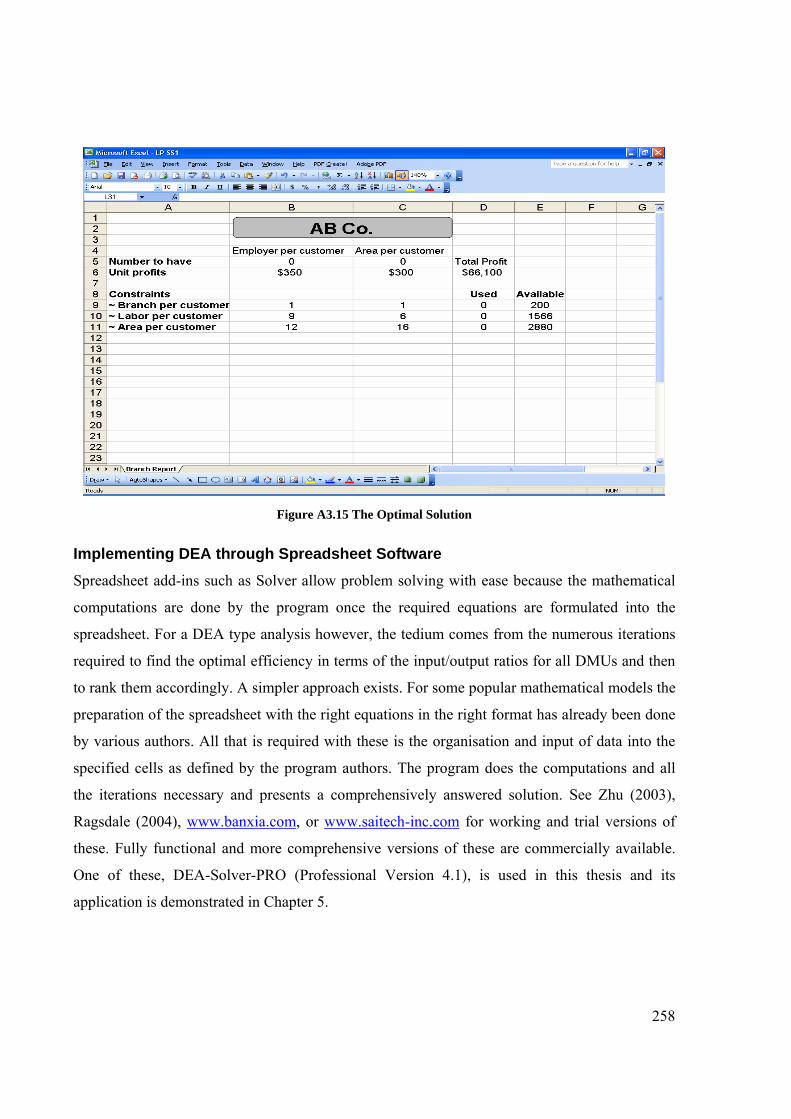
258
Figure A3.15 The Optimal Solution
Implementing DEA through Spreadsheet Software Spreadsheet add-ins such as Solver allow problem solving with ease because the mathematical
computations are done by the program once the required equations are formulated into the
spreadsheet. For a DEA type analysis however, the tedium comes from the numerous iterations
required to find the optimal efficiency in terms of the input/output ratios for all DMUs and then
to rank them accordingly. A simpler approach exists. For some popular mathematical models the
preparation of the spreadsheet with the right equations in the right format has already been done
by various authors. All that is required with these is the organisation and input of data into the
specified cells as defined by the program authors. The program does the computations and all
the iterations necessary and presents a comprehensively answered solution. See Zhu (2003),
Ragsdale (2004), www.banxia.com, or www.saitech-inc.com for working and trial versions of
these. Fully functional and more comprehensive versions of these are commercially available.
One of these, DEA-Solver-PRO (Professional Version 4.1), is used in this thesis and its
application is demonstrated in Chapter 5.
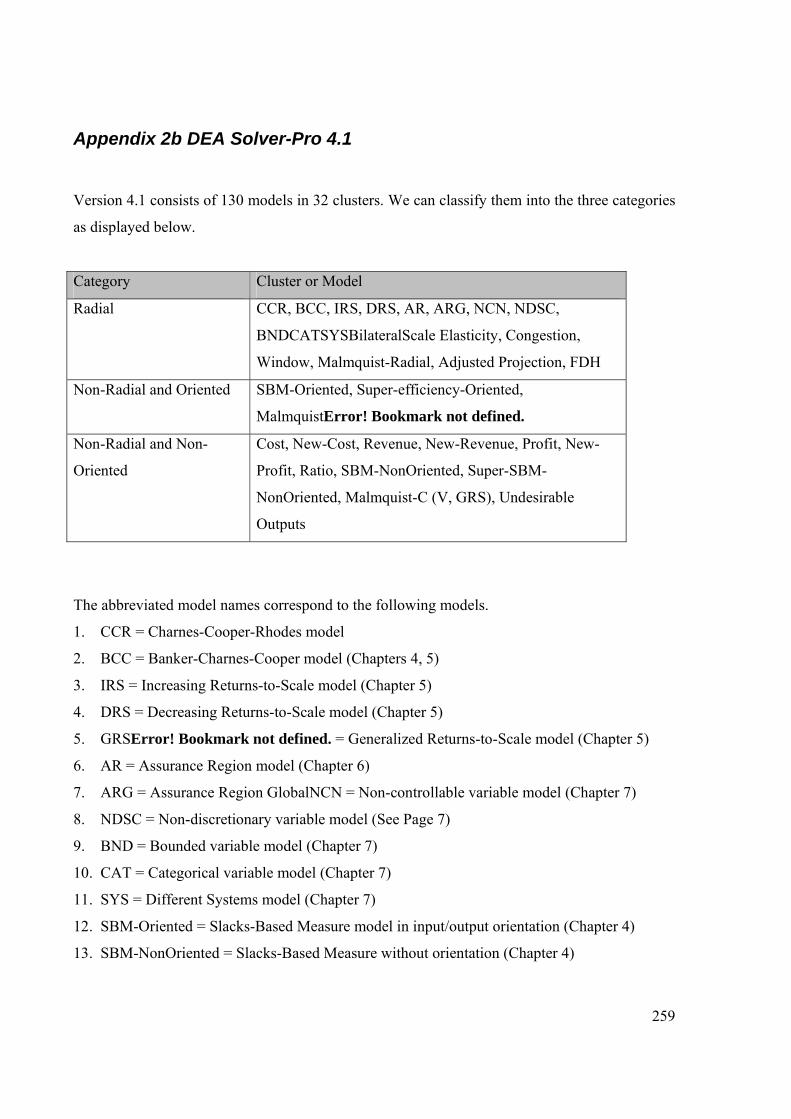
259
Appendix 2b DEA Solver-Pro 4.1
Version 4.1 consists of 130 models in 32 clusters. We can classify them into the three categories
as displayed below.
Category Cluster or Model
Radial CCR, BCC, IRS, DRS, AR, ARG, NCN, NDSC,
BNDCATSYSBilateralScale Elasticity, Congestion,
Window, Malmquist-Radial, Adjusted Projection, FDH
Non-Radial and Oriented SBM-Oriented, Super-efficiency-Oriented,
MalmquistError! Bookmark not defined.
Non-Radial and Non-
Oriented
Cost, New-Cost, Revenue, New-Revenue, Profit, New-
Profit, Ratio, SBM-NonOriented, Super-SBM-
NonOriented, Malmquist-C (V, GRS), Undesirable
Outputs
The abbreviated model names correspond to the following models.
1. CCR = Charnes-Cooper-Rhodes model
2. BCC = Banker-Charnes-Cooper model (Chapters 4, 5)
3. IRS = Increasing Returns-to-Scale model (Chapter 5)
4. DRS = Decreasing Returns-to-Scale model (Chapter 5)
5. GRSError! Bookmark not defined. = Generalized Returns-to-Scale model (Chapter 5)
6. AR = Assurance Region model (Chapter 6)
7. ARG = Assurance Region GlobalNCN = Non-controllable variable model (Chapter 7)
8. NDSC = Non-discretionary variable model (See Page 7)
9. BND = Bounded variable model (Chapter 7)
10. CAT = Categorical variable model (Chapter 7)
11. SYS = Different Systems model (Chapter 7)
12. SBM-Oriented = Slacks-Based Measure model in input/output orientation (Chapter 4)
13. SBM-NonOriented = Slacks-Based Measure without orientation (Chapter 4)
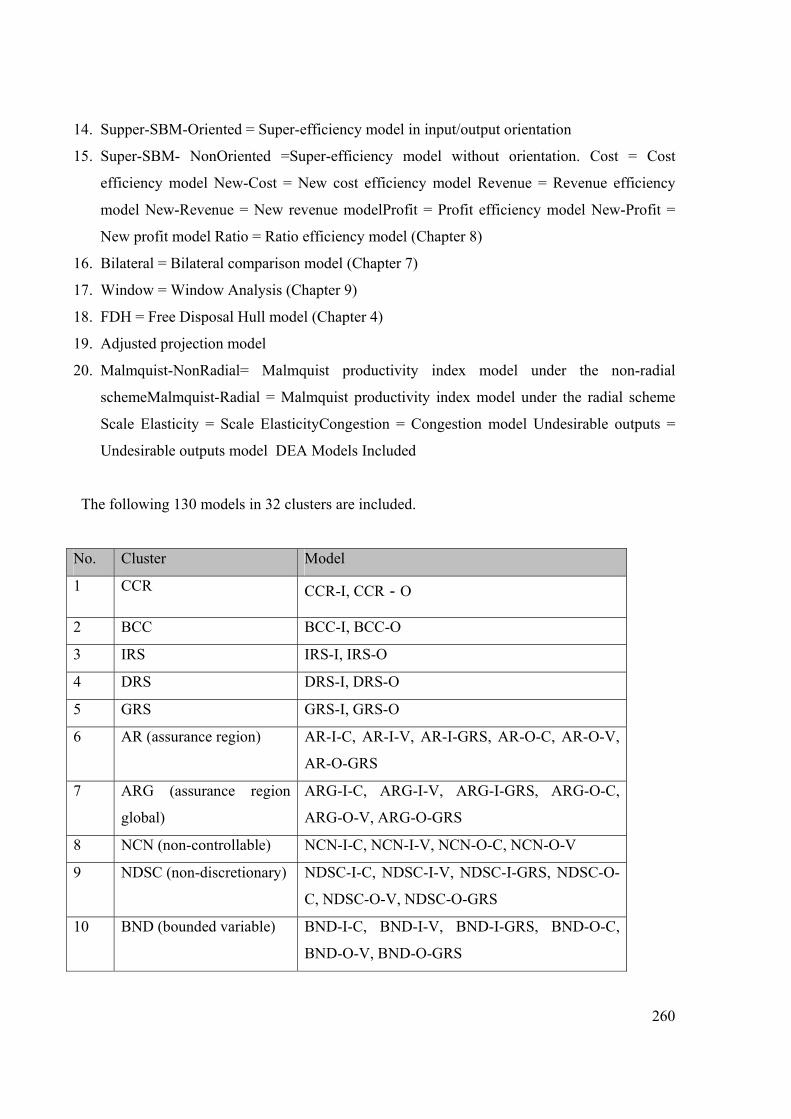
260
14. Supper-SBM-Oriented = Super-efficiency model in input/output orientation
15. Super-SBM- NonOriented =Super-efficiency model without orientation. Cost = Cost
efficiency model New-Cost = New cost efficiency model Revenue = Revenue efficiency
model New-Revenue = New revenue modelProfit = Profit efficiency model New-Profit =
New profit model Ratio = Ratio efficiency model (Chapter 8)
16. Bilateral = Bilateral comparison model (Chapter 7)
17. Window = Window Analysis (Chapter 9)
18. FDH = Free Disposal Hull model (Chapter 4)
19. Adjusted projection model
20. Malmquist-NonRadial= Malmquist productivity index model under the non-radial
schemeMalmquist-Radial = Malmquist productivity index model under the radial scheme
Scale Elasticity = Scale ElasticityCongestion = Congestion model Undesirable outputs =
Undesirable outputs model DEA Models Included
The following 130 models in 32 clusters are included.
No. Cluster Model
1 CCR CCR-I, CCR-O
2 BCC BCC-I, BCC-O
3 IRS IRS-I, IRS-O
4 DRS DRS-I, DRS-O
5 GRS GRS-I, GRS-O
6 AR (assurance region) AR-I-C, AR-I-V, AR-I-GRS, AR-O-C, AR-O-V,
AR-O-GRS
7 ARG (assurance region
global)
ARG-I-C, ARG-I-V, ARG-I-GRS, ARG-O-C,
ARG-O-V, ARG-O-GRS
8 NCN (non-controllable) NCN-I-C, NCN-I-V, NCN-O-C, NCN-O-V
9 NDSC (non-discretionary) NDSC-I-C, NDSC-I-V, NDSC-I-GRS, NDSC-O-
C, NDSC-O-V, NDSC-O-GRS
10 BND (bounded variable) BND-I-C, BND-I-V, BND-I-GRS, BND-O-C,
BND-O-V, BND-O-GRS

261
11 CAT (categorical variable) CAT-I-C, CAT-I-V, CAT-O-C, CAT-O-V
12 SYS (different systems) SYS-I-C, SYS-I-V, SYS-O-C, SYS-O-V
13 SBM-Oriented (Slacks-
based Measure)
SBM-I-C, SBM-I-V, SBM-I-GRS, SBM-O-C,
SBM-O-V, SBM-O-GRS, SBM-AR-I-C, SBM-
AR-I-V, SBM-AR-O-C, SBM-AR-O-V
14 SBM-NonOriented SBM-C, SBM-V, SBM-GRS, SBM-AR-C, SBM-
AR-V
15 Super-SBM-Oriented Super-SBM-I-C, Super-SBM-I-V, Super-SBM-I-
GRS, Super-SBM-O-C, Super-SBM-O-V, Super-
SBM-O-GRS
16 Super-SBM-NonOriented Super-SBM-C, Super-SBM-V, Super-SBM-GRS
17 Cost Cost-C, Cost-V, Cost-GRS
18 New-Cost New-Cost-C, New-Cost-V, New-Cost-GRS
19 Revenue Revenue-C, Revenue-V, Revenue-GRS
20 New-Revenue New-Revenue-C, New-Revenue-V, New-
Revenue-GRS
21 Profit Profit-C, Profit-V, Profit-GRS
22 New-Profit New-Profit-C, New-Profit-V, New-Profit-GRS
23 Ratio (Revenue/Cost) Ratio-C, Ratio-V
24 Bilateral Bilateral
25 Window Window-I-C, Window-I-V, Window-I-GRS,
Window-O-C, Window-O-V, Window-O-GRS
26 FDH FDH
27 Adjusted Projection Adj-CCR-I, Adj-CCR-O, Adj-BCC-I, Adj-BCC-
O, Adj-AR-I-C, Adj-AR-I-V, Adj-AR-O-C,
Adj-AR-O-V
28 Malmquist-NonRadial Malmquist-I-C, Malmquist-I-V, Malmquist-I-
GRS, Malmquist-O-C, Malmquist-O-V,
Malmquist-O-GRS,
Malmquist-C, Malmquist-V, Malmquist-GRS
29 Malmquist-Radial Malmquist-Radial-I-C, Malmquist-Radial-I-V,
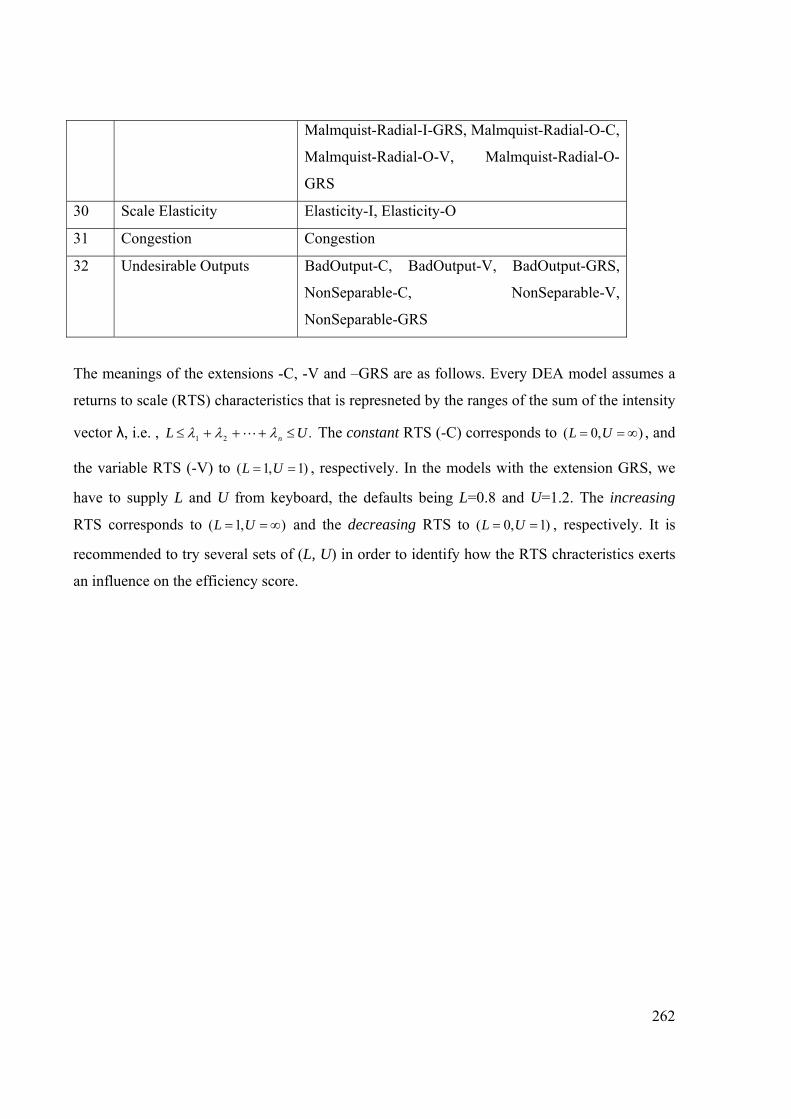
262
Malmquist-Radial-I-GRS, Malmquist-Radial-O-C,
Malmquist-Radial-O-V, Malmquist-Radial-O-
GRS
30 Scale Elasticity Elasticity-I, Elasticity-O
31 Congestion Congestion
32 Undesirable Outputs BadOutput-C, BadOutput-V, BadOutput-GRS,
NonSeparable-C, NonSeparable-V,
NonSeparable-GRS
The meanings of the extensions -C, -V and –GRS are as follows. Every DEA model assumes a
returns to scale (RTS) characteristics that is represneted by the ranges of the sum of the intensity
vector λ, i.e. , .21 UL n ≤+++≤ λλλ L The constant RTS (-C) corresponds to ),0( ∞== UL , and
the variable RTS (-V) to )1,1( == UL , respectively. In the models with the extension GRS, we
have to supply L and U from keyboard, the defaults being L=0.8 and U=1.2. The increasing
RTS corresponds to ),1( ∞== UL and the decreasing RTS to )1,0( == UL , respectively. It is
recommended to try several sets of (L, U) in order to identify how the RTS chracteristics exerts
an influence on the efficiency score.
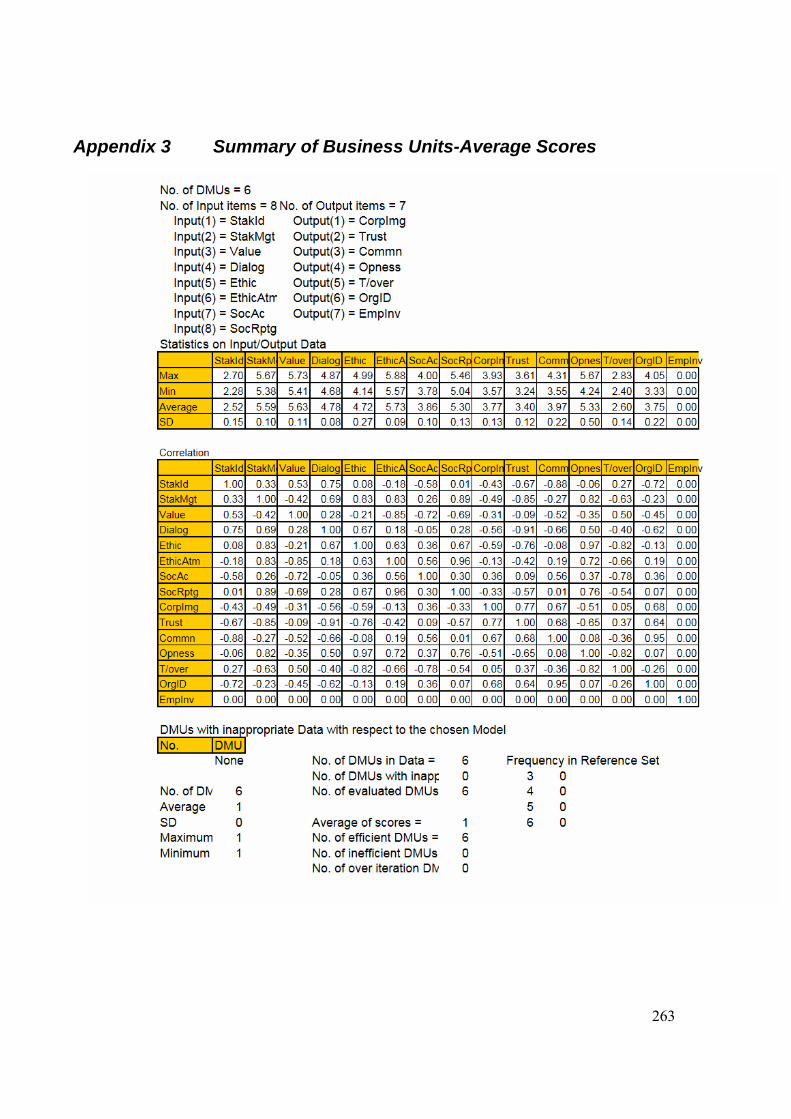
263
Appendix 3 Summary of Business Units-Average Scores
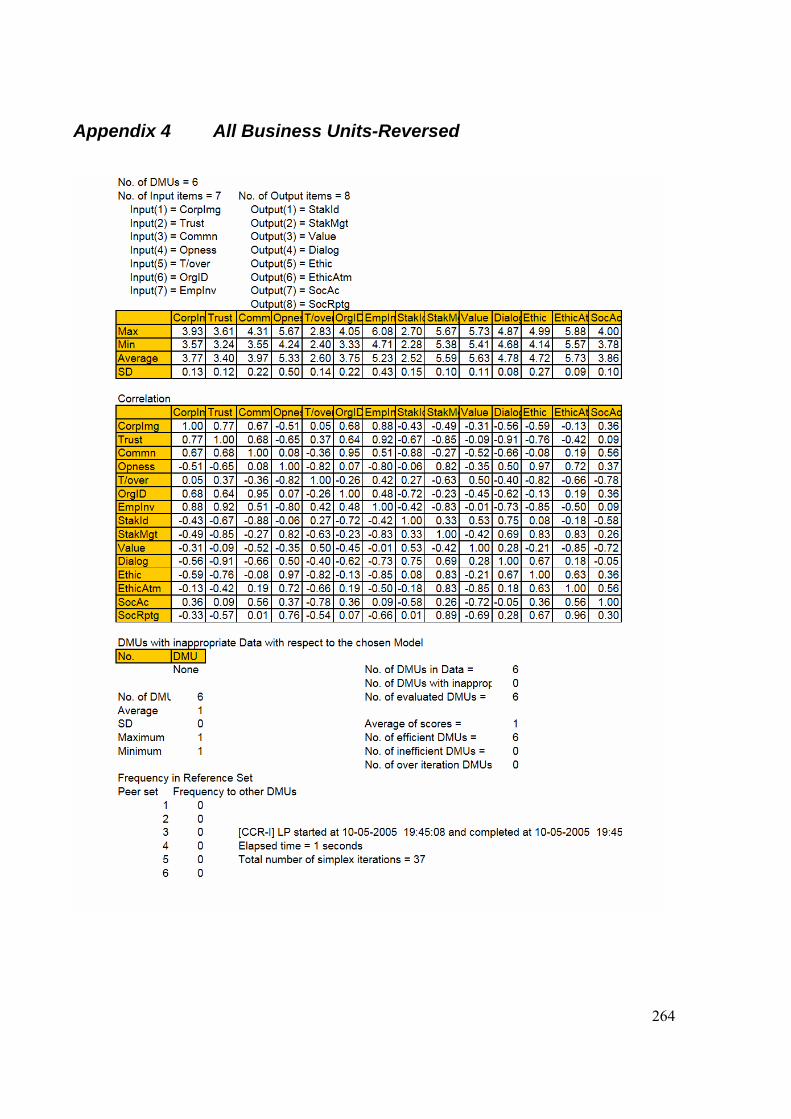
264
Appendix 4 All Business Units-Reversed
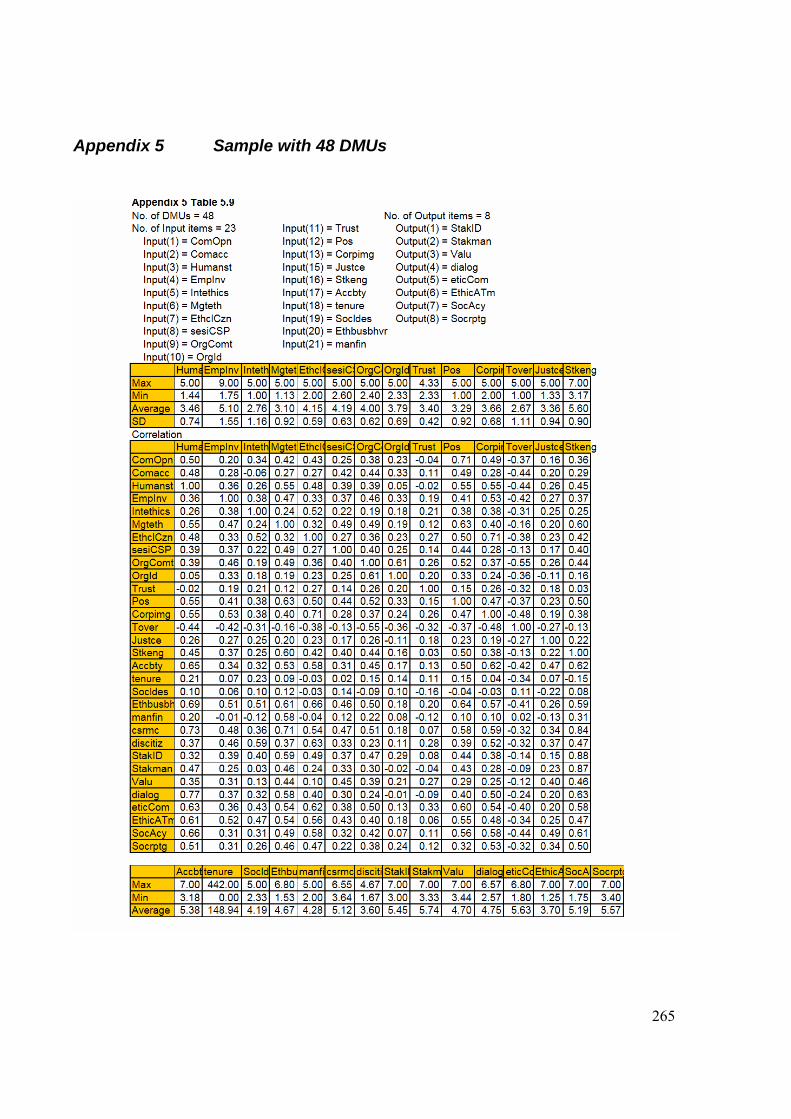
265
Appendix 5 Sample with 48 DMUs
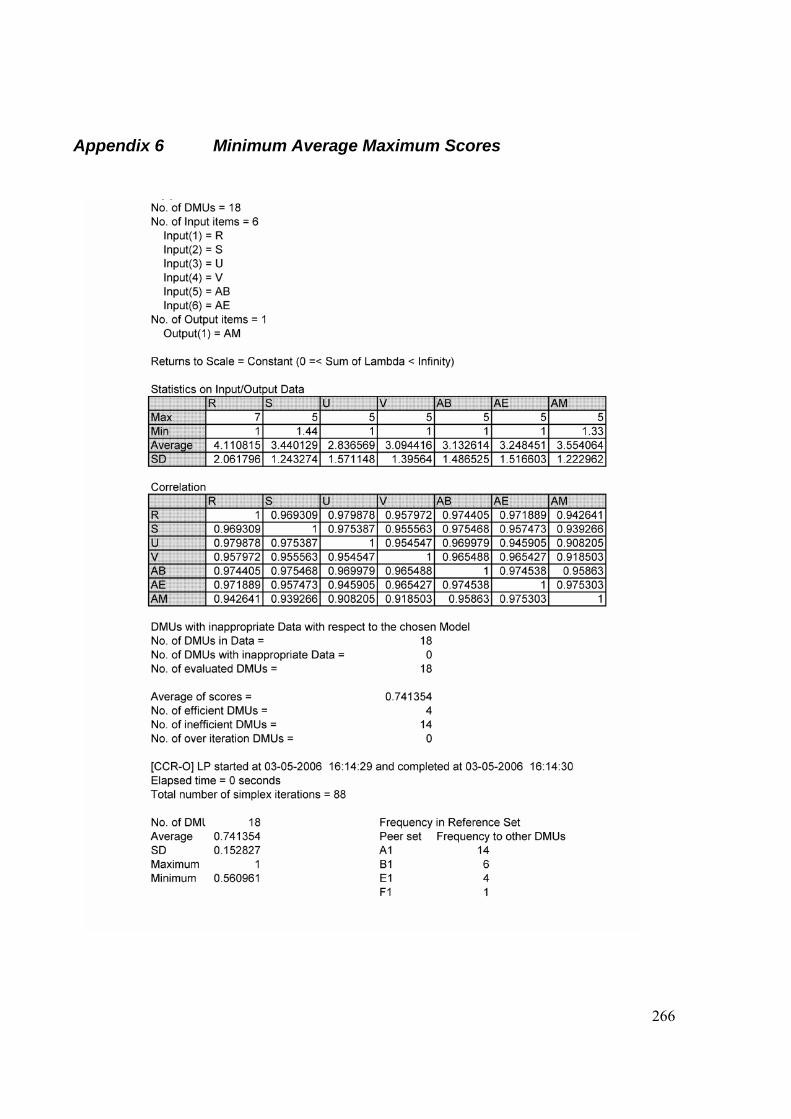
266
Appendix 6 Minimum Average Maximum Scores
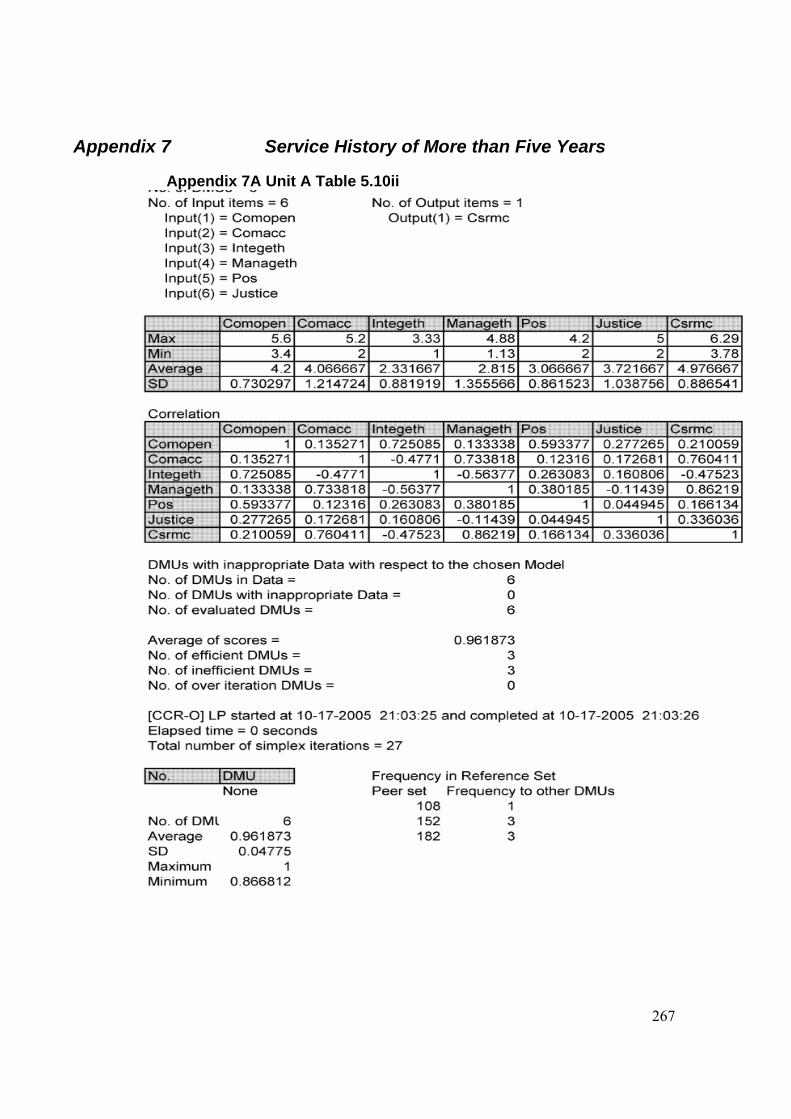
267
Appendix 7 Service History of More than Five Years
Appendix 7A Unit A Table 5.10ii
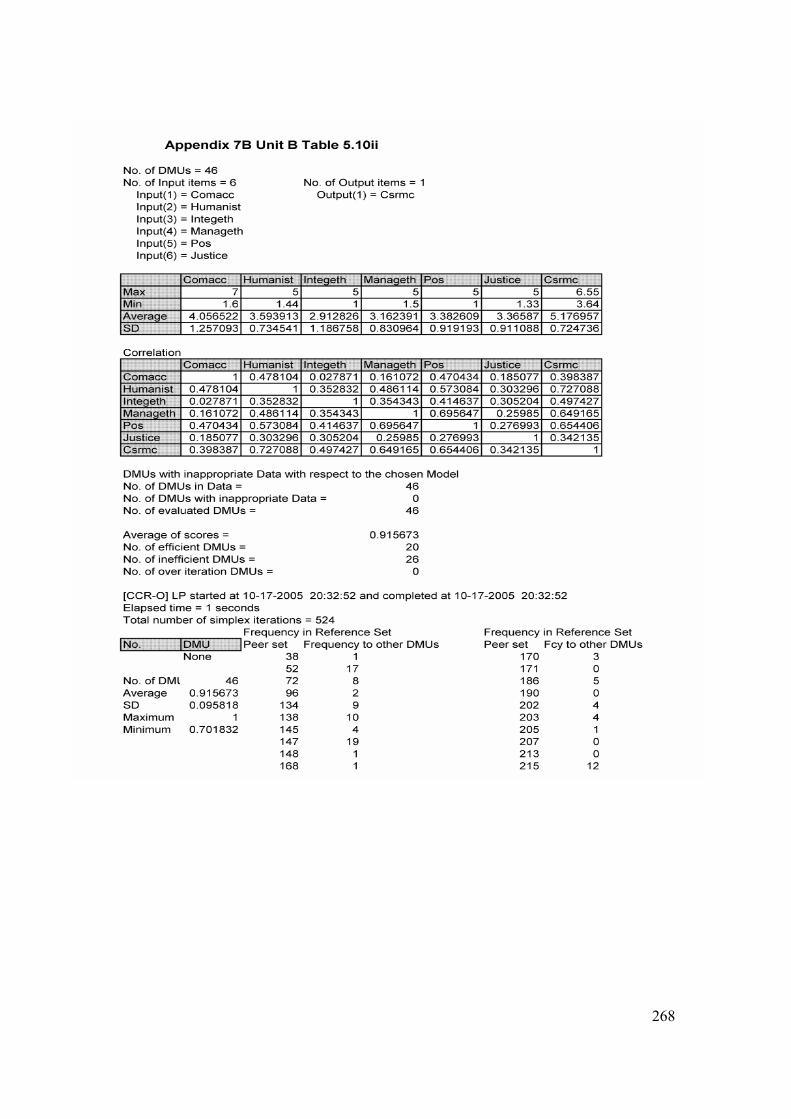
268
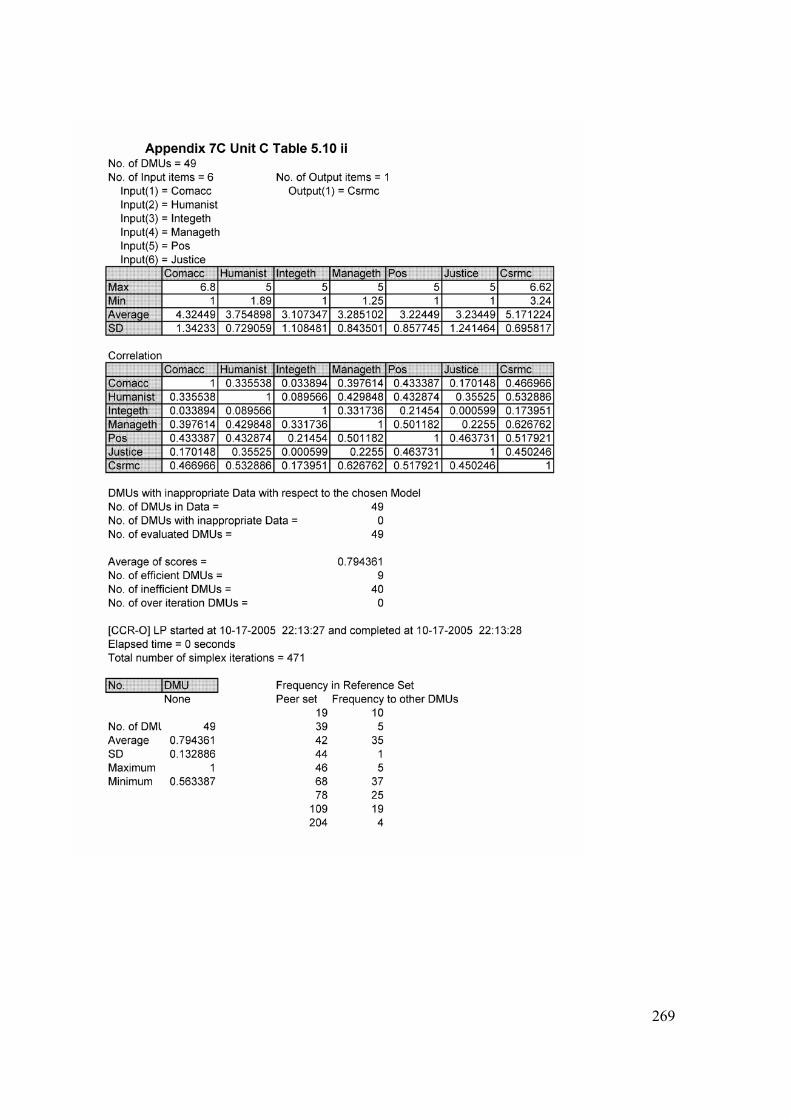
269
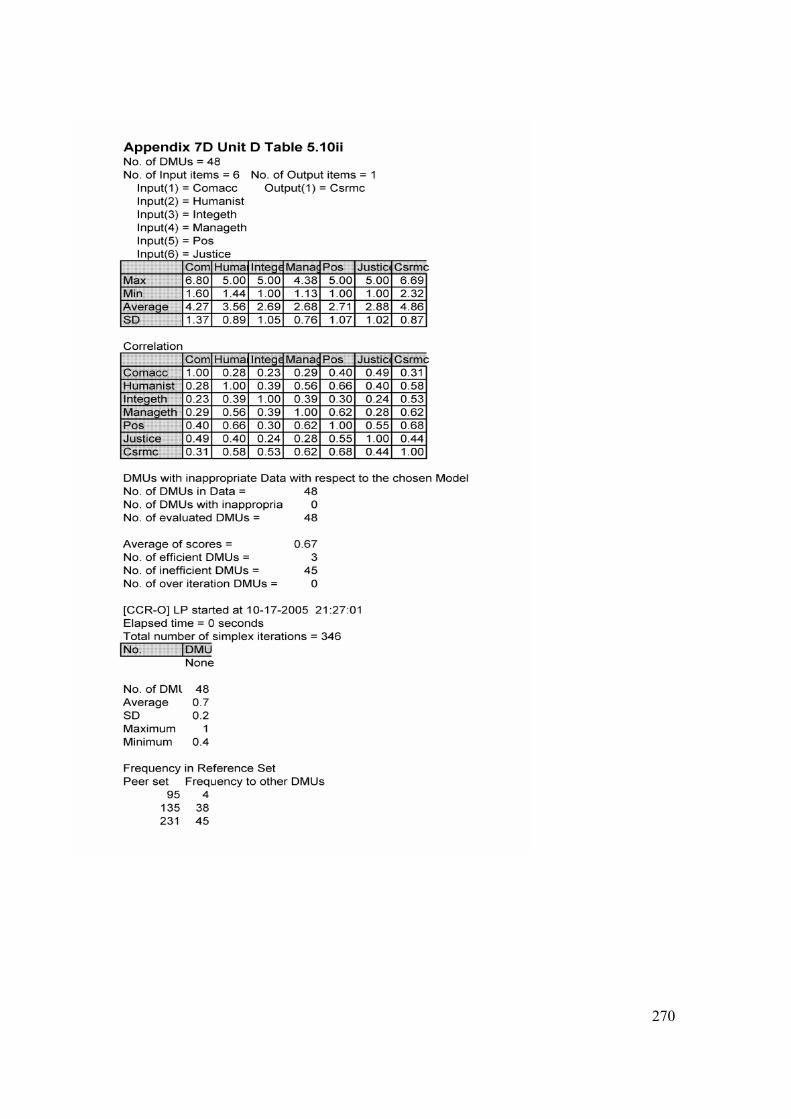
270
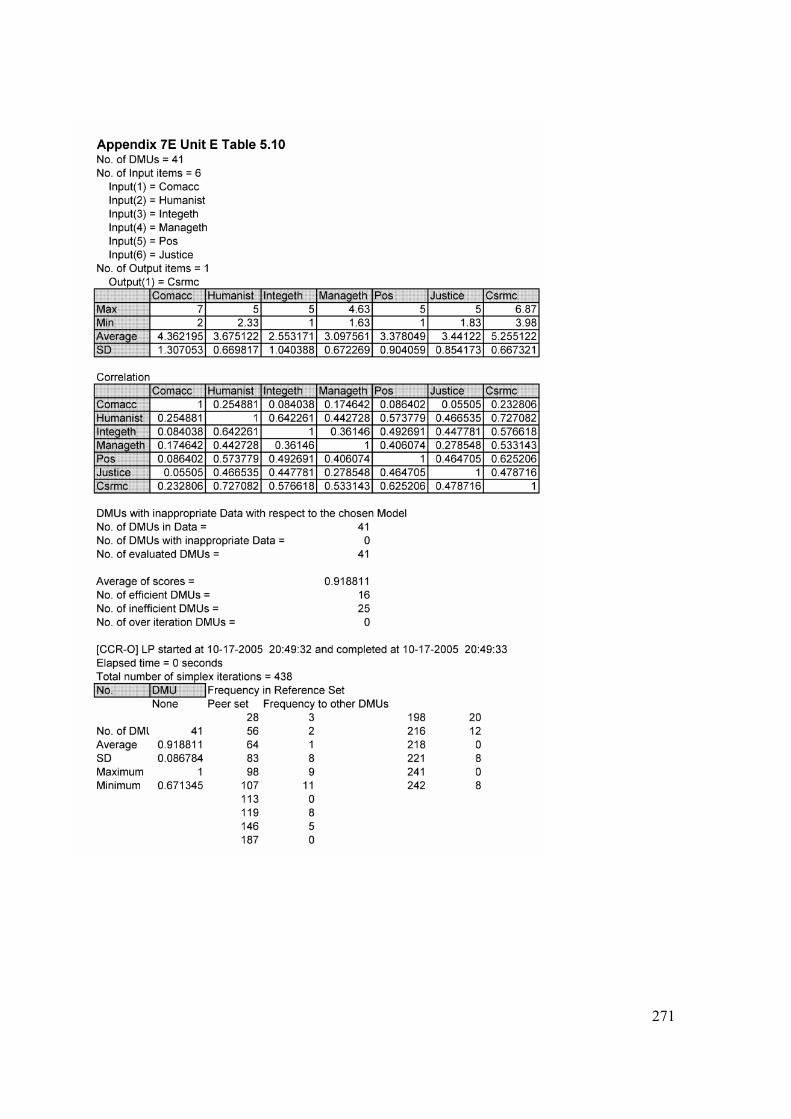
271
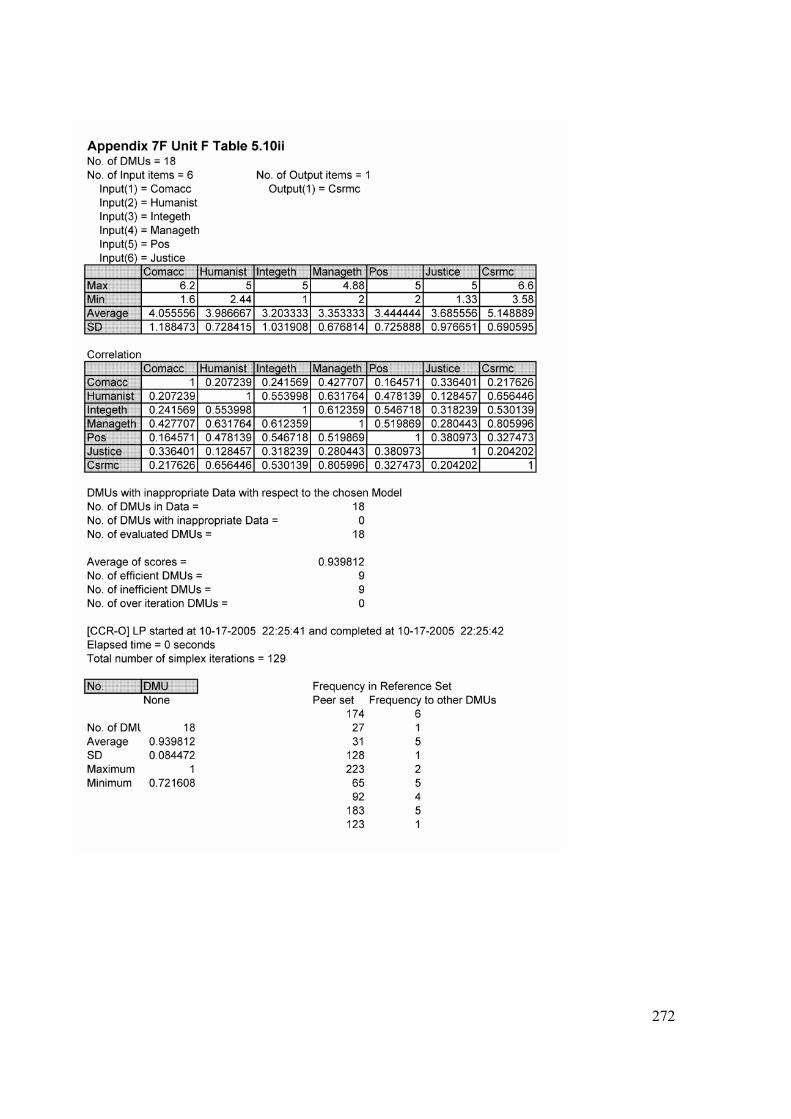
272
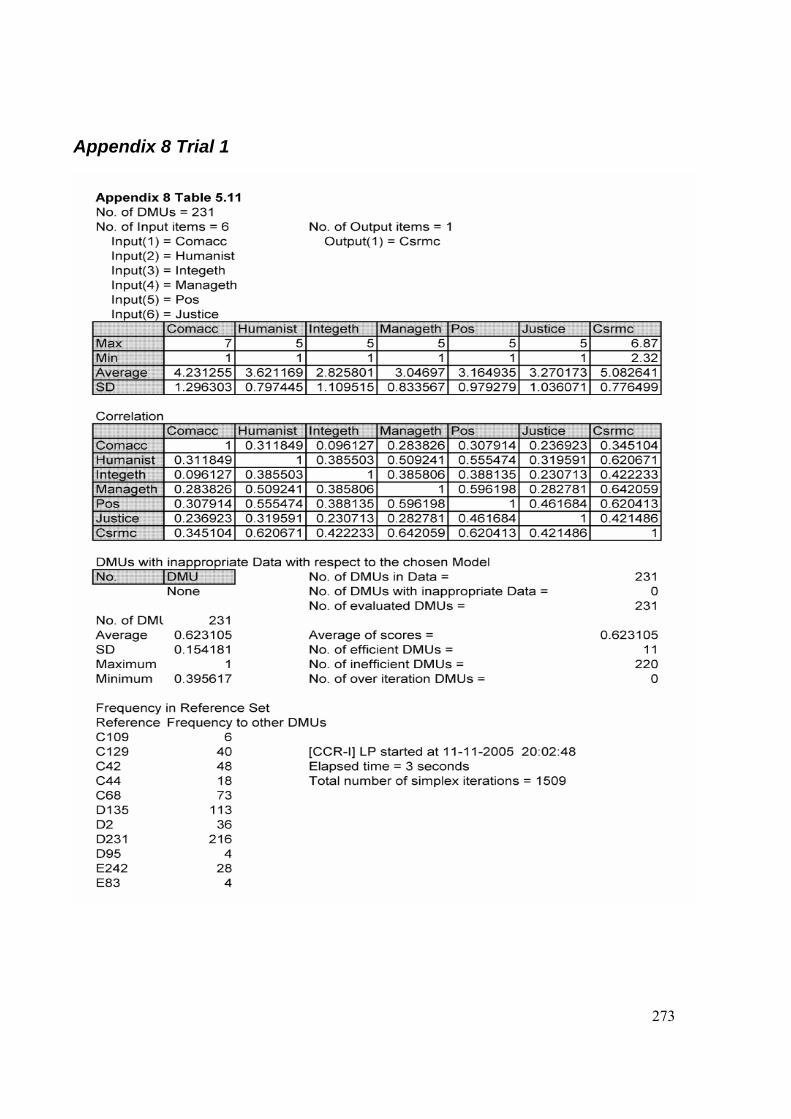
273
Appendix 8 Trial 1
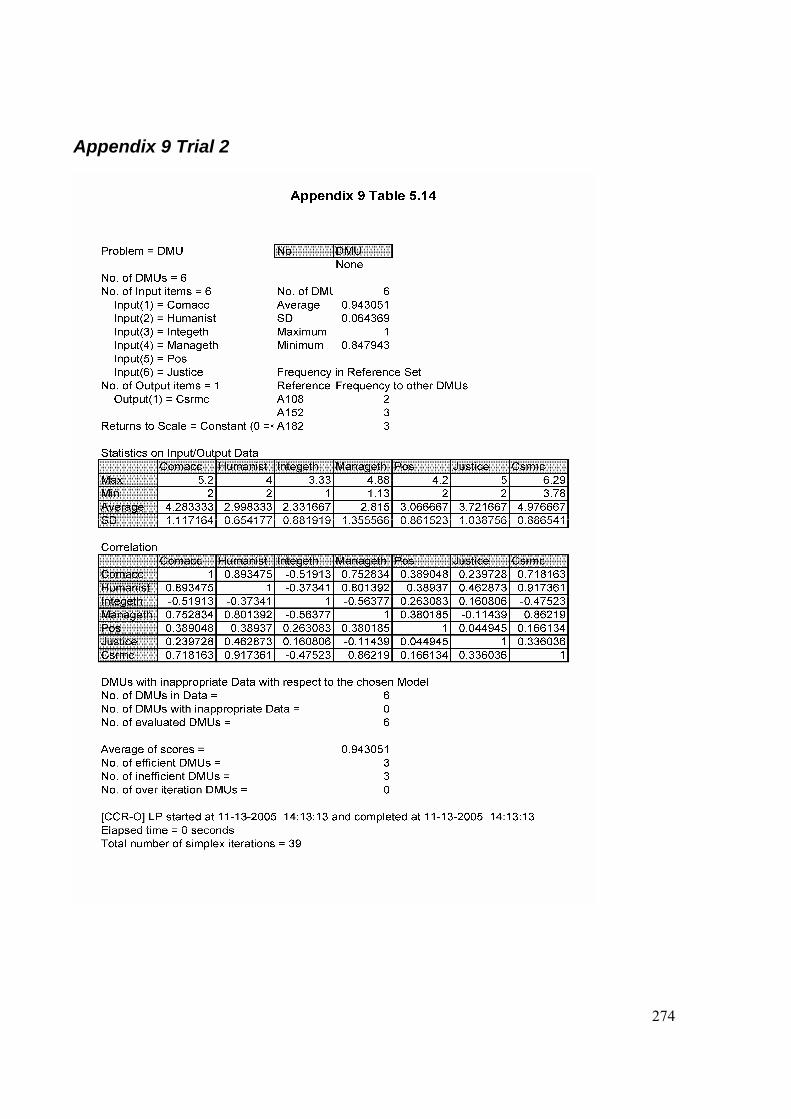
274
Appendix 9 Trial 2
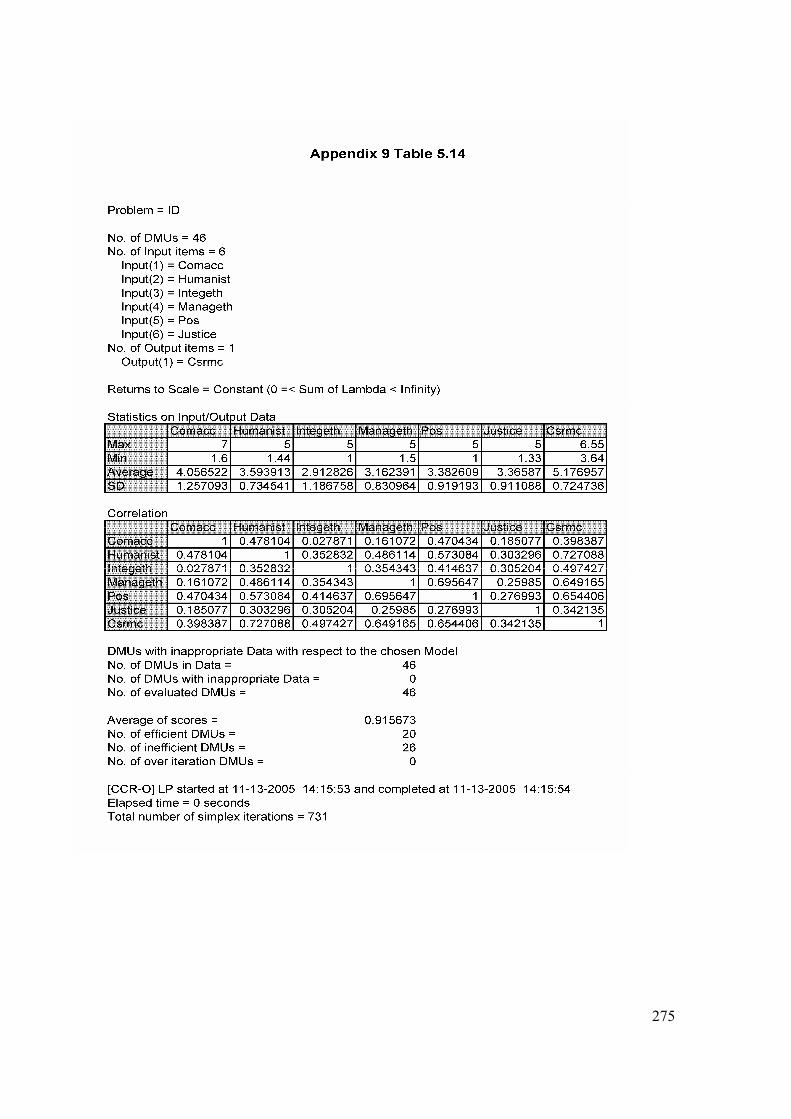
275
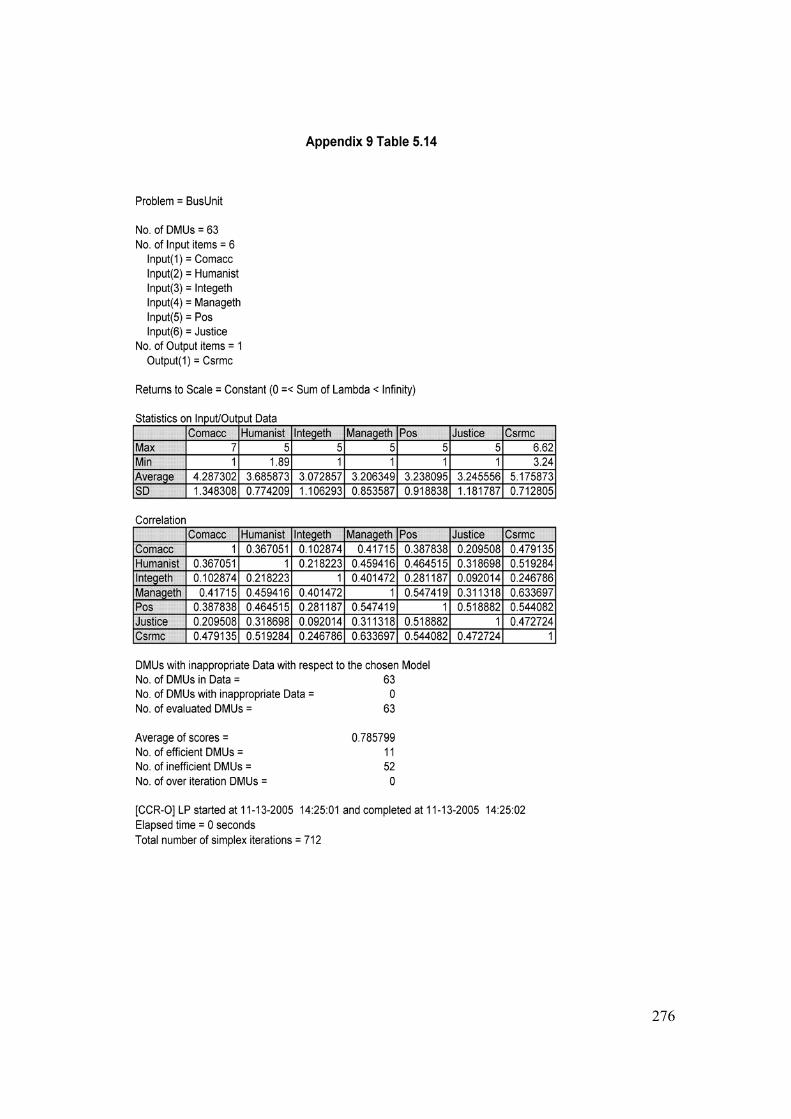
276
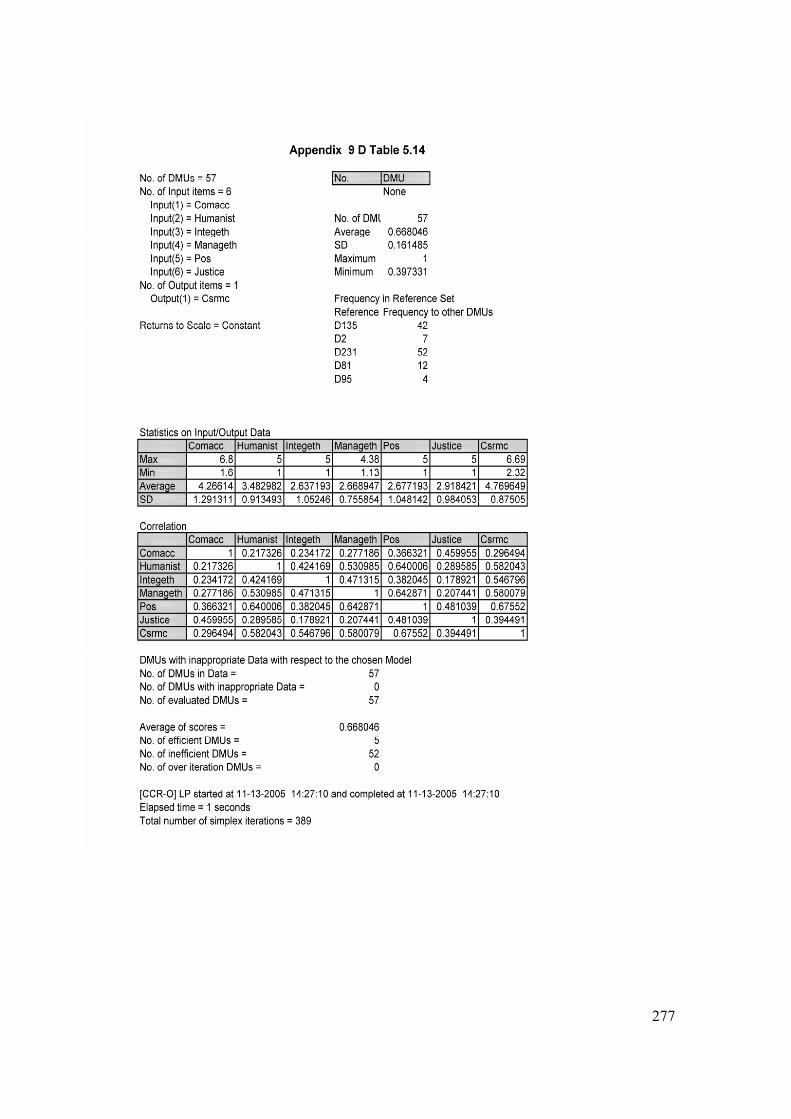
277
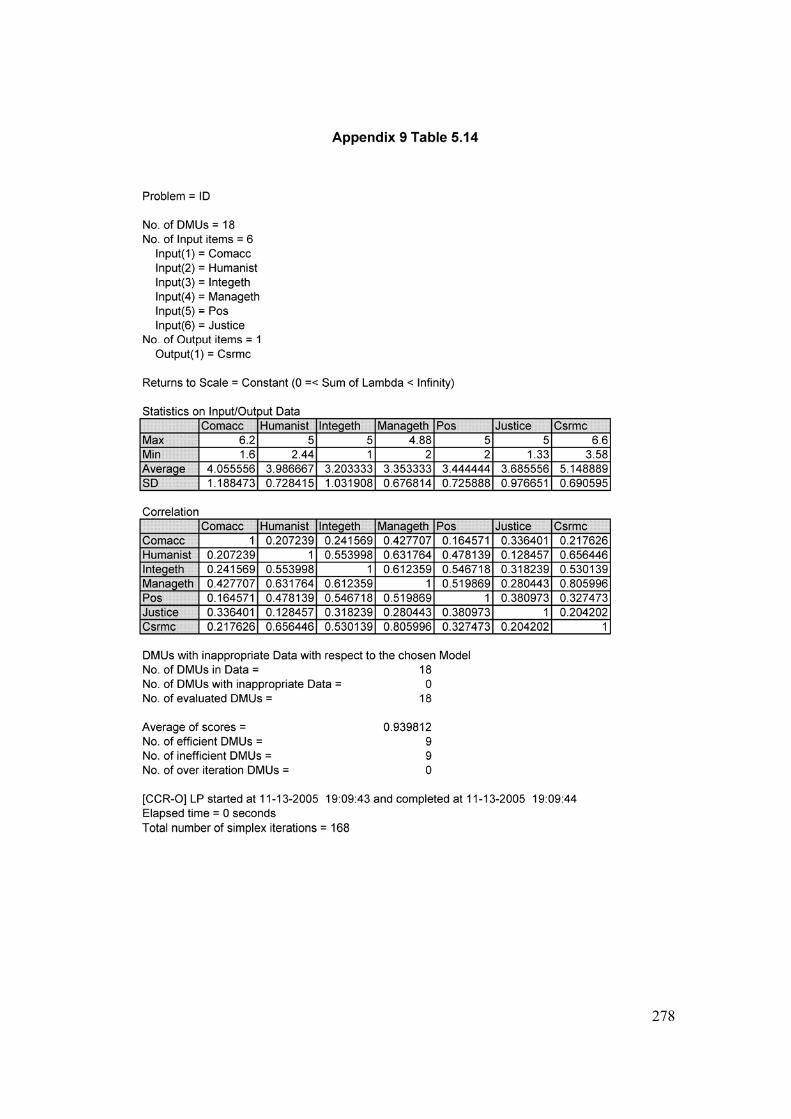
278
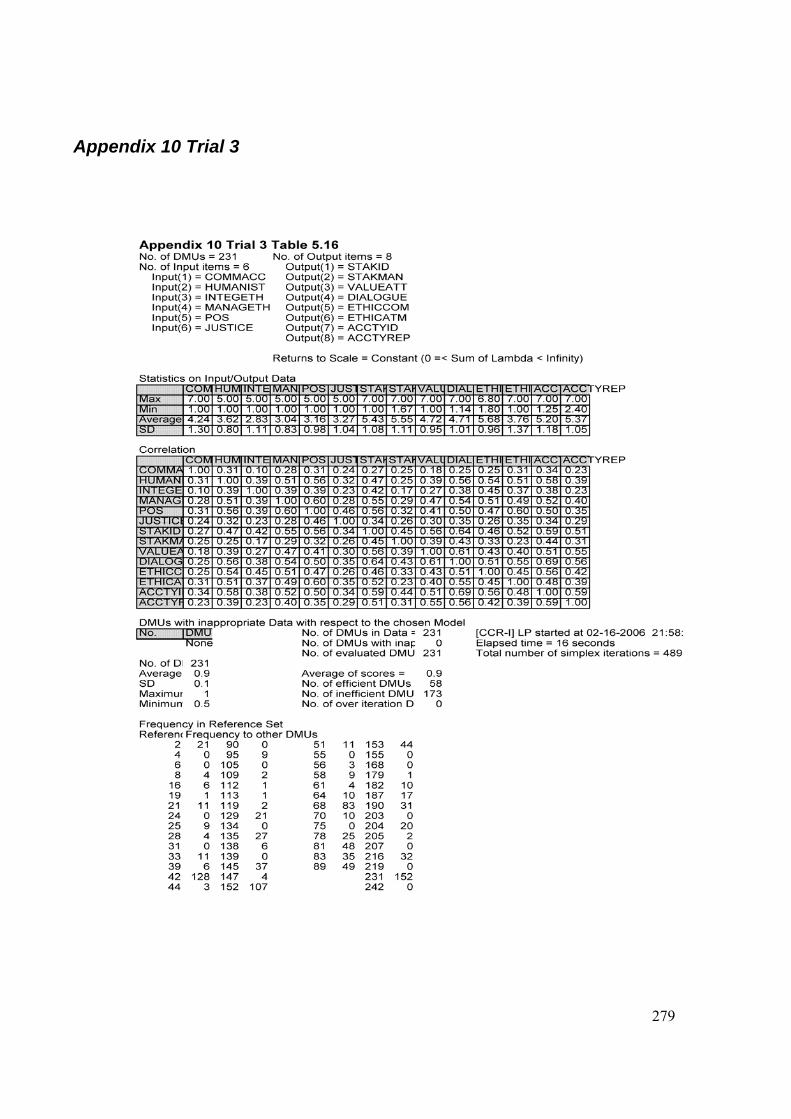
279
Appendix 10 Trial 3
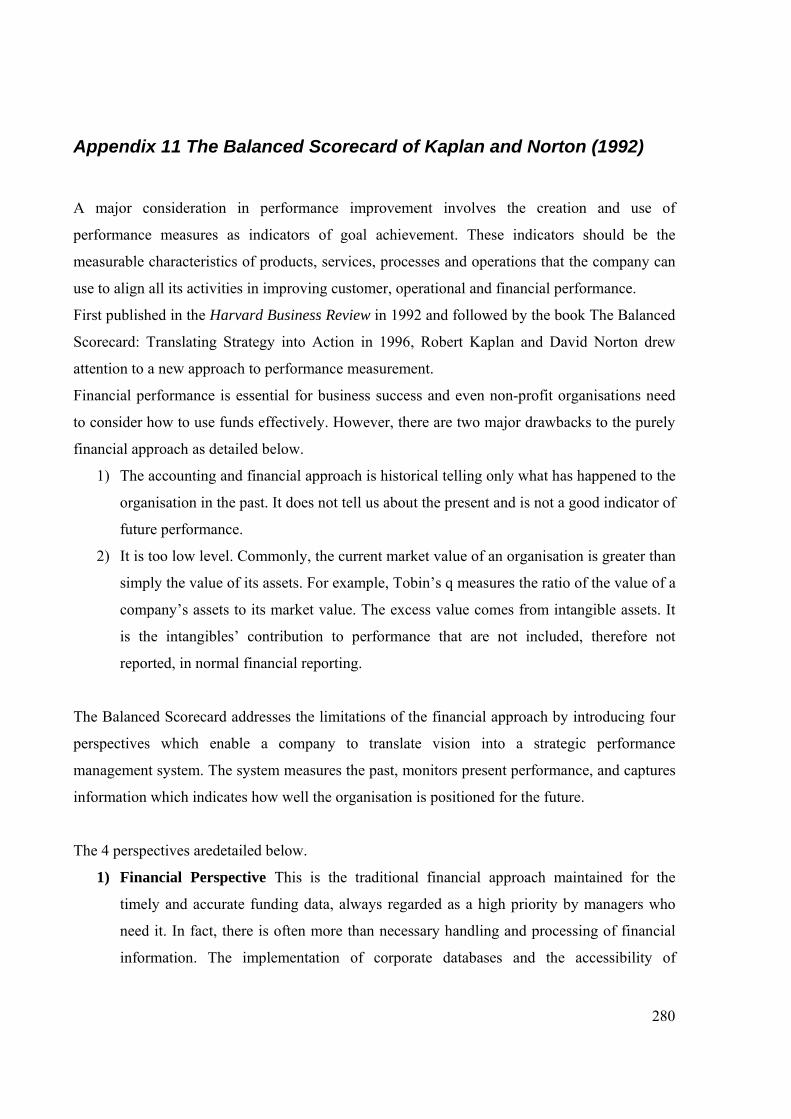
280
Appendix 11 The Balanced Scorecard of Kaplan and Norton (1992)
A major consideration in performance improvement involves the creation and use of
performance measures as indicators of goal achievement. These indicators should be the
measurable characteristics of products, services, processes and operations that the company can
use to align all its activities in improving customer, operational and financial performance.
First published in the Harvard Business Review in 1992 and followed by the book The Balanced
Scorecard: Translating Strategy into Action in 1996, Robert Kaplan and David Norton drew
attention to a new approach to performance measurement.
Financial performance is essential for business success and even non-profit organisations need
to consider how to use funds effectively. However, there are two major drawbacks to the purely
financial approach as detailed below.
1) The accounting and financial approach is historical telling only what has happened to the
organisation in the past. It does not tell us about the present and is not a good indicator of
future performance.
2) It is too low level. Commonly, the current market value of an organisation is greater than
simply the value of its assets. For example, Tobin’s q measures the ratio of the value of a
company’s assets to its market value. The excess value comes from intangible assets. It
is the intangibles’ contribution to performance that are not included, therefore not
reported, in normal financial reporting.
The Balanced Scorecard addresses the limitations of the financial approach by introducing four
perspectives which enable a company to translate vision into a strategic performance
management system. The system measures the past, monitors present performance, and captures
information which indicates how well the organisation is positioned for the future.
The 4 perspectives aredetailed below.
1) Financial Perspective This is the traditional financial approach maintained for the
timely and accurate funding data, always regarded as a high priority by managers who
need it. In fact, there is often more than necessary handling and processing of financial
information. The implementation of corporate databases and the accessibility of
281
centralised automated data would suggest that financial issues may lead to an emphasis
on financial performance at the expense of the other perspectives.
2) Customer Perspective Recent management thinking has shown an increasing realisation
of the importance of customer focus and customer satisfaction in any company. As
leading indicators, if customers are not satisfied they will find other suppliers that meet
their needs and furthermore let others know of their dissatisfaction. Poor performance
from this perspective is therefore a good indicator of future decline, even though the
current financial picture may still seem good. In developing metrics for satisfaction,
customers should be analysed in terms of their demographics, the products and services
they require, and what gives our company the advantage.
3) Business Process Perspective This refers to the internal operational processes and the
measures related to these. It shows managers how well their business is doing and
whether the products and services conform to customer requirements. Performance is
dissected into two business processes; mission oriented processes, and support processes.
Support processes are those that being repetitive in nature, are easier to measure and
benchmark using generic techniques. The other reflects the problems unique in achieving
company mission.
4) Learning and Growth Perspective This perspective includes employee training and
corporate culture, those attitudes that relate to individual and corporate self improvement.
In knowledge based companies, people are the main resource. In a time of rapid
technological change people are required to learn quickly and continuously. Kaplan and
Norton caution that learning is more than training and should include coaching and
mentoring, and should include communication among workers with facilities such as the
Internet.
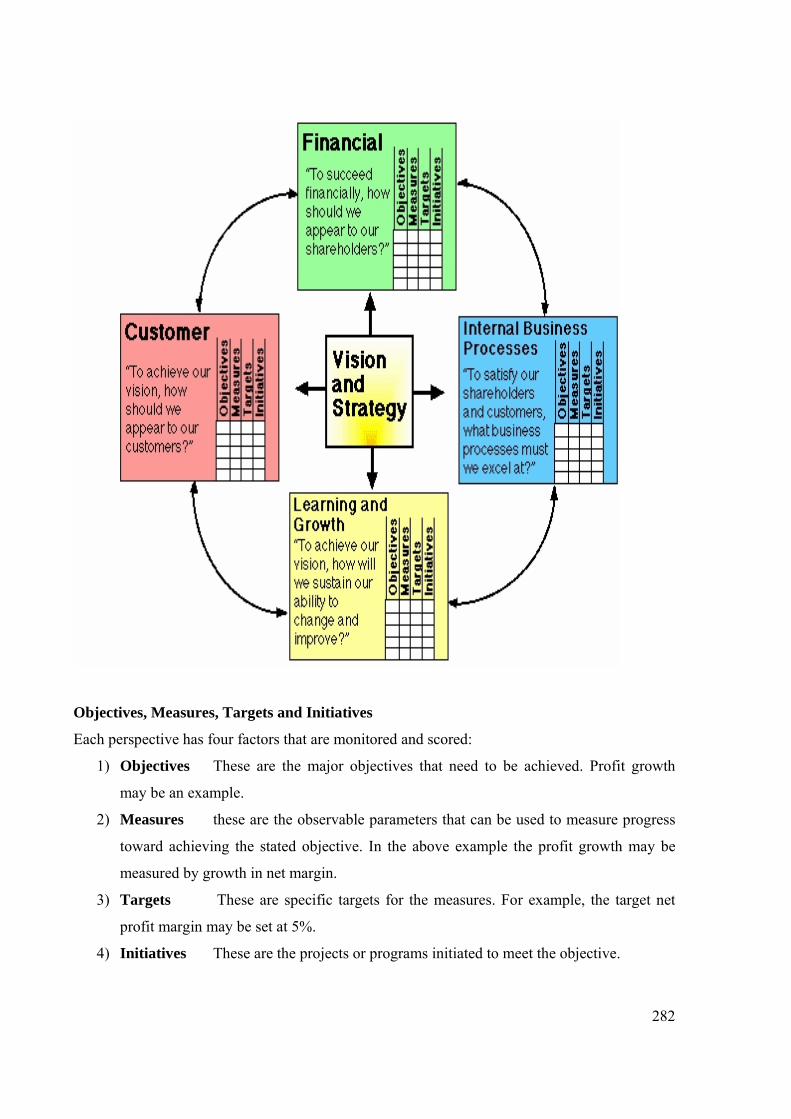
282
Objectives, Measures, Targets and Initiatives
Each perspective has four factors that are monitored and scored:
1) Objectives These are the major objectives that need to be achieved. Profit growth
may be an example.
2) Measures these are the observable parameters that can be used to measure progress
toward achieving the stated objective. In the above example the profit growth may be
measured by growth in net margin.
3) Targets These are specific targets for the measures. For example, the target net
profit margin may be set at 5%.
4) Initiatives These are the projects or programs initiated to meet the objective.
283
Benefits of the Balanced Scorecard
Kaplan and Norton cite the following benefits of a balanced scorecard methodology for
performance improvement.
1) Focusing the whole organisation on only a few key issues will create breakthrough
performance.
2) The BSC invigorates corporate programs such as six sigma, lean thinking, TQM and
BPR.
3) Breaking down strategic measures into lower order metrics allows managers and
employees understand what is required at their own levels to achieve superior
performance.
Value of Metrics
‘It cannot be improved if it cannot be measured’ is a performance idiom which many adhere to.
Metrics must be developed on the priorities of the strategic plan so that the key business drivers
can be monitored according to specified criteria. Processes are then designed to collect pertinent
information in numerical form for storage, display and analysis. The value of these metrics is in
their ability to provide feedback:
1) Strategic feedback. This shows the present status of the organisation from the various
perspectives.
2) Diagnostic feedback. This allows an analysis of process variation for continuous
improvement.
3) Trends. Movement over time.
4) Measurement feedback. This tracks the metrics themselves and may indicate which
should be changed, and how.
5) Quantitative inputs. Input for forecasting and decision support systems.
Limitations of the BSC
People tend to work to achieve specific targets as set. If such targets are not on the BSC or they
are disproportionably weighted, as in an over emphasis on financial performance, then actions
and thinking may be short term and the mechanisms developed could limit the attainment of
longer term strategy. The choice of measures is crucial (Meyer 2002). Criticism of the BSC has
284
also often revolved around the view that there is no specific mention of employees, suppliers,
alliance partners, intermediaries and regulators, nor the community or pressure groups (Neely,
Adams and Crowe, 2001).
Conclusion
The BSC has been so influential that it has been the most cited measurement system over a
number of years (deWaal 2003). Such pervasiveness naturally brings profilicacy. Cobbold and
Lawrie (2004) trace its development and classify its design by the intended method of use by the
organisation. They note that it has now evolved into a third generation performance
measurement system.
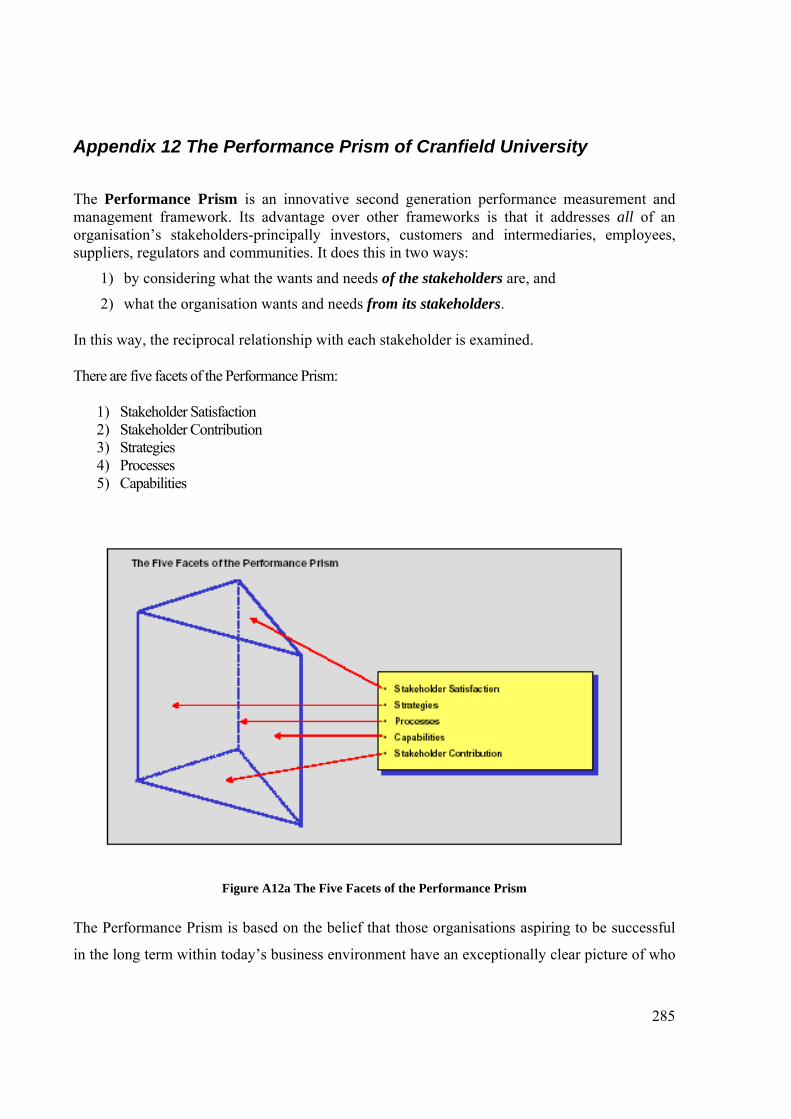
285
Appendix 12 The Performance Prism of Cranfield University
The Performance Prism is an innovative second generation performance measurement and management framework. Its advantage over other frameworks is that it addresses all of an organisation’s stakeholders-principally investors, customers and intermediaries, employees, suppliers, regulators and communities. It does this in two ways:
1) by considering what the wants and needs of the stakeholders are, and
2) what the organisation wants and needs from its stakeholders.
In this way, the reciprocal relationship with each stakeholder is examined.
There are five facets of the Performance Prism:
1) Stakeholder Satisfaction 2) Stakeholder Contribution 3) Strategies 4) Processes 5) Capabilities
Figure A12a The Five Facets of the Performance Prism
The Performance Prism is based on the belief that those organisations aspiring to be successful
in the long term within today’s business environment have an exceptionally clear picture of who
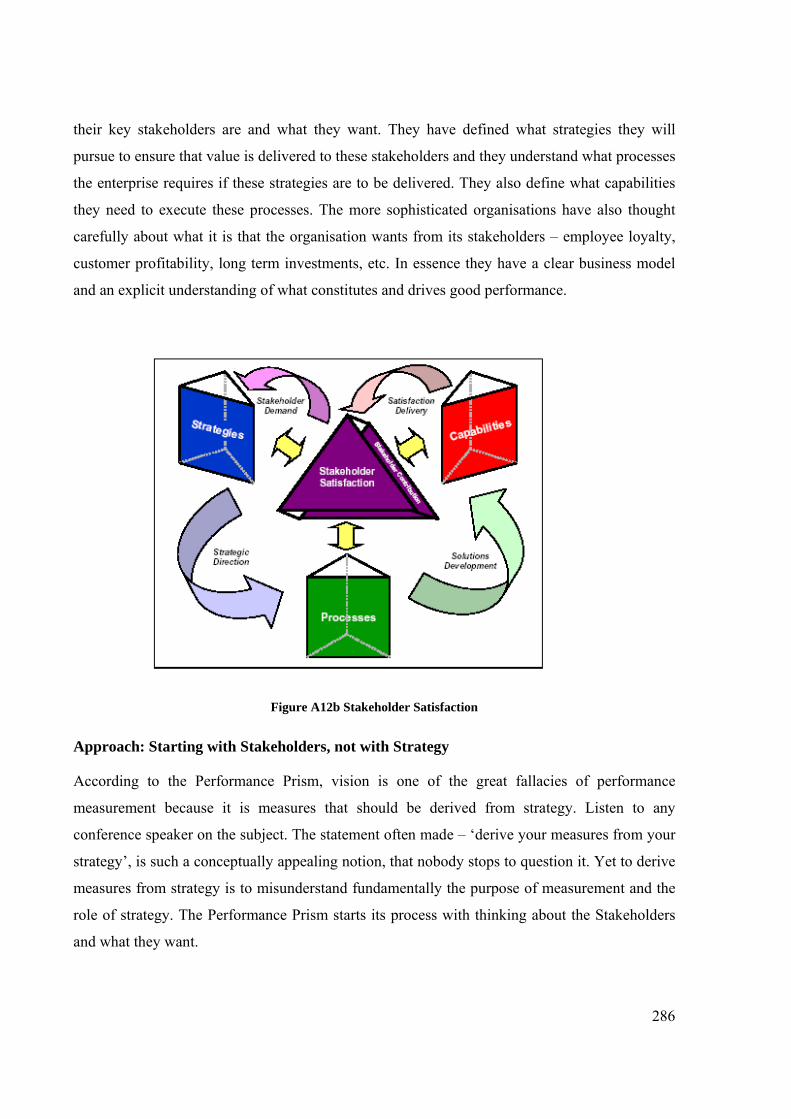
286
their key stakeholders are and what they want. They have defined what strategies they will
pursue to ensure that value is delivered to these stakeholders and they understand what processes
the enterprise requires if these strategies are to be delivered. They also define what capabilities
they need to execute these processes. The more sophisticated organisations have also thought
carefully about what it is that the organisation wants from its stakeholders – employee loyalty,
customer profitability, long term investments, etc. In essence they have a clear business model
and an explicit understanding of what constitutes and drives good performance.
Figure A12b Stakeholder Satisfaction
Approach: Starting with Stakeholders, not with Strategy
According to the Performance Prism, vision is one of the great fallacies of performance
measurement because it is measures that should be derived from strategy. Listen to any
conference speaker on the subject. The statement often made – ‘derive your measures from your
strategy’, is such a conceptually appealing notion, that nobody stops to question it. Yet to derive
measures from strategy is to misunderstand fundamentally the purpose of measurement and the
role of strategy. The Performance Prism starts its process with thinking about the Stakeholders
and what they want.
287
Five key questions for measurement design are listed below.
1) Stakeholder Satisfaction – who are the key stakeholders and what do they want and need?
2) Strategies – what strategies do we have to put in place to satisfy the wants and Aneeds of
these key stakeholders?
3) Processes – what critical processes do we require if we are to execute these strategies?
4) Capabilities – what capabilities do we need to operate and enhance these processes, and
5) Stakeholder Contribution – what contributions do we require from our Astakeholders if
we are to maintain and develop these capabilities?
The Performance Prism is designed to illustrate the hidden complexity of the corporate world. Single
dimensional, traditional frameworks pick up only elements of this complexity, and while each of them
offers a unique perspective on performance. It is essential to recognise that this is all they offer – a myopic
view. Performance, however, is not uni-dimensional, so to understand it in its entirety, it is essential to view
performance from the multiple and interlinked perspectives offered by the Performance Prism (Neely et al.
2001).
288
Appendix 13 The Construct of CSR Management Capacity
Black (2004) hypothesised that there are antecedent variables which are predictive of an
organisation’s capability to be socially responsive and to behave in a manner which displays
corporate citizenship. She found that a firm’s cultural context can influence managerial
initiatives which explain how organisations choose to become socially responsive. The culture
which is based on shared values and assumptions underpins organisational structure, behaviour
and thinking, and is reflective of a humanistic culture where the organisation is managed in a
participative fashion such that people support each other in an environment which promotes
ethical business behaviour. She labelled this as the ‘corporate social responsiveness management
capacity’ construct (CSRMC).
She tested the existence of such a construct with traditional hypothesis testing. The fourteen
hypotheses are summarised below.
The antecedents to CSRMC:
1. A humanistic culture will be positively related to CSRMC.
a. The humanistic culture will be more strongly related to dialogue, ethical business
behaviour and accountability than to the other dimensions of CSRMC.
2. Management commitment to ethics will be positively related to CSRMC.
3. Integrated ethics practice will be positively related to CSRMC.
4. Perceived distributive justice be positively related to CSRMC.
5. Perceived organisational support be positively related to CSRMC.
6. Communication accuracy be positively related to CSRMC.
The consequences of CSRMC:
7. CSRMC is positively related to human resources and communication outcomes.
8. CSRMC will be related positively to organisational identification
9. CSRMC will be related positively to organisational commitment.
10. CSRMC will be related negatively to turnover intention.
11. CSRMC will be related positively to trust
12. CSRMC will be related positively to organisational image.
13. CSRMC will be related positively to employer investment in employees.
289
14. CSRMC will be related positively to communication openness.
All hypotheses, except for 3 and 6, were supported with humanistic culture and a management
commitment to ethics, strongly and significantly, contributing to an organisational environment
supporting the development of corporate social responsiveness.
The results of her tests revealed five dimensions of the CSRMC construct, with significant
positive correlations for most of the eight factors that comprise it. These factors are: stakeholder
identity, stakeholder management, value attuned public relations, dialogue, ethics (compliance),
ethics (caring atmosphere), accountability (reporting) and accountability (sense of). She
concluded that there exists an eight factor structure within a five dimensional framework that
adequately reflects her claim to the CSMRC construct. However, at no stage was her intent or
her finding a comparison on which of the business entities were most efficient on the
dimensions she espoused.