Embed Size (px)
Citation preview
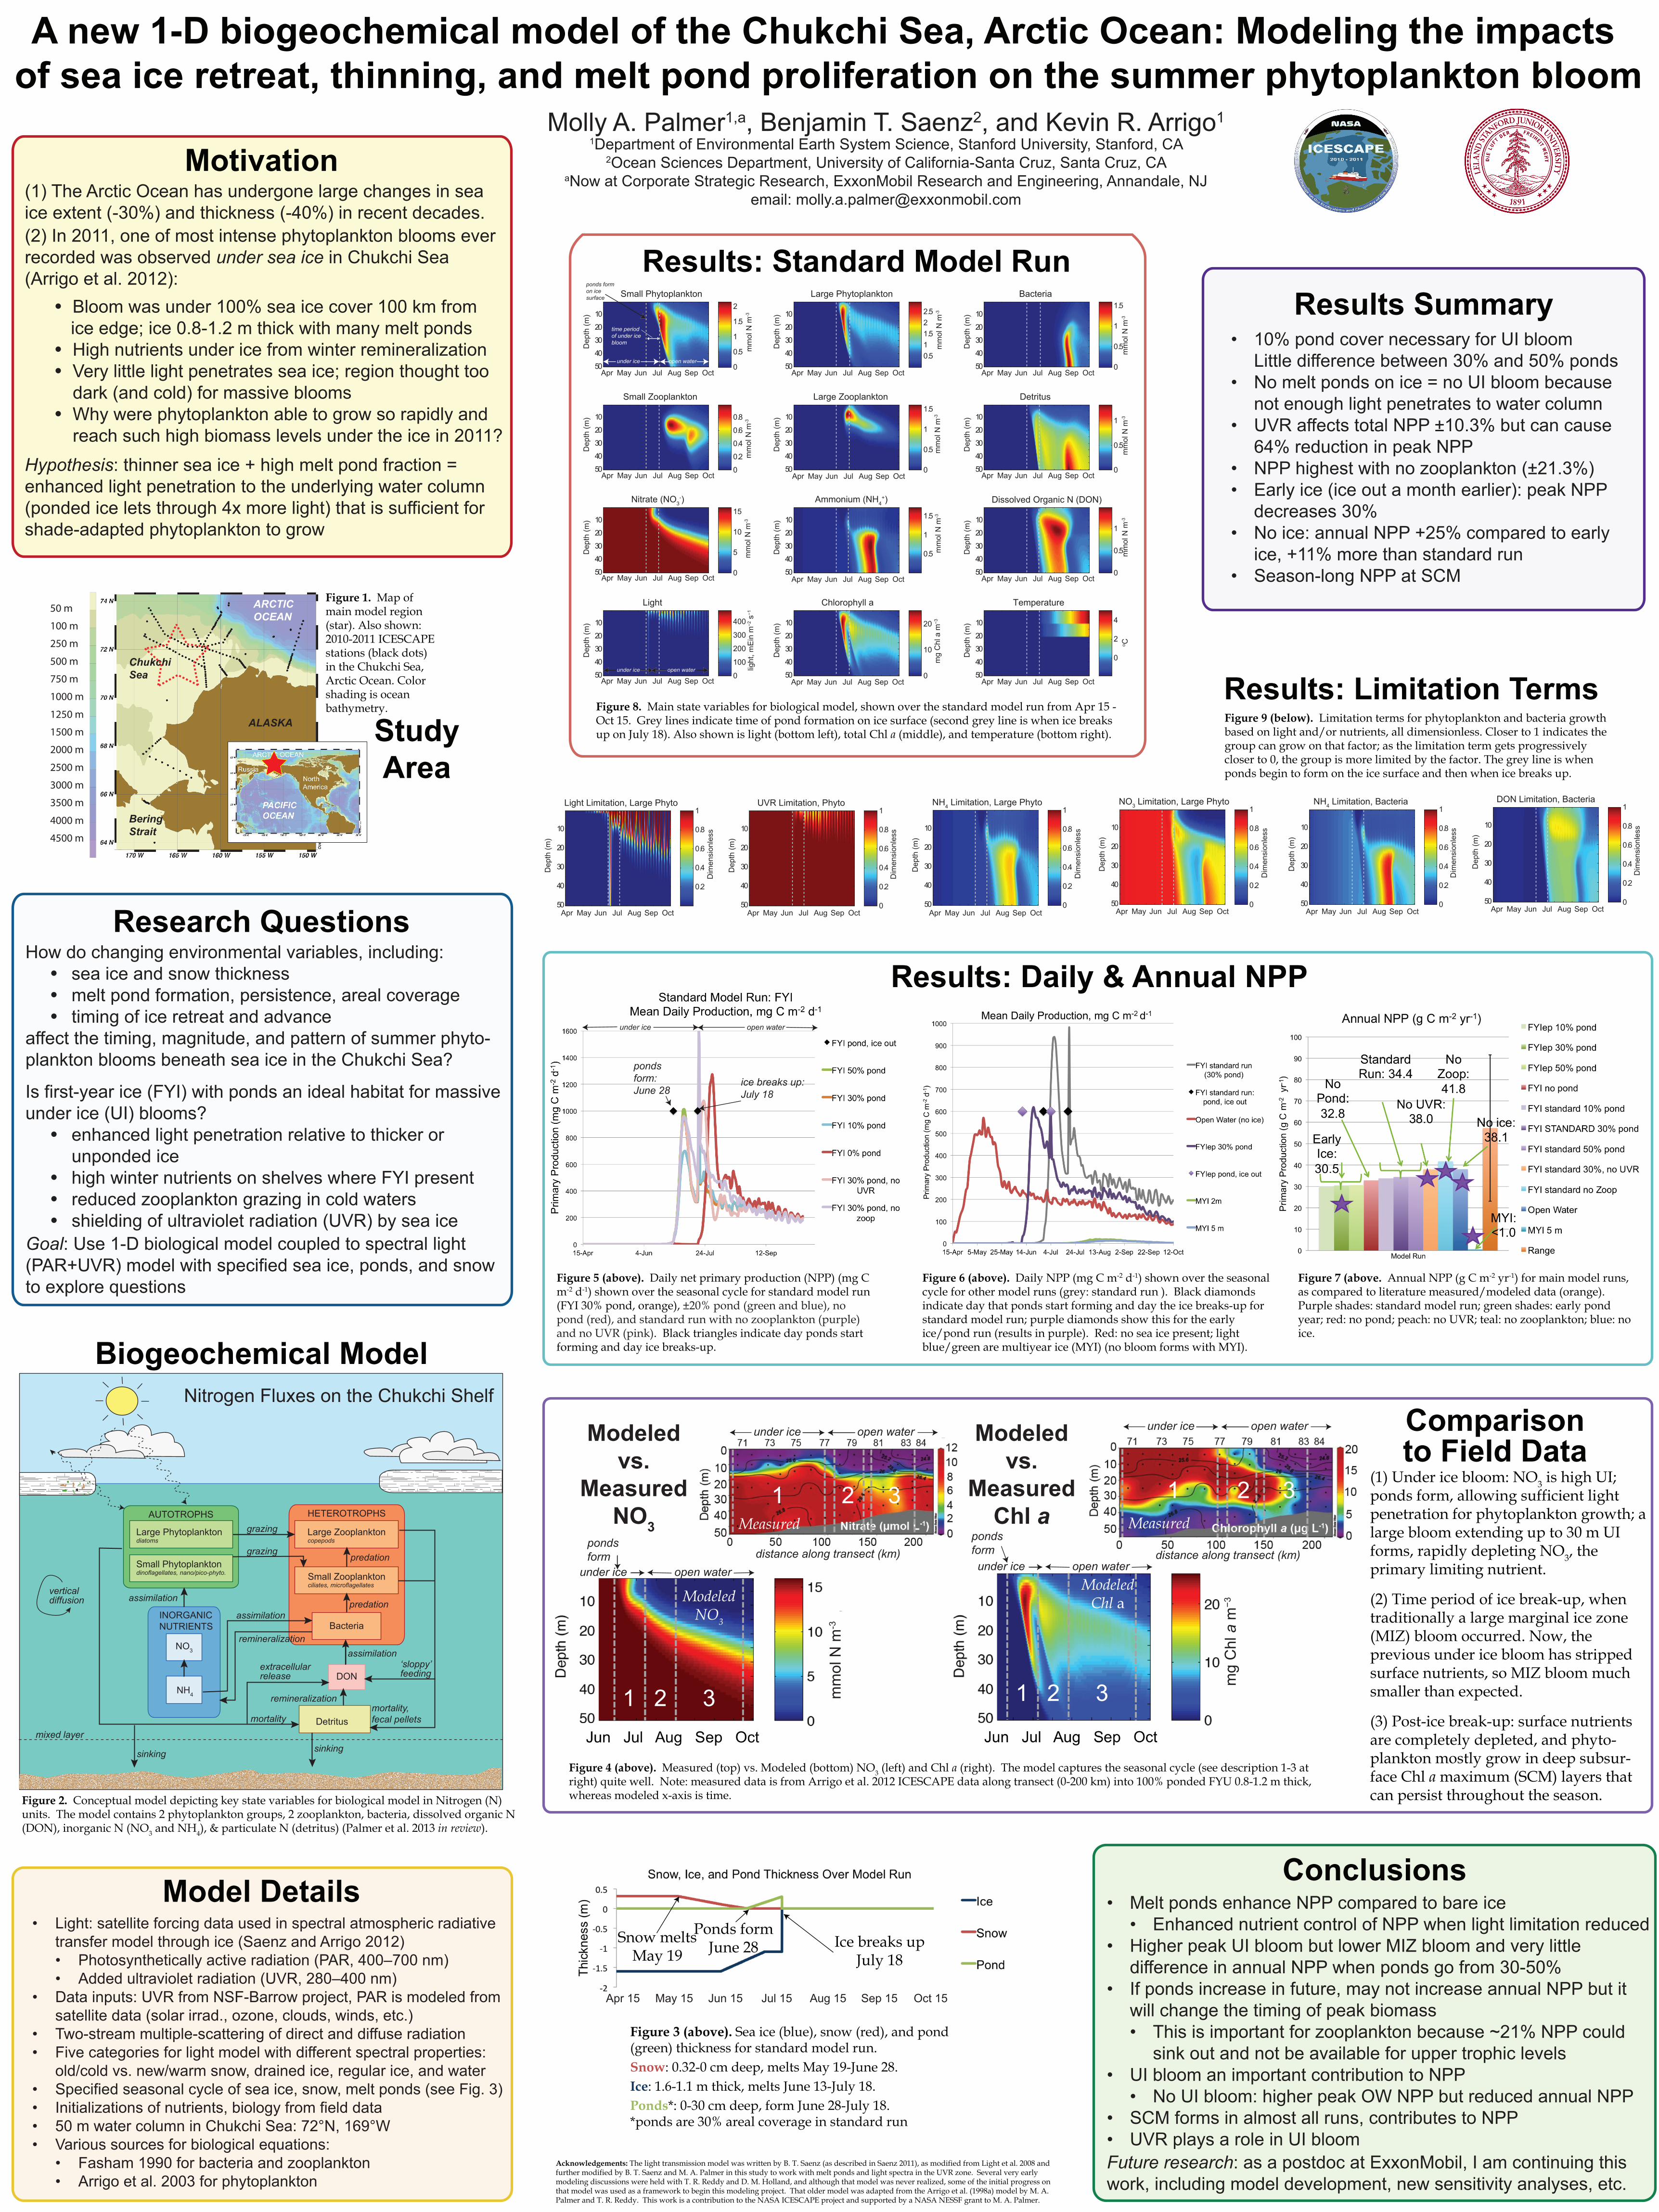
Apr 15 May 15 Jun 15 Jul 15 Aug 15 Sep 15 Oct 15
Ice breaks upJuly 18
Ponds formJune 28Snow melts
May 19
Conclusions
A new 1-D biogeochemical model of the Chukchi Sea, Arctic Ocean: Modeling the impacts of sea ice retreat, thinning, and melt pond proliferation on the summer phytoplankton bloom
Molly A. Palmer1,a, Benjamin T. Saenz2, and Kevin R. Arrigo11Department of Environmental Earth System Science, Stanford University, Stanford, CA
2Ocean Sciences Department, University of California-Santa Cruz, Santa Cruz, CAaNow at Corporate Strategic Research, ExxonMobil Research and Engineering, Annandale, NJ
email: [email protected]
Research QuestionsHow do changing environmental variables, including: • sea ice and snow thickness • melt pond formation, persistence, areal coverage • timing of ice retreat and advanceaffect the timing, magnitude, and pattern of summer phyto-plankton blooms beneath sea ice in the Chukchi Sea? Is first-year ice (FYI) with ponds an ideal habitat for massive under ice (UI) blooms? • enhanced light penetration relative to thicker or unponded ice • high winter nutrients on shelves where FYI present • reduced zooplankton grazing in cold waters • shielding of ultraviolet radiation (UVR) by sea iceGoal: Use 1-D biological model coupled to spectral light (PAR+UVR) model with specified sea ice, ponds, and snow to explore questions
(1) The Arctic Ocean has undergone large changes in sea ice extent (-30%) and thickness (-40%) in recent decades. (2) In 2011, one of most intense phytoplankton blooms ever recorded was observed under sea ice in Chukchi Sea (Arrigo et al. 2012): • Bloom was under 100% sea ice cover 100 km from ice edge; ice 0.8-1.2 m thick with many melt ponds • High nutrients under ice from winter remineralization • Very little light penetrates sea ice; region thought too dark (and cold) for massive blooms • Why were phytoplankton able to grow so rapidly and reach such high biomass levels under the ice in 2011? Hypothesis: thinner sea ice + high melt pond fraction = enhanced light penetration to the underlying water column (ponded ice lets through 4x more light) that is sufficient for shade-adapted phytoplankton to grow
Motivation
Large Phytoplanktondiatoms
AUTOTROPHS
Large Zooplanktoncopepods
HETEROTROPHS
Small Phytoplanktondinoflagellates, nano/pico-phyto. Small Zooplankton
ciliates, microflagellates
Bacteria
predation
predation
grazing
Detritus
NH4
NO3
assimilation
INORGANICNUTRIENTS
DON
grazing
assimilation
assimilation
remineralization
extracellularrelease
mortalitymortality,fecal pellets
‘sloppy’ feeding
sinking sinkingmixed layer
verticaldiffusion
remineralization
Nitrogen Fluxes on the Chukchi Shelf
StudyArea
Figure 1. Map of main model region (star). Also shown: 2010-2011 ICESCAPE stations (black dots) in the Chukchi Sea, Arctic Ocean. Color shading is ocean bathymetry.
ALASKA
BeringStrait
ChukchiSea
ARCTICOCEAN
4500 m
4000 m
3500 m
3000 m
2500 m
2000 m
1500 m
1250 m
1000 m
750 m
500 m
250 m
100 m
50 m
Biogeochemical Model
Figure 2. Conceptual model depicting key state variables for biological model in Nitrogen (N) units. The model contains 2 phytoplankton groups, 2 zooplankton, bacteria, dissolved organic N (DON), inorganic N (NO3 and NH4), & particulate N (detritus) (Palmer et al. 2013 in review).
Comparisonto Field Data
Figure 3 (above). Sea ice (blue), snow (red), and pond (green) thickness for standard model run. Snow: 0.32-0 cm deep, melts May 19-June 28. Ice: 1.6-1.1 m thick, melts June 13-July 18. Ponds*: 0-30 cm deep, form June 28-July 18.*ponds are 30% areal coverage in standard run
Dep
th (m
)
NH4 Limitation, Bacteria
10
20
30
40
50
Dim
ensi
onle
ss
0
0.2
0.4
0.6
0.8
1
Dep
th (m
)
DON Limitation, Bacteria
10
20
30
40
50
Dim
ensi
onle
ss
0
0.2
0.4
0.6
0.8
1
Apr May Jun Jul Aug Sep OctApr May Jun Jul Aug Sep Oct
Dep
th (m
)
Light Limitation, Large Phyto
10
20
30
40
50
Dim
ensi
onle
ss
0.2
0.4
0.6
0.8
1
Dep
th (m
)
UVR Limitation, Phyto
10
20
30
40
50D
imen
sion
less
0
0.2
0.4
0.6
0.8
1
Apr May Jun Jul Aug Sep OctApr May Jun Jul Aug Sep OctD
epth
(m)
NH4 Limitation, Large Phyto
10
20
30
40
50
Dim
ensi
onle
ss
0
0.2
0.4
0.6
0.8
1
Dep
th (m
)
NO3 Limitation, Large Phyto
10
20
30
40
50
Dim
ensi
onle
ss
0
0.2
0.4
0.6
0.8
1
Apr May Jun Jul Aug Sep OctApr May Jun Jul Aug Sep Oct
Results: Limitation Terms
• Melt ponds enhance NPP compared to bare ice • Enhanced nutrient control of NPP when light limitation reduced• Higher peak UI bloom but lower MIZ bloom and very little difference in annual NPP when ponds go from 30-50%• If ponds increase in future, may not increase annual NPP but it will change the timing of peak biomass • This is important for zooplankton because ~21% NPP could sink out and not be available for upper trophic levels• UI bloom an important contribution to NPP • No UI bloom: higher peak OW NPP but reduced annual NPP• SCM forms in almost all runs, contributes to NPP• UVR plays a role in UI bloomFuture research: as a postdoc at ExxonMobil, I am continuing this work, including model development, new sensitivity analyses, etc.
Figure 6 (above). Daily NPP (mg C m-2 d-1) shown over the seasonal cycle for other model runs (grey: standard run ). Black diamonds indicate day that ponds start forming and day the ice breaks-up for standard model run; purple diamonds show this for the early ice/pond run (results in purple). Red: no sea ice present; light blue/green are multiyear ice (MYI) (no bloom forms with MYI).
Figure 5 (above). Daily net primary production (NPP) (mg C m-2 d-1) shown over the seasonal cycle for standard model run (FYI 30% pond, orange), ±20% pond (green and blue), no pond (red), and standard run with no zooplankton (purple) and no UVR (pink). Black triangles indicate day ponds start forming and day ice breaks-up.
Figure 7 (above. Annual NPP (g C m-2 yr-1) for main model runs, as compared to literature measured/modeled data (orange). Purple shades: standard model run; green shades: early pond year; red: no pond; peach: no UVR; teal: no zooplankton; blue: no ice.
• 10% pond cover necessary for UI bloom Little difference between 30% and 50% ponds• No melt ponds on ice = no UI bloom because not enough light penetrates to water column• UVR affects total NPP ±10.3% but can cause 64% reduction in peak NPP• NPP highest with no zooplankton (±21.3%)• Early ice (ice out a month earlier): peak NPP decreases 30%• No ice: annual NPP +25% compared to early ice, +11% more than standard run• Season-long NPP at SCM
Results Summary
Acknowledgements: The light transmission model was written by B. T. Saenz (as described in Saenz 2011), as modified from Light et al. 2008 and further modified by B. T. Saenz and M. A. Palmer in this study to work with melt ponds and light spectra in the UVR zone. Several very early modeling discussions were held with T. R. Reddy and D. M. Holland, and although that model was never realized, some of the initial progress on that model was used as a framework to begin this modeling project. That older model was adapted from the Arrigo et al. (1998a) model by M. A. Palmer and T. R. Reddy. This work is a contribution to the NASA ICESCAPE project and supported by a NASA NESSF grant to M. A. Palmer.
1 2 31 2 3
1 2 3 1 2 3
ModeledNO3
ModeledChl a
Measured Measured
mm
ol N
m-3
mg
Chl
a m
−3
under ice open water under ice open waterModeled vs.
Measured NO3
Modeled vs.
Measured Chl a
under ice open water
pondsform
under ice open water
pondsform
pondsform:June 28
ice breaks up:July 18
under ice open water
Dep
th (m
)
Small Phytoplankton
10
20
30
40
50 0
0.5
1
1.5
2
Dep
th (m
)
Large Phytoplankton
10
20
30
40
500.511.522.5
Dep
th (m
)
Bacteria
10
20
30
40
50 0
0.5
1
1.5
Dep
th (m
)
Small Zooplankton
10
20
30
40
50 0
0.2
0.4
0.6
0.8
Dep
th (m
)
Large Zooplankton
10
20
30
40
50 0
0.5
1
1.5
Dep
th (m
)
Detritus
10
20
30
40
50 0
0.5
1
Dep
th (m
)
Nitrate (NO3-)
10
20
30
40
50
mm
ol N
m-3
0
5
10
15
Dep
th (m
)
Ammonium (NH4+)
10
20
30
40
50
0.5
1
1.5
Dep
th (m
)
Dissolved Organic N (DON)
10
20
30
40
50 0
0.5
1
Dep
th (m
)
Light
Apr May Jun Jul Aug Sep
10
20
30
40
50
light
, mE
in m
−2 s
−1
0
100
200
300
400
Dep
th (m
)
Chlorophyll a
10
20
30
40
50
mg
Chl
a m
−3
0
10
20
Dep
th (m
)
Temperature
10
20
30
40
50
o C
0
2
4
mm
ol N
m-3
mm
ol N
m-3
mm
ol N
m-3
mm
ol N
m-3
mm
ol N
m-3
mm
ol N
m-3
mm
ol N
m-3
Oct
Apr May Jun Jul Aug Sep Oct
Apr May Jun Jul Aug Sep Oct
Apr May Jun Jul Aug Sep Oct Apr May Jun Jul Aug Sep Oct
Apr May Jun Jul Aug Sep Oct
Apr May Jun Jul Aug Sep Oct
Apr May Jun Jul Aug Sep Oct Apr May Jun Jul Aug Sep Oct
Apr May Jun Jul Aug Sep Oct
Apr May Jun Jul Aug Sep Oct
Apr May Jun Jul Aug Sep Oct
mm
ol N
m-3
Results: Standard Model Run
Figure 8. Main state variables for biological model, shown over the standard model run from Apr 15 - Oct 15. Grey lines indicate time of pond formation on ice surface (second grey line is when ice breaks up on July 18). Also shown is light (bottom left), total Chl a (middle), and temperature (bottom right).
under ice open water
• Light: satellite forcing data used in spectral atmospheric radiative transfer model through ice (Saenz and Arrigo 2012) • Photosynthetically active radiation (PAR, 400–700 nm) • Added ultraviolet radiation (UVR, 280–400 nm)• Data inputs: UVR from NSF-Barrow project, PAR is modeled from satellite data (solar irrad., ozone, clouds, winds, etc.)• Two-stream multiple-scattering of direct and diffuse radiation• Five categories for light model with different spectral properties: old/cold vs. new/warm snow, drained ice, regular ice, and water• Specified seasonal cycle of sea ice, snow, melt ponds (see Fig. 3)• Initializations of nutrients, biology from field data• 50 m water column in Chukchi Sea: 72°N, 169°W• Various sources for biological equations: • Fasham 1990 for bacteria and zooplankton • Arrigo et al. 2003 for phytoplankton
Model Details
Figure 9 (below). Limitation terms for phytoplankton and bacteria growth based on light and/or nutrients, all dimensionless. Closer to 1 indicates the group can grow on that factor; as the limitation term gets progressively closer to 0, the group is more limited by the factor. The grey line is when ponds begin to form on the ice surface and then when ice breaks up.
(1) Under ice bloom: NO3 is high UI; ponds form, allowing sufficient light penetration for phytoplankton growth; a large bloom extending up to 30 m UI forms, rapidly depleting NO3, the primary limiting nutrient. (2) Time period of ice break-up, when traditionally a large marginal ice zone (MIZ) bloom occurred. Now, the previous under ice bloom has stripped surface nutrients, so MIZ bloom much smaller than expected. (3) Post-ice break-up: surface nutrients are completely depleted, and phyto-plankton mostly grow in deep subsur-face Chl a maximum (SCM) layers that can persist throughout the season.
Figure 4 (above). Measured (top) vs. Modeled (bottom) NO3 (left) and Chl a (right). The model captures the seasonal cycle (see description 1-3 at right) quite well. Note: measured data is from Arrigo et al. 2012 ICESCAPE data along transect (0-200 km) into 100% ponded FYU 0.8-1.2 m thick, whereas modeled x-axis is time.
Results: Daily & Annual NPP
distance along transect (km) distance along transect (km)
under ice open water
ponds formon icesurface
time periodof under icebloom