Embed Size (px)
Citation preview
Open AccessResearch Article
Pathak et al., J Cancer Sci Ther 2014, 6:10 DOI: 10.4172/1948-5956.1000298
Volume 6(10) 394-400 (2014) - 394 J Cancer Sci Ther ISSN:1948-5956 JCST, an open access journal
Keywords: Dose grid; 2D Array; Organs at risk; Intensity-modulated radiotherapy; Dose-volume changes; Head-and-neck cancers
IntroductionThe benefit of intensity-modulated radiation therapy (IMRT) in
the treatment of head-and-neck cancer (HNC) has been demonstrated in numerous studies [1-3]. Highly conformal radiation allows for a high dose to high-risk areas, whilst sparing adjacent organs at risk (OAR) such as the parotid glands. Clinical studies have shown that IMRT reduces grade-3 xerostomia comparison to three-dimensional conformal radiotherapy (3D CRT) [4,5], for that reason IMRT has become the standard treatment in many centers. IMRT dose distributions, with steep dose gradients, are very sensitive to geometrical uncertainties, and hence, deviations between planned and delivered dose distributions have to be minimized. One way of improving the treatment accuracy is to reduce geometrical errors. Rigid errors, such as setup, have been extensively studied. Mechalakos et al. [6]. for instance evaluated the interfraction and interfraction errors in treatments of HNC and compared their results with previous studies from others authors. Margins are added to clinical volumes in order to take into account geometrical uncertainties. These planning margins are commonly calculated from measured systematic and random geometrical errors [7].
However, it is well known that many HNC patients treated with radiotherapy (RT) suffer significant anatomical changes due to tumor
shrinkage or weight loss. Several scheduled rescanning studies have evaluated these volumetric changes in both target volumes and normal tissues [8-11], mostly on the parotid glands and their consequent effects on dose distribution [12-15].
The purpose of the present study was to analyze the variation on the dose distribution in Planning target volumes (PTVs) and organs at risk (OAR). The use of IMRT implies the irradiation of more OARs than conventional 3D CRT. Therefore, beside typical susceptible organs such as the eyes, optic nerves, optic chiasm, spinal cord, parotid glands, bladder, rectum and bowel we have also included additional OARs such as the brainstem, and femur head.
The IMRT technique has the potential benefit over conventional
*Corresponding author: Pathak P, Chief medical Physicist, BIMR Hospitals,Radiation Oncology, Surya mandir road Gwalior, Madhya Pradesh 474004, India,Tel: 07512405715; E-mail: [email protected]
Received July 25, 2014; Accepted September 23, 2014; Published September 25, 2014
Citation: Pathak P, Guha S, Vidya V, Sourav M, Ashok S (2014) Comparative Analysis of Dose Variations in Tumor Volumes and Organs at Risk in IMRT Plans for Head-And–Neck, Pelvis and Brain Cancers with Varying Dose Calculation Grid Sizes. J Cancer Sci Ther 6: 394-400. doi:10.4172/1948-5956.1000298
Copyright: © 2014 Pathak P, et al. This is an open-access article distributed under the terms of the Creative Commons Attribution License, which permits unrestricted use, distribution, and reproduction in any medium, provided the original author and source are credited.
Comparative Analysis of Dose Variations in Tumor Volumes and Organs at Risk in IMRT Plans for Head-And–Neck, Pelvis and Brain Cancers with Varying Dose Calculation Grid SizesPathak P1*, Guha S2, Vitwekar Vidya3, Majumder Sourav4 and Soni Ashok5
1Chief medical Physicist, BIMR Hospitals, Gwalior, India2Radiation Oncologist, Tata Medical Center, Kolkata, India3Radiotherapy Technologist, Rajiv Gandhi University of Health Sciences, India4Diploma in Radiotherapy Technology, Radiotherapy Technologist, India5Service Engineer, BIMR Hospitals, Gwalior, India
AbstractPurpose: The aim of this study was to compare the plan results that were obtained by using different calculation
grid sizes ranging from 3 mm to 10 mm, and the same dose calculation algorithm Pencil Beam (PB), in Intensity Modulated Radiotherapy (IMRT) for different treatment sites Head-And –Neck, Pelvis (Carcinoma Cervix) And Brain Cancers.
Introduction: Ever since the advent and development of treatment planning systems, the uncertainty associated with calculation grid size has been an issue. Even to this day, with highly sophisticated 3D conformal and intensity-modulated radiation therapy (IMRT) treatment planning systems (TPS), dose uncertainty due to grid size is still a concern.
Materials and methods: Twelve patients in which four patients of Head-And –Neck, Pelvis And Brain tumors respectively were considered for the study. IMRT Plans were generated for a 6,600cGy, 5,000cGy & 5,400cGy prescribed doses for Head-And –Neck, Pelvis and Brain tumors respectively using Oncentra v 4.3 TPS. For each patient, dose calculation with Pencil Beam (PB) algorithms using dose grid sizes of 3.0 mm, 5.0 mm, and 10.0 mm were performed.
Results: The plans were evaluated as per the ICRU guidelines and dose constraints were maintained as per the Quantec guidelines. The dose differences for the varying grid sizes in Tumor Volumes and Organs at Risk were analyzed and tabulated.
Conclusion: Overall, the effect of varying grid size on dose variation appears to be insignificant. However, 3 mm is recommended to ensure acceptable dose calculations, especially in high gradient regions.
Journal ofCancer Science & TherapyJo
urna
l of C
ancer Science & Therapy
ISSN: 1948-5956
Journal ofCancer Science & TherapyJo
urna
l of C
ancer Science & Therapy
ISSN: 1948-5956
Citation: Pathak P, Guha S, Vidya V, Sourav M, Ashok S (2014) Comparative Analysis of Dose Variations in Tumor Volumes and Organs at Risk in IMRT Plans for Head-And–Neck, Pelvis and Brain Cancers with Varying Dose Calculation Grid Sizes. J Cancer Sci Ther 6: 394-400. doi:10.4172/1948-5956.1000298
Volume 6(10) 394-400 (2014) - 395 J Cancer Sci Ther ISSN:1948-5956 JCST, an open access journal
whole-pelvis irradiation of improving target dose coverage, reducing the volume of the organs at risk (OARs) that receive irradiation, and reducing the toxicity to normal tissue [16-19]. Despite the significant benefits of IMRT, there are some disadvantages. The technique usually requires multiple fixed-angle radiation beams, which can increase treatment delivery time. This has an impact on patient comfort, reproducibility of the treatment position, and intra-fraction motion. Moreover, IMRT uses a larger number of monitor units (MUs) compared with conventional conformal radiotherapy (CRT), leading to an increase in the amount of low-dose radiation received by the rest of the body. This raises the concern of secondary radiation-induced malignancy, which is of particular relevance to young patients or those with long future life expectancies [20-23].
In the past, whole-brain radiotherapy (WBRT) planning was simple. Today, new clinical and dosimetric considerations are taken into consideration when approaching such planning. It has been found that as many as 11% of patients who were treated by WBRT and survived more than 12 months developed dementia, especially with the use of a larger dose-per-fraction regimen [24]. However, regression of the lesions after WBRT was found to correlate with survival and improved neurocognitive function. Therefore, achievement of macroscopic lesion control is the mainstay of treatment. Thus, treatment-dose compromise is unjust for preserving these neurocognitive functions. Furthermore, memory functions were found to be most susceptible to early decline, even in patients with nonprogressing brain metastases [25]. These concerns became more significant as WBRT was instituted for prophylactic brain irradiation (PCI) for various neoplasms to decrease intracranial failure in patients with potential long-term survival [26].
In the case of IMRT, this is accomplished by using complex computer models to calculate the dose to a given volume. These volumes and their resolution of defined by the calculation grid, which defines the space where the dose calculation models are applied and the resolution of that space. However, the calculation grid has been generally left at a default value to minimize the amount of time that the treatment planning system needs to perform the dose calculations. The intent of the project is, therefore, to test the effect of very fine calculation grid resolutions on the accuracy of IMRT plans.
The intent of the study is, therefore, to test the effect of calculation grid sizes on the accuracy of IMRT plans.
Materials and MethodsC T acquisition and contouring
CT scans were acquired using a Somatom Power Spirit CT Simulator (Siemens) with 3–5 mm slice spacing. Patients were in the supine position and immobilized with a ther moplastic head–shoulder mask. A planning CT scan (CT) was acquired one week before RT treatment. The Oncentra version 4.3 (Nucletron) treatment planning system was used for delineation and dose distribution calculations. Target volumes and normal tissues were manually contoured by a physician on each axial slice of the CT using MRI or contrast-enhanced CT. The definition of volumes was in accordance with ICRU Reports 50-62, but dose-volume parameters were reported according to the new ICRU Report 83 IMRT recommendations. Gross tumor volume (GTV) included the primary tumor and affected lymph nodes. The GTV was expanded to include the high-risk regions (CTV).
To compensate for geometrical uncertainties such as setup and organ motion, a 5 mm margin was automatically added to CTVs to obtain the planning target volume (PTV). In order to avoid dose
compensation in the build-up region, in cases with no skin infiltration, the PTVs were manually modified excluding areas where the distance to the skin was less than 3 mm. Although these modified PTVs were used during optimization process, the absorbed dose was reported over the whole PTV. Prescribed doses were 6,600cGy, 5,000cGy & 5,400cGy for HEAD-AND –NECK, PELVIS (Carcinoma Cervix), & BRAIN respectively.
The critical structures contoured were: the parotid glands, spinal cord, mandible, eyes, oral cavity, brainstem, brain, optic nerves, optic chiasm, bladder, rectum, bowel & femur heads.
Treatment planning
IMRT treatment plans were generated on the CT with nine 6 MV
(a)
(b)
(c)
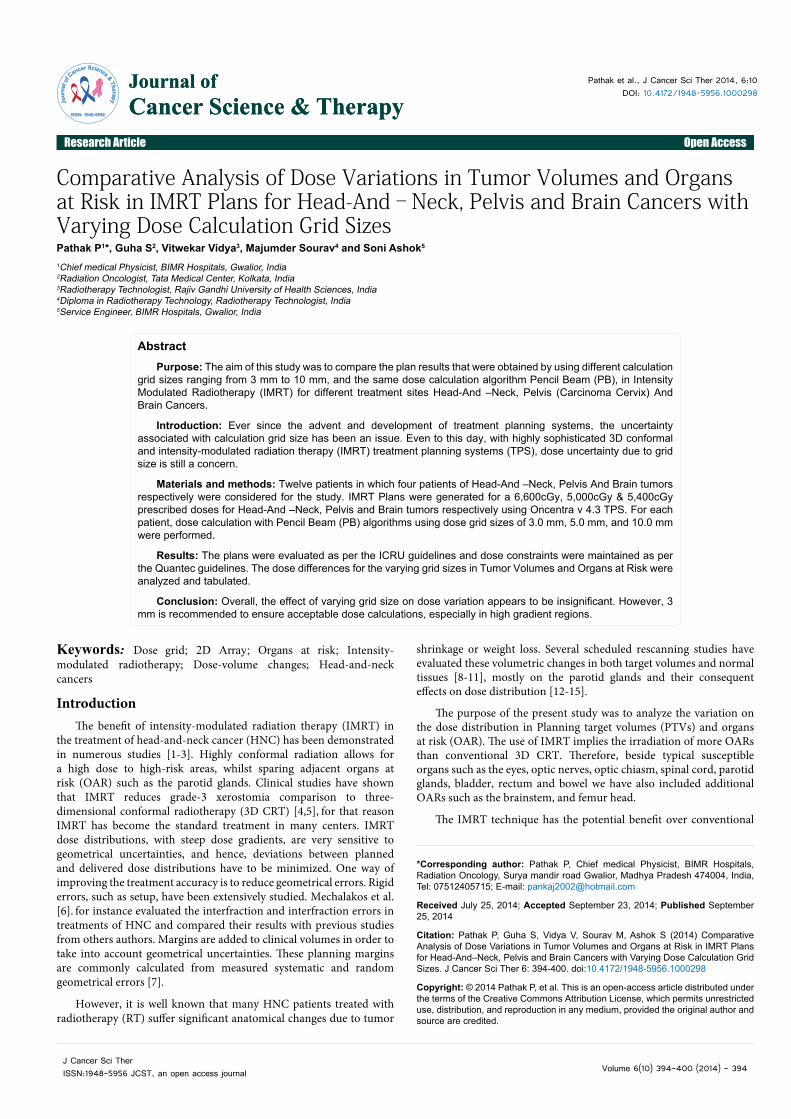
Figure 1: Showing 95% Isodose distribution In Head & Neck Cancer. (a) With 3mm Dose Calculation Grid Size (b) With 5mm Dose Calculation Grid Size (c) With 10mm Dose Calculation Grid Size.
Citation: Pathak P, Guha S, Vidya V, Sourav M, Ashok S (2014) Comparative Analysis of Dose Variations in Tumor Volumes and Organs at Risk in IMRT Plans for Head-And–Neck, Pelvis and Brain Cancers with Varying Dose Calculation Grid Sizes. J Cancer Sci Ther 6: 394-400. doi:10.4172/1948-5956.1000298
Volume 6(10) 394-400 (2014) - 396 J Cancer Sci Ther ISSN:1948-5956 JCST, an open access journal
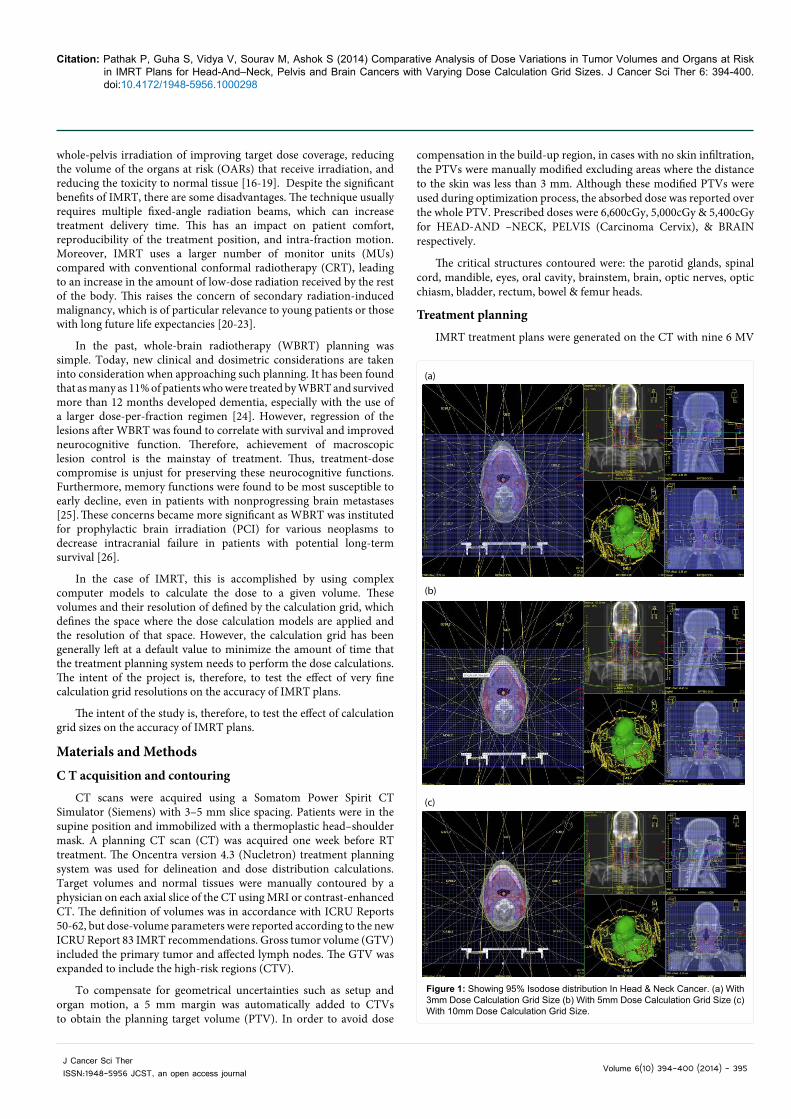
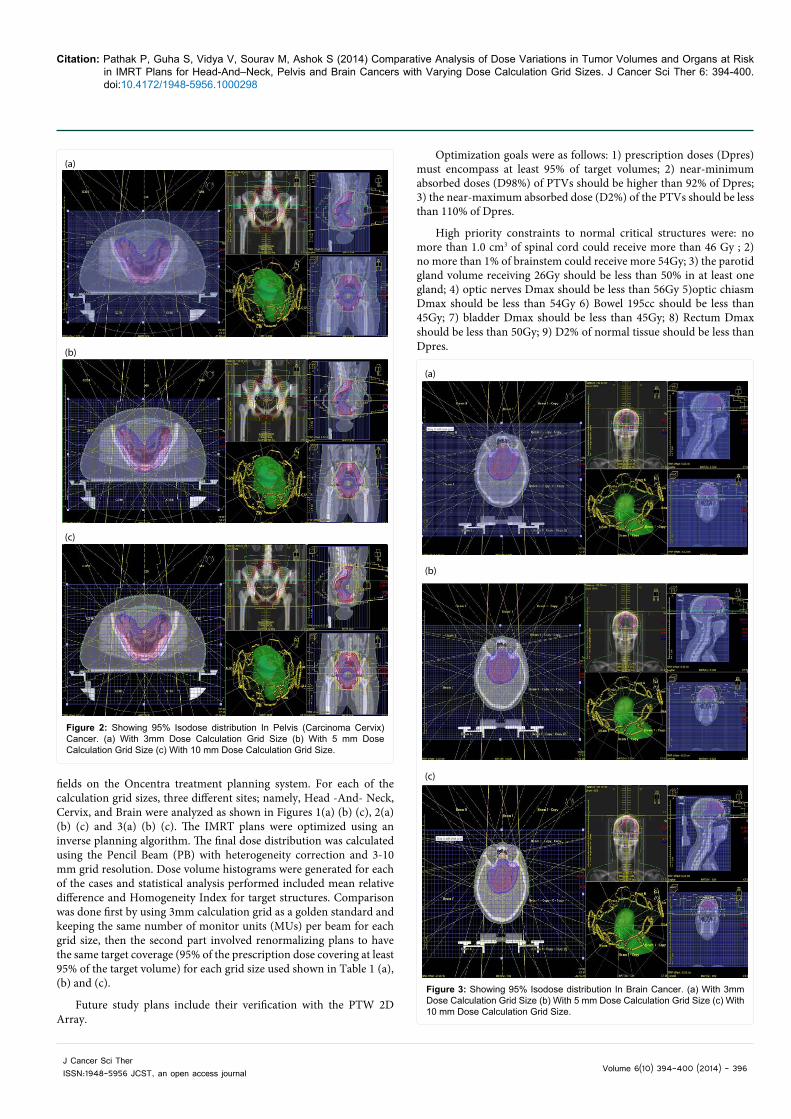
fields on the Oncentra treatment planning system. For each of the calculation grid sizes, three different sites; namely, Head -And- Neck, Cervix, and Brain were analyzed as shown in Figures 1(a) (b) (c), 2(a) (b) (c) and 3(a) (b) (c). The IMRT plans were optimized using an inverse planning algorithm. The final dose distribution was calculated using the Pencil Beam (PB) with heterogeneity correction and 3-10 mm grid resolu tion. Dose volume histograms were generated for each of the cases and statistical analysis performed included mean relative difference and Homogeneity Index for target structures. Comparison was done first by using 3mm calculation grid as a golden standard and keeping the same number of monitor units (MUs) per beam for each grid size, then the second part involved renormalizing plans to have the same target coverage (95% of the prescription dose covering at least 95% of the target volume) for each grid size used shown in Table 1 (a), (b) and (c).
Future study plans include their verification with the PTW 2D Array.
Optimization goals were as follows: 1) prescription doses (Dpres) must encompass at least 95% of target volumes; 2) near-minimum absorbed doses (D98%) of PTVs should be higher than 92% of Dpres; 3) the near-maximum absorbed dose (D2%) of the PTVs should be less than 110% of Dpres.
High priority constraints to normal critical structures were: no more than 1.0 cm3 of spinal cord could receive more than 46 Gy ; 2) no more than 1% of brainstem could receive more 54Gy; 3) the parotid gland volume receiving 26Gy should be less than 50% in at least one gland; 4) optic nerves Dmax should be less than 56Gy 5)optic chiasm Dmax should be less than 54Gy 6) Bowel 195cc should be less than 45Gy; 7) bladder Dmax should be less than 45Gy; 8) Rectum Dmax should be less than 50Gy; 9) D2% of normal tissue should be less than Dpres.
(a)
(b)
(c)
Figure 2: Showing 95% Isodose distribution In Pelvis (Carcinoma Cervix) Cancer. (a) With 3mm Dose Calculation Grid Size (b) With 5 mm Dose Calculation Grid Size (c) With 10 mm Dose Calculation Grid Size.
(a)
(b)
(c)
Figure 3: Showing 95% Isodose distribution In Brain Cancer. (a) With 3mm Dose Calculation Grid Size (b) With 5 mm Dose Calculation Grid Size (c) With 10 mm Dose Calculation Grid Size.
Citation: Pathak P, Guha S, Vidya V, Sourav M, Ashok S (2014) Comparative Analysis of Dose Variations in Tumor Volumes and Organs at Risk in IMRT Plans for Head-And–Neck, Pelvis and Brain Cancers with Varying Dose Calculation Grid Sizes. J Cancer Sci Ther 6: 394-400. doi:10.4172/1948-5956.1000298
Volume 6(10) 394-400 (2014) - 397 J Cancer Sci Ther ISSN:1948-5956 JCST, an open access journal
Low priority constraints that should not compromise target coverage were: 1) eyes Dmax should be less than 50 Gy.
ResultsThe maximum percentage of variation recorded between
calculation grid sizes used was in the case of the Head and Neck treatments. For the Cervix and Brain cases there was little variation in the results based on the calculation grid size chosen. However head and neck cases with nodal involvement showed significant variation in the dosimetric results based on the grid size chosen as shown in Table 2 (a), (b) and (c). Overall results vary from case to case and also depend on the plan complexity. For larger treatment areas calculating with the grid size smaller than 3mm may be impossible as time needed for calculation rises exponentially with the field size involved. In gamma function tests, all grid sizes met the criteria of acceptability. (i.e., 95% of the region resulted in gamma index less or equal to 1 with a 3% dose difference and a 3 mm Distance to target agreement (DTA) criteria) except for deep target and 5 mm and 10 mm grid sizes where 95% of the region resulted in gamma index less or equal to 1 with a 5% dose difference and a 5 mm DTA criteria. It was observed that larger grid spacing produces higher dose gradient.
There are enduring uncertainties regarding the optimal dose grid resolution for use with pelvic intensity-modulated radiotherapy
(IMRT) plans in which the adjacent organs at risk are slender and transect the field edge
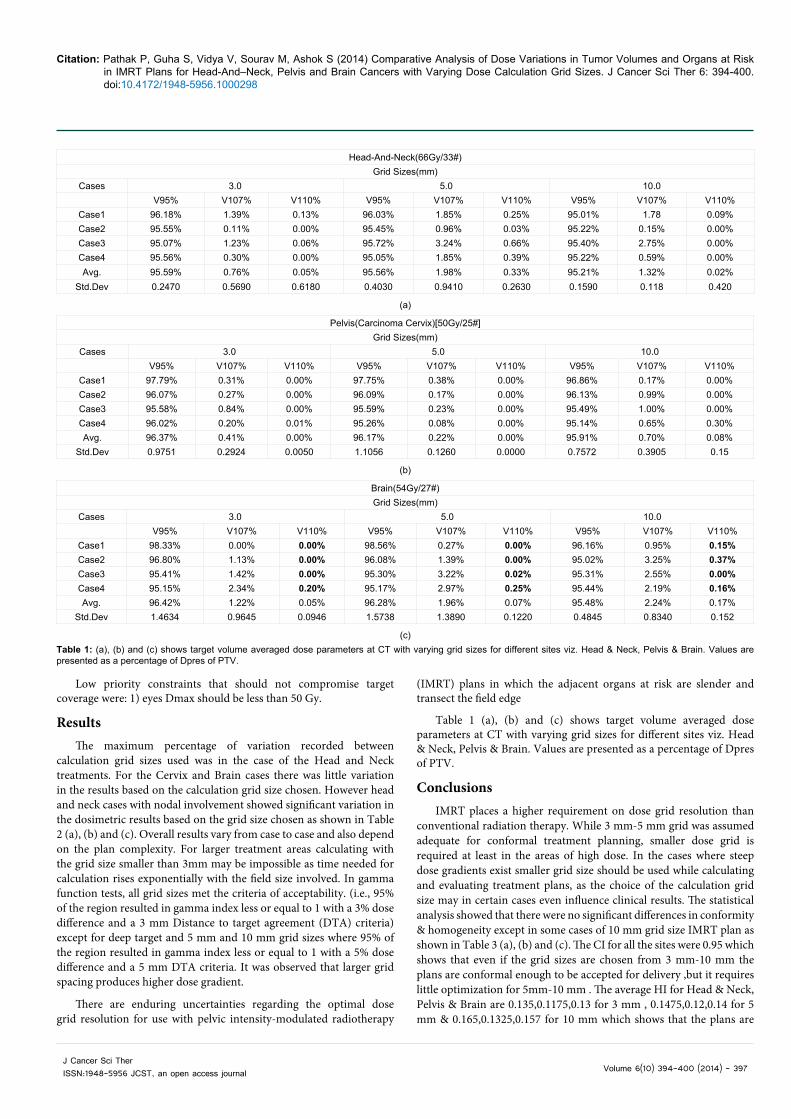
Table 1 (a), (b) and (c) shows target volume averaged dose parameters at CT with varying grid sizes for different sites viz. Head & Neck, Pelvis & Brain. Values are presented as a percentage of Dpres of PTV.
ConclusionsIMRT places a higher requirement on dose grid resolution than
conventional radiation therapy. While 3 mm-5 mm grid was assumed adequate for conformal treatment planning, smaller dose grid is required at least in the areas of high dose. In the cases where steep dose gradients exist smaller grid size should be used while calculating and evaluating treatment plans, as the choice of the calculation grid size may in certain cases even influence clinical results. The statistical analysis showed that there were no significant differences in conformity & homogeneity except in some cases of 10 mm grid size IMRT plan as shown in Table 3 (a), (b) and (c). The CI for all the sites were 0.95 which shows that even if the grid sizes are chosen from 3 mm-10 mm the plans are conformal enough to be accepted for delivery ,but it requires little optimization for 5mm-10 mm . The average HI for Head & Neck, Pelvis & Brain are 0.135,0.1175,0.13 for 3 mm , 0.1475,0.12,0.14 for 5 mm & 0.165,0.1325,0.157 for 10 mm which shows that the plans are
Head-And-Neck(66Gy/33#)Grid Sizes(mm)
Cases 3.0 5.0 10.0V95% V107% V110% V95% V107% V110% V95% V107% V110%
Case1 96.18% 1.39% 0.13% 96.03% 1.85% 0.25% 95.01% 1.78 0.09%Case2 95.55% 0.11% 0.00% 95.45% 0.96% 0.03% 95.22% 0.15% 0.00%Case3 95.07% 1.23% 0.06% 95.72% 3.24% 0.66% 95.40% 2.75% 0.00%Case4 95.56% 0.30% 0.00% 95.05% 1.85% 0.39% 95.22% 0.59% 0.00%Avg. 95.59% 0.76% 0.05% 95.56% 1.98% 0.33% 95.21% 1.32% 0.02%
Std.Dev 0.2470 0.5690 0.6180 0.4030 0.9410 0.2630 0.1590 0.118 0.420
(a)
Pelvis(Carcinoma Cervix)[50Gy/25#]Grid Sizes(mm)
Cases 3.0 5.0 10.0V95% V107% V110% V95% V107% V110% V95% V107% V110%
Case1 97.79% 0.31% 0.00% 97.75% 0.38% 0.00% 96.86% 0.17% 0.00%Case2 96.07% 0.27% 0.00% 96.09% 0.17% 0.00% 96.13% 0.99% 0.00%Case3 95.58% 0.84% 0.00% 95.59% 0.23% 0.00% 95.49% 1.00% 0.00%Case4 96.02% 0.20% 0.01% 95.26% 0.08% 0.00% 95.14% 0.65% 0.30%Avg. 96.37% 0.41% 0.00% 96.17% 0.22% 0.00% 95.91% 0.70% 0.08%
Std.Dev 0.9751 0.2924 0.0050 1.1056 0.1260 0.0000 0.7572 0.3905 0.15
(b)
Brain(54Gy/27#)Grid Sizes(mm)
Cases 3.0 5.0 10.0V95% V107% V110% V95% V107% V110% V95% V107% V110%
Case1 98.33% 0.00% 0.00% 98.56% 0.27% 0.00% 96.16% 0.95% 0.15%Case2 96.80% 1.13% 0.00% 96.08% 1.39% 0.00% 95.02% 3.25% 0.37%Case3 95.41% 1.42% 0.00% 95.30% 3.22% 0.02% 95.31% 2.55% 0.00%Case4 95.15% 2.34% 0.20% 95.17% 2.97% 0.25% 95.44% 2.19% 0.16%Avg. 96.42% 1.22% 0.05% 96.28% 1.96% 0.07% 95.48% 2.24% 0.17%
Std.Dev 1.4634 0.9645 0.0946 1.5738 1.3890 0.1220 0.4845 0.8340 0.152
(c)Table 1: (a), (b) and (c) shows target volume averaged dose parameters at CT with varying grid sizes for different sites viz. Head & Neck, Pelvis & Brain. Values are presented as a percentage of Dpres of PTV.
Citation: Pathak P, Guha S, Vidya V, Sourav M, Ashok S (2014) Comparative Analysis of Dose Variations in Tumor Volumes and Organs at Risk in IMRT Plans for Head-And–Neck, Pelvis and Brain Cancers with Varying Dose Calculation Grid Sizes. J Cancer Sci Ther 6: 394-400. doi:10.4172/1948-5956.1000298
Volume 6(10) 394-400 (2014) - 398 J Cancer Sci Ther ISSN:1948-5956 JCST, an open access journal
Head-And-Neck(66Gy/33#)Grid Sizes(mm)
Organs At Risk 3.0 5.0 10.0D1cc (Gy) Dmax (Gy) Mean Dose (Gy) D1cc (Gy) Dmax (Gy) Mean Dose (Gy) D1cc (Gy) Dmax (Gy) Mean Dose (Gy)
Spinal CordCase1Case2Case3Case4
40.1844.2640.7243.19
43.5046.8443.1946.05
43.2445.5944.8742.54
44.9346.1845.1144.89
42.1646.4545.1141.56
Spinal cord PRVCase1Case2Case3Case4
47.5948.2248.1448.42
49.7250.8949.6951.72
48.8447.0148.9749.98
49.4248.4851.8148.76
47.0146.5347.3347.50
Brain StemCase1Case2Case3Case4
40.4032.8351.6645.31
47.0738.3253.9549.68
39.6032.9052.7745.38
44.0036.7854.8650.42
44.7733.0653.4449.50
46.9135.0254.7649.88
Brain Stem PRVCase1Case2Case3Case4
47.4236.4055.6555.15
56.2440.5359.5855.15
52.4040.1659.8756.21
49.8636.5756.3559.26
53.8436.4857.1059.26
ParotidCase1Case2Case3Case4
35.4235.4233.4034.50
34.4934.5034.5038.83
31.9732.5035.0040.00
(a)
Pelvis(Carcinoma Cervix)[50Gy/25#]Grid Sizes(mm)
Organs At Risk 3.0 5.0 10.0D1cc (Gy) Dmax (Gy) Mean Dose (Gy) D1cc (Gy) Dmax (Gy) Mean Dose (Gy) D1cc (Gy) Dmax (Gy) Mean Dose (Gy)
BladderCase1Case2Case3Case4
50.9450.5051.8249.85
51.2951.0052.0950.25
51.7050.5751.1850.51
52.0250.9451.7150.83
52.0451.5852.8450.64
52.0451.5652.9450.68
RectumCase1Case2Case3Case4
52.1450.1552.3850.98
52.6350.9952.6251.54
52.7150.7951.4051.35
53.1051.6251.9051.67
52.7550.8852.7851.48
53.0550.9252.6851.59
Rt.FHCase1Case2Case3Case4
44.5350.5550.8246.96
44.6450.8649.2146.01
45.1350.1247.0841.5
Lt.FHCase1Case2Case3Case4
44.5951.1551.6048.01
44.5650.7550.6445.26
45.7053.6251.1843.56
Bowel D195cc (Gy) Dmax (Gy) Mean Dose (Gy) D195cc(Gy) Dmax (Gy) Mean Dose (Gy) D195cc(Gy) Dmax (Gy) Mean Dose (Gy)Case1Case2Case3Case4
41.6239.7745.2942.47
53.4753.6553.4853.37
41.9339.3045.0442.34
52.7453.5652.4953.85
41.7339.6246.1742.99
51.7353.6253.4152.19
(b)
Brain(54Gy/27#)Grid Size (mm)
Organs at Risk 3 5 10 D1cc (Gy) Dmax (GY) Mean Dose(GY) D1cc (Gy) Dmax (GY) Mean Dose(GY) D1cc (Gy) Dmax (GY) Mean Dose (GY)
optic chiasm Case1 20.11 29.32 21.13 26.98 21.57 28.36 Case2 53.0 53.82 51.39 55.21 51.39 53.69 Case3 51.21 55.23 51.39 55.21 51.48 55.33
Citation: Pathak P, Guha S, Vidya V, Sourav M, Ashok S (2014) Comparative Analysis of Dose Variations in Tumor Volumes and Organs at Risk in IMRT Plans for Head-And–Neck, Pelvis and Brain Cancers with Varying Dose Calculation Grid Sizes. J Cancer Sci Ther 6: 394-400. doi:10.4172/1948-5956.1000298
Volume 6(10) 394-400 (2014) - 399 J Cancer Sci Ther ISSN:1948-5956 JCST, an open access journal
(c)
Case4 35.66 49.65 35.74 46.96 35.07 46.96 Optic chiasm PRV
Case1 26.62 35.16 27.03 34.37 26.97 30.11 Case2 53.69 55.64 55.61 57.68 53.69 57.18 Case3 55.25 56.57 55.66 56.34 55.39 55.78 Case4 47.36 53.10 46.97 51.87 47.88 47.50
BRAIN STEM CASE1 52.17 53.36 53.28 54.76 53.23 54.75 CASE2 52.78 59.10 54.23 55.88 55.81 56.95 CASE3 35.75 37.28 36.02 37.23 16.77 37.04 CASE4 54.00 54.68 53.59 53.98 54.69 55.19
BRAIN STEMPRV CASE1 53.92 55.35 54.82 55.93 53.75 55.75 CASE2 54.61 55.90 55.35 55.96 56.63 58.45 CASE3 50.16 52.15 50.63 51.62 50.97 51.79 CASE4 54.12 54.77 53.77 54.21 54.92 55.19 Rt.Eye Case1 6.27 4.81 7.83 5.66 6.56 5.06Case2 31.08 14.39 28.34 14.32 14.04 26.9Case3 40.29 22.46 38.33 21.96 34.15 22.4Case4 22.64 7.27 22.44 7.31 19.78 7.31Lt.Eye Case1 17.18 15.10 17.93 15.8 17.98 16.28Case2 44.60 19.34 42.28 19.66 38.91 15.93Case3 40.09 20.17 38.81 19.79 33.05 19.89Case4 15.06 4.50 14.88 4.40 14.08 4.40
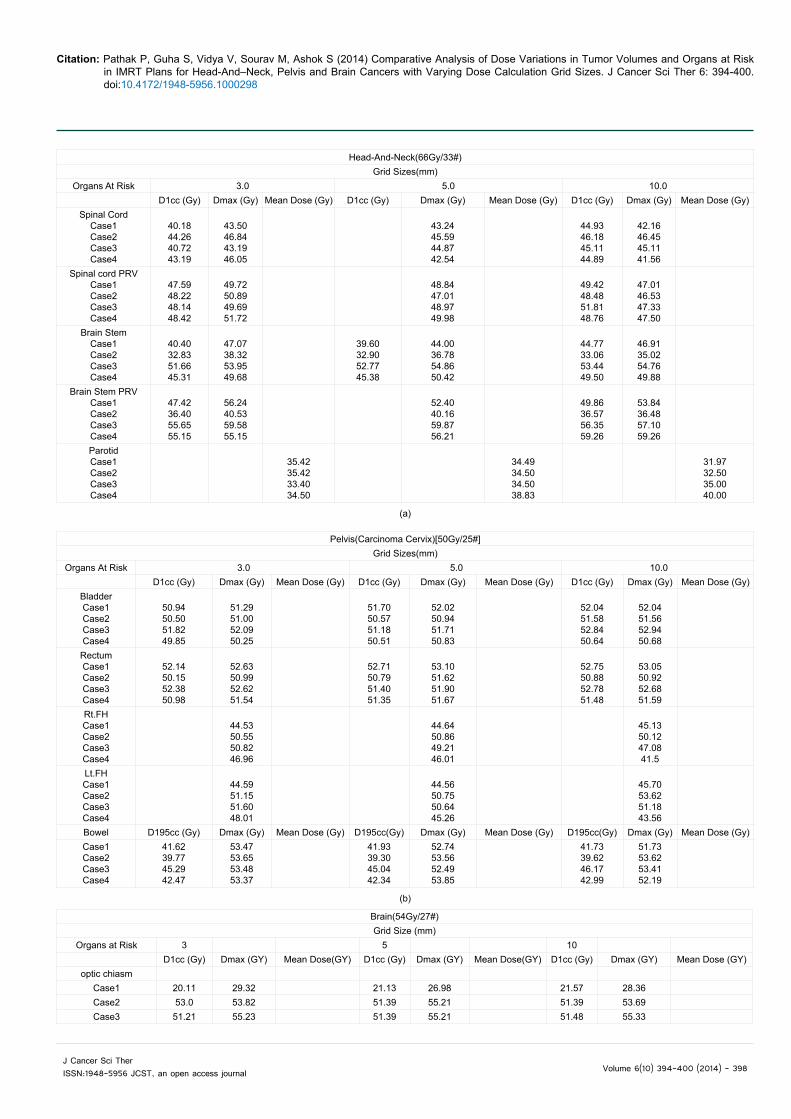
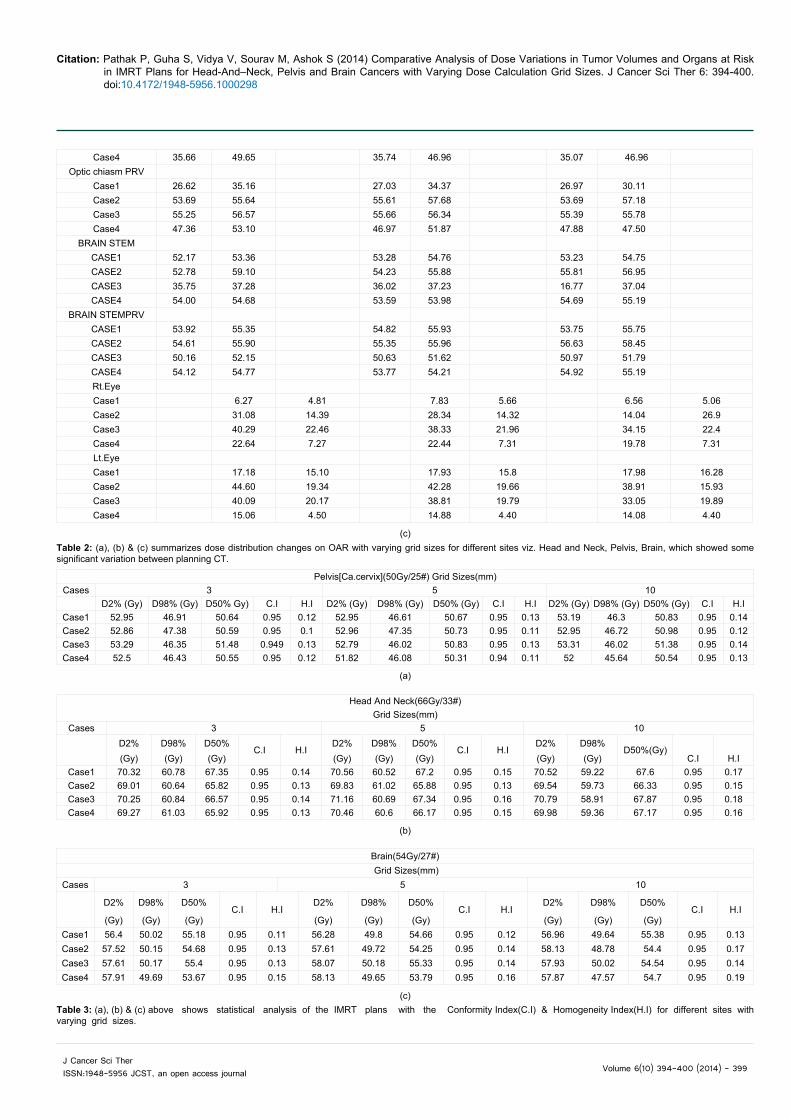
Table 2: (a), (b) & (c) summarizes dose distribution changes on OAR with varying grid sizes for different sites viz. Head and Neck, Pelvis, Brain, which showed some significant varia tion between planning CT.
Pelvis[Ca.cervix](50Gy/25#) Grid Sizes(mm)Cases 3 5 10
D2% (Gy) D98% (Gy) D50% Gy) C.I H.I D2% (Gy) D98% (Gy) D50% (Gy) C.I H.I D2% (Gy) D98% (Gy) D50% (Gy) C.I H.ICase1 52.95 46.91 50.64 0.95 0.12 52.95 46.61 50.67 0.95 0.13 53.19 46.3 50.83 0.95 0.14Case2 52.86 47.38 50.59 0.95 0.1 52.96 47.35 50.73 0.95 0.11 52.95 46.72 50.98 0.95 0.12Case3 53.29 46.35 51.48 0.949 0.13 52.79 46.02 50.83 0.95 0.13 53.31 46.02 51.38 0.95 0.14Case4 52.5 46.43 50.55 0.95 0.12 51.82 46.08 50.31 0.94 0.11 52 45.64 50.54 0.95 0.13
(a)
Head And Neck(66Gy/33#)Grid Sizes(mm)
Cases 3 5 10
D2% D98% D50%
C.I H.ID2% D98% D50%
C.I H.ID2% D98%
D50%(Gy)
(Gy) (Gy) (Gy) (Gy) (Gy) (Gy) (Gy) (Gy) C.I H.ICase1 70.32 60.78 67.35 0.95 0.14 70.56 60.52 67.2 0.95 0.15 70.52 59.22 67.6 0.95 0.17Case2 69.01 60.64 65.82 0.95 0.13 69.83 61.02 65.88 0.95 0.13 69.54 59.73 66.33 0.95 0.15Case3 70.25 60.84 66.57 0.95 0.14 71.16 60.69 67.34 0.95 0.16 70.79 58.91 67.87 0.95 0.18Case4 69.27 61.03 65.92 0.95 0.13 70.46 60.6 66.17 0.95 0.15 69.98 59.36 67.17 0.95 0.16
(b)
Brain(54Gy/27#) Grid Sizes(mm)
Cases 3 5 10
D2% D98% D50%
C.I H.ID2% D98% D50%
C.I H.ID2% D98% D50%
C.I H.I(Gy) (Gy) (Gy) (Gy) (Gy) (Gy) (Gy) (Gy) (Gy)
Case1 56.4 50.02 55.18 0.95 0.11 56.28 49.8 54.66 0.95 0.12 56.96 49.64 55.38 0.95 0.13Case2 57.52 50.15 54.68 0.95 0.13 57.61 49.72 54.25 0.95 0.14 58.13 48.78 54.4 0.95 0.17Case3 57.61 50.17 55.4 0.95 0.13 58.07 50.18 55.33 0.95 0.14 57.93 50.02 54.54 0.95 0.14Case4 57.91 49.69 53.67 0.95 0.15 58.13 49.65 53.79 0.95 0.16 57.87 47.57 54.7 0.95 0.19
(c)Table 3: (a), (b) & (c) above shows statistical analysis of the IMRT plans with the Conformity Index(C.I) & Homogeneity Index(H.I) for different sites with varying grid sizes.
Citation: Pathak P, Guha S, Vidya V, Sourav M, Ashok S (2014) Comparative Analysis of Dose Variations in Tumor Volumes and Organs at Risk in IMRT Plans for Head-And–Neck, Pelvis and Brain Cancers with Varying Dose Calculation Grid Sizes. J Cancer Sci Ther 6: 394-400. doi:10.4172/1948-5956.1000298
Volume 6(10) 394-400 (2014) - 400 J Cancer Sci Ther ISSN:1948-5956 JCST, an open access journal
more homogeneous for 3 mm IMRT plans with respect to 5 & 10 mm IMRT plans .Thus 3 mm is recommended to ensure acceptable dose calculations, especially in high gradient regions.
P value and statistical significance
The two-tailed P value is less than 0.001 for target coverage.
By conventional criteria, this difference is considered to be extremely statistically significant.
References
1. Huang D, Xia P, Akazawa P (2003) Comparison of treatment plans usingintensity-modulated radiotherapy and three-dimensional conformal radiotherapy for Para-nasal sinus carcinoma. Int J Radiat Oncol Biol Phys 56:158-168.
2. Chao KS, Ozyigit G, Blanco AI, Thorstad WL, Deasy JO, et al. (2004) Intensity-modulated radiation therapy for oropharyngeal carcinoma: impact of tumorvolume. Int J Radiat Oncol Biol Phys 59: 43-50.
3. Miles EA, Clark CH, Urbano MT, Bidmead M, Dearnaley DP, et al. (2005) Theimpact of introducing intensity modulated radiotherapy into routine clinicalpractice. Radiother Oncol 77: 241-246.
4. Scott-Brown M, Miah A, Harrington K, Nutting C (2010) Evidence-basedreview: quality of life following head and neck intensity-modulated radiotherapy. Radiother Oncol 97: 249-257.
5. Nutting CM, Morden JP, Harrington KJ, Urbano TG, Bhide SA, et al. (2011)Parotid-sparing intensity modulated versus conventional radio¬therapyin head and neck cancer (PARSPORT): a phase 3 multicentre randomizedcontrolled trial. Lancet Oncol 12: 127-136.
6. Mechalakos JG, Hunt MA, Lee NY, Hong LX, Ling CC, et al. (2007) Using anonboard kilovoltage imager to measure setup deviation in intensity-modulatedradiation therapy for head-and-neck patients. J Appl Clin Med Phys 8: 2439.
7. van Herk M, Remeijer P, Rasch C, Lebesque JV (2000) The probability ofcorrect target dosage: dose-population histograms for deriving treatmentmargins in radiotherapy. Int J Radiat Oncol Biol Phys 47: 1121-1135.
8. Barker JL, Garden AS, Ang KK, O’Daniel JC, Wang H, et al. (2004) Quantification of volumetric and geometric changes occurring during fractionated radiotherapy for head-and-neck cancer using an integrated CT/linear accelerator system. Int J Radiat Oncol Biol Phys 59: 960-970.
9. Castadot P, Geets X, Lee JA, Christian N, Gregoire V (2010) Assessment bya deformable registration method of the volumetric and positional changes oftarget volumes and organs at risk in pharyngo-laryngeal tumors treated withconcomitant chemo-radiation. Radiother Oncol 95: 209-217.
10. Vasquez Osorio EM, Hoogeman MS, Al-Mamgani A, Teguh DN, LevendagPC, et al. (2008) Local anatomic changes in parotid and submandibular glands during radiotherapy for oropharynx cancer and correlation with dose, studiedin detail with nonrigid registration. Int J Radiat Oncol Biol Phys 70: 875-882.
11. Lee C, Langen KM, Lu Wl (2008) Evaluation of geometric changes of parotidglands during head and neck cancer radiotherapy using daily MVCT andautomatic deformable registration. Radiother Oncol 89: 81-88.
12. Bhide SA, Davies M, Burke K () Weekly volume and dosimetric changes during chemo radiotherapy with intensity-modulated radiation therapy for head andneck Cancer: a prospective observational study. Int J Radiat Oncol Biol Phys76: 1360-1368.
13. Robar JL, Day A, Clancey J, Kelly R, Yewondwossen M, et al. (2007) Spatialand dosimetric variability of organs at risk in head-and-neck intensity-modulated radiotherapy. Int J Radiat Oncol Biol Phys 68: 1121-1130.
14. Han C, Chen YJ, Liu A, Schultheiss TE, Wong JY (2008) Actual dose variation of parotid glands and spinal cord for nasopharyngeal cancer patients duringradiotherapy. Int J Radiat Oncol Biol Phys 70: 1256-1262.
15. Lee C, Langen KM, Lu W, Haimerl J, Schnarr E, et al. (2008) Assessment ofparotid gland dose changes during head and neck cancer radio¬therapy using daily megavoltage computed tomography and deformable image registration.Int J Radiat Oncol Biol Phys 71: 1563-1571.
16. Georg P, Georg D, Hillbrand M, Kirisits C, Pötter R (2006) Factorsinfluencing bowel sparing in intensity modulated whole pelvic radiotherapy for gynaecological malignancies. Radiother Oncol 80: 19-26.
17. Portelance L, Chao KS, Grigsby PW, Bennet H, Low D (2001) Intensity-modulated radiation therapy (IMRT) reduces small bowel, rectum, andbladder doses in patients with cervical cancer receiving pelvic and para-aorticirradiation. Int J Radiat Oncol Biol Phys 51: 261-266.
18. Mundt AJ, Lujan AE, Rotmensch J, Waggoner SE, Yamada SD, et al. (2002)Intensity-modulated whole pelvic radiotherapy in women with gynecologicmalignancies. Int J Radiat Oncol Biol Phys 52: 1330-1337.
19. Roeske JC, Lujan A, Rotmensch J, Waggoner SE, Yamada D, et al. (2000)Intensity-modulated whole pelvic radiation therapy in patients with gynecologic malignancies. Int J Radiat Oncol Biol Phys 48: 1613-1621.
20. Sharma SD, Upreti RR, Laskar S, Tambe CM, Deshpande DD, et al. (2008)Estimation of risk of radiation-induced carcinogenesis in adolescents withnasopharyngeal cancer treated using sliding window IMRT. Radiother Oncol86: 177-181.
21. Hall EJ, Wuu CS (2003) Radiation-induced second cancers: the impact of3D-CRT and IMRT. Int J Radiat Oncol Biol Phys 56: 83-88.
22. Verellen D, Vanhavere F (1999) Risk assessment of radiation-inducedmalignancies based on whole-body equivalent dose estimates for IMRTtreatment in the head and neck region. Radiother Oncol 53: 199-203.
23. Ruben JD, Davis S, Evans C, Jones P, Gagliardi F, et al. (2008) The effect ofintensity-modulated radiotherapy on radiation-induced second malignancies.Int J Radiat Oncol Biol Phys 70: 1530-1536.
24. DeAngelis LM, Delattre JY, Posner JB (1989) Radiation-induced dementia inpatients cured of brain metastases. Neurology 39: 789-796.
25. Li J, Bentzen SM, Renschler M, Mehta MP (2007) Regression after whole-brain radiation therapy for brain metastases correlates with survival and improvedneurocognitive function. J Clin Oncol 25: 1260-1266.
26. Rosenman J, Choi NC (1982) Improved quality of life of patients with small-cell carcinoma of the lung by elective irradiation of the brain. Int J Radiat Oncol Biol Phys 8: 1041-1043.


![Mat Scie & Eng[1]](https://img.pdfslide.us/doc/110x75/55cf9ae8550346d033a3f641/mat-scie-eng1.jpg)