Embed Size (px)
Citation preview

1
A NATIONAL STUDY OF IMMIGRATION
DETENTION IN THE UNITED STATES*
EMILY RYO† AND IAN PEACOCK‡
Amidst growing reports of abuses and rights violations in immigration
detention, the Trump administration has sought to expand the use of
immigration detention to facilitate its deportation policy. This study offers
the first comprehensive empirical analysis of U.S. immigration detention at
the national level. Drawing on administrative records and geocoded data
pertaining to all noncitizens who were detained by U.S. Immigration and
Customs Enforcement in fiscal year 2015, we examine who the detainees are,
where they were held, and what happened to them.
The bulk of the detained population consisted of men (79%) and
individuals from Mexico, El Salvador, Guatemala, and Honduras (together,
89%). Over 59,000, or about 17%, of the detainees were juveniles under the
age of eighteen. Every state in the United States had one or more facility,
with Texas and California having the highest number of facilities and
*. This research was supported by the Carnegie Corporation of New York and the California
Wellness Foundation. The statements made and views expressed are solely the responsibility of the
authors. We are grateful to Ben Johnson, Sue Long, Grace Meng, Brian Root, and Tizita Wasihun. We
thank Tendayi Achiume, Sameer Ashar, Lenni Benson, Guillermo Cantor, Jennifer Chacón, Ingrid Eagly,
Annie Lai, and Jaya Ramji-Nogales for their insightful comments. Kris Coombs, Joanna Cortez
Hernández, Danielle Flores, Hilary Olson, and Tiffany Panganiban provided excellent research
assistance. We thank the participants of the Criminalizing Immigrants Conference at Cornell University,
the UCLA Center for the Study of International Migration Seminar Series, and the Berkeley International
Migration and Refugee Law Workshop for providing helpful feedback. Direct all correspondence to
Emily Ryo, USC Gould School of Law, 699 Exposition Blvd., Los Angeles, CA 90089. Email:
†. Associate Professor of Law and Sociology, University of Southern California Gould School of
Law.
‡. Ph.D. Candidate in Sociology, University of California, Los Angeles.

2 SOUTHERN CALIFORNIA LAW REVIEW [Vol. 92:1
detainees. Detention in privately operated facilities and in remote locations
was common. We analyze three key detention outcomes: detention length,
inter-facility transfers, and facility-related grievances. The average
detention length for adults released in fiscal year 2015 was thirty-eight days,
though tens of thousands were detained for many months or years. A
majority of these detainees experienced one or more inter-facility transfers,
many involving movements across cities, states, and federal judicial circuits.
In fiscal year 2015, the Detention Reporting and Information Line received
over 48,800 facility-related grievances, a majority of which concerned issues
pertaining to access to legal counsel and basic immigration case
information.
We find that detention outcomes vary significantly across facility
operator types (private versus non-private) and facility locations (within or
outside of major urban areas). Specifically, our multivariate regression
analyses show that confinement in privately operated facilities is associated
with significantly longer detention and a higher number of grievances. We
find a similar pattern of results for confinement in facilities located outside
of major urban areas. On the other hand, confinement in privately operated
facilities, and confinement in facilities located outside of major urban areas,
respectively, are associated with lower risks of inter-facility transfers. These
findings provide an important foundation for ongoing public discourse and
policy discussions on the expanded use of detention as an immigration
enforcement strategy.
TABLE OF CONTENTS
INTRODUCTION ........................................................................................ 3 I. BACKGROUND ....................................................................................... 7
A. POLITICAL CONTEXT ............................................................................ 7 B. LEGAL AND POLICY FRAMEWORK ...................................................... 10 C. RESEARCH ON DETENTION ................................................................. 14
II. THE CURRENT STUDY ...................................................................... 16 A. DATA .................................................................................................. 16
1. Detention Data ................................................................................ 17 2. Geocoded Data ............................................................................... 18 3. Grievance Data ............................................................................... 20
B. ANALYTICAL APPROACH .................................................................... 21 III. KEY EMPIRICAL FINDINGS ............................................................ 22
A. DETAINEE CHARACTERISTICS ............................................................ 23 B. DETENTION FACILITY CHARACTERISTICS .......................................... 25 C. DETENTION OUTCOMES ...................................................................... 30
1. Detention Length ............................................................................ 32

2018] IMMIGRATION DETENTION 3
2. Inter-Facility Transfers ................................................................... 37 3. Grievances ...................................................................................... 45
CONCLUSION .......................................................................................... 51 APPENDIX TABLES ................................................................................ 55 METHODS APPENDIX ............................................................................ 62
A. DETENTION DATA PREPARATION ....................................................... 62 B. GAPS IN CUSTODY PERIODS AND DETENTION STINTS ........................ 63 C. TRANSFERS ......................................................................................... 64 D. CODING FACILITIES AS PRIVATELY OPERATED .................................. 65 E. DISTANCE MEASURES ......................................................................... 65 F. GEOCODING FACILITIES ...................................................................... 66
INTRODUCTION
In Zadvydas v. Davis, a case about the constitutionality of indefinite
immigration detention, the U.S. Supreme Court declared: “Freedom from
imprisonment—from government custody, detention, or other forms of
physical restraint—lies at the heart of the liberty that [the Due Process]
Clause protects.”1 As courts have noted, imprisonment implicates core due
process issues because imprisonment not only engenders the loss of freedom
of physical movement, but also inflicts deep social stigma and other enduring
adverse consequences on the individual.2
Every day, tens of thousands of noncitizens in immigration proceedings
face this deprivation of personal liberty through immigration detention.3 The
1. Zadvydas v. Davis, 533 U.S. 678, 690 (2001).
2. McMillan v. Pennsylvania, 477 U.S. 79, 98 n.2 (1986) (“The combination of stigma and loss
of liberty involved in a conditional or absolute sentence of imprisonment sets that sanction apart from
anything else the law imposes.”) (internal citation omitted); Vitek v. Jones, 445 U.S. 480, 492 (1980)
(“The loss of liberty produced by an involuntary commitment is more than a loss of freedom from
confinement.”); Castle v. United States, 399 F.2d 642, 651 n.16 (5th Cir. 1968) (“[I]mprisonment brings
not only a financial loss in wages but also the loss of all other advantages and privileges of being at
liberty.”).
3. We define immigration detention as a confinement system based on the federal government’s
power to hold individuals pending their immigration proceedings. By contrast, criminal incarceration
refers to a confinement system based on state or federal government’s authority to hold individuals
charged with, or convicted of, a criminal offense. See DORA SCHRIRO, U.S. DEP’T OF HOMELAND SEC.,
IMMIGRATION DETENTION OVERVIEW AND RECOMMENDATIONS 4 (2009), https://www.ice.gov/doclib
/about/offices/odpp/pdf/ice-detention-rpt.pdf [https://perma.cc/FC6L-WSH8]; OFFICE OF THE FED. DET.
TR., DETENTION NEEDS ASSESSMENT AND BASELINE REPORT 4 n.2 (2001), https://www.justice.gov
/archive/ofdt/federal_detention_report_2002.pdf [https://perma.cc/MSW7-2Z2C]. Some observers,
however, use the term immigration incarceration to refer to immigration detention, in part to highlight
the punitive nature and severe consequences of immigration detention. See, e.g., SEMUTEH FREEMAN &
LAUREN MAJOR, IMMIGRATION INCARCERATION: THE EXPANSION AND FAILED REFORM OF

4 SOUTHERN CALIFORNIA LAW REVIEW [Vol. 92:1
U.S. Department of Homeland Security (“DHS”), rather than the U.S.
Department of Justice (“DOJ”), currently operates the largest confinement
and supervised release program in the United States.4 Under the Trump
administration, the number of people booked into the custody of U.S.
Immigration and Customs Enforcement (“ICE”) through its interior
enforcement program has increased steeply.5 This is not surprising given the
administration’s announcement to employ detention as the default
immigration enforcement strategy.6 In accordance with this strategy, the
Trump administration plans to build additional detention facilities across the
country to accommodate the expected rise in the detainee population.7 The
Trump administration has also sought to lower the detention standards in
order to make the facility contracts more palatable to third-party contractors.8
This shift in policy is taking place amidst growing reports that have
documented a host of due process violations and human rights abuses in
immigration detention. For example, these reports have drawn public
attention to the rising number of deaths and suicides in detention, dangerous
and substandard medical care, sexual and physical abuse, exploitative labor
practices, and lack of adequate access to legal counsel, among many other
issues.9 Due to data scarcity, however, many of these investigative reports
IMMIGRATION DETENTION IN ESSEX COUNTY, NJ (2012), http://www.law.nyu.edu/sites/default/files
/upload_documents/Immigration%20Incarceration.pdf [https://perma.cc/56BD-DXVW]; César
Cuauhtémoc García Hernández, Naturalizing Immigration Imprisonment, 103 CALIF. L. REV. 1449
(2015); Raha Jorjani, Locked Up: Criminal and Immigration Incarceration in America, Keynote Address
(Mar. 16, 2010) in 4 DEPAUL J. FOR SOC. JUST. 1 (2010).
4. Dora B. Schriro, Improving Conditions of Confinement for Immigrant Detainees: Guideposts
Toward a Civil System of Civil Detention, in THE NEW DEPORTATIONS DELIRIUM: INTERDISCIPLINARY
RESPONSES 57, 66 (Daniel Kanstroom & M. Brinton Lykes eds., 2015).
5. U.S. DEP’T OF HOMELAND SEC., FISCAL YEAR 2017 ICE ENFORCEMENT AND REMOVAL
OPERATIONS REPORT 10 (2017), https://www.ice.gov/sites/default/files/documents/Report/2017
/iceEndOfYearFY2017.pdf [https://perma.cc/AJX4-TF3H].
6. See Exec. Order No. 13767, 82 Fed. Reg. 8793 (Jan. 25, 2017).
7. Memorandum from John Kelly, Sec’y of Homeland Sec., to Kevin McAleenan, Acting
Comm’r of U.S. Customs & Border Protection et al. 8–9 (Feb. 20, 2017), https://www.dhs.gov/sites
/default/files/publications/17_0220_S1_Implementing-the-Presidents-Border-Security-Immigration-
Enforcement-Improvement-Policies.pdf [https://perma.cc/LVX3-EGMY]; Immigration and Customs
Enforcement & Customs and Border Protection FY18 Budget Request: Hearing Before the Subcomm. on
Homeland Sec. of the H. Comm. on Appropriations, 115th Cong. (2017) (statement of Thomas Homan,
Acting Director, U.S. Immigration and Customs Enforcement), https://www.dhs.gov/news/2017/06/13
/written-testimony-ice-acting-director-house-appropriations-subcommittee-homeland [https://perma.cc
/Z3RS-MUAD].
8. Caitlin Dickerson, Plan Would Limit Protections for Immigrants Held in Jails, N.Y. TIMES,
Apr. 14, 2017, at A1.
9. See generally, e.g., AM. CIVIL LIBERTIES UNION ET AL., FATAL NEGLECT: HOW ICE IGNORES
DEATHS IN DETENTION (2016), https://www.detentionwatchnetwork.org/sites/default/files/reports/Fatal
%20Neglect%20ACLU-DWN-NIJC.pdf [https://perma.cc/J4VP-NU75]; S. POVERTY LAW CTR. ET AL.,

2018] IMMIGRATION DETENTION 5
have been relatively limited in their scope and primarily focused on specific
issues, regions of the country, or subpopulations. The same is largely true of
scholarly research on immigration detention in the United States.10
Fundamental questions thus remain at the national level about the detained
population, the facilities where the detainees are confined, and their
experiences and outcomes.
This study offers, for the first time, a comprehensive empirical analysis
of U.S. immigration detention at the national level. Drawing on
administrative records pertaining to all individuals who were in ICE custody
in fiscal year 2015, as well as geocoded data and records of grievances
relating to the facilities in which the detainees were confined, we examine
who the detainees are, where they were held, and what happened to them.
We also examine factors that predict variations in the following key
detention outcomes: detention length, the number of inter-facility transfers
that the detainees experienced during detention, and the number of
grievances filed against detention facilities. Detention length and grievances
capture basic aspects of detention experiences and outcomes. Inter-facility
transfers constitute another important—albeit largely overlooked—measure
of what happens to individuals in detention. Transfers warrant a special
scrutiny because they can substantially hinder access to legal representation,
sever family ties and community support, and separate detainees from the
evidence needed in their court proceedings.11
SHADOW PRISONS: IMMIGRANT DETENTION IN THE SOUTH (2016), https://www.splcenter.org/sites
/default/files/ijp_shadow_prisons_immigrant_detention_report.pdf [https://perma.cc/2GMD-M9RD];
HUMAN RIGHTS WATCH & CMTY. INITIATIVES FOR VISITING IMMIGRANTS IN CONFINEMENT, SYSTEMIC
INDIFFERENCE: DANGEROUS & SUBSTANDARD MEDICAL CARE IN US IMMIGRATION DETENTION (2017),
https://www.hrw.org/sites/default/files/report_pdf/usimmigration0517_web_0.pdf [http://perma.cc
/VQW5-UNMV]; PA. STATE LAW CTR. FOR IMMIGRANTS’ RIGHTS CLINIC, IMPRISONED JUSTICE: INSIDE
TWO GEORGIA IMMIGRANT DETENTION CENTERS (2017), https://projectsouth.org/wp-content/uploads
/2017/06/Imprisoned_Justice_Report-1.pdf [https://perma.cc/57ZK-SWEY].
10. For notable exceptions, see generally Ingrid V. Eagly & Steven Shafer, A National Study of
Access to Counsel in Immigration Court, 164 U. PA. L. REV. 1 (2015) (using data on immigration courts
to examine access to counsel in immigration proceedings, including for detained immigrants); Ingrid
Eagly et al., Detaining Families: A Study of Asylum Adjudication in Family Detention, 106 CALIF. L.
REV. 785 (2018) (using data on immigration courts to examine family detention). For challenges that
researchers face in obtaining government data related to immigration detention, see, for example,
TRANSACTIONAL RECORDS ACCESS CLEARINGHOUSE, HUGE INCREASE IN TRANSFERS OF ICE
DETAINEES (2009), http://trac.syr.edu/immigration/reports/220/#20 [https://perma.cc/3NXM-2BTB];
Donald Kerwin et al., Piecing Together the US Immigrant Detention Puzzle One Night at a Time: An
Analysis of All Persons in DHS-ICE Custody on September 22, 2012, 3 J. ON MIGRATION & HUM.
SECURITY 330, 331–32 (2015).
11. See Libby Rainey, ICE Transfers Immigrants Held in Detention Around the Country to Keep
Beds Filled, DENVER POST (Sept. 17, 2017), https://www.denverpost.com/2017/09/17/ice-detention-
transfers-immigrants [https://perma.cc/L2JS-96WF] (documenting the hardships detainees face as a result
of transfers); see also HUMAN RIGHTS WATCH, A COSTLY MOVE: FAR AND FREQUENT TRANSFERS
6 SOUTHERN CALIFORNIA LAW REVIEW [Vol. 92:1
In analyzing these key detention outcomes, we pay special attention to
two features of the U.S. detention system that have become a focal point of
growing concern among advocates, scholars, and policymakers. The first is
the expanding role of private companies in the U.S. detention system.12
According to a recent government report, 65% of the average daily detainee
population as of September 2016 were confined in facilities operated by
private, for-profit contractors.13 The second prominent feature of the current
U.S. detention system relates to the location—or more precisely, the relative
remoteness—of many of the detention facilities.14 In short, we assess
whether the detention outcomes of interest in this study are related to
confinement in privately operated facilities and in facilities that are located
outside of major urban areas.
The remainder of this Article proceeds in three major parts. Part I
provides the basic legal, political, and research context for understanding
immigration detention as it has evolved over time and as it stands now. Part
II describes the data we analyze in this Article. We obtained and merged
three major datasets to conduct our analyses. The primary dataset comes
from records that ICE provided to the Transactional Records Access
Clearinghouse (“TRAC”) pursuant to the Freedom of Information Act
(“FOIA”). This dataset consists of longitudinal information on each
individual detained by ICE during fiscal year 2015. The second dataset is a
compilation of geocoded records that allow us to examine distances to and
from detention facilities and other locations of interest in this study. The third
dataset consists of records that Human Rights Watch obtained through FOIA
from ICE on the complaints and grievances that detainees and other
stakeholders submitted involving the detention facilities. Part III presents our
key empirical findings.
Taken together, our findings constitute an important first step toward
understanding the possible structural determinants of detention experiences
and outcomes. More generally, our findings provide a critical empirical
IMPEDE HEARINGS FOR IMMIGRANT DETAINEES IN THE UNITED STATES (2011), https://www.hrw.org
/sites/default/files/reports/us0611webwcover_0.pdf [https://perma.cc/LP5F-XZUG] (analyzing detainee
transfers).
12. See generally Jennifer M. Chacón, Privatized Immigration Enforcement, 52 HARV. C.R.-C.L.
L. REV. 1 (2017) (evaluating privatization in immigration law).
13. See U.S. DEP’T OF HOMELAND SEC., REPORT OF THE SUBCOMMITTEE ON PRIVATIZED
IMMIGRATION DETENTION FACILITIES 6 (2016), https://www.dhs.gov/sites/default/files/publications
/DHS%20HSAC%20PIDF%20Final%20Report.pdf [https://perma.cc/5FR5-JJY4].
14. See, e.g., HUMAN RIGHTS WATCH, supra note 11, at 13, 16; Kyle Kim, Immigrants Held in
Remote ICE Facilities Struggle to Find Legal Aid Before They’re Deported, L.A. TIMES (Sept. 28, 2017),
http://www.latimes.com/projects/la-na-access-to-counsel-deportation [https://perma.cc/CAD9-FMSH].

2018] IMMIGRATION DETENTION 7
foundation for future research and policy debates on the expanded use of
detention as an immigration enforcement strategy.
I. BACKGROUND
A. POLITICAL CONTEXT
We begin with a brief discussion of the current political context of
immigration detention.15 The modern era of immigration detention in the
United States can be traced to the enactment of two laws in 1996: The
Antiterrorism and Effective Death Penalty Act (“AEDPA”)16 and the Illegal
Immigration Reform and Immigrant Responsibility Act (“IIRIRA”).17 The
AEDPA broadened the list of crimes defined as an aggravated felony and
expanded the types of offenses (beyond aggravated felonies) that trigger
mandatory detention.18
A few months later, Congress enacted the IIRIRA to further expand the
use of immigration detention, including by broadening the categories of
noncitizens subject to mandatory detention.19 Aggravated felonies now
include offenses that are neither aggravated nor a felony under criminal
statutes, such as a simple battery or shoplifting conviction.20 Further, the
category of individuals subject to mandatory detention now extends not only
to noncitizens with criminal convictions, but also to certain classes of
arriving aliens.21
As expected, the number of noncitizens detained by immigration
authorities during the post–1996 period rose steadily and dramatically.22 In
15. For additional recent discussions on the historical and political context of immigration
detention, see Emily Ryo, Fostering Legal Cynicism Through Immigration Detention, 90 S. CAL. L. REV.
999 (2017).
16. Antiterrorism and Effective Death Penalty Act of 1996, Pub. L. No. 104-132, § 440(a), 110
Stat. 1214 (1996).
17. Illegal Immigration Reform and Immigrant Responsibility Act of 1996, Pub. L. No. 104-208,
§ 133, 110 Stat. 3009 (1996).
18. César Cuauhtémoc García Hernández, Immigration Detention as Punishment, 61 UCLA L.
REV. 1346, 1370 (2014); Margaret H. Taylor, The 1996 Immigration Act: Detention and Related Issues,
74 INTERPRETER RELEASES 209, 216 (1997).
19. García Hernández, supra note 18, at 1370–71.
20. Nancy Morawetz, Understanding the Impact of the 1996 Deportation Laws and the Limited
Scope of Proposed Reforms, 113 HARV. L. REV. 1936, 1939 (2000).
21. ALISON SISKIN, CONG. RESEARCH SERV., IMMIGRATION-RELATED DETENTION: CURRENT
LEGISLATIVE ISSUES 5–6 (2012), https://fas.org/irp/crs/RL32369.pdf [https://perma.cc/R83M-DP3L].
22. There is some debate as to whether this growth can be partly attributed to what is commonly
known as the “detention bed quota” or the “detention bed mandate.” Since 2009, Congress has mandated
that the DHS maintain a certain minimum number of detention beds on a daily basis. The quota in 2009
was 33,400 beds, which increased to 34,000 in 2011. See PATRISIA MACÍAS-ROJAS, FROM DEPORTATION

8 SOUTHERN CALIFORNIA LAW REVIEW [Vol. 92:1
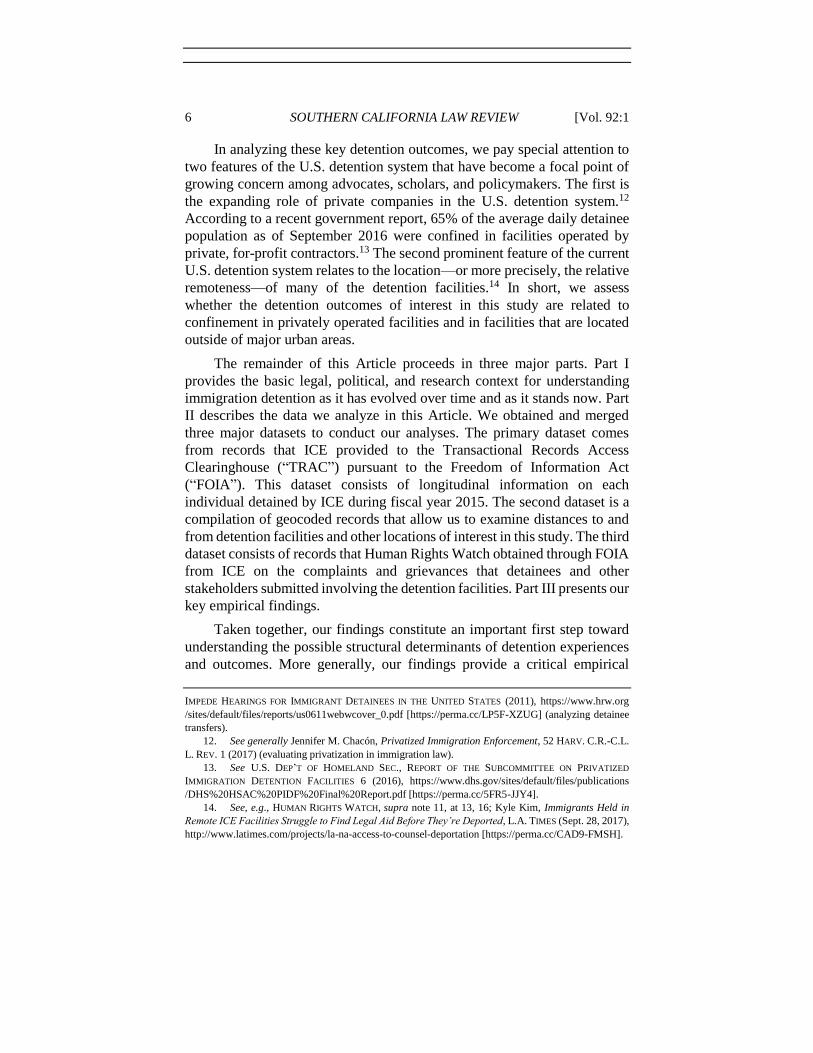
1994, an average of 6,785 noncitizens were detained on any given day. By
2014, that daily average had surpassed 33,200 (see Figure 1). The average
length of detention also increased during this time period, from twenty-six
days to thirty days.23 The DHS’s budget for fiscal year 2017 estimated an
average rate of $126.46 per day for adult detention beds and an average rate
of $161.36 per day for family detention beds.24
The Trump administration’s immigration enforcement policy seeks to
bring dramatic changes in the use and operation of immigration detention.
First, signaling a sharp departure from the Obama administration’s policy of
prioritizing noncitizens with criminal convictions for removal, the Trump
administration’s plan targets virtually all unauthorized immigrants
regardless of whether they have been convicted of a crime.25 This policy shift
has already resulted in increased removal rates of noncitizens without
criminal convictions.26 Second, the Trump administration seeks to detain all
noncitizens apprehended at the border pending their immigration
proceedings.
TO PRISON: THE POLITICS OF IMMIGRATION ENFORCEMENT IN POST–CIVIL RIGHTS AMERICA 73–74
(2016).
23. Containing Cost of Incarceration of Federal Prisoners and Detainees: Prisons and Related
Issues, Hearings Before a Subcomm. of the Comm. on Appropriations, 104th Cong. 1058 (1995)
(statement of James A. Puleo, Exec. Assoc. Comm’r, Immigration & Naturalization Serv.); U.S.
IMMIGRATION & CUSTOMS ENF’T, WEEKLY DEPARTURES AND DETENTION REPORT 5 (2016),
https://oversight.house.gov/wp-content/uploads/2016/07/ICE-Weekly-Departures-and-Detention-
Report1.pdf [https://perma.cc/5K8K-MVJ6].
24. U.S. DEP’T OF HOMELAND SEC., BUDGET-IN-BRIEF: FISCAL YEAR 2017 38 (2017),
https://www.dhs.gov/sites/default/files/publications/FY2017BIB.pdf [https://perma.cc/DY3R-4N8Q].
25. Exec. Order No. 13768, 82 Fed. Reg. 8799 (Jan. 25, 2017); Exec. Order No. 13767, 82 Fed.
Reg. 8793 (Jan. 25, 2017); Memorandum from John Kelly, supra note 7.
26. Between February and September of 2016, non–criminal removals were 41% of all removals.
That figure rose to 43% during the same time period in 2017. See U.S. Immigration & Customs Enf’t,
Fiscal Year 2017 ICE Enforcement and Removal Operations Report (Dec. 13, 2017),
https://www.ice.gov/removal-statistics/2017 (select “Local Statistics” tab; then view PDF of “Local
Statistics 2013–2016” for the 2016 statistics, and view PDF of “Local Statistics 2017” for the 2017
statistics).

2018] IMMIGRATION DETENTION 9
FIGURE 1. Average Number of INS/ICE Detainees per Day, FY 1994-2017
Notes: See ALISON SISKIN, CONG. RESEARCH SERV., IMMIGRATION-RELATED DETENTION:
CURRENT LEGISLATIVE ISSUES 11–12 (2004), https://digital.library.unt.edu/ark:/67531/
metacrs5951/m1/1/high_res_d/RL32369_2004Apr28.pdf [https://perma.cc/2VSR-BFQ5]
(providing 1994–2000 statistics); U.S. IMMIGRATION & CUSTOMS ENF’T, supra note 23, at 9
(providing 2001–2015 statistics); U.S. DEP’T OF HOMELAND SEC. & U.S. IMMIGRATION AND
CUSTOMS ENF’T, BUDGET OVERVIEW, FISCAL YEAR 2019 CONGRESSIONAL JUSTIFICATION 5
(2018), https://www.dhs.gov/sites/default/files/publications/U.S.%20Immigration%20and%
20Customs%20Enforcement.pdf [https://perma.cc/4P37-NCUG] (providing 2016–2017
statistics).
To implement these plans, President Trump has called for an allocation
of “all legally available resources” for the immediate construction, operation,
and control of detention facilities near the border with Mexico, or for the
establishment of contracts for such facilities.27 In June 2017, Thomas
Homan, the ICE Acting Director, stated that his budget for the fiscal year
2018 included nearly $4.9 billion to expand the average daily detained
population to over 51,000.28 According to the latest government statistics,
the overall book-ins to ICE detention declined in fiscal year 2017 due to a
decline in book-ins resulting from border apprehensions.29 However, the
27. Exec. Order No. 13767, 82 Fed. Reg. 8793 (Jan. 25, 2017); see also Exec. Order No. 13768,
82 Fed. Reg. 8799 (Jan. 25, 2017); Memorandum from John Kelly, supra note 7.
28. Regarding the Fiscal Year 2018 President’s Budget Request: Hearing Before the Subcomm.
on Homeland Sec. of the H. Comm. on Appropriations, 115th Cong. 3–4 (2017) (statement of Thomas
Homan, Acting Director, U.S. Immigration and Customs Enforcement), https://docs.house.gov/meetings
/AP/AP15/20170613/106057/HHRG-115-AP15-Wstate-HomanT-20170613.pdf [https://perma.cc
/QCA3-2RFZ].
29. U.S. DEP’T OF HOMELAND SEC., supra note 5, at 11; U.S. DEP’T OF HOMELAND SEC., CBP
6,7
85
7,4
75
9,0
11
11
,87
1
15
,44
7
17
,77
2
19
,45
8
20
,25
1
19
,92
2
21
,17
8
21
,92
8
19
,71
8
22
,97
5 30
,29
5
31
,66
2
32
,09
8
30
,88
5
33
,33
0
34
,26
0
33
,78
8
33
,22
7
28
,44
9 34
,37
6
38
,10
6
0
5,000
10,000
15,000
20,000
25,000
30,000
35,000
40,000
45,000
199
4
199
5
199
6
199
7
199
8
199
9
200
0
200
1
200
2
200
3
200
4
200
5
200
6
200
7
200
8
200
9
201
0
201
1
201
2
201
3
201
4
201
5
201
6
201
7
To
tal
Nu
mb
er
Fiscal Year

10 SOUTHERN CALIFORNIA LAW REVIEW [Vol. 92:1
initial book-ins resulting from ICE’s interior enforcement programs were
42% higher between January 20, 2017 and September 20, 2017 (the period
after President Trump took office), compared to the same time period in
fiscal year 2016.30
B. LEGAL AND POLICY FRAMEWORK
There are many aspects of immigration detention that make detention
indistinguishable from criminal incarceration.31 Yet the law considers
immigration detention to be strictly civil—that is, “nonpunitive and merely
preventative” in nature.32 Consequently, the basic legal protections that are
afforded to criminal defendants, such as the right to government-appointed
counsel, the privilege against self-incrimination, the ban on cruel and
unusual punishment, and the right to a speedy trial, are deemed to be
inapplicable in the immigration law context.33
Beyond the basic principle that detention is civil, the legal framework
governing immigration detention is exceedingly complex and has changed
over time. Below, we offer a broad overview of the current legal and policy
framework that governs basic aspects of immigration detention in the United
States. More specifically, our overview focuses on issues relating to which
classes of noncitizens may be detained, the locations where they may be held,
and the conditions of their confinement.
A number of provisions of the Immigration and Nationality Act
(“INA”) grant immigration officials the power to detain noncitizens for the
BORDER SECURITY REPORT: FISCAL YEAR 2017 1 (2017), https://www.cbp.gov/sites/default/files
/assets/documents/2017-Dec/cbp-border-security-report-fy2017.pdf [https://perma.cc/ERP5-L5PE]; see
also Nick Miroff, Arrests Along Mexico Border Drop Sharply Under Trump, New Statistics Show, WASH.
POST (Dec. 5, 2017), http://wapo.st/2Atmy6j?tid=ss_tw&utm_term=.53a99e255c63 [http://perma.cc
/9ST2-2PHD] (explaining that border apprehensions “show a sharp drop . . . immediately after President
Trump’s election win, possibly reflecting the deterrent effect of his rhetoric on would-be border crossers;
starting in May, the number of people taken into custody began increasing again”).
30. U.S. DEP’T OF HOMELAND SEC., supra note 5, at 10 fig. 10.
31. García Hernández, supra note 18, at 1370–71; Ryo, supra note 15, at 1024–34; Dora Schriro,
Improving Conditions of Confinement for Criminal Inmates and Immigrant Detainees, 47 AM. CRIM. L.
REV. 1441, 1442 (2010).
32. Rodriguez v. Robbins, 804 F.3d 1060, 1065 (9th Cir. 2015), rev’d sub nom. Jennings v.
Rodriguez, 138 S. Ct. 830 (2018).
33. AM. IMMIGRATION COUNCIL, TWO SYSTEMS OF JUSTICE: HOW THE IMMIGRATION SYSTEM
FALLS SHORT OF AMERICAN IDEALS OF JUSTICE 1 (2013), https://www.americanimmigrationcouncil.org
/sites/default/files/research/aic_twosystemsofjustice.pdf [https://perma.cc/L4HC-6JYR]; David Cole,
In Aid of Removal: Due Process Limits on Immigration Detention, 51 EMORY L.J. 1003, 1006–08 (2002);
Philip L. Torrey, Rethinking Immigration’s Mandatory Detention Regime: Politics, Profit, and the
Meaning of “Custody”, 48 U. MICH. J.L. REFORM 879, 880–81 (2015).
2018] IMMIGRATION DETENTION 11
purposes of immigration enforcement.34 First, under INA section 236(a), “an
alien may be arrested and detained pending a decision on whether the alien
is to be removed from the United States.”35 Because of the permissive
language of “may” used in this provision, section 236(a) is often referred to
as the discretionary detention provision of the INA. Noncitizens detained
under this provision may be released on conditional parole (also commonly
known as “release on recognizance”) or on a bond of at least $1,500.36
Noncitizens released under this provision, however, may be rearrested at any
time at the discretion of an authorized immigration official.37
Second, under what are often referred to as the mandatory detention
provisions of the INA, the Attorney General must detain, with limited
exceptions,38 certain classes of noncitizens pending their removal from the
United States. These noncitizens include: (1) most “arriving aliens;” (2)
noncitizens with certain criminal convictions; (3) suspected terrorists; and
(4) noncitizens with final orders of removal.39 An “arriving alien” generally
refers to an “applicant for admission,” such as an individual apprehended at
the border or a port of entry.40 As there are no statutory limits on how long a
noncitizen may be detained, and many noncitizens are detained for extended
periods of time, prolonged detention has been the focus of ongoing litigation
in federal courts.41
As to where the detainees may be held, INA section 241(g) states:
“The Attorney General shall arrange for appropriate places of detention for
aliens detained pending removal or a decision on removal.” This provision
further states:
When United States Government facilities are unavailable or facilities
34. For a helpful and more detailed discussion on the statutory framework and the categories of
noncitizens subject to detention, see Powers of the U.S. Government to Detain Noncitizens, 8 Immigr. L.
& Proc. (MB) §108.02 (2017).
35. Immigration and Nationality Act § 236(a), 8 U.S.C. § 1226(a) (2018).
36. Immigration and Nationality Act § 236(a)(2); see also Ortega-Cervantes v. Gonzales, 501 F.3d
1111, 1115 (9th Cir. 2007) (noting that “the phrase ‘release on recognizance’” is used “as another name
for ‘conditional parole’ under § 1226(a)”).
37. Immigration and Nationality Act § 236(b); see also 8 C.F.R. § 236.1(c)(9) (2018).
38. See generally Powers of the U.S. Government to Release Detained Noncitizens, 8 Immigr. L.
& Proc. (MB) §108.03 (2018) (discussing mandatory detention).
39. Immigration and Nationality Act §§ 235(b)(2)(A), 236(c), 236A(a), 241(a)(2).
40. 8 C.F.R. § 1.2 (2018). Arriving aliens subject to mandatory detention include individuals
seeking asylum pending a final determination of whether they demonstrate a credible fear of persecution.
Immigration and Nationality Act § 235(b)(1)(B)(iii)(IV).
41. See Legal Challenges to Detention, 8 Immigr. L. & Proc. (MB) §108.05 (2018). See generally
Farrin R. Anello, Due Process and Temporal Limits on Mandatory Immigration Detention, 65 HASTINGS
L.J. 363 (2014) (discussing federal courts’ treatment of prolonged detention); Philip L. Torrey, Jennings
v. Rodriguez and the Future of Immigration Detention, 20 HARV. LATINX L. REV. 171 (2017) (same).

12 SOUTHERN CALIFORNIA LAW REVIEW [Vol. 92:1
adapted or suitably located for detention are unavailable for rental,
the Attorney General may expend . . . amounts necessary to acquire land
and to acquire, build, remodel, repair, and operate facilities (including
living quarters for immigration officers if not otherwise available)
necessary for detention.42
One important issue related to where the detainees may be held is
whether and when detainees may be transferred from one facility to another.
On this question, the federal courts generally have interpreted INA
section 241(g) as providing the Attorney General broad discretion to transfer
the detainees as he or she “deems appropriate.”43 Thus, noncitizens have
been held where they initially were apprehended or transferred to remote and
distant facilities, including ones that are outside the jurisdiction of the
presiding court. In 2009, a report by the Office of Inspector General
concluded that such transfers have led to “errors, delays, and confusion for
detainees, their families, and legal representatives.”44 Around the same time,
Human Rights Watch published a report raising serious concerns about the
frequent transfers of large numbers of detainees to facilities that were far
away from where they lived.45 In response, ICE informed Human Rights
Watch that it intended to minimize transfers.46 In 2012, ICE released a policy
directive restricting detainee transfers to only those deemed to be
42. Immigration and Nationality Act § 241(g).
43. Avramenkov v. Immigration & Naturalization Serv., 99 F. Supp. 2d 210, 213 (D. Conn. 2000);
Comm. of Cent. Am. Refugees v. Immigration & Naturalization Serv., 682 F. Supp. 1055, 1064 (N.D.
Cal. 1988) (noting that “[t]he Attorney General has the authority, conferred by statute, to choose the
location for detention and to transfer aliens to that location. . . . Such a transfer, standing alone, does not
constitute a violation of plaintiffs’ due process or statutory rights”); see also Rady v. Ashcroft, 193 F.
Supp. 2d. 454, 456–57 (D. Conn. 2002) (same); Sasso v. Milhollan, 735 F. Supp. 1045, 1048 (S.D. Fla.
1990) (same). But see César Cuauhtémoc García Hernández, Due Process and Immigrant Detainee
Prison Transfers: Moving LPRs to Isolated Prisons Violates Their Right to Counsel, 21 BERKELEY LA
RAZA L.J. 17, 17 (2011) (arguing that the transfer of lawful permanent residents from one detention
facility to another “frequently violates the Fifth Amendment’s due process right to counsel for lawful
permanent residents”).
44. OFFICE OF INSPECTOR GEN., U.S. DEP’T OF HOMELAND SEC., OIG-10-13, IMMIGRATION AND
CUSTOMS ENFORCEMENT POLICIES AND PROCEDURES RELATED TO DETAINEE TRANSFERS 1 (2009),
https://www.oig.dhs.gov/assets/Mgmt/OIG_10-13_Nov09.pdf [https://perma.cc/H934-Y9XN].
45. See HUMAN RIGHTS WATCH, LOCKED UP FAR AWAY: THE TRANSFER OF IMMIGRANTS TO
REMOTE DETENTION CENTERS IN THE UNITED STATES (2009), https://www.hrw.org/sites/default/files
/reports/us1209webwcover.pdf [https://perma.cc/J2WB-LXX3]. For an updated Human Rights Watch
report on transfers, see HUMAN RIGHTS WATCH, supra note 11.
46. See Letter from Phyllis A. Coven, Acting Dir., U.S. Immigration & Customs Enf’t, to Alison
Parker, Deputy Dir., U.S. Program, Human Rights Watch (Feb. 22, 2010), https://www.hrw.org/sites
/default/files/related_material/Coven%20to%20HRW%20Feb%202010.pdf [https://perma.cc/LF2N-
KNFF]. In 2011, ICE revised the transfer provisions in its Performance-Based National Detention
Standards. See U.S. IMMIGRATION & CUSTOMS ENF’T, PERFORMANCE-BASED NATIONAL DETENTION
STANDARDS 2011, at 443–50 (2013), https://www.ice.gov/doclib/detention-standards/2011/pbnds2011
.pdf [https://perma.cc/RQF6-JSFZ].

2018] IMMIGRATION DETENTION 13
“necessary” under a specific set of circumstances.47 In practice, legal
advocates continue to report that “often ICE does not follow its policy
memorandum and instead bases the location of detention on bed space
availability.”48
As to the type of detention facilities used by ICE, the DHS recognized
in 2009 that most immigrant detainees were confined in facilities that were
“either jails operated by county authorities or detention centers operated by
private contractors.”49 The DHS also recognized that these facilities were
“largely designed for penal, not civil, detention.”50 The DHS announced an
overhaul of this system with the creation of the Office of Detention Policy
and Planning (“ODPP”). The announcement stated that ICE would move
away from its reliance on penal institutions to confine immigrant detainees
and instead, design “a new civil detention system.”51
In 2016, in the aftermath of the DOJ’s decision to phase out private for-
profit prisons from the federal correctional system,52 the Homeland Security
Advisory Council considered whether the same phase-out ought to be
implemented in the immigration detention system.53 The Advisory Council’s
report, however, concluded: “Fiscal considerations, combined with the need
for realistic capacity to handle sudden increases in detention, indicate that
DHS’s use of private for-profit detention will continue.”54 This conclusion
was the subject of a contentious debate among the Council members,
resulting in almost three-fourths of the Council members concurring with
one Council member’s view that the federal government should take a
“measured but deliberate shift away from the private prison model.”55
47. See U.S. IMMIGRATION & CUSTOMS ENF’T, POLICY 11022.1: DETAINEE TRANSFERS 3 (2012),
https://www.ice.gov/doclib/detention-reform/pdf/hd-detainee-transfers.pdf [https://perma.cc/R7ME-
ZN6J].
48. MARIA BALDINI-POTERMIN, § 3:3 ICE Office of Chief Counsel, in IMMIGRATION TRIAL
HANDBOOK (2017).
49. 2009 Immigration Detention Reforms, U.S. IMMIGR. & CUSTOMS ENFORCEMENT (Dec. 12,
2011), https://www.ice.gov/factsheets/2009detention-reform [https://perma.cc/9JZS-QGMW].
50. Id.
51. Id.
52. Memorandum from Sally Q. Yates, Deputy Attorney Gen., to the Acting Dir., Fed. Bureau of
Prisons (Aug. 18, 2016), https://www.justice.gov/archives/opa/file/886311/download [https://perma.cc
/8BB3-CAXE].
53. See Letter from Tom Carper, Ranking Member of Permanent Subcomm. on Investigations, &
Kamala D. Harris, U.S. Senator, to John F. Kelly, U.S. Sec’y of Homeland Sec. (May 15, 2017),
https://www.carper.senate.gov/public/_cache/files/73576fda-9990-46b4-86d3-b492a26336d3/2017-05-
15-carper-and-harris-letter-to-dhs-re-private-prisons-press-.pdf [https://perma.cc/H9LM-7NQ3].
54. U.S. DEP’T OF HOMELAND SEC., supra note 13, at 2.
55. Id. at 2, 11 n.14; see also Matt Zapotosky, Justice Department Will Again Use Private Prisons,
WASH. POST, Feb. 24, 2017, at A4.

14 SOUTHERN CALIFORNIA LAW REVIEW [Vol. 92:1
The treatment of detainees and their conditions of confinement are
governed by a number of different ICE detention standards. Three versions
of the standards are currently in use across various facilities throughout the
United States, depending on the type of facility and the terms of the facilities’
respective contracts with ICE.56 These standards include the 2000 National
Detention Standards (“NDS”), and the 2008 and 2011 Performance-Based
National Detention Standards (“PBNDS”).57 None of these standards are
legally enforceable regulations. As the U.S. Commission on Civil Rights has
concluded, the nonbinding nature of these standards often means that the
“facilities are not held accountable when they fail to maintain or meet these
standards—at times with tragic results.”58
A detailed review of the specific issues related to the conditions of
confinement and the treatment of detainees is beyond the scope of this
Article. As we noted earlier, however, these issues are manifold, ongoing,
and broad ranging. The Office of the Inspector General underscored this
point in reaching the following conclusion in its December 2017 report based
on its unannounced inspections of several detention facilities: “Overall, the
problems we identified undermine the protection of detainees’ rights, their
humane treatment, and the provision of a safe and healthy environment.”59
C. RESEARCH ON DETENTION
The existing research on immigration detention offers another
important context for our empirical analysis. The extant body of research is
varied in approach and wide-ranging in focus. A longstanding body of legal
scholarship has analyzed statutory, constitutional, doctrinal, and policy
issues related to immigration detention, particularly mandatory detention.60
56. See U.S. COMM’N ON CIVIL RIGHTS, WITH LIBERTY AND JUSTICE FOR ALL: THE STATE OF
CIVIL RIGHTS AT IMMIGRATION DETENTION FACILITIES 25 (2015), https://www.usccr.gov/pubs/docs
/Statutory_Enforcement_Report2015.pdf [https://perma.cc/38Q3-BMFY]; OFFICE OF INSPECTOR GEN.,
U.S. DEP’T OF HOMELAND SEC., OIG-18-32, CONCERNS ABOUT ICE DETAINEE TREATMENT AND CARE
AT DETENTION FACILITIES 1 (2017), https://www.oig.dhs.gov/sites/default/files/assets/2017-12/OIG-18-
32-Dec17.pdf [https://perma.cc/ZPM7-32Z2].
57. See U.S. IMMIGRATION & CUSTOMS ENF’T, 2000 Detention Operations Manual,
https://www.ice.gov/detention-standards/2000 [https://perma.cc/6WCB-2E2X] (last updated July 12,
2017); U.S. IMMIGRATION & CUSTOMS ENF’T, 2008 Operations Manual ICE Performance-Based
National Detention Standards, https://www.ice.gov/detention-standards/2008 [https://perma.cc/PM2E-
KM8R] (last updated July 12, 2017); U.S. IMMIGRATION & CUSTOMS ENF’T, 2011 Operations Manual
ICE Performance-Based National Detention Standards, https://www.ice.gov/detention-standards/2011
[https://perma.cc/8EAZ-LREM] (last updated Jan. 3, 2018).
58. U.S. COMM’N ON CIVIL RIGHTS, supra note 56, at 25.
59. OFFICE OF INSPECTOR GEN., U.S. DEP’T OF HOMELAND SEC., supra note 56, at 3.
60. See generally, e.g., Cole, supra note 33 (discussing constitutional limitations on immigration
detention); Alina Das, Immigration Detention: Information Gaps and Institutional Barriers to Reform,

2018] IMMIGRATION DETENTION 15
Complementing this legal scholarship is a relatively small, but growing,
body of scholarship from multiple disciplines that illuminates the history,
politics, and social realities of immigration detention.61 Finally, there is a
nascent body of socio-legal scholarship that brings empirical analysis to bear
upon legal and policy issues related to immigration detention.62
A number of themes have emerged as focal points of inquiry across
these related albeit disparate bodies of research. Here, we focus on the
research on the political economy of detention. By political economy, we
mean the confluence of political and economic forces that determine the
emergence, location, and the locus of governance and power over the
immigration detention infrastructure. An important point of inquiry in this
area of research has been the increasing privatization of immigration
enforcement, which involves the delegation of enforcement powers—a
traditional government function—to private actors.
That detention has become a core topic of investigation for researchers
concerned with the privatization of immigration enforcement is unsurprising,
given the expanded role of for-profit companies in the construction and
operation of immigration detention facilities across the United States.63 Due
largely to data limitations, evidence is mixed on the precise role of privatized
80 U. CHI. L. REV. 137 (2013) (discussing policy issues related to immigration detention); García
Hernández, supra note 3 (examining the legal and political decisions that affect immigration detention);
Stephen H. Legomsky, The Detention of Aliens: Theories, Rules, and Discretion, 30 U. MIAMI INTER-
AM. L. REV. 531 (1999) (discussing detention decisions); Margaret H. Taylor, Dangerous by Decree:
Detention Without Bond in Immigration Proceedings, 50 LOY. L. REV. 149 (2004) (examining the
executive branch’s legal authority for immigration detention without bond).
61. See generally, e.g., Robert Barde & Gustavo J. Bobonis, Detention at Angel Island: First
Empirical Evidence, 30 SOC. SCI. HIST. 103 (2006) (analyzing immigration detention at San Francisco’s
Angel Immigration Station from 1913 to 1919); Kalina Brabeck & Qingwen Xu, The Impact of Detention
and Deportation on Latino Immigrant Children and Families: A Quantitative Exploration, 32 HISP. J.
BEHAV. SCI. 341 (2010) (analyzing immigration detention’s impact on immigrant families); Nancy
Hiemstra & Deirdre Conlon, Beyond Privatization: Bureaucratization and the Spatialities of Immigration
Detention Expansion, 5 TERRITORY, POL., GOVERNANCE 252 (2017) (exploring the role of
beauracratization in immigration detention’s expansion); Luis H. Zayas et al., The Distress of Citizen-
Children with Detained and Deported Parents, 24 J. CHILD & FAM. STUD. 3213 (2015) (exploring the
impact of immigration detention on immigrant children).
62. See generally, e.g., Ingrid V. Eagly, Remote Adjudication in Immigration, 109 NW. L. REV.
933 (2015) (examining the role of remote adjudication in immigration cases); Kerwin et al., supra note
10 (analyzing nationwide detention data for a single night and arguing the federal government should
work to provide this data more broadly and consistently); Emily Ryo, Legal Attitudes of Immigrant
Detainees, 51 LAW & SOC’Y REV. 99 (2017) (examining immigrant detainees’ legal attitudes); Emily
Ryo, Representing Immigrants: The Role of Lawyers in Immigration Bond Hearings, 52 LAW & SOC’Y
REV. 503 (2018) (investigating the role of lawyers in immigration bond hearings); Emily Ryo, Predicting
Danger in Immigration Courts, LAW & SOC. INQUIRY (forthcoming 2018) (analyzing immigration
judges’ decisions on dangerousness in bond hearings).
63. See, e.g., Hiemstra & Conlon, supra note 61; Torrey, supra note 33.

16 SOUTHERN CALIFORNIA LAW REVIEW [Vol. 92:1
detention in shaping detention experiences and outcomes. On the one hand,
Jennifer Chacón, in her recent analysis of the critiques of privatized
detention, has concluded that currently, systematic evidence is lacking on
whether detainees are worse off in privately operated facilities compared to
public facilities.64 On the other hand, Denise Gilman and Luis Romero have
argued that privatization fuels profit-seeking dynamics that distort decisions
regarding whether to detain, where to detain, and for how long.65
Research on the political economy of detention has also focused on the
centrality of geopolitics in structuring detention experiences and outcomes.
Alison Mountz, for example, has argued that the practice of holding
detainees in remote locations that are outside and distant from urban areas
leads to separation from family, community, and legal support networks that
are critical to the detainees’ chances of achieving favorable case outcomes.66
Furthermore, Lauren Martin has argued that ICE “is acutely aware of
detainees’ relationships to surrounding communities,” and considers
proximity to such communities and their supporting institutions as a negative
trait in selecting detention sites.67
Taken together, the foregoing discussion of the key themes in detention
law, policies, and research raises fundamental questions about who the
detainees are, where they are held, and what happens to them once they are
detained. We now turn to our analysis in which we investigate these issues
using a national dataset on individuals held in immigration detention by ICE
during fiscal year 2015.
II. THE CURRENT STUDY
A. DATA
We compiled a number of datasets for this study. Together, these
datasets represent the most comprehensive national-level data to date on U.S.
64. Chacón, supra note 12, at 31–32.
65. Denise Gilman & Luis A. Romero, Immigration Detention, Inc. 6 J. ON MIGRATION & HUM.
SECURITY 145 passim (2018).
66. Alison Mountz, Mapping Remote Detention: Dis/location through Isolation, in BEYOND
WALLS AND CAGES: PRISONS, BORDERS, AND GLOBAL CRISIS 91, 99–100 (Jenna M. Lloyd et al. eds.,
2012).
67. Lauren L. Martin, ‘Catch and Remove’: Detention, Deterrence, and Discipline in US
Noncitizen Family Detention Practice, 17 GEOPOLITICS 312, 326 (2012). Of note, studies have found that
legal service organizations are one such supporting institution whose involvement is consistently related
to more favorable outcomes in custody redetermination hearings—an essential release mechanism from
detention. Eagly & Shafer, supra note 10; Emily Ryo, Detained: A Study of Immigration Bond Hearings,
50 LAW & SOC’Y REV. 117 (2016); Ryo, Representing Immigrants, supra note 62.

2018] IMMIGRATION DETENTION 17
immigration detention. We discuss each of these data sources and their
limitations, followed by a brief discussion of our analytical strategy.
1. Detention Data
The primary dataset consists of individual-level longitudinal data on
each individual, including juveniles, detained by ICE during fiscal year 2015
(“Detention Data”).68 TRAC obtained the Detention Data from ICE with
public records requests. To our knowledge, 2015 is the latest and the only
fiscal year that the federal government has released individual-level data of
this kind on immigration detention.69 TRAC is currently awaiting ICE’s
response to its request for more recent detention data.
For each detainee, ICE generated a new record each time the detainee
was booked into a facility. We treat each record as a new “stint” in detention.
If an individual had been booked into a facility only once during the course
of his detention, that detainee would have only one record pertaining to that
detention stint. On the other hand, if an individual had been booked into a
facility, subsequently transferred to another facility, and then released from
the second facility on parole, that detainee would have a total of two records
pertaining to two detention stints. The first record would have the release
reason (“Release Type” variable in the Detention Data) of “transferred,” and
the second record would have the release reason of “paroled.”
To be included in the Detention Data, the individual must have been
detained at some point during fiscal year 2015, but his or her detention need
not have begun nor ended in fiscal year 2015. For individuals who entered
detention before fiscal year 2015, some of their records in the Detention Data
pre-date fiscal year 2015. For individuals whose detention continued beyond
fiscal year 2015, we do not observe what happened to them and their records
are right censored. A total of 38,796 records are right censored in the
Detention Data.
We undertook a number of steps to clean and prepare the data for
analysis, including deleting duplicate or redundant records. The Methods
Appendix describes each of these steps. Our data cleaning and preparation
resulted in 734,709 records pertaining to 355,729 detainees, including
68. Fiscal year 2015 began on October 1, 2014 and ended on September 30, 2015. The Detention
Data, however, contains information on sixty-one detainees who were released on October 13, 2015,
indicating that the last date of the data extraction by ICE was October 13, 2015.
69. Although TRAC obtained similar data from ICE pertaining to fiscal years 2013, 2014, and
2016, ICE produced these data in such a way that they are not amenable to meaningful analysis. For
example, some of the data are missing a large set of records, while others contain a large set of seemingly
duplicate records that cannot be identified accurately as duplicates.

18 SOUTHERN CALIFORNIA LAW REVIEW [Vol. 92:1
juveniles and adults, and 679 detention facilities.70 For each detention
facility in the Detention Data, we collected information from a number of
sources to determine the facility’s address and whether the facility was
operated by a private for-profit company. The Methods Appendix contains
detailed information on our coding process.
2. Geocoded Data
We generated a geocoded dataset specifically for the purposes of this
study (“Geocoded Data”). To create this dataset, we compiled and merged
three distinct record sets. The first set of records consists of a comprehensive
list of facility dyads that we produced, with each dyad consisting of pairings
of all facilities involved in inter-facility transfers.
The second set of records pertains to the metropolitan statistical areas
(“MSAs”) and their principal cities. The U.S. Office of Management and
Budget (“OMB”) defines MSAs as consisting of “at least one urbanized area
that has a population of at least 50,000.”71 About 85% of the U.S. population
live in MSAs.72 Given the expansive coverage of MSAs, we sought a
narrower definition of major urban areas for the purposes of this study. The
largest city in each MSA is called a principal city.73 According to the OMB,
principal cities constitute “the more significant places in each [MSA] . . . in
terms of population and employment.”74 Thus, we define major urban areas
in this study as the principal cities in MSAs.75
70. As discussed earlier, some of the records in the Detention Data predate fiscal year 2015; 679
facilities pertain to all of the records in the Detention Data, including the records that predate fiscal year
2015.
71. OFFICE OF MGMT. & BUDGET, 2010 STANDARDS FOR DELINEATING METROPOLITAN AND
MICROPOLITAN STATISTICAL AREAS; NOTICE, 75 Fed. Reg. 37246, 37252 (June 28, 2010),
https://obamawhitehouse.archives.gov/sites/default/files/omb/assets/fedreg_2010/06282010_metro_stan
dards-Complete.pdf [https://perma.cc/K63B-WWG8]. The basic idea behind MSAs is “to represent a city
or group of cities and its surrounding built-up and/or economically integrated region.” John E. Farley,
Metropolitan Statistical Area, in THE BLACKWELL ENCYCLOPEDIA OF SOCIOLOGY 2993 (George Ritzer
et al. eds., 2007).
72. Bulletin from Shaun Donovan, Dir., Exec. Office of the President, Office of Mgmt. & Budget,
to the Heads of Exec. Dep’ts & Establishments, OMB Bulletin No. 15-01, at app. 2 (July 15, 2015),
https://www.whitehouse.gov/sites/whitehouse.gov/files/omb/bulletins/2015/15-01.pdf [https://perma.cc
/35WN-EDSG].
73. U.S. CENSUS BUREAU, Metropolitan and Micropolitan, https://www.census.gov/programs-
surveys/metro-micro/about.html [https://perma.cc/AD3L-YAT5] (last updated Oct. 15, 2018).
74. Bulletin from Jeffrey D. Zients, Deputy Dir. for Mgmt., Exec. Office of the President, Office
of Mgmt. & Budget, to the Heads of Exec. Dep’ts & Establishments, OMB Bulletin No. 13-01, at app. 3
(Feb. 28, 2013), https://www.whitehouse.gov/sites/whitehouse.gov/files/omb/bulletins/2013/b13-01.pdf
[https://perma.cc/H9AB-KXRP].
75. We used the U.S. Office of Management and Budget’s (“OMB”) February 2013 delineation of
metropolitan statistical areas (“MSAs”) and principal cities for our coding purposes, as doing so allowed

2018] IMMIGRATION DETENTION 19
The third set of records pertains to immigration attorneys who are
members of the American Immigration Lawyers Association (“AILA”).
AILA is a national association of attorneys who practice or teach
immigration law. AILA was founded in 1947 and currently has more than
15,000 members. The AILA membership data contains information on
attorneys in wide-ranging practice settings, including law firms of various
sizes, nonprofit organizations, and law schools. We geocoded the office
addresses of all attorneys who were active members of AILA during fiscal
year 2015 and whose practice area included removal defense. Given that
many immigrants often lack resources to hire private attorneys, this study
focuses on AILA attorneys who work at legal services/nonprofit
organizations or law schools.
We also collected and coded information pertaining to the accredited
representatives in the Executive Office for Immigration Review’s (“EOIR”)
Recognition and Accreditation Program.76 The EOIR, under the jurisdiction
of the DOJ, oversees the immigration courts. The accredited representatives
in the Recognition and Accreditation Program can assist noncitizens in
immigration proceedings.77
We geocoded the addresses found in each record set discussed above to
convert the addresses into geocoordinates. Using these geocoordinates, we
produced the following measures: (1) driving distance between each
detention facility and the nearest principal city within an MSA; (2) driving
distance between each detention facility and the nearest nonprofit
immigration attorney and the nearest EOIR accredited representative; and
(3) driving distance between the facilities involved in inter-facility transfers.
Of note, many geographic studies use straight-line distance measures instead
of driving distance measures. This practice arose largely due to the relative
ease of calculating straight-line distances, rather than due to any substantive
us to identify the location of each facility in the Detention Data with respect to the principal cities at the
beginning of fiscal year 2015. See id.
76. See Exec. Office for Immigration Review, Recognition & Accreditation (R&A) Program, U.S.
DEP’T OF JUSTICE, https://www.justice.gov/eoir/recognition-and-accreditation-program [https://perma
.cc/7YQ6-T467] (last updated Oct. 5, 2018). We used the list that appears on the archived Executive
Office for Immigration Review (“EOIR”) website, which was updated on September 7, 2015. Exec.
Office for Immigration Review, Accredited Representatives Roster, U.S. DEP’T OF JUSTICE (Sept. 7,
2015), https://www.justice.gov/sites/default/files/pages/attachments/2015/09/08/raroster-reps.pdf [https:
//perma.cc/3GMD-FDF6].
77. 8 C.F.R. § 1292.1(a)(4) (2018); see also OFFICE OF THE CHIEF IMMIGRATION JUDGE, EXEC.
OFFICE FOR IMMIGRATION REVIEW, U.S. DEP’T OF JUSTICE, IMMIGRATION COURT PRACTICE MANUAL
31 (Nov. 2, 2017), https://www.justice.gov/sites/default/files/pages/attachments/2017/11/02
/practicemanual.pdf [https://perma.cc/KJA6-8V45].

20 SOUTHERN CALIFORNIA LAW REVIEW [Vol. 92:1
reasons.78 In the Methods Appendix, we describe the basic difference
between these two types of distance measures and explain why the use of
driving distance is more appropriate for this study.
3. Grievance Data
The third dataset we analyze consists of calls that the ICE Office of
Enforcement and Removal Operations’ (“ERO”) Detention Reporting and
Information Line (“DRIL”) received from detainees and community
members during fiscal year 2015 that relate to specific detention facilities.79
Human Rights Watch obtained these records from ICE pursuant to a FOIA
request. The records request stated: “HRW requests information relating to
the incidence of and response to all complaints or grievances with regards to
the complainant or another individual, in ICE detention facilities from fiscal
year 2013 through the present.” In light of this request language, we treat the
calls as a measure of facility-related grievances in this study.
The original data relating to grievances that Human Rights Watch
received from ICE contained a total of 48,849 grievances pertaining to
specific detention facilities. Matching these facilities to the facilities in the
Detention Data and restricting the sample to only those facilities used by ICE
in fiscal year 2015 produced 47,145 grievances pertaining to 304 facilities.
The DRIL initiative, launched in September of 2012, is “a toll-free
service that provides a direct channel for agency stakeholders to
communicate directly with ERO to answer questions and resolve
concerns.”80 Stakeholders include “individuals in ICE custody, the public,
non-governmental organizations, faith-based organizations, academic
institutions, attorneys, and advocacy groups.”81 In the summary information
accompanying its records production to Human Rights Watch, ICE noted
that DRIL “does not directly investigate complaints nor does it provide
outcomes for investigated complaints.” However, “[s]ome of the call
concerns (complaints) are routed to field offices for review.” In addition, “[a]
small number of calls are routed to the ICE Office of Professional
Responsibility for assessment and possible investigation.”
78. See generally Francis P. Boscoe et al., A Nationwide Comparison of Driving Distance Versus
Straight-Line Distance to Hospitals, 64 PROF. GEOGRAPHER 188 (2012).
79. In a note accompanying the records production, ICE indicated that records without detention
facility names are calls that did not directly pertain to detention facilities. We did not include these calls
in our analysis.
80. U.S. Immigration & Customs Enf’t, ICE ERO Detention Reporting and Information Line,
(May 1, 2017), https://www.ice.gov/contact/detention-information-line [https://perma.cc/B5CJ-GQZ7].
81. Id.

2018] IMMIGRATION DETENTION 21
It is important to note that DRIL is only one mechanism through which
detainees and community members can report grievances related to detention
facilities.82 Nonetheless, DRIL is an important source of information on
facility-related grievances given that detainees may be more likely to be
aware of its existence than other reporting mechanisms. For example, ICE
has created an information poster for distribution to detention facilities that
contains DRIL contact information for reporting concerns.83 A more
comprehensive analysis of all grievances is difficult, if not impossible, for
the reasons that we discuss later.
The Grievance Data contains information about the subject matter of
the grievances, names of the facilities to which the grievances pertain, and
the number of grievances per facility. ICE classified the subject matters of
the grievances into the following broad categories: (1) calls related to
physical and/or sexual abuse; (2) calls related to serious mental disorder or
condition; (3) calls related to separation from minor child or other dependent
or parental related issues; and (4) calls related to any other category. The
Grievance Data contains information at the level of facilities, rather than at
the level of individual detainees.
B. ANALYTICAL APPROACH
We begin our analysis by examining descriptive statistics on the
detainee characteristics, detention facility characteristics, and detention
outcomes. We then examine each of the three major detention outcomes of
interest in this study: detention length, inter-facility transfers, and
grievances. As we describe below, our analysis of detention outcomes
primarily focuses on adult detainees given that juveniles are situated
differently in the detention system.84
We first examine various bivariate relationships, such as the
relationship between confinement in a privately operated facility and
detention length. We then assess whether the bivariate patterns we find are
robust to the inclusion of various covariates by conducting multivariate
regression analyses. For our multivariate regression analyses of detention
82. See U.S. GOV’T ACCOUNTABILITY OFFICE, IMMIGRATION DETENTION: ADDITIONAL ACTIONS
NEEDED TO STRENGTHEN MANAGEMENT AND OVERSIGHT OF DETAINEE MEDICAL CARE, GAO-16-231,
at 11 (2016), https://www.gao.gov/assets/680/675484.pdf [https://perma.cc/6VN6-BS5Z].
83. See U.S. IMMIGRATION & CUSTOMS ENF’T, ICE DETENTION REPORTING AND INFORMATION
LINE (2017), https://www.ice.gov/sites/default/files/documents/Document/2015/DRIL_helpline_flyer
_community.pdf [https://perma.cc/7VQE-Y5PL].
84. Cf. Eagly & Shafer, supra note 10, at 89 (removing juvenile cases in analyzing case outcomes
and discussing other researchers’ decisions to do the same).

22 SOUTHERN CALIFORNIA LAW REVIEW [Vol. 92:1
length, we use parametric survival models based on the Weibull distribution.
For the multivariate regression analyses of transfers, we use parametric
survival models based on the lognormal distribution. We selected Weibull
and lognormal models based on a series of tests of model fit.85 We fit the
Weibull and lognormal models, respectively, in the accelerated failure-time
metric (“AFT”) rather than in the hazard rate metric. The AFT model takes
the form:
log(T) = β0 + β1x1 + … + βpxp + log(ε), (1)
in which T is the time-to-event (the “failure time”); x1, . . . ,xp are predictor
variables with β regression coefficients; ε is the error term. In the detention-
length analysis, the “failure” or the event of interest is obtaining release from
detention. In the transfer analysis, the “failure” or the event of interest is
experiencing a transfer.
For our multivariate regression analyses of grievances, we use negative
binomial models. Negative binomial regression belongs to a family of
generalized linear models in which the dependent variable is a count of the
number of times an event occurs.86 The negative binomial model takes the
form:
log λi = β0 + β1xi1 + … + βkxik + σεi, (2)
in which λi is the expected count of grievances for facility i, xi1, . . . , xik are
the predictor variables at the facility level with β regression coefficients, and
εi is the error term.
III. KEY EMPIRICAL FINDINGS
To understand who the detainees are, where they were held, and what
happened to them, we examine: (1) detainee characteristics; (2) facility
characteristics; and (3) detention outcomes. Appendix Table A contains a
detailed description of all of the measures that we analyze below.
85. To determine which possible functional forms best fit our data, we estimated the empirical
Nelson-Aalen cumulative hazard function and plotted it against the cumulative hazard of the Cox-Snell
residuals, which should be a straight 45o line if the model fit the data well. We also examined the Akaike
information criterion and the Bayesian information criterion, two conventional information-based criteria
that assess model fit. We compared the results of these two diagnostic assessments across five different
types of survival models, Cox, Weibull, exponential, lognormal, and loglogistic, and found that Weibull
and lognormal models best fit our data. See MARIO CLEVES ET AL., AN INTRODUCTION TO SURVIVAL
ANALYSIS USING STATA 221–25 (3d ed. 2016).
86. Negative binomial regression is a generalization of Poisson regression with an extra parameter
to model overdispersion, which occurs when the conditional variance exceeds the conditional mean. See
JOSEPH M. HILBE, NEGATIVE BINOMIAL REGRESSION 1–5 (2d ed. 2011).

2018] IMMIGRATION DETENTION 23
A. DETAINEE CHARACTERISTICS
The ICE Detention Data contains records for 355,729 unique
individuals. Who are these detainees? To address this question, we examine
a number of detainee characteristics, including gender, country of
citizenship, age, legal status at the time of last entry into the United States
(“entry status”), and whether ICE classified the individual as an aggravated
felon. Table 1 contains summary statistics on each of these characteristics
for the entire detained population.
TABLE 1. Characteristics of Individuals Detained by ICE in FY2015
Variables Percentage/Mean Min Max
Gender
Male 79.39 0 1
Region of Origin
Africa 1.47 0 1
Asia Pacific 3.33 0 1
Europe & North America 1.10 0 1
Mexico 42.58 0 1
Northern Trianglea 46.02 0 1
Latin America 5.48 0 1
Age at First Entry into Detention
Less than 18 Years Old 16.59 0 1
18–30 Years Old 42.47 0 1
31–40 Years Old 25.66 0 1
41–50 Years Old 11.43 0 1
Over 50 Years Old 3.84 0 1
Population Mean (SD)b 28.34 (11.93) 0 89
Entry Status
Seeking Asylum/Refugee 6.85 0 1
Lawful Permanent Resident 1.59 0 1
Present without Admission 64.94 0 1
(continued on next page)

24 SOUTHERN CALIFORNIA LAW REVIEW [Vol. 92:1
TABLE 1. Characteristics of Individuals Detained by ICE in FY2015
Variables Percentage/Mean Min Max
Other/Unknown 26.63 0 1
Criminal History
Has an Aggravated Felony 0.74 0 1
Notes: N=355,729 detainees. a Northern Triangle region consists of El Salvador, Guatemala,
and Honduras. b Median Age at First Entry into Detention is 28.
Table 1 shows that men constituted about 79% of the detainee
population. In terms of the region of origin,87 Mexican nationals by
themselves made up about 43% of the detainee population, and individuals
from the Northern Triangle region of El Salvador, Guatemala, and Honduras,
made up about 46% of the detainee population. Together, individuals from
Mexico and Northern Triangle regions added up to 89% of the detainee
population. Individuals from the rest of Latin America constituted about 5%
of the detainee population, followed by individuals from Asia Pacific (3%),
Africa (1%), and Europe and North America (together, 1%). Appendix Table
B shows the top fifteen countries of citizenship.
Approximately 17% of the population were juveniles (under 18 years
old). Adults between the ages 18 to 30 made up the largest segment of the
population (42%), followed by adults between the ages 31 to 40 (26%). The
population as a whole was relatively young, with mean and median ages of
28.
The ICE Detention Data contains thirty-five entry status categories.
These entry status categories refer to the detainees’ legal status at their last
entry into the United States. Given the relatively small sizes of many of these
categories, we collapsed them into four broad categories of
“asylum/refugee,” “lawful permanent resident,” “present without
admission,” and “other/unknown.” Table 1 shows that a majority of the
detainees were classified as present without admission (65%).
The Detention Data includes information about the detainee’s criminal
history, including whether the detainee had convictions that were considered
aggravated felonies. As we discussed earlier, an aggravated felony is a legal
term of art in immigration law that refers to a growing host of criminal
87. We generally followed the United Nations’ classification system to sort the countries of
citizenship in the Detention Data into major world regions. See UNITED NATIONS, METHODOLOGY:
STANDARD COUNTRY OR AREA CODES FOR STATISTICAL USE (M49), https://unstats.un.org/unsd
/methodology/m49 [https://perma.cc/6YEL-GM9S].

2018] IMMIGRATION DETENTION 25
offenses that trigger removal proceedings. Only 1% of the detainee
population was classified as having an aggravated felony conviction. The
Detention Data also contains information about the detainee’s “most serious
criminal conviction,” if any. Because our analysis suggests that ICE did not
capture information on this variable for a large proportion of the detainee
population,88 we do not further analyze this variable.
B. DETENTION FACILITY CHARACTERISTICS
The Detention Data indicates that in fiscal year 2015, ICE used 638
facilities to detain individuals, including juveniles.89 Of the 638 facilities,
565 were used to detain adults in fiscal year 2015. Where were the 638
facilities located and what were their characteristics? We begin by
considering the geographical location of the facilities. As shown in Figure 2,
every state in the United States had at least one detention facility. Although
not shown in Figure 2, the following U.S. territories also had at least one
detention facility: Guam, Puerto Rico, the Northern Mariana Islands, and the
Virgin Islands.90 As shown in Appendix Table C, the top five states in terms
of the total number of facilities were: Texas (115 facilities), California (70
facilities), Florida (43 facilities), New York (39 facilities), and Arizona (33
facilities).
88. About 63% of detainees who were designated as having an aggravated felony were missing on
the “most serious criminal conviction” variable.
89. As we noted earlier, the Detention Data is longitudinal and contains information about the
individual detention stints of all individuals detained in fiscal year 2015. Some of these detention stints
occurred before fiscal year 2015 and in facilities that were not used by ICE in fiscal year 2015.
90. Of the facilities in U.S. territories, seven were in Puerto Rico, three in Guam, two in the Virgin
Islands, and one in Northern Mariana Islands.

26 SOUTHERN CALIFORNIA LAW REVIEW [Vol. 92:1
FIGURE 2. Number of Detention Facilities Used by ICE in FY2015, by
State
Note: U.S. territories of Guam, Puerto Rico, Northern Mariana Islands, and the Virgin Islands
are not shown, but each of those territories had at least one detention facility.
Figure 3 shows the total number of detainees held in each state in fiscal
year 2015. Figure 3 underscores the relative dominance of southern and
southwestern states in terms of the total detainee population. As shown in
Appendix Table C, the top five states in terms of the total detainee population
were: Texas (192,771 detainees), California (51,162 detainees), Arizona
(44,283 detainees), Louisiana (26,481 detainees), and New Mexico (19,927
detainees). Notably, Arizona, Louisiana, and New Mexico had some of the
highest levels of detainee populations in fiscal year 2015, yet they
maintained relatively fewer total number of facilities compared to Texas and
California.

2018] IMMIGRATION DETENTION 27
FIGURE 3. Number of Detainees Held by ICE in FY2015, by State
Note: Detainees who were transferred between states are counted more than once.
Next, we examine a number of key detention facility characteristics,
including whether a given facility is operated by a for-profit company, as
well as the facility’s distance to the nearest principal city in an MSA, to the
nearest nonprofit immigration attorney, and to the nearest EOIR accredited
representative. We also examine the U.S. region in which the facilities are
located, and facility type. In Table 2, we summarize these facility
characteristics both at the facility level and at the detainee level. The
estimates in the “Facility Level” column are the percentages of facilities that
fall within a given category. In contrast, estimates in the “Detainee Level”
column are the percentages of detainees for whom any of their detention
stints fall within a given category.91
91. We present the detainee-level statistics in this way because detainees can move in and out of
various facilities over the course of their detention.

28 SOUTHERN CALIFORNIA LAW REVIEW [Vol. 92:1
TABLE 2. Characteristics of Facilities Used by ICE in FY2015
Percentage/Mean
Variables Facility Level Detainee Level
Type of Operation
Privately Operated 9.56 67.11
Facility Location
Outside MSA 49.53 63.57
Distance to Nearest MSA
More than 30 Miles to MSA 24.92 49.92
Population Mean Miles (SD)a 25.29 (34.02) . . .
Distance to Nearest Nonprofit Attorney
More than 30 Miles to a Nonprofit
Attorney 38.56 57.51
Population Mean Miles (SD)b 49.27 (76.33) . . .
Distance to Nearest Accredited
Representative
More than 30 Miles to an Accredited
Representative 27.27 39.59
Population Mean Miles (SD)c 32.83 (63.18) . . .
Regional Location of Facilities
Midwest 14.89 4.42
Northeast 13.64 6.32
South 39.03 67.35
West 30.41 33.39
U.S. Territories 2.04 0.21
Facility Type
Contract Detention Facility 2.66 27.61
Holding/Staging Facility 20.53 54.62
ICE Service Processing Center 1.25 20.38
(continued on next page)

2018] IMMIGRATION DETENTION 29
TABLE 2. Characteristics of Facilities Used by ICE in FY2015
Percentage/Mean
Variables Facility Level Detainee Level
Intergovernmental Service Agreement 43.42 40.55
Juvenile Facility 22.41 9.00
Other Facility Type 9.56 3.17
N 638 355,729
Notes: a The range for Distance to Nearest MSA is 0 to 278 miles at the facility level. b The
range for Distance to Nearest Nonprofit Attorney is 0 to 531 miles at the facility level. c The
range for Distance to Nearest Accredited Representative is 0 to 472 miles at the facility level.
Table 2 shows that while only about 10% of all facilities were operated
by for-profit companies, 67% of detainees had at least one of their detention
stints at a privately operated facility. Next, we examine the relative
remoteness of the facilities. About 50% of all facilities were located outside
of MSA principal cities, and about 64% of detainees had at least one of their
detention stints in facilities located outside of MSA principal cities. At the
facility level, mean distance to the nearest MSA principal city was about
twenty-five miles. The range for the Distance to Nearest MSA variable was
substantial: 0 to 278 miles. At the detainee level, Table 2 shows that about
50% of detainees spent at least one detention stint in a facility that was
located more than thirty miles away from the nearest MSA principal city.
Another remoteness measure we examine is distance to the nearest
nonprofit immigration attorney. At the facility level, mean distance to the
nearest nonprofit immigration attorney was about forty-nine miles. Like the
Distance to Nearest MSA variable, the range for the Distance to Nearest
Nonprofit Attorney variable was also substantial: 0 to 531 miles. At the
detainee level, about 58% of detainees spent at least one detention stint in a
facility that was located more than thirty miles away from the nearest
nonprofit immigration attorney. While the mean distance to the nearest EOIR
accredited representative is relatively smaller than the mean distance to the
nearest nonprofit immigration attorney, it is important to note that accredited
representatives are much more limited in the type of services that they are
allowed to provide.
Table 2 shows that both at the facility and at the detainee level, the
facilities were heavily concentrated in the South (39% and 67%,
respectively). In terms of facility type, facilities with intergovernmental
service agreements (“IGSAs”) constituted the most common type of

30 SOUTHERN CALIFORNIA LAW REVIEW [Vol. 92:1
facilities (43% and 41% at the facility and detainee level, respectively). As
we describe in detail in Appendix Table A, IGSAs are agreements between
the federal government and a state or local government to provide detention
beds in jails, prisons, and other local or state government detention facilities.
These facilities are government owned, but they may be operated by either
local or state agencies or by a for-profit company.
C. DETENTION OUTCOMES
Next, we ask, what happened to the individuals held in detention? To
address this question, we consider the following three types of outcomes:
detention length, inter-facility transfers, and grievances. As noted earlier, our
detention outcome analysis primarily focuses on adult detainees
(N=296,703) given that a different set of legal requirements apply for the
detention of juveniles.92 Before examining these three outcomes in depth,
however, we first consider whether, to what extent, and on what basis
individuals who had been detained in fiscal year 2015 were released from
detention. In Figure 4, we show how ICE classified each detainee’s final
record by examining the Release Type variable in the Detention Data. For
more detailed information on each Release Type, see Appendix Table A.
92. See generally William Wilberforce Trafficking Victims Protection Reauthorization Act of
2008, Pub. L. No. 110-457, 122 Stat. 5044; Stipulated Settlement Agreement, Flores v. Reno, No. 85-
4544-RKJ (Px) (C.D. Cal. Jan. 17, 1997). The Detention Data does not contain information about whether
the juveniles are unaccompanied or accompanied minors.

2018] IMMIGRATION DETENTION 31
FIGURE 4. Release Types
Notes: N=296,703 detainees. Juveniles are excluded.
As shown in Figure 4, the most common release type was Removed,
with 62% of the detainees being released from detention due to removal. The
next largest category was Temporarily Released, at about 20%. As described
in Appendix Table A, this category includes detainees who have been
released on their own recognizance, bonded out, released on supervision
conditions (for example, reporting requirements) or on other alternatives to
detention conditions (for example, electronic ankle monitors). The third
largest category was Continued Detention, which includes all individuals
who continued to be detained at the end of the fiscal year (about 12%). The
last three categories of release are Paroled (about 3%), Granted Relief (about
3%), and Voluntary Departure (0.61%).
In examining detention length and transfers, wherever appropriate we
conduct separate analyses for the following major release categories:
Removed, Granted Relief, and Temporarily Released. For example, our
analysis of detention length explores how much time various comparison
groups (for instance, individuals confined in privately operated facilities
versus non-privately operated facilities) spent in detention before being
removed, before being granted relief, and before being temporarily released.
This subgroup-analysis approach reduces the risk that our findings might be
confounded by fundamental dissimilarities across individuals who
experienced different types of releases.
0.55
0.61
2.68
2.69
12.03
19.78
61.67
0 10 20 30 40 50 60 70
Other
Voluntary Departure
Granted Relief
Paroled
Continued detention
Temporarily Released
Removed
Percentage
Rel
ease
Typ
e

32 SOUTHERN CALIFORNIA LAW REVIEW [Vol. 92:1
1. Detention Length
We first examine detention length among the individuals who were
released in fiscal year 2015. We noted earlier that 38,796 records pertaining
to adults and juveniles are right censored in the Detention Data. For adult
detainees, 35,683 records are right censored. These right-censored records
pertain to individuals who continued to be detained at the end of fiscal year
2015. As we do not know how long these individuals’ time in detention
lasted, we excluded them in our calculation of detention lengths shown in
Figure 5. In effect, the estimates shown in Figure 5 relate to all adult
detainees who were released in fiscal year 2015.
Figure 5 shows that about 17% of adult detainees who were released in
fiscal year 2015 were released on the same day as their initial book-in. But
many—about one-third of the adult detainees—were detained for more than
thirty days. The average detention length was about thirty-eight days.
Notably, the maximum value for this variable is 2,943 days, indicating that
one detainee was detained for over eight years before being released in fiscal
year 2015. This detainee was not alone in experiencing years of detention.
For example, 1,800 adults who were released in fiscal year 2015 were
detained between one to two years; another 273 adults were detained
between two to three years, and 117 adults were detained more than three
years, before being released in fiscal year 2015.

2018] IMMIGRATION DETENTION 33
FIGURE 5. Total Days Detained Among Individuals Released in FY2015
Notes: N=261,020 detainees. Juveniles are excluded. Mean detention length is about 38 days,
and the range is 0 to 2,943 days.
Next, we consider whether there are significant differences in the
average detention length across the key detention facility characteristics that
we discussed earlier: the type of facility operator (privately operated vs non-
privately operated) and the location of the facility (within or outside of MSA
principal cities). We conduct these bivariate tests separately for each of the
three key release categories of interest: Removed, Granted Relief, and
Temporarily Released.
To calculate the average detention length shown in Figure 6, we use the
following approach: Within each major release category, we calculate the
total number of detention days spent in privately operated (non-privately
operated) facilities. We then divide that total by the total number of detainees
who ever spent time in privately operated (non-privately operated) facilities.
We follow the same approach in calculating the average detention length by
facility location shown in Figure 7.
4.16
6.14
7.23
15.81
7.55
7.93
10.90
22.89
17.40
0 5 10 15 20 25
181 days or more (> 6 months)
91-180 days ( ̴3-6 months)
61-90 days ( ̴2-3 months)
31-60 days ( ̴1-2 months)
22-30 days ( ̴3-4 weeks)
15-21 days ( ̴2-3 weeks)
7-14 days ( ̴1-2 weeks)
1-6 days (<1 week)
Less than 1 day
Percentage
Day
s D
etai
ned

34 SOUTHERN CALIFORNIA LAW REVIEW [Vol. 92:1
FIGURE 6. Mean Days Detained by Type of Operation
FIGURE 7. Mean Days Detained by Facility Location
First, we note that the Granted Relief category has the highest average
detention length (about sixty-eight days), followed by Temporarily Released
(about fifty-five days), and Removed (about thirty-two days) (not shown in
Figure 6). Second, as shown in Figure 6, there are substantial differences in
the average detention length across privately operated and non-privately
16.2
33.33
22.1328.07
87.12
65.09
0
10
20
30
40
50
60
70
80
90
100
Removed Granted Relief Temporarily Released
Day
s
Not Privately Operated Privately Operated
16.26
28.0724.2
28.87
94.19
58.58
0
10
20
30
40
50
60
70
80
90
100
Removed Granted Relief Temporarily Released
Day
s
In MSA Outisde MSAOutside MSA

2018] IMMIGRATION DETENTION 35
operated facilities. Third, as shown in Figure 7, there are also substantial
differences in the average detention length across facilities that are located
in MSA principal cities versus those that are located outside of MSA
principal cities. Specifically, detention length is consistently and
substantially higher in privately operated facilities (than in non-privately
operated facilities), and in facilities located outside of MSA principal cities
(than in facilities located within MSA principal cities).
To test the robustness of these findings, we conduct regression analyses
of detention length that control for a variety of relevant potential
confounders. These covariates include the following detainee and facility
characteristics: (1) gender; (2) region of origin; (3) age at first entry into
detention; (4) legal status at the time of last U.S. entry; (5) criminal history;
(6) number of inter-facility transfers experienced by a detainee; (7) miles to
the nearest nonprofit immigration attorney; and (8) regional location of
facilities.
TABLE 3. Coefficients from Weibull Models Predicting Time to
Release93
Time to Release
Removed Granted Relief
Temporarily
Released
Variables coeff. s.e. coeff. s.e. coeff. s.e.
Privately
Operated 0.60*** (0.02) 3.20*** (0.09) 2.97*** (0.04)
Facility outside
an MSA 0.60*** (0.01) 1.51*** (0.08) 0.62*** (0.03)
Covariates a √ √ √
Log Pseudo-
likelihood -393030.28 -17561.98 -128919.25
N 402,540 16,148 117,647
Notes: Juveniles are excluded. Standard errors are adjusted for clustering at the detainee level. a Covariates include: Male, Region of Origin, Age at First Entry into Detention, Entry Status,
Has an Aggravated Felony, Count of Transfers, Miles to Nearest Nonprofit Attorney, and
Regional Location of Facilities. * p < 0.05, ** p < 0.01, *** p < 0.001 (two-tailed tests).
93. For robustness checks on the results presented in Table 3 under varying specifications, see the
Methods Appendix.

36 SOUTHERN CALIFORNIA LAW REVIEW [Vol. 92:1
The regression results shown in Table 3 are based on Weibull models
that we discussed earlier, and we undertake separate analyses for each major
release type: Removed, Granted Relief, and Temporarily Released. The
coefficients in the Weibull models we present below can be interpreted as a
percent change in the expected “failure time” (in this study, detention length)
with every unit increase in the independent variable, holding all other
covariates in the model constant.
Our regression results are consistent with those we found in Figures 6
and 7. In each of the three release categories, being confined in privately
operated facilities is associated with longer detention. For example, among
those who were removed, confinement in a privately operated facility is
associated with an 82% increase in days to release (100x[exp(0.60)-1] =
82.21). The same is true of confinement in a facility located outside of an
MSA principal city. These patterns of results are even more pronounced for
those who were granted relief and those who were temporarily released.
Some observers might ask whether these findings suggest that ICE is
merely placing individuals who are likely to be detained longer into privately
operated facilities, and into facilities that are located outside of major urban
areas. These placement decisions may occur at the initial sorting point or at
subsequent inter-facility transfers. Such a decisionmaking process would
result in a pattern of detention length that would be consistent with our
findings. Central to this account is the assumption that ICE is systematically
and reliably predicting which detainees are likely to turn out to be long-term
detainees. Our data does not allow us to formally test this possible
explanation. However, at least two features of our analyses cast doubt on the
validity of this account’s central assumption.
First, our findings hold across various subgroups of release categories
(Removed, Granted, and Temporarily Released categories). This means that
the foregoing account requires ICE to be making relatively nuanced and
ongoing assessments about each detainee’s legal case—beyond mere
assessments about which detainee is likely to be eventually removed, granted
relief, or temporarily released. Second, our findings are robust controlling
for a variety of detainee-background characteristics (see Table 3) that might
confound the relationship between detention length and facility operator, and
between detention length and facility location, respectively. These findings
suggest that for ICE to be systematically predicting with relative accuracy
which detainees will turn out to be long-term detainees, ICE must be relying
on a more complex set of factors beyond these core detainee-background
characteristics. Both scenarios above require us to assume a great deal about
ICE’s prediction and sorting process.
2018] IMMIGRATION DETENTION 37
Another possible explanation for the positive relationship between
detention length and confinement in privately operated facilities, and
confinement in facilities located outside of major urban areas, respectively,
relates to the size of such facilities. Privately operated facilities tend to detain
a substantially higher number of individuals on average than non-privately
operated facilities. The same is true of facilities located outside of major
urban areas compared to facilities located within major urban areas.
Geographical concentrations of large detainee populations are likely
associated with longer court backlogs, and in turn, longer time to release, all
else being equal.
It is also possible that certain conditions of detention in privately
operated facilities and facilities located outside of major urban areas are
systematically linked to longer detention. For example, insofar as telephone
calls are more expensive in privately operated facilities, or visitation is more
difficult in facilities located outside of major urban areas, detainees may face
greater challenges in obtaining legal counsel or obtaining materials
necessary for their court hearings. If so, we might expect detainees in such
facilities to seek court continuances at higher rates, leading to longer
detention time. Our data do not allow us to test these possible explanations.
However, our findings at a minimum call for careful future investigations
into whether certain structural or situational aspects of confinement in
privately operated facilities and in remote facilities might be lengthening
detention.
2. Inter-Facility Transfers
The second detention outcome we analyze is inter-facility transfers.
Two important notes about such transfers are in order. First, although
transfers can occur for a variety of reasons, the Detention Data does not
provide the reasons underlying the transfers. Second, ICE’s 2012 policy
directive on transfers defines transfers as the movement of detainees from
one Area of Responsibility (“AOR”) to another.94 An AOR is “[t]he
geographic area of responsibility under the authority of a Field Office
Director,”95 and it can encompass multiple states. For example, the Saint
Paul Field Office’s AOR consists of Iowa, Minnesota, Nebraska, North
Dakota, and South Dakota.96 In this study, we do not adopt this narrow
94. U.S. IMMIGRATION & CUSTOMS ENF’T, supra note 47.
95. Id.
96. U.S. IMMIGRATION & CUSTOMS ENF’T, ENFORCEMENT AND REMOVAL OPERATIONS FIELD
OFFICES (2018), https://www.ice.gov/contact/ero [https://perma.cc/W37F-LYD9]; U.S. IMMIGRATION &
CUSTOMS ENF’T, ERO FIELD OFFICES (2015), https://www.ice.gov/sites/default/files/documents

38 SOUTHERN CALIFORNIA LAW REVIEW [Vol. 92:1
definition of transfers.
Instead, we treat a movement as a transfer if ICE assigned a given
record the release reason of “transferred” or “U.S. Marshals or other
agency.” We refer to these movements as inter-facility transfers in this study
for the following reason: ICE assigned each facility in the Detention Data a
facility code that ICE has represented as uniquely identifying each facility.
During our data preparation stage, we ensured that all consecutive records
for any given detainee had a distinct facility code (see the Methods
Appendix). In sum, all of the transfers that we analyze in this study involved
movements from one location to another that had distinct facility codes.97
FIGURE 8. Number of Transfers Among Individuals Released During
FY2015
Notes: N=261,020 detainees. Juveniles are excluded. Mean number of transfers is 1.15. The
range for the Number of Transfers is 0 to 51.
First, we examine the prevalence of transfers. Because we cannot
determine the total number of transfers for the individuals who continued to
be detained at the end of fiscal year 2015, we excluded these individuals in
calculating the number of transfers shown in Figure 8. As we note in Figure
/Document/2016/eroFieldOffices.pdf [https://perma.cc/H8MD-8K74].
97. As we explain in detail in the Methods Appendix, however, a small number of transfers (N=64)
involved a movement from one location to another that had distinct facility codes yet shared the same
address.
45.55
26.92
15.05
12.48
0 10 20 30 40 50
None
One
Two
Three or More
Percentage
Num
ber
of
Tra
nsf
ers

2018] IMMIGRATION DETENTION 39
8, the average number of transfers that these individuals experienced before
release is a little more than one, but the range is wide: 0 to 51. Figure 8 shows
that about 27% of these individuals experienced one transfer, about 15%
experienced two transfers, and about 12% experienced three or more
transfers. This means that about 54% of adults released in fiscal year 2015
experienced at least one transfer during their detention.
It is also illuminating to consider the type of transfers that the detainees
experienced. As shown in Table 4, we coded each transfer in the Detention
Data as intercity, interstate, or intercircuit. Intercity transfers refer to
transfers between detention facilities that are located in different cities.
Interstate transfers refer to transfers between different states. Intercircuit
transfers refer to transfers between different federal judicial circuits.
All of these different types of transfers can negatively impact detainees
and their legal cases. For example, transfers can sever the detainees’ familial
and social contacts (in and outside the facilities where they are held), disrupt
the continuity of their medical care and legal representation, and interfere
with their efforts to navigate the legal system more generally.98 In addition
to these issues, however, intercircuit transfers may impose special challenges
to detainees because such transfers can mean changes in the controlling law
that governs the detainees’ immigration case.99 Nancy Morawetz, for
example, has shown that the government’s decision to transfer detainees to
certain jurisdictions can “greatly increase[] the chances that the individual
will be deported prior to any substantive review of the case.”100
98. See, e.g., INTER-AM. COMM’N ON HUMAN RIGHTS, REPORT ON IMMIGRATION IN THE UNITED
STATES: DETENTION AND DUE PROCESS 26–27, 137–40 (2010); García Hernández, supra note 43, at 17;
Steering Comm. of the N.Y. Immigrant Representation Study Report, Accessing Justice: The Availability
and Adequacy of Counsel in Removal Proceedings, 33 CARDOZO L. REV. 357, 363 (2011); Mark Noferi,
Cascading Constitutional Deprivation: The Right to Appointed Counsel for Mandatorily Detained
Immigrants Pending Removal Proceedings, 18 MICH. J. RACE & L. 63, 76–77 (2012).
99. Peter L. Markowitz & Lindsay C. Nash, Constitutional Venue, 66 FLA. L. REV. 1153, 1200
(2015) (noting that “federal immigration authorities’ unchecked control over venue allows them to
manipulate the controlling law of a case because the case will be governed by the law of the federal circuit
in the jurisdiction in which the immigration court sits”).
100. Nancy Morawetz, Detention Decisions and Access to Habeas Corpus for Immigrants Facing
Deportation, 25 B.C. THIRD WORLD L.J. 13, 16 (2005).

40 SOUTHERN CALIFORNIA LAW REVIEW [Vol. 92:1
TABLE 4. Type of Transfers Experienced by Detainees with at Least
One Transfer
Detainee Level Transfer Level
Variables
Percentage of
Detainees N
Percentage of
Transfers N
Transfer Type
Intercity 85.80 152,214 88.72 313,813
Interstate 36.92 65,500 27.67 97,887
Intercircuit 29.23 51,850 19.40 68,601
All Transfers 177,402 353,704
Notes: Analysis sample includes only those detainees who experienced at least one transfer
(including detainees whose records are right censored). Juveniles are excluded.
According to Table 4, 177,402 adults (which constitutes about 60% of
296,703 adults detained during fiscal year 2015) experienced at least one
transfer. Collectively, these individuals experienced 353,704 transfers. Table
4 also shows that at the detainee level, about 86% of adult detainees who had
at least one transfer experienced an intercity transfer, about 37% experienced
an interstate transfer, and about 29% experienced an intercircuit transfer. At
the transfer level, about 89% of all transfers were intercity transfers, about
28% were interstate transfers, and about 19% were intercircuit transfers.
Another way of examining the transfers is to consider the distance
between the facilities involved. Figure 9 reports the mean and median driving
distances pertaining to various transfer types. The smallest means and
medians involve intercity transfers. Figure 9 shows that for intercity
transfers, the mean is about 297 miles and the median is about 116 miles.
The largest means and medians across different transfer types involve
intercircuit transfers. Figure 9 shows that the mean for intercircuit transfers
is substantial—about 820 miles. The median for intercircuit transfers is a
little less than the mean—about 716 miles.

2018] IMMIGRATION DETENTION 41
FIGURE 9. Mean and Median Driving Distance Between Facilities Involved
in Different Types of Transfers
Are transfer risks associated with confinement in particular types of
facilities? To address this question, we begin by examining the average
number of transfers by the facility characteristics of interest in this study.
Figure 10 shows the average number of transfers by the type of facility
operator. Figure 11 shows the average number of transfers by the location of
the facility. As before, we calculate these averages separately for each major
release category of Removed, Granted Relief, and Temporarily Released.
To calculate the average number of transfers shown in Figures 10 and
11, we follow the same approach that we use in calculating the average
detention lengths shown in Figures 6 and 7. For example, within each major
release category, we calculate the total number of transfers out of privately
operated (non-privately operated) facilities. We then divide that total by the
total number of detainees who ever spent time in privately operated (non-
privately operated) facilities.
270.18
296.54
684.44
820.25
104
115.58
484
716
0 200 400 600 800 1000
All Transfers
Intercity Transfers
Interstate Transfers
Intercircuit Transfers
Miles
Median Mean

42 SOUTHERN CALIFORNIA LAW REVIEW [Vol. 92:1
FIGURE 10. Mean Number of Transfers by Type of Operation
FIGURE 11. Mean Number of Transfers by Facility Location
Figures 10 and 11 generally indicate that transfers are more prevalent
among non-privately operated facilities compared to privately operated
facilities. The same is true of facilities located within MSA principal cities
compared to those located outside of MSA principal cities, at least with
1.36
0.95 0.92
0.66 0.67 0.69
0
0.2
0.4
0.6
0.8
1
1.2
1.4
1.6
Removed Granted Relief Temporarily Released
Not Privately Operated Privately Operated
0.91
0.68
0.780.84
1.03
0.70
0
0.2
0.4
0.6
0.8
1
1.2
Removed Granted Relief Temporarily Released
In MSA Outisde MSAOutside MSA

2018] IMMIGRATION DETENTION 43
respect to the Removed and the Temporarily Released categories. We test the
robustness of these findings by estimating a set of survival models that
predict the expected time to transfer, holding a number of covariates
constant.
TABLE 5. Coefficients from Lognormal Models Predicting Time to
Transfer101
Time to Transfer
Removed Granted Relief
Temporarily
Released
Variables coeff. s.e. coeff. s.e. coeff. s.e.
Privately
Operated 4.56*** (0.01) 4.08*** (0.10) 4.63*** (0.04)
Facility
Outside an
MSA 1.32*** (0.01) 1.29*** (0.15) 1.81*** (0.05)
Covariatesa √ √ √
Log Pseudo-
likelihood -630548.55 -28080.74 -195613.93
N 402,540 16,148 117,649
Notes: Juveniles are excluded. Standard errors are adjusted for clustering at the detainee level. a Covariates include: Male, Region of Origin, Age at First Entry into Detention, Entry Status,
Has an Aggravated Felony, Miles to Nearest Nonprofit Attorney, and Regional Location of
Facilities. * p < 0.05, ** p < 0.01, *** p < 0.001 (two-tailed tests).
Table 5 shows that across each release category, there is a positive
relationship between confinement in privately operated facilities and the
expected days to transfer. Consider the results for the Removed category:
Among the detainees who were eventually removed, confinement in a
privately operated facility extends the expected days to transfer by about
ninety-six times (exp(4.56) = 95.58), compared to being confined in a non-
privately operated facility.
Likewise, Table 5 shows that across each release category, there is a
positive relationship between confinement in facilities located outside of
MSA principal cities and the expected days to transfer. For example, for the
detainees who were eventually removed, confinement in a facility located
101. For robustness checks on the results presented in Table 5 under varying specifications, see the
Methods Appendix.

44 SOUTHERN CALIFORNIA LAW REVIEW [Vol. 92:1
outside of an MSA principal city extends the expected days to transfer by
about four times (exp(1.32) = 3.74), compared to being confined in a facility
located within an MSA principal city.
Another way to think about these results is that detainees in privately
operated facilities, and in facilities located outside of MSA principal cities,
respectively, are expected to experience transfers at a significantly slower
rate, holding all other covariates in the model constant. The slower the failure
process, the lower the risk of the expected event (in this case, transfers), all
else being equal.
According to a 2009 Human Rights Watch report, “the majority of
detainee transfers originate from the patchwork of local prisons and jails
operating under IGSA contracts with ICE.”102 But that finding does not shed
light on the question raised by our analysis results—namely, why does
confinement in privately operated facilities, and facilities located outside of
major urban areas, respectively, lower transfer risks?
The most direct evidence relevant to addressing this question is
information regarding the specific reasons for the transfers. There are many
different reasons why detainees may be transferred. The policy directive
issued by ICE in 2012, for example, enumerates a series of officially
sanctioned reasons, including reasons related to “medical or mental health
care to the detainee,” the “safety and security of the detainee, other detainees,
detention personnel or any ICE employee,” and the “detainee’s individual
circumstances and risk factors.”103 Advocates and researchers have reported
a variety of other reasons for transfers, including retaliation against detainees
for speaking up or organizing.104
To our knowledge, ICE does not maintain electronic records of why any
given detainee is transferred.105 This critical gap in data on transfers prevents
102. HUMAN RIGHTS WATCH, supra note 45, at 21; see also HUMAN RIGHTS WATCH, supra note
11, at 24 (“More than half of all transfers involved a facility that has an Intergovernmental Service
Agreement with ICE to hold immigration detainees. These facilities are most commonly state or local
criminal jails and prisons . . . .”).
103. U.S. IMMIGRATION & CUSTOMS ENF’T, supra note 47, at 3.
104. Nancy Hiemstra, “You Don’t Even Know Where You Are”: Chaotic Geographies of U.S.
Migrant Detention and Deportation, in CARCERAL SPACES: MOBILITY AND AGENCY IN IMPRISONMENT
AND MIGRANT DETENTION 68 (Dominique Moran et al. eds., 2013); D. Conlon & N. Hiemstra,
Examining the Everyday Micro-Economies of Migrant Detention in the United States, 69 GEOGRAPHICA
HELVETICA 335, 342 (2014).
105. On September 15, 2017, the first author filed a records request under FOIA with ICE seeking
all records that reflect or describe policies, procedures, or systems used to make placement and transfer
determinations. On May 10, 2018, ICE produced a one-page letter containing three ICE websites
pertaining to ICE’s official policies on transfers. We thus continue to lack information about how ICE
makes these determinations in practice.

2018] IMMIGRATION DETENTION 45
us from further analyzing the pattern of relationships that we uncovered in
this study. However, one possible reason why transfer risks may be
comparatively lower for privately operated facilities and facilities located
outside of major urban areas might be that these facilities generally tend to
have greater bed space capacities.106
Such a possibility, even if empirically supported, does not favor the
continued maintenance and construction of facilities with large bed space
capacities. The research on the prison industrial complex has long
documented the perverse incentives for incarceration generated by the
expansion of prisons into communities whose local economies become
reliant on the operation and profitability of those prisons.107 We do argue,
however, that a data-driven understanding of the disparities in transfer risks
across various facility types is a critical first step in developing policies to
reduce the prevalence of transfers and to mitigate their resulting harm.
3. Grievances
Finally, we examine the type and prevalence of grievances in facilities.
The Grievance Data contains a total of 47,145 grievances relating to 304 of
the detention facilities used by ICE in fiscal year 2015. We begin by
considering the prevalence of different types of grievances. Next, we
aggregate these various types of grievances to generate a total count of all
grievances for each facility.
Two important caveats are in order before we begin. First, we
underscore again that the grievances we analyze in this study are likely only
a small fraction of all issues and incidents experienced or reported by
detainees. Second, ICE’s records production to Human Rights Watch did not
include definitions of the grievance types. Nor did ICE provide any
explanations of how ICE classified the grievances into the various categories
included in its records production. We recognize that some of the category
106. Our analysis of the ICE detention-facility dataset that contains information on the facilities’
bed space capacity generally supports this conclusion. See 2015 ICE Detention Facility Listing, U.S.
IMMIGRATION & CUSTOMS ENF’T (Oct. 3, 2017), https://www.ice.gov/foia/library (expand “Detention
Facility Statistics;” then follow “2015 ICE Detention Facility Listing” hyperlink); see also THE GEO
GRP., INC., 2011 ANNUAL REPORT 2 (highlighting the large bed-space capacity of its facilities as its
competitive market advantage); CORRECTIONS CORPORATION OF AMERICA, 2009 ANNUAL REPORT ON
FORM 10-K 9 (2009) (same).
107. See generally, e.g., Rose M. Brewer & Nancy A. Heitzeg, The Racialization of Crime and
Punishment: Criminal Justice, Color-Blind Racism, and the Political Economy of the Prison Industrial
Complex, 51 AM. BEHAV. SCIENTIST 625 (2008); Heather Ann Thompson, Why Mass Incarceration
Matters: Rethinking Crisis, Decline, and Transformation in Postwar American History, 97 J. AM. HIST.
703 (2010); Rebecca U. Thorpe, Perverse Politics: The Persistence of Mass Imprisonment in the Twenty-
First Century, 13 PERSP. ON POL. 618 (2015).

46 SOUTHERN CALIFORNIA LAW REVIEW [Vol. 92:1
labels used by ICE (see, for example, the “Serious or Unresolved Problem in
Detention” category in Table 6) are broad and ambiguous. We also recognize
that some of the categories may undercount certain kinds of grievances if
those grievances were inconsistently classified. For example, grievances
relating to barriers to communication with legal counsel may have been
classified into the “Telephone Access” category or the “Visitation” category
instead of the “Access to Counsel” category (see Table 6). For these reasons,
we examine only the total count of grievances in our regression analysis.
To begin, we note that the Grievance Data contains a total of 31,417
grievances that relate to the following two categories: “Access to Legal
Counsel” and “Basic Immigration Case Information.” Together, these
categories concerning issues relating to access to legal representation and
basic legal knowledge constitute about two-thirds of all grievances in the
Grievance Data.
Table 6 contains a comprehensive list of all grievance categories as
provided by ICE in its records production to Human Rights Watch. We
examine the grievance statistics by type of facility operator and facility
location, respectively. The statistics shown under the Type of Operation
column indicate the average number of grievances (for any given grievance
type) pertaining to the privately operated facilities versus those that are not
privately operated. The estimates shown under the Facility Location column
indicate the average number of grievances (for any given grievance type)
pertaining to the facilities located within MSA principal cities versus those
located outside of MSA principal cities.

2018] IMMIGRATION DETENTION 47
TABLE 6. Average Number of Grievances Against Detention Facilities
Used by ICE in FY2015, by Type of Operation and Facility Location
Type of Operation Facility Location
Grievance Type Private
Non-
Private
In
MSA
Not in
MSA Total
Access to Legal Counsel 2.89 0.26 0.48 0.97 218
Asylum 19.42 0.46 1.86 5.74 1,145
Asylum Withdraw 19.66 0.22 1.82 5.46 1,096
Basic Immigration Case
Information 469.91 25.08 67.40 139.28 31,199
Bond 47.85 2.20 5.86 14.64 3,086
Fear of Retaliation 0.26 0.01 0.06 0.05 17
ICE/Facility Misconduct 7.08 0.83 0.81 3.07 584
Medical Complaint 9.47 0.91 1.36 3.49 731
Mental Disorder or
Condition 0.64 0.03 0.08 0.19 41
Online Detainee Locator 69.62 7.43 17.69 18.88 5,555
Physical and/or Sexual
Abuse 1.83 0.12 0.30 0.55 128
Release from Facility 8.49 0.80 1.30 3.03 652
Separation from Minor
Child or Other
Dependent or Parental
Related 2.81 0.24 0.50 0.89 210
Serious or Unresolved
Problem in Detention 5.49 0.51 0.65 2.15 420
Telephone Access 1.06 0.15 0.17 0.46 94
Victim/Citizen Hotline 0.36 0.02 0.08 0.07 23
Visitation 0.40 0.05 0.10 0.12 33
Other 24.11 2.52 3.76 8.91 1,910
All Grievances 691.34 41.85 104.26 207.95 47,145
Note: N=304 facilities.

48 SOUTHERN CALIFORNIA LAW REVIEW [Vol. 92:1
For example, under the column heading, Type of Operation, Table 6
shows that privately operated facilities had an average of 2.89 grievances
involving access to legal counsel. In contrast, non-privately operated
facilities had an average of 0.26 grievances involving access to legal counsel.
Under the column heading, Facility Location, Table 6 also shows that while
facilities located within MSA principal cities had an average of 0.48
grievances involving access to legal counsel, facilities located outside of
MSA principal cities had an average of 0.97 such grievances.
The overall pattern of results presented in Table 6 is similar for privately
operated facilities and facilities that are located outside of MSA principal
cities. In short, privately operated facilities and facilities located outside of
MSA principal cities generally had a substantially higher number of
grievances across almost all grievance types. In Figure 12, we show the
average number of all grievances (the sum of individual grievance types) by
the type of facility operator and facility location. The results are consistent
with the general pattern we observed when we considered the average
number of individual grievance types in Table 6. Specifically, Figure 12
shows a substantially higher overall number of grievances against privately
operated facilities and facilities located outside of MSA principal cities.
FIGURE 12. Average Number of Grievances by Type of Operation and
Facility Location, FY2015
To assess whether these results are robust controlling for various
potential confounders, we estimate multivariate negative binomial models.
104.26
207.95
41.85
691.34
0 100 200 300 400 500 600 700 800
In MSA
Outside MSA
Not Privately Operated
Privately Operated

2018] IMMIGRATION DETENTION 49
In these negative binomial models, the dependent variable is the total number
of grievances. The covariates in these models include: (1) Proportion Male
(the proportion of detainees confined in any given facility during fiscal year
2015 who were male); (2) Proportion Mexican (the proportion of detainees
confined in any given facility during fiscal year 2015 who were of Mexican
origin); (3) Total Detainee Population (the total number of detainees
confined in a given facility during fiscal year 2015); (4) Average Detention
Stint (the average length of detention stints (in days) in a given facility in
fiscal year 2015); and (5) Juvenile Facility (whether or not the facility is a
juvenile facility).
The results of these negative binomial regressions are shown in Table
7. Model 2 shows that that privately operated facilities are expected to have
about 175% more grievances than non-privately operated facilities, holding
all other covariates in the model constant (100x[exp(1.01)-1]=174.56).
Facilities located outside of MSA principal cities are expected to have about
51% more grievances than facilities located within MSA principal cities,
holding all other covariates in the model constant (100x[exp(0.41)-1]
=50.68).
TABLE 7. Coefficients from Negative Binomial Models Predicting Total
Grievances Among Facilities Used by ICE in FY2015
Total Grievance Count
Model 1 Model 2
Variables coeff. s.e. coeff. s.e.
Privately Operated 2.76*** (0.24) 1.01*** (0.25)
Facility outside an MSA 0.49** (0.18) 0.41** (0.15)
Proportion Male 1.00* (0.40)
Proportion Mexican 0.38 (0.39)
Total Detainee Population
(thousands) 0.26*** (0.03)
Average Detention Stint 0.06*** (0.01)
Juvenile Facility -2.96*** (0.40)
Log likelihood -1464.85 -1354.87
N 304 304
Note: * p < 0.05, ** p < 0.01, *** p < 0.001 (two-tailed tests).

50 SOUTHERN CALIFORNIA LAW REVIEW [Vol. 92:1
What might explain the disparities in grievance counts? If it were
systematically easier to express grievances or submit grievances in privately
operated facilities and facilities located outside of MSAs, grievance counts
would be higher in such facilities, all else being equal. Yet a consideration
of certain basic features of these facilities suggest that detainees might face
equally burdensome, if not higher, barriers to filing complaints or grievances
in these facilities. Research suggests that isolation—which is intrinsically
exacerbated in remotely located facilities removed from community
networks—can impair detainees’ cognitive and emotional functions, deprive
them of their sense of agency, and prevent them from obtaining knowledge
about their rights.108 Reports also suggest that privately operated facilities
are more likely to lack transparency and public accountability.109
Transparency and accountability, in turn, are two basic institutional features
that might be associated with open and responsive management.
The foregoing discussion focuses on whether detainees in different
types of facilities may face different levels and types of challenges in
submitting complaints and grievances. However, another possible
explanation that requires empirical scrutiny in future research is whether and
to what extent there may be differences in actual conditions of confinement
that underlie disparities in grievance counts.110 In the criminal justice
context, the DOJ’s latest review of correctional facilities in 2016 found that
private contract-operated prisons had a worse record on most safety and
security measures, relative to comparable facilities operated by the Federal
Bureau of Prisons.111 This finding was important in the then-Deputy
Attorney General Sally Yates’s decision to phase out private contracts.112 To
108. Mountz, supra note 66, at 95–96 (discussing the ways in which isolation deprives detainees of
essential knowledge and information); Alison Mountz et al., Conceptualizing Detention: Mobility,
Containment, Bordering, and Exclusion, 37 PROGRESS IN HUM. GEOGRAPHY 522, 529 (2013) (discussing
research that documents the negative psychological impacts of isolation on detainees).
109. See AM. CIVIL LIBERTIES UNION OF N.M., OUTSOURCING RESPONSIBILITY: THE HUMAN COST
OF PRIVATIZED IMMIGRATION DETENTION IN OTERO COUNTY 59 (2011), https://www.aclu-nm.org/sites
/default/files/wp-content/uploads/2011/01/OCPC-Report.pdf [https://perma.cc/2MPC-P4FL]; U.S.
DEP’T OF HOMELAND SEC., supra note 13, at 45.
110. See Chacón, supra note 12, at 21–32.
111. See OFFICE OF THE INSPECTOR GEN., U.S. DEP’T OF JUSTICE, REVIEW OF THE FEDERAL
BUREAU OF PRISONS’ MONITORING OF CONTRACT PRISONS, at i (2016), https://oig.justice.gov/reports
/2016/e1606.pdf [https://perma.cc/AQF2-L9Q9].
112. Memorandum from Sally Q. Yates, supra note 52. Attorney General Jeff Sessions, nominated
by President Trump, subsequently rescinded the Memorandum from Deputy Attorney General Yates,
noting that “[t]he memorandum changed long-standing policy and practice, and impaired the Bureau’s
ability to meet the future needs of the federal correctional system.” Memorandum from Jefferson B.
Sessions III, Attorney Gen., to the Acting Director, Fed. Bureau of Prisons (Feb. 21, 2017),
https://www.bop.gov/resources/news/pdfs/20170224_doj_memo.pdf [https://perma.cc/4CNQ-G4TY].

2018] IMMIGRATION DETENTION 51
our knowledge, no such systematic comparative assessments exist in the
immigration detention context.113 Our findings thus provide an important
starting point and foundation for future investigations on this critical issue.
CONCLUSION
Our analyses revealed a number of important patterns and significant
findings. The bulk of the detained population consisted of men, and
individuals from Mexico, followed by El Salvador, Guatemala, and
Honduras. Together, these four countries constituted 89% of the detainee
population. About 17% of the population consisted of juveniles. During
fiscal year 2015, the detainees were held in a total of 638 facilities. Every
state and a number of U.S. territories had at least one such facility in fiscal
year 2015. While only 10% of these facilities were operated by for-profit
companies, about 67% of the detainees had at least one of their detention
stints at a privately operated facility.
About 50% of facilities used by ICE in fiscal year 2015 were located
outside of major urban areas, and about 64% of detainees had at least one of
their detention stints at such facilities. We also find that about 50% of
detainees spent at least one detention stint in a facility that was located more
than thirty miles away from the nearest major urban area. In addition, about
58% of detainees spent at least one detention stint in a facility that was more
than thirty miles away from the nearest nonprofit immigration attorney.
Taken together, these measures indicate that many detainees are confined in
locations that are relatively far from community support structures and legal
advocacy networks.
We also find that many detainees experienced inter-facility transfers.
About 60% of adults detained during fiscal year 2015 experienced at least
one transfer during their detention. About 89% of those transfers were
intercity, about 28% were interstate, and about 19% involved intercircuit
transfers.
These findings have important implications for not only the wellbeing
of the detainees, but also for their rights to due process. For example, there
is now a movement underway in many cities and states across the United
States to promote greater access to legal representation for detainees.114 Yet
113. See Chacón, supra note 12, at 25 (concluding that “systematic comparative evidence is
lacking” with respect to conditions of confinement in immigration detention).
114. See generally, e.g., CAL. COAL. FOR UNIVERSAL REPRESENTATION, CALIFORNIA’S DUE
PROCESS CRISIS: ACCESS TO LEGAL COUNSEL FOR DETAINED IMMIGRANTS (2016), https://www.nilc.org
/wp-content/uploads/2016/06/access-to-counsel-Calif-coalition-report-2016-06.pdf [https://perma.cc
/X8LN-XSTB]; ANDREA BLACK & JOAN FRIEDLAND, NAT’L IMMIGRATION LAW CTR., BLAZING A

52 SOUTHERN CALIFORNIA LAW REVIEW [Vol. 92:1
such efforts are likely to be hampered in fundamental ways by the remote
location of many facilities and the frequent transfer of detainees across long
distances. As the Office of Inspector General has emphasized: “When ICE
transfers detainees far from where they were originally detained, their legal
counsel may request a release from representation because the distance and
travel time or cost make representation impractical.”115 These challenges and
disruptions not only create hardships for individual detainees, but they also
have ripple effects throughout the legal system, as “[d]ifficulty arranging for
counsel or accessing evidence may result in delayed court proceedings.”116
Our analyses also identified notable patterns with respect to detention
outcomes. We find that confinement in privately operated facilities is
associated with significantly longer detention. The same is true of facilities
located outside of major urban areas. Our analyses also show that privately
operated facilities and facilities located outside of major urban areas have
substantially higher counts of grievances. On the other hand, transfer risks
are relatively lower in privately operated facilities and in facilities located
outside of major urban areas.
We do not argue that the bivariate relationships that we found between
the various detention outcomes and detention facility characteristics of
interest (privately operated versus non-privately operated; location within
MSA principal cities versus outside of MSA principal cities) are causal in
nature. Whenever possible, we conducted subgroup analyses and
multivariate regression analyses to control for possible confounders. Yet
without knowing the assignment process of detainees to different facilities,
it is difficult to draw direct causal inferences.
Nonetheless, our findings highlight the need for a careful consideration
of certain basic facility characteristics in facility monitoring and reform
efforts.117 For example, privately operated facilities and facilities located in
remote areas may warrant a heightened scrutiny with respect to various
TRAIL: THE FIGHT FOR RIGHT TO COUNSEL IN DETENTION AND BEYOND (Richard Irwin ed., 2016),
https://www.nilc.org/wp-content/uploads/2016/04/Right-to-Counsel-Blazing-a-Trail-2016-03.pdf
[https://perma.cc/JQJ3-ACPC]; MAGGIE CORSER, CTR. FOR POPULAR DEMOCRACY, ACCESS TO JUSTICE:
ENSURING COUNSEL FOR IMMIGRANTS FACING DEPORTATION IN THE D.C. METROPOLITAN AREA (Emily
Tucker et al. eds., 2017), https://populardemocracy.org/sites/default/files/DC_Access_to_Counsel_rev4
_033117%20%281%29.pdf [https://perma.cc/CXT5-TNX4].
115. OFFICE OF INSPECTOR GEN., U.S. DEP’T OF HOMELAND SEC., supra note 44, at 4.
116. Id.
117. For an examination of the relationship between the characteristics of communities hosting
detention facilities and detention outcomes, see Emily Ryo & Ian Peacock, Beyond the Walls: The
Importance of Community Contexts in Immigration Detention, AM. BEHAV. SCIENTIST (forthcoming
2018).

2018] IMMIGRATION DETENTION 53
detention outcomes. This is all the more so because these types of facilities
traditionally have been relatively less transparent and less accountable to the
public. Consider, for example, a long-running FOIA litigation in which
Detention Watch Network and the Center for Constitutional Rights sought
records from ICE relating to immigration detention practices.118 When the
district court ordered the release of documents, the government chose not to
appeal. However, two private prison corporations, the GEO Group and
CoreCivic, intervened to stop the release of documents and filed an appeal
of the court’s decision.119
This study also underscores the urgent need for the government to
engage in more systematic and comprehensive data collection with respect
to immigration detention and to make such data widely available to
researchers and the public. Importantly, any such data collection effort must
be attentive to challenges that arise uniquely in detention settings. For
example, underreporting of grievances is likely a serious problem given the
current grievance system established by the ICE detention standards.
According to a recent government report, “ICE detention standards and
guidance call for informal resolution of detainee complaints through oral
communication with ICE facility or contractor staff or medical personnel as
appropriate.”120 Yet according to detainees, “staff obstructed or delayed their
grievances or intimidated them, through fear of retaliation, into not
complaining.”121 The report continued, “[t]hese deterrents may prevent
detainees from filing grievances about serious concerns that should be
addressed and resolved.”122
Despite these challenges, investigating detention experiences and
outcomes remains a critical task in light of the ongoing humanitarian and
legal concerns raised by immigration detention in the United States. In a
recent decision granting the habeas petition of Ravi Ragbir, a long-time New
York resident and an immigrant rights activist,123 U.S. District Judge
118. Det. Watch Network v. U.S. Immigration & Customs Enf’t, 215 F. Supp. 3d 256, 259–60
(S.D.N.Y. 2016).
119. Press Release, Det. Watch Network, Private Prison Corporations Thrown Out of Court, Feb.
8, 2017), https://www.detentionwatchnetwork.org/pressroom/releases/2017/private-prison-corporations-
thrown-out-court [https://perma.cc/3NKK-XEHX].
120. U.S. GOV’T ACCOUNTABILITY OFFICE, GAO-16-231, IMMIGRATION DETENTION:
ADDITIONAL ACTIONS NEEDED TO STRENGTHEN MANAGEMENT AND OVERSIGHT OF DETAINEE
MEDICAL CARE 28 (2016), https://www.gao.gov/assets/680/675484.pdf [https://perma.cc/ZZP8-4PFW].
121. OFFICE OF INSPECTOR GEN., U.S. DEP’T OF HOMELAND SEC., supra note 56, at 5.
122. Id.; see also AM. CIVIL LIBERTIES UNION OF N.M., supra note 109, at 35 (reporting that
detainees “refused to submit grievance forms or complaints exposing officer behavior because they feared
retaliation”).
123. In January 2018, Ravi Ragbir was taken into ICE custody during his regular check-in with
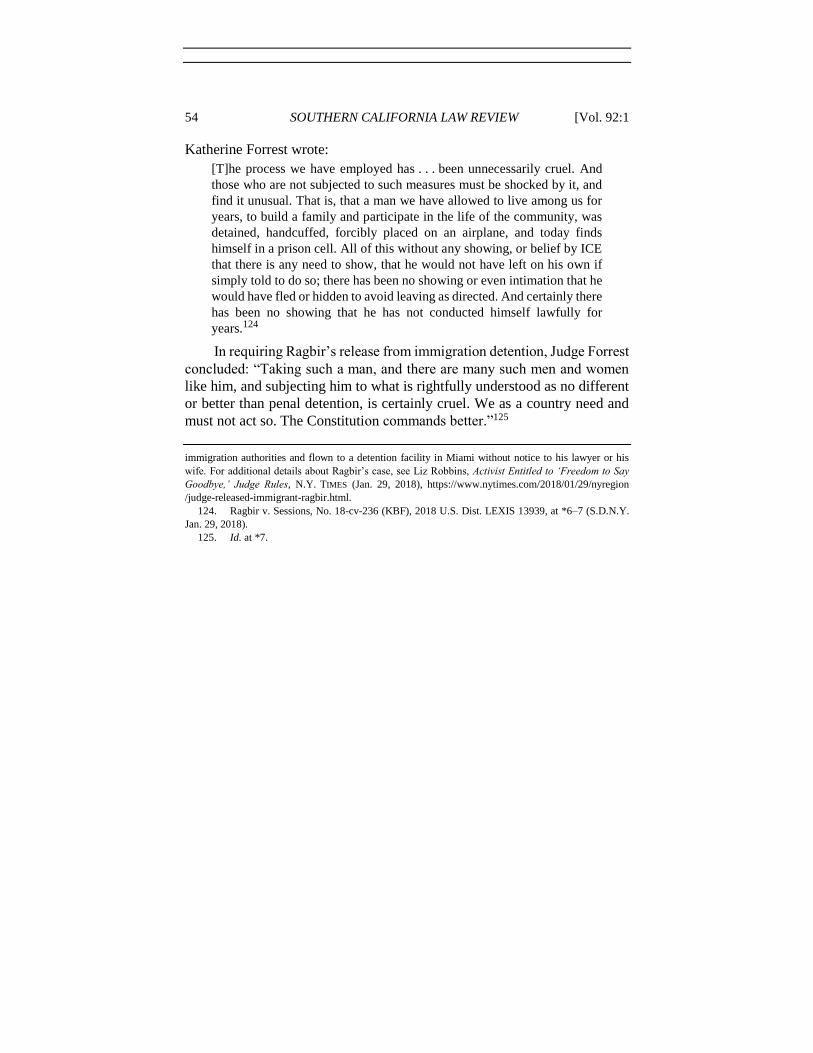
54 SOUTHERN CALIFORNIA LAW REVIEW [Vol. 92:1
Katherine Forrest wrote:
[T]he process we have employed has . . . been unnecessarily cruel. And
those who are not subjected to such measures must be shocked by it, and
find it unusual. That is, that a man we have allowed to live among us for
years, to build a family and participate in the life of the community, was
detained, handcuffed, forcibly placed on an airplane, and today finds
himself in a prison cell. All of this without any showing, or belief by ICE
that there is any need to show, that he would not have left on his own if
simply told to do so; there has been no showing or even intimation that he
would have fled or hidden to avoid leaving as directed. And certainly there
has been no showing that he has not conducted himself lawfully for
years.124
In requiring Ragbir’s release from immigration detention, Judge Forrest
concluded: “Taking such a man, and there are many such men and women
like him, and subjecting him to what is rightfully understood as no different
or better than penal detention, is certainly cruel. We as a country need and
must not act so. The Constitution commands better.”125
immigration authorities and flown to a detention facility in Miami without notice to his lawyer or his
wife. For additional details about Ragbir’s case, see Liz Robbins, Activist Entitled to ‘Freedom to Say
Goodbye,’ Judge Rules, N.Y. TIMES (Jan. 29, 2018), https://www.nytimes.com/2018/01/29/nyregion
/judge-released-immigrant-ragbir.html.
124. Ragbir v. Sessions, No. 18-cv-236 (KBF), 2018 U.S. Dist. LEXIS 13939, at *6–7 (S.D.N.Y.
Jan. 29, 2018).
125. Id. at *7.

2018] IMMIGRATION DETENTION 55
APPENDIX TABLES
APPENDIX TABLE A. Description of Variables Used in the Analyses
Variable Description Coding
Detainee Characteristics
Male Detainee’s recorded
gender.
1 = Yes, 0 = No
Region of Origin The world region in which
detainee’s recorded
citizenship country is
located. Asia Pacific
includes Asia and Oceania
regions. Northern Triangle
includes El Salvador,
Guatemala, and Honduras.
1 = Africa;
2 = Asia Pacific;
3 = Europe & North
America;
4 = Mexico;
5 = N. Triangle;
6 = Latin America
Age at First Entry
into Detention
Detainee’s recorded age at
first entry into detention for
any given custody period.
Years
Entry Status Detainee’s recorded legal
status at the time of last
U.S. entry.
1 = Seeking
Asylum/Refugee;
2 = Lawful
Permanent
Resident;
3 = Present Without
Admission;
4 = Other/Unknown
Has an Aggravated
Felony
The recorded status for
“Aggravated Felon” is a
“yes.”
1 = Yes, 0 = No
Facility Characteristics
Type of Operation
Privately Operated Facility is operated by a
for-profit company.
1 = Yes, 0 = No
Facility Location
Outside MSA Facility is located outside
of an MSA principal city.
1 = Yes, 0 = No
(continued on next page)

56 SOUTHERN CALIFORNIA LAW REVIEW [Vol. 92:1
APPENDIX TABLE A. Description of Variables Used in the Analyses
Variable Description Coding
Distance to Nearest
MSA
Driving distance from a
given facility to the nearest
MSA principal city.
Miles
Distance to Nearest
Nonprofit Attorney
Driving distance from a
given facility to the nearest
AILA attorney who
practices removal defense
at a legal services/nonprofit
organization or a law
school.
Miles
Distance to Nearest
Accredited
Representative
Driving distance from a
given facility to the nearest
accredited representative in
EOIR’s Recognition and
Accreditation Program.
Miles
Regional Location of
Facilities
The U.S. Census Bureau
region in which a given
facility is located.
1 = Midwest;
2 = Northeast;
3 = South;
4 = West;
5 = U.S. Territories
Facility Typea
Contract Detention
Facility
A detention facility owned
and operated by a private
company in the business of
providing detention
services under a
government contract.
1 = Yes, 0 = No
(continued on next page)

2018] IMMIGRATION DETENTION 57
APPENDIX TABLE A. Description of Variables Used in the Analyses
Variable Description Coding
Holding/Staging
Facility
A secure area where ICE
detainees may be
temporarily held, often co-
located in ICE field offices
and subfield offices. ICE
detention standards allow
individuals to be held in a
holding area for up to 12
hours, and in a staging
facility for up to 16 hours.
These facilities do not
provide sleeping quarters or
shower facilities.
1 = Yes, 0 = No
ICE Service
Processing Center
(“SPC”)
An ICE owned detention
facility used to house
individuals who have been
detained by ICE because of
questions about their
immigration status. SPCs
were formerly owned and
operated by ICE. Now,
however, SPCs are owned
by ICE but operated by
private sector companies.
The SPCs are among
several different types of
facilities commonly used
by ICE to house detainees.
1 = Yes, 0 = No
(continued on next page)

58 SOUTHERN CALIFORNIA LAW REVIEW [Vol. 92:1
APPENDIX TABLE A. Description of Variables Used in the Analyses
Variable Description Coding
Intergovernmental
Service Agreement
(“IGSA”)
IGSAs are agreements
between the federal
government and a state or
local government to
provide detention beds in
jails, prisons, and other
local or state government
detention facilities. While
government owned, these
facilities may be operated
by either local or state
agencies or by a private
company in the business of
providing detention
services. Some of these
facilities may even be
dedicated for federal use.
1 = Yes, 0 = No
Juvenile Facility Special facilities designated
for the housing of juveniles
while they are being
detained because of
questions regarding their
immigration status. These
are often operated by
religious, charitable or
nonprofit organizations.
Detention in these facilities
may be administered
directly by ICE or be
handled by the Office of
Refugee Resettlement.
1 = Yes, 0 = No
Other Facilities not falling within
one of the above categories,
including Federal Bureau
of Prisons, Medical
Facility, U.S. Marshals
Service Office, and motels
or hotels.
1 = Yes, 0 = No
(continued on next page)

2018] IMMIGRATION DETENTION 59
APPENDIX TABLE A. Description of Variables Used in the Analyses
Variable Description Coding
Detention Outcomes
Release Type
Continued Detention Continued to be detained at
the end of the data
extraction period.
1 = Yes, 0 = No
Granted Relief Included in this category
are detainees whose
recorded release reason is
“Proceedings Terminated,”
“Deferred Action for
Childhood Arrivals,”
“Deferred Action for
Parents of Americans and
Lawfully Admitted
Residents,” or
“Prosecutorial Discretion.”
1 = Yes, 0 = No
Paroled Released on parole. 1 = Yes, 0 = No
Removed Released due to removal to
country of origin.
1 = Yes, 0 = No
Temporarily Released Included in this category
are detainees whose
recorded release reason is
“Alternatives to
Detention,” “Bonded Out,”
“Order of Recognizance,”
or “Order of Supervision.”
1 = Yes, 0 = No
Voluntary Departure Included in this category
are detainees whose
recorded release reason is
“Voluntary Return” or
“Voluntary Departure.”
1 = Yes, 0 = No
(continued on next page)

60 SOUTHERN CALIFORNIA LAW REVIEW [Vol. 92:1
APPENDIX TABLE A. Description of Variables Used in the Analyses
Variable Description Coding
Other Included in this category
are detainees whose
recorded release reason is
“Died,” “Escaped,” “Office
of Refugee and
Resettlement,” or
“Withdrawal.”
1 = Yes, 0 = No
Days Detained Cumulative number of days
spent in detention at the
end of a given detention
stint.
Days
Number of Transfers Cumulative number of
recorded transfers at the
end of a given detention
stint.
Count
Number of Grievances Number of calls pertaining
to detention facilities
received by the ICE Office
of Enforcement and
Removal Operations’
Detention and Information
Line
Count
Notes: a The descriptions of the detention facility types were taken verbatim from About the
Data, TRANSACTIONAL RECORDS ACCESS CLEARINGHOUSE, http://trac.syr.edu/immigration
/reports/222 [https://perma.cc/9W9W-B2M7] (last visited Nov. 28, 2018).

2018] IMMIGRATION DETENTION 61
APPENDIX TABLE B. Top 15 Countries of Citizenship Among Individuals
Detained in FY2015
Country Percentage
Cumulative
Percentage N
Mexico 42.58 42.58 151,455
Guatemala 18.72 61.30 66,608
El Salvador 15.35 76.65 54,606
Honduras 11.95 88.60 42,500
Ecuador 1.04 89.64 3,713
India 0.91 90.55 3,226
Dominican Republic 0.86 91.41 3,072
China 0.58 91.99 2,046
Brazil 0.53 92.52 1,892
Nicaragua 0.51 93.03 1,823
Colombia 0.45 93.48 1,599
Jamaica 0.44 93.93 1,572
Haiti 0.38 94.30 1,345
Cuba 0.34 94.65 1,215
Bangladesh 0.28 94.93 1,000
Somalia 0.28 95.21 1,000

62 SOUTHERN CALIFORNIA LAW REVIEW [Vol. 92:1
APPENDIX TABLE C. Top Fifteen States by Facilities and Detainees,
FY2015
Facilities Detainees
Rank State Percentage N Rank State Percentage N
1 TX 18.03 115 1 TX 43.61 192,771
2 CA 10.97 70 2 CA 11.58 51,162
3 FL 6.74 43 3 AZ 10.02 44,283
4 NY 6.11 39 4 LA 5.99 26,481
5 AZ 5.17 33 5 NM 4.51 19,927
6 VA 3.45 22 6 GA 2.88 12,736
7 IL 3.29 21 7 FL 2.56 11,310
8 CO 2.66 17 8 NY 1.89 8,374
9 PA 2.51 16 9 NJ 1.53 6,772
10 MI 2.35 15 10 IL 1.53 6,765
11 OR 2.04 13 11 PA 1.48 6,543
12 MO 1.72 11 12 WA 1.44 6,356
12 MT 1.72 11 13 VA 1.01 4,460
12 WA 1.72 11 14 CO 0.83 3,682
15 LA 1.57 10 15 SC 0.82 3,603
15 MA 1.57 10
15 NC 1.57 10
METHODS APPENDIX
A. DETENTION DATA PREPARATION
To aid in our description of the Detention Data’s basic data structure,
we constructed an example set of records pertaining to a single detainee (see
Appendix Table D). The Initial Book-In Date is the date the detainee first
came into ICE custody. The Book-In Date and the Release Date,
respectively, refer to the date that the detainee was booked into and released
from a given facility. The Release Type contains information about what
happened to the detainee at the end of each record or detention stint. We
discuss the Begin Time and End Time variables in the next Section.

2018] IMMIGRATION DETENTION 63
We treated the records that share the same Initial Book-In Date as
constituting a single “custody period.” Appendix Table D shows that the
detainee had two custody periods. The first custody period consists of
Records 1 through 3. The second custody period consists of Records 4 and
5. We prepared the Detention Data for analysis by taking the following steps
to address any errors in ordering and issues related to duplicate or
overlapping records. First, we ordered the records by sorting on the unique
identification number associated with each detainee, Initial Book-In Date,
Book-In Date, Release Date, Release Type, and Facility Code. The Facility
Code is the unique identifier that ICE assigns to each facility.
Second, we identified and adjusted the records with overlapping
information, and we removed the records that contained duplicate
information. For example, if a given record contained Book-In and Release
Dates that were entirely nested within the immediately preceding record, and
the two records shared the same Facility Code, we dropped the nested record
(the record with the smaller date range).
APPENDIX TABLE D. Example Records of a Single Detainee
Rec-
ord
Facility
Code
Initial
Book-In
Date
Book-In
Date
Release
Date
Release
Type
Begin
Time
End
Time
1 A 1/29/15 1/29/15 2/4/15 transfer 0 6
2 B 1/29/15 2/4/15 2/7/15 transfer 6 9
3 C 1/29/15 2/9/15 2/9/15 transfer 11 11
4 D 2/10/15 2/11/15 2/12/15 transfer 13 14
5 A 2/10/15 2/12/15 2/15/15 bonded 14 17
B. GAPS IN CUSTODY PERIODS AND DETENTION STINTS
In Appendix Table D, we purposely inserted gaps in dates across some
of the records in order to illustrate how we addressed some of the analysis
issues arising from such gaps. The example in Appendix Table D contains a
gap of two days between Records 2 and 3, since Record 2 ends with a Release
Date of February 7th and Record 3 begins with a Book-in Date of February
9th. A total of 20,043 such gaps exist in the Detention Data pertaining to
about 5% of all detainees and less than 3% of all records. Approximately
91% of these gaps have a duration of one day.
The example in Appendix Table D also contains a gap of two days
between the first and second custody periods, since the first custody period
64 SOUTHERN CALIFORNIA LAW REVIEW [Vol. 92:1
ends with a Release Date of February 9th and the second custody period
begins with a Book-in Date of February 11th. A total of 772 such gaps exist
in the Detention Data pertaining to 0.22% of all detainees and 0.11% of all
records. The median for these gaps is five days (the range is 2 to 109 days).
For descriptive analyses involving such measures as the total number
of days spent in privately operated facilities and the total number days spent
in facilities located outside of MSA principal cities, we excluded these gaps
from our analyses since we were unable to observe where the detainees were
held during these gap periods. For the survival analyses in Table 3, we
counted these gaps as continuing periods of detention in generating our time-
to-event measure. Consider the Begin Time and End Time in Appendix
Table D. The Begin Time refers to the number of days passed since the Initial
Book-In Date at the start of each record. The End Time refers to the number
of days passed since the Initial Book-In Date at the end of each record. To
treat the gap periods as continuing periods of detention, we calculated the
Begin Time and End Time in reference to the Initial Book-In Date of the first
custody period regardless of the number of custody periods and regardless
of any gaps within and across custody periods.
We tested the robustness of our survival analyses by re-estimating each
of our regression models under these varying specifications: (1) excluding
the gap periods; (2) excluding the detainees with multiple custody periods;
and (3) excluding the gap periods and detainees with multiple custody
periods. The results of these robustness checks produced substantially
similar results as the results we present in Tables 3 and 5.
C. TRANSFERS
For any given detainee, the steps that we took to prepare the data (see
the Detention Data Preparation Section in the Methods Appendix) ensured
that within each custody period, consecutive records contained different
Facility Codes. We then coded each record as involving a transfer if a given
record’s Release Type was “transferred” or “U.S. Marshals or other agency.”
In calculating the total number of transfers, we excluded each detainee’s last
record. In effect, we did not treat the last record as involving a transfer even
if that record’s Release Type was “transferred” or “U.S. Marshals or other
agency,” since in such instances we could not calculate the distance between
the originating and receiving facilities.
Although ICE has represented that the Facility Code uniquely identifies
each facility, we found sixty-four records pertaining to sixty-one detainees
in which two consecutive records in a custody period differed in their Facility

2018] IMMIGRATION DETENTION 65
Codes but shared the same address. We suspect that these transfers involved
movements from one part of a building complex with one facility code, to
another part of the same building complex with a different facility code.
D. CODING FACILITIES AS PRIVATELY OPERATED
We classified detention facilities as privately operated using the
following steps. First, we used a list of facilities compiled by the
Enforcement and Removal Operations’ Custody Management Division. This
list contains information about 208 facilities that were in use during fiscal
year 2015, including an indicator of whether any given facility was operated
by a private for-profit company (for example, GEO Group), or local
government (for example, a county or city sheriff’s department).
Second, we reviewed a set of contracts available in ICE’s FOIA library
that pertain to agreements between ICE and private for-profit companies. We
then used the Wayback Machine to examine archived versions of the
companies’ websites to compile a list of all facilities that the companies
operated in fiscal year 2015. Although we recognize that a facility that was
privately operated in fiscal year 2015 may not have been privately operated
in earlier fiscal years, our coding is time-invariant. A total of 46,202 records
(6% of records) pertaining to 23,492 detainees (3% of detainees) in the
Detention Data pre-date fiscal year 2015.a
E. DISTANCE MEASURES
Rather than use a straight-line measure of distance based on changes in
latitude and longitude coordinates, we used the distance generated by Google
Maps based on driving routes between various points of interest. The
advantage of using the driving distance is that by accounting for the existence
or nonexistence of roads, freeways, interstates, mountains, bodies of water,
and other geographical features of land, we better approximate the actual
distance that legal counsel, kin, or advocates would have to travel to reach a
given facility.
The use of driving distance, however, poses challenges for measuring
distances involving points of interest that are surrounded by seas and oceans.
While we can measure the driving distance to the nearest MSA principal city
in Oahu, Hawaii and in Puerto Rico because those two islands contain MSA
principal cities, we cannot do the same for other U.S. territories and Sitka,
Alaska, which do not have MSAs. We thus treat the facilities in latter
a. Likewise, our measure of distance to the nearest EOIR accredited representative is time-
invariant because our coding is based on the list that the EOIR published in fiscal year 2015.
66 SOUTHERN CALIFORNIA LAW REVIEW [Vol. 92:1
locations (N=7) as missing on Distance to Nearest MSA. The same problem
exists in terms measuring the driving distance to the nearest nonprofit
immigration attorney, and the driving distance to the nearest accredited
representative. In locations like Sitka, Alaska, where such attorneys or
representatives do not exist, crossing a body of water is necessary to reach
the nearest attorney or representative. We treat the facilities in these types of
locations as missing on Distance to Nearest Nonprofit Attorney (N=16), and
Distance to Nearest Accredited Representative (N=14).
To estimate the distance between facilities involved in inter-facility
transfers, however, we implemented a different strategy. Because distance
measures for inter-facility transfers represent actual distances that detainees
were required to travel (whether by air or ground transportation), excluding
facilities that are located in territories, Hawaii, and Sitka, Alaska, would
result in a significant underestimation of these distances. Thus, we rely on
the driving distance wherever driving between a given pair of facilities is
possible, and on the Haversine formula (a straight-line distance measure)
wherever a transfer necessitates crossing a body of water.
F. GEOCODING FACILITIES
To obtain latitude and longitude coordinates for the facilities in the
Detention Data, we used a multi-pronged approach. First, we matched the
facilities in the Detention Data to the facilities in the National Immigrant
Justice Center’s ICE detention facility list (“NIJC Data”), which the NIJC
obtained from ICE through a FOIA request.b The NIJC Data contains
addresses for the facilities included in its list. The matching process allowed
us to assign addresses to 521 of the 679 facilities in the Detention Data
(77%). We then used the geocode function of R’s ggmap package to assign
geocoordinates to each of the 521 facilities.c
For the remaining 158 facilities in the Detention Data, we found the city
and state in which each facility is located using information included in the
TRAC detention facility reports.d We then queried Google Maps using the
b. Nat’l Immigrant Justice Ctr., ICE Detention Facil i t ies as of November 2017 ,
https://immigrantjustice.org/ice-detention-facilities-november-2017 [https://perma.cc/6NLR-TXBH]
(last visited Nov. 28, 2018).
c. For a detailed discussion on R’s ggmap package, see David Kahle & Hadley Wickham, ggmap:
Spatial Visualization with ggplot2, 5 R J. 144 (2013).
d. Detention Facility Reports: Transfers, TRANSACTIONAL RECORDS ACCESS CLEARINGHOUSE,
http://trac.syr.edu/immigration/detention/tran.shtml [https://perma.cc/NLD9-TFMV] (last updated Sept.
2015); Detention Facility Reports: Departures from ICE Detention, TRANSACTIONAL RECORDS ACCESS
CLEARINGHOUSE, http://trac.syr.edu/immigration/detention/exit.shtml [https://perma.cc/AF58-BZ6Q]
(last updated Sept. 2015).

2018] IMMIGRATION DETENTION 67
facility name and its city and state. As shown in Appendix Table E (see
Google Maps category), we were able to assign geocoordinates to eighty-one
additional facilities in the Detention Data (12%) using this method.
To assign geocoordinates for the rest of the facilities in the Detention
Data, Google Maps required additional information beyond facility name,
city, and state. We compiled the addresses for most of these facilities using
the following sources: (1) the yellow page directories; (2) the websites of the
non–profit and for-profit organizations that operated the facilities; (3) the
websites of governmental entities, including the Bureau of Prisons, U.S.
Marshals Service, and county and city correctional departments; (4) the
Global Detention Project website; and (5) the websites of various third party
agencies describing or evaluating the facilities.e We were able to assign
geocoordinates to another 10% of the facilities in the Detention Data using
the facility addresses we compiled from these sources (see Yellow Pages,
Operating Organization Websites, Government Websites, Global Detention
Project Website, and Other Sources categories).
Finally, for the remaining 3% of facilities in the Detention Data for
which we could not assign geocoordinates using the above methods, we
assigned them geocoordinates that corresponded to the city and state where
the facility is located (see City and State Information (TRAC) category). All
of these facilities were one of several branches operated by the same non–
profit organizations located within same cities.
APPENDIX TABLE E. Sources Used to Identify Facility Locations
Source Facilities Percentage
NIJC Data 521 76.73
Google Maps 81 11.93
Yellow Pages 25 3.68
Operating Organization Websites 21 3.09
Government Websites 4 0.59
Global Detention Project Website 4 0.59
Other Sources 4 0.59
City and State Information (TRAC) 18 2.65
Total 679 100
e. Given the number of unique websites we reference in this Section, we do not list them here
individually, but they are available upon request from the authors.

68 SOUTHERN CALIFORNIA LAW REVIEW [Vol. 92:1