Embed Size (px)
Citation preview
A National County-Level Long Distance Travel
Model
Mike Chaney, AICPTian Huang, PE, AICP, PTOE
Binbin Chen, AICP
15th TRB National Transportation Planning Applications ConferenceMay 19, 2015
#TRBAppCon @Alliance_Trans
Project Background
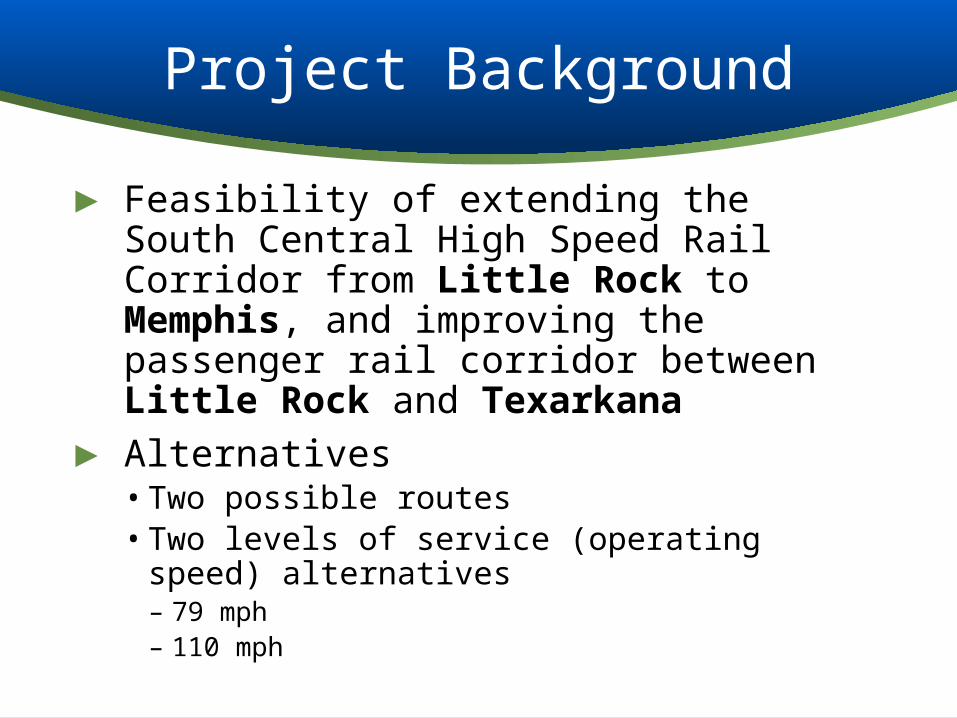
► Feasibility of extending the South Central High Speed Rail Corridor from Little Rock to Memphis, and improving the passenger rail corridor between Little Rock and Texarkana
► Alternatives• Two possible routes• Two levels of service (operating speed) alternatives
– 79 mph – 110 mph

Project Location

Team
► Arkansas State Highway and Transportation Department (AHTD)• FRA grant
► Alliance Transportation Group
Existing Tools
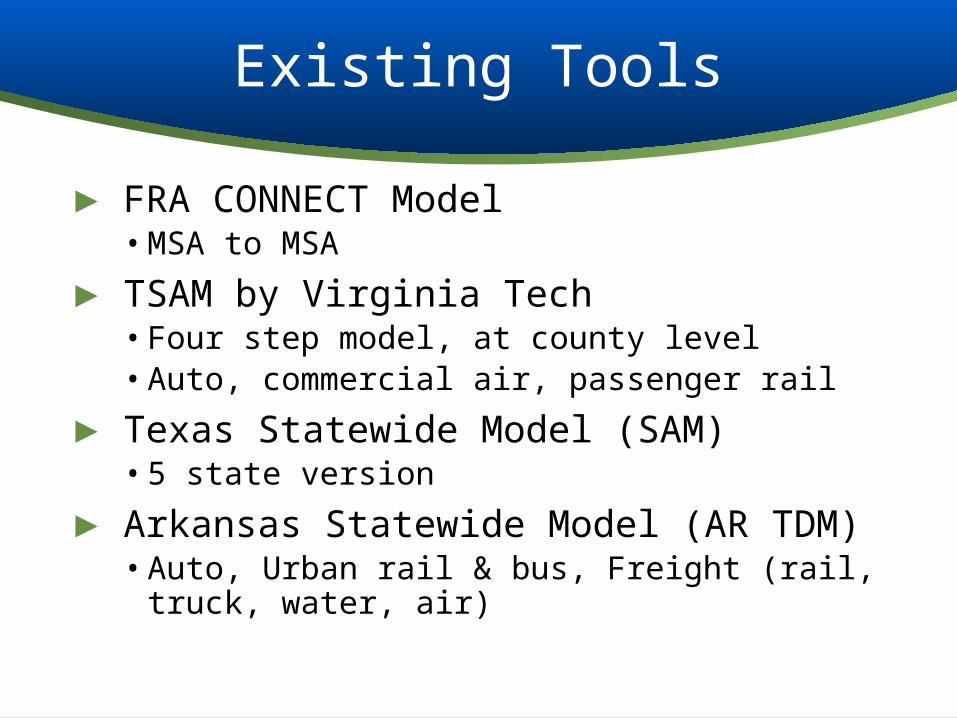
► FRA CONNECT Model• MSA to MSA
► TSAM by Virginia Tech• Four step model, at county level• Auto, commercial air, passenger rail
► Texas Statewide Model (SAM)• 5 state version
► Arkansas Statewide Model (AR TDM)• Auto, Urban rail & bus, Freight (rail, truck, water, air)
Future Tools
► FHWA on-going efforts to model long distance travel• A National Model System to Forecast Long Distance
Passenger Travel • Trips over 50 miles made by auto, air, rail or bus
► AASHTO – National Travel Demand Forecasting Model • Phase I final scope - NCHRP report 8-36-70
Why Build a National County-Level Long Distance Model
► No readily available tool ► Data sources typically national ► A national model allows for the evaluation of
alternative corridors ► It is reusable/transferable with little modification
Challenges in Building the Model
► Long distance travel survey data• National datasets:
– 1995 ATS– 2001 NHTS– 2009 NHTS
► Networks• AMTRAK network • Air network • Intercity bus network
► Schedule

Model Overview
► Trip is defined as trips over 100 miles, travels within the lower 48 states
► Zones: 3,076 counties in the lower 48 continental states of the US
► Networks:• Highway network• Multimodal Transit
networks– Air– AMTRAK– Intercity bus– Potential rail routes

Model Overview – Flow Chart
Trip Generation
• Party size models
• 1995 ATS• W&P
demographics
• CTPP
Trip Distribution
• Trips are distributed by: party size, income and purpose
• 1995 ATS
Mode Choice
• Trips are split into modes by party size and income and purpose

Model Overview –Trip Generation
► Trip purpose:• Business• Non-business
► Trip rates:• Data source: 1995 ATS• By party size, household size, household income, and
area type• 10.1 long distance person round trips per household
annually• 22.8% business trips, 77.2% non-business trips
Model Overview – Party Size
► Party Size Model:• Estimated from 1995 ATS for each trip purpose• Binary choice between travel alone or travel in group• Applied during trip generation
Model Overview – Trip Distribution
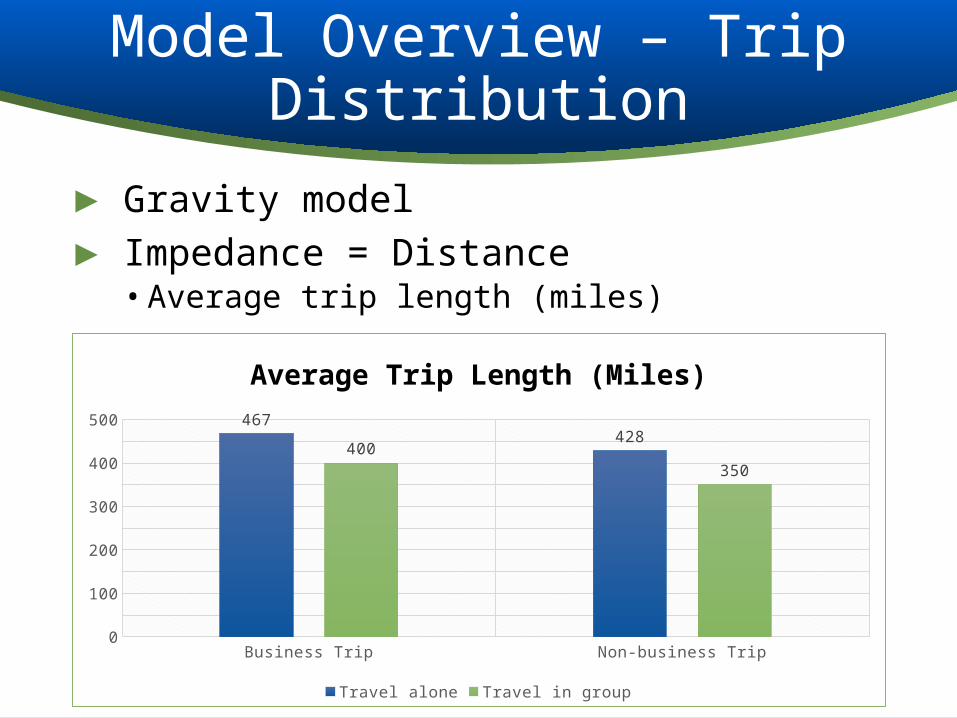
► Gravity model► Impedance = Distance• Average trip length (miles)
Business Trip Non-business Trip0
50
100
150
200
250
300
350
400
450
500 467428
400
350
Average Trip Length (Miles)
Travel alone Travel in group
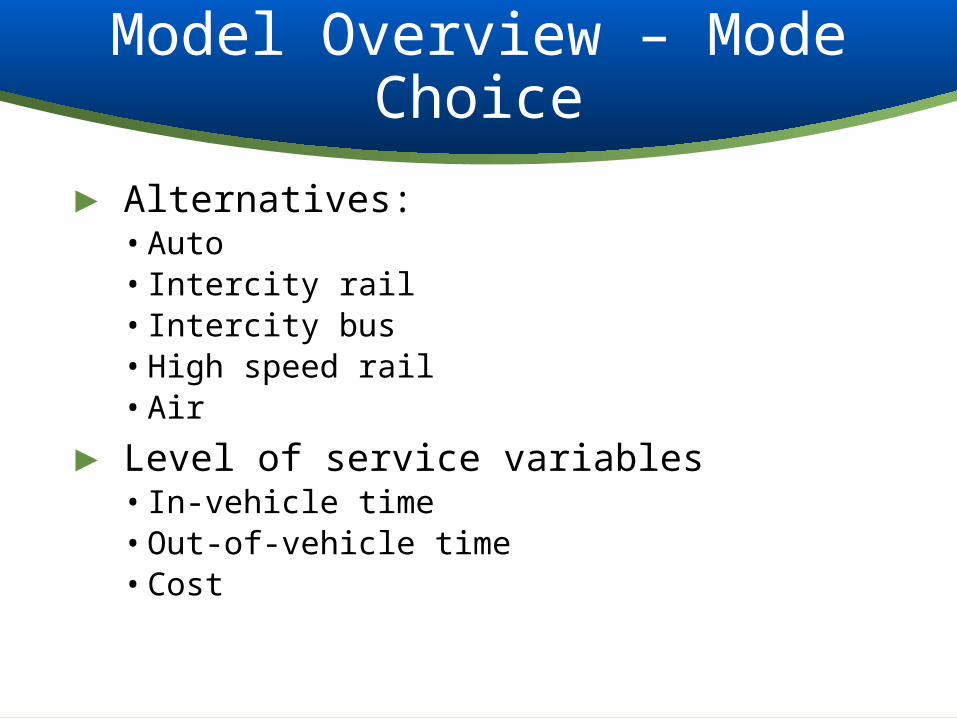
Model Overview – Mode Choice
► Alternatives: • Auto• Intercity rail• Intercity bus • High speed rail• Air
► Level of service variables• In-vehicle time • Out-of-vehicle time • Cost

Validation Data
► AMTRAK ridership• AMTRAK provided ridership relevant to the study
corridor• AMTRAK fiscal year report
► Air ridership• FAA domestic T-100 segment data
► Comparison are made for:• System total• By route• By airport
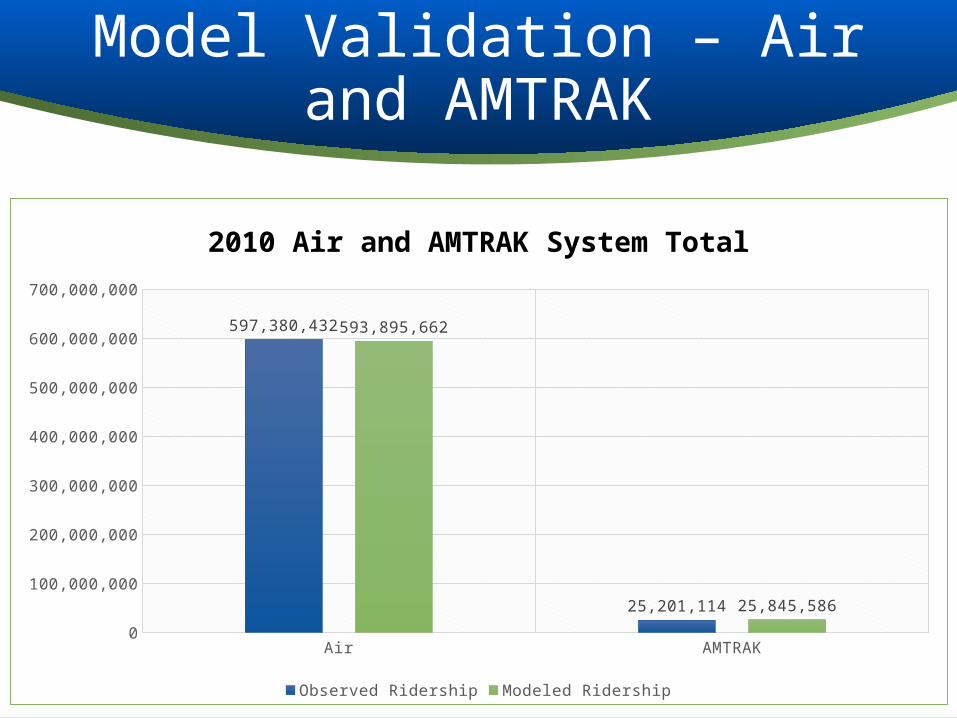
Model Validation – Air and AMTRAK
Air AMTRAK0
100,000,000
200,000,000
300,000,000
400,000,000
500,000,000
600,000,000
700,000,000
597,380,432
25,201,114
593,895,662
25,845,586
2010 Air and AMTRAK System Total
Observed Ridership Modeled Ridership
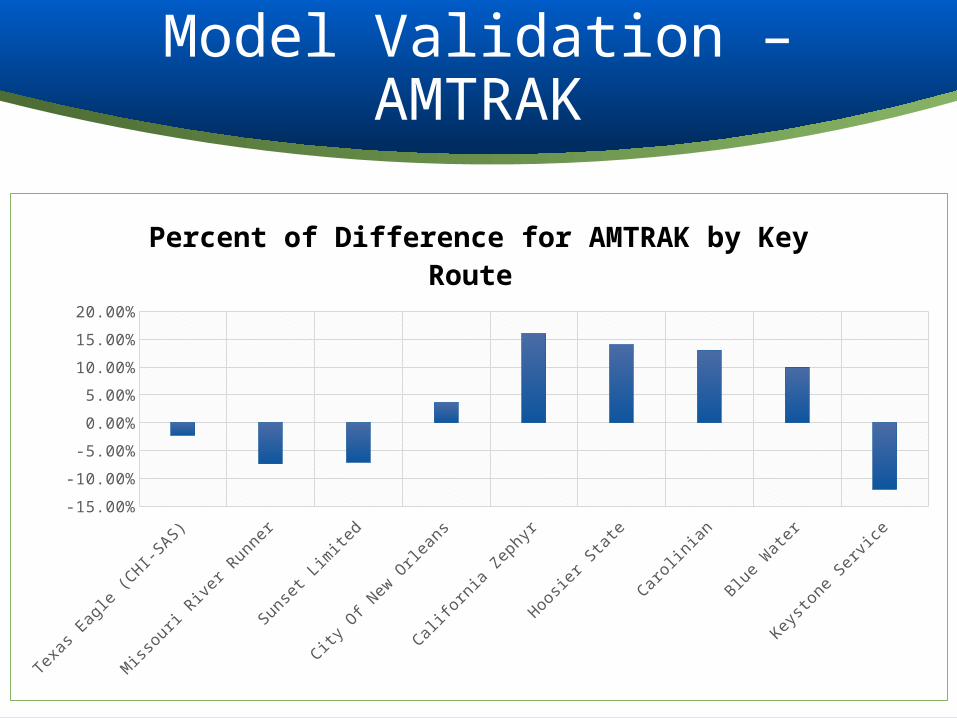
Model Validation – AMTRAK
Texas E
agle (CHI-S
AS)
Miss
ouri Rive
r Runner
Sunse
t Lim
ited
City O
f New O
rleans
Californ
ia Zephyr
Hoosier S
tate
Carolin
ian
Blue Water
Keystone Se
rvice
-15.00%
-10.00%
-5.00%
0.00%
5.00%
10.00%
15.00%
20.00%
Percent of Difference for AMTRAK by Key Route

Model Validation – Key Airports
Atlanta
Denver
Las V
egas
Los A
ngeles
Phoenix
St. Lo
uis
Memphis
Nashvil
le
Jackso
n
Little Rock
Metairi
e
Oklahoma City
Dallas
Houston
Chicago
New York
San Fr
ancisco
Los A
ngeles -
5,000,000
10,000,000
15,000,000
20,000,000
25,000,000
30,000,000
35,000,000
40,000,000
2010 Passenger Enplanement for Selected Airports
Observed Modeled
Project Status
► Stayed on Schedule► Submitted Ridership to FRA► Service Development Plan► Alternative Analysis ► Highway Impacts
Works with Statewide Model
► Designed to work Arkansas Statewide Model• Arkansas statewide model passenger trip purposes:
– Short trip: less than 100 miles– Long distance trips: 100 miles or above, separated by
business/non-business trips

Take Away
► Easily transferable► Validated to AMTRAK ridership► Potential Enhancements:• Refine model when newer survey data is available• Add special generators for tourist oriented areas• Expand intercity bus network• Backcast to 1995