Embed Size (px)
Citation preview
50 Top Cardiovascular Hospitals, 2018A National Benchmarks Report
Prepared For:Sample HospitalCity, STMedicare ID: 999999
Sample Hospital
Report Methodology NotesCOMPARISON GROUPSSo that we can compare your hospital with others most like it, we assign each hospital to one of three comparison groups according to size, teaching status, and residency/fellowship program involvement:
• Teaching hospitals with cardiovascular residency programs (CARDIO TEACHING)
• Teaching hospitals without cardiovascular residency programs (TEACHING)
• Community hospitals (COMMUNITY)BENCHMARK AND PEER GROUPSIn the Watson Health 50 Top Cardiovascular Hospitals study, we select 50 Benchmark hospitals (winners) based on overall performance in the most recent year of data available:
CARDIO TEACHING 15TEACHING 20COMMUNITY 15
Peer group hospitals include all U.S. hospitals in our study database, excluding benchmark hospitals.INCLUDED PATIENT GROUPSThe focus of the study is on hospitals that offer both medical and surgical treatment options for patients with two of the most common cardiovascular conditions — coronary atherosclerosis and heart failure. We include data for acute myocardial infarction (AMI), heart failure (HF), coronary artery bypass graft (CABG) and primary percutaneous coronary intervention (PCI) patients in our analysis. Patients are assigned to mutually exclusive groups, as follows:
• CABG patients (primary or secondary)• PCI patients (excludes open chest coronary artery angioplasty)• AMI patients (restricted to non-surgical)• HF patients (restricted to non-surgical)
Patients with both PCI and CABG are grouped as CABG. Patients with both AMI and HF are excluded.POA METHODOLOGY NOTESPresent on Admission (POA) coding is used in risk models for inpatient mortality, complications, average LOS, and cost per case. Due to increasing numbers of diagnoses with invalid POA code ‘0’, we made the following
adjustments to the MEDPAR data:1) Original, valid (Y, N, U, W, or 1) POA codes attached to diagnoses
were retained2) Where a POA code of ‘0’ appeared, we took the next four steps:
a. We treated all principal diagnoses (dx) as ‘present on admission’b. We treated all secondary dx on the CMS exempt list as ‘exempt’c. We treated secondary diagnoses for which the POA code ‘Y’ or
‘W’ appeared more than 50 percent of the time in Watson Health’s all-payer database, as ‘present on admission’
d. All others were treated as ‘not present’RANK WEIGHTS AND PUBLIC DATA SOURCES
Ranked Performance Metric Current Wt
Trend Wt Source
Risk-Adjusted IP Mortality (AMI, HF, CABG, PCI)
1/2 ea 1/2 ea MEDPAR FFY1 2011 - 2016
Risk-Adjusted Complications (CABG, PCI)
1/4 ea 1/4 ea MEDPAR FFY1 2011 - 2016
Percent CABG Patient with IMA Use 1/2 1/2 MEDPAR FFY1 2011 - 2016
30-Day Mortality2 Rate (AMI, HF, CABG)
1/6 ea 1/4 eaCMS Hospital Compare: 3-yr datasets ending Jun 30 in 2012, 2013, 2014, 2015, 2016
30-Day Readmission3 Rate (AMI, HF, CABG)
1/6 ea 1/4 eaCMS Hospital Compare: 3-yr datasets ending Jun 30 in 2012, 2013, 2014, 2015, 2016
Severity-Adjusted ALOS (AMI, HF, CABG, PCI)
1/4 ea 1/4 ea MEDPAR FFY1 2012 - 2016
Wage- and Severity-Adjusted Average Cost per Case (AMI, HF, CABG, PCI)
1/4 ea 1/4 ea MEDPAR FFY1 2012 - 2016
30-Day Episode Payment (AMI, HF) 1/2 ea * CMS Hospital Compare July 1, 2013 – June 30, 2016
1 Federal Fiscal Year is Oct 1 through Sep 30.2 No trend data available for CABG 30-day mortality rates.3 No trend data available for CABG 30-day readmission rates.* No trend data available for 30-day payment measures.
FOR MORE INFORMATIONFor a Study Overview, with full details on performance measures, methods used and winner list, visit www.100tophospitals.com.
Watson Health © IBM Corporation 2017 2 of 38
Sample Hospital
50 Top Cardiovascular Hospitals Performance MatrixINTEGRATED HOSPITAL PERFORMANCE COMPARISON
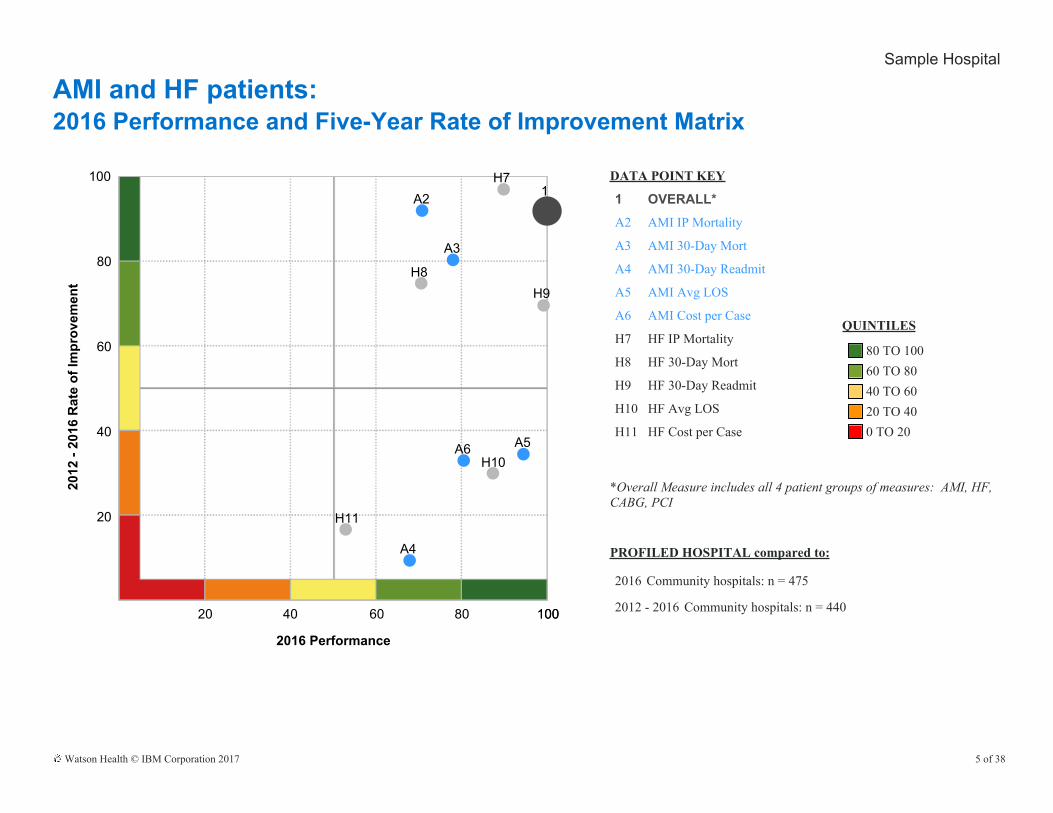
The 50 Top Cardiovascular Hospitals Performance Matrix, in a single view, compares your hospital’s current level of performance achievement and five-year rate of improvement in percentiles. These percentiles are based on your hospital’s rank, overall and by measure, within your comparison group. This integrated performance comparison provides insight into the success of hospital performance improvement strategies relative to other similar hospitals.
INTERPRETING HOSPITAL PERFORMANCE
The matrix “Overall” dot displays your national rank percentile for current overall performance with your national rank percentile for five-year overall rate of improvement. Rank percentiles for each individual measure are also graphed. Measures may fall into any one of four quadrants: Declining (lower left), Improving (upper left), Leading (upper right), or At-Risk (lower right).
Overall hospital performance in the most current year is a composite score based on the weighted sum of the ranks of individual measures. This sum is used to rank your hospital within your comparison group and produce your 2016 Performance Percentile.
Overall hospital performance on five-year rate of improvement is also a composite score based on the sum of the weighted ranks of individual measures on improvement. This sum is used to rank your hospital within your comparison group and produce your 2012-2016 Rate of Improvement Percentile.
50 Top Cardiovascular Hospitals award winners are selected based on highest current overall performance. Winners fall into either the “Leading” or “At-Risk” quadrants, depending on their five-year rate of improvement. Those with a high rate of improvement will be “Leading” performers and those who have fallen behind their comparison group mean are “At Risk” for falling out of the winner circle, if performance improvement continues to be stalled.
PERFORMANCE MATRIX NOTES
Overall Dot
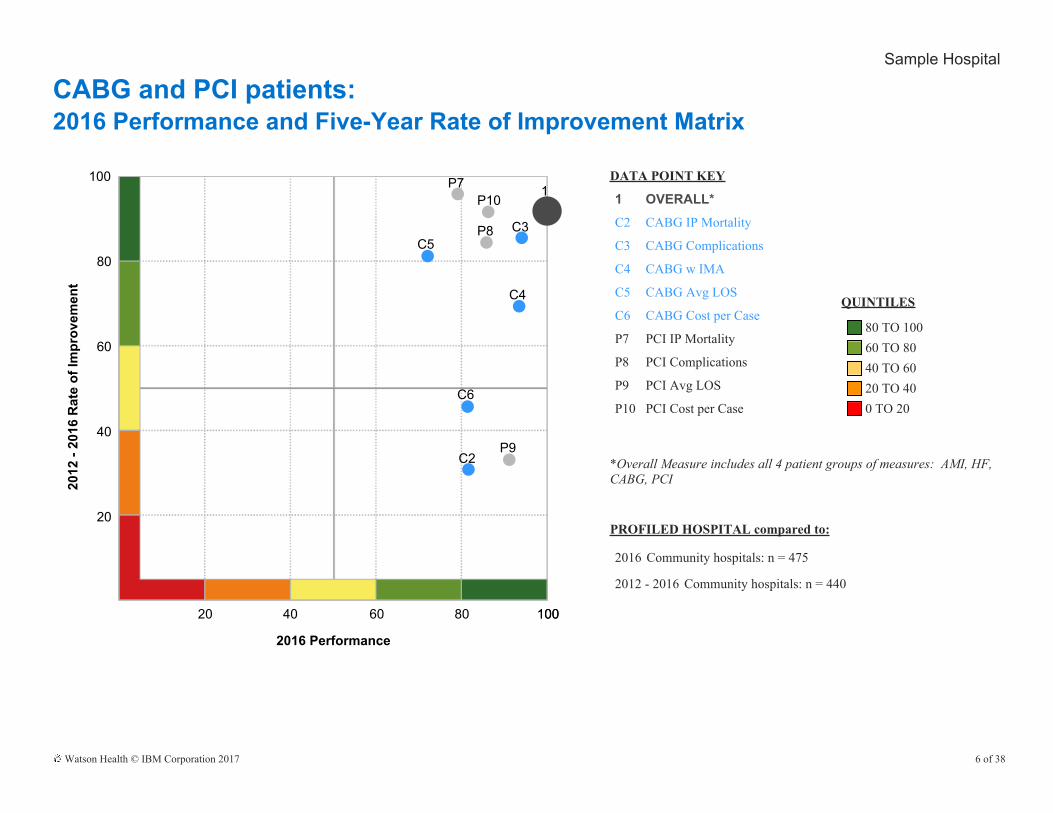
Due to the number of individual measures in this study, two matrix graphs are provided to better visualize the performance of each measure. One graph shows the medical patient group measures (AMI and HF) and the other shows the surgical patient group measures (CABG and PCI). However, the “Overall” dot on each matrix graph represents the hospital overall performance and rate of improvement based on all measures and patient groups, combined (AMI, HF, CABG, PCI). Therefore, it is identical on each matrix graph.
Missing Matrix Graphs
The matrix graphs will be missing if your hospital did not have enough years of data to be trended. A minimum of four years of data, including the most current year, are required. There also will be no Trend Profile section in the report.
If there were too few years of data for one or more measures, but not all, there will be no matrix graphs; but there will be a Trend Profile section with graphs for the measures that were not missing. Notes on excluded data points are in the Appendix following the Trend Profile.
Missing Measure Dots
A measure dot will be missing from the matrix if your hospital had too few useable data points (after outlier exclusions) to calculate a regression line t-statistic, which is the ranked variable. If this occurs, the dot for the affected measure(s) will be missing on the matrix graph and there will be no “Overall” dot. In addition, data points will be missing from the affected measure graphs in the Trend Profile. Notes on excluded data points are in the Appendix following the Performance Matrix graph and the Trend Profile.
Watson Health © IBM Corporation 2017 3 of 38
Sample Hospital
50 Top Cardiovascular Hospitals Performance Comparison Group
Profiled hospital compared to Community hospitals
Watson Health © IBM Corporation 2017 4 of 38
Sample Hospital
AMI and HF patients:2016 Performance and Five-Year Rate of Improvement Matrix
20
40
60
80
100
20 40 60 80 100100
1 A2
A3
A4
A5 A6
H7
H8 H9
H10
H11
2016 Performance
2012
- 20
16 R
ate
of Im
prov
emen
t
DATA POINT KEY
1 OVERALL*A2 AMI IP Mortality
A3 AMI 30-Day Mort
A4 AMI 30-Day Readmit
A5 AMI Avg LOS
A6 AMI Cost per Case
H7 HF IP Mortality
H8 HF 30-Day Mort
H9 HF 30-Day Readmit
H10 HF Avg LOS
H11 HF Cost per Case
QUINTILES
80 TO 100 60 TO 80 40 TO 60 20 TO 40 0 TO 20
*Overall Measure includes all 4 patient groups of measures: AMI, HF, CABG, PCI
PROFILED HOSPITAL compared to:
2016 Community hospitals: n = 475
2012 - 2016 Community hospitals: n = 440
Watson Health © IBM Corporation 2017 5 of 38
Sample Hospital
CABG and PCI patients:2016 Performance and Five-Year Rate of Improvement Matrix
20
40
60
80
100
20 40 60 80 100100
1
C2
C3
C4
C5
C6
P7
P8
P9
P10
2016 Performance
2012
- 20
16 R
ate
of Im
prov
emen
t
DATA POINT KEY
1 OVERALL*C2 CABG IP Mortality
C3 CABG Complications
C4 CABG w IMA
C5 CABG Avg LOS
C6 CABG Cost per Case
P7 PCI IP Mortality
P8 PCI Complications
P9 PCI Avg LOS
P10 PCI Cost per Case
QUINTILES
80 TO 100 60 TO 80 40 TO 60 20 TO 40 0 TO 20
*Overall Measure includes all 4 patient groups of measures: AMI, HF, CABG, PCI
PROFILED HOSPITAL compared to:
2016 Community hospitals: n = 475
2012 - 2016 Community hospitals: n = 440
Watson Health © IBM Corporation 2017 6 of 38
Sample Hospital
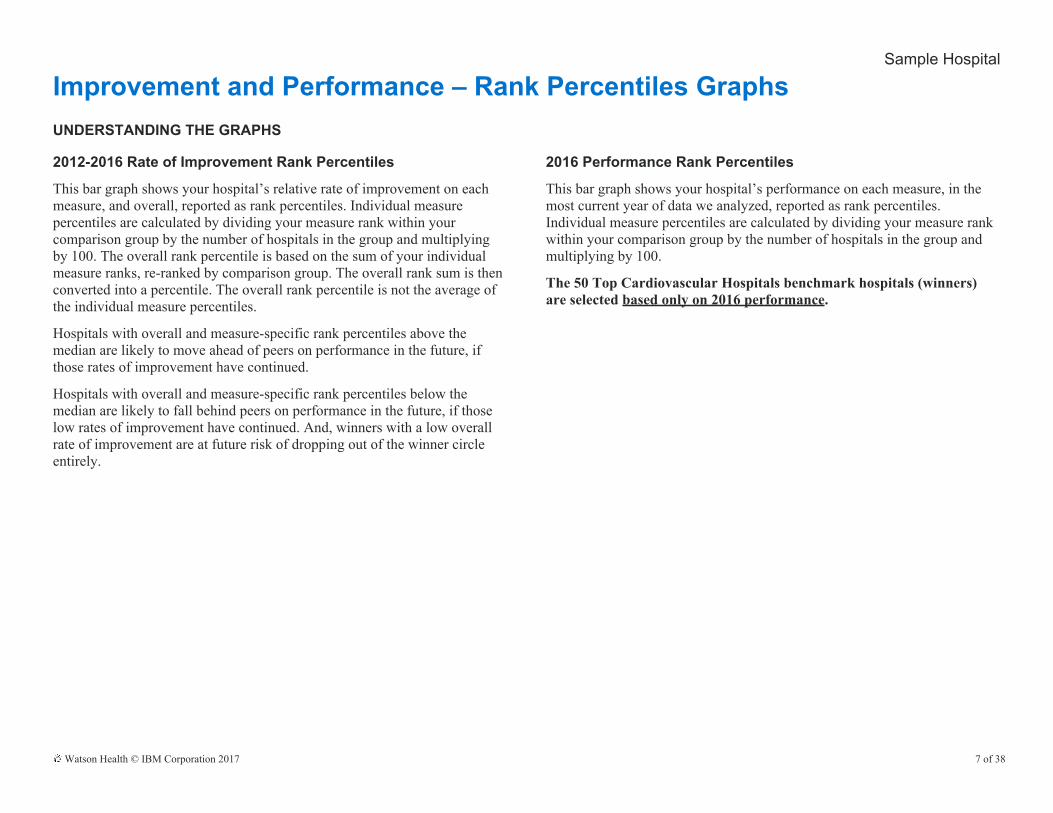
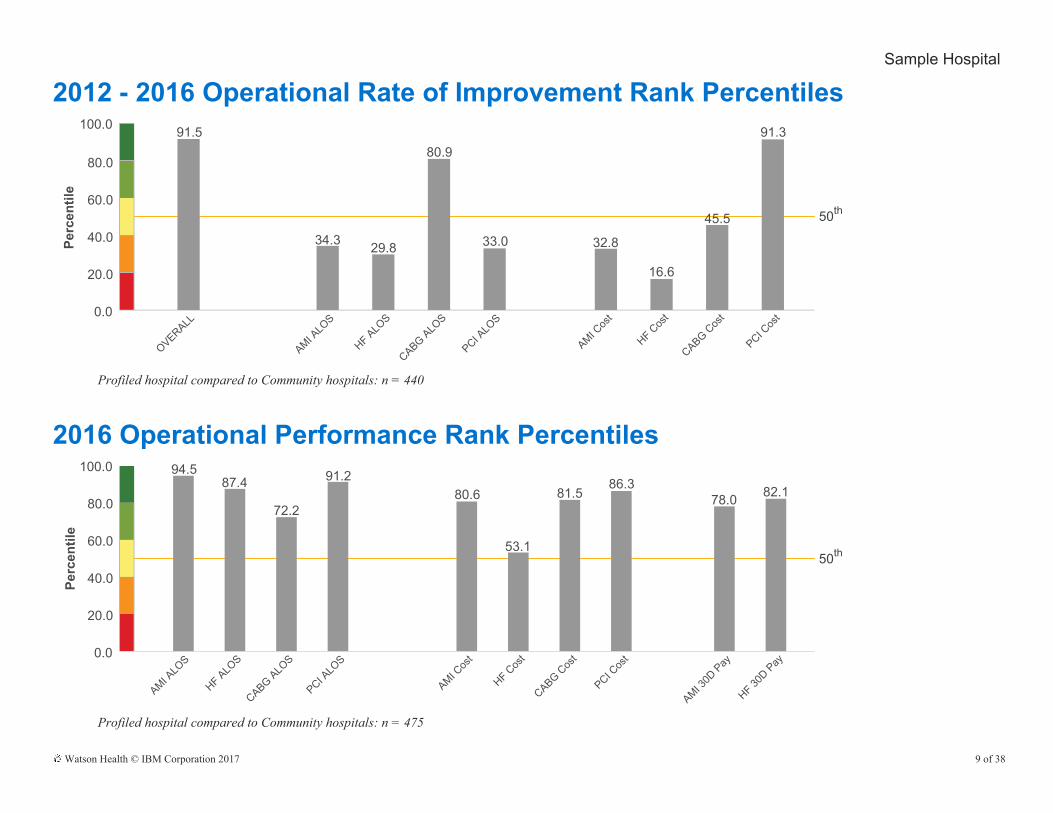
Improvement and Performance – Rank Percentiles GraphsUNDERSTANDING THE GRAPHS
2012-2016 Rate of Improvement Rank Percentiles
This bar graph shows your hospital’s relative rate of improvement on each measure, and overall, reported as rank percentiles. Individual measure percentiles are calculated by dividing your measure rank within your comparison group by the number of hospitals in the group and multiplying by 100. The overall rank percentile is based on the sum of your individual measure ranks, re-ranked by comparison group. The overall rank sum is then converted into a percentile. The overall rank percentile is not the average of the individual measure percentiles.
Hospitals with overall and measure-specific rank percentiles above the median are likely to move ahead of peers on performance in the future, if those rates of improvement have continued.
Hospitals with overall and measure-specific rank percentiles below the median are likely to fall behind peers on performance in the future, if those low rates of improvement have continued. And, winners with a low overall rate of improvement are at future risk of dropping out of the winner circle entirely.
UNDERSTANDING THE GRAPHS
2016 Performance Rank Percentiles
This bar graph shows your hospital’s performance on each measure, in the most current year of data we analyzed, reported as rank percentiles. Individual measure percentiles are calculated by dividing your measure rank within your comparison group by the number of hospitals in the group and multiplying by 100.
The 50 Top Cardiovascular Hospitals benchmark hospitals (winners) are selected based only on 2016 performance.
Watson Health © IBM Corporation 2017 7 of 38
Sample Hospital
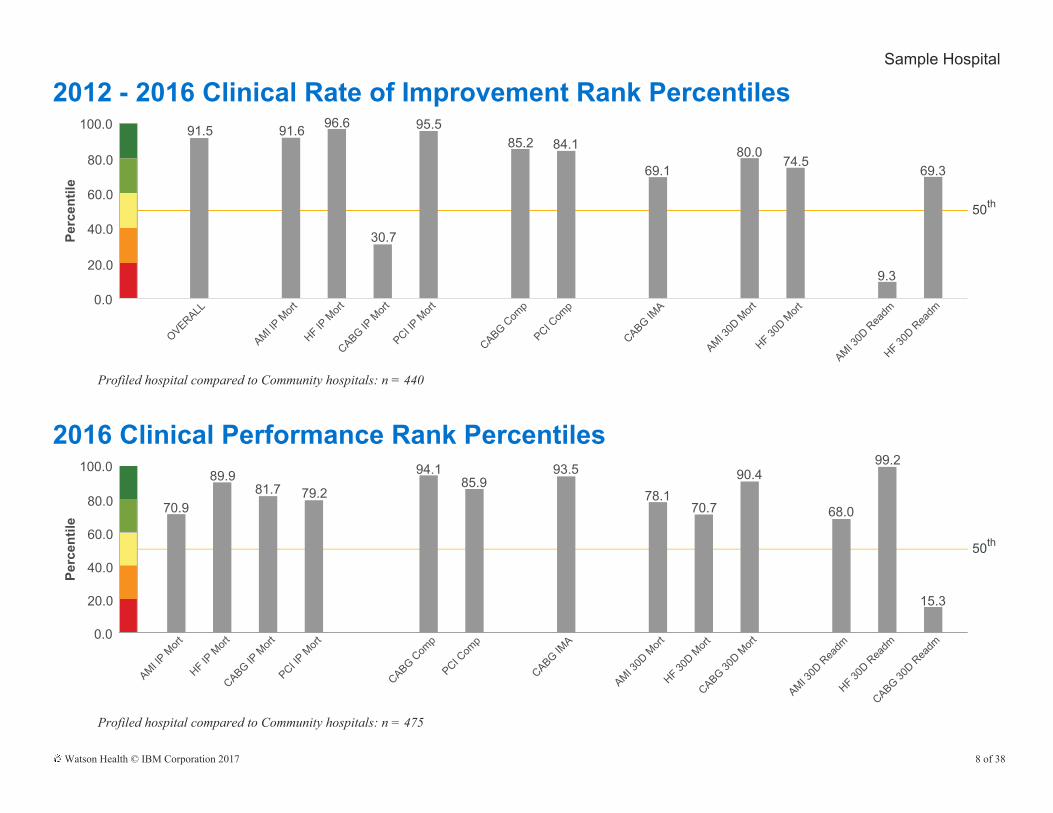
2012 - 2016 Clinical Rate of Improvement Rank Percentiles
0.0
20.0
40.0
60.0
80.0
100.0
OVERALL
AMI IP M
ort
HF IP M
ort
CABG IP M
ort
PCI IP M
ort
CABG Com
p
PCI Com
p
CABG IMA
AMI 30D
Mort
HF 30D M
ort
AMI 30D
Rea
dm
HF 30D R
eadm
91.5 91.6 96.6
30.7
95.585.2 84.1
69.180.0
74.5
9.3
69.3
Perc
entil
e
50th
Profiled hospital compared to Community hospitals: n = 440
2016 Clinical Performance Rank Percentiles
0.0
20.0
40.0
60.0
80.0
100.0
AMI IP M
ort
HF IP M
ort
CABG IP M
ort
PCI IP M
ort
CABG Com
p
PCI Com
p
CABG IMA
AMI 30D
Mort
HF 30D M
ort
CABG 30D M
ort
AMI 30D
Rea
dm
HF 30D R
eadm
CABG 30D R
eadm
70.9
89.981.7 79.2
94.185.9
93.5
78.170.7
90.4
68.0
99.2
15.3
Perc
entil
e
50th
Profiled hospital compared to Community hospitals: n = 475
Watson Health © IBM Corporation 2017 8 of 38
Sample Hospital
2012 - 2016 Operational Rate of Improvement Rank Percentiles
0.0
20.0
40.0
60.0
80.0
100.0
OVERALL
AMI ALO
S
HF ALOS
CABG ALOS
PCI ALO
S
AMI Cos
t
HF Cos
t
CABG Cos
t
PCI Cos
t
91.5
34.3 29.8
80.9
33.0 32.8
16.6
45.5
91.3
Perc
entil
e
50th
Profiled hospital compared to Community hospitals: n = 440
2016 Operational Performance Rank Percentiles
0.0
20.0
40.0
60.0
80.0
100.0
AMI ALO
S
HF ALOS
CABG ALOS
PCI ALO
S
AMI Cos
t
HF Cos
t
CABG Cos
t
PCI Cos
t
AMI 30D
Pay
HF 30D Pay
94.587.4
72.2
91.280.6
53.1
81.586.3
78.0 82.1
Perc
entil
e
50th
Profiled hospital compared to Community hospitals: n = 475
Watson Health © IBM Corporation 2017 9 of 38
Sample Hospital
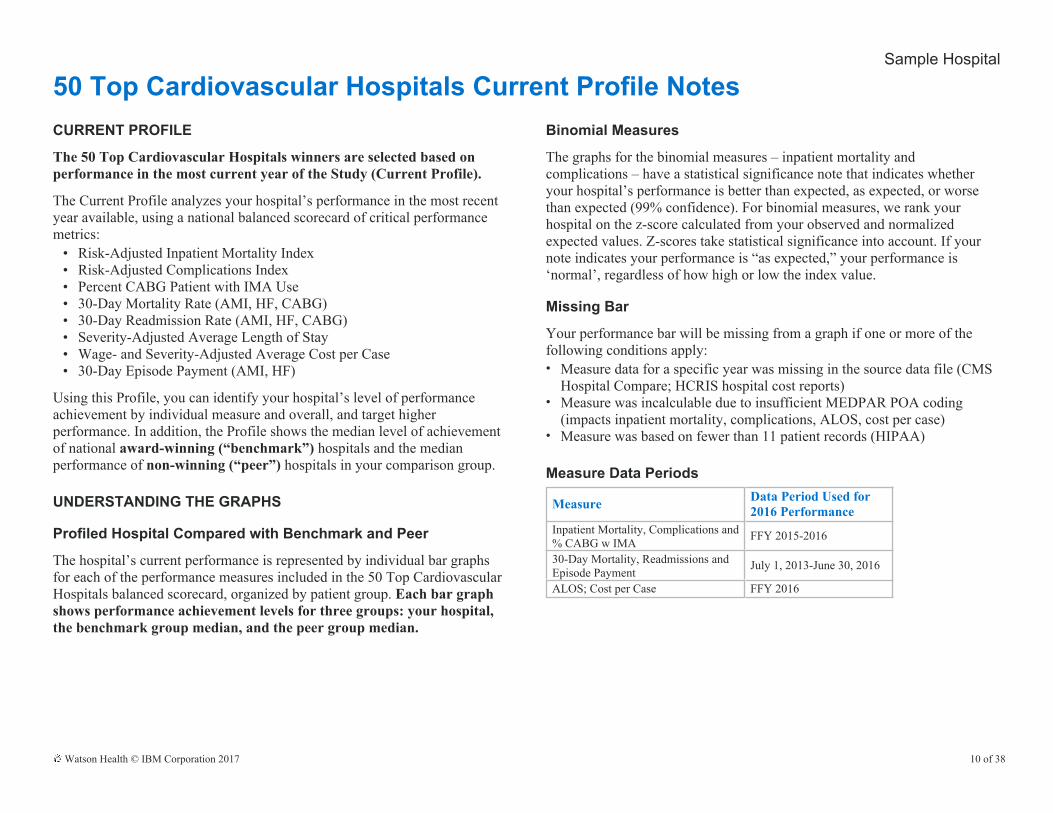
50 Top Cardiovascular Hospitals Current Profile NotesCURRENT PROFILE
The 50 Top Cardiovascular Hospitals winners are selected based on performance in the most current year of the Study (Current Profile).
The Current Profile analyzes your hospital’s performance in the most recent year available, using a national balanced scorecard of critical performance metrics:
• Risk-Adjusted Inpatient Mortality Index• Risk-Adjusted Complications Index• Percent CABG Patient with IMA Use• 30-Day Mortality Rate (AMI, HF, CABG)• 30-Day Readmission Rate (AMI, HF, CABG)• Severity-Adjusted Average Length of Stay• Wage- and Severity-Adjusted Average Cost per Case• 30-Day Episode Payment (AMI, HF)
Using this Profile, you can identify your hospital’s level of performance achievement by individual measure and overall, and target higher performance. In addition, the Profile shows the median level of achievement of national award-winning (“benchmark”) hospitals and the median performance of non-winning (“peer”) hospitals in your comparison group.
UNDERSTANDING THE GRAPHS
Profiled Hospital Compared with Benchmark and Peer
The hospital’s current performance is represented by individual bar graphs for each of the performance measures included in the 50 Top Cardiovascular Hospitals balanced scorecard, organized by patient group. Each bar graph shows performance achievement levels for three groups: your hospital, the benchmark group median, and the peer group median.
Binomial Measures
The graphs for the binomial measures – inpatient mortality and complications – have a statistical significance note that indicates whether your hospital’s performance is better than expected, as expected, or worse than expected (99% confidence). For binomial measures, we rank your hospital on the z-score calculated from your observed and normalized expected values. Z-scores take statistical significance into account. If your note indicates your performance is “as expected,” your performance is ‘normal’, regardless of how high or low the index value.
Missing Bar
Your performance bar will be missing from a graph if one or more of the following conditions apply:• Measure data for a specific year was missing in the source data file (CMS
Hospital Compare; HCRIS hospital cost reports)• Measure was incalculable due to insufficient MEDPAR POA coding
(impacts inpatient mortality, complications, ALOS, cost per case)• Measure was based on fewer than 11 patient records (HIPAA)
Measure Data Periods
Measure Data Period Used for 2016 Performance
Inpatient Mortality, Complications and % CABG w IMA FFY 2015-2016
30-Day Mortality, Readmissions and Episode Payment July 1, 2013-June 30, 2016
ALOS; Cost per Case FFY 2016
Watson Health © IBM Corporation 2017 10 of 38
Sample Hospital
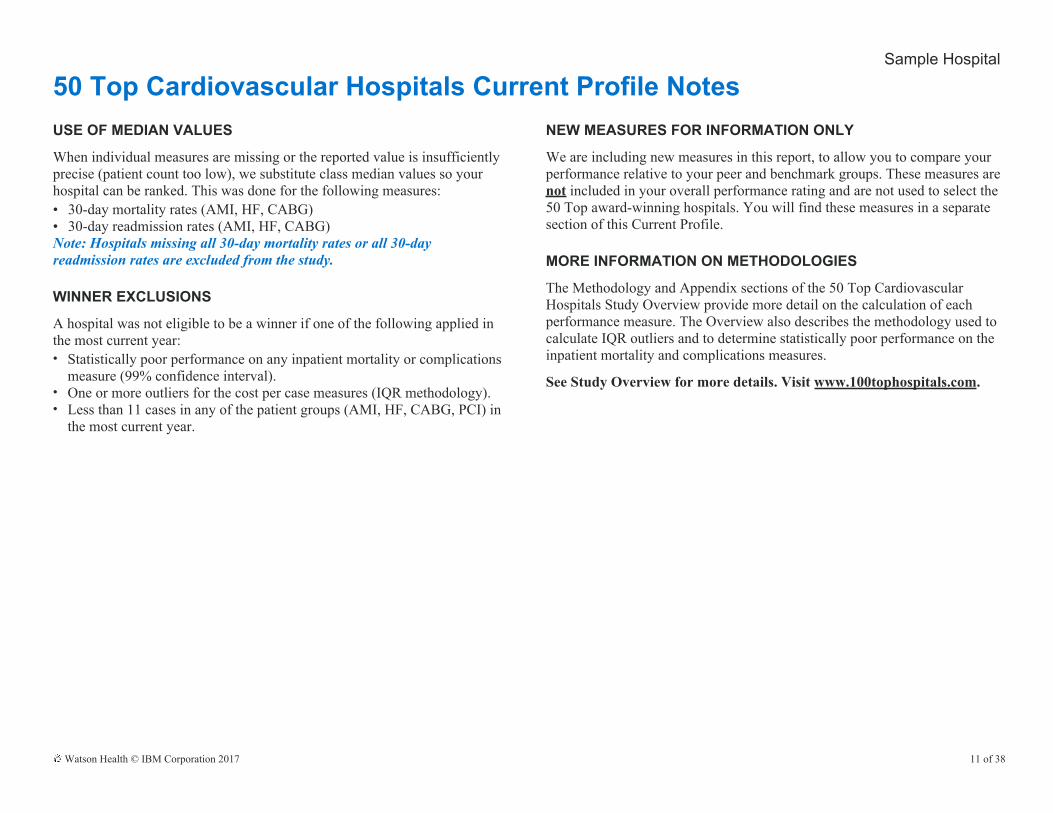
50 Top Cardiovascular Hospitals Current Profile NotesUSE OF MEDIAN VALUES
When individual measures are missing or the reported value is insufficiently precise (patient count too low), we substitute class median values so your hospital can be ranked. This was done for the following measures:• 30-day mortality rates (AMI, HF, CABG)• 30-day readmission rates (AMI, HF, CABG)Note: Hospitals missing all 30-day mortality rates or all 30-day readmission rates are excluded from the study.
WINNER EXCLUSIONS
A hospital was not eligible to be a winner if one of the following applied in the most current year:• Statistically poor performance on any inpatient mortality or complications
measure (99% confidence interval).• One or more outliers for the cost per case measures (IQR methodology).• Less than 11 cases in any of the patient groups (AMI, HF, CABG, PCI) in
the most current year.
NEW MEASURES FOR INFORMATION ONLY
We are including new measures in this report, to allow you to compare your performance relative to your peer and benchmark groups. These measures are not included in your overall performance rating and are not used to select the 50 Top award-winning hospitals. You will find these measures in a separate section of this Current Profile.
MORE INFORMATION ON METHODOLOGIES
The Methodology and Appendix sections of the 50 Top Cardiovascular Hospitals Study Overview provide more detail on the calculation of each performance measure. The Overview also describes the methodology used to calculate IQR outliers and to determine statistically poor performance on the inpatient mortality and complications measures.
See Study Overview for more details. Visit www.100tophospitals.com.
Watson Health © IBM Corporation 2017 11 of 38
Sample Hospital
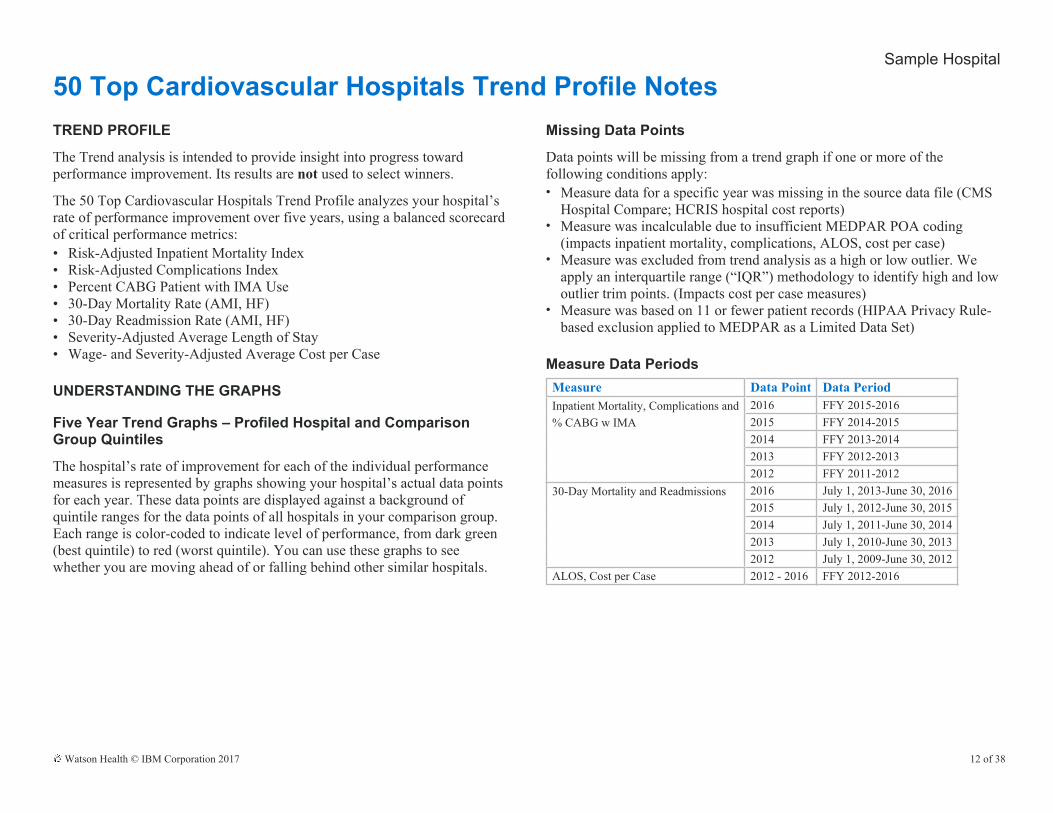
50 Top Cardiovascular Hospitals Trend Profile NotesTREND PROFILE
The Trend analysis is intended to provide insight into progress toward performance improvement. Its results are not used to select winners.
The 50 Top Cardiovascular Hospitals Trend Profile analyzes your hospital’s rate of performance improvement over five years, using a balanced scorecard of critical performance metrics:• Risk-Adjusted Inpatient Mortality Index• Risk-Adjusted Complications Index• Percent CABG Patient with IMA Use• 30-Day Mortality Rate (AMI, HF)• 30-Day Readmission Rate (AMI, HF)• Severity-Adjusted Average Length of Stay• Wage- and Severity-Adjusted Average Cost per Case
UNDERSTANDING THE GRAPHS
Five Year Trend Graphs – Profiled Hospital and Comparison Group Quintiles
The hospital’s rate of improvement for each of the individual performance measures is represented by graphs showing your hospital’s actual data points for each year. These data points are displayed against a background of quintile ranges for the data points of all hospitals in your comparison group. Each range is color-coded to indicate level of performance, from dark green (best quintile) to red (worst quintile). You can use these graphs to see whether you are moving ahead of or falling behind other similar hospitals.
Missing Data Points
Data points will be missing from a trend graph if one or more of the following conditions apply:• Measure data for a specific year was missing in the source data file (CMS
Hospital Compare; HCRIS hospital cost reports)• Measure was incalculable due to insufficient MEDPAR POA coding
(impacts inpatient mortality, complications, ALOS, cost per case)• Measure was excluded from trend analysis as a high or low outlier. We
apply an interquartile range (“IQR”) methodology to identify high and low outlier trim points. (Impacts cost per case measures)
• Measure was based on 11 or fewer patient records (HIPAA Privacy Rule-based exclusion applied to MEDPAR as a Limited Data Set)
Measure Data PeriodsMeasure Data Point Data PeriodInpatient Mortality, Complications and 2016 FFY 2015-2016% CABG w IMA 2015 FFY 2014-2015
2014 FFY 2013-20142013 FFY 2012-20132012 FFY 2011-2012
30-Day Mortality and Readmissions 2016 July 1, 2013-June 30, 20162015 July 1, 2012-June 30, 20152014 July 1, 2011-June 30, 20142013 July 1, 2010-June 30, 20132012 July 1, 2009-June 30, 2012
ALOS, Cost per Case 2012 - 2016 FFY 2012-2016
Watson Health © IBM Corporation 2017 12 of 38

Sample Hospital
AMI patients:Risk-adjusted inpatient mortality index2016 IP MORTALITY PERFORMANCE
0.00
0.20
0.40
0.60
0.80
1.00
1.20
ProfiledHospital
BenchmarkMedian
PeerMedian
0.750.66
0.99
IND
EX
Profiled hospital is statistically AS expected (99% confidence).
▼ DesiredDirection
Benchmark hospitals are the winners in the comparison group: n = 15
Peer hospitals are the non-winners in the comparison group: n = 460
Note: 2016 values on the current and trend graphs will not match due to different norm factors used to normalize the expected values.
2012 - 2016 IP MORTALITY RATE OF IMPROVEMENT
0.000.250.500.751.001.251.501.752.002.252.502.753.003.25
2012 2013 2014 2015 2016
IND
EX
Profiled hospital is NOT CHANGING (99% confidence)
> 80 to Max
> 60 to 80
> 40 to 60
> 20 to 40
Min to 20 Profiled Hospital
Hospital performance compared to peer hospital quintiles: n = 440
HOSPITALCOMPARISON GROUP
PROFILED HOSPITAL
PERCENTILE POINTS ► 20th 40th 60th 80th Value Upper C.I. Lower C.I.
YEARS
2012 0.73 0.92 1.10 1.36 1.08 2.03 0.50
2013 0.69 0.88 1.06 1.32 1.03 2.02 0.45
2014 0.71 0.91 1.08 1.31 0.75 1.69 0.26
2015 0.71 0.89 1.10 1.38 0.73 1.73 0.23
2016 0.72 0.91 1.14 1.39 0.77 2.31 0.15
Watson Health © IBM Corporation 2017 13 of 38

Sample Hospital
AMI patients:30-day mortality rate2016 30D MORTALITY PERFORMANCE
0.0
2.0
4.0
6.0
8.0
10.0
12.0
14.0
ProfiledHospital
BenchmarkMedian
PeerMedian
12.5% 12.4%13.4%
PER
CEN
T
No different than CMS national rate (95% confidence).
▼ DesiredDirection
Benchmark hospitals are the winners in the comparison group: n = 15
Peer hospitals are the non-winners in the comparison group: n = 460
2012 - 2016 30D MORTALITY RATE OF IMPROVEMENT
10.0
11.0
12.0
13.0
14.0
15.0
16.0
17.0
18.0
19.0
20.0
2012 2013 2014 2015 2016
PER
CEN
T
Profiled hospital is IMPROVING (95% confidence)
> 80 to Max
> 60 to 80
> 40 to 60
> 20 to 40
Min to 20 Profiled Hospital
Hospital performance compared to peer hospital quintiles: n = 440
HOSPITALCOMPARISON GROUP
PROFILEDHOSPITAL
PERCENTILE POINTS ► 20th 40th 60th 80th Value
YEARS
2012 13.7 14.6 15.4 16.2 14.6
2013 13.5 14.4 15.0 15.9 14.3
2014 12.9 13.6 14.2 15.1 14.2
2015 12.8 13.5 14.3 15.1 13.5
2016 12.4 13.1 13.7 14.6 12.5
Watson Health © IBM Corporation 2017 14 of 38
Sample Hospital
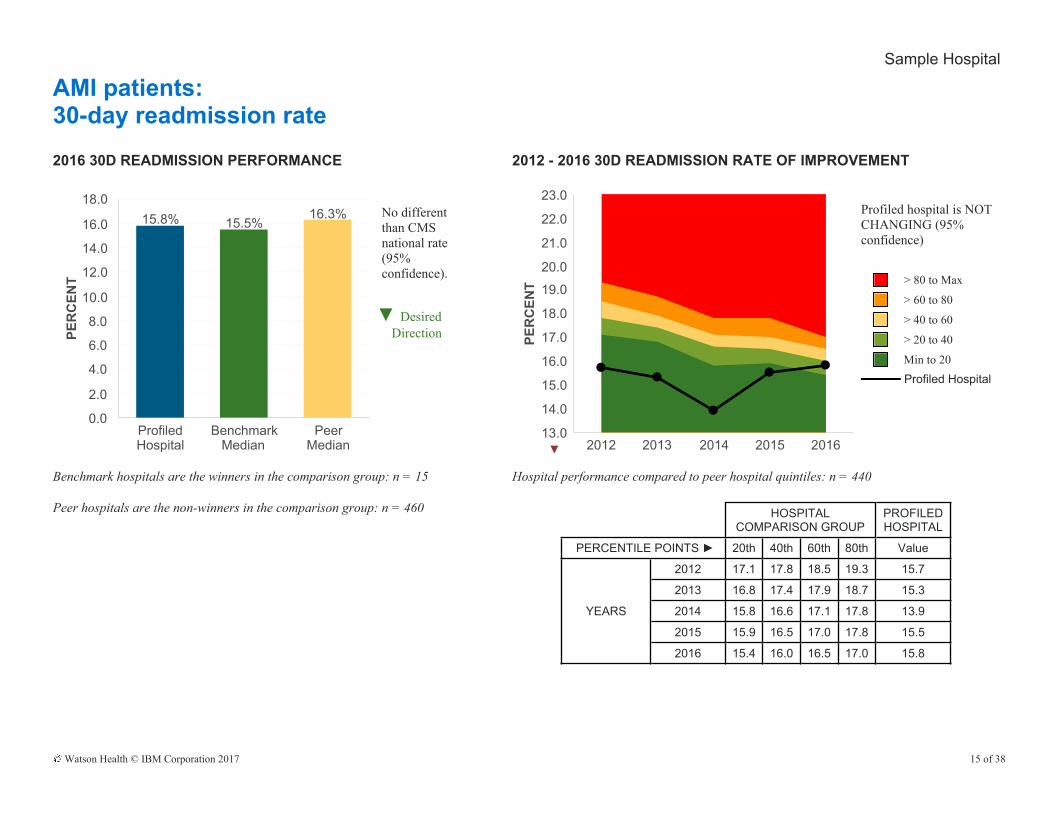
AMI patients:30-day readmission rate2016 30D READMISSION PERFORMANCE
0.0
2.0
4.0
6.0
8.0
10.0
12.0
14.0
16.0
18.0
ProfiledHospital
BenchmarkMedian
PeerMedian
15.8% 15.5%16.3%
PER
CEN
T
No different than CMS national rate (95% confidence).
▼ DesiredDirection
Benchmark hospitals are the winners in the comparison group: n = 15
Peer hospitals are the non-winners in the comparison group: n = 460
2012 - 2016 30D READMISSION RATE OF IMPROVEMENT
13.0
14.0
15.0
16.0
17.0
18.0
19.0
20.0
21.0
22.0
23.0
2012 2013 2014 2015 2016
PER
CEN
T
Profiled hospital is NOT CHANGING (95% confidence)
> 80 to Max
> 60 to 80
> 40 to 60
> 20 to 40
Min to 20 Profiled Hospital
Hospital performance compared to peer hospital quintiles: n = 440
HOSPITALCOMPARISON GROUP
PROFILEDHOSPITAL
PERCENTILE POINTS ► 20th 40th 60th 80th Value
YEARS
2012 17.1 17.8 18.5 19.3 15.7
2013 16.8 17.4 17.9 18.7 15.3
2014 15.8 16.6 17.1 17.8 13.9
2015 15.9 16.5 17.0 17.8 15.5
2016 15.4 16.0 16.5 17.0 15.8
Watson Health © IBM Corporation 2017 15 of 38
Sample Hospital
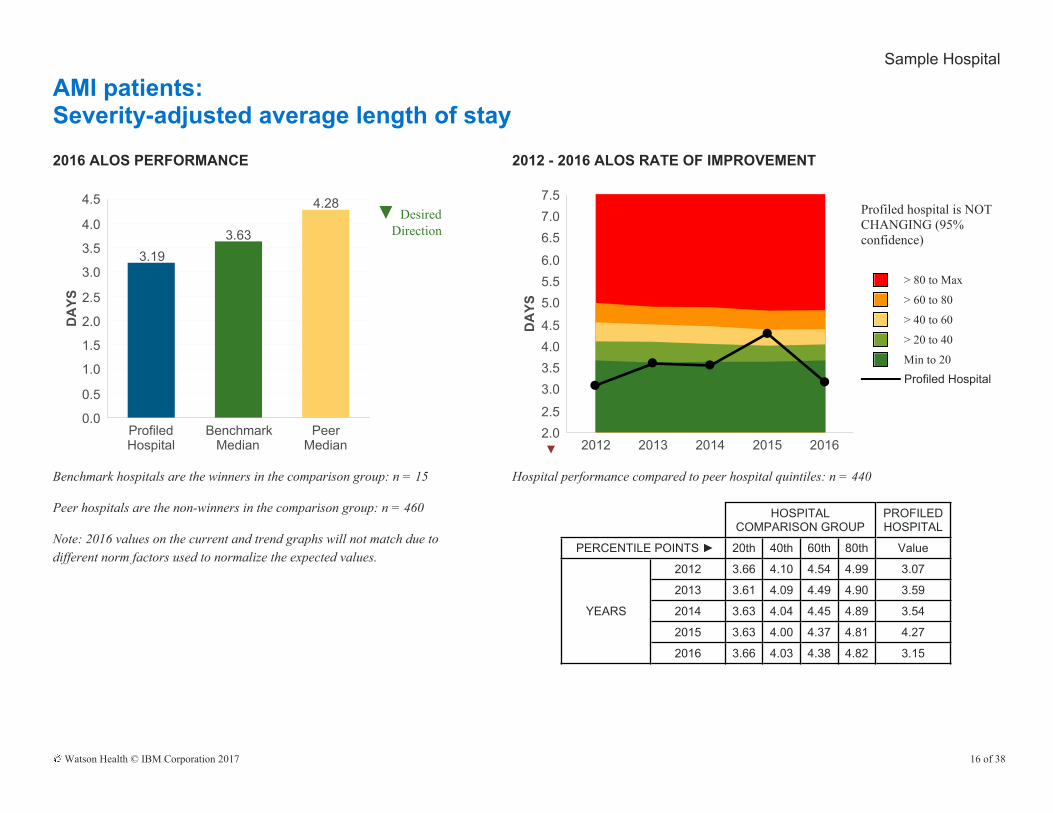
AMI patients:Severity-adjusted average length of stay2016 ALOS PERFORMANCE
0.0
0.5
1.0
1.5
2.0
2.5
3.0
3.5
4.0
4.5
ProfiledHospital
BenchmarkMedian
PeerMedian
3.193.63
4.28
DA
YS
▼ DesiredDirection
Benchmark hospitals are the winners in the comparison group: n = 15
Peer hospitals are the non-winners in the comparison group: n = 460
Note: 2016 values on the current and trend graphs will not match due to different norm factors used to normalize the expected values.
2012 - 2016 ALOS RATE OF IMPROVEMENT
2.02.5
3.03.54.04.5
5.05.56.0
6.57.07.5
2012 2013 2014 2015 2016
DA
YS
Profiled hospital is NOT CHANGING (95% confidence)
> 80 to Max
> 60 to 80
> 40 to 60
> 20 to 40
Min to 20 Profiled Hospital
Hospital performance compared to peer hospital quintiles: n = 440
HOSPITALCOMPARISON GROUP
PROFILEDHOSPITAL
PERCENTILE POINTS ► 20th 40th 60th 80th Value
YEARS
2012 3.66 4.10 4.54 4.99 3.07
2013 3.61 4.09 4.49 4.90 3.59
2014 3.63 4.04 4.45 4.89 3.54
2015 3.63 4.00 4.37 4.81 4.27
2016 3.66 4.03 4.38 4.82 3.15
Watson Health © IBM Corporation 2017 16 of 38

Sample Hospital
AMI patients:Wage- and severity-adjusted cost per case2016 COST PER CASE PERFORMANCE
0
2,000
4,000
6,000
8,000
10,000
12,000
ProfiledHospital
BenchmarkMedian
PeerMedian
$8,390 $8,251
$9,919
DO
LLA
RS
▼ DesiredDirection
Benchmark hospitals are the winners in the comparison group: n = 15
Peer hospitals are the non-winners in the comparison group: n = 460
Note: 2016 values on the current and trend graphs will not match due to different norm factors used to normalize the expected values.
2012 - 2016 COST PER CASE RATE OF IMPROVEMENT
4,000
6,000
8,000
10,000
12,000
14,000
16,000
18,000
20,000
2012 2013 2014 2015 2016
DO
LLA
RS
Profiled hospital is NOT CHANGING (95% confidence)
> 80 to Max
> 60 to 80
> 40 to 60
> 20 to 40
Min to 20 Profiled Hospital
Hospital performance compared to peer hospital quintiles: n = 440
HOSPITALCOMPARISON GROUP
PROFILEDHOSPITAL
PERCENTILE POINTS ► 20th 40th 60th 80th Value
YEARS
2012 8,460 9,781 10,972 12,497 8,145
2013 8,496 9,541 10,566 11,865 9,718
2014 8,379 9,468 10,422 11,793 8,124
2015 7,910 9,081 10,042 11,433 10,005
2016 8,046 8,969 9,929 11,661 8,080
Watson Health © IBM Corporation 2017 17 of 38
Sample Hospital
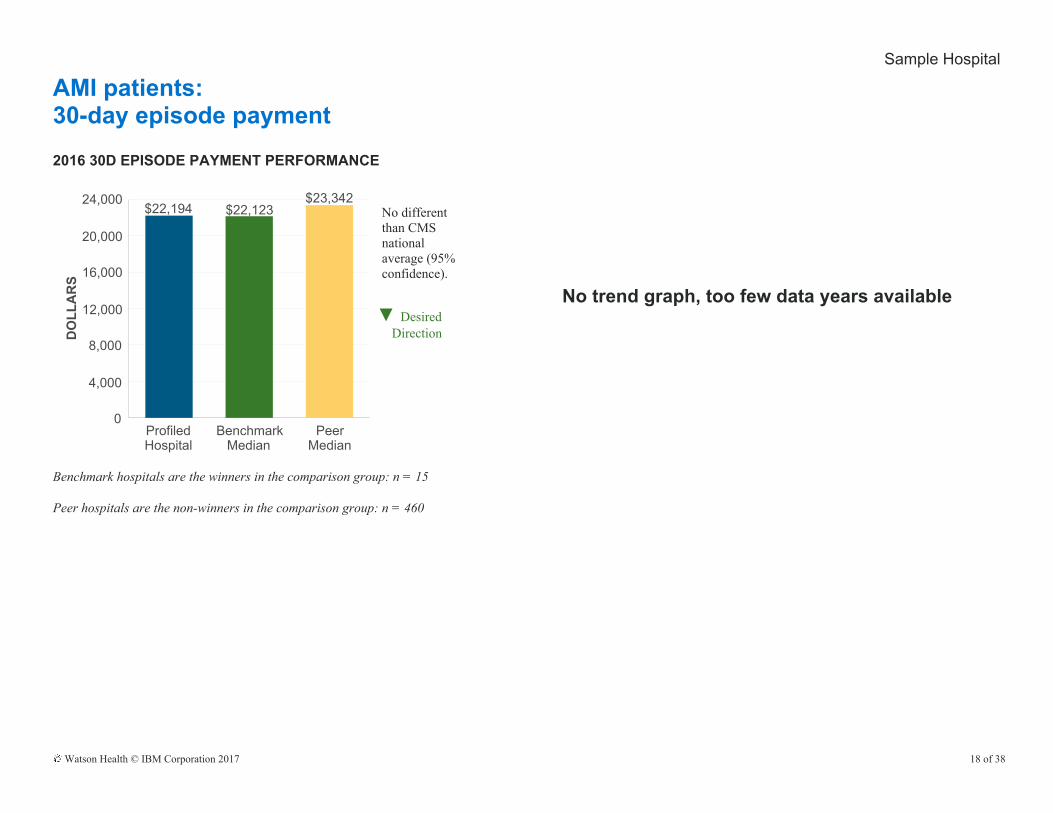
AMI patients:30-day episode payment2016 30D EPISODE PAYMENT PERFORMANCE
0
4,000
8,000
12,000
16,000
20,000
24,000
ProfiledHospital
BenchmarkMedian
PeerMedian
$22,194 $22,123$23,342
DO
LLA
RS
No different than CMS national average (95% confidence).
▼ DesiredDirection
Benchmark hospitals are the winners in the comparison group: n = 15
Peer hospitals are the non-winners in the comparison group: n = 460
No trend graph, too few data years available
Watson Health © IBM Corporation 2017 18 of 38
Sample Hospital
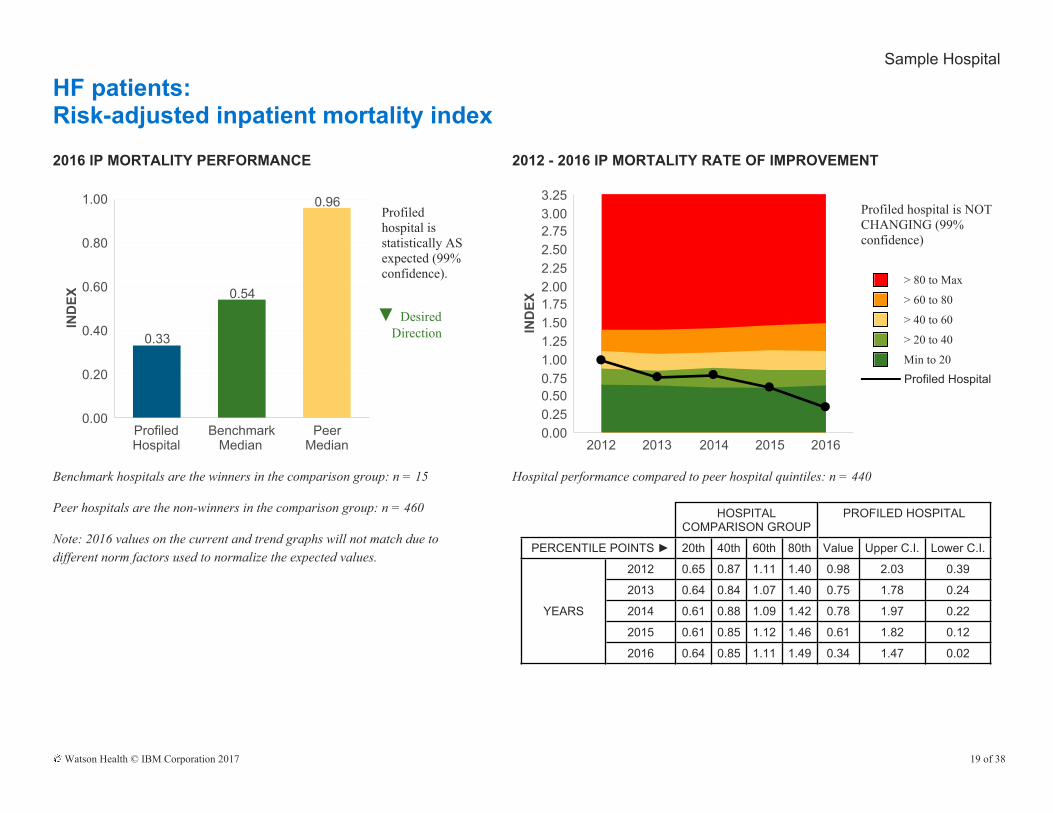
HF patients:Risk-adjusted inpatient mortality index2016 IP MORTALITY PERFORMANCE
0.00
0.20
0.40
0.60
0.80
1.00
ProfiledHospital
BenchmarkMedian
PeerMedian
0.33
0.54
0.96
IND
EX
Profiled hospital is statistically AS expected (99% confidence).
▼ DesiredDirection
Benchmark hospitals are the winners in the comparison group: n = 15
Peer hospitals are the non-winners in the comparison group: n = 460
Note: 2016 values on the current and trend graphs will not match due to different norm factors used to normalize the expected values.
2012 - 2016 IP MORTALITY RATE OF IMPROVEMENT
0.000.250.500.751.001.251.501.752.002.252.502.753.003.25
2012 2013 2014 2015 2016
IND
EX
Profiled hospital is NOT CHANGING (99% confidence)
> 80 to Max
> 60 to 80
> 40 to 60
> 20 to 40
Min to 20 Profiled Hospital
Hospital performance compared to peer hospital quintiles: n = 440
HOSPITALCOMPARISON GROUP
PROFILED HOSPITAL
PERCENTILE POINTS ► 20th 40th 60th 80th Value Upper C.I. Lower C.I.
YEARS
2012 0.65 0.87 1.11 1.40 0.98 2.03 0.39
2013 0.64 0.84 1.07 1.40 0.75 1.78 0.24
2014 0.61 0.88 1.09 1.42 0.78 1.97 0.22
2015 0.61 0.85 1.12 1.46 0.61 1.82 0.12
2016 0.64 0.85 1.11 1.49 0.34 1.47 0.02
Watson Health © IBM Corporation 2017 19 of 38
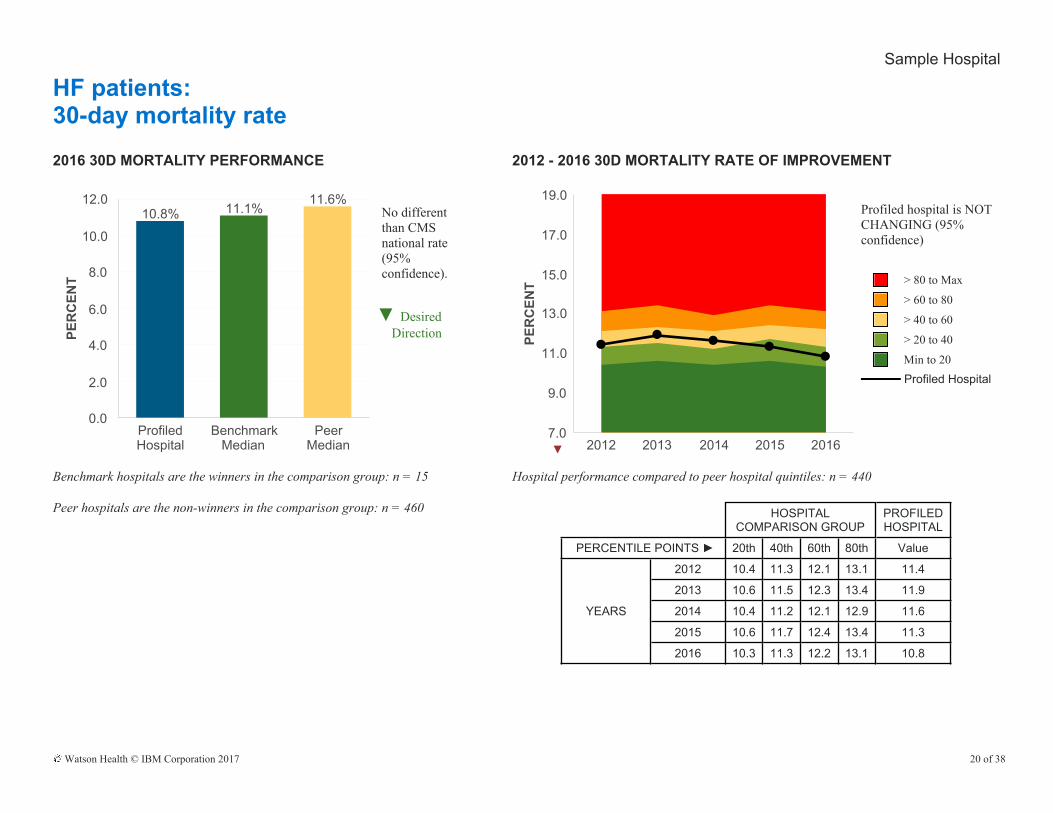
Sample Hospital
HF patients:30-day mortality rate2016 30D MORTALITY PERFORMANCE
0.0
2.0
4.0
6.0
8.0
10.0
12.0
ProfiledHospital
BenchmarkMedian
PeerMedian
10.8% 11.1%11.6%
PER
CEN
T
No different than CMS national rate (95% confidence).
▼ DesiredDirection
Benchmark hospitals are the winners in the comparison group: n = 15
Peer hospitals are the non-winners in the comparison group: n = 460
2012 - 2016 30D MORTALITY RATE OF IMPROVEMENT
7.0
9.0
11.0
13.0
15.0
17.0
19.0
2012 2013 2014 2015 2016
PER
CEN
T
Profiled hospital is NOT CHANGING (95% confidence)
> 80 to Max
> 60 to 80
> 40 to 60
> 20 to 40
Min to 20 Profiled Hospital
Hospital performance compared to peer hospital quintiles: n = 440
HOSPITALCOMPARISON GROUP
PROFILEDHOSPITAL
PERCENTILE POINTS ► 20th 40th 60th 80th Value
YEARS
2012 10.4 11.3 12.1 13.1 11.4
2013 10.6 11.5 12.3 13.4 11.9
2014 10.4 11.2 12.1 12.9 11.6
2015 10.6 11.7 12.4 13.4 11.3
2016 10.3 11.3 12.2 13.1 10.8
Watson Health © IBM Corporation 2017 20 of 38
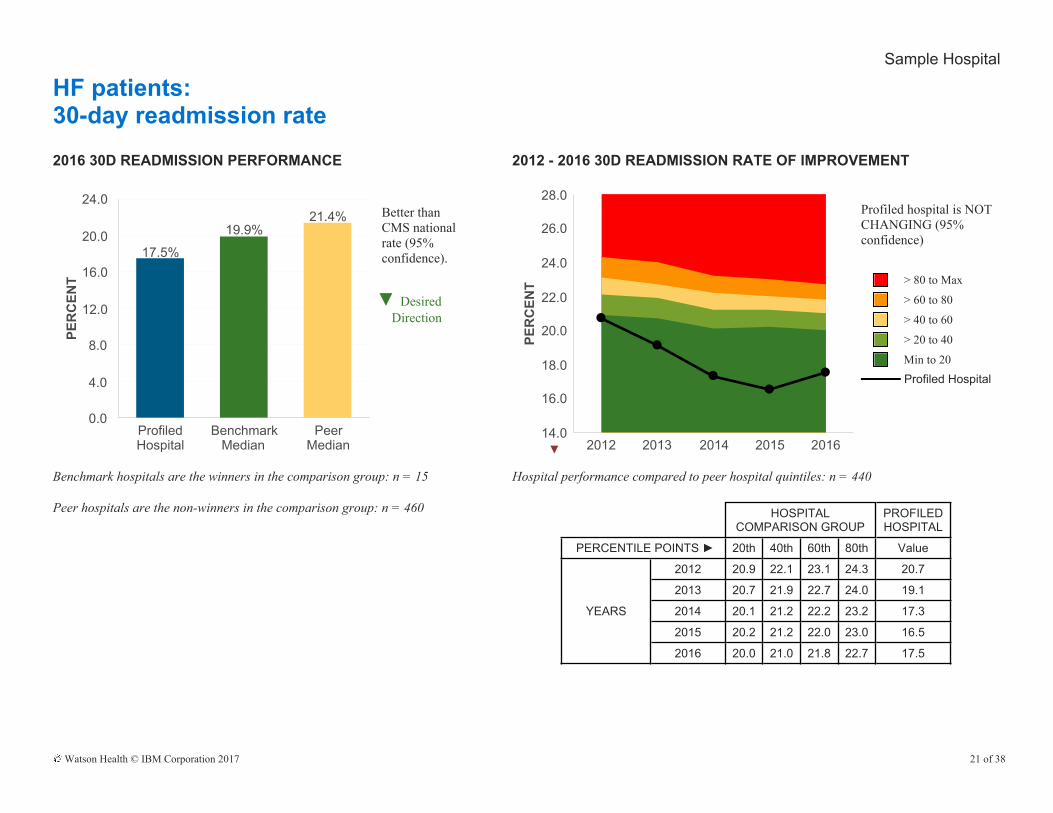
Sample Hospital
HF patients:30-day readmission rate2016 30D READMISSION PERFORMANCE
0.0
4.0
8.0
12.0
16.0
20.0
24.0
ProfiledHospital
BenchmarkMedian
PeerMedian
17.5%
19.9%21.4%
PER
CEN
T
Better than CMS national rate (95% confidence).
▼ DesiredDirection
Benchmark hospitals are the winners in the comparison group: n = 15
Peer hospitals are the non-winners in the comparison group: n = 460
2012 - 2016 30D READMISSION RATE OF IMPROVEMENT
14.0
16.0
18.0
20.0
22.0
24.0
26.0
28.0
2012 2013 2014 2015 2016
PER
CEN
T
Profiled hospital is NOT CHANGING (95% confidence)
> 80 to Max
> 60 to 80
> 40 to 60
> 20 to 40
Min to 20 Profiled Hospital
Hospital performance compared to peer hospital quintiles: n = 440
HOSPITALCOMPARISON GROUP
PROFILEDHOSPITAL
PERCENTILE POINTS ► 20th 40th 60th 80th Value
YEARS
2012 20.9 22.1 23.1 24.3 20.7
2013 20.7 21.9 22.7 24.0 19.1
2014 20.1 21.2 22.2 23.2 17.3
2015 20.2 21.2 22.0 23.0 16.5
2016 20.0 21.0 21.8 22.7 17.5
Watson Health © IBM Corporation 2017 21 of 38

Sample Hospital
HF patients:Severity-adjusted average length of stay2016 ALOS PERFORMANCE
0.0
1.0
2.0
3.0
4.0
5.0
6.0
ProfiledHospital
BenchmarkMedian
PeerMedian
4.094.47
4.91
DA
YS
▼ DesiredDirection
Benchmark hospitals are the winners in the comparison group: n = 15
Peer hospitals are the non-winners in the comparison group: n = 460
Note: 2016 values on the current and trend graphs will not match due to different norm factors used to normalize the expected values.
2012 - 2016 ALOS RATE OF IMPROVEMENT
2.53.0
3.54.04.55.0
5.56.06.5
7.07.58.0
2012 2013 2014 2015 2016
DA
YS
Profiled hospital is NOT CHANGING (95% confidence)
> 80 to Max
> 60 to 80
> 40 to 60
> 20 to 40
Min to 20 Profiled Hospital
Hospital performance compared to peer hospital quintiles: n = 440
HOSPITALCOMPARISON GROUP
PROFILEDHOSPITAL
PERCENTILE POINTS ► 20th 40th 60th 80th Value
YEARS
2012 4.25 4.72 5.08 5.48 3.72
2013 4.43 4.76 5.15 5.56 4.14
2014 4.37 4.76 5.15 5.56 4.64
2015 4.40 4.81 5.21 5.56 4.43
2016 4.10 4.48 4.79 5.24 3.88
Watson Health © IBM Corporation 2017 22 of 38
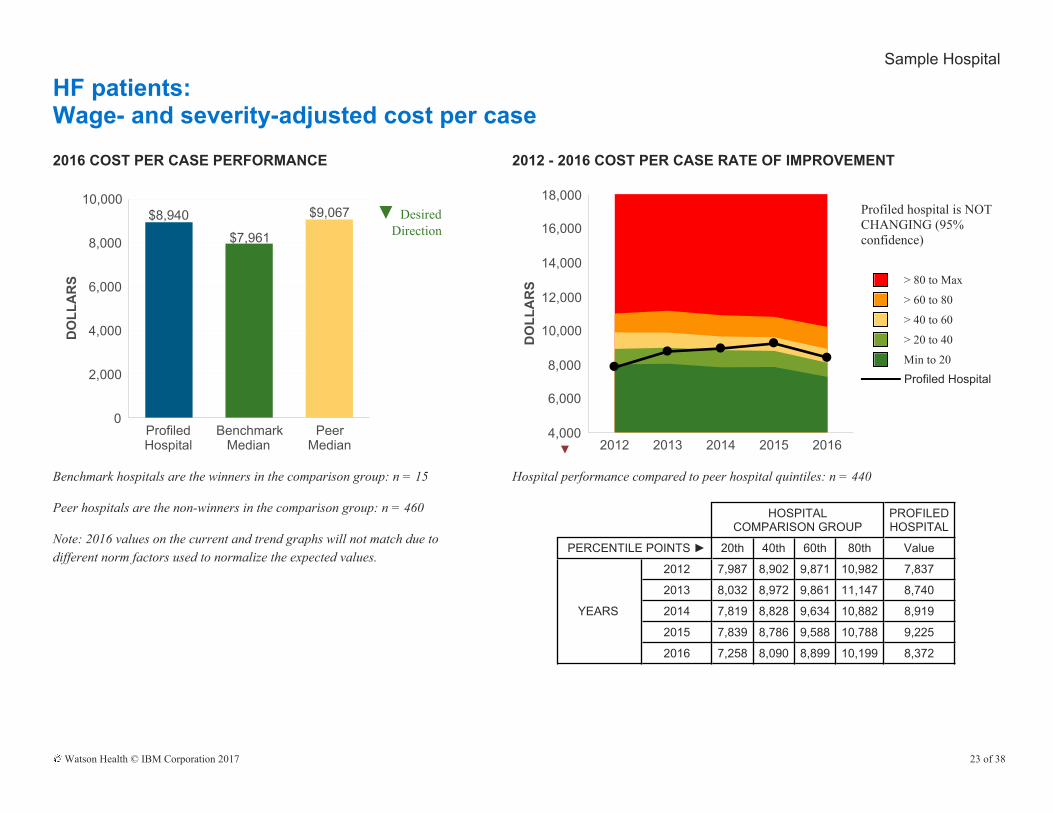
Sample Hospital
HF patients:Wage- and severity-adjusted cost per case2016 COST PER CASE PERFORMANCE
0
2,000
4,000
6,000
8,000
10,000
ProfiledHospital
BenchmarkMedian
PeerMedian
$8,940
$7,961
$9,067
DO
LLA
RS
▼ DesiredDirection
Benchmark hospitals are the winners in the comparison group: n = 15
Peer hospitals are the non-winners in the comparison group: n = 460
Note: 2016 values on the current and trend graphs will not match due to different norm factors used to normalize the expected values.
2012 - 2016 COST PER CASE RATE OF IMPROVEMENT
4,000
6,000
8,000
10,000
12,000
14,000
16,000
18,000
2012 2013 2014 2015 2016
DO
LLA
RS
Profiled hospital is NOT CHANGING (95% confidence)
> 80 to Max
> 60 to 80
> 40 to 60
> 20 to 40
Min to 20 Profiled Hospital
Hospital performance compared to peer hospital quintiles: n = 440
HOSPITALCOMPARISON GROUP
PROFILEDHOSPITAL
PERCENTILE POINTS ► 20th 40th 60th 80th Value
YEARS
2012 7,987 8,902 9,871 10,982 7,837
2013 8,032 8,972 9,861 11,147 8,740
2014 7,819 8,828 9,634 10,882 8,919
2015 7,839 8,786 9,588 10,788 9,225
2016 7,258 8,090 8,899 10,199 8,372
Watson Health © IBM Corporation 2017 23 of 38
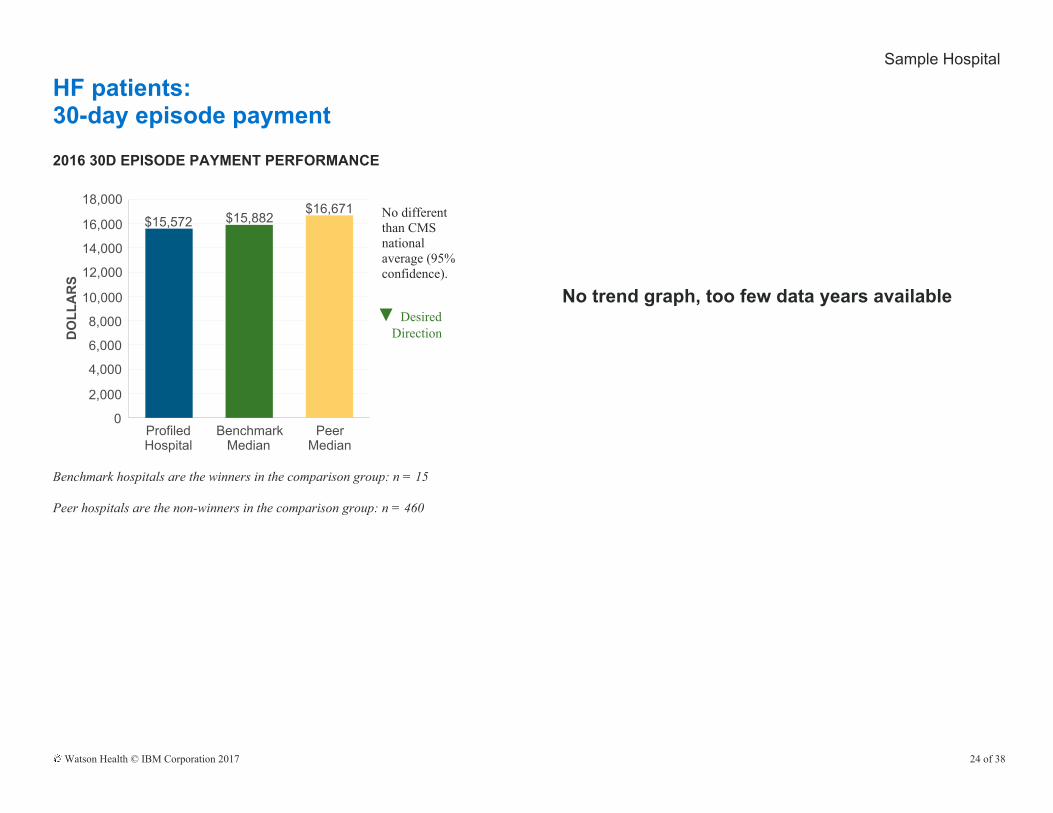
Sample Hospital
HF patients:30-day episode payment2016 30D EPISODE PAYMENT PERFORMANCE
0
2,000
4,000
6,000
8,000
10,000
12,000
14,000
16,000
18,000
ProfiledHospital
BenchmarkMedian
PeerMedian
$15,572 $15,882$16,671
DO
LLA
RS
No different than CMS national average (95% confidence).
▼ DesiredDirection
Benchmark hospitals are the winners in the comparison group: n = 15
Peer hospitals are the non-winners in the comparison group: n = 460
No trend graph, too few data years available
Watson Health © IBM Corporation 2017 24 of 38
Sample Hospital
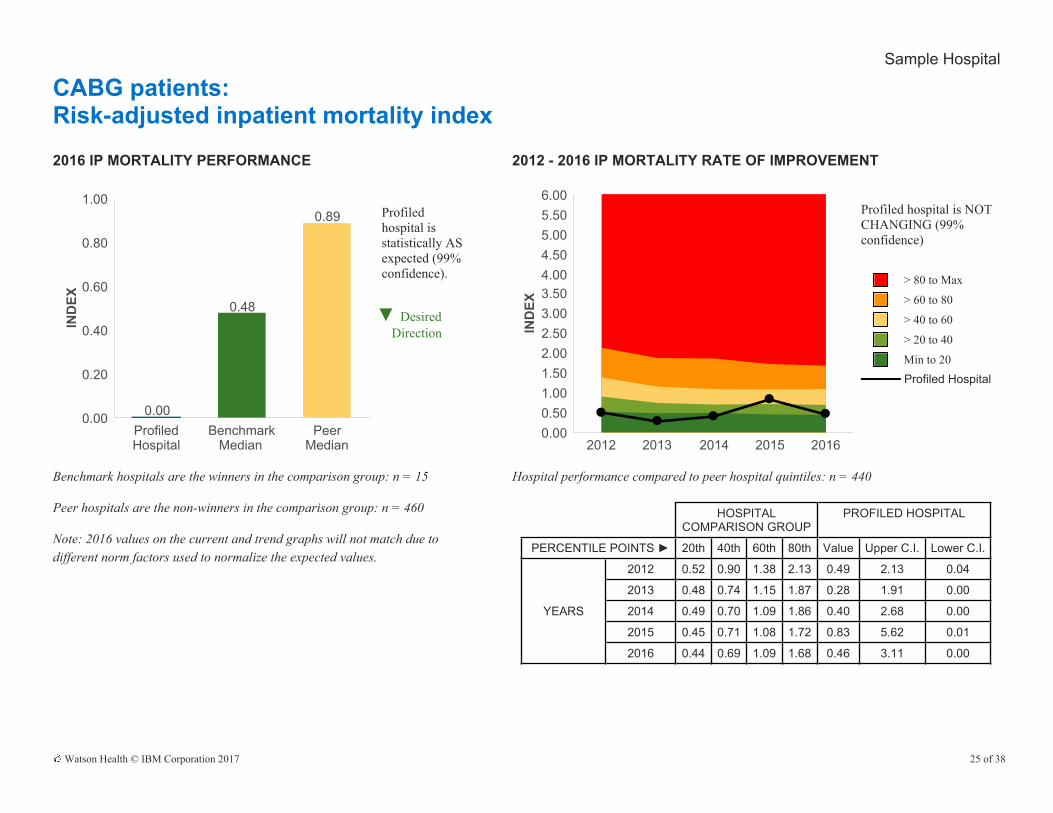
CABG patients:Risk-adjusted inpatient mortality index2016 IP MORTALITY PERFORMANCE
0.00
0.20
0.40
0.60
0.80
1.00
ProfiledHospital
BenchmarkMedian
PeerMedian
0.00
0.48
0.89
IND
EX
Profiled hospital is statistically AS expected (99% confidence).
▼ DesiredDirection
Benchmark hospitals are the winners in the comparison group: n = 15
Peer hospitals are the non-winners in the comparison group: n = 460
Note: 2016 values on the current and trend graphs will not match due to different norm factors used to normalize the expected values.
2012 - 2016 IP MORTALITY RATE OF IMPROVEMENT
0.000.501.001.502.002.503.003.504.004.505.005.506.00
2012 2013 2014 2015 2016
IND
EX
Profiled hospital is NOT CHANGING (99% confidence)
> 80 to Max
> 60 to 80
> 40 to 60
> 20 to 40
Min to 20 Profiled Hospital
Hospital performance compared to peer hospital quintiles: n = 440
HOSPITALCOMPARISON GROUP
PROFILED HOSPITAL
PERCENTILE POINTS ► 20th 40th 60th 80th Value Upper C.I. Lower C.I.
YEARS
2012 0.52 0.90 1.38 2.13 0.49 2.13 0.04
2013 0.48 0.74 1.15 1.87 0.28 1.91 0.00
2014 0.49 0.70 1.09 1.86 0.40 2.68 0.00
2015 0.45 0.71 1.08 1.72 0.83 5.62 0.01
2016 0.44 0.69 1.09 1.68 0.46 3.11 0.00
Watson Health © IBM Corporation 2017 25 of 38
Sample Hospital
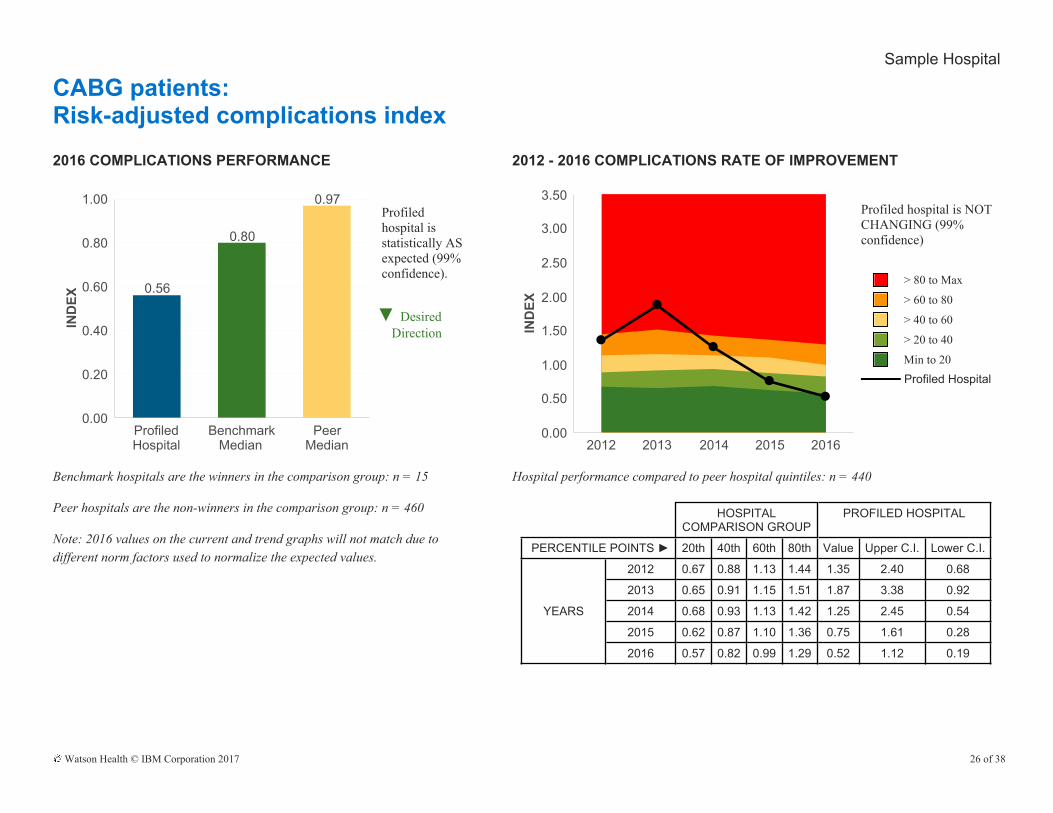
CABG patients:Risk-adjusted complications index2016 COMPLICATIONS PERFORMANCE
0.00
0.20
0.40
0.60
0.80
1.00
ProfiledHospital
BenchmarkMedian
PeerMedian
0.56
0.80
0.97
IND
EX
Profiled hospital is statistically AS expected (99% confidence).
▼ DesiredDirection
Benchmark hospitals are the winners in the comparison group: n = 15
Peer hospitals are the non-winners in the comparison group: n = 460
Note: 2016 values on the current and trend graphs will not match due to different norm factors used to normalize the expected values.
2012 - 2016 COMPLICATIONS RATE OF IMPROVEMENT
0.00
0.50
1.00
1.50
2.00
2.50
3.00
3.50
2012 2013 2014 2015 2016
IND
EX
Profiled hospital is NOT CHANGING (99% confidence)
> 80 to Max
> 60 to 80
> 40 to 60
> 20 to 40
Min to 20 Profiled Hospital
Hospital performance compared to peer hospital quintiles: n = 440
HOSPITALCOMPARISON GROUP
PROFILED HOSPITAL
PERCENTILE POINTS ► 20th 40th 60th 80th Value Upper C.I. Lower C.I.
YEARS
2012 0.67 0.88 1.13 1.44 1.35 2.40 0.68
2013 0.65 0.91 1.15 1.51 1.87 3.38 0.92
2014 0.68 0.93 1.13 1.42 1.25 2.45 0.54
2015 0.62 0.87 1.10 1.36 0.75 1.61 0.28
2016 0.57 0.82 0.99 1.29 0.52 1.12 0.19
Watson Health © IBM Corporation 2017 26 of 38
Sample Hospital
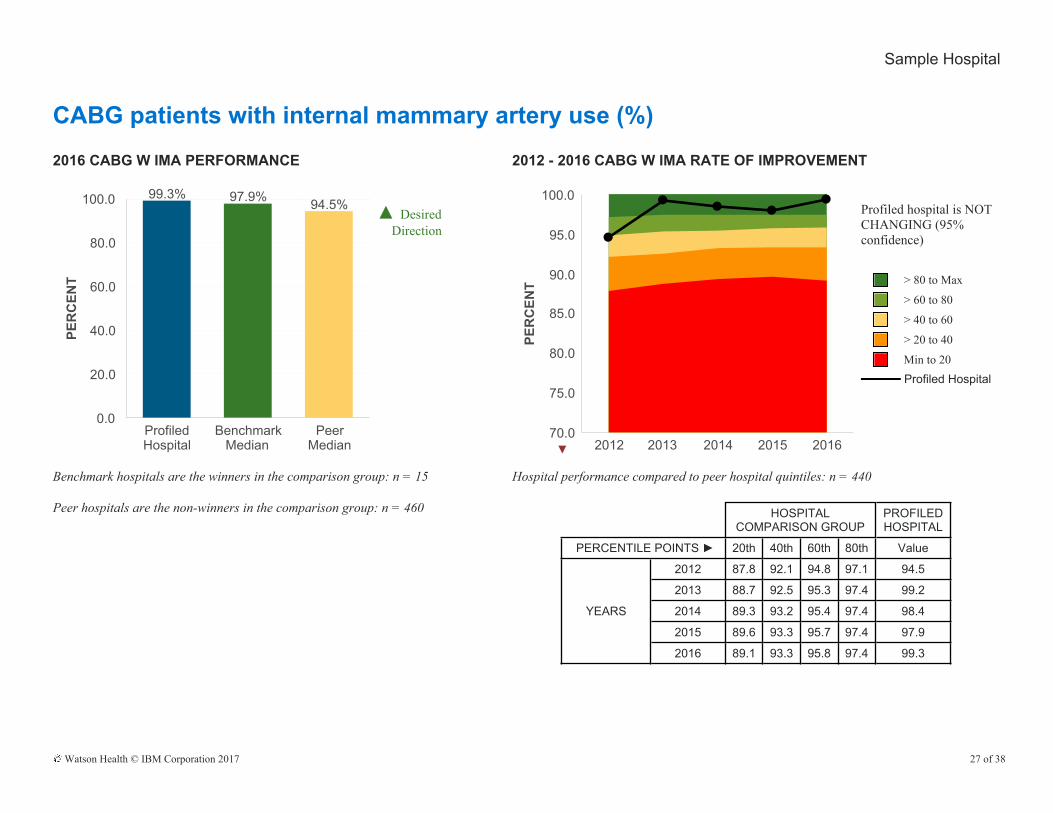
CABG patients:CABG patients with internal mammary artery use (%)2016 CABG W IMA PERFORMANCE
0.0
20.0
40.0
60.0
80.0
100.0
ProfiledHospital
BenchmarkMedian
PeerMedian
99.3% 97.9% 94.5%
PER
CEN
T
▲ DesiredDirection
Benchmark hospitals are the winners in the comparison group: n = 15
Peer hospitals are the non-winners in the comparison group: n = 460
2012 - 2016 CABG W IMA RATE OF IMPROVEMENT
70.0
75.0
80.0
85.0
90.0
95.0
100.0
2012 2013 2014 2015 2016
PER
CEN
T
Profiled hospital is NOT CHANGING (95% confidence)
> 80 to Max
> 60 to 80
> 40 to 60
> 20 to 40
Min to 20 Profiled Hospital
Hospital performance compared to peer hospital quintiles: n = 440
HOSPITALCOMPARISON GROUP
PROFILEDHOSPITAL
PERCENTILE POINTS ► 20th 40th 60th 80th Value
YEARS
2012 87.8 92.1 94.8 97.1 94.5
2013 88.7 92.5 95.3 97.4 99.2
2014 89.3 93.2 95.4 97.4 98.4
2015 89.6 93.3 95.7 97.4 97.9
2016 89.1 93.3 95.8 97.4 99.3
Watson Health © IBM Corporation 2017 27 of 38
Sample Hospital
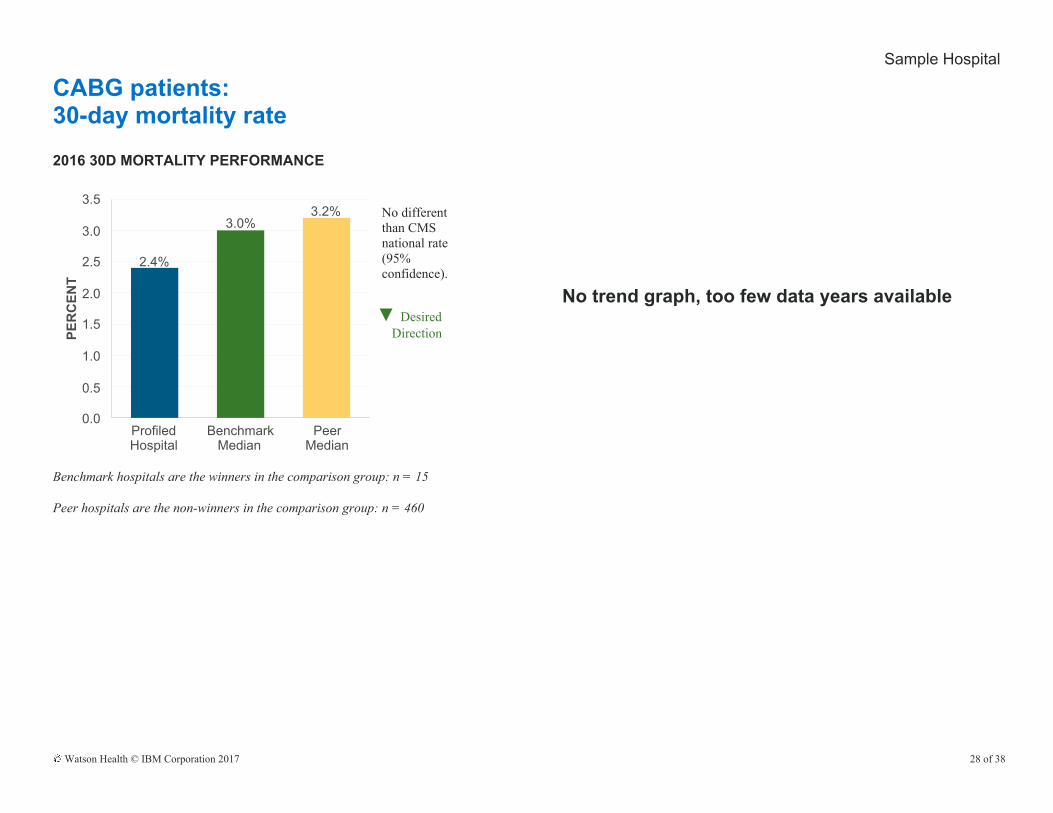
CABG patients:30-day mortality rate2016 30D MORTALITY PERFORMANCE
0.0
0.5
1.0
1.5
2.0
2.5
3.0
3.5
ProfiledHospital
BenchmarkMedian
PeerMedian
2.4%
3.0%3.2%
PER
CEN
T
No different than CMS national rate (95% confidence).
▼ DesiredDirection
Benchmark hospitals are the winners in the comparison group: n = 15
Peer hospitals are the non-winners in the comparison group: n = 460
No trend graph, too few data years available
Watson Health © IBM Corporation 2017 28 of 38
Sample Hospital
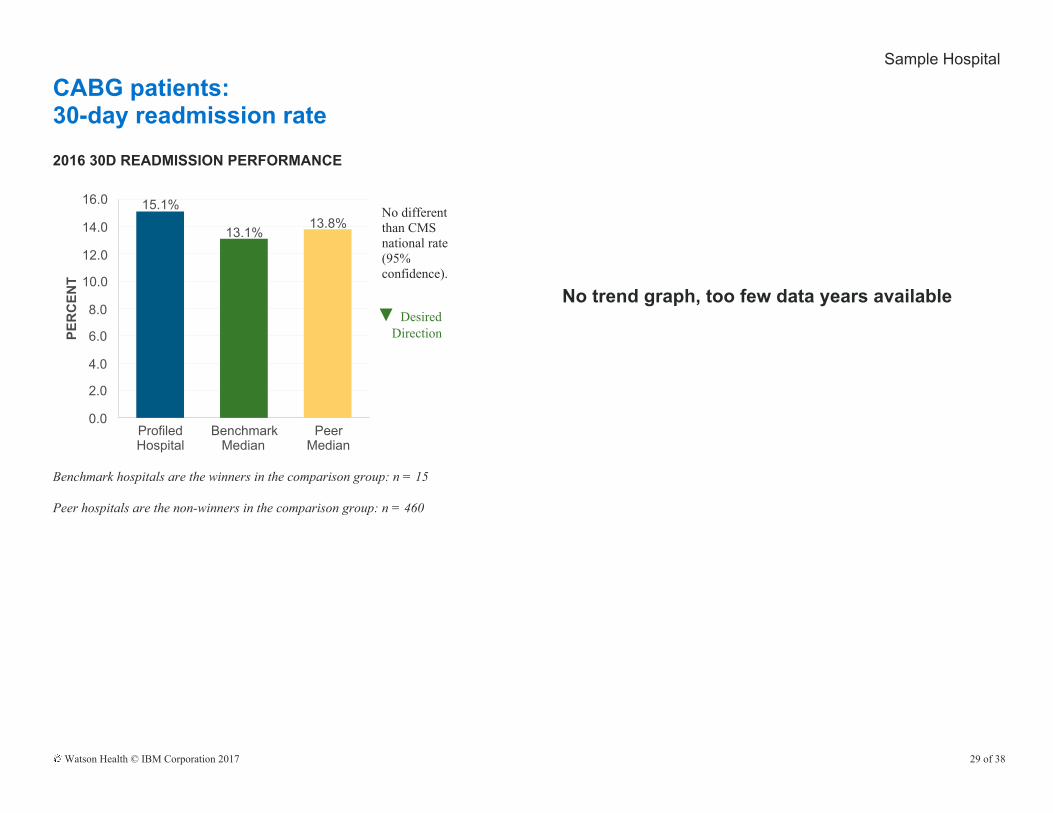
CABG patients:30-day readmission rate2016 30D READMISSION PERFORMANCE
0.0
2.0
4.0
6.0
8.0
10.0
12.0
14.0
16.0
ProfiledHospital
BenchmarkMedian
PeerMedian
15.1%
13.1%13.8%
PER
CEN
T
No different than CMS national rate (95% confidence).
▼ DesiredDirection
Benchmark hospitals are the winners in the comparison group: n = 15
Peer hospitals are the non-winners in the comparison group: n = 460
No trend graph, too few data years available
Watson Health © IBM Corporation 2017 29 of 38

Sample Hospital
CABG patients:Severity-adjusted average length of stay2016 ALOS PERFORMANCE
0.0
2.0
4.0
6.0
8.0
10.0
ProfiledHospital
BenchmarkMedian
PeerMedian
8.43 8.29
9.30
DA
YS
▼ DesiredDirection
Benchmark hospitals are the winners in the comparison group: n = 15
Peer hospitals are the non-winners in the comparison group: n = 460
Note: 2016 values on the current and trend graphs will not match due to different norm factors used to normalize the expected values.
2012 - 2016 ALOS RATE OF IMPROVEMENT
5.06.0
7.08.09.0
10.0
11.012.013.0
14.015.016.0
2012 2013 2014 2015 2016
DA
YS
Profiled hospital is NOT CHANGING (95% confidence)
> 80 to Max
> 60 to 80
> 40 to 60
> 20 to 40
Min to 20 Profiled Hospital
Hospital performance compared to peer hospital quintiles: n = 440
HOSPITALCOMPARISON GROUP
PROFILEDHOSPITAL
PERCENTILE POINTS ► 20th 40th 60th 80th Value
YEARS
2012 8.09 8.82 9.55 10.64 8.79
2013 8.09 8.80 9.56 10.65 9.72
2014 8.09 8.89 9.59 10.47 8.88
2015 8.18 8.87 9.57 10.61 8.71
2016 8.08 8.84 9.53 10.51 8.42
Watson Health © IBM Corporation 2017 30 of 38
Sample Hospital
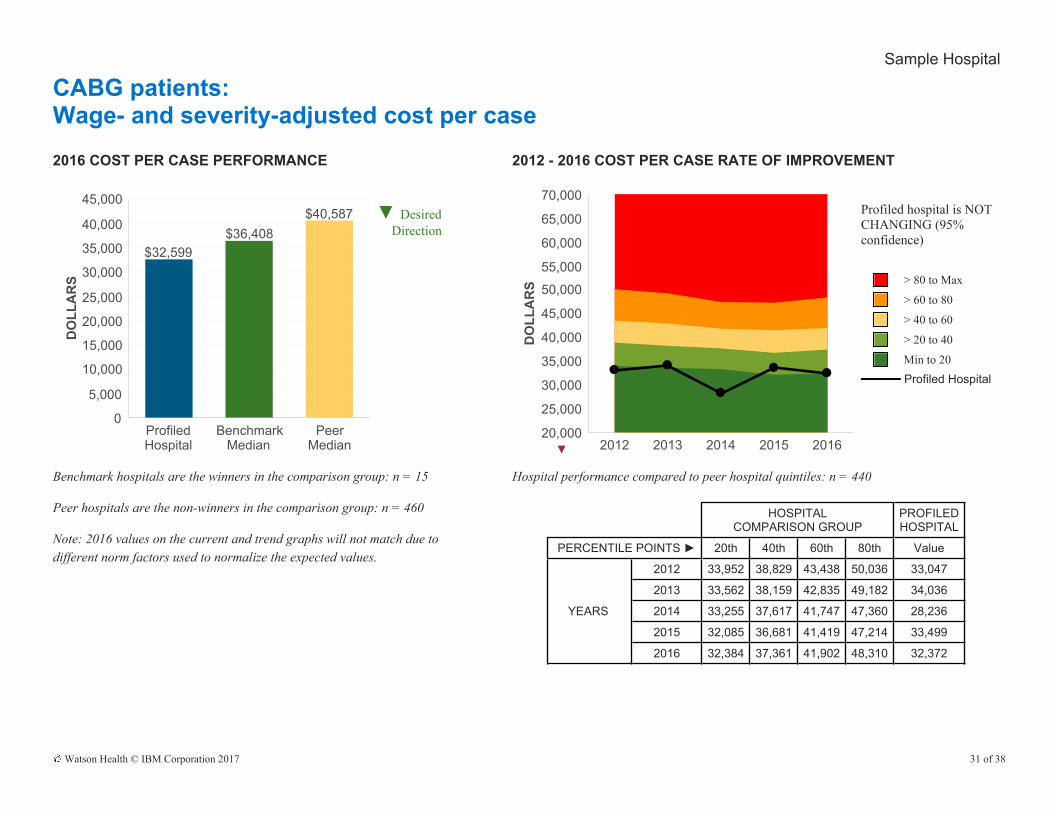
CABG patients:Wage- and severity-adjusted cost per case2016 COST PER CASE PERFORMANCE
0
5,000
10,000
15,000
20,000
25,000
30,000
35,000
40,000
45,000
ProfiledHospital
BenchmarkMedian
PeerMedian
$32,599$36,408
$40,587
DO
LLA
RS
▼ DesiredDirection
Benchmark hospitals are the winners in the comparison group: n = 15
Peer hospitals are the non-winners in the comparison group: n = 460
Note: 2016 values on the current and trend graphs will not match due to different norm factors used to normalize the expected values.
2012 - 2016 COST PER CASE RATE OF IMPROVEMENT
20,000
25,000
30,000
35,000
40,000
45,000
50,000
55,000
60,000
65,000
70,000
2012 2013 2014 2015 2016
DO
LLA
RS
Profiled hospital is NOT CHANGING (95% confidence)
> 80 to Max
> 60 to 80
> 40 to 60
> 20 to 40
Min to 20 Profiled Hospital
Hospital performance compared to peer hospital quintiles: n = 440
HOSPITALCOMPARISON GROUP
PROFILEDHOSPITAL
PERCENTILE POINTS ► 20th 40th 60th 80th Value
YEARS
2012 33,952 38,829 43,438 50,036 33,047
2013 33,562 38,159 42,835 49,182 34,036
2014 33,255 37,617 41,747 47,360 28,236
2015 32,085 36,681 41,419 47,214 33,499
2016 32,384 37,361 41,902 48,310 32,372
Watson Health © IBM Corporation 2017 31 of 38

Sample Hospital
PCI patients:Risk-adjusted inpatient mortality index2016 IP MORTALITY PERFORMANCE
0.000.10
0.200.30
0.400.50
0.600.70
0.800.90
1.00
ProfiledHospital
BenchmarkMedian
PeerMedian
0.70
0.83
1.00
IND
EX
Profiled hospital is statistically AS expected (99% confidence).
▼ DesiredDirection
Benchmark hospitals are the winners in the comparison group: n = 15
Peer hospitals are the non-winners in the comparison group: n = 460
Note: 2016 values on the current and trend graphs will not match due to different norm factors used to normalize the expected values.
2012 - 2016 IP MORTALITY RATE OF IMPROVEMENT
0.00
0.50
1.00
1.50
2.00
2.50
3.00
3.50
4.00
2012 2013 2014 2015 2016
IND
EX
Profiled hospital is NOT CHANGING (99% confidence)
> 80 to Max
> 60 to 80
> 40 to 60
> 20 to 40
Min to 20 Profiled Hospital
Hospital performance compared to peer hospital quintiles: n = 440
HOSPITALCOMPARISON GROUP
PROFILED HOSPITAL
PERCENTILE POINTS ► 20th 40th 60th 80th Value Upper C.I. Lower C.I.
YEARS
2012 0.58 0.83 1.16 1.59 1.12 2.82 0.32
2013 0.54 0.79 1.06 1.50 1.01 2.27 0.35
2014 0.54 0.83 1.09 1.53 1.01 2.11 0.40
2015 0.53 0.82 1.13 1.55 0.93 2.19 0.29
2016 0.61 0.86 1.11 1.51 0.71 1.93 0.17
Watson Health © IBM Corporation 2017 32 of 38

Sample Hospital
PCI patients:Risk-adjusted complications index2016 COMPLICATIONS PERFORMANCE
0.00
0.20
0.40
0.60
0.80
1.00
ProfiledHospital
BenchmarkMedian
PeerMedian
0.67
0.79
0.94
IND
EX
Profiled hospital is statistically AS expected (99% confidence).
▼ DesiredDirection
Benchmark hospitals are the winners in the comparison group: n = 15
Peer hospitals are the non-winners in the comparison group: n = 460
Note: 2016 values on the current and trend graphs will not match due to different norm factors used to normalize the expected values.
2012 - 2016 COMPLICATIONS RATE OF IMPROVEMENT
0.00
0.50
1.00
1.50
2.00
2.50
3.00
2012 2013 2014 2015 2016
IND
EX
Profiled hospital is NOT CHANGING (99% confidence)
> 80 to Max
> 60 to 80
> 40 to 60
> 20 to 40
Min to 20 Profiled Hospital
Hospital performance compared to peer hospital quintiles: n = 440
HOSPITALCOMPARISON GROUP
PROFILED HOSPITAL
PERCENTILE POINTS ► 20th 40th 60th 80th Value Upper C.I. Lower C.I.
YEARS
2012 0.59 0.78 0.99 1.29 1.29 2.46 0.58
2013 0.59 0.81 1.03 1.32 0.85 1.84 0.32
2014 0.60 0.86 1.12 1.50 1.06 2.03 0.48
2015 0.63 0.90 1.22 1.54 1.07 2.00 0.49
2016 0.61 0.86 1.17 1.59 0.73 1.52 0.29
Watson Health © IBM Corporation 2017 33 of 38
Sample Hospital
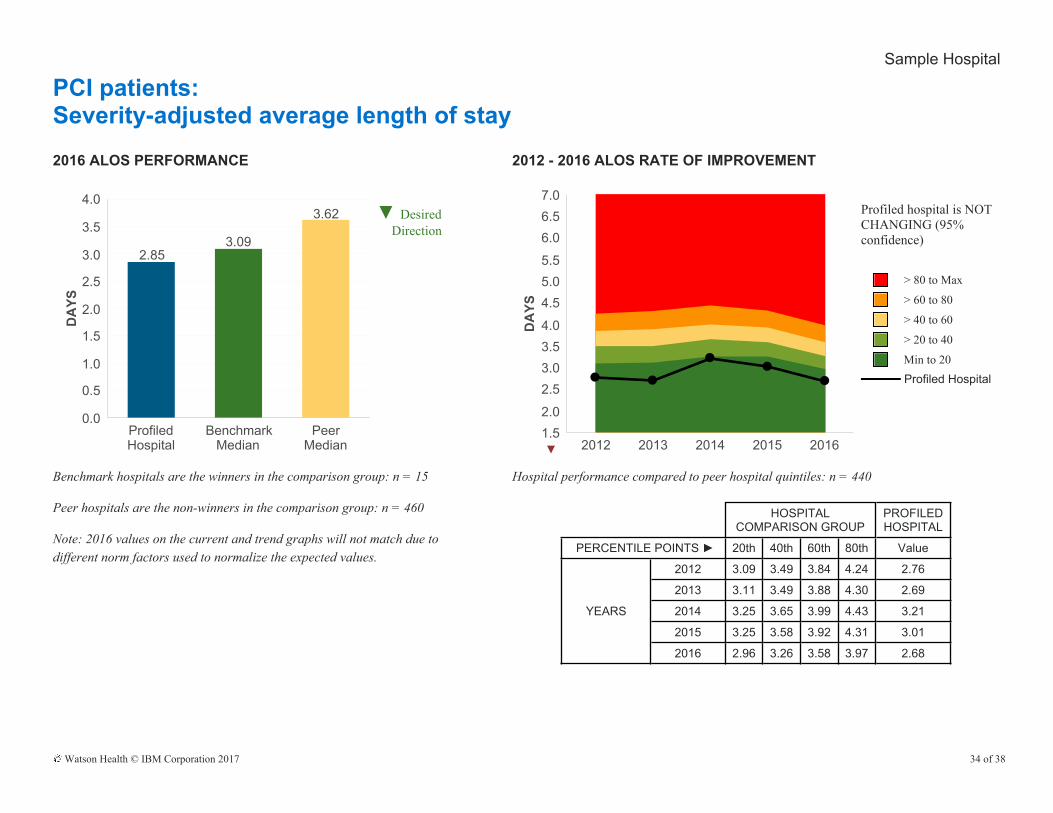
PCI patients:Severity-adjusted average length of stay2016 ALOS PERFORMANCE
0.0
0.5
1.0
1.5
2.0
2.5
3.0
3.5
4.0
ProfiledHospital
BenchmarkMedian
PeerMedian
2.853.09
3.62
DA
YS
▼ DesiredDirection
Benchmark hospitals are the winners in the comparison group: n = 15
Peer hospitals are the non-winners in the comparison group: n = 460
Note: 2016 values on the current and trend graphs will not match due to different norm factors used to normalize the expected values.
2012 - 2016 ALOS RATE OF IMPROVEMENT
1.52.0
2.53.03.54.0
4.55.05.5
6.06.57.0
2012 2013 2014 2015 2016
DA
YS
Profiled hospital is NOT CHANGING (95% confidence)
> 80 to Max
> 60 to 80
> 40 to 60
> 20 to 40
Min to 20 Profiled Hospital
Hospital performance compared to peer hospital quintiles: n = 440
HOSPITALCOMPARISON GROUP
PROFILEDHOSPITAL
PERCENTILE POINTS ► 20th 40th 60th 80th Value
YEARS
2012 3.09 3.49 3.84 4.24 2.76
2013 3.11 3.49 3.88 4.30 2.69
2014 3.25 3.65 3.99 4.43 3.21
2015 3.25 3.58 3.92 4.31 3.01
2016 2.96 3.26 3.58 3.97 2.68
Watson Health © IBM Corporation 2017 34 of 38

Sample Hospital
PCI patients:Wage- and severity-adjusted cost per case2016 COST PER CASE PERFORMANCE
0
4,000
8,000
12,000
16,000
20,000
ProfiledHospital
BenchmarkMedian
PeerMedian
$14,299$15,952
$18,293
DO
LLA
RS
▼ DesiredDirection
Benchmark hospitals are the winners in the comparison group: n = 15
Peer hospitals are the non-winners in the comparison group: n = 460
Note: 2016 values on the current and trend graphs will not match due to different norm factors used to normalize the expected values.
2012 - 2016 COST PER CASE RATE OF IMPROVEMENT
8,000
13,000
18,000
23,000
28,000
33,000
38,000
2012 2013 2014 2015 2016
DO
LLA
RS
Profiled hospital is NOT CHANGING (95% confidence)
> 80 to Max
> 60 to 80
> 40 to 60
> 20 to 40
Min to 20 Profiled Hospital
Hospital performance compared to peer hospital quintiles: n = 440
HOSPITALCOMPARISON GROUP
PROFILEDHOSPITAL
PERCENTILE POINTS ► 20th 40th 60th 80th Value
YEARS
2012 14,410 16,489 17,960 20,540 17,507
2013 14,434 16,392 18,023 20,162 18,041
2014 14,455 16,324 18,279 20,718 14,623
2015 14,176 15,926 17,528 19,952 13,317
2016 18,711 21,119 23,640 27,240 17,596
Watson Health © IBM Corporation 2017 35 of 38
Sample Hospital
New metrics under consideration
This section of your report contains measures that we are currently considering for future inclusion in the study.• Excess days in acute care (EDAC) measures:
• 30-day excess days in acute care for AMI patients • 30-day excess days in acute care for HF patients
As defined by the Centers for Medicare & Medicaid Services (CMS), the “EDAC measures capture excess days that a hospital’s patients spent in acute care within 30 days after discharge.”The values of these measures are the number of risk-adjusted days a hospital’s patients spend in an emergency department (ED), a hospital observation unit, or a hospital inpatient unit (“days in acute care”) during 30 days following a hospitalization for AMI or HF.”The measures report the difference (“excess”) between each hospital’s average days in acute care (“predicted days”) and the number of days in acute care that each hospital’s patients would have been expected to spend if discharged from an average-performing hospital (“expected days”). The measure is reported as excess days per 100 discharges.
We welcome your comments and feedback on the usefulness and relevance of these measures in assessing leadership’s ability to drive high-level, balanced performance.
Watson Health © IBM Corporation 2017 36 of 38
Sample Hospital
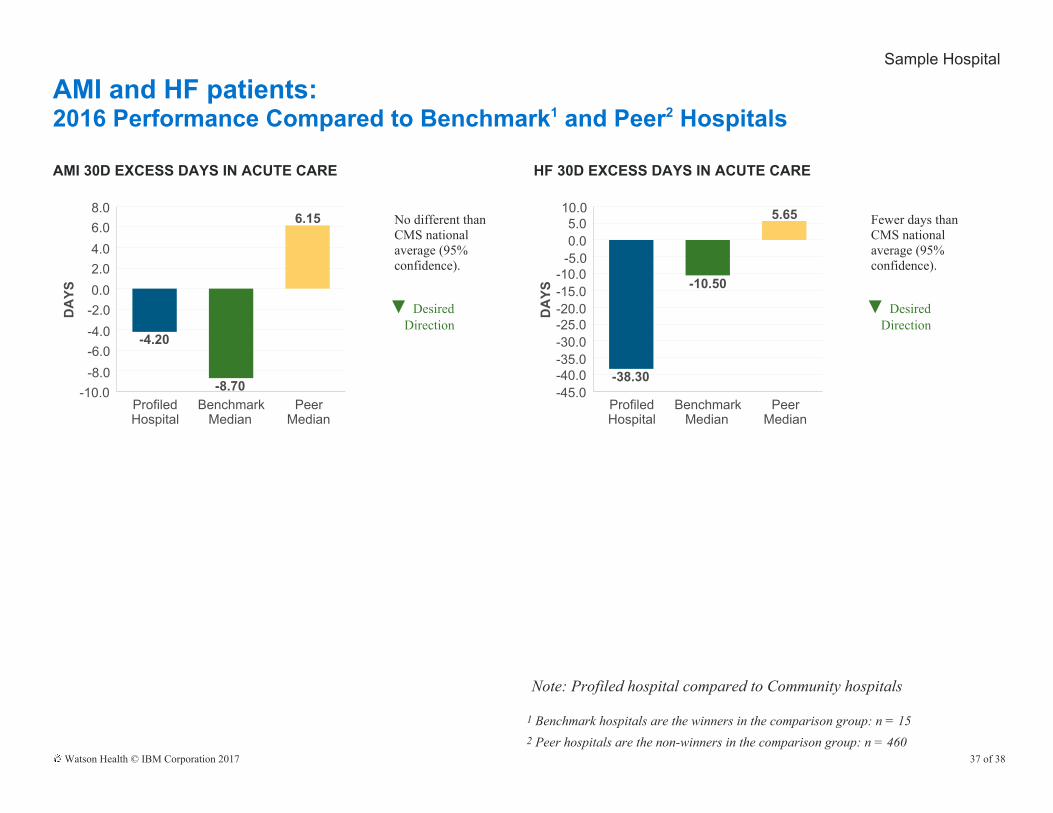
AMI and HF patients:2016 Performance Compared to Benchmark1 and Peer2 Hospitals
AMI 30D EXCESS DAYS IN ACUTE CARE HF 30D EXCESS DAYS IN ACUTE CARE
-10.0-8.0-6.0-4.0-2.00.02.04.06.08.0
ProfiledHospital
BenchmarkMedian
PeerMedian
-4.20
-8.70
6.15
DA
YS
No different than CMS national average (95% confidence).
▼ DesiredDirection
-45.0-40.0-35.0-30.0-25.0-20.0-15.0-10.0
-5.00.05.0
10.0
ProfiledHospital
BenchmarkMedian
PeerMedian
-38.30
-10.50
5.65
DA
YS
Fewer days than CMS national average (95% confidence).
▼ DesiredDirection
Note: Profiled hospital compared to Community hospitals
1 Benchmark hospitals are the winners in the comparison group: n = 152 Peer hospitals are the non-winners in the comparison group: n = 460
Watson Health © IBM Corporation 2017 37 of 38
© Copyright IBM Corporation 2017
IBM CorporationSoftware GroupRoute 100Somers, NY 10589
Produced in the United States of America October 2017
IBM, the IBM logo, ibm.com, and Watson Health are trademarks of International Business Machines Corp., registered in many jurisdictions worldwide. Other product and service names might be trademarks of IBM or other companies.
A current list of IBM trademarks is available on the Web at “Copyright and trademark information” at:ibm.com/legal/copytrade.shtml
This document is current as of the initial date of publication and may be changed by IBM at any time. Not all offerings are available in every country in which IBM operates.
The information in this document is provided “as is” without any warranty, express or implied, including without any warranties of merchantability, fitness for a particular purpose and any warranty or condition of non-infringement.
IBM products are warranted according to the terms and conditions of the agreements under which they are provided.
Statement of Good Security Practices: IT system security involves protecting systems and information through prevention, detection and response to improper access from within and outside your enterprise. Improper access can result in information being altered, destroyed or misappropriated or can result in damage to or misuse of your systems, including to attack others.
No IT system or product should be considered completely secure and no single product or security measure can be completely effective in preventing improper access. IBM systems and products are designed to be part of a comprehensive security approach, which will necessarily involve additional operational procedures, and may require other systems, products or services to be most effective. IBM does not warrant that systems and products are immune from the malicious or illegal conduct of any party.


![Cardio - Admera Health · PHARMACOGENOMICS TEST TO BETTER TREAT CARDIOVASCULAR DISEASES & CONDITIONS Cardio [16] Genes ABCB1 ACE ADRA2A AGTR1 APOE CYP2C19 CYP2C9 CYP2D6 CYP3A4 CYP3A5](https://img.pdfslide.us/doc/110x75/5fb27aa653d65601df68e958/cardio-admera-health-pharmacogenomics-test-to-better-treat-cardiovascular-diseases.jpg)