Embed Size (px)
Citation preview

IN the 1980s and 1990s, few issues related toschooling were as universally endorsed as home-work. Educators, parents, and policymakers ofall political and pedagogical stripes insisted thathomework is good and more is better—a viewthat was promoted most visibly in A Nation atRisk (National Commission on Excellence in Ed-ucation, 1983) and What Works (U.S. Depart-ment of Education, 1986).1 Indeed, never in thehistory of American education was there astronger professional and public consensus infavor of homework (see Gill & Schlossman,1996; Gill & Schlossman, 2000).
Homework has been touted for academic andcharacter-building purposes, and for promotingAmerica’s international competitiveness (see,e.g., Cooper, 2001; Keith, 1986; Maeroff, 1992;Maeroff, 1989; The Economist, 1995). It hasbeen viewed as a key symbol, method, and yard-stick of serious commitment to educational re-
319
form. In 1995, when a maverick school boardmember in the small town of Half Moon Bay,California proposed to abolish homework fromthe local public schools, he was derided not onlylocally but in the national press (Gill & Schloss-man, 1995). The consensus view was summed uptwo years later by the state superintendent ofpublic instruction and the state school boardpresident of California: “Our children are com-peting in a global economy,” they warned. “Theextra hours spent after school on homework inEurope and Asia are giving those children anextra boost into the 21st century. We should notdo less in California” (Eastin & Larsen, 1997).2
Indeed, recent news reports suggest that thepro-homework consensus is in danger of becom-ing a victim of its own success, based on de-scriptions of the woes of children and parentswho are losing sleep, burning out, and enteringtherapy as a result of heavy doses of homework.
A Nation at Rest: The American Way of Homework
Brian P. GillRAND
Steven L. SchlossmanCarnegie Mellon University
We use several national surveys to provide a 50-year perspective on time spent on homework. Thegreat majority of American children at all grade levels now spend less than one hour studying on atypical day—an amount that has not changed substantially in at least 20 years. Moreover, high schoolstudents in the late 1940s and early 1950s studied no more than their counterparts did in the 1970s,1980s, and 1990s. Changes in educational opinion on homework over the last half century have hadlittle effect on student behavior, with only two notable exceptions: a temporary increase in homeworktime in the decade following Sputnik, and a new willingness in the last two decades to assign smallamounts to primary-grade students.
Keywords: Cold War culture, “excellence” movement, history of education, home and school, homework
Educational Evaluation and Policy AnalysisFall 2003, Vol. 25, No. 3, pp. 319–337
The respective authors wish to express thanks to the RAND Corporation and the Hoover Institution for providing the opportunityand support to complete research for this article. Conclusions and opinions expressed in this article are entirely the authors’ own.

According to a story in the New York Times,American students are increasingly “homeworkbound” by the “gross tonnage of today’s home-work” (Winerip, 1999). Similarly, the RaleighNews Observer finds students and parents talkingseriously about “surviving” the homework loadof first and second grades; meanwhile, the sky isapparently the limit in high schools, as differentsubject teachers indiscriminately assign home-work without concern for the overall daily loadon students (Hui, 2000). USA Today reports thatAmerica is in the midst of a period of “homeworkintensification” (Hellmich, 2000). An op-ed pieceby the former president of Pepperdine Universityconcludes that homework “is at an all-time high”(Davenport, 2002). Even talk-show host OprahWinfrey has joined the debate, devoting a showto discussing the “onslaught of homework.”3
The perception that homework has increasedin recent years is supported by the results of a re-search study that is often cited in newspaper re-ports. The Institute for Social Research at theUniversity of Michigan found that time spent onhome study by 6- to 8-year-old children morethan doubled between 1981 and 1997 (Hofferth& Sandberg, 2000).4 The Michigan study is citednot only in news reports, but also in a recentbook advocating “the end of homework”—provocatively subtitled, “How Homework Dis-rupts Families, Overburdens Children, and Lim-its Learning” (Kralovec & Buell, 2000). The Endof Homework, like many of the recent press re-ports, laments “the enormous homework burdenborne by our students and their families” (Kralovec& Buell, 2000, p. x).
Given the strength of the pro-homework con-sensus over the last twenty years, it would not besurprising if the homework burden for typicalAmerican students today was indeed substantial,and substantially more than that of earlier decades.But the perception of a heavy and growing home-work load has been based almost entirely on anec-dote (with the notable exception of the Michiganstudy). Scholars have shown little interest in seri-ously examining issues as mundane as the amountof time that students spend on homework, whetherhomework increases with grade level, or howhomework loads have changed over time.
That homework is mundane does not make it unimportant. Homework engages the child-family-school interface on a daily basis—moreso than any other school practice (for elabora-
Gill and Schlossman
320
tion on this theme, see Gill & Schlossman, 2003).Furthermore, homework is a barometer of thesuccess—or the limits—of movements to raiseacademic standards. To succeed, academic excel-lence movements ultimately require students to in-vest effort in their studies; time spent on homeworkis a ground-level indicator of this effort. Analysisof historical trends in homework can thereforeilluminate the effectiveness of broader educa-tion reform movements, both past and present.
In this article we reverse the standard chrono-logical organization of historical argument. Webegin with the present and work our way back tothe late 1940s, when the first systematic nationaldata on homework time were collected.
Time Spent on Homework Today
The most systematic evidence on homeworktime at multiple grade levels across the countrycomes from background questions given to stu-dents undertaking the National Assessment ofEducational Progress (NAEP). In 1999, studentstaking NAEP tests at three different ages—9, 13,and 17—were asked, “How much time did youspend on homework yesterday?”5 Figure 1 com-pares the proportion of students doing less thanone hour of homework with those doing morethan two hours, at each age level.6
The results for 9-year-olds are unsurprising.These are students who are in third or fourthgrade, when we would not expect large quanti-ties of homework. It seems clear that very few ofthese students are seriously overburdened withhomework: only 5% reported spending morethan two hours the previous night. While the 13-year-olds (surveyed in the fall, when mostwould have been in eighth grade) are doing morehomework, their loads likewise do not seem ex-cessive: only 8% spent more than two hoursstudying the night before.
What is perhaps most surprising is the home-work load for 17-year-olds. Surveyed in thespring, most were in grade 11. The time they spenton homework differed only marginally from thatof 13-year-old students. Although two hours haslong been considered an appropriate amount of study for a high-school junior—especially forthose who plan to attend college—only 12% spentmore than that the night before the survey.7 Nearlytwo-thirds of both 17- and 13-year-old studentsspent less than one hour on homework.

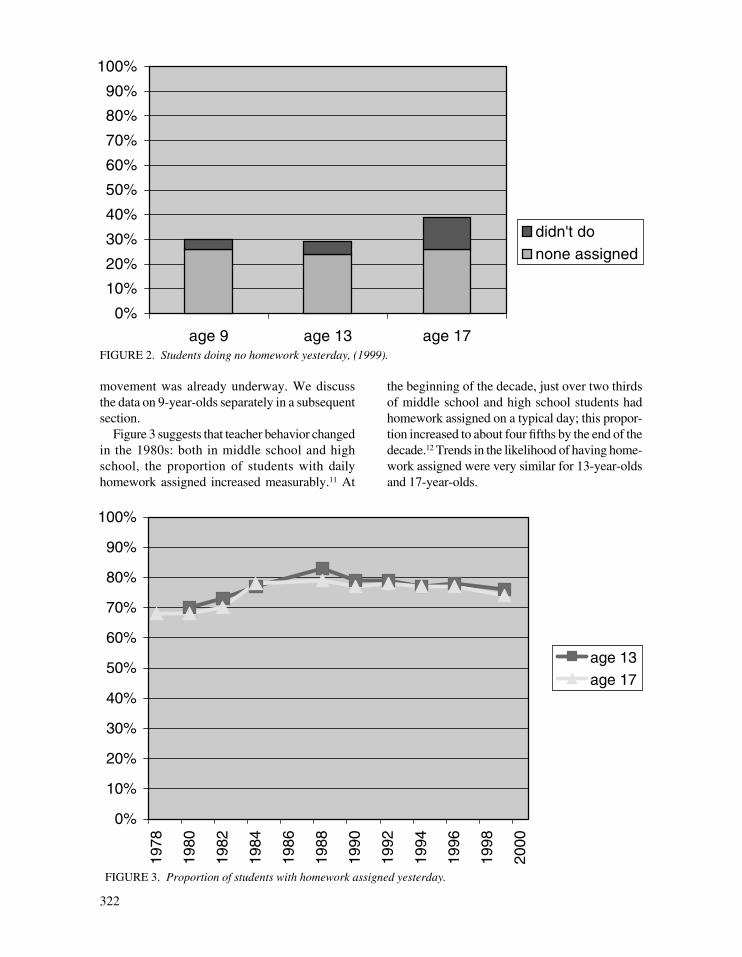
The limited amount of homework done by most17-year-olds is underscored by an examinationof the low end of the scale: the proportion ofstudents who do no homework at all on any par-ticular school day. These include students whohad no homework assigned and those who failedto do assigned homework. Figure 2 comparesthese groups at all three age levels.
As Figure 2 indicates, on any particular schoolday, 17-year-olds are less likely than 13-year-olds or 9-year-olds to do any homework. On anyparticular school day, nearly two high-schooljuniors in five are doing no homework at all. At all age levels, one quarter of students saythey had no homework assigned yesterday. Highschool students, however, are far more likelythan younger students to ignore homework thatis assigned—a finding that will surely come asno surprise to high-school teachers.8
Variations in time spent on homework—withinand between schools—are undoubtedly large.Although scholars have rarely assessed the differ-ences systematically, it is clear that many schoolshave higher expectations, and many individual
321
students do indeed devote substantial amounts oftime to study.9 Nevertheless, these figures seri-ously undermine any claims that homeworktoday involves a large time commitment for mostAmerican students at any grade level.
Homework Trends Over the Last 25 Years
Even if homework loads are not especiallylarge for most students today, have they increasedsince the academic excellence movement thatbegan in the late 1970s made homework centralto the goals of educational reform? In fact, theevidence from NAEP shows only small increasessince that time period, many of which were notsustained through the 1990s.
The clearest evidence suggesting that the pro-homework consensus of the last quarter centuryhad a positive effect can be found in the proba-bility that teachers will assign homework on anygiven day. Figure 3 charts the proportion of stu-dents aged 13 and 17 who had homework as-signed yesterday.10 Here we omit the 9-year-oldsbecause NAEP began asking them about home-work only in 1984, when the academic excellence
0%
10%
20%
30%
40%
50%
60%
70%
80%
90%
100%
<1 hr >2 hrs
age 9age 13age 17
FIGURE 1. Time spent on homework, 1999.
322
0%
10%
20%
30%
40%
50%
60%
70%
80%
90%
100%
age 9 age 13 age 17
didn't donone assigned
FIGURE 2. Students doing no homework yesterday, (1999).
0%
10%
20%
30%
40%
50%
60%
70%
80%
90%
100%
1978
1980
1982
1984
1986
1988
1990
1992
1994
1996
1998
2000
age 13
age 17
FIGURE 3. Proportion of students with homework assigned yesterday.
movement was already underway. We discussthe data on 9-year-olds separately in a subsequentsection.
Figure 3 suggests that teacher behavior changedin the 1980s: both in middle school and highschool, the proportion of students with dailyhomework assigned increased measurably.11 At
the beginning of the decade, just over two thirdsof middle school and high school students hadhomework assigned on a typical day; this propor-tion increased to about four fifths by the end of thedecade.12 Trends in the likelihood of having home-work assigned were very similar for 13-year-oldsand 17-year-olds.

As Figure 3 indicates, during the 1990s, home-work assignment trends moved very gradually inthe other direction: the likelihood that highschool and middle school students would be as-signed homework on any evening declined fromapproximately four fifths to approximately threefourths.13 At the end of the century, however,teachers in both middle school and high schoolremained somewhat more likely to assign home-work daily than they had been 20 years earlier.14
As homework assignment became more com-mon during the 1980s, the probability that studentswould spend more than an hour daily on home-work also increased, but not by large amounts.Figure 4 shows the changes between 1978 and2000 in the proportion of 13- and 17-year-oldswho spent at least one hour on homework thenight before the survey.
As with the trends in homework assignment,the trends in students doing one hour or more ofhomework closely parallel each other at ages 13and 17. Indeed, since 1980 (the first year that themeasure is available for 13-year-old students),there have been virtually no notable differencesbetween 13- and 17-year-olds in the proportionspending at least one hour on homework. Thecommon-sense expectation that there should be a progressive escalation of homework loadas students proceed from middle school to high
A Nation at Rest: The American Way of Homework
323
school does not appear to be the general practicein American schooling.
In addition, the trends in this chart are a bitflatter than those representing the likelihood of astudent receiving a homework assignment in Fig-ure 3. While some increases were evident in theearly to mid-1980s, they were not large. The pro-portion of 13-year-olds doing at least one hour ofhomework increased by only 10% from 1980(31%) to its peak in 1988 (41%), while the pro-portion of 17-year-olds in the same category in-creased by only 7% from 1978–1980 (33%) to itspeak in 1984 (40%).15
During the 1990s, the trends in Figure 4 mir-ror those in Figure 3, indicating a very gradualdecline in the proportion of middle school andhigh school students doing at least one hour ofhomework. By 1999, the figures in both age groupsdeclined to numbers approaching what they werein 1980—shortly after the academic excellencemovement had begun.
Trends similar to those found in the NAEPdata can be found in two other major nationaldata sets. Monitoring the Future is an annual sur-vey of high-school seniors conducted by the In-stitute for Social Research at the University ofMichigan (Johnston, Bachman, & O’Malley,2001). Every year since 1976, it has asked thesame question about homework loads to a
0%
10%
20%
30%
40%
50%
60%
70%
80%
90%
100%
1978
1980
1982
1984
1986
1988
1990
1992
1994
1996
1998
2000
age 13age 17
FIGURE 4. Proportion of students doing 1 hour or more of homework, 1978–1999.

nationally representative sample of high schoolseniors. The results are not directly comparableto the NAEP data, because the question asksabout weekly (rather than daily) homework timeand specifically tells students to include in-schoolstudy time. Nevertheless, the time trend is gen-erally consistent with that of NAEP: a slight in-crease in the early 1980s followed by a gradualdecline since then (Johnston et al., 2001) (seealso Freedman-Doan & Libsch, 1997; Zill, Nord,& Loomis, 1995). Similarly, the Higher Educa-tion Research Institute at UCLA conducts anannual survey of first-year college students thatasks how much time they spent studying duringtheir final year of high school. This, of course, isa select sample of high school seniors, who wouldprobably have studied more than those who didnot go on to college. Again, however, the trendis consistent with the NAEP data: the percentageof respondents who studied six or more hoursweekly as seniors gradually declined from 47%in 1987, when the question was first asked, to33% in 2002 (Sax, Lindholm, Astin, Korn, &Mahoney, 2002).
In sum: the 1980s saw a measurable but smallincrease in the amount of homework done by mid-dle school and high school students. The increasewas most evident in the likelihood that teacherswould assign a minimal amount of homework,and somewhat less evident in the likelihood thatstudents would spend at least one hour daily onhomework. The only measurable increases oc-curred in the early- to mid-1980s, coinciding withthe height of the public effort to promote aca-demic excellence and increase homework.16 A Na-tion at Risk, the academic excellence movement’ssymbolic call to arms, was published in 1983 (Sec-retary of Education Terrell Bell commissioned thegroup that authored it in August, 1981), followedby What Works in 1986 (sponsored by Bell’s suc-cessor, William Bennett). Since 1988, however,despite continuing public support for academic ex-cellence generally and homework specifically, theamount of homework done by middle school andhigh school students has not increased, and in facthas slowly and gradually declined.
Homework in the Elementary Grades Since the 1980s
Although the NAEP data demonstrate thathomework loads for middle and high school stu-dents were not substantially greater in the late1990s than 20 years earlier, homework loads for
Gill and Schlossman
324
elementary-grade students deserve further analy-sis. As noted earlier, the Institute for Social Re-search at the University of Michigan found a146% increase between 1981 and 1997 in the timethat six- to eight-year-old children (generally ingrades K-3) spent on home study (Hofferth &Sandberg, 2000, Figure 6). The ISR study is basedon time diaries that cataloged all of the activitiesundertaken by a nationally representative group ofchildren over the course of a week. Time diariesare generally considered the most accurate way tomeasure time use (Juster & Stafford, 1985; Juster& Stafford, 1991; Larson & Verma, 1999). Thechildren’s time diaries used in this ISR study werecollected only twice, in 1981 and 1997.
While the home study increase measured by ISRwas proportionally huge for six- to eight-year-oldchildren, in absolute terms it was less dramatic. In1981, time diaries indicated that primary-gradechildren spent an average of 52 minutes studyingper week; this figure increased to 128 minutesper week in 1997 (Hofferth & Sandberg, 2000,Table 2).17 [The End of Homework dramaticallyoverstates the load for primary-grade students bymistakenly reporting weekly home study times asdaily times (Kralovec & Buell, 2000, p. 20)]. Theproportional increase seemed very large becausethe baseline measurement—time spent on studyin 1981—was very small.
Moreover, the ISR study found no substantialincrease in home study time over the same periodfor nine to twelve-year-old children (generallythird to sixth graders). Their average weekly homestudy time was 3:22 in 1981 and 3:41 in 1997—a difference that was not large enough to achievestatistical significance (Hofferth & Sandberg,2000, Table 2).
In this context, we return to the NAEP data on9-year-olds (in third or fourth grade). Figure 5 pre-sents NAEP trend data from 1984 (the first yearthe question was asked of 9-year-olds) through1999 on two indicators: rates of homework as-signment and the proportion of students doingmore than one hour of homework the night be-fore the survey.
Although we lack 9-year-old data prior to1984, when rates of homework assignment wereincreasing for middle school and high school stu-dents, assignment rates increased for 9-year-oldsbetween 1984 and 1988.18 It seems likely that thisfollowed an earlier increase consistent with thatfound for older students. Interestingly, however,rates of homework assignment for 9-year-olds

increased still further in the 1990s, unlike therates for 13- and 17-year-olds.19 This suggeststhat the ongoing academic excellence movementhas been more successful in changing the prac-tice of homework in the elementary grades thanin middle school or high school. It is also consis-tent with the ISR finding that study time increasedfor younger children but not older children.20
Even so, the “one hour or more” trend line un-dermines any claim that the increase in homeworkfor 9-year-olds was large. The line is virtually flatthroughout the period from 1984–1999, suggest-ing that the increase in homework assignment for9-year olds usually involved only nominal quanti-ties of homework—less than an hour daily.21 It ispossible that this line would have shown an in-crease prior to 1984, but nothing we have seensuggests that any such increase would have beenlarge. Given the small minority of 9-year-old chil-dren studying at least one hour in 1984 (andsince), the increase could not have been huge.
The Failed Movement to IncreaseHomework Over the Last 25 Years
The data presented in the preceding pages painta clear picture of homework practice in America
325
over the last quarter-century, at the elementary,middle, and high school levels. Although the pe-riod represents a high point in terms of home-work’s reputation among educators and the public(i.e., the consensus that homework is good andmore is better), it has hardly been a high point interms of the amount of time that students actuallyspend on homework. Claims about recent large in-creases in the homework load carried by most stu-dents are seriously overstated. Indeed, while ANation at Risk invoked America’s challenges inkeeping up with international competition, inter-national comparisons of homework loads suggestthat U.S. students spend far less time studyingthan many of their counterparts in Europe andAsia. In those regions, a number of studies havefound that teenagers study an average of two tothree hours or more daily (for a summary, see Lar-son & Verma, 1999). Several prominent findingsrelated to the American data may be surprising toeducators and policymakers alike:
• For the great majority of students at all ages,the total amount of time spent on homework isquite limited. Indeed, over the past quarter cen-tury, the majority of students at all grade levelsspent less than one hour daily on homework.
0
10
20
30
40
50
60
70
80
90
100
1984
1986
1988
1990
1992
1994
1996
1998
2000
% o
f stu
dent
s
hw assignedyesterdayone hour or more
hw = homework
FIGURE 5. Homework trends for 9-year-olds, 1984–99.
• Time spent on homework does not consis-tently increase as students age. The likelihoodthat a student will have homework assigned onany particular day is essentially the same at agesnine (74% in 1999), thirteen (76%), and seven-teen (74%). Because they are more likely toignore homework assignments, 17-year-olds areactually less likely to be doing homework on anyparticular day than are 13-year-olds and 9-year-olds. While the proportion of students studyingat least one hour per day increases from elemen-tary (age 9) to middle school (age 13), most 17-year-olds spend no more time on homeworkthan do most 13-year-olds.22
• Time spent on homework has not increasedsubstantially over the last 25 years. Teachers aremore likely to assign homework than in the past,and there is some evidence of an increase in home-work quantity for elementary-grade students (fromlow baseline levels). But the pro-homework move-ment has not succeeded in producing a substantialand sustained increase in the proportion of studentsstudying at least one hour daily, at any age level.
These empirical findings raise a broader ques-tion: Can major changes in cultural preference andeducational policy affect practice? The changesevident in the early- and mid-1980s suggest thatthe academic excellence movement probably didaffect practice, but that the magnitude of the ef-fects on homework was small, and increases weredifficult to sustain over time. Indeed, if currenttrends continue, homework levels may dip belowthe levels measured before the academic excel-lence movement began. Educational reformershave reason for concern that the ratcheting up ofacademic standards over the last twenty years—as seen in increased graduation requirements andthe proliferation of Advanced Placement courses,for example—has not led to a substantial increasein time spent on homework.
High School Homework in the 1970s
The academic excellence movement exempli-fied by A Nation at Risk and What Works was mo-tivated in large part by a perception that, since thecultural revolution of the late 1960s, Americanschools had demanded too little of their students(Gutek, 2000; Honig, 1985; Ravitch, 2001). Al-though systematic data on homework time are lessavailable in the 1970s than in the later periods, thebest available evidence suggests that, at the highschool level, few students did substantial amounts
Gill and Schlossman
326
of homework during the 1970s. Nevertheless, aswe will discuss below, it does not appear that thehigh school homework load in the 1970s was dra-matically lower than in the 1980s and 1990s.
NAEP’s long-term trend data provide a con-sistent series on homework only as far back as1984 for 9-year-olds, 1980 for 13-year-olds, and1978 for 17-year-olds. Prior to 1980, we havebeen able to find nationally representative home-work time data only for high school students.Data from the 1970s are not directly comparableto the NAEP data from the 1980s and 1990s because survey questions asked about weekly,rather than daily, homework time. Nevertheless,an overlap of daily and weekly questions in a sin-gle year (1980) makes it possible to connect thetrends in the 1970s to the later period.
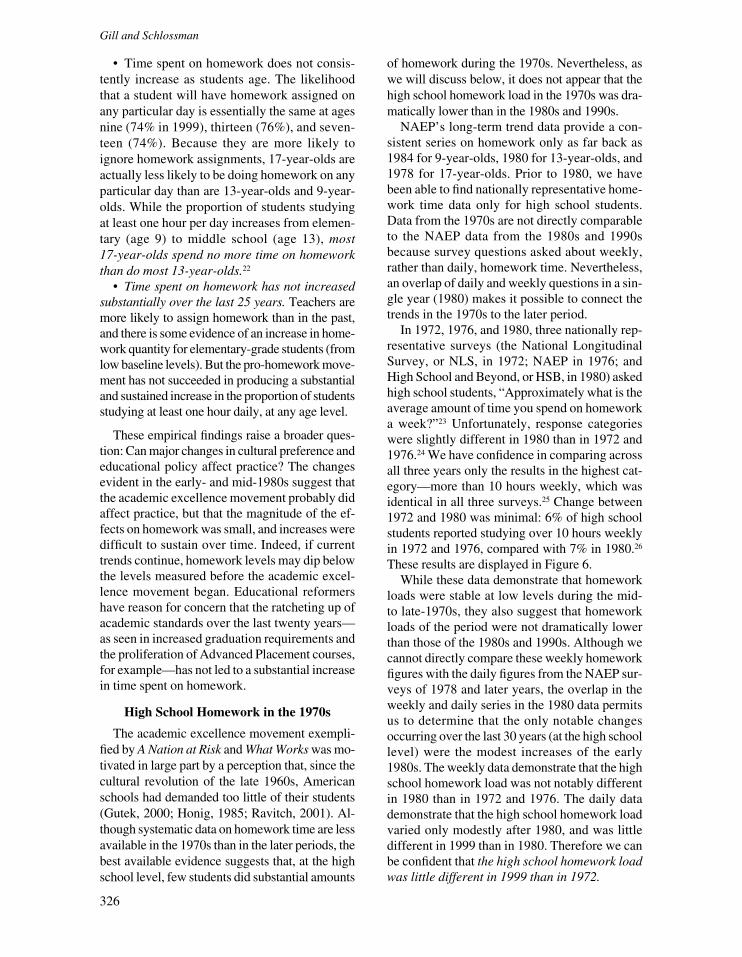
In 1972, 1976, and 1980, three nationally rep-resentative surveys (the National LongitudinalSurvey, or NLS, in 1972; NAEP in 1976; andHigh School and Beyond, or HSB, in 1980) askedhigh school students, “Approximately what is theaverage amount of time you spend on homeworka week?”23 Unfortunately, response categorieswere slightly different in 1980 than in 1972 and1976.24 We have confidence in comparing acrossall three years only the results in the highest cat-egory—more than 10 hours weekly, which wasidentical in all three surveys.25 Change between1972 and 1980 was minimal: 6% of high schoolstudents reported studying over 10 hours weeklyin 1972 and 1976, compared with 7% in 1980.26
These results are displayed in Figure 6.While these data demonstrate that homework
loads were stable at low levels during the mid- to late-1970s, they also suggest that homeworkloads of the period were not dramatically lowerthan those of the 1980s and 1990s. Although wecannot directly compare these weekly homeworkfigures with the daily figures from the NAEP sur-veys of 1978 and later years, the overlap in theweekly and daily series in the 1980 data permitsus to determine that the only notable changesoccurring over the last 30 years (at the high schoollevel) were the modest increases of the early1980s. The weekly data demonstrate that the highschool homework load was not notably differentin 1980 than in 1972 and 1976. The daily datademonstrate that the high school homework loadvaried only modestly after 1980, and was littledifferent in 1999 than in 1980. Therefore we canbe confident that the high school homework loadwas little different in 1999 than in 1972.
This finding further confirms that the acade-mic excellence movement had minimal effect onthe investment by high school students in study.While the homework loads of the 1970s might beconsidered low, they were nearly indistinguish-able from homework loads today, and not dra-matically lower than those experienced by highschool students at the peak of the academic ex-cellence movement in the mid-1980s. With thelast 30 years characterized more by continuitythan change, we must ask the longer-term ques-tion: was there ever a time when most Americanhigh school students were doing substantialquantities of homework?
Homework trends among high school students:the 1960s, 1950s, and 1940s
If the last 30 years have not seen a “goldenage” of homework, what about the 1960s—or atleast that portion of the decade prior to 1968, thesymbolic year which historians commonly use tomark a major shift in American politics, culture,and education (Goetz, 2002; Hodgson, 1976;Kaiser, 1988; Matusow, 1984; O’Neill, 1971)?
To explore this question empirically, we haveanalyzed homework data collected by the PurdueOpinion Panel between 1948 and 1967. Begunshortly after George Gallup and others pioneeredscientific opinion research at the national level,the Panel, under the leadership of H. H. Rem-mers, began surveying the attitudes, beliefs, andbehaviors of American high school youth in 1943(Converse, 1984, 1987). Over time, the Panel
327
“accumulated the most extensive and thoroughlyanalyzed storehouse of data on the attitudes ofadolescents in the United States,” according to itscreator (Remmers & Gage, 1955).
Homework was not one of the Panel’s morefrequently investigated topics. However, the foursurveys on homework that it conducted between1948 and 1967 offer the only nationwide overviewof high school homework practice prior to the1970s, encompassing grades 9–12 in 1948 and1952, and grades 10–12 in 1962 and 1967.27 Ourpresent goal is not to analyze all of the informationon homework that the Panel gathered. Rather, weselect Panel data from the 1940s–1960s that canbe compared most reliably with our data from the1970s–1990s.
Like the NAEP surveys of the last 30 years,the Purdue homework surveys generally askedabout daily homework time rather than weeklyhomework time. But unlike the NAEP surveysthat asked about yesterday’s homework, the Pur-due surveys asked students to estimate the “av-erage” amount of time spent on homework daily.One might guess that these two questions wouldlead to different results. Fortunately, another setof NAEP survey questions permits us to deter-mine how the results differ.
Over the past two decades, different NAEPsurveys have included different questions abouthomework. In some years, NAEP has asked ques-tions both about yesterday’s homework and aboutaverage daily homework—in different nation-ally representative surveys. The question, “How
0%
10%
20%
30%
40%
50%
60%
70%
80%
90%
100%
1972 1976 1980FIGURE 6. Percent of high school students studying more than 10 hours weekly, 1972–1980.
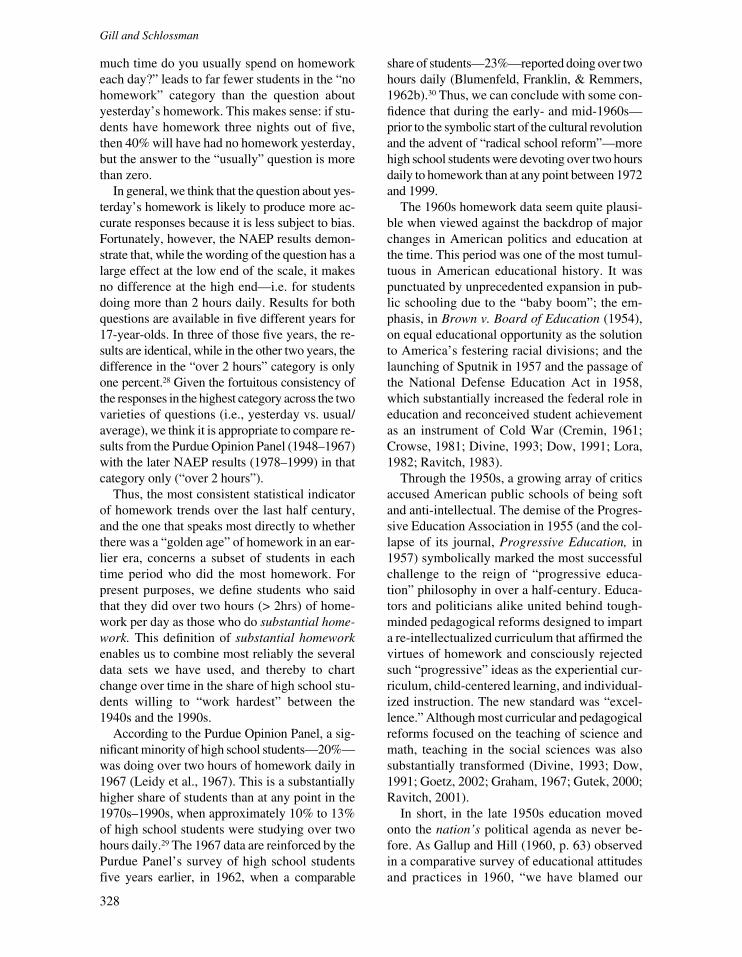
much time do you usually spend on homeworkeach day?” leads to far fewer students in the “nohomework” category than the question aboutyesterday’s homework. This makes sense: if stu-dents have homework three nights out of five,then 40% will have had no homework yesterday,but the answer to the “usually” question is morethan zero.
In general, we think that the question about yes-terday’s homework is likely to produce more ac-curate responses because it is less subject to bias.Fortunately, however, the NAEP results demon-strate that, while the wording of the question has alarge effect at the low end of the scale, it makesno difference at the high end—i.e. for studentsdoing more than 2 hours daily. Results for bothquestions are available in five different years for17-year-olds. In three of those five years, the re-sults are identical, while in the other two years, thedifference in the “over 2 hours” category is onlyone percent.28 Given the fortuitous consistency ofthe responses in the highest category across the twovarieties of questions (i.e., yesterday vs. usual/average), we think it is appropriate to compare re-sults from the Purdue Opinion Panel (1948–1967)with the later NAEP results (1978–1999) in thatcategory only (“over 2 hours”).
Thus, the most consistent statistical indicatorof homework trends over the last half century,and the one that speaks most directly to whetherthere was a “golden age” of homework in an ear-lier era, concerns a subset of students in eachtime period who did the most homework. Forpresent purposes, we define students who saidthat they did over two hours (> 2hrs) of home-work per day as those who do substantial home-work. This definition of substantial homeworkenables us to combine most reliably the severaldata sets we have used, and thereby to chartchange over time in the share of high school stu-dents willing to “work hardest” between the1940s and the 1990s.
According to the Purdue Opinion Panel, a sig-nificant minority of high school students—20%—was doing over two hours of homework daily in1967 (Leidy et al., 1967). This is a substantiallyhigher share of students than at any point in the1970s–1990s, when approximately 10% to 13%of high school students were studying over twohours daily.29 The 1967 data are reinforced by thePurdue Panel’s survey of high school studentsfive years earlier, in 1962, when a comparable
Gill and Schlossman
328
share of students—23%—reported doing over twohours daily (Blumenfeld, Franklin, & Remmers,1962b).30 Thus, we can conclude with some con-fidence that during the early- and mid-1960s—prior to the symbolic start of the cultural revolutionand the advent of “radical school reform”—morehigh school students were devoting over two hoursdaily to homework than at any point between 1972and 1999.
The 1960s homework data seem quite plausi-ble when viewed against the backdrop of majorchanges in American politics and education atthe time. This period was one of the most tumul-tuous in American educational history. It waspunctuated by unprecedented expansion in pub-lic schooling due to the “baby boom”; the em-phasis, in Brown v. Board of Education (1954),on equal educational opportunity as the solutionto America’s festering racial divisions; and thelaunching of Sputnik in 1957 and the passage ofthe National Defense Education Act in 1958,which substantially increased the federal role ineducation and reconceived student achievementas an instrument of Cold War (Cremin, 1961;Crowse, 1981; Divine, 1993; Dow, 1991; Lora,1982; Ravitch, 1983).
Through the 1950s, a growing array of criticsaccused American public schools of being softand anti-intellectual. The demise of the Progres-sive Education Association in 1955 (and the col-lapse of its journal, Progressive Education, in1957) symbolically marked the most successfulchallenge to the reign of “progressive educa-tion” philosophy in over a half-century. Educa-tors and politicians alike united behind tough-minded pedagogical reforms designed to imparta re-intellectualized curriculum that affirmed thevirtues of homework and consciously rejectedsuch “progressive” ideas as the experiential cur-riculum, child-centered learning, and individual-ized instruction. The new standard was “excel-lence.” Although most curricular and pedagogicalreforms focused on the teaching of science andmath, teaching in the social sciences was alsosubstantially transformed (Divine, 1993; Dow,1991; Goetz, 2002; Graham, 1967; Gutek, 2000;Ravitch, 2001).
In short, in the late 1950s education movedonto the nation’s political agenda as never be-fore. As Gallup and Hill (1960, p. 63) observedin a comparative survey of educational attitudesand practices in 1960, “we have blamed our

educators because the United States was not firstin orbiting a space satellite.” The academic ex-cellence reformers, Gallup and Hill (p. 76) noted,expected kids to study hard in the post-Sputnikera: keeping up with the Soviets was going torequire more homework, a longer school year,and higher educational standards, among otherchanges.
When the Purdue Panel surveyed high schoolstudents in 1962, America was in the midst ofthat era’s academic excellence movement. It wasalso perhaps the high point of the nation’s ColdWar fears regarding the Soviet threat to Ameri-can democratic institutions.31 This was a propi-tious time for persuading high school students tostudy hard: how well they performed in schooland matched up against their Soviet counterpartsmattered in ways that transcended their individ-ual happiness, social adjustment, or vocationalpreparation.32 The forces that reshaped Americanpolitics and culture in the post-Sputnik era seemconsistent with efforts by teachers to demand,and by students to complete, substantial home-work in the early to mid-1960s.33
But were the 1960s—when around one fifth ofhigh school students completed over two hoursof homework daily—the “golden age” of Amer-ican homework? Was this the hardest that Amer-ican high school students ever studied, at least inthe last half of the 20th century? Or were studentsin the decade following World War II (the late1940s and early 1950s) even more likely to studyhard than their counterparts in the post-Sputnikera? The Purdue Panel conducted surveys onhomework in 1948 and 1952 that allow us toaddress these questions empirically.
The data clearly indicate that following WorldWar II, high school students were not inclined tostudy very hard. Only a small share of students—8%—were doing more than two hours of home-work daily in 1948 (Remmers, Gage, & Shim-burg, 1948). This figure not only indicates thatpostwar high school students were doing substan-tially less homework than their counterparts in the1960s, but also suggests that they were doing nomore (and perhaps slightly less) than high schoolstudents at any point in the 1970s–1990s. Theamount of homework that high school students aredoing today is neither the highest nor the lowestamount that they have done since World War II.
The low homework pattern evident in 1948appears to have remained stable for at least the
A Nation at Rest: The American Way of Homework
329
next several years. When the Panel next surveyedhomework in high schools in 1952, it did not askpupils how much time they spent studying (Rem-mers, Horton, & Scarborough, 1952).34 Instead,it asked how much time they thought they oughtto study. Fortunately for us, the survey had in-cluded both questions in 1948. Not surprisingly,students in 1948 had reported that they ought tostudy a bit more than they in fact studied (Rem-mers et al., 1948). Between 1948 and 1952, theamount that students said they ought to study de-clined slightly. This suggests to us that the amountof time they actually studied probably did not in-crease. Doing substantial homework continuedto remain a rarity for high school students intothe early 1950s.
Figure 7 charts the proportion of students doingmore than two hours of homework daily as mea-sured by the Purdue Opinion Panel between 1948and 1967 (including an estimate for 1952, basedon calibrating the question about how muchhomework “ought” to be done with 1948 data).Unfortunately, it is impossible to specify withany precision the precise chronological pointafter 1952 and before 1962 when the share of stu-dents doing substantial homework increased to23%. The era’s academic excellence movementwas well underway by the early 1950s (Crowse,1981; Dow, 1991; Gutek, 2000; Lora, 1982).Nonetheless, given the growing confidence andpolitical urgency that the reform movement grad-ually acquired during the decade—especially theriveting fear raised by Sputnik’s launching in1957 that the nation was being “outsmarted” bythe Soviets, and the passage one year later of un-precedented levels of federal support for curric-ular innovation via NDEA—it makes sense thathomework would have increased beginning inthe late 1950s.
In sum, data from the Purdue Opinion Panelsupport four general conclusions about the goalsand results of educational reform from the late1940s through the 1960s:
1. Substantial increases occurred in the home-work load of American high school students,probably starting in the late 1950s;
2. These increases were supported by politicaland cultural forces that promoted academic excel-lence as a matter of national import. In an in-creasingly competitive global setting, declin-ing school performance was seen as weakeningAmerica’s stature, security, and economic power;

3. Homework loads declined precipitouslybetween 1967 and 1972; and
4. Even at homework’s peak in the post-Sputnik years—the “golden age” if ever therewas one—the great majority of high school stu-dents were spending less than two hoursnightly on home study.
Homework in the United States: A Long-Term Perspective
Our review of the homework load of Americanstudents since World War II produced a numberof interesting findings, some that are fairly pre-dictable but others that are quite surprising. Thebasic story is one of historical continuity. Whilethe amount of homework that students do has oc-casionally shifted upward or downward, the vari-ations have been relatively small, even in periodsof major educational foment. Whatever our coun-try has achieved educationally since World WarII, it had little to do with variations in how muchhomework children were assigned or completed.
Both of the two major academic excellencemovements of the past half-century producedmeasurable increases in homework, but the sub-stantive importance of the increases is debatable.The excellence movement that began in the late1970s produced only marginal (dare we say triv-
330
ial?) increases, while the excellence movementthat began in the 1950s produced larger increasesthat nevertheless left the great majority of Amer-ican high school students studying less than twohours daily. In neither case were the increasessustained a decade later. The American way ofhomework has mainly been at rest: on the onehand, students at all grade levels did very littlehomework throughout the second half of the 20thcentury; on the other hand, concerted attempts toraise homework levels had little immediate impactand virtually no lasting effect. As a result, highschool students in 1999 had approximately thesame homework load as those in 1980, 1972, or1948. This finding is clearest in Figure 8, whichcharts the proportion of students doing substan-tial homework over the half-century from 1948though 1999, combining all of the data sets avail-able to us, including Purdue Opinion Panel datafrom 1948–67, National Longitudinal Survey datafrom 1972, and NAEP data from 1976–1999.35
It is evident that the academic excellence move-ment of the past two decades—at least with re-gard to homework—has largely failed. Averagehomework time has increased very little, with themost substantial and sustained increases occur-ring in the elementary grades. Homework hasincreased at precisely the lower grade levels
0%
10%
20%
30%
40%
50%
60%
70%
80%
90%
100%
1948
1949
1950
1951
1952
1953
1954
1955
1956
1957
1958
1959
1960
1961
1962
1963
1964
1965
1966
1967
1968
FIGURE 7. Percent of high school students spending more than 2 hours on homework daily, 1948–1967.

where researchers believe it matters least for aca-demic achievement (Cooper, 1989), and wherethere is the least public consensus that more isnecessarily better.
Research indicates that homework matters alot for achievement at the high school level(Cooper, 1989). Moreover, the public is solidlybehind the effort to increase the homework levelof high school students. Unfortunately, it is pre-cisely at the high school level that the failures ofhomework reform have been most evident. Today,the majority of American students are doing onlymodest amounts of homework: less than one hourper day, in all grade levels—elementary, middle,and high. For most students, the homework loadincreases only modestly between elementary andmiddle school, and not at all between middleschool and high school. The expectation that stu-dents ought naturally to do more homework asthey advance in grade, and particularly as theyprepare for college and for head-to-head compe-tition with international students in a globaleconomy, has not assimilated into the culture ofthe American high school.
331
Our historical research does demonstrate, how-ever, that it is not impossible, even in America,to persuade high school students to do morehomework. High school students spent moretime studying in the early- to mid-1960s thanthey do today.36 We have not investigated thelocal mechanisms of change in policy and prac-tice that made homework reform more success-ful in the post-Sputnik era than in recent times.But it seems clear that in both periods, the effortto effect change was conscious and deliberate atthe national, state, and local levels, reflectingvalues and cues that were widely shared and ar-ticulated by political and educational leaders. Inboth periods, a global threat of major propor-tions (“a nation at risk”) was invoked to moti-vate educational change; in neither period didserious philosophical or political division weakenthe new push for excellence. Indeed, if any-thing, homework was more central to the cam-paign for academic excellence in the 1980s thanin the 1950s. Hence, the failure to raise home-work levels during the past quarter century standsout all the more. The gap between the rhetoric
0%
10%
20%
30%
40%
50%
60%
70%
80%
90%
100%
1948
1950
1952
1954
1956
1958
1960
1962
1964
1966
1968
1970
1972
1974
1976
1978
1980
1982
1984
1986
1988
1990
1992
1994
1996
1998
2000
FIGURE 8. Proportion of high school students doing substantial homework (more than 2 hours daily), 1948–1999.
and the reality of homework reform has neverbeen greater than it is today.
Yet we should not be nostalgic about past tri-umphs in homework reform. The achievementsof the Sputnik-era academic excellence move-ment should not be exaggerated, at least with re-gard to homework. Even at homework’s peakduring the mid-1960s, less than one quarter ofhigh school students studied more than two hoursdaily. These levels were well above those of adecade or two earlier. But even at their height,the post-Sputnik homework levels hardly consti-tuted a true “golden age” of homework. Some ofthe leading homework scholars in the 1950s and1960s considered two hours per day as normaland appropriate, not an unusual amount of timefor high school students to study—much like theiracademic counterparts do today (Cooper, 2001;Goldstein, 1960). Indeed, even in 1960, in themidst of the post-Sputnik excellence movement,a Gallup study lamented that American studentswere studying far less than their counterparts inGermany, France, and Norway (Gallup & Hill,1960). Most American high school students in thepost-Sputnik era ignored the homework imperativearticulated by educational reformers.
Regardless, there is no denying that the in-creases in homework that took place in the post-Sputnik period were anomalous. The main his-torical trend over the past half-century is that ofcontinuity. American high school students in thelate 1940s and early 1950s studied no more thantheir counterparts did in the 1970s, 1980s, and1990s. Since World War II—whether prevailingeducational opinion opposed or supported home-work as a cure for the nation’s educational ills—the American way of homework has largely restedat levels comfortably below those of the post-Sputnik peak. Just as in the late 1940s, less thanone hour per day is the norm today.
Homework Reform: Toward a MoreFruitful Policy Discourse
Is there something distinctive to American cul-ture, or to our policymaking process in education,that undermines periodic efforts to increase home-work? That intriguing question, alas, is beyond theability of our empirical evidence to address. Butwe do believe that there is something peculiar tothe American discourse on homework that futurereformers will have to address if they hope to makehomework a more integral and valued part of thehigh school experience, as we think it should be.
Gill and Schlossman
332
Historically, homework has been one of themost emotionally charged topics in Americaneducation. Opinions on homework have tendedtoward extremes, with one viewpoint or anotherdominating for relatively lengthy periods of time.For example, between 1900 and 1940 a crusadeagainst homework led by “progressive” educa-tors achieved considerable support among aca-demics, school officials, and parents alike.Throughout the 20th century, proponents and op-ponents have linked their views on homework tobroader political and ideological agendas, andregularly derided contrary views as unfounded oreven un-American (Gill & Schlossman, 1996).
In the clash of ideological discourse, the mostcommon focus has been on time, i.e. how muchhomework ought students at different grade lev-els to do? One side has idealized homework: themore the better. The other side has demonizedhomework and even demanded its abolition. Overthe past century, it is remarkable how narrowlyfocused on issues of time the controversies overhomework have been and continue to be today.Debate centers on how much to require of a givenproduct, rarely on rethinking homework itselfto obtain stronger student and parental buy-inor to make it more effective pedagogically (seeKohn, 1999).
Seriously neglected, too, have been thorny im-plementation problems regarding the content andscheduling of homework that must guide any con-crete effort to change practice. Mundane thoughthey may seem at first, issues of scheduling cut tothe heart of class management, administrativenorms, and principal-teacher power relations. Thisis especially true at the high school level, whereteaching is divided by subject areas and super-vised by separate academic departments.
Future reformers, we suggest, might learn froma long-forgotten strand of the discourse on home-work that occurred during the middle decades ofthe 20th century. At that time, a number of schol-ars and practitioners seriously tried to transformhomework into more interesting, challenging,and diverse educational experiences for students.Moreover, they sought to establish practicalguidelines for administering homework in orderto maximize buy-in from teachers, students, andparents (Gill & Schlossman, 2000).37 As was trueat mid-century, issues of “what?” and “how?”should become as important to future policy dis-course on homework as the narrow issue of “howmuch?”
Homework can and should serve a variety ofimportant purposes in the educational process,especially when it is thoughtfully designed andimplemented. Homework can promote academicachievement (Cooper, 1989), particularly in thecurrent era of standards-based reform and high-stakes accountability; it can inculcate habits ofself-discipline and independent study (Goldstein,1960); and, not least, it can help inform parentsabout and excite their interest in the educationalagenda of the school (Gill & Schlossman, 1995).Gaining leverage on homework, however, in-evitably requires significant reforms of educa-tional practice (Gardner, 1999; Kohn, 1999). Thelargest increases in homework time during thelast half century occurred during the post-Sputnikera, a period of pedagogical fervor when educa-tional practice changed considerably, especiallyat the high school level. These increases, ratherthan resulting from a focused effort to expandhomework per se, were incidental to major effortsto transform the content of the curriculum andmethods of instruction. Without this level of se-rious interest in promoting major and comple-mentary reforms in educational practice, mereexhortations to spend more time on homeworkwill come up against limits imposed by students,teachers, and sometimes parents as well.
Notes1 In A Nation at Risk, the National Commission on
Excellence offered the following observations and rec-ommendations regarding homework (pp. 19, 21, 29):“The amount of homework for high school seniorshas decreased (two-thirds report less than 1 hour anight) . . . time spent . . . on homework is often usedineffectively . . . schools are not doing enough to helpstudents develop either the study skills required to usetime well or the willingness to spend more time onschool work . . . Students in high schools should be as-signed far more homework than is now the case.”What Works, however, was more emphatic and nar-rowly focused in identifying homework as key to rais-ing student achievement, and in citing ostensibly con-clusive research evidence in support of its claim.According to the leading academic authority on home-work, Harris Cooper, What Works was, in the early1990s, “the most popular publication ever printed bythe U.S. government” (Cooper, 1994, p. 36). In a sec-ond edition of this study (2001, p. 52), Cooper refersto What Works as still “one of the most popular publi-cations ever printed by the U.S. government.” In botheditions, Cooper raises serious questions about howthe research evidence was used in What Works? and inother policy documents of the 1980s.
A Nation at Rest: The American Way of Homework
333
2 Notably, the state school board president, YvonneLarsen, had been the vice-chair, under David Gardner,of the National Commission on Excellence in Educa-tion that wrote A Nation at Risk in 1983.
3 Televised on 1 April 1999.4 The ISR findings have been cited in the New York
Times (Winerip, 1999), Time (Ratnesar, 1999), andThe End of Homework (Kralovec & Buell, 2000).
5 These results come from the NAEP Long-TermTrend Reading surveys. NAEP also asks about home-work on other surveys, sometimes using different ques-tions and different response categories. We believe thequestion on the Long-Term Trend Reading assessmentis the best of the NAEP homework questions, and italso has the longest history, dating back to 1978 inthe case of 17-year-olds (when it was asked on theLong-Term Trend Math survey).
6 The “less than one hour” category in Figure 1 in-cludes those students who did no homework and thosewho had none assigned. Five response categories weregiven in the survey: “No homework was assigned”; “Ihad homework but didn’t do it”; “Less than 1 hour”;“1 to 2 hours”; and “More than two hours.”
7 Although this was not dramatically more than 13-year-olds (at 8%), the difference is statistically sig-nificant ( p < .01).
8 The difference in the proportion of students whosaid they did not do assigned homework between 17-year-olds (13%) and 13-year-olds (5%) is statisti-cally significant ( p < .01), as is the difference between17-year-olds and 9-year-olds (4%) ( p < .01).
9 Twenty years ago James Coleman and col-leagues found substantial variation in average home-work load across school sectors, with Catholic, pri-vate, and high-performing public high schoolsdemanding substantially more homework than conven-tional public schools (Coleman, Hoffer, & Kilgore,1982). Such differences would surely be evident todayas well, but we have not sought to examine them here.Future scholarship should seek to examine variationswithin and between schools, including any changesover time in the distribution of homework loads.
10 This chart is derived by subtracting from 100% allof those who said they had no homework assigned.
11 A reader might wonder whether homework hadalready been increasing in the 1970s. Unfortunately,evidence from the 1970s is less consistent than thatfrom later periods and was produced using differentsurvey questions, making direct comparisons problem-atic. As we show later in the essay (see Figure 6), how-ever, the best available evidence shows no notableincrease in high-school homework in the 1970s.
12 The difference between 1980 and 1988 is sta-tistically significant at both age levels ( p < .01 for17-year-olds and p < .01 for 13-year-olds).
13 The difference between 1988 and 1999 is statisti-cally significant at both age levels ( p < .01 for 13-year-olds and p < .01 for 17-year-olds).
14 The difference between 1980 and 1999 is statisti-cally significant at both age levels ( p < .01 for 17-year-olds and p < .01 for 13-year-olds).
15 Differences at both age levels are statistically sig-nificant ( p < .01 for 17-year-old differences between1980 and 1984; p < .01 for 13-year-old differences be-tween 1980 and 1988). Note that this chart combinesresults from two response categories on the originalsurveys: one-to-two hours and over two hours. NCEStables, however, report standard errors for individualresponse categories. We did not have access to rawdata from which to calculate standard errors of com-bined categories. We therefore estimate p values usingstandard errors from both categories, which shouldproduce a conservative p value.
16 Moreover, these increases did not merely representthe continuation of a pre-existing trend. As we describein a subsequent section, homework loads were flat dur-ing the 1970s, at levels similar to those seen in 1980.
17 Note, however, that these figures represent year-round averages, including summertime, when mostchildren are not in school. They therefore probablyunderstate the average study time during a typicalschool week.
18 The difference between assignment rates in 1984and 1988 is statistically significant ( p < .01).
19 The difference between assignment rates in 1990and 1999 is statistically significant ( p < .05).
20 To be sure, the age groups in the two data sets arenot quite consistent. ISR grouped 9-year-old childrenwith those aged 10 to 12, a group which showed onlya small (nonsignificant) increase. But given the sub-stantial increase found for 6- to 8-year-old children inthe ISR study, it seems likely that 9-year-olds, mea-sured separately, would have also seen an increase.
21 Indeed, for 9-year-olds studying one hour ormore, the overall trend for the period shows a slightdecline, from 19% to 17%. This difference is statisti-cally significant ( p < .05). Again, note that this chartcombines results from two response categories on theoriginal surveys: one-to-two hours and over two hours.NCES tables, however, report standard errors for indi-vidual response categories. We did not have access toraw data from which to calculate standard errors ofcombined categories. We therefore estimate p valuesusing standard errors from both categories, whichshould produce a conservative p value.
22 At the high end of the scale—more than two hoursdaily—there are more 17-year-olds than 13-year-olds,as we showed in Figure 1. But the proportion of all stu-dents doing this much homework is quite small,amounting to only 12% at age 17 and 8% at age 13 in1999. As Figures 1 and 4 demonstrate, the majority of13- and 17-year-olds are doing less than one hour ofhomework daily, and the proportions are virtually iden-tical at age 13 (66% in 1999) and age 17 (65% in 1999).
23 The NLS survey in 1972 polled high school se-niors while the NAEP survey in 1976, like later NAEP
Gill and Schlossman
334
surveys, polled 17-year-old students—who wouldhave been largely high school juniors. Evidence fromother surveys that include students at multiple gradelevels, however, demonstrates that there are no notabledifferences in homework time between grades 10 and12. (See Blumenfeld, Franklin, & Remmers, 1962b;Leidy, Karasick, Smart, Remmers, & Starry, 1967;Remmers, Gage, & Shimberg, 1948). Moreover, theHSB survey itself found only small differences be-tween grades 10 and 12, with no clear pattern evident.
24 In all three years, response categories included “Nohomework is ever assigned” and “I have homework butdon’t do it.” In 1972 and 1976, the other three responsecategories were each equivalent to a multiple of fivetimes the daily categories used in later NAEP surveys:“Less than 5 hours a week”; “Between five and tenhours a week”; and “More than ten hours a week.” In1980, the “less than 5 hours” category was expandedinto three categories: less than 1 hour, 1 to 3 hours, and3 to 5 hours. We do not think it is safe to assume thatthe sum of responses in the three new categories wouldbe equivalent to the response received in a single cat-egory of “less than 5 hours.” The expansion of this in-termediate category in the scale seems likely to havepulled in some responses that might otherwise havebeen in the immediately adjacent categories, notablythe 5–10 hours category.
25 Notably, the immediately adjacent category—5 to10 hours weekly—was also the same in all three sur-veys. While the 5 to 10 hour category may have beenartificially deflated by the expansion of the “less than5 hours” category into three separate increments, wedo not believe the “over 10 hours” category shouldhave been substantially affected.
26 Standard errors are not reported in the documentproviding 1976 results, but even if the figures are sta-tistically different, the change they represent is sub-stantively small.
27 Differences in homework time across grade levelsin the various Purdue surveys are small and followno consistent pattern (see Blumenfeld, Franklin, &Remmers, 1962a; Blumenfeld et al., 1962b; Leidy et al., 1967; Remmers et al., 1948).
28 For the “yesterday” question, the “over 2 hours”category drew 12% in 1990, 11% in 1992, 13% in1994, 11% in 1996, and 12% in 1999. Meanwhile, thesame response to the “usually” question drew 13% in1990, 11% in 1992, 13% in 1994, 12% in 1996, and12% in 1999.
29 The directly comparable estimates of 10% to 13%come from the NAEP surveys from 1978 to 1999.While we do not have directly comparable data from1972 and 1976, the consistency of those results with1980 weekly results strongly suggests that the propor-tion of students studying over 2 hours daily wouldhave been comparable to the 1980 figure of 10%. ThePurdue reports, unfortunately, do not include standarderrors that would permit us to assess the statistical sig-
nificance of these differences. Given that the Purduestudies included a representative sample of 3,000 highschool students across the country, however, we havesome confidence in the precision of the results.
30 The question and response categories wereslightly different in 1962 and 1967. In 1962, studentswere asked, “What is the average amount of time youactually spend on homework outside of school eachday?” Response categories included “no time,” “lessthan 1 hour,” “1–2 hours,” and “more than 2 hours”(Blumenfeld et al., 1962b, p. 17a). In 1967, studentswere asked, “How long each day, on the average, doyou spend working on school assignments after schoolhours?” Response categories included “less than onehour,” “one to two hours,” “three to four hours,” “fiveto six hours,” and “more than six hours” (Leidy et al.,1967, p. 5a). Although we do not believe the slight dif-ference in question phrasing would have affected theresult, the change in response categories might havemade a difference. One possibility is that the additionof high-end categories might have inflated results in1967. Alternatively, however, the fact that the newcategories were not continuous could have deflated re-sults: A student who studied 2.4 hours per day mightchoose the “one to two hours” category rather than the“three to four hours” category, when the same personwould have responded in the “more than 2 hours” cat-egory in 1962. It is impossible to know definitivelywhether one or both of these effects existed, and if so,whether one dominated the other. We are reassured,however, by the fact that, of the 20% of students in thetop three categories, only 2% checked “five to sixhours” and 1% checked “more than six hours.”
31 Recall that the Cuban Missile Crisis took place in1962. In the Purdue Panel’s 1962 survey, the only othersustained line of questioning (in addition to homework)involved students’ opinions on fallout shelters.
32 The Panel devoted far more questions in 1962 thanin 1948 or 1952—an astonishing 24—to issues relatingto study and homework, further suggesting the central-ity of homework to the era’s academic excellencemovement. One of these questions concerned theamount of time that students spent on study at school.By distinguishing carefully between home-based andschool-based study time, the Panel, we believe, ensureda more accurate and discriminating set of responses.
33 Our interpretation is loosely reinforced by severalsurveys of parental opinion on homework that GeorgeGallup administered between 1954 and 1965 (Gallup,1972). In 1954, only 39% of American adults felt thathigh school students should be given more homework.By 1958 and 1959, this share had risen to 51%. Thathomework was becoming increasingly central to publicdiscussion of education reform is suggested by a signif-icant decline in the share of respondents who recordedno opinion: from 27% in 1954 to 12% in 1959.
As the academic excellence movement increased ininfluence nationwide and raised the homework load in
A Nation at Rest: The American Way of Homework
335
American high schools—as reflected in the 23% ofstudents recorded as doing more than two hours dailyin 1962 by the Purdue Opinion Panel—adult opinionbecame more sharply divided about how much home-work was enough. In the 1961 poll, 46% favored and44% opposed increasing the amount of homework forhigh school students, while only 10% recorded no opin-ion. Thus, fewer adults actually supported increases inhomework in 1961 than in 1959 (46% vs. 51%). Wesuggest that this small shift probably occurred notbecause Americans were turning their backs on home-work in the early 1960s—an explanation that we findimplausible, given the broader political and culturalclimate—but rather because actual homework loadshad recently risen and some adults were beginning toconclude that additional increases were undesirable orunrealistic.
This interpretation is reinforced by the survey datafrom 1965. Now, opponents of additional homeworkled supporters by a margin of 47% to 39%. Notable,too, was the breakdown that the survey provided be-tween respondents with and without children. A plu-rality of the latter group still favored assigning morehomework (41% to 40%), whereas a solid majority(54% to 37%) of the former—those who would feelthe brunt of rising homework loads more directly intheir own households—opposed further increases inthe amount of homework. Again, we suggest, this wasnot because political and cultural support for home-work were beginning to decline by 1965; recall that,according to the Purdue Opinion Panel, 20% of stu-dents were still doing substantial homework in 1967.Rather, we believe, more American adults, and espe-cially parents with children, understood that home-work expectations had already risen significantly inthe high schools, and they were beginning to doubt thewisdom of never-ending increases in homework load.
All poll figures are from Gallup (1972). For 1954,see vol. 2, p. 1282; for 1958, see vol. 2, p. 1582; for1959, see vol. 3, p. 1612; for 1961, see vol. 3, p. 1715;and for 1965, see vol. 3, p. 1945.
34 Starting in 1952, the Panel stopped surveying 9thgraders as part of the high school population, doubtlessdue to the rapid proliferation of junior high schools.But a consistent finding of the surveys was that therewas no appreciable increase in the time that studentsspent on homework as they progressed through thehigh school grades. Hence, the elimination of 9thgraders from the surveys probably did not reducetheir comparability over time to the original 1948survey of homework.
35 In this chart, all data except 1972 are for grade 11or age 17, to maintain as much comparability as pos-sible. 1972 data are for grade 12. The 1952 figure is anestimate based on the results of a question on nor-mative homework, calibrated with 1948 data, as de-scribed earlier in the text. 1972 and 1976 figures areestimates based on the results of questions on weekly
homework time, calibrated with 1980 data (using theseparate weekly and daily results from 1980 to createa crosswalk that estimates 1972 and 1976 daily figuresfrom weekly figures).
36 Compared to the 1950s, where substantial federaland foundation monies flowed into the transformationof academic curricula and the development of new“discovery-based” pedagogies (Crowse, 1981; Divine,1993; Dow, 1991; Goetz, 2002), the recent educationalreform movement has focused little attention on im-proving curriculum or pedagogy at the high schoollevel in order to increase student buy-in for traditionalacademic subjects. This reflects, in our view, the greaterpessimism that exists today regarding high school asa realistic object of systemic reform or as the educa-tional linchpin of American democracy (Angus & Mirel,1999; Labaree, 1997; Ravitch, 2001).
37 Howard Gardner and Alfie Kohn have articulateda more expansive view of homework that is consistentwith these earlier efforts (Gardner, 1999; Kohn, 1999).
References
Angus, D. L., & Mirel, J. E. (1999). The failedpromise of the American high school, 1890–1995.New York: Teachers College Press.
Blumenfeld, W. S., Franklin, R. D., & Remmers,H. H. (1962a). Teenagers’ attitudes toward studyhabits, vocational plans, religious beliefs, and luck(#67): Purdue Opinion Panel.
Blumenfeld, W. S., Franklin, R. D., & Remmers,H. H. (1962b). Youth’s attitudes toward civil de-fense, fallout shelters, and homework (#65): PurdueOpinion Panel.
Coleman, J., Hoffer, T., & Kilgore, S. (1982). Highschool achievement: Public, Catholic, and privateschools compared. New York: Basic Books.
Converse, J. M. (1984). Attitude measurement in psy-chology and sociology: The early years. In C. F.Turner & E. Martin (Eds.), Surveying subjectivephenomena (pp. 3–39). New York: Russell SageFoundation.
Converse, J. M. (1987). Survey research in the UnitedStates. Berkeley, CA: University of California Press.
Cooper, H. (1989). Synthesis of research on home-work. Educational Leadership, 47(3), 85–91.
Cooper, H. (1994). The battle over homework: An ad-ministrator’s guide to setting sound and effectivepolicies. Thousand Oaks, CA: Corwin Press, Inc.
Cooper, H. (2001). The battle over homework: An ad-ministrator’s guide to setting sound and effectivepolicies, (2nd Ed.). Thousand Oaks, CA: CorwinPress, Inc.
Cremin, L. (1961). The transformation of the school.New York: Knopf.
Crowse, B. B. (1981). Brainpower for the Cold War:The Sputnik crisis and national defense EducationAct of 1958. Westport, CT: Greenwood Press.
Gill and Schlossman
336
Davenport, D. (2002, June 13). A beastly burden: It’stime to get heavy weight off our children’s lives.Pittsburgh Post-Gazette.
Divine, R. A. (1993). The Sputnik challenge. NewYork: Oxford University Press.
Dow, P. B. (1991). Schoolhouse politics: Lessonsfrom the Sputnik era. Cambridge, MA: HarvardUniversity Press.
Eastin, D., & Larsen, Y. W. (1997). Letter promotingnew state homework policy to superintendents andprincipals of California schools.
Freedman-Doan, P., & Libsch, M. (1997, October).Student reports of time spent on homework: Resultsfrom 20 years of national samples. National Asso-ciation of Secondary School Principals Bulletin, 81,95–98.
Gallup, G. H. (1972). The Gallup poll: Public opinion,1935–1971. New York: Random House.
Gallup, G. H., & Hill, E. (1960, December 24). Is Eu-ropean education better than ours? The SaturdayEvening Post, 233, 59–76.
Gardner, H. (1999, January 25). A prescription forpeace: An educational theorist urges parents totreat homework as an opportunity, not a threat.Time, 153, 62–63.
Gill, B. P., & Schlossman, S. L. (1995, June 24).Homework is a parent’s eyes and ears. Los AngelesTimes.
Gill, B. P., & Schlossman, S. L. (1996). A sin againstchildhood: Progressive education and the crusade toabolish homework, 1897–1941. American Journalof Education, 105, 27–66.
Gill, B. P., & Schlossman, S. L. (2000). The lost causeof homework reform. American Journal of Educa-tion, 109, 27–62.
Gill, B. P., & Schlossman, S. L. (2003). Homeworkand the elusive voice of parents: Some historicalperspectives. Teachers College Record, 105(5),846–871.
Goetz, W. W. (2002). Ravitch and reform: Should LeftBack be left back? Teachers College Record,104(6), 1204–1228.
Goldstein, A. (1960). Does homework help? A reviewof research. Elementary School Journal, 60,212–224.
Graham, P. A. (1967). Progressive education: FromArcady to academe. New York: Teachers CollegePress.
Gutek, G. L. (2000). American education, 1945–2000:A history and commentary. Prospect Heights, IL:Waveland Press, Inc.
Hellmich, N. (2000, October 10). Assigning home-work blame. USA Today.
Hodgson, G. (1976). America in our time. New York:Random House.
Hofferth, S. L., & Sandberg, J. F. (2000). Changes inAmerican children’s time, 1981–1997 (00-456).
Ann Arbor, MI: University of Michigan PopulationStudies Center.
Honig, B. (1985). Last chance for our children: Howyou can help save our schools. Reading, MA: Addison-Wesley Publishing Company, Inc.
Hui, T. K. (2000, December 4). Too much of a goodthing. The Raleigh News and Observer.
Johnston, L. D., Bachman, J. G., & O’Malley, P. M.(2001). Monitoring the future: questionnaire re-sponses from the nation’s high school seniors,1999. Ann Arbor, MI: Institute for Social Research.
Juster, F. T., & Stafford, F. P. (1985). Time, goods, andwell-being. Ann Arbor: University of Michigan.
Juster, F. T., & Stafford, F. P. (1991). The allocationof time: Empirical findings, behavioral models, andproblems of measurement. Journal of EconomicLiterature, 29, 471–522.
Kaiser, C. (1988). 1968 in America: Music, politics,chaos, counterculture, and the shaping of a gener-ation. New York: Weidenfeld & Nicolson.
Keith, T. (1986). Homework. West Lafayette, IN:Kappa Delta Pi.
Kohn, A. (1999). The schools our children deserve:Moving beyond traditional classrooms and “tougherstandards.” Boston, MA: Houghton Mifflin Co.
Kralovec, E., & Buell, J. (2000). The end of homework:How homework disrupts families, overburdens chil-dren, and limits learning. Boston, MA: Beacon Press.
Labaree, D. (1997). How to succeed in school withoutreally learning: The credentials race in Americaneducation. New Haven, CT: Yale University Press.
Larson, R. W., & Verma, S. (1999). How children andadolescents spend time across the world: Work,play, and developmental opportunities. Psycholog-ical Bulletin, 125(6), 701–736.
Leidy, T. R., Karasick, B., Smart, B., Remmers, H. H.,& Starry, A. R. (1967). High school students’leisure time activities and attitudes toward networktelevision (#79): Purdue Opinion Panel.
Lora, R. (1982). Education: Schools as crucible inCold War America. In R. H. Bremner & G. W. Reichard (Eds.), Reshaping America: Society andinstitutions, 1945–1960 (pp. 223–260). Columbus,OH: Ohio State University Press.
Maeroff, G. (1992). Reform comes home: Policies toencourage parental involvement in children’s edu-cation. In C. Finn Jr. & T. Rebarber (Eds.), Educa-tion reform in the ‘90s (pp. 157–171). New York:Macmillan Publishing Co.
Maeroff, G. I. (1989). The school-smart parent. NewYork: Times Books.
Matusow, A. J. (1984). The unraveling of America: Ahistory of liberalism in the 1960s. New York: Harper& Row.
A Nation at Rest: The American Way of Homework
337
National Commission on Excellence in Education.(1983). A nation at risk: The imperative for educa-tional reform. Washington, DC: NCEE, Author.
O’Neill, W. L. (1971). Coming apart: An informalhistory of America in the 1960s. New York: TimesBooks.
Ratnesar, R. (1999, January 25). The homework atemy family. Time, 153, 54–63.
Ravitch, D. (1983). The troubled crusade: Americaneducation, 1945–1980. New York: Basic Books.
Ravitch, D. (2001). Left back: A century of failedschool reforms. New York: Simon and Schuster.
Remmers, H. H., Gage, N. L. (1955). Educationalmeasurement and evaluation (revised ed.). NewYork: Harper & Brothers.
Remmers, H. H., Gage, N. L., & Shimberg, B. (1948).Youth looks at schools and jobs (#18): PurdueOpinion Panel.
Remmers, H. H., Horton, R. E., & Scarborough, B. B.(1952). Youth views purposes, practices, and pro-cedures in education (#31): Purdue Opinion Panel.
Sax, L. J., Lindholm, J. A., Astin, A. W., Korn, W. S.,& Mahoney, K. M. (2002). The American fresh-man: National norms for fall 2002. Los Angeles,CA: UCLA Higher Education Research Institute.
The Economist. (1995, May 6). Homework, sweethomework, 15–16.
U.S. Department of Education. (1986). What works:Research about teaching and learning. Washing-ton, DC.: Author.
Winerip, M. (1999, January 3). Homework bound.New York Times.
Zill, N., Nord, C. W., & Loomis, L. S. (1995). Ado-lescent time use, risky behavior and outcomes: Ananalysis of national data. Washington, DC: U.S.Department of Health and Human Services.
Authors
BRIAN P. GILL is a Social Scientist with RAND,201 North Craig Street, Suite 202, Pittsburgh, PA15213; [email protected]. His areas of specialization arecharter schools, vouchers, and privatization; district-wide instructional improvement efforts; and homework.
STEVEN L. SCHLOSSMAN is Professor, Depart-ment of History, Carnegie Mellon University, BakerHall 240, Pittsburgh, PA 15213-3890; [email protected]. His areas of specialization are history ofeducation, juvenile justice, childhood and the family,and history of military personnel policy.
Manuscript Received January 5, 2001Revision Received June 3, 2003
Accepted June 20, 2003