Embed Size (px)
Citation preview
U.S. Department of eDUcation
Twenty-five Years After A Nation at Risk
A Nation
Accountable
A Nation AccountableTwenty-five Years After a nation at risk
U.S. Department of education
U.S. Department of EducationMargaret SpellingsSecretary
April 2008
This publication is in the public domain. Authorization to reproduce it in whole or in part is granted. While permission to reprint this publication is not necessary, the citation should be: U.S. Department of Education, A Nation Accountable: Twenty-five Years After A Nation at Risk, Washington, D.C., 2008.
This report is available on the Department’s Web site at http://www.ed.gov/rschstat/research/pubs/accountable/
On request, this publication is available in alternate formats, such as Braille, large print or computer diskette. For more information, contact the Department’s Alternate Format Center at 202-260-0852 or at 202-260-0818.
contents
List of Figures . . . . . . . . . . . . . . . . . . . . . . . . . . . . . . . . . . . . . . . . . . . . . . . . . . . . . . . . . . . . . . . . . . . iv
Executive Summary . . . . . . . . . . . . . . . . . . . . . . . . . . . . . . . . . . . . . . . . . . . . . . . . . . . . . . . . . . . . . . . 1
Introduction . . . . . . . . . . . . . . . . . . . . . . . . . . . . . . . . . . . . . . . . . . . . . . . . . . . . . . . . . . . . . . . . . . . . . 2
I. How Far We’ve Come . . . . . . . . . . . . . . . . . . . . . . . . . . . . . . . . . . . . . . . . . . . . . . . . . . . . . . . . . . . 3
Curriculum Content . . . . . . . . . . . . . . . . . . . . . . . . . . . . . . . . . . . . . . . . . . . . . . . . . . . . . . . . . . . . . 3
Standards and Expectations . . . . . . . . . . . . . . . . . . . . . . . . . . . . . . . . . . . . . . . . . . . . . . . . . . . . . . . 5
Time . . . . . . . . . . . . . . . . . . . . . . . . . . . . . . . . . . . . . . . . . . . . . . . . . . . . . . . . . . . . . . . . . . . . . . . . . 6
Teacher Quality . . . . . . . . . . . . . . . . . . . . . . . . . . . . . . . . . . . . . . . . . . . . . . . . . . . . . . . . . . . . . . . . . 6
Leadership and Financial Support . . . . . . . . . . . . . . . . . . . . . . . . . . . . . . . . . . . . . . . . . . . . . . . . . . 7
II. What Has Been the Result of These Efforts and, More Importantly, Are We Still at Risk?. . . . . . . . . . . . . . . . . . . . . . . . . . . . . . . . . . . . . . . . . . . . . . . . . . . . . . . . . . . . 8
III. Remaining Challenges . . . . . . . . . . . . . . . . . . . . . . . . . . . . . . . . . . . . . . . . . . . . . . . . . . . . . . . . . . 10
IV. Looking Ahead . . . . . . . . . . . . . . . . . . . . . . . . . . . . . . . . . . . . . . . . . . . . . . . . . . . . . . . . . . . . . . . . 14
Endnotes. . . . . . . . . . . . . . . . . . . . . . . . . . . . . . . . . . . . . . . . . . . . . . . . . . . . . . . . . . . . . . . . . . . . . . . . 16
iii
figures
1. The Attainment Crisis . . . . . . . . . . . . . . . . . . . . . . . . . . . . . . . . . . . . . . . . . . . . . . . . . . . . . . . . . . . . 2
2. NAEP Reading and Math Scores of 17-year-olds vs. Percentage Taking College Prep Course-load: 1978–2004. . . . . . . . . . . . . . . . . . . . . . . . . . . . . . . . . . . . . . . . . . . . . . . . . . . . . . . . . . 4
3. NAEP Reading Scores of 9–17-year-olds vs. Education Expenditures per Student: 1984–2004 . . 8
4. Proficiency Improvement . . . . . . . . . . . . . . . . . . . . . . . . . . . . . . . . . . . . . . . . . . . . . . . . . . . . . . . . . 9
5a. Per-pupil Spending on Elementary Education in Purchase-adjusted Dollars, by Various Countries: 2004 . . . . . . . . . . . . . . . . . . . . . . . . . . . . . . . . . . . . . . . . . . . . . . . . . . . . . . . . . . . . . . . . . 10
5b. Math Literacy Scores, PISA, by Various Countries: 2006 . . . . . . . . . . . . . . . . . . . . . . . . . . . . . . . . 10
5c. Science Literacy Scores, PISA, by Various Countries: 2006 . . . . . . . . . . . . . . . . . . . . . . . . . . . . . . 10
6. Although the overall graduation rate for the class of 2000 was nearly 70 percent, for most minority students the likelihood of getting a high school diploma is about 50-50. . . . . . . . . . . . . . 11
7. 2007 median annual income for college graduates was more than double that of high school dropouts. . . . . . . . . . . . . . . . . . . . . . . . . . . . . . . . . . . . . . . . . . . . . . . . . . . . . . . . . . . . . . . . . 12
8. In 2006, high schools with promotion rates below 60 percent made up only 12 percent of the total, yet they contributed over half of the number of non-promoted students. . . . . . . . . . . . 13
iv
�
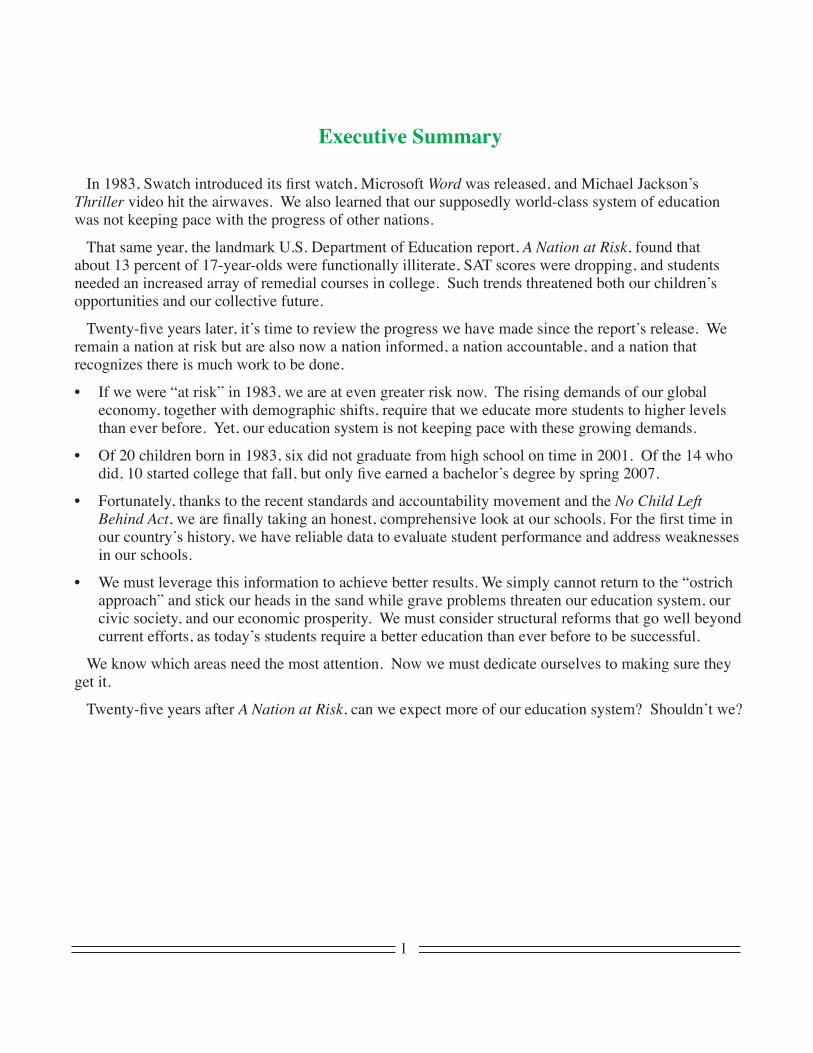
Executive Summary
In 1983, Swatch introduced its first watch, Microsoft Word was released, and Michael Jackson’s Thriller video hit the airwaves. We also learned that our supposedly world-class system of education was not keeping pace with the progress of other nations.
That same year, the landmark U.S. Department of Education report, A Nation at Risk, found that about 13 percent of 17-year-olds were functionally illiterate, SAT scores were dropping, and students needed an increased array of remedial courses in college. Such trends threatened both our children’s opportunities and our collective future.
Twenty-five years later, it’s time to review the progress we have made since the report’s release. We remain a nation at risk but are also now a nation informed, a nation accountable, and a nation that recognizes there is much work to be done.
• If we were “at risk” in 1983, we are at even greater risk now. The rising demands of our global economy, together with demographic shifts, require that we educate more students to higher levels than ever before. Yet, our education system is not keeping pace with these growing demands.
• Of 20 children born in 1983, six did not graduate from high school on time in 2001. Of the 14 who did, 10 started college that fall, but only five earned a bachelor’s degree by spring 2007.
• Fortunately, thanks to the recent standards and accountability movement and the No Child Left Behind Act, we are finally taking an honest, comprehensive look at our schools. For the first time in our country’s history, we have reliable data to evaluate student performance and address weaknesses in our schools.
• We must leverage this information to achieve better results. We simply cannot return to the “ostrich approach” and stick our heads in the sand while grave problems threaten our education system, our civic society, and our economic prosperity. We must consider structural reforms that go well beyond current efforts, as today’s students require a better education than ever before to be successful.
We know which areas need the most attention. Now we must dedicate ourselves to making sure they get it.
Twenty-five years after A Nation at Risk, can we expect more of our education system? Shouldn’t we?
2
IntroductionIn the spring of 1983, the National Commission on Excellence in Education issued A Nation at
Risk—its eye-opening report that indicted education officials, school leaders, and the American public for complacency.� The university presidents, eminent scientists, policymakers, and educators who made up the Commission refused to paint a happy face on the eroding quality of American education. They said that we had become self-satisfied about our leading position in the world and “lost sight of the basic purposes of schooling, and of the high expectations and disciplined effort needed to attain them.”
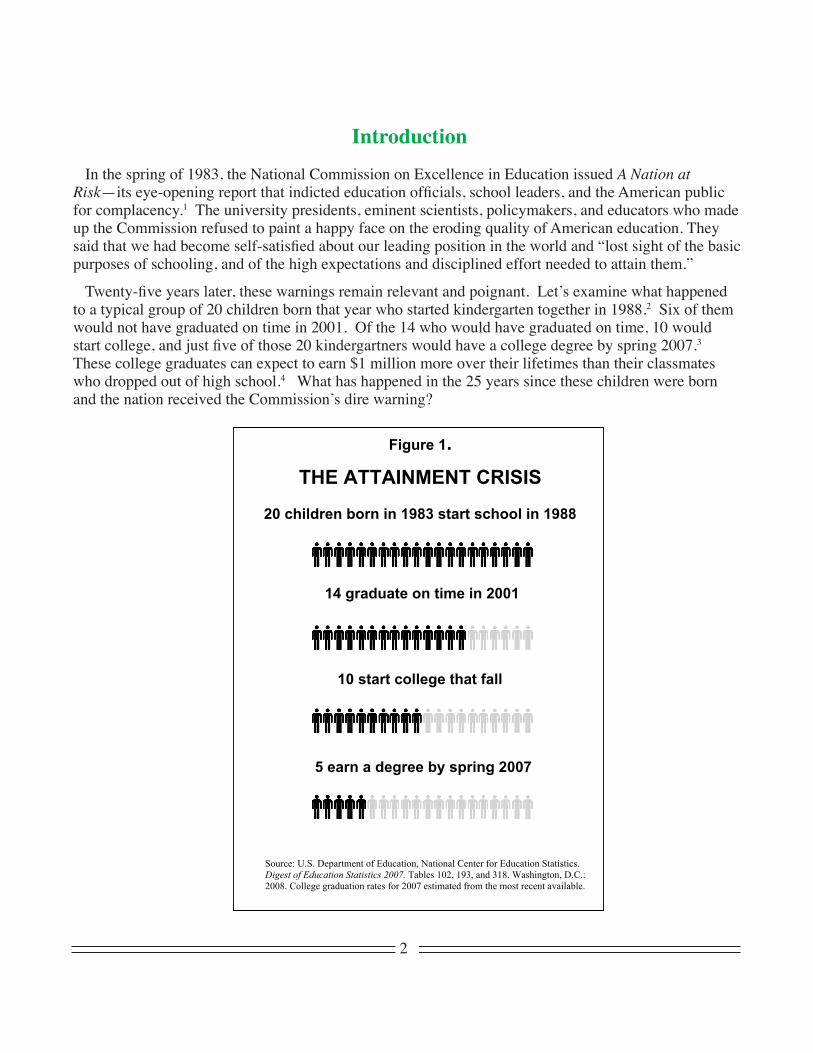
Twenty-five years later, these warnings remain relevant and poignant. Let’s examine what happened to a typical group of 20 children born that year who started kindergarten together in 1988.2 Six of them would not have graduated on time in 2001. Of the 14 who would have graduated on time, 10 would start college, and just five of those 20 kindergartners would have a college degree by spring 2007.3 These college graduates can expect to earn $1 million more over their lifetimes than their classmates who dropped out of high school.4 What has happened in the 25 years since these children were born and the nation received the Commission’s dire warning?
Figure 1.
THE ATTAINMENT CRISIS
20 children born in 1983 start school in 1988
14 graduate on time in 2001
10 start college that fall
5 earn a degree by spring 2007
Source: U.S. Department of Education, National Center for Education Statistics.
Digest of Education Statistics 2007. Tables 102, 193, and 318. Washington, D.C.:
2008. College graduation rates for 2007 estimated from the most recent available.
3
Many people—elected officials, administrators, teachers, parents, and students— have been hard at work since this report was released to make sure that we aren’t caught off guard again. States devel-oped content standards and tests that allow us to know how well our students are doing. State and local academic standards and standards-based testing began in the 1980s and 1990s, and federal legislation required that states receiving federal aid for education have such academic standards and tests in certain grades. The No Child Left Behind Act of 2001 expanded the grades to be tested and strengthened the accountability attached to test results. While we are still a nation at risk, we are also now a nation in-formed, a nation accountable, and a nation that recognizes there is much work to be done.
Unforeseen events, demographic changes, and shifts in the global landscape have made our job more daunting than ever, but we have made progress since 1983. However, the looming question is: Will the children being born today have a better shot at getting a decent education than those children born in 1983? Only if we continue to push forward with a sense of urgency. While many have been working to ensure that all students fulfill their academic potential, we are like mountain climbers who discover that the mountain is more challenging than we realized.
I. How Far We’ve ComeA Nation at Risk highlighted a variety of challenges: mediocre to poor performance on international
tests, an illiteracy rate of 13 percent among 17-year-olds, falling student achievement on standardized tests, and a sharp increase in the need for remedial education in colleges. Additionally, businesses and the military expressed concern about the need to offer remedial training.
To address these and other sobering findings, the Commission outlined recommendations for change in five areas: curriculum content, standards and expectations of students, time devoted to education, teacher quality, and educational leadership and the financial support of education. The following is a summary of our progress in those areas. Some recommendations were acted on quickly, some over time, and some have yet to be put into effect.
Curriculum ContentOne of the most important pieces of the educational quality puzzle is the course work and subject-mat-
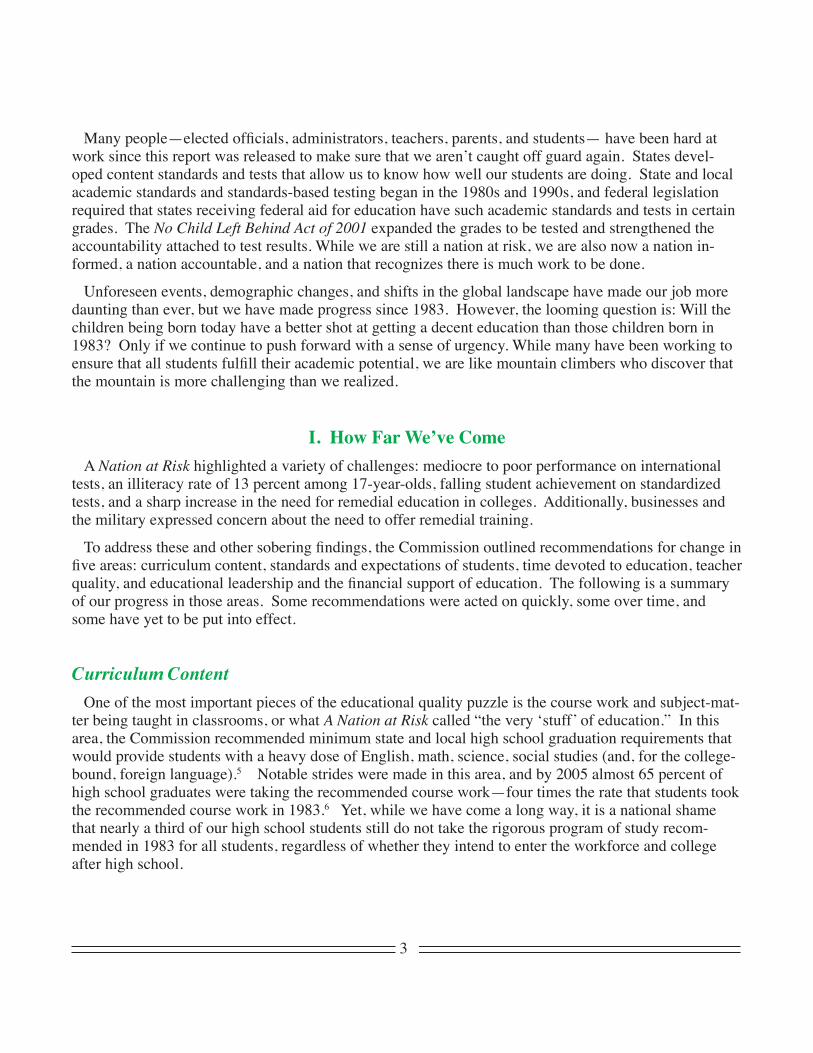
ter being taught in classrooms, or what A Nation at Risk called “the very ‘stuff’ of education.” In this area, the Commission recommended minimum state and local high school graduation requirements that would provide students with a heavy dose of English, math, science, social studies (and, for the college-bound, foreign language).5 Notable strides were made in this area, and by 2005 almost 65 percent of high school graduates were taking the recommended course work—four times the rate that students took the recommended course work in 1983.6 Yet, while we have come a long way, it is a national shame that nearly a third of our high school students still do not take the rigorous program of study recom-mended in 1983 for all students, regardless of whether they intend to enter the workforce and college after high school.
4
Figure 2.
NAEP Reading and Math Scores of 17-year-olds vs.
Percentage Taking College Prep Course-load: 1978-2004.
250
260
270
280
290
300
310
320
330
340
350
1978 1980 1982 1984 1986 1988 1990 1992 1994 1996 1998 2000 2002 2004
NA
EP
Ac
hie
ve
me
nt
0
10
20
30
40
50
60
Pe
rce
nta
ge
of
Co
lle
ge
Pre
p C
ou
rse
-lo
ad
Ta
ke
rs
College Prep Course-load Takers
Long-term 17-year-olds NAEP Reading Scores
Long-term 17-year-olds NAEP Math Scores
Source: U.S. Department of Education, National Center for Education Statistics. The Nation’s Report Card: Long-Term Trend , and Digest of Education Statistics 2007 . Table 144. Washington, D.C.: 2008.
The Commission was disturbed by the easy courses and “curricular smorgasbord” available to high school students. Unfortunately, this has not changed greatly. Both easy courses and this smorgasbord still remain, with diluted content now hiding behind inflated course names.7 The educational achieve-ment of 17-year-old students has largely stagnated since then. As measured by the Nation’s Report Card (or National Assessment of Educational Progress), the reading scores of 20 students born in 1983, who turned 17 in 2000, would have been the same as those of a similar group of students who turned 17 in 1984. 8
The standards and accountability movement and the No Child Left Behind Act have brought further insight into the weaknesses of our high schools. Although its provisions are weighted toward the el-ementary and middle school grades, No Child Left Behind has resulted in schools and districts gathering achievement and graduation data that highlight how much work needs to be done at the secondary level. A Nation at Risk anticipated that our secondary schooling deficiencies could eventually threaten the quality of the entire K–12 system, and this legislation has generated data that, unfortunately, confirm this threat.
5
Standards and ExpectationsIn 1983, the Commission recommended “that schools, colleges, and universities adopt more rigorous
and measurable standards, and higher expectations, for academic performance … and that 4-year col-leges and universities raise their requirements for admission.” The Commission described this as the path to “authentic accomplishment.”
As a result, many states began to implement standards-based education systems. Early adopters of this approach in the late 1980s and early 1990s often produced content standards that were not very clear or specific, or academically rigorous. But as states learned from these experiences, content standards began to take the shape that we see today—clearer, grade-level specific, and more academically challenging. States next worked to create tests and adopt textbooks aligned with those content standards, but teaching materials that are demonstrably effective are still rare. Some states have also tried, with mixed results, to focus their teacher training to coordinate with their standards and assessments. We know the direction needed and are progressing that way.
This important work at the state level was complemented by efforts at the federal level. In 1989, Presi-dent George H.W. Bush convened a meeting of the nation’s governors in Charlottesville, Va. There they agreed to adopt national K–12 performance goals for the year 2000. During Bill Clinton’s presidency, Congress passed the Improving America’s Schools Act of 1994, which required state academic-content standards and tests, and the Goals 2000: Educate America Act (1994), which provided federal funds to aid states in writing those content standards.9
With the new millennium, the standards and accountability movement reached a new level. President George W. Bush called for significant reforms at the federal level, which led to the enactment of the No Child Left Behind Act of 2001.10 This important law, which was passed with bipartisan majorities in Congress and with the support of the business and civil rights communities, built on the foundation laid in the 1980s and 1990s by ensuring that states accepting the federal government’s targeted investment agree to measure and report on results in terms of standards and accountability. Today, all 50 states have reading and math content standards and tests at a minimum in grades 3–8 and once in high school. (By the end of school year 2007-08, states must also have in place science tests to be administered at least once during grades 3–5, grades 6–9, and grades 10–12.) The school-level results of these annual tests (broken down to include results for minority students, English language learners, students with disabili-ties, and other subgroups) are now available on the Internet for anyone to see. Publication of these test results means that parents, taxpayers, educators, and policymakers have more information at their finger-tips than ever before, which has made possible a more informed national dialogue on education. This is a giant step forward from 1983, when the public knew comparatively little about student performance. Policymakers and other stakeholders must now make better use of this information as we continue to trek up the mountain.

6
TimeIn 1983, the Commission was concerned that American children spent less time in school than children
in other countries, such as England. It recommended that “significantly more time be devoted to learn-ing … [which would] require more effective use of the existing school day, a longer school day, or a lengthened school year.” However, our children do not spend more days in school than they did in 1983, save for those in some charter schools or in a few state or local pilot programs.�� The time dedicated to academics during the school day in the United States has risen slightly since 1983. Nonetheless we are spending fewer hours per week on academic subjects and have a shorter school year than many other industrialized countries.12 We know that the amount of time on task is important, yet as important is how effectively that time is spent.�3
Teacher QualityA Nation at Risk said that many teachers did not have the knowledge, skills, and training they needed.
The Commission called for strengthening teacher preparation both in content and effective teaching practices, but what followed was an even greater focus on classroom-teaching philosophy rather than on the more needed subject-matter knowledge. Some in Congress sought to address this weakness through the enactment of the No Child Left Behind Act’s Highly Qualified Teacher provision. Yet this provision focused on resource inputs rather than learning outcomes. While most teachers have taken the steps necessary to meet their states’ Highly Qualified Teacher definition, there is little evidence to conclude that this provision has led to notable increases in the requisite subject-matter knowledge of teachers or to increases in measures of individual teacher effectiveness.14
A Nation at Risk raised another issue pertaining to teachers: the best way to compensate them. The Commission said, “Salaries for the teaching profession should be increased and should be professionally competitive, market-sensitive, and performance-based.” It added, “Salary, promotion, tenure, and reten-tion decisions should be tied to an effective evaluation system that includes peer review so that superior teachers can be rewarded, average ones encouraged, and poor ones either improved or terminated.”
A number of social scientists have noted that the resistance of interest groups blocked the enactment of some of the Commission’s most promising reforms. One wrote:
“Progress has … been made on recommendations that required real change, if they were supported by powerful political interest groups in education, especially teachers’ unions. … Virtually no prog-ress has been made on recommendations that required real change if they were opposed by these same interest groups. For example, merit pay for teachers remains negligible, and the school year has not lengthened.” 15
Yet, recently, several school districts, such as those in Denver and New York, have been moving to-ward performance pay. To encourage more such efforts, the George W. Bush administration proposed the Teacher Incentive Fund. Launched in 2006, this federal grant program supports states, school districts, and nonprofit organizations in their innovative efforts to adopt pay-for-performance.16

7
It was almost 20 years after A Nation at Risk that organizations such as the American Board for Certi-fication of Teacher Excellence (ABCTE) and the National Council on Teacher Quality (NCTQ) were set up to promote alternative paths to teacher certification. Other organizations and programs such as Teach For America (TFA), The New Teacher Project (TNTP), and Troops-to-Teachers, were launched in the 1990s to encourage high-achieving professionals who would not typically consider a teaching career to devote several years of their lives to K–12 teaching.
Leadership and Financial SupportFinally, the Commission was concerned that we were not developing the leadership necessary to run a
world-class school system. While management and supervisory skills are needed, the Commission said that principals and superintendents also must have the skills of persuasion, goal-setting, and developing community consensus. In addition, the Commission stressed the importance of providing the resources such a system would require. As they noted, “Excellence costs. But in the long run mediocrity costs far more.”
Since A Nation at Risk and the ensuing standards and accountability movement, school principals and superintendents have taken on the role of instructional leaders as well as managers. They are now being recruited in more rigorous ways. For instance, universities have recently begun to recruit candidates more carefully for their education administration programs, seeking to find those who will be success-ful leaders. Innovative organizations such as the promising New Leaders for New Schools have created alternative pathways that are highly selective in their recruitment and that require long and intensive training. 17
Calls for additional resources for education have been present as long as public education itself, and legislative bodies from those in Washington, D.C., to state legislatures to school boards have responded. In 1983, total spending on public education in the U.S. was $118.4 billion.�8 If we had since increased spending by only the rate of inflation, we would have spent $246 billion in 2005. Instead, in 2005, the U.S. spent $499 billion on K–12 education, or roughly double the amount spent in 1983, after adjust-ing for inflation. This increase is not just a consequence of increased K–12 enrollment. Per-student spending grew from $5,691 in 1983 to almost $9,266 in 2005, after adjusting for inflation.�9 This large increase in resources has not gone hand-in-hand with improvements in student performance. While resources will always remain an issue of debate in education, we must find more effective and efficient ways to use funding.
Our country responded to A Nation at Risk with far-reaching educational reforms. Total spending and per-pupil spending—local, state, and federal—have gone up dramatically. School districts and states have begun to make changes in their approaches to the teaching and education leadership professions. Finally, state officials and legislators have begun setting forth content standards, creating annual tests for students, and reporting results. This effort to achieve equity and excellence through standards and accountability reached a new level with the enactment of the No Child Left Behind Act in 2002.

8
II. What Has Been the Result of These Efforts and, More Importantly, Are We Still at Risk?
In 1983, we faced a grave risk of losing our leading position in the world, the Commission warned. We had little idea of how we were doing, and we were happily complacent in assuming that we had, and would continue to have, the best schools money could buy. The report challenged this illusion and forced us to recognize the profound deficiencies in our educational system. In the last two decades, poli-cymakers have worked to develop measurement systems that obviate the need for another such surpris-ing report and that keep the country aware of the challenges we face.
As a result of No Child Left Behind, we now have annual test score data on students in reading and math from the third grade through the eighth grade and once in high school. We are able to see how well each of the approximately 96,000 public schools in our country is performing, not just overall but also for each group of students a school serves, such as minority students, students with disabilities, and English lan-guage learners.20 We have transformed ourselves from a nation at risk of complacency to a nation that is accountable and at work on its education weaknesses. We now know the daunting scope of the problem—and must enlist everyone to address weaknesses if we are to make progress up the mountain.
$5,896
$6,920
$7,464 $7,419 $7,437$7,517
$8,074
$9,116
100
150
200
250
300
350
400
450
500
1984 1988 1990 1992 1994 1996 1999 2004
Lo
ng
-te
rm N
AE
PA
ch
iev
em
en
t
Per-student spending
Long-term NAEP Reading: 9-year-olds
Long-term NAEP Reading: 13-year-olds
Long-term NAEP Reading: 17-year-olds
Figure 3.
NAEP Reading Scores of 9-17-year-olds vs. Education
Expenditures per Student: 1984-2004.
Source: U.S. Department of Education, National Center for Education Statistics. Digest of Education Statistics 2007 . Table 171. Washington, D.C.: 2008.

9
Of the 20 children born in 1983, only six would have been proficient readers in fourth grade and only four would have been proficient in math. A new class of 20 kids born in 1997, and tested in 2007, would have seven proficient readers in fourth grade and eight students who are proficient in math.21 So, while we are gaining ground in math, two-thirds of our fourth-graders are still not proficient readers.
Figure 4.
PROFICIENCY IMPROVEMENT
And only 4 were proficient in math.
Among 4th-graders born in 1997, 7 outof 20 students are proficient in
reading.
And 8 are proficient in math.
Among 4th-graders born in 1983, only 6out of 20 students were proficient in
reading.
Note: For the purposes of this graph it is assumed that the children will be in 4th grade when they are 9-years-old. The achievement data are based on
9-year-olds, and it should be noted that a few of them could be in other grades.
Source: U.S. Department of Education, Institute of Education Sciences, National Center for Education Statistics. National Assessment of Educational
Progress (NAEP), 1971-2004 Long-Term Trend Reading and Mathematics Assessments. Extracted April 2008.
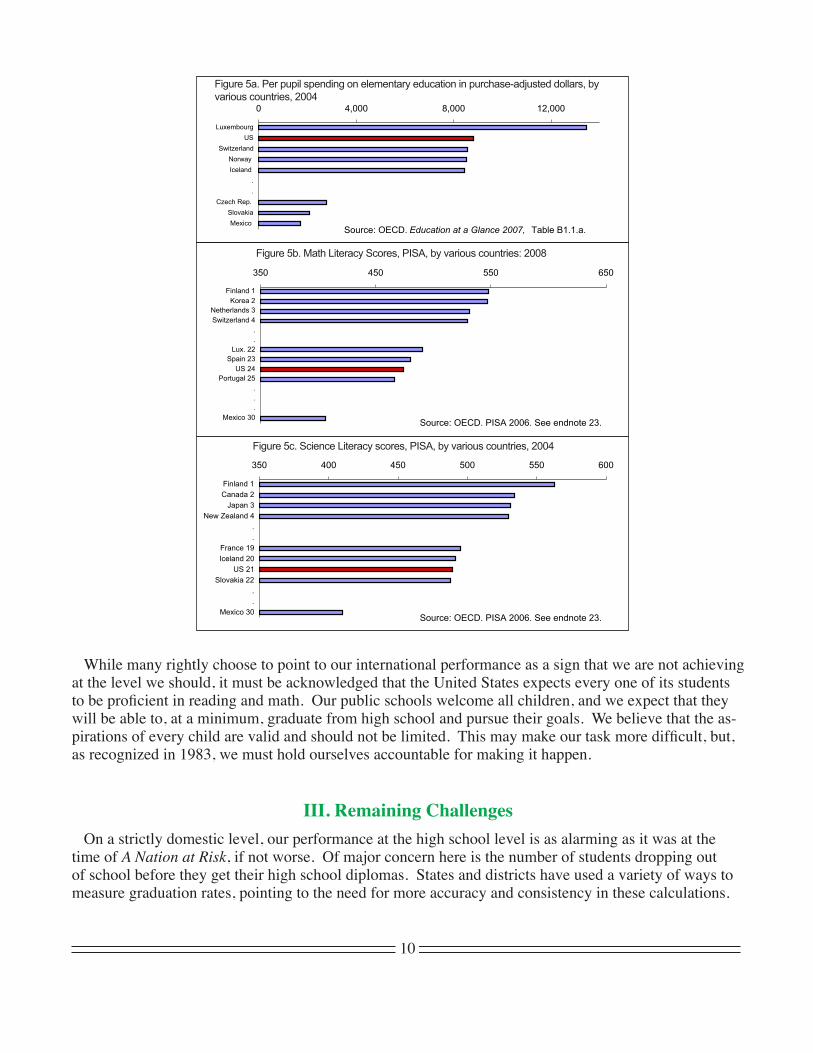
These results are generally consistent with our performance on international tests —a risk that was of particular concern to the Commission in 1983. American education outcomes on international compari-sons have not improved significantly since the 1970s. International tests show that the United States is, at best, running in place, while other nations are passing us by. Many countries now match or exceed us, not only in the number of years their children attend school but also in how much those children learn. The United States was once the world leader in high school completion, but among our 25–34 year olds, it has now slipped to 10th place, falling behind such countries as Canada, Switzerland, and South Korea.22 It may fall farther behind yet. The same is true for achievement. On most international tests, the United States is standing still while others are gaining ground.23 With performance like this, it’s no wonder that most foreign children studying in the United States find our schools easier than the ones they left back home—despite the fact that Americans spend more money per student than almost any other country in the world.24
10
While many rightly choose to point to our international performance as a sign that we are not achieving at the level we should, it must be acknowledged that the United States expects every one of its students to be proficient in reading and math. Our public schools welcome all children, and we expect that they will be able to, at a minimum, graduate from high school and pursue their goals. We believe that the as-pirations of every child are valid and should not be limited. This may make our task more difficult, but, as recognized in 1983, we must hold ourselves accountable for making it happen.
III. Remaining ChallengesOn a strictly domestic level, our performance at the high school level is as alarming as it was at the
time of A Nation at Risk, if not worse. Of major concern here is the number of students dropping out of school before they get their high school diplomas. States and districts have used a variety of ways to measure graduation rates, pointing to the need for more accuracy and consistency in these calculations.
350 450 550 650
Mexico 30
.
.
.
Portugal 25
US 24
Spain 23
Lux. 22
.
.
Switzerland 4
Netherlands 3
Korea 2
Finland 1
350 400 450 500 550 600
Mexico 30
.
.
Slovakia 22
US 21
Iceland 20
France 19
.
.
New Zealand 4
Japan 3
Canada 2
Finland 1
0 4,000 8,000 12,000
Mexico
Slovakia
Czech Rep.
.
.
Iceland
Norway
Switzerland
US
Luxembourg
Source: OECD. Education at a Glance 2007, Table B1.1.a.
Source: OECD. PISA 2006. See endnote 23.
Source: OECD. PISA 2006. See endnote 23.
Figure 5a. Per pupil spending on elementary education in purchase-adjusted dollars, by various countries, 2004
Figure 5b. Math Literacy Scores, PISA, by various countries: 2008
Figure 5c. Science Literacy scores, PISA, by various countries, 2004
��
Some of these methods are misleading, and result in numbers near 90 percent.25 However, a more ac-curate measure is the percentage of students who graduate after starting ninth grade four years earlier—which is only 70 percent for the class of 2006.26
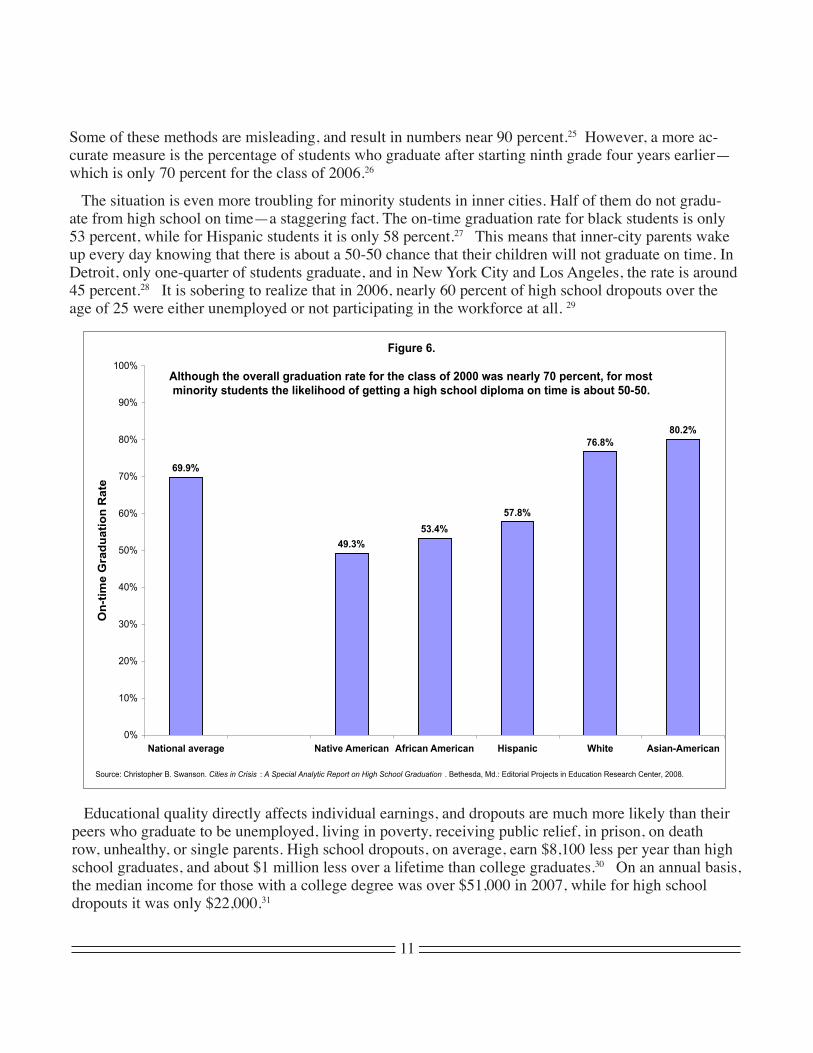
The situation is even more troubling for minority students in inner cities. Half of them do not gradu-ate from high school on time—a staggering fact. The on-time graduation rate for black students is only 53 percent, while for Hispanic students it is only 58 percent.27 This means that inner-city parents wake up every day knowing that there is about a 50-50 chance that their children will not graduate on time. In Detroit, only one-quarter of students graduate, and in New York City and Los Angeles, the rate is around 45 percent.28 It is sobering to realize that in 2006, nearly 60 percent of high school dropouts over the age of 25 were either unemployed or not participating in the workforce at all. 29
Educational quality directly affects individual earnings, and dropouts are much more likely than their peers who graduate to be unemployed, living in poverty, receiving public relief, in prison, on death row, unhealthy, or single parents. High school dropouts, on average, earn $8,100 less per year than high school graduates, and about $1 million less over a lifetime than college graduates.30 On an annual basis, the median income for those with a college degree was over $51,000 in 2007, while for high school dropouts it was only $22,000.3�
Figure 6.
Although the overall graduation rate for the class of 2000 was nearly 70 percent, for most
minority students the likelihood of getting a high school diploma on time is about 50-50.
69.9%
49.3%
53.4%
57.8%
76.8%
80.2%
0%
10%
20%
30%
40%
50%
60%
70%
80%
90%
100%
National average Native American African American Hispanic White Asian-American
On
-tim
e G
rad
uati
on
Rate
Source: Christopher B. Swanson. Cities in Crisis : A Special Analytic Report on High School Graduation . Bethesda, Md.: Editorial Projects in Education Research Center, 2008.

12
But the tragedy is not a burden of the individual alone. High dropout rates also affect our communities and the nation because of the loss of productive workers and the higher costs associated with increased incarceration, health care and social services.32 A recent report noted, “Four out of every 10 young adults (ages 16–24) lacking a high school diploma received some [sort of public relief] in 2001.”33 This report also noted, “… a dropout is more than eight times as likely to be in jail or prison as a person with at least a high school diploma.”34
Much of the dropout crisis is concentrated, however. About 1,700 of America’s 14,500 traditional high schools with enrollment over 100 students are responsible for approximately half of the students who leave school before 12th grade. In these schools—often called dropout factories—less than 60 per-cent of ninth-graders are enrolled as 12th-graders four years later, while in the other roughly 12,000 high schools, nearly 90 percent of those who started are still enrolled by their senior year. Out of a freshman classroom of 20 students in one of these dropout factories, only 12 will be around to become seniors, versus 18 in the rest of the schools. Distressingly, these dropout factories have much higher percentages of low-income and minority students.35
$22,256
$31,408
$51,324
Less than HS diploma HS diploma College Degree
Figure 7.
2007 median annual income for college graduates was more
than double that of high school dropouts.
Source: U.S. Department of Labor, Bureau of Labor Statistics. Weekly and hourly wage data from the 2007 Current Population Survey at http://data.bls.gov. Extracted April 2008.

�3
Adding to the gravity of the dropout crisis facing our minority students is the fact that Hispanic stu-dents are the fastest-growing segment of our student population. In the mid-1980s, less than 10 percent of public school students were Hispanic; by 2005, this figure had doubled to 20 percent of enrollment.36 Within the next decade many states will see a new majority composed of students from some of the very groups that we have historically failed to educate adequately.37 A related challenge we face is the growing numbers of students who do not speak English as a first language. In fact, 10 percent, or nearly 5 million students, come to school with limited English proficiency—a number that has nearly doubled in less than 10 years.38 We are still learning the most effective ways to reach these students and teach them English so that they can become proficient in other subjects. Testing and reporting the achieve-ment of these students is required by No Child Left Behind, and the results, while improving, suggest that we have a long way to go. Only about 6 percent of English language learners are proficient in reading, based on results from the 4th-, 8th- and 12th-grade main National Assessment of Educational Progress (NAEP) tests.39
Non-promoted Studentsfrom Schools with
promotion rate below 60%
Schools with promotion rate
below 60%
Non-promoted Students from Schools with
promotion rate above 60%
Schools with promotion rate
above 60%
0%
10%
20%
30%
40%
50%
60%
70%
80%
90%
100%
Total Number of Schools Total Number of Non-promoted students
Source: Belfanz, R., & Legters, N. Locating the dropout crisis . (Baltimore, Md.: Johns Hopkins University, 2004). 2006 promotion rates are from http://web.jhu.edu/CSOS/images/List_of_Schools_with_a_Weak_Three_Year_Average_Promoting_Power_Ratio.pdf accessed April 2008. Additional data provided by the authors. Note: Traditional high schools with enrollment of more than 100.
Figure 8.In 2006, high schools with promotion rates below 60 percent made up only 12 percent of the total,
yet they contributed over half of the number of non-promoted students.

14
There are other achievement gaps that we need to address, as well. Persistent achievement gaps between black students and white students have only been slightly diminished in the last two decades, though in recent years we have seen progress. As a result, black students are, on average, roughly two to three years behind white students in both reading and math. Further, only 14 percent of black fourth-graders are proficient readers, as measured by NAEP. 40
IV. Looking AheadWhile we are no longer complacent or idle, we continue to face many challenges, several of which did
not even exist in 1983. The standards and accountability movement has resulted in new transparency in student achievement—by grade, subgroup, and subject, and by school, district, and state. While we are finally capable of defining our difficulties, the full solutions to some of them have not yet been found. Where solutions have been found, they have not been put fully in place because not everyone is willing to accept and make the changes that are necessary.
Another important sign of progress is the collection of rigorous research on what works in the class-room.41 In 1997, the National Reading Panel was assembled to review research on reading instruction. The Panel issued its report in 2000, and the report has had far-reaching impact in the elementary school classroom, particularly on the teaching of struggling readers.42 The National Mathematics Advisory Panel issued its report in March 2008. It evaluated what is known about effectiveness in math instruc-tion.43 Both of these reports pointed out gaps in our knowledge and recommended additional research.
In addition to sweeping changes that standards and accountability have brought, we have seen other new challenges and ideas surface in education that were not contemplated in A Nation at Risk. Schools today must not only keep pace with rapid advances in technology (which are slowly changing the way students and teachers learn and interact) but also work to address increasing threats to school safety. Newly implemented policy proposals include scholarship programs for low-income students, the growth of homeschooling, and the creation of charter schools—all of which increase parental choice in education. And we have seen some encouraging results. We know, from emerging research on schools in Illinois and Florida, that students who attend charter middle and high schools have been substantially more likely to graduate with a standard diploma and attend college than their counterparts in traditional public schools.44 We know that scholarships for low-income students are boosting the achievement of inner-city African-American children.45
We also know that effective teachers are one of the most crucial components in education improve-ment.46 We know that teachers are more effective when they have demonstrated mastery of the sub-jects that they teach and that effective teachers deserve to be compensated for excellent results in their classrooms.47 However, we do not yet know as much as we would like about how to develop these great teachers or the best way to allocate our teaching resources to do the most good. Fortunately, a growing body of research and innovative pilot efforts, such as the Teacher Incentive Fund, are being pursued on these topics.
15
Furthermore, the magnitude of our problems in secondary education is becoming increasingly clear. Our high schools have not improved enough since A Nation at Risk. We are only beginning to analyze and act on test score data at the secondary level. We are starting to address the staggering dropout rate problem. There is much more to be learned here, much more of the mountain to climb—now that we are better able to define the problems.
As many have noted, a number of critical factors determine a society’s long-run prosperity, includ-ing: respect for ownership, a relatively open market, and ambitious entrepreneurs. But human capital is one of the most important, and a strong education system is vital to the long-term cultivation of human capital. Education makes not only the individual better off but also the society.48
The pace of change in the global economy poses an already enormous and growing challenge for educators. As Microsoft founder Bill Gates has said, “You need to understand things in order to invent beyond them.”49 We are currently preparing our students for jobs that don’t exist, using technologies that haven’t been invented, in order to solve problems we don’t even know are problems yet.50 It is more critical than ever that we stay informed of our progress and recognize the urgency of ensuring that children’s futures are not wasted.
In �983, A Nation at Risk sounded the alarm, and state and local leaders responded in the 1980s and 1990s with various efforts that included initial forays into standards, testing, and accountability. In those same years, the federal government provided aid to assist those efforts.
Over the last eight years, the administration and Congress have worked together on education reform, through such efforts as the American Competitiveness Initiative, which includes enactment of programs in math and, of course, the major accountability legislation No Child Left Behind. We have changed ourselves from a nation at risk of complacency to a nation at work on its shortcomings and accountable for results.
As a result of No Child Left Behind, we now have a detailed picture from the school level to the national level of annual student achievement in reading and math. We can readily observe how well various groups of students, such as minority students, students with disabilities, and English language learners, are doing.
Twenty-five years after A Nation at Risk we know we face greater challenges. We have made prog-ress, but we know that now is the time to push harder. We must redouble our efforts and continue to climb the mountain to make sure that all children can reach the summit.
16
Endnotes
� National Commission on Excellence in Education, A Nation at Risk: The Imperative for Educational Reform (Washing-ton, D.C.: U.S. Department of Education, 1983). This citation applies to all references to A Nation at Risk or the Commis-sion.
2 The data in this section are estimates produced using data from the 2007 Digest of Education Statistics, published by the National Center for Education Statistics. The estimates were produced by applying to the cohort of 20 students born in 1983: the average freshman high school graduation rate in 2001 (71.7 percent, Digest Table 102), for a total of about 14 students; then applying the college enrollment rate (66.8 percent, Digest Table 193), for a total of approximately 10 students; then ap-plying the latest available college graduation rate (56.3 percent in 2001, Digest Table 318; average of the two- and four-year college rates based on proportion of enrollees in each) to yield approximately five college graduates by spring 2007.
3 This analysis is based on students who enter college immediately upon graduation and does not take into account those who enter college later.
4 Sandy Baum and Jennifer Ma, Education Pays: The Benefits of Higher Education for Individuals and Society (Washington, D.C.: College Board, 2007), p. 10.
5 The Commission also recommended one-half year of computer science.6 From 1983 to 2005, the rate increased from 14.3 to 64.7 percent at which students took four units of English and three
each of math, science, and social studies. T.D. Snyder, S.A. Dillow, and C.M. Hoffman, Digest of Education Statistics 2007 (NCES 2008-022), National Center for Education Statistics, Institute of Education Sciences (Washington, D.C.: U.S. Depart-ment of Education, March 2008), Table 144, p. 219.
7 Williamson Evers and Paul Clopton, “The Curricular Smorgasbord” in Our Schools and Our Future: Are We Still at Risk?, ed. Paul Peterson (Stanford, Calif.: Hoover Institution Press, 2003), pp. 248-54. Also available at http://www.hoover.org/publications/books/3002506.html (accessed April 2008).
8 U.S. Department of Education, Institute of Education Sciences, National Center for Education Statistics, National As-sessment of Educational Progress: Long-Term Trend (Washington, D.C., 2005), available through NAEP Data Explorer at http://nces.ed.gov/nationsreportcard/lttnde/viewresults.asp (accessed April 2008).
9 Improving America’s Schools Act of 1994: Public Law 103-382, enacted July 1, 1995. Goals 2000: Educate America Act: Public Law 103-227, enacted March 31, 1994.
10 The No Child Left Behind Act of 2001: Public Law 107-110, enacted January 8, 2002.��Data from NAEP Transcript Study of various years, as quoted in Caroline Hoxby, “What Has Changed and What Has
Not,” in Our Schools and Our Future: Are We Still at Risk?, ed. Paul Peterson (Stanford, Calif.: Hoover Institution Press, 2003), p. 89.
12 Organisation for Economic Co-operation and Development, Education at a Glance Indicators 2005, Chart D1.3–Student learning time in and out of school 2003, September 2005, available at http://www.oecd.org/document/11/0,3343,es_2649_39263238_35321099_1_1_1_1,00.html (accessed April 2008).
�3 Herbert J. Walberg and Susan J. Paik, Effective Educational Practices, Educational Practices Series no. 3 (Brussels, Bel-gium: International Academy of Education, and Geneva, Switzerland: UNESCO International Bureau of Education, 2000), p. ��.
17
14 For more information on these issues, see Terry M. Moe, “Highly Qualified Teacher in Every Classroom,” in Within Our Reach: How America Can Educate Every Child, ed. John E. Chubb (Lanham, Md.: Rowman and Littlefield, 2005), pp. 173–99.
15 Caroline Hoxby, “What Has Changed and What Has Not,” in Our Schools and Our Future: Are We Still at Risk?, ed. Paul E. Peterson (Stanford, Calif.: Hoover Institution Press, 2003), p. 74.
16 For more information, see http://www.ed.gov/programs/teacherincentive/index.html (accessed April 2008).17 New Leaders for New Schools, “Defining an Urban Principalship to Drive Dramatic Achievement Gains,” March 10,
2008, p. 4., available at http://www.nlns.org/NLWeb/documents/New_Leaders_Report_Mar102008_final.pdf (accessed April 2008).
�8 T.D. Snyder, S.A. Dillow, and C.M. Hoffman, Digest of Education Statistics 2006 (NCES 2007-017), National Center for Education Statistics, Institute of Education Sciences (Washington, D.C.: US Department of Education, March 2007), Table 26, p. 44.
�9 T.D. Snyder, S.A. Dillow, and C.M. Hoffman, Digest of Education Statistics 2007 (NCES 2008-022), National Center for Education Statistics, Institute of Education Sciences (Washington, D.C.: U.S. Department of Education, March 2008), Table 171, p. 253. These are current per-pupil expenditures in constant 2006-07 dollars based on average daily attendance.
20 According to the National Digest of Education Statistics 2006, there were 96,513 schools in the 2004–05 school year.21 U.S. Department of Education, Institute of Education Sciences, National Center for Education Statistics, National As-
sessment of Educational Progress, 1971–2004 Long-Term Trend Reading and Mathematics Assessments (Washington, D.C., 2005), available through NAEP Data Explorer at http://nces.ed.gov/nationsreportcard/lttnde/viewresults.asp (accessed April 2008).
22Organisation for Economic Co-operation and Development, Education at a Glance 2007: OECD Briefing Note on the United States (September 2007), p. 7.
23 Stéphane Baldi, Ying Jin, Melanie Skemer, Patricia J. Green, and Deborah Herget. Highlights from PISA 2006: Perfor-mance of U.S. 15-Year-Old Students in Science and Mathematics Literacy in an International Context, Institute of Education Sciences, National Center for Education Statistics (Washington, D.C.: U.S, Department of Education, December 2007), pp. 47-48. See also Justin Baer, Stéphane Baldi, Kaylin Ayotte, and Patricia J. Green. “The Reading Literacy of U.S. Fourth-Grade Students in an International Context Results From the 2001 and 2006 Progress in International Reading Literacy Study (PIRLS),” Institute of Education Sciences, National Center for Education Statistics (Washington, D.C.: U.S. Depart-ment of Education, November 2007), p. 7 (Figure 2). See also Mariann Lemke and Patrick Gonzales, “U.S. Student and Adult Performance on International Assessments of Educational Achievement,” Institute of Education Sciences, National Center for Education Statistics, June 2006, pp. 9, 13–15.
24 Tom Loveless, “The 2001 Brown Center Report on American Education: How Well Are American Students Learning?” (Washington, D.C.: Brookings Institution, 2001), p. 21. Organisation for Economic Co-operation and Development, OECD Education at a Glance 2007: OECD Briefing Note for the United States, September 2007, p. 12.
25 Jay P. Greene and Marcus Winters, “Public School Graduation Rates in the United States” (New York: Manhattan Insti-tute for Policy Research, November 2002), p. 7, available at http://www.manhattan-institute.org/html/cr_31.htm (accessed April 2008).
26 Christopher B. Swanson, “Cities in Crisis: A Special Analytic Report on High School Graduation” (Bethesda, Md.: Editorial Projects in Education Research Center, April 2008), p.1. The National Center for Education Statistics, using the averaged freshman graduate rate methodology, reports a rate of 74.3 percent. See T.D. Snyder, S.A. Dillow, and C.M. Hoff-man, Digest of Education Statistics 2006 (NCES 2007-017), National Center for Education Statistics, Institute of Education Sciences (Washington, D.C.: U.S. Department of Education, March 2007), Table 101, p. 165.
�8
27 Swanson, “Cities in Crisis,” p. 1.28 Ibid, p. 9.29 T.D. Snyder, T.D., S.A. Dillow, and C.M. Hoffman, Digest of Education Statistics 2007 (NCES 2008-022), National Cen-
ter for Education Statistics, Institute of Education Sciences (Washington, D.C.: U.S. Department of Education, March 2008), Table 376, p. 559.
30 Sandy Baum and Jennifer Ma, Education Pays: The Benefits of Higher Education for Individuals and Society (Washing-ton, D.C.: College Board, 2007), pp. 9–10. But see Charles Miller, Letter to Gaston Caperton, April 2, 2008. Available at: http://chronicle.com/weekly/documents/v54/i31/college-board-letter.doc (accessed April 2008).
3� U.S. Department of Labor, Bureau of Labor Statistics, weekly and hourly wage data from the 2007 Current Population Survey, available at http://data.bls.gov (accessed April 2008).
32 Henry Levin, Clive Belfield, Peter Muennig, Cecilia Rouse, “The Costs and Benefits of an Excellent Education for All of America’s Children” (New York: Teachers College, Columbia University, January 2007), p.1, available at http://www.cbcse.org/media/download_gallery/Leeds_Report_Final_Jan2007.pdf (accessed April 2008).
33 Caroline Wolf Harlow, Education and Correctional Populations, Special Report, rev. ed. (Washington, D.C.: U.S. De-partment of Justice, Bureau of Justice Statistics, April 15, 2003), NCJ 195670, http://www.ojp.usdoj.gov/bjs (accessed April 2008), as cited in John M. Bridgeland, John J. DiIulio Jr., and Karen Burke Morison, The Silent Epidemic: Perspectives of High School Dropouts (Washington, D.C.: Civic Enterprises, 2006), p.2.
34 Bridgeland et al., The Silent Epidemic. 35 Robert Balfanz and Nettie Legters, “Locating the Dropout Crisis: Which High Schools Produce the Nation’s Dropouts?
Where are they Located? Who Attends Them?” (Baltimore, Md.: Center for Social Organization of Schools, Johns Hopkins University, 2004), p. v. Additional data were provided by the referenced study’s authors for some of the calculations.
36 For mid-1980s data, see U.S. Department of Education, Office for Civil Rights, 1986 State Summaries of Elementary and Secondary School Civil Rights Survey; and National Center for Education Statistics, Common Core of Data survey. For 2005 data, T.D. Snyder, S.A. Dillow, and C.M. Hoffman, Digest of Education Statistics 2006 (NCES 2007-017), National Center for Education Statistics, Institute of Education Sciences (Washington, D.C.: U.S. Department of Education, March 2007), Table 40, p. 72.
37 “Knocking at the College Door: Projections of High School Graduates by State and Race/Ethnicity 1992–2022” (Boul-der, Colo.: Western Interstate Commission for Higher Education, March 2008), pp. 27–28.
38 For 1998 data, see U.S. Department of Education, Institute of Education Sciences, National Center for Education Sta-tistics, Common Core of Data, “Local Education Universe Survey,” 1998–99, v.1c. For 2006 data, see U.S. Department of Education, SY 2005-2006 Consolidated State Performance Reports, available at http://www.ed.gov/admins/lead/account/con-solidated/index.html (accessed April 2008).
39 U.S. Department of Education, Institute of Education Sciences, National Assessment of Educational Progress: Long-Term Trend, National Center for Education Statistics (Washington, D.C., 2005), available through NAEP Data Explorer at http://nces.ed.gov/nationsreportcard/lttnde/viewresults.asp (accessed April 2008).
40 U.S. Department of Education, Institute of Education Sciences, National Assessment of Educational Progress: Long-Term Trend, National Center for Education Statistics, Washington, D.C., 2005, available through NAEP Data Explorer at http://nces.ed.gov/nationsreportcard/lttnde/viewresults.asp (accessed April 2008).
�9
41 Much of federally funded research in education has been made more scientific and is now supervised by an independent entity created in 2002, the Institute of Education Sciences.
42 National Reading Panel, Teaching Children to Read: An Evidence-Based Assessment of the Scientific Research Literature on Reading and Its Implications for Reading Instruction (Washington, D.C.: U.S. Department of Education, 2000).
43 National Mathematics Advisory Panel, Foundations for Success, Final Report of the National Mathematics Advisory Panel (Washington, D.C.: U.S. Department of Education, 2008).
44 Kevin Booker, Tim Sass, Brian Gill, and Ron Zimmer, “Going Beyond Test Scores: Evaluating Charter School Impact on Educational Attainment in Chicago and Florida,” paper presented at the American Educational Research Association Annual Meeting, March 27, 2008, p. 3.
45 William E. Howell, Patrick J. Wolf, Paul E. Peterson, and David Campbell, “Test-Score Effect of School Vouchers in Dayton, Ohio, New York City, and Washington, D.C.: Evidence of Randomized Field Trials,” PEPG00-16 (Boston: Harvard University Program on Education Policy and Governance, August 2000), p. 2.
46 Eric A. Hanushek and Steven G. Rivkin, “How to Improve the Supply of High-Quality Teachers,” in Brookings Papers on Education Policy 2004, ed. Diane Ravitch (Washington, D.C.: Brookings Institution Press, 2004), p. 20.
47 On teacher knowledge, see National Mathematics Advisory Panel, Foundations for Success, p. 37.48 Eric A. Hanushek, Dean T. Jamison, Eliot A. Jamison, and Ludger Woessmann, “Education and Economic Growth,”
Education Next, Vol. 8, No. 2 (Spring 2008), pp. 66, 68.49 Thomas Friedman, The World Is Flat: A Brief History of the Twenty-First Century (New York: Farrar, Straus and Giroux:
2005), p. 365.50 Karl Fisch and Scott McCleod, with design and development by XPLANE, “Did You Know 2.0,” June 2007, available at
http://www.youtube.com/watch?v=pMcfrLYDm2U (accessed April 2008). Karl Fisch is director of technology at Arapahoe High School in Littleton, Colo. Scott McCleod is associate professor in the Department of Educational Leadership and Policy Studies at Iowa State University.
“Knocking at the College Door: Projections of High School Graduates by State and Race/Ethnicity 1992–2022” (Boulder, Colo.: Western Interstate Commission for Higher

The Department of Education’s mission is to promote student achievement and preparation for global competitiveness by fostering educational excellence
and ensuring equal access.
www.ed.gov
![,PSOHPHQWLQJ $FFRXQWDEOH &DUH 2UJDQL]DWLRQVii Berkeley Center on Health, Economic & Family Security|Implementing Accountable Care Organizations EXECUTIVE SUMMARY s the nation gears](https://img.pdfslide.us/doc/110x75/5e3a42df21ba42351f6445d5/psohphqwlqj-ffrxqwdeoh-duh-2ujdqldwlrqv-ii-berkeley-center-on-health-economic.jpg)