Embed Size (px)
Citation preview
A n n u a l R e p o r t 2 0 0 3
Contents
Business Idea 1
Incap in Brief 2
Values 3
Strengths 4
Trend in the Operating Environment 5
1999–2003 6
2003 in Brief 7
Review by the President and CEO 8
Development of Operations 10
Personnel 16
Quality and Environment 17
Financial Accounts
Comparison with Pro Forma 2002 figures 18
Report of the Board of Directors 20
Consolidated Profit and Loss Account 23
Consolidated Balance Sheet 24
Consolidated Sources of Funds 25
Parent Company’s Profit and Loss Account 26
Parent Company’s Balance Sheet 27
Parent Company’s Sources of Funds 28
Account Policy Applied in the
Consolidated Annual Accounts for 2003 29
Notes 30
Consolidated Financial Information 39
Rules for Calculating Financial Information 40
Proposal by the Board of Directors 41
Auditors´ Report 41
Shares and Shareholders 42
Corporate Governance 45
Board of Directors 46
Management Team 47
Press Releases in 2003 48
Information for Shareholders 50
Contact Information 51
○
○
○
○
○
○
○
○
○
○
○
○
○
○
○
○
○
○
○
○
○
○
○
○
○
○
○
○
○
○
○
○
○
○
○
○
○
○
○
○
○
○
○
○
○
○
○
○
○
○
○
○
○
○
○
○
○
○
○
○
○
○
○
○
○
○
○
1Annual Report 2003
Business Idea
Incap is an electronic contract manufacturer that offers
diverse, flexible and high-quality manufacturing services
covering design and construction as well as repair and
maintenance services.
We are an active part of the value chain for electronics
products and we build close long-term partnerships
with customers, suppliers, subcontractors and other
partners in co-operation.
◆ PROTOTYPE FABRICATION ◆ MACHINING ◆ ETCHING ◆ SHEET METAL FABRICATION
◆ HIGH-PRECISION PLATING ◆ PCB ASSEMBLY ◆ DESIGN SERVICES
◆ LOGISTICS SERVICES ◆ FINAL ASSEMBLY
◆ PRODUCT INTEGRATION ◆ TESTING ◆ SERVICING AND MAINTENANCE

2 Annual Report 2003
Incap in Brief
Comprehensive manufacturing services
Incap has about 25 years of solid experience of manufacturingelectronics products. The service palette covers a large part ofthe value chain of an electronics product and Incap is able toprovide its customers with integrated packages encompassing◆ design services◆ prototype fabrication◆ machining◆ etching◆ high-precision plating◆ PCB assembly◆ sheet metal fabrication◆ manufacture of flexible circuit boards◆ final assembly◆ product integration◆ testing◆ servicing and maintenance◆ logistics services.
Customers in many industries
The company’s main customer sectors are telecommunica-tions, electrical power technology, the automation and processindustry as well as equipment manufacture for measurementtechnology, safety electronics and healthcare. Customers in-clude ABB, Abloy, Environics, GE-Instrumentarium, Kone,Metorex Security Products, Metso, Nokia Networks, Oras,Planmeca, REMEC, Solotop, Suunto and Vaisala.
Incap’s production facilities are located in Helsinki,Kempele, Ruukki, Vaasa, Vuokatti and Kuressaare in Estonia.All the factories have a certified ISO 9001:2000 quality systemand an ISO 14001:1996 environmental system.
The Incap Group has two subsidiaries: Incap ElectronicsEstonia OÜ and Ultraprint Oy. The Group has a payroll ofa total of 552 employees.
Incap Corporation’s shares are listed on the I List of Hel-sinki Exchanges. ■
Net turnover by customer sector, %.
○ ○ ○ ○ ○ ○ ○ ○ ○ ○ ○ ○ ○ ○ ○ ○ ○ ○ ○ ○ ○ ○ ○ ○ ○ ○ ○ ○ ○ ○ ○ ○ ○ ○ ○ ○ ○ ○ ○ ○ ○ ○ ○ ○ ○ ○ ○ ○ ○ ○ ○ ○ ○ ○ ○ ○ ○ ○ ○ ○
Incap offers leading equipment suppliers in the electronics and electrical industryflexible and high-quality manufacturing services that combine versatile know-howin electronics and mechanics.
■ Telecommunications 43%
■ Electrical power technology 13%
■ Automation/process 3%
■ Measurement technology 20%
■ Medical electronics 8%
■ Safety 4%
■ Others 9%
○ ○ ○ ○ ○ ○ ○ ○ ○ ○ ○ ○ ○ ○ ○ ○ ○ ○ ○ ○ ○ ○ ○ ○ ○ ○ ○ ○ ○ ○ ○ ○ ○ ○ ○ ○ ○ ○ ○ ○ ○ ○ ○ ○ ○ ○ ○ ○ ○ ○ ○ ○ ○ ○ ○ ○ ○ ○ ○ ○
3Annual Report 2003
Incap’s Values
Focus on customersLong-term success is possible only if our customers are satisfied with our services.We build an enduring partnership with our customers, a relationship that is basedon trust and mutual benefit.
ProfitabilityEfficient and competitive operations ensure a good earnings trend and makepossible future growth and internationalisation.
Continuous developmentWe improve and develop our operations actively so that we can keep performing well.We seek to renew ourselves continually and to shape our businessto fit the customer’s needs.
Respect for the individualWe support each other in learning new things and we share our abilities with othermembers of the workgroup for the benefit of all. We strive for open interactionand deal with matters – even difficult ones – in a good spirit. We give each otherpositive and constructive feedback.
Focus on CustomersFocus on CustomersFocus on CustomersFocus on CustomersFocus on Customers
Focus on CustomersFocus on CustomersFocus on CustomersFocus on Customers
ProfitabilityProfitabilityProfitability
ProfitabilityProfitabilityProfitability
ContinuousDevelopment
Development
Continuous
ContinuousDevelopment
4 Annual Report 2003
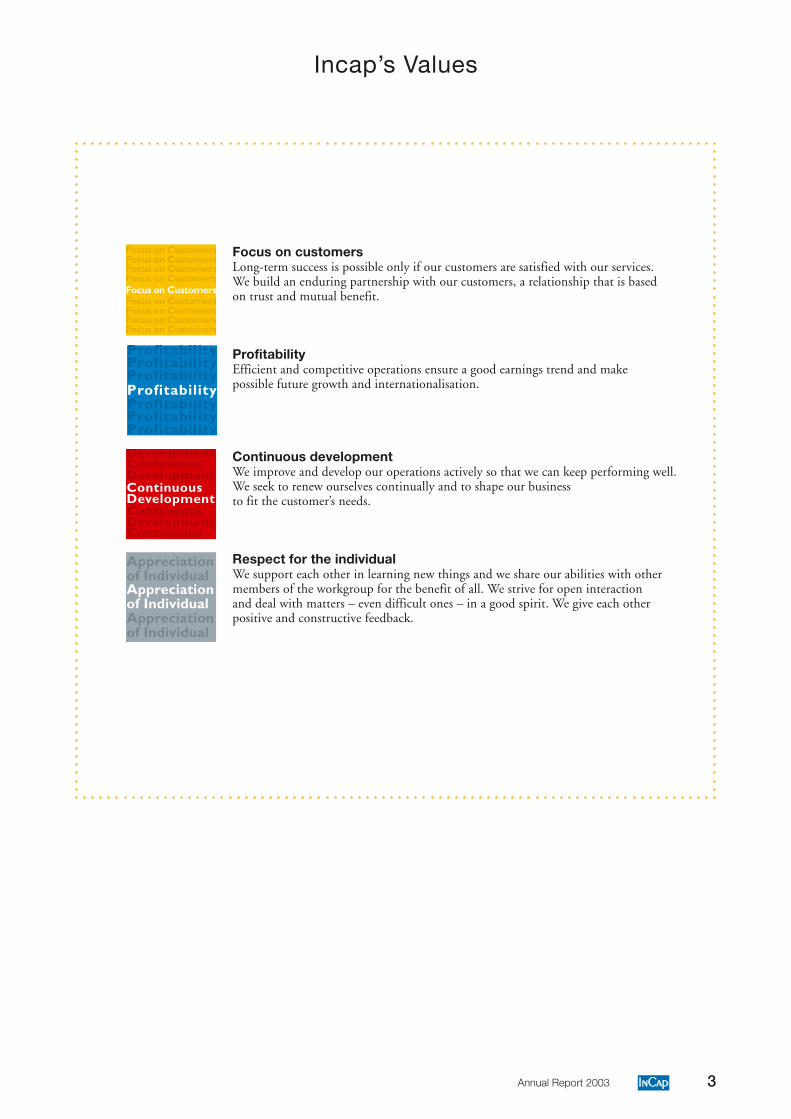
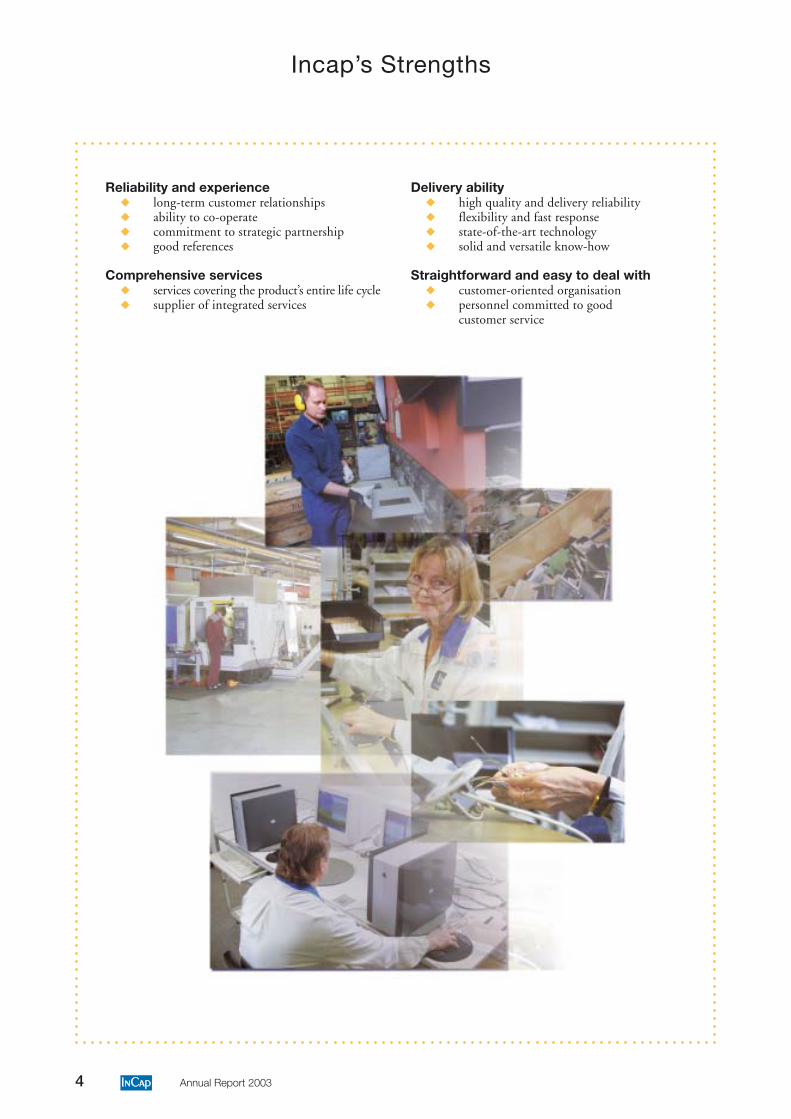
Reliability and experience◆ long-term customer relationships◆ ability to co-operate◆ commitment to strategic partnership◆ good references
Comprehensive services◆ services covering the product’s entire life cycle◆ supplier of integrated services
Delivery ability◆ high quality and delivery reliability◆ flexibility and fast response◆ state-of-the-art technology◆ solid and versatile know-how
Straightforward and easy to deal with◆ customer-oriented organisation◆ personnel committed to good
customer service
Incap’s Strengths
5Annual Report 2003
Trend in the Operating Environment
A challenging market situationThere was continuing overcapacity in the provision of manu-facturing services in 2003. Large international contract manu-facturers reassessed their operations in Finland, closed factories,discontinued production lines and revised their strategies andobjectives. Providers of manufacturing services jockeyed fornew positions in the value chain by making acquisitions,joining together in mergers or networking with partners inco-operation. The transfer of high-volume production to low-cost countries that are close to growing markets gained pace.
Manufacturers of equipment for the electron-ics industry cut down the number of their sup-pliers and sought close co-operation with a fewreliable suppliers. Concurrently, the weak de-mand and tough competition in the market ledto a declining price trend and forced equipmentmanufacturers to seek cost savings. This trendhad a pronounced impact on the entire deliverychain, and contract manufacturers had to revisetheir prices and step up operational efficiencyfurther. With product life cycles shortening, ithas become more difficult than ever to forecastdemand. In the face of tight competition, newproducts must be brought to market quickly,and a contract manufacturer’s speed, responsive-ness and flexibility constitute a major competi-tive advantage.
Contract manufacturing gains groundContract manufacturing is still an expandingbusiness, though the trend over the past twoyears has not been in line with expectations.Outsourcing is continuing and strengthening asthe economy bounces back. Instead of indi-vidual components, a contract manufacturer iscalled on to provide ever larger product andservice packages.
According to a study published by the Ministry of Tradeand Industry in November 2003, about 25% of electronicsproduction in Europe has been outsourced. In Finland, a goodthird of the manufacture of telecommunications equipmenthas been outsourced, and the share within other electronicsmanufacture is clearly smaller. In order to cope with the dif-ficult market situation, manufacturers of electronics equip-ment are looking for new ways of stepping up their operationsand are outsourcing both manufacturing, production supportfunctions and entire business processes. So far, only a fractionof design and after-market services has been outsourced, and
the outsourcing of these services will increase at a faster ratethan that of mainline manufacturing.
Service ability is crucialThe sector is dividing into large global contract manufacturersand medium-sized regional players. The large electronics con-tract manufacturers are able to focus their operations on cer-tain industries, whereas medium-sized contract manufacturersserve a wider clientele.
There is still tough price competition andcustomers are insisting on an annual price-dropof up to 10%, depending on the industry. Pricepressures may ease off if there is particularlystrong growth in the market and componentavailability comes under pressure. Ever tightercompetition is leading to more open pricing.This is resulting in a closer partner relationshipbetween electronics equipment manufacturersand contract manufacturers. The supply ofcheap labour is being utilised actively, andhigh-volume production in particular is mov-ing from Finland to the Baltic countries, east-ern Europe, Mexico and the Far East.
In price comparisons, the priority is shift-ing from a narrow concern with a product’smanufacturing cost to its total costs and thesupplier’s service ability because in the manu-facture of electronics products, fast ramp-up,delivery reliability and dependable quality aremajor factors in the overall analysis.
Because of logistics costs and the time lag,it doesn’t pay to transport completed productsfrom one continent to another. This meansthat products that are needed in the Europeanmarkets will for the most part continue to bemanufactured in Europe. On the other hand,
the fact that companies’ product development will remain inFinland and Europe guarantees that at least production ramp-up will be done here, even if, some years in the future, actualhigh-volume production is moved closer to the markets, say,to China.
The life cycles of electronics products are shortening con-tinually and several versions of products that are tailored tothe needs of different user groups are being made. This is afactor limiting the size of manufacturing volumes. In themanufacture of products of this kind, flexible and agile sup-pliers like Incap, whose production technology is suited tosmall and medium-sized series will be successful. ■
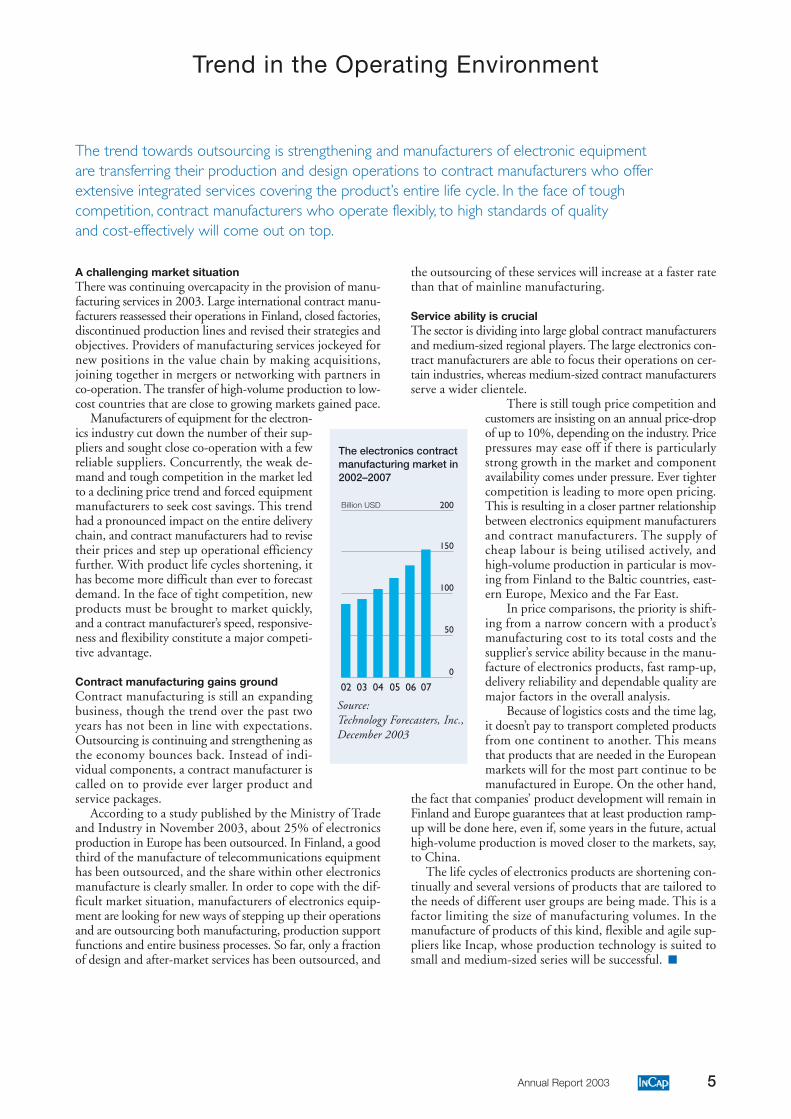
Source:Technology Forecasters, Inc.,December 2003
The trend towards outsourcing is strengthening and manufacturers of electronic equipmentare transferring their production and design operations to contract manufacturers who offerextensive integrated services covering the product’s entire life cycle. In the face of toughcompetition, contract manufacturers who operate flexibly, to high standards of qualityand cost-effectively will come out on top.
The electronics contractmanufacturing market in2002–2007
150
200
03 04 0502
100
50
0
06 07
Billion USD
6 Annual Report 2003
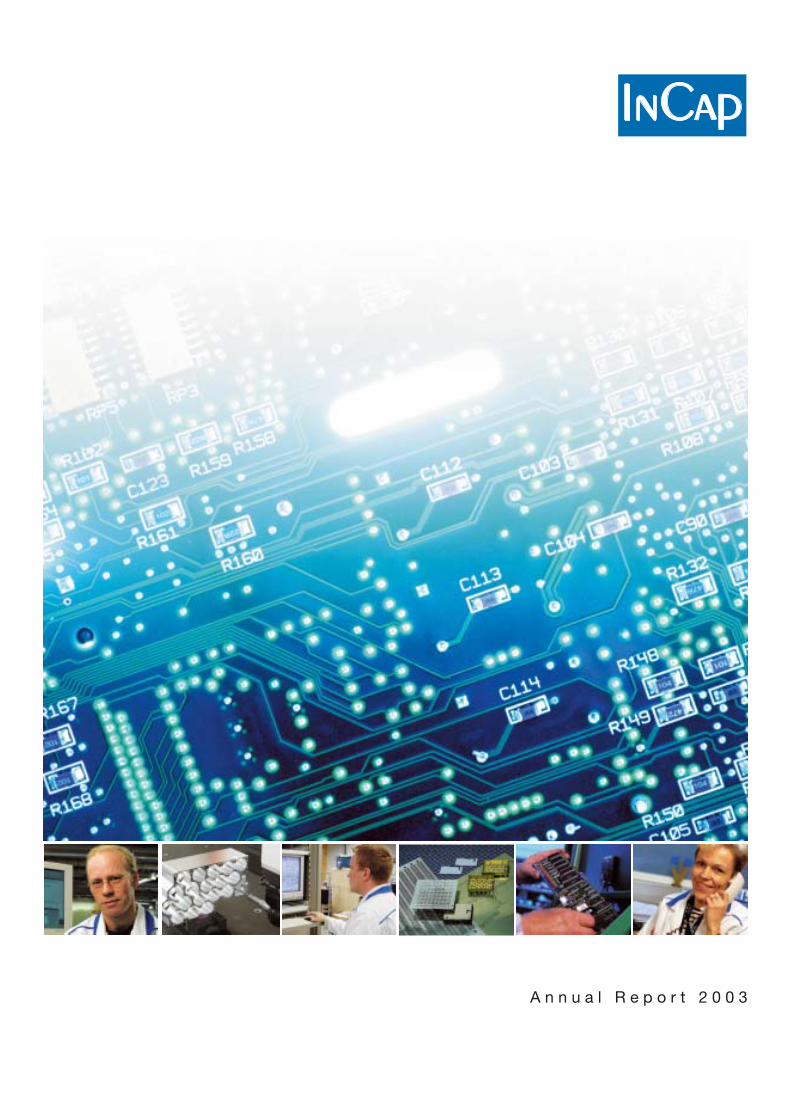
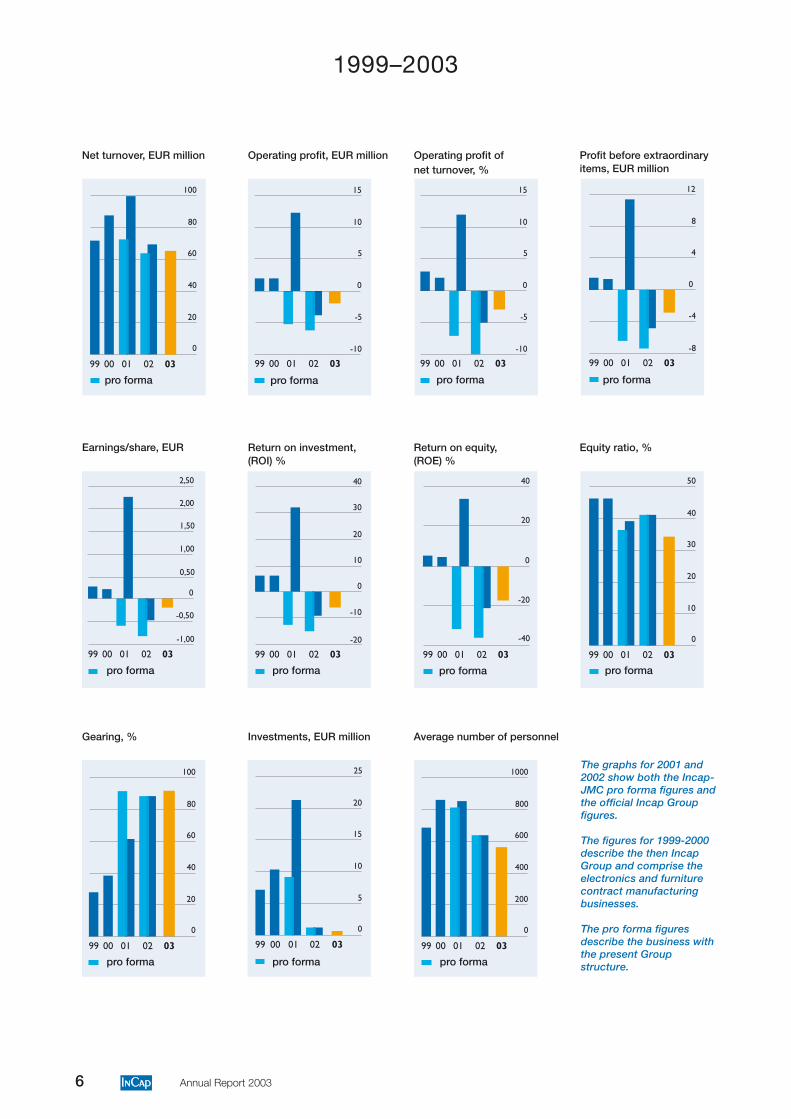
1999–2003
The graphs for 2001 and2002 show both the Incap-JMC pro forma figures andthe official Incap Groupfigures.
The figures for 1999-2000describe the then IncapGroup and comprise theelectronics and furniturecontract manufacturingbusinesses.
The pro forma figuresdescribe the business withthe present Groupstructure.
pro forma
Net turnover, EUR million
pro forma
20
40
60
80
100
0
00 01 02 0399
Operating profit, EUR million
0
15
-10
-5
10
5
00 01 02 0399
Operating profit ofnet turnover, %
0
15
-10
-5
10
5
00 01 02 0399
0
4
8
12
-8
-4
00 01 02 0399
Profit before extraordinaryitems, EUR million
Earnings/share, EUR
1,00
1,50
2,00
2,50
0,50
0
-0,50
-1,00
00 01 02 0399
Return on investment,(ROI) %
0
10
20
30
40
-20
-10
00 01 02 0399
Return on equity,(ROE) %
-20
-40
20
40
0
00 01 02 0399
Equity ratio, %
10
20
30
40
50
0
00 01 02 0399
Gearing, %
20
40
60
80
100
0
00 01 02 0399
Investments, EUR million
5
10
15
20
25
0
00 01 02 0399
Average number of personnel
200
400
600
800
1000
0
00 01 02 0399
pro forma pro forma
pro formapro forma pro forma pro forma
pro formapro forma pro forma
7Annual Report 2003
Improved profitability – increase in net turnoverIncap Corporation retained its established position as a sup-plier of manufacturing services. The continued slack demandin the telecommunications network sector had an especiallymarked impact on the operations of the Group’s units thatmanufacture network and base station products. Despite lowmanufacturing volumes, productivity improved at all thefactories. The pick-up in the market towards the end of theyear increased the capacity utilisation rate and had a positiveeffect on earnings.
Consolidated net turnover was EUR 65.2 million, up 3%on the pro forma turnover in 2002. The Group reported anoperating loss of EUR 1.9 million, i.e. a 70% improvementon the pro forma operating result in 2002.
The operating result includes a total of EUR 1.6 millionof non-recurring costs resulting from efficiency-boosting anddownsizing arrangements. Due to structural rearrangement,non-recurring writedowns concerning machinery and equip-ment were entered in extraordinary expenses to a total of EUR3.2 million.
Enhancement in integrated servicesAll of the company’s areas of expertise were utilised in thedeliveries of base station components that got under way atthe beginning of the year. The manufacture of products in-volved machining, plating, PCB assembly, sheet metal fabri-cation, product assembly, integration, tuning and testing.
In the face of tougher competition, customers are seekingever-newer cost savings, thereby increasing the need for thecontinuous enhancement of operations. With the aim oflowering manufacturing costs, a greater amount of electronicsmanufacture and assembly was done in Estonia.
At the factories in Kempele and Ruukki, quality and en-vironmental systems were built and they were granted an ISO9001:2000 quality certificate and an ISO 14001:1996 envi-ronmental certificate in January 2004. All the Group’s factorieshave the same types of certification.
The results of the customer satisfaction survey improvedin all the subareas of customer service compared with the cor-
2003 in Brief
responding survey in 2002. Customers identified Incap’s mainstrengths as being its understanding of customers’ needs, theease of dealing with us and the competence of our people.
Business development prioritiesThe paramount near-term objective is to improve profitabilityby increasing productivity, stepping up materials managementprocesses and raising the capital turnover rate. Growth in netturnover will be sought primarily by expanding co-operationwith present customers.
Incap’s manufacturing services and way of working aresuited to most customers in the electronics and product fab-rication sectors, and the company wants to maintain its ver-satile customer mix. Instead of focusing on a single customersector, Incap is concentrating on customer-specific service andtailoring its operations in accordance with each customer’sneeds.
Incap is amplifying co-operation with its customers byoffering ever more extensive integrated services and by assum-ing total responsibility for the customer’s production andrelated services.
Incap’s flexible way of working, versatile expertise andability to respond quickly are major strengths, especially inmanufacturing products that are made in several versionsdesigned for the needs of different user groups. Incap is verycompetitive in the manufacture of such “high mix - low vol-ume” products because its expertise is well suited to the smalland medium-sized production series required for these products.
Outlook for 2004Signs of a revival in demand can be seen in a number of in-dustries. Incap’s objective is to strengthen its role as a partnerof its present customers, and consolidated net turnover isestimated to grow in 2004 at least in line with the marketgrowth.
Profitability will be improved by increasing cost-efficiency,especially within production and materials management. Theobjective is to post an operating result that is in the black andclearly better than the figure reported in 2003. ■
Key ratios By quarters2003 2002 Change 2002 Q1/2003 Q2/2003 Q3/2003 Q4/2003
pro forma % official
Net turnover, EUR million 65.2 63.2 3 69.0 15.3 14.6 15.3 20.0
Operating profit, EUR million –1.9 –6.3 70 –3.8 –0.7 –0.6 –0.5 –0.1
% of net turnover –3 –10 - –5 –4 –4 –3 –1
Profit before extraordinary items, EUR million –2.8 –7.3 62 –4.7 –0.8 –0.8 –0.7 –0.5
Profit/loss for the period, EUR million –5.6 –7.3 23 –10.8 –0.8 –0.8 –0.7 –3.3
Earnings/share, (EPS), EUR –0.20 –0.76 - –0.49 –0.07 –0.07 –0.06 –0.01
Return on equity, (ROE), % –18 –36 - –21 - - - -
Return on investment, (ROI), % –6 –16 - –9 - - - -
Equity ratio, % 34 41 - 41 41 41 39 34
Personnel at end of period 552 589 –6 589 568 561 561 552
The Group’s officially reported figures include the January and February 2002 figures of the furniture business as well as the figures of theJMC Tools Group as from 1 May 2002. The pro forma figures describe the operations of the merged Incap-JMC entity similar to the presentstructure of the Group.The rules for calculating the key ratios are given on page 40.
8 Annual Report 2003
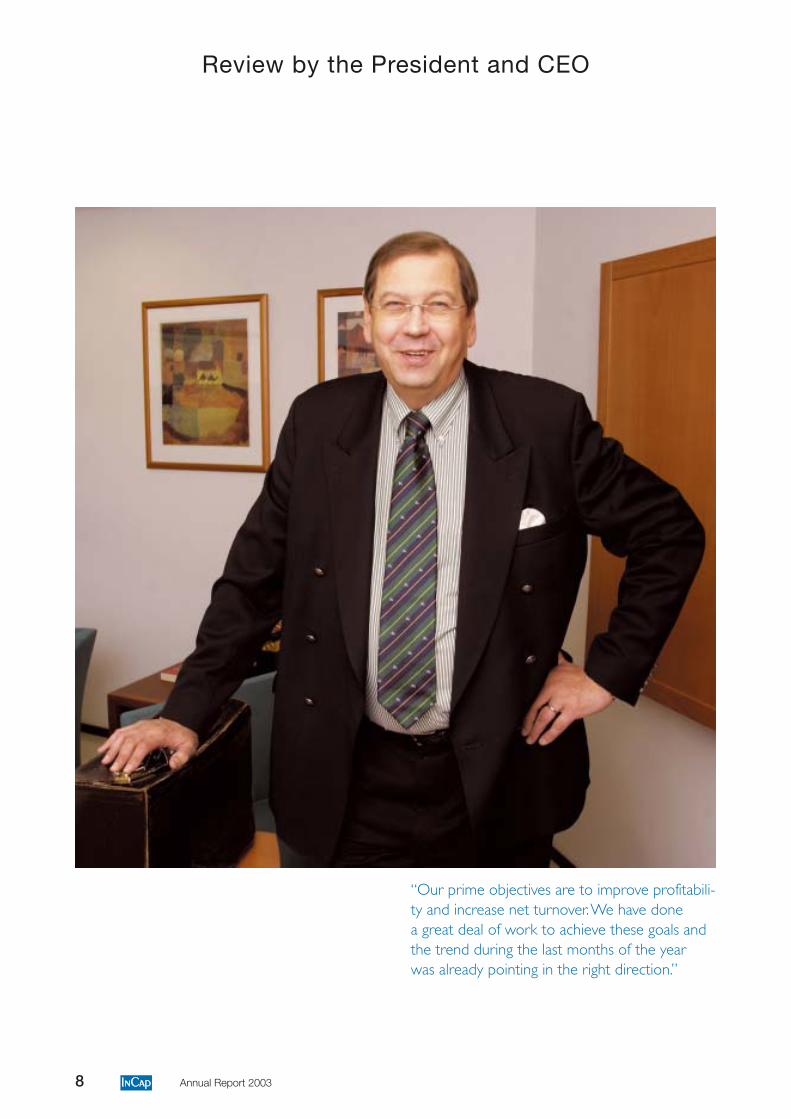
Review by the President and CEO
“Our prime objectives are to improve profitabili-ty and increase net turnover. We have donea great deal of work to achieve these goals andthe trend during the last months of the yearwas already pointing in the right direction.”
9Annual Report 2003
The priority for Incap’s operations was on deepeningcustomer relationships and improving our integratedservices for customers. Work was done on many fronts
with the aim of improving profitability. Our operationalmodel and cost structures were honed, and co-operation be-tween the different areas of expertise was developed. Thewhole palette of expertise was used in the first integrated de-liveries of base station products at the beginning of the year.We also racked up successes in rapidly ramping up the pro-duction of new products and in carrying through customers’outsourced production according to a tight schedule.
Earnings trend heads upwardsBack at the beginning of 2003, an upswing in the economywas forecast to get under way by the summer, but at the closeof the first quarter, the optimism had already become morecautionary, and the anticipated revival in the markets againfailed to materialise.
Demand for Incap’s manufacturing services varied by bothindustry and customer. In the telecommunications sector, de-mand picked up at the end of the year, and in deliveries ofmeasuring technology equipment there was a marked revivalafter the summer. For part of our electrical power technol-ogy customers, demand grew, whereas for others it fell further.The situation was the same for manufacturers of healthcareequipment.
The trend in net turnover was satisfactory, but the oper-ating result was still in the red. In the last two quarters, theoperational result was already in the black and we estimate thatthe positive trend will continue this year. In 2003, earningswere also burdened by non-recurring entries, primarily fordownsizing arrangements and restructuring of production.
During the year we carried out streamlining and efficiency-boosting arrangements across Incap. The Group structure wassimplified when the functions of JMC Tools Oy were trans-ferred to Incap Corporation’s name in mid year. Within thenew organisation that went into effect in November, all manu-facturing operations were centralised within the same busi-ness sector, sales activities were pulled together into a singleteam and materials management was made into a separateunit. The objective of the change is to improve customerservice, delineate procedures clearly, focus operations towardsextensive total deliveries in line with our strategy and raise theefficiency of materials functions.
On the basis of our experiences, customers’ requirementsand ever-mounting cost pressures, we undertook planning forutilising the business potential of the Baltic area more widelythan at present. This means both increasing our production
in Estonia and expanding operations further in the Baltic area.Incap wants to grow and develop its operations primarily inEurope.
Customers are actively seeking rational solutions for arrang-ing their production, and intensive negotiations were heldwith a number of customers concerning the transfer of manu-facturing operations to Incap. The outsourcing of Solotop’sscale manufacturing and the transfer of production operationswere accomplished in a first-rate manner. The process was agood example of the benefits of outsourcing to the customerand it gave a convincing demonstration of Incap’s ability totake on the customer’s production operations.
A brighter futureThe three-year long slump within contract manufacturingappears to be swinging to growth at last. In all customer sec-tors, there are signs of a clear pick-up, and business forecastsare predominantly positive.
Consolidation within the industry will probably moveahead and there will continue to be fierce competition amongelectronics contract manufacturers. The trend towardsoutsourcing will strengthen and design services will grow inimportance. Equipment manufacturers are cutting down thenumber of their suppliers and procuring ever-larger totaldeliveries from the same supplier. Contract manufacturing stillhas great market potential, but growth and success will notcome easily: as cost pressures mount, only those who adaptswiftly and flexibly will come out on top.
Our prime objectives are to improve profitability and in-crease net turnover. We have done a great deal of work toachieve these goals and the trend during the last months ofthe year was already pointing in the right direction.
Improving customer service and deepening customer re-lationships is a key priority for us. We will go after net turnovergrowth primarily by expanding services for present customersand securing a greater role as their partner. Incap is ready forgrowth in demand and prepared to take on additional respon-sibility: we can quickly double our present production vol-ume with minor additional investments, and our integratedservices have been honed in line with even the most demand-ing needs.
I wish to thank our customers, shareholders and partnersin co-operation for the confidence they have shown in us andfor their good co-operation. An especial vote of thanks goesto our personnel, who even when faced with major challenges,have worked with enthusiasm and commitment in order toachieve our shared objectives. ■
Kempele, February 2004
Juhani Hanninen
President and CEO
10 Annual Report 2003
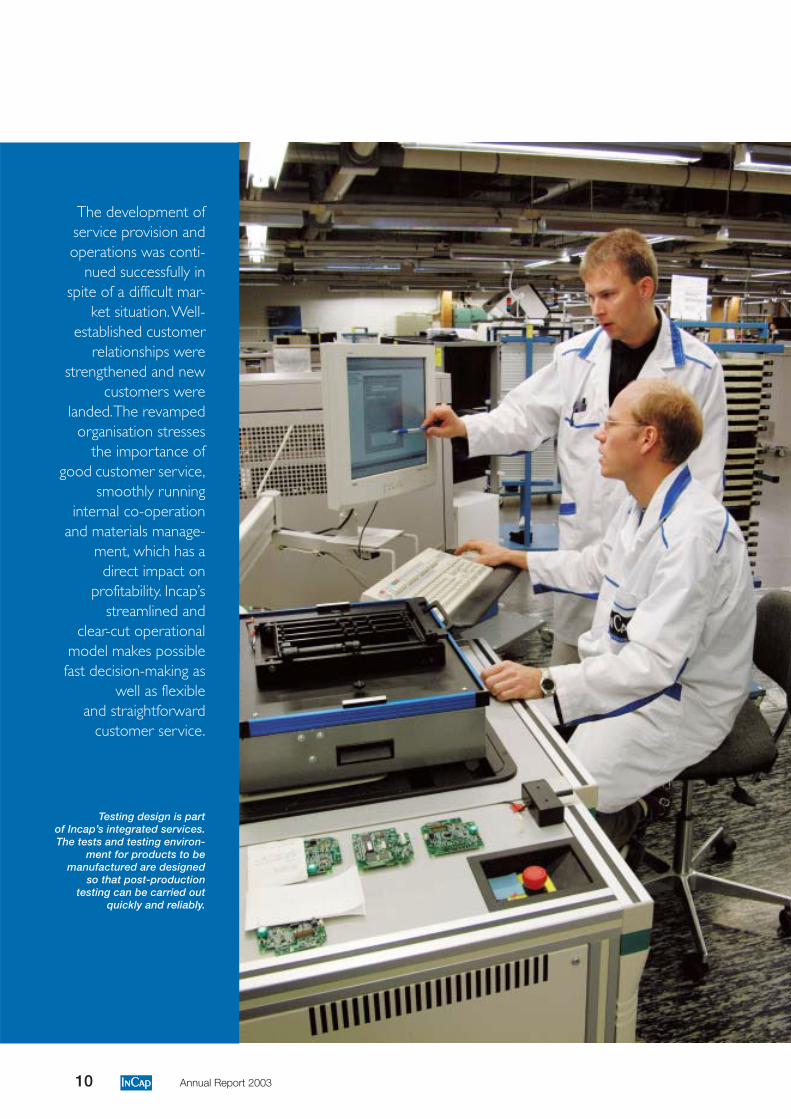
Testing design is partof Incap’s integrated services.The tests and testing environ-
ment for products to bemanufactured are designed
so that post-productiontesting can be carried out
quickly and reliably.
The development ofservice provision andoperations was conti-
nued successfully inspite of a difficult mar-
ket situation. Well-established customer
relationships werestrengthened and new
customers werelanded. The revamped
organisation stressesthe importance of
good customer service,smoothly running
internal co-operationand materials manage-
ment, which has adirect impact on
profitability. Incap’sstreamlined and
clear-cut operationalmodel makes possiblefast decision-making as
well as flexibleand straightforward
customer service.
11Annual Report 2003
Development of Operations
Faint signs of a turn in the market situationManufacturing services for electronics and fabricated prod-ucts continued to face a challenging market situation. Theuncertain outlook for the international economy impactedcustomers’ business operations, and there was still overcapacitywithin electronics manufacturing services. Visibility worsenedfurther, order lead times shortened and the pressure to lowercosts across the entire delivery chain led to tougher pricecompetition. Signals portending a growth in demand strength-ened towards the end of the year, but there was still no clearconsensus in the markets regarding the strength and onset ofthe upswing.
Consolidation within the contract manufacturing sectormoved ahead. Many rearrangements of manufacturing capac-ity were carried out in the field with the aim of achievingoperational efficiency advantages in response to customers’demands for lower costs. Customers’ willingness to outsourceproduction and services strengthened further.
There was a slight increase in the demand from Incap’s cus-tomers in the telecommunications sector right in the firstmonths of the year, and deliveries of products used in telecom-munications networks showed especially marked growthtowards the end of the year. Demand for industrial electronicsproducts was stable and the growth that still beckoned at thebeginning of the year failed to materialise. The market formeasurement technology equipment nevertheless picked upsubstantially in the latter half of the year.
Gratifying trend in customer relationshipsEstablished customer relationships were deepened by expand-ing co-operation to design services and new products andproduct families. Customers continued their efforts to trimthe number of suppliers. On the one hand, this meant atighter competitive situation, but on the other, it also offerednew opportunities. In most situations, Incap’s competitive-ness proved to be soundly based in terms of quality, deliveryreliability and price, and Incap succeeded in improving itsrelative position among its customers. In some cases, wherenot only price but also speed of response had a big significancein the choice of a manufacturer, Incap was competitive evencompared with manufacturers who use low-cost Far Easternlabour, and deliveries were also made to Asia.
One of the most important new customers was Solotop Oy,which outsourced its entire production of scales to Incap. Thetransfer of production was accomplished according to a veryfast timetable fully in line with plans and demonstrated thatIncap is capable of taking charge of production operationsquickly and reliably.
Towards the end of the year, Incap started electronics andassembly co-operation with a major customer in the telecom-munications sector in connection with box-build deliveries,where after manufacture and assembly the product is sentdirectly to the end user in the customer’s own package. Thetimetable was tight and production start-up was carriedthrough swiftly.
New customer-specific teams were set up within electronicsproduction with the aim of stepping up customer service.Contacts between the customer and the team are straightfor-ward and fast, and the team members are highly committed
to serving the customer. In addition, customer responsibili-ties in the area of sales and marketing were fine-tuned and salesteams were strengthened both through internal arrangementsand recruitment.
Positive feedback on customer satisfactionA customer satisfaction survey was carried out in the spring,as in the previous year. The elements measured were customers’views on co-operation, the quality of operations, service,competence, social responsibility and the corporate image. Apositive trend was observed in all sub-areas. The biggestprogress was made in speed of response and the ability to beproactive. Better rankings than in the previous year were alsoregistered for the understanding of customers’ needs, theadequacy of resources and the corporate image in the contractmanufacturing market. The highest marks were given forIncap’s mainline manufacturing services, technology and in-frastructure, product quality, staff professionalism and envi-ronmental awareness. Customers pointed out that Incap’sparticular strengths are understanding customers’ needs, theease of dealing with us and the competence of our people.
Improved service abilityCustomers were paring down the number of their suppliersand seeking to get larger, more integrated service packages froma single supplier – even entire completed products. Incap’scompetitive position was good because our services cover allof a product’s manufacturing stages: the plating and machiningof fabricated frames, the manufacture of electronic compo-nents and sheet metal fabrication, product assembly and in-tegration as well as tuning and testing. Incap’s objective is tooffer integrated deliveries that utilise all the company’s areas
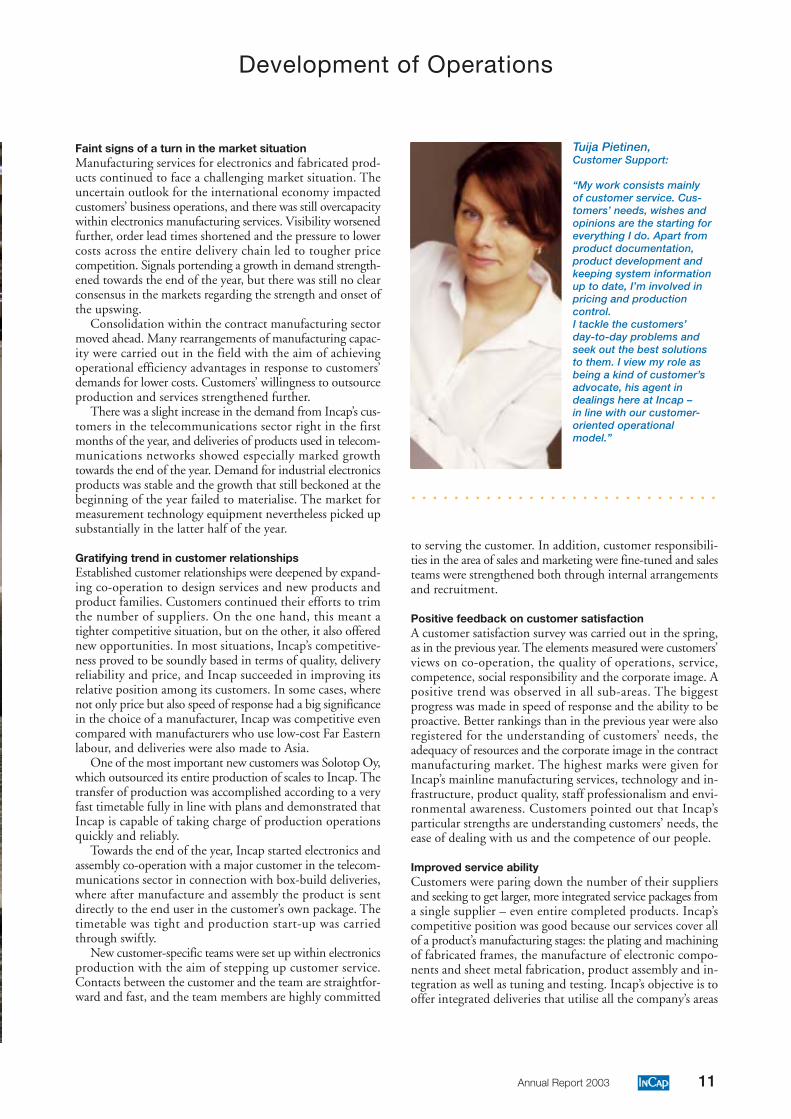
Tuija Pietinen,Customer Support:
“My work consists mainlyof customer service. Cus-tomers’ needs, wishes andopinions are the starting foreverything I do. Apart fromproduct documentation,product development andkeeping system informationup to date, I’m involved inpricing and productioncontrol.I tackle the customers’day-to-day problems andseek out the best solutionsto them. I view my role asbeing a kind of customer’sadvocate, his agent indealings here at Incap –in line with our customer-oriented operationalmodel.”
○ ○ ○ ○ ○ ○ ○ ○ ○ ○ ○ ○ ○ ○ ○ ○ ○ ○ ○ ○ ○ ○ ○ ○ ○ ○ ○ ○ ○
12 Annual Report 2003
Development of Operations
of expertise. To this end, we succeeded in expanding ourdelivery scope from the manufacture of components to finalassembly, notably, in the manufacture of base station compo-nents, equipment for telecommunications networks and scales.The first orders for total deliveries of mast top amplifiers werelanded at the beginning of the year and after a fast ramp-up,actual deliveries got started in the summer. At the end of theyear negotiations were completed on the start-up of high-volume production of base station filters at the Kuressaarefactory during the first quarter of 2004.
The ability to deliver integrated total packages was im-proved by beefing up manufacturing know-how within RFproducts through recruitment and internal training. Theplating, tuning and testing processes for high frequency tech-nology products were developed, and outlays were made onthese operations, among other things, by purchasing newmeasuring equipment. Co-operation between the differentunits was honed by harmonising ways of working and bring-ing together all the factory units into a single ManufacturingServices organisation.
The company had excellent success throughout the yearin placing new products in production and in improvingmanufacturability, and very positive feedback came in frommany customers. The shortening of product life cycles ishighlighting the need to get new products moved from thedesign and prototype phase into mass production quickly andcost-effectively, whilst ensuring high quality. The results of theFast Ramp-up development project that was carried out in2001-2003 and co-ordinated by VTT Industrial Systems(VTT Technical Research Centre of Finland) brought a no-ticeable improvement in operations.
Incap’s design services extend from product design to thedesign of maintenance functions. Demand for these servicespicked up further, and additional resources were obtained fortesting and fabrication design as well as for component en-gineering services. Know-how and service provision weredirected towards mainline product development work, testing
design, selections of materials and improving manufacturabi-lity. Design was increasingly incorporated as part of the de-liveries to customers, and a number of co-operation agree-ments for design service were concluded.
Manufacturing efficiency improvesCompetitiveness was improved successfully by increasingoperational efficiency at all units. The objective is to reach abreak-even profitability level with a much lower capacityutilisation rate than at present.
Pekka Laitila,Electronics Purchasing:
“Nowadays, a contractmanufacturer’s purchasingfunction is all-embracingand lasts throughout theproduct’s life cycle. That’swhy the buyer is involved,right from the designstage, in helping to selectthe right components andmanufacturers. We have di-rect contacts with the lead-ing component manufactur-ers in different parts of theworld and we always seekto find the alternatives thatoffer the greatest overalleconomy.In a purchasing agent’swork no two days arethe same – situations keepchanging and you haveto be flexible.”
○ ○ ○ ○ ○ ○ ○ ○ ○ ○ ○ ○ ○ ○ ○ ○ ○ ○ ○ ○ ○ ○ ○ ○ ○ ○ ○ ○ ○
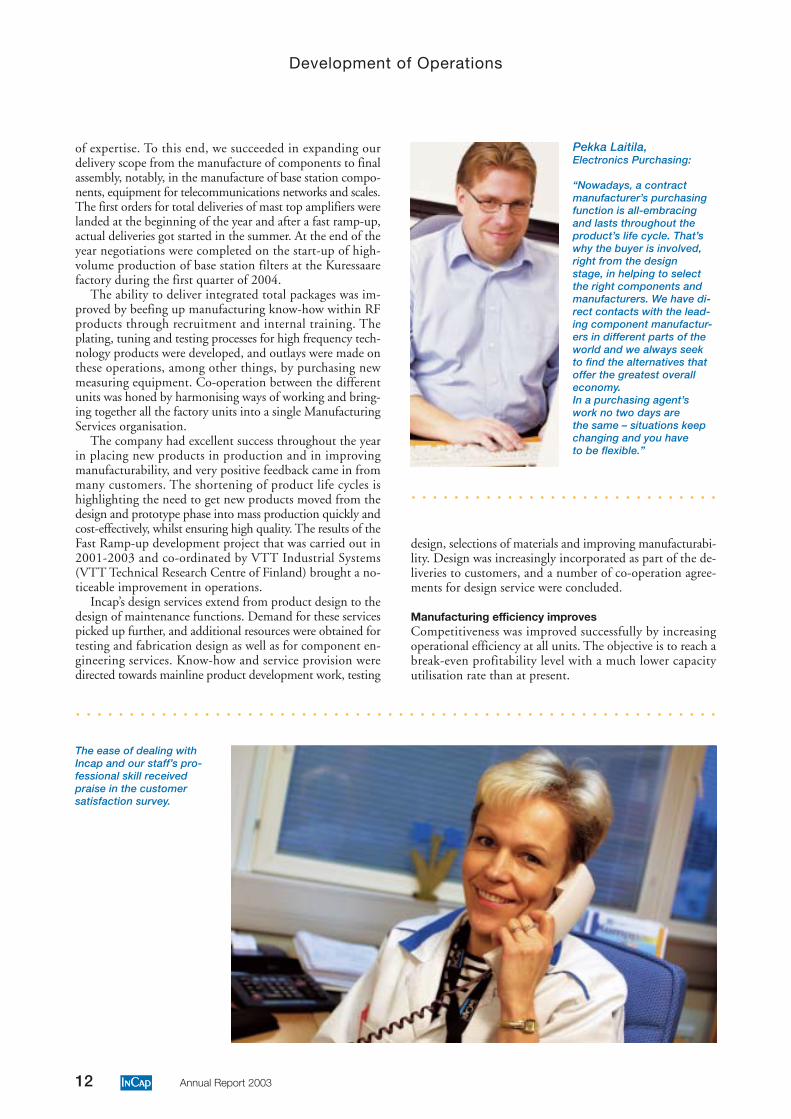
The ease of dealing withIncap and our staff’s pro-fessional skill receivedpraise in the customersatisfaction survey.
○ ○ ○ ○ ○ ○ ○ ○ ○ ○ ○ ○ ○ ○ ○ ○ ○ ○ ○ ○ ○ ○ ○ ○ ○ ○ ○ ○ ○ ○ ○ ○ ○ ○ ○ ○ ○ ○ ○ ○ ○ ○ ○ ○ ○ ○ ○ ○ ○ ○ ○ ○ ○ ○ ○ ○ ○ ○ ○ ○
13Annual Report 2003
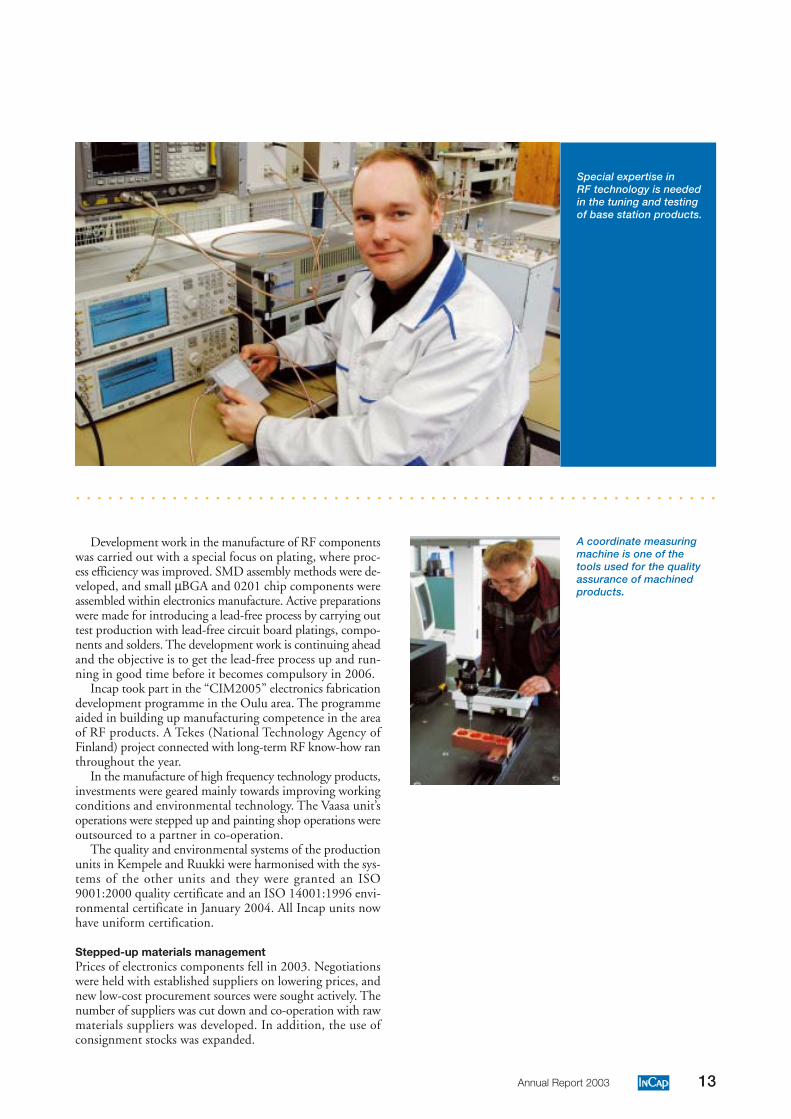
Special expertise inRF technology is neededin the tuning and testingof base station products.
Development work in the manufacture of RF componentswas carried out with a special focus on plating, where proc-ess efficiency was improved. SMD assembly methods were de-veloped, and small µBGA and 0201 chip components wereassembled within electronics manufacture. Active preparationswere made for introducing a lead-free process by carrying outtest production with lead-free circuit board platings, compo-nents and solders. The development work is continuing aheadand the objective is to get the lead-free process up and run-ning in good time before it becomes compulsory in 2006.
Incap took part in the “CIM2005” electronics fabricationdevelopment programme in the Oulu area. The programmeaided in building up manufacturing competence in the areaof RF products. A Tekes (National Technology Agency ofFinland) project connected with long-term RF know-how ranthroughout the year.
In the manufacture of high frequency technology products,investments were geared mainly towards improving workingconditions and environmental technology. The Vaasa unit’soperations were stepped up and painting shop operations wereoutsourced to a partner in co-operation.
The quality and environmental systems of the productionunits in Kempele and Ruukki were harmonised with the sys-tems of the other units and they were granted an ISO9001:2000 quality certificate and an ISO 14001:1996 envi-ronmental certificate in January 2004. All Incap units nowhave uniform certification.
Stepped-up materials managementPrices of electronics components fell in 2003. Negotiationswere held with established suppliers on lowering prices, andnew low-cost procurement sources were sought actively. Thenumber of suppliers was cut down and co-operation with rawmaterials suppliers was developed. In addition, the use ofconsignment stocks was expanded.
○ ○ ○ ○ ○ ○ ○ ○ ○ ○ ○ ○ ○ ○ ○ ○ ○ ○ ○ ○ ○ ○ ○ ○ ○ ○ ○ ○ ○ ○ ○ ○ ○ ○ ○ ○ ○ ○ ○ ○ ○ ○ ○ ○ ○ ○ ○ ○ ○ ○ ○ ○ ○ ○ ○ ○ ○ ○ ○ ○
A coordinate measuringmachine is one of thetools used for the qualityassurance of machinedproducts.
14 Annual Report 2003
Development of Operations
Materials account for a major portion of the costs of con-tract manufacturing for electronics and fabricated products,and they have an essential bearing on the profitability of op-erations. One of the main objectives of the new materials or-ganisation is purposeful development of materials and pur-chasing functions. The aim is to reduce the value of inven-tories significantly and to improve quickly the inventoryturnover rate. Especial attention will be paid to the usabilityof materials, because as product life cycles grow shorter, thereis a greater risk of unsaleable raw materials.
Expanded operations in the Baltic countriesProduction at the unit located in Kuressaare, Estonia, grewthanks both to an increase in the manufacturing volumes forpresent customers and to landing new customers. Integrateddeliveries accounted for a steadily growing share of the unit’smanufacturing operations, and know-how connected with itwas built up. In addition, equipment that is to be used inmanufacturing RF products was purchased.
The operational model of the Kuressaare unit was broughtup to the same speed and flexibility as the electronics produc-tion at the company’s sites in Finland. When Estonia joins theEU in May 2004, co-operation and logistics between Kures-saare and the units in Finland will be simpler and even faster.
The objective is to boost production in Estonia and to ex-pand operations in the Baltic area further inaccordance with customers’ needs.
A streamlined corporate structureIncap’s operations were streamlined, primarilyby simplifying the corporate structure. JMCTools Oy, which was acquired in 2002, wasdissolved through voluntary liquidation andthe company’s operations were transferred tothe parent company at the end of May. Afterthe arrangement, the Incap Group has twosubsidiaries: Incap Electronics Estonia OÜand Ultraprint Oy.
Business development prioritiesThe paramount near-term objective is toimprove profitability by increasing produc-tivity and by stepping up materials manage-ment processes. Growth in net turnover will
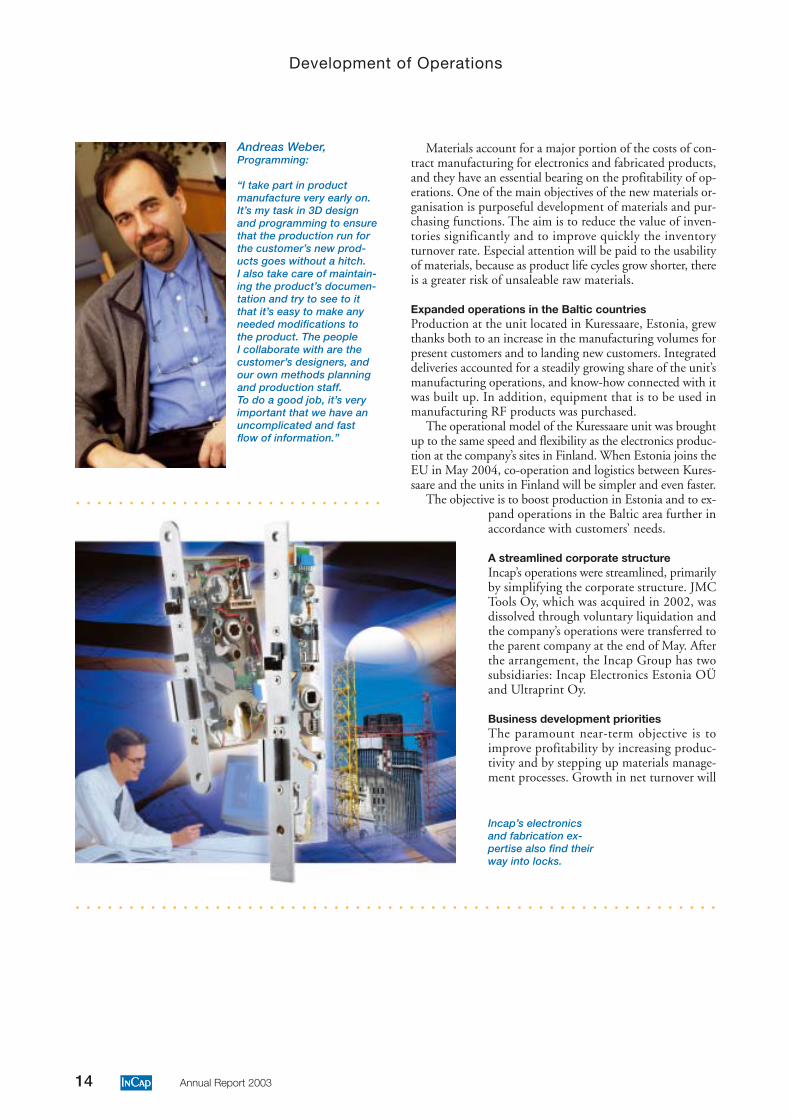
Andreas Weber,Programming:
“I take part in productmanufacture very early on.It’s my task in 3D designand programming to ensurethat the production run forthe customer’s new prod-ucts goes without a hitch.I also take care of maintain-ing the product’s documen-tation and try to see to itthat it’s easy to make anyneeded modifications tothe product. The peopleI collaborate with are thecustomer’s designers, andour own methods planningand production staff.To do a good job, it’s veryimportant that we have anuncomplicated and fastflow of information.”
○ ○ ○ ○ ○ ○ ○ ○ ○ ○ ○ ○ ○ ○ ○ ○ ○ ○ ○ ○ ○ ○ ○ ○ ○ ○ ○ ○ ○
○ ○ ○ ○ ○ ○ ○ ○ ○ ○ ○ ○ ○ ○ ○ ○ ○ ○ ○ ○ ○ ○ ○ ○ ○ ○ ○ ○ ○ ○ ○ ○ ○ ○ ○ ○ ○ ○ ○ ○ ○ ○ ○ ○ ○ ○ ○ ○ ○ ○ ○ ○ ○ ○ ○ ○ ○ ○ ○ ○
Incap’s electronics andfabrication expertise alsofind their way into locks.
Incap’s electronicsand fabrication ex-pertise also find theirway into locks.
15Annual Report 2003
be sought primarily by expanding co-operation with presentcustomers.
Incap’s flexible way of working, versatile expertise and abil-ity to respond quickly are major strengths, especially in manu-facturing products that are made in several versions designedfor the needs of different user groups. Incap is very competitivein the manufacture of such “high mix – low volume” prod-ucts because its expertise is well suited to the small and me-dium-sized production series required for these products.
Outsourcing is gaining ground, and manufacturers of elec-tronic equipment are shifting the provision of production anddesign services to contract manufacturers who are able toassume overall responsibility for their products. Incap’s totaldelivery ability and wide range of services, together with itsways of working that are grounded in the customers’ needs,offer the company excellent opportunities to grow and de-velop. ■
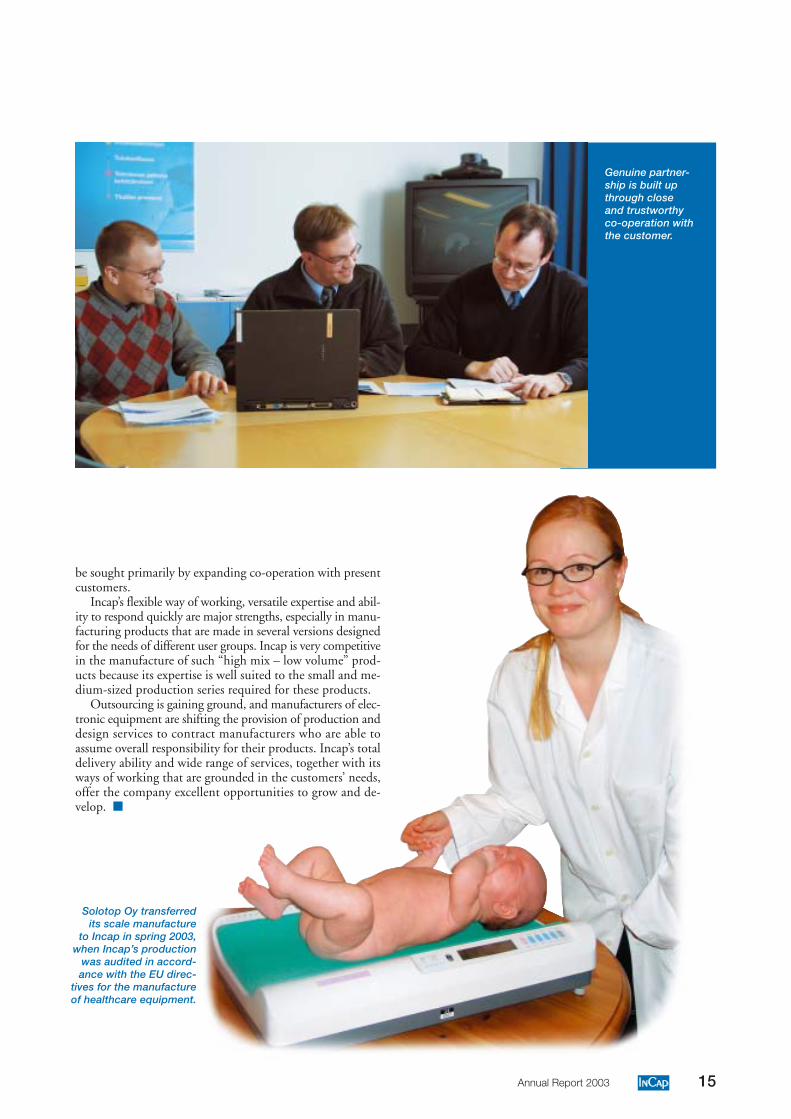
Solotop Oy transferredits scale manufacture
to Incap in spring 2003,when Incap’s production
was audited in accord-ance with the EU direc-
tives for the manufactureof healthcare equipment.
Genuine partner-ship is built upthrough closeand trustworthyco-operation withthe customer.

16 Annual Report 2003
Personnel
One IncapThe Human Resources management function supports thecreation of a unified company culture. The aim is to bring theways of working and practices of the different units closertogether so that the personnel work with full commitment toachieving the company’s common goals.
JMC Tools Oy’s functions continued to be integrated intothe rest of the Group in 2003 by harmonising the factories’ways of working. Right from the start of the year, fast-pacedand successful co-operation got under way between the dif-ferent units in carrying out for the first integrated deliveriesof base station products, and operational models were fine-tuned all year long. Internal development now takes placethroughout the company in accordance with the same prin-ciples because in January 2004 the Kempele and Ruukki unitswere granted the same quality and environmental certifica-tions as the other factories.
New organisationThe Group’s new organisation came into effect at the begin-ning of November. The aim of the realignment is to channelresources towards developing functions that are essential forachieving business success. The customer interface was stream-lined by bringing sales activities together into a single teamand the role of materials management was emphasised byturning it into an independent unit. Furthermore, manufac-turing operations were stepped up by centralising all themanufacturing services within a single organisational unit.
Competence developmentThe development priority was know-how for manufacturingbase station products. This expertise was augmented boththrough recruitment and internal training sessions. Trainingwas carried out both in co-operation with customers and bymeans of external experts.
DownsizingMaintaining competitiveness in a challenging market situationresulted in pressure to step up operational efficiency. Cost
structures were examined critically all year long, and variousstaff adjustment measures ranging from working time arrange-ments to pension agreements were applied. Although layoffshad to be made at nearly all the units, the situation improvedtowards the end of the year, when the number of laid-off staffhad fallen to 51 employees, from 84 at the start of the year.
Incentive systemProgress was made in building the Group’s unified bonussystem, and the scheme was expanded from the beginning of2004. The way the system works in practice is assessed regu-larly and it is recast as necessary to ensure motivation andfairness.
Personnel satisfaction surveyAn internal atmosphere survey was carried out amongst thepersonnel in November–December with the aim of findingout the entire staff ’s views on their own work, their job,workplace co-ordination and job atmosphere as well as pro-posals for developing these areas. The response rate was ex-cellent: 91%. The high level of participation makes the resultsreliable and is an indication of the staff ’s willingness to par-ticipate in developing operations.
The survey results became available in January 2004. Ac-cording to them, the staff consider Incap’s strengths to be ef-ficient operations and the quality of its products and services.The staff estimate that the external corporate image reflectsa company that is service-minded, high quality and flexible.The most important areas for development turned out to bethe working environment, training opportunities and moti-vation-building compensation.
The priority for internal development in 2004 is the subjectareas that were pointed up in the personnel survey. On thebasis of the results, a few main development areas will beselected and a purposeful effort will be launched to improvethem. Progress will be measured by means of repeat surveysat regular intervals.
Personnel by locationat 31 December 2003
Age breakdown of personnel Years of employment
A capable and committed staff ensures smoothly running operations and flexiblecustomer service. The objective of Incap’s human resources policy is to supportthe staff ’s development, promote independent working and taking responsibilitywhilst encouraging our people to engage in co-operation for high performance.
■ Vuokatti■ Kuressaare■ Helsinki■ Vaasa■ Kempele■ Ruukki
Total 552
■ 19–29 yrs.■ 30–39■ 40–49■ 50–65
■ Over 40 yrs.■ 30–39■ 20–29■ 10–19■ 5–9■ Under 5 yrs.
17Annual Report 2003
Quality and Environment
The environmentThe significant environmental effects of production are ana-lysed on a facility-by-facility basis in terms of defined bench-marks and goals. The achievement of objectives is monitoredcontinuously as part of daily operations and by conductinga quarterly management review.
In 2003 there were no significant new environmentalprotection activities, but the changes implemented in theprevious year were maintained and developed
Operations do not involve environmental risks, and safe-guarding and developing measures that are part of the envi-ronmental system are being carried out across the units.
Goals and benchmarksDuring 2003 a process aiming at obtaining quality and en-vironmental certification for the Kempele and Ruukki facilitieswas started. The work moved ahead in line with plans and the
systems at the units were certified in January 2004.The majority of the environmental goals were achieved.
The goals for 2004 are more ambitious than in 2003 whilethe benchmarks are largely similar.
A customer satisfaction survey that was carried out in 2003indicated that customer satisfaction has improved markedlyover the year-ago results in all sub-areas.
Preparing for future environmental requirementsDuring 2003 Incap participated in projects aiming at famil-iarising the employees with lead-free soldering and the changesthis will cause to the soldering processes and product char-acteristics. In 2004, pilot series will be continued using lead-free soldering and components. The objective is to bringprocesses into line with the RoHS directive by the beginningof 2006. ■
All Incap units have quality and environmental systems, in accordance with theISO9001:2000/ISO14001:1996 standards, which are used as tools for the continual im-provement of operations. Quality and environmental awareness is part of the personnel’sprofessional skill, and it is emphasised in human resources development and in training.
18 Annual Report 2003
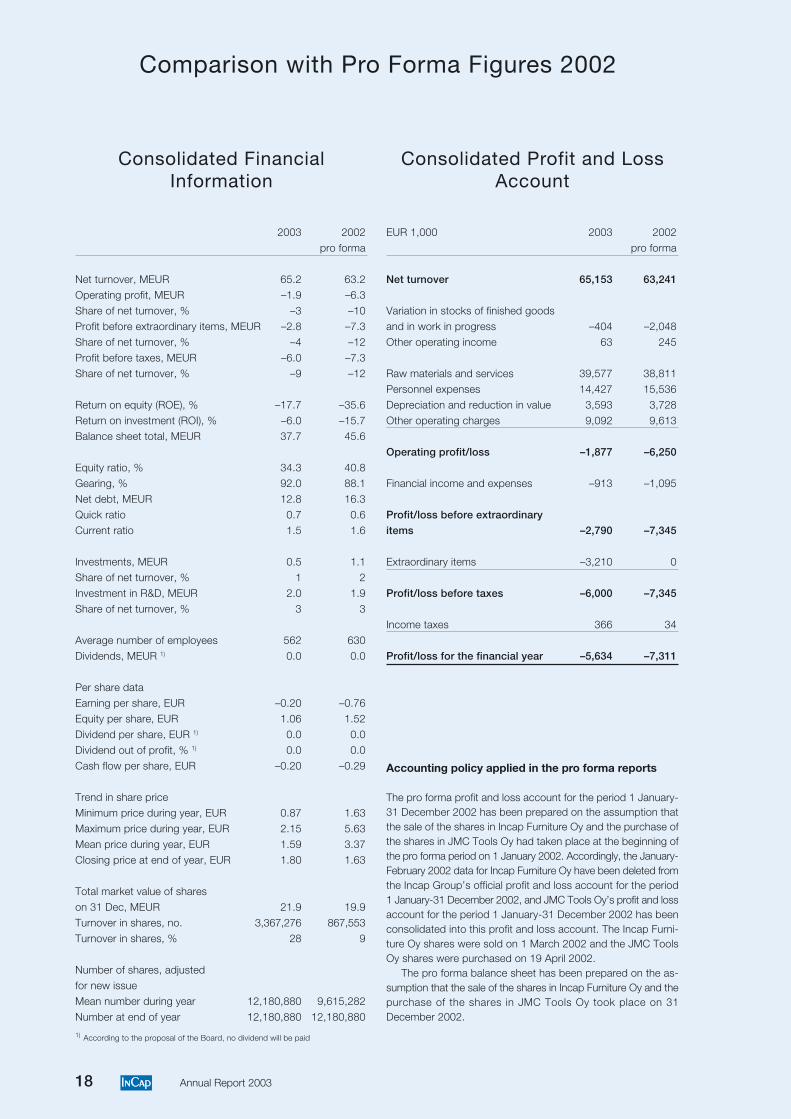
2003 2002pro forma
Net turnover, MEUR 65.2 63.2Operating profit, MEUR –1.9 –6.3
Share of net turnover, % –3 –10Profit before extraordinary items, MEUR –2.8 –7.3Share of net turnover, % –4 –12
Profit before taxes, MEUR –6.0 –7.3Share of net turnover, % –9 –12
Return on equity (ROE), % –17.7 –35.6Return on investment (ROI), % –6.0 –15.7Balance sheet total, MEUR 37.7 45.6
Equity ratio, % 34.3 40.8Gearing, % 92.0 88.1
Net debt, MEUR 12.8 16.3Quick ratio 0.7 0.6Current ratio 1.5 1.6
Investments, MEUR 0.5 1.1Share of net turnover, % 1 2
Investment in R&D, MEUR 2.0 1.9Share of net turnover, % 3 3
Average number of employees 562 630Dividends, MEUR 1) 0.0 0.0
Per share dataEarning per share, EUR –0.20 –0.76Equity per share, EUR 1.06 1.52
Dividend per share, EUR 1) 0.0 0.0Dividend out of profit, % 1) 0.0 0.0Cash flow per share, EUR –0.20 –0.29
Trend in share priceMinimum price during year, EUR 0.87 1.63
Maximum price during year, EUR 2.15 5.63Mean price during year, EUR 1.59 3.37Closing price at end of year, EUR 1.80 1.63
Total market value of shareson 31 Dec, MEUR 21.9 19.9
Turnover in shares, no. 3,367,276 867,553Turnover in shares, % 28 9
Number of shares, adjustedfor new issueMean number during year 12,180,880 9,615,282
Number at end of year 12,180,880 12,180,880
1) According to the proposal of the Board, no dividend will be paid
EUR 1,000 2003 2002pro forma
Net turnover 65,153 63,241
Variation in stocks of finished goodsand in work in progress –404 –2,048Other operating income 63 245
Raw materials and services 39,577 38,811Personnel expenses 14,427 15,536
Depreciation and reduction in value 3,593 3,728Other operating charges 9,092 9,613
Operating profit/loss –1,877 –6,250
Financial income and expenses –913 –1,095
Profit/loss before extraordinary
items –2,790 –7,345
Extraordinary items –3,210 0
Profit/loss before taxes –6,000 –7,345
Income taxes 366 34
Profit/loss for the financial year –5,634 –7,311
Comparison with Pro Forma Figures 2002
Consolidated FinancialInformation
Consolidated Profit and LossAccount
Accounting policy applied in the pro forma reports
The pro forma profit and loss account for the period 1 January-31 December 2002 has been prepared on the assumption thatthe sale of the shares in Incap Furniture Oy and the purchase ofthe shares in JMC Tools Oy had taken place at the beginning ofthe pro forma period on 1 January 2002. Accordingly, the January-February 2002 data for Incap Furniture Oy have been deleted fromthe Incap Group’s official profit and loss account for the period1 January-31 December 2002, and JMC Tools Oy’s profit and lossaccount for the period 1 January-31 December 2002 has beenconsolidated into this profit and loss account. The Incap Furni-ture Oy shares were sold on 1 March 2002 and the JMC ToolsOy shares were purchased on 19 April 2002.
The pro forma balance sheet has been prepared on the as-sumption that the sale of the shares in Incap Furniture Oy and thepurchase of the shares in JMC Tools Oy took place on 31December 2002.
19Annual Report 2003
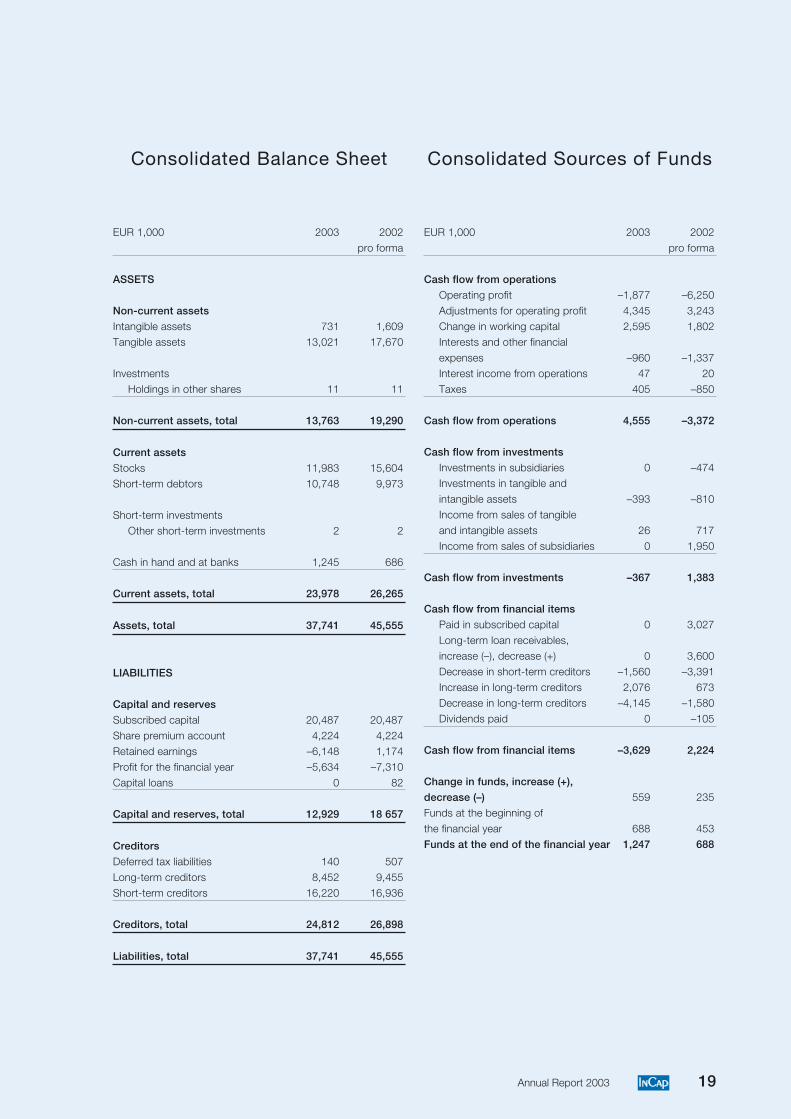
EUR 1,000 2003 2002pro forma
ASSETS
Non-current assets
Intangible assets 731 1,609Tangible assets 13,021 17,670
InvestmentsHoldings in other shares 11 11
Non-current assets, total 13,763 19,290
Current assets
Stocks 11,983 15,604Short-term debtors 10,748 9,973
Short-term investmentsOther short-term investments 2 2
Cash in hand and at banks 1,245 686
Current assets, total 23,978 26,265
Assets, total 37,741 45,555
LIABILITIES
Capital and reserves
Subscribed capital 20,487 20,487
Share premium account 4,224 4,224Retained earnings –6,148 1,174Profit for the financial year –5,634 –7,310
Capital loans 0 82
Capital and reserves, total 12,929 18 657
Creditors
Deferred tax liabilities 140 507
Long-term creditors 8,452 9,455Short-term creditors 16,220 16,936
Creditors, total 24,812 26,898
Liabilities, total 37,741 45,555
EUR 1,000 2003 2002pro forma
Cash flow from operations
Operating profit –1,877 –6,250
Adjustments for operating profit 4,345 3,243Change in working capital 2,595 1,802Interests and other financial
expenses –960 –1,337Interest income from operations 47 20Taxes 405 –850
Cash flow from operations 4,555 –3,372
Cash flow from investments
Investments in subsidiaries 0 –474Investments in tangible and
intangible assets –393 –810Income from sales of tangibleand intangible assets 26 717
Income from sales of subsidiaries 0 1,950
Cash flow from investments –367 1,383
Cash flow from financial items
Paid in subscribed capital 0 3,027
Long-term loan receivables,increase (–), decrease (+) 0 3,600Decrease in short-term creditors –1,560 –3,391
Increase in long-term creditors 2,076 673Decrease in long-term creditors –4,145 –1,580Dividends paid 0 –105
Cash flow from financial items –3,629 2,224
Change in funds, increase (+),
decrease (–) 559 235Funds at the beginning of
the financial year 688 453Funds at the end of the financial year 1,247 688
Consolidated Sources of FundsConsolidated Balance Sheet
20 Annual Report 2003
Report of the Board of Directors, 2003
Incap Corporation retained its established position as asupplier of manufacturing services. The continued slackdemand in the telecommunications network sector had anespecially marked impact on the operations of the Group’sunits that manufacture network and base station products.Despite low manufacturing volumes, productivity improvedat all the factories. The pick-up in the market towards theend of the year increased the capacity utilisation rate andhad a positive effect on earnings.
Group financial performance in 2003Consolidated net turnover was EUR 65.2 million, up 3%on the pro forma turnover in 2002 (63.2 million). TheGroup’s officially reported net turnover in 2002 was EUR69.0 million.
The Group reported an operating loss of EUR 1.9 mil-lion, i.e. a 70% improvement on the pro forma operatingresult in 2002 (operating loss: 6.3 million). The officiallyreported operating result in 2002 was a loss of EUR 3.8million.
Earnings per share were EUR 0.20 negative (pro forma:0.76 negative, reported: 0.49 negative) and equity per sharewas EUR 1.06 (1.52). The Group’s equity ratio was 34%(41%) and total assets were EUR 37.7 million (45.6million).
The operating result for 2003 includes a total of EUR1.6 million of non-recurring costs resulting from efficiency-boosting and downsizing arrangements as well as fromunsaleable stocks. Due to structural rearrangement, non-recurring write-downs concerning machinery and equip-ment were entered in extraordinary expenses to a total ofEUR 3.2 million. The aim of the structural rearrangementis to step up capacity utilisation and to improve produc-tivity. Machinery is reorganised between units, productionis centralised to the most efficient machines and obsoleteequipment is decommissioned. The arrangement will becarried out during 2004.
Result of the fourth quarterThe last quarter of 2003 was the year’s best in terms of bothnet turnover and the operational result. Net turnover forthe period increased by 31% on the previous quarter andwas EUR 20.0 million, representing growth of 24% on thesame quarter a year ago (Oct.-Dec. 2002: 16.2 million).Net turnover increased thanks to the revival in demand inthe telecommunications sector and among manufacturersof measurement technology equipment.
The fourth-quarter operating result was burdened bynon-recurring write-downs on stocks, to a total amount ofEUR 0.6 million, pushing the operating result into the redat EUR 0.1 million negative. The overall result of opera-tions was nevertheless in the black, as it was in the previousquarter. The earnings improvement was due mainly to thegrowth in production volumes. Compared with the sameperiod of 2002, the operating loss figure improved by 81%.Earnings per share in the period were EUR 0.01 negative(0.08 negative).
Trend in the operating environmentThere was still an overhang of excess capacity in the sup-ply of electronics manufacturing services in 2003. Consoli-dation in the sector moved ahead as mass production wasmoved to countries with a low cost level. Manufacturers ofequipment for the electronics industry cut down thenumber of their suppliers and sought close co-operationwith a few reliable suppliers. The low demand and toughcompetition that have prevailed for three years now led toa declining price trend and increasing efforts to achieve costsavings across the entire delivery chain. The upswing in theeconomy, which was forecast at the start of the year, did notmaterialise in the way that was expected.
Development of the Group’s operationsIn line with Incap’s aim to supply integrated product en-tities, all of the company’s areas of expertise were utilisedin the deliveries of base station components that got un-der way at the beginning of the year. The manufacture ofproducts involved machining, plating, PCB assembly, sheetmetal fabrication, product assembly, integration, tuning andtesting.
In the face of tougher competition, customers were seek-ing ever-newer cost savings, thereby increasing the need forthe continuous enhancement of operations. With the aimof lowering manufacturing costs, a greater amount of elec-tronics manufacture and assembly was done in Estonia.
At the factories in Kempele and Ruukki, quality and en-vironmental systems were built and they were granted anISO 9001:2000 quality certificate and an ISO 14001:1996environmental certificate in January 2004. All the Group’sfactories have the same types of certification.
The results of the customer satisfaction survey improvedin all the subareas of customer service compared with thecorresponding survey in 2002. Customers identified Incap’smain strengths as being its understanding of customers’needs, the ease of dealing with us and the competence ofour people.
Business development prioritiesThe paramount near-term objective is to improve profit-ability by increasing productivity, stepping up materialsmanagement processes and raising the capital turnover rate.Growth in net turnover will be sought primarily by expand-ing co-operation with present customers.
Incap’s manufacturing services and way of working aresuited to most customers in the electronics and productfabrication sectors, and the company wants to maintain itsversatile customer mix. Instead of focusing on a singlecustomer sector, Incap is concentrating on customer-specificservice and tailoring its operations in accordance with eachcustomer’s needs.
Incap is amplifying co-operation with its customers byoffering ever more extensive integrated services and byassuming total responsibility for the customer’s productionand related services.
Incap’s flexible way of working, versatile expertise and
21Annual Report 2003
ability to respond quickly are major strengths, especially inmanufacturing products that are made in several versionsdesigned for the needs of different user groups. Incap is verycompetitive in the manufacture of such “high mix - lowvolume” products because its expertise is well suited to thesmall and medium-sized production series required for theseproducts.
FinancingThe Group’s liquidity was satisfactory: the quick ratio was0.7 (0.6) and the current ratio 1.5 (1.6). Cash flow fromoperations was EUR 4.6 million (pro forma: 3.4 millionnegative, reported: 1.9 million negative) and the change incash flows was an increase of EUR 0.6 million (pro formaincrease of 0.2 million, reported decrease of 0.6 million).The result for the period includes non-recurring expensesthat do not affect cash flow.
Net financial expenses came to EUR 0.9 million (proforma: 1.1 million, reported: 1.0 million). Net debt totalledEUR 12.8 million (16.3 million) and the gearing ratio was92% (88%). Interest-bearing net debt amounted to EUR11.9 million at the close of the financial year (16.1 million).The equity ratio remained satisfactory and was 34% (41%).
Capital expendituresThe Group’s gross capital expenditures in the report periodtotalled EUR 0.5 million (1.1 million) or about 1% of netturnover (2%). Capital expenditures were made mainly onenvironmental technology and testing equipment for RFproducts.
Research and developmentSpending on research and development amounted to EUR2.0 million, or 3% of net turnover (1.9 million, 3% of netturnover). Research and development focused, notably, onimproving plating, tuning and testing processes for productsincorporating high frequency technology as well as thedevelopment of a lead-free process. Research and develop-ment expenditure has been booked to expenses for theperiod.
Personnel and managementAt the beginning of the year the Incap Group had a pay-roll of 589 employees and at the end of the year it had 552employees. The number of laid-off staff decreased from 84employees at the beginning of the year to 51 employees at31 December 2003. New staff were hired mainly for sales,the plating process and materials management.
The company’s president and CEO up to 7 July wasSeppo Ropponen, after which Chief Financial OfficerRauni Nokela served as acting CEO. Juhani Hanninen,M.Sc. (Eng.) took over as the Group’s president and CEOon 1 September. Tuula Ylimäki, M.Sc. (Econ.), was ap-pointed as the Group’s chief financial officer effective1 October. Ari Turunen, a technician, was appointed VicePresident of Materials Management as from 1 November.
The members of the Group’s Management Team were
Juhani Hanninen (President and CEO), Hannele Pöllä(Communications and Investor Relations), Petri Saari (Salesand Marketing), Timo Sonninen (Manufacturing Services),Ari Turunen (Materials Management) and Tuula Ylimäki(Finance and Administration).
Personnel surveyAn internal atmosphere survey was carried out amongst thepersonnel in November-December with the aim of find-ing out the staff ’s views on their own work, their job andworkplace co-ordination as well as proposals for developingthese areas. The participation rate in the survey was 91%.According to the survey results, the staff consider Incap’sstrengths to be efficient operations and the quality of itsservice. The most important areas for development turnedout to be the working environment, training opportuni-ties and motivation-building compensations.
Organisational revampThe Group’s new organisation came into effect at the be-ginning of November. Customer relationship managementwas improved and streamlined by bringing the sales func-tions together into a single team. The role of materials man-agement was emphasised by turning it into an independentunit. Furthermore, manufacturing operations were steppedup by centralising all the manufacturing services within asingle organisational unit.
Group structureIn order to simplify the Group structure, JMC Tools Oy,which became a Group subsidiary in 2002, was merged intothe parent company by way of a voluntary dissolution pro-cedure. The JMC Tools Oy business was transferred to theparent company at the beginning of June, and the disso-lution was reported to the Trade Register in accordance witha resolution of an extraordinary general meeting of theshareholders of JMC Tools Oy on 23 December 2003. OfJMC Tools’ loss on dissolution, EUR 6.3 million has beenbooked to the parent company’s extraordinary expenses anddepreciation. The remaining goodwill will be amortised inthe parent company’s profit and loss account over 5 years.After the arrangement, the Incap Group has two subsidi-aries: Incap Electronics Estonia OÜ and Ultraprint Oy.
Board of DirectorsThe Annual General Meeting held on April 25, 2003, re-elected Seppo Arponen, Kalevi Laurila, Markku Puskala,Jorma Terentjeff and Juhani Vesterinen to seats on theBoard of Directors. The Board of Directors re-elected JormaTerentjeff chairman.
AuditorsThe independent firm of accountants Ernst & Young Oywas the company’s auditor, with Rauno Sipilä, AuthorisedPublic Accountant, acting as chief auditor.
22 Annual Report 2003
Report of the Board of Directors, 2003
Introduction of IFRS standards (IAS)The Incap Group will go over to reporting in accordancewith the international IFRS standards in 2005. Preparationsfor introducing the standards were started in 2003, and theproject has moved ahead according to plans. Decisions onthe accounting policies for financial statements will be takenin 2004, at which time the figures for the opening IFRSbalance sheet will be calculated, along with the comparisoninformation for 2004.
Shares and trading informationThe number of shares is 12,180,880. The price of the IncapCorporation share varied in the range of EUR 2.15 to EUR0.87, and the share price at the close of the year was EUR1.80. Share turnover was 28%.
At the end of the report period, the company had 834shareholders, or 51% more than at the beginning of theyear. The company’s market capitalisation at December 31,2003 was EUR 21.9 million.
Events related to shares and shareholdingsOn 21 January 2003 the Board of Directors exercised theauthorisation it had received at the 2002 Annual GeneralMeeting through an issue of a total of 702,000 warrantsdirected at Varma Mutual Pension Insurance Companyentitling the holders of said warrants to subscribe for anequal number of shares. The subscription price of the sharesis determined according to the mathematical average of theclosing prices of the company’s share during the period from3 February to 30 May 2003, but nevertheless such that thesubscription price is a minimum of EUR 2.50 per share.The subscription period for the shares commenced on1 June 2003 and it ends on 31 December 2005.
If Varma exercises its option rights-based warrants intheir entirety, the shareholding of Varma Mutual PensionInsurance Company in Incap Corporation will exceed1/20 of the company’s voting rights and share capital.Varma would hold 702,000 shares, representing 5.4% ofIncap Corporation’s share capital and voting rights.
In a transaction completed on 2 December 2003, JormaTerentjeff sold 1,161,700 Incap Corporation shares to IrishLife International Limited, whereby Irish Life InternationalLimited became an Incap Corporation shareholder, witha 9.5% stake in the company. Following the transaction,Jorma Terentjeff ’s proportion of Incap shares is 2.5%.
Annual General MeetingThe Annual General Meeting of Incap Corporation washeld on Friday, 25 April 2003 in Helsinki. The AnnualGeneral Meeting authorised the Board of Directors todecide on increasing the share capital, granting stock op-tions and/or issuing convertible bonds. On the basis of theauthorisation, the share capital can be increased by a maxi-mum of EUR 4,092,775.68. The authorisation is valid upto 25 April 2004. The Board of Directors did not exercisethe authorisation during 2003.
The Annual General Meeting amended the Articles ofAssociation in accordance with the Board of Directors’proposal, whereby the company’s domicile was changedfrom Helsinki to Oulu.
DividendThe Board of Directors will propose to the Annual Gen-eral Meeting convening on 20 April 2004 that the loss forthe financial year be transferred to the retained earningsaccount and that no dividend be distributed for the 2003financial year.
Outlook for 2004Signs of a revival in demand can be seen in a number ofindustries. Incap’s objective is to strengthen its role as apartner of its present customers, and consolidated netturnover is estimated to grow in 2004 at least in line withthe market growth.
Profitability will be improved by increasing cost-effi-ciency, especially within production and materials manage-ment. The objective is to post an operating result that is inthe black and clearly better than the figure reported in 2003.
23Annual Report 2003
Consolidated Profit and Loss Account
EUR 1,000 Note 2003 2002
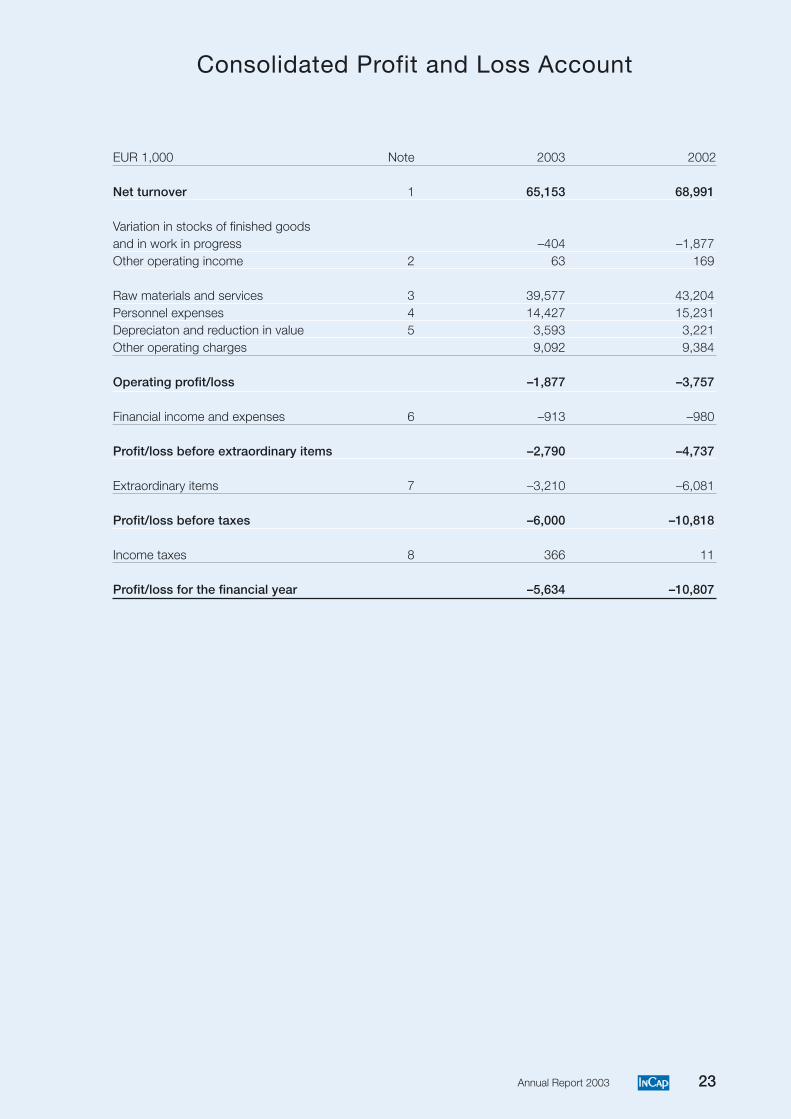
Net turnover 1 65,153 68,991
Variation in stocks of finished goodsand in work in progress –404 –1,877Other operating income 2 63 169
Raw materials and services 3 39,577 43,204Personnel expenses 4 14,427 15,231Depreciaton and reduction in value 5 3,593 3,221Other operating charges 9,092 9,384
Operating profit/loss –1,877 –3,757
Financial income and expenses 6 –913 –980
Profit/loss before extraordinary items –2,790 –4,737
Extraordinary items 7 –3,210 –6,081
Profit/loss before taxes –6,000 –10,818
Income taxes 8 366 11
Profit/loss for the financial year –5,634 –10,807
24 Annual Report 2003
Consolidated Balance Sheet
EUR 1,000 Note 2003 2002
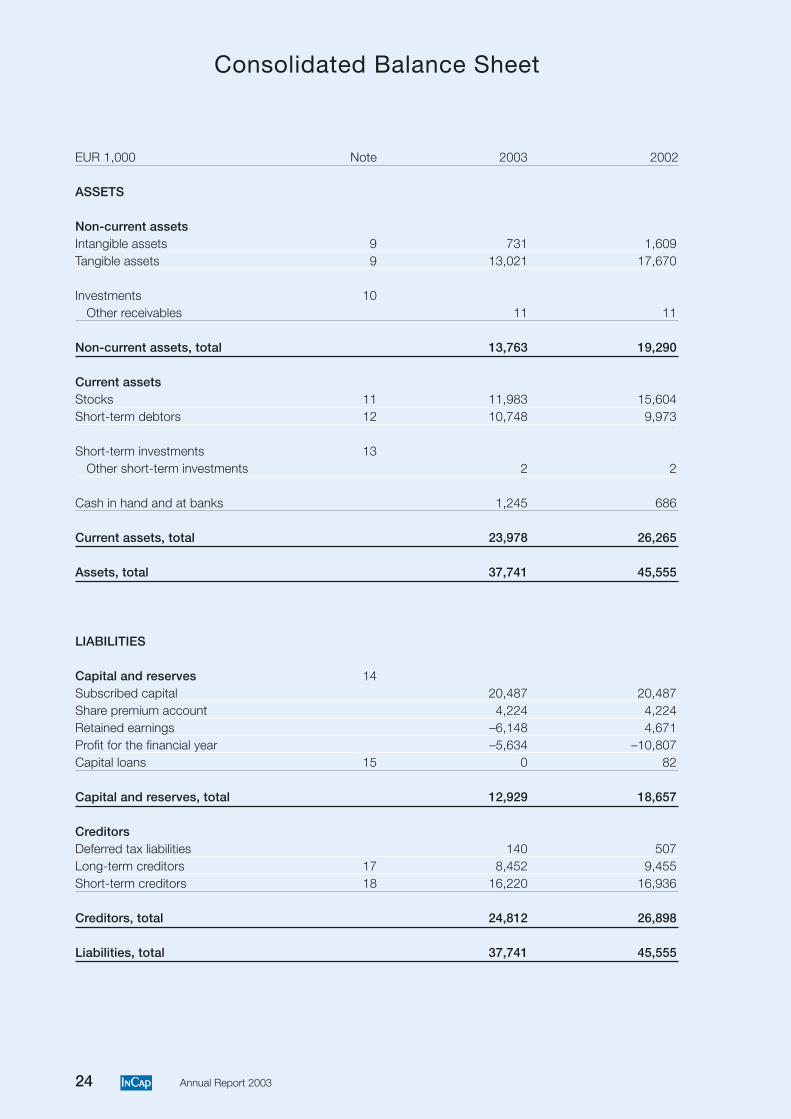
ASSETS
Non-current assetsIntangible assets 9 731 1,609Tangible assets 9 13,021 17,670
Investments 10Other receivables 11 11
Non-current assets, total 13,763 19,290
Current assetsStocks 11 11,983 15,604Short-term debtors 12 10,748 9,973
Short-term investments 13Other short-term investments 2 2
Cash in hand and at banks 1,245 686
Current assets, total 23,978 26,265
Assets, total 37,741 45,555
LIABILITIES
Capital and reserves 14Subscribed capital 20,487 20,487Share premium account 4,224 4,224Retained earnings –6,148 4,671Profit for the financial year –5,634 –10,807Capital loans 15 0 82
Capital and reserves, total 12,929 18,657
CreditorsDeferred tax liabilities 140 507Long-term creditors 17 8,452 9,455Short-term creditors 18 16,220 16,936
Creditors, total 24,812 26,898
Liabilities, total 37,741 45,555
25Annual Report 2003
Consolidated Sources of Funds
EUR 1,000 2003 2002
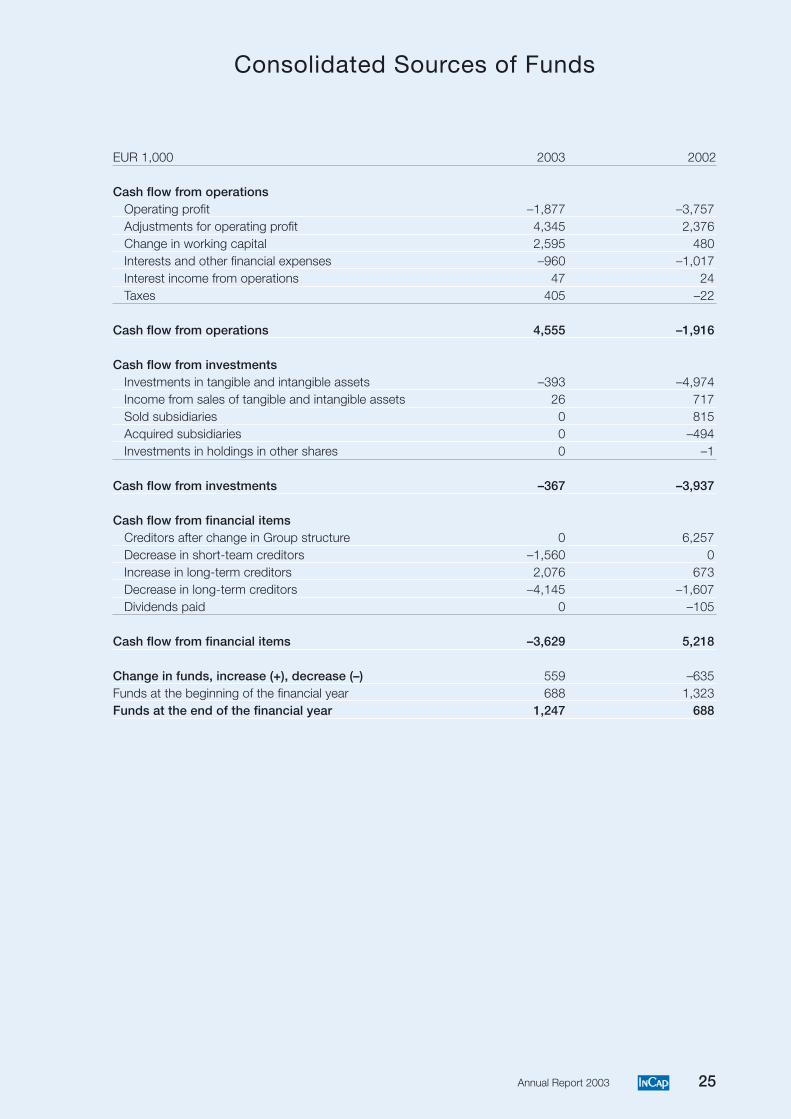
Cash flow from operationsOperating profit –1,877 –3,757Adjustments for operating profit 4,345 2,376Change in working capital 2,595 480Interests and other financial expenses –960 –1,017Interest income from operations 47 24Taxes 405 –22
Cash flow from operations 4,555 –1,916
Cash flow from investmentsInvestments in tangible and intangible assets –393 –4,974Income from sales of tangible and intangible assets 26 717Sold subsidiaries 0 815Acquired subsidiaries 0 –494Investments in holdings in other shares 0 –1
Cash flow from investments –367 –3,937
Cash flow from financial itemsCreditors after change in Group structure 0 6,257Decrease in short-team creditors –1,560 0Increase in long-term creditors 2,076 673Decrease in long-term creditors –4,145 –1,607Dividends paid 0 –105
Cash flow from financial items –3,629 5,218
Change in funds, increase (+), decrease (–) 559 –635Funds at the beginning of the financial year 688 1,323Funds at the end of the financial year 1,247 688
26 Annual Report 2003
Parent Company's Profit and Loss Account
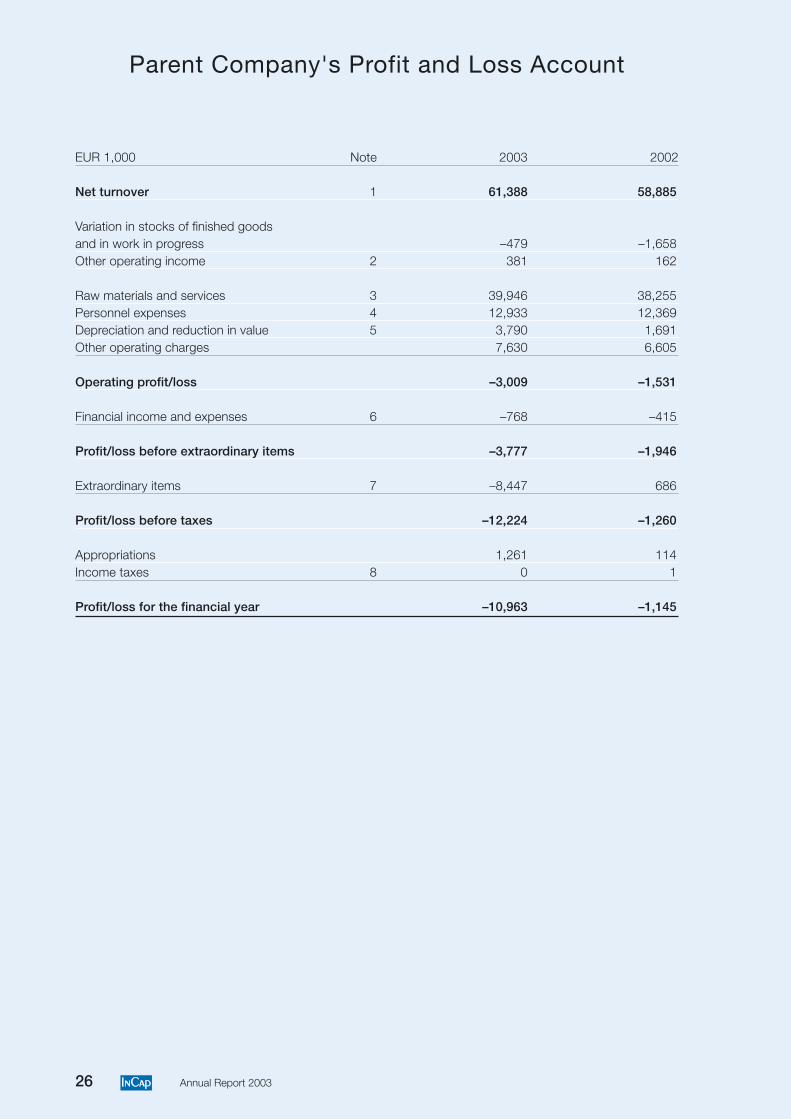
EUR 1,000 Note 2003 2002
Net turnover 1 61,388 58,885
Variation in stocks of finished goodsand in work in progress –479 –1,658Other operating income 2 381 162
Raw materials and services 3 39,946 38,255Personnel expenses 4 12,933 12,369Depreciation and reduction in value 5 3,790 1,691Other operating charges 7,630 6,605
Operating profit/loss –3,009 –1,531
Financial income and expenses 6 –768 –415
Profit/loss before extraordinary items –3,777 –1,946
Extraordinary items 7 –8,447 686
Profit/loss before taxes –12,224 –1,260
Appropriations 1,261 114Income taxes 8 0 1
Profit/loss for the financial year –10,963 –1,145
27Annual Report 2003
Parent Company's Balance Sheet
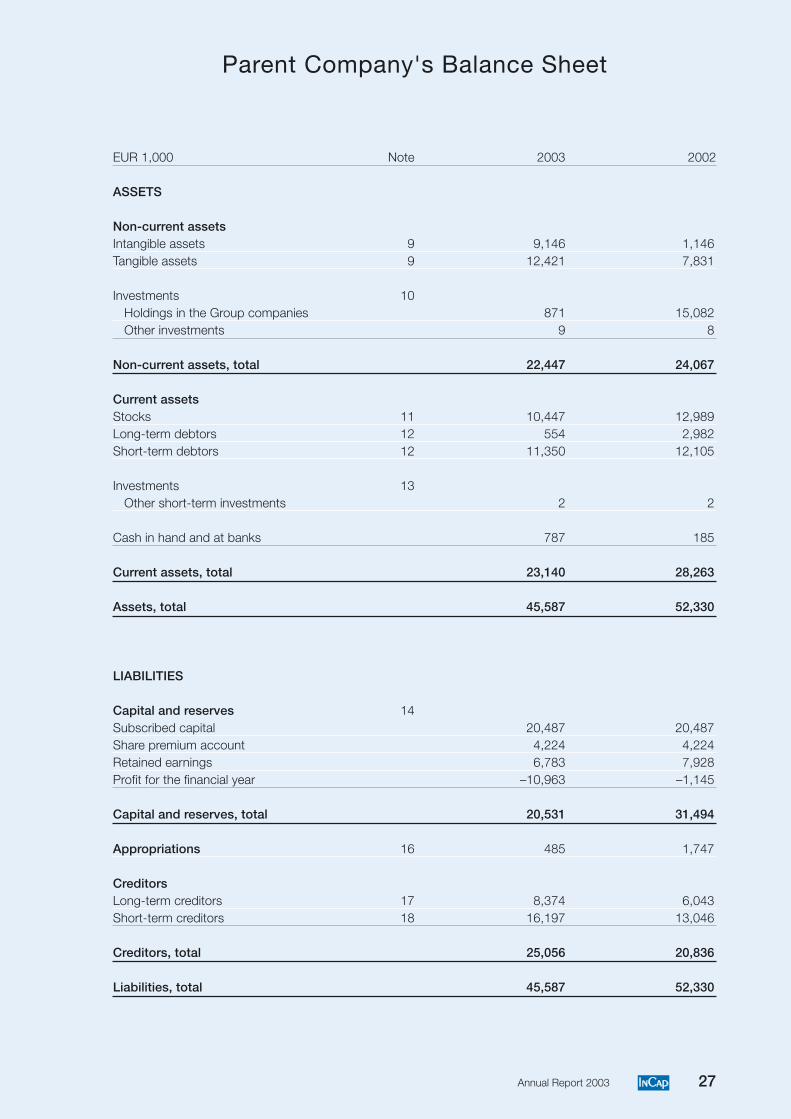
EUR 1,000 Note 2003 2002
ASSETS
Non-current assetsIntangible assets 9 9,146 1,146Tangible assets 9 12,421 7,831
Investments 10Holdings in the Group companies 871 15,082Other investments 9 8
Non-current assets, total 22,447 24,067
Current assetsStocks 11 10,447 12,989Long-term debtors 12 554 2,982Short-term debtors 12 11,350 12,105
Investments 13Other short-term investments 2 2
Cash in hand and at banks 787 185
Current assets, total 23,140 28,263
Assets, total 45,587 52,330
LIABILITIES
Capital and reserves 14Subscribed capital 20,487 20,487Share premium account 4,224 4,224Retained earnings 6,783 7,928Profit for the financial year –10,963 –1,145
Capital and reserves, total 20,531 31,494
Appropriations 16 485 1,747
CreditorsLong-term creditors 17 8,374 6,043Short-term creditors 18 16,197 13,046
Creditors, total 25,056 20,836
Liabilities, total 45,587 52,330
28 Annual Report 2003
Parent Company's Sources of Funds
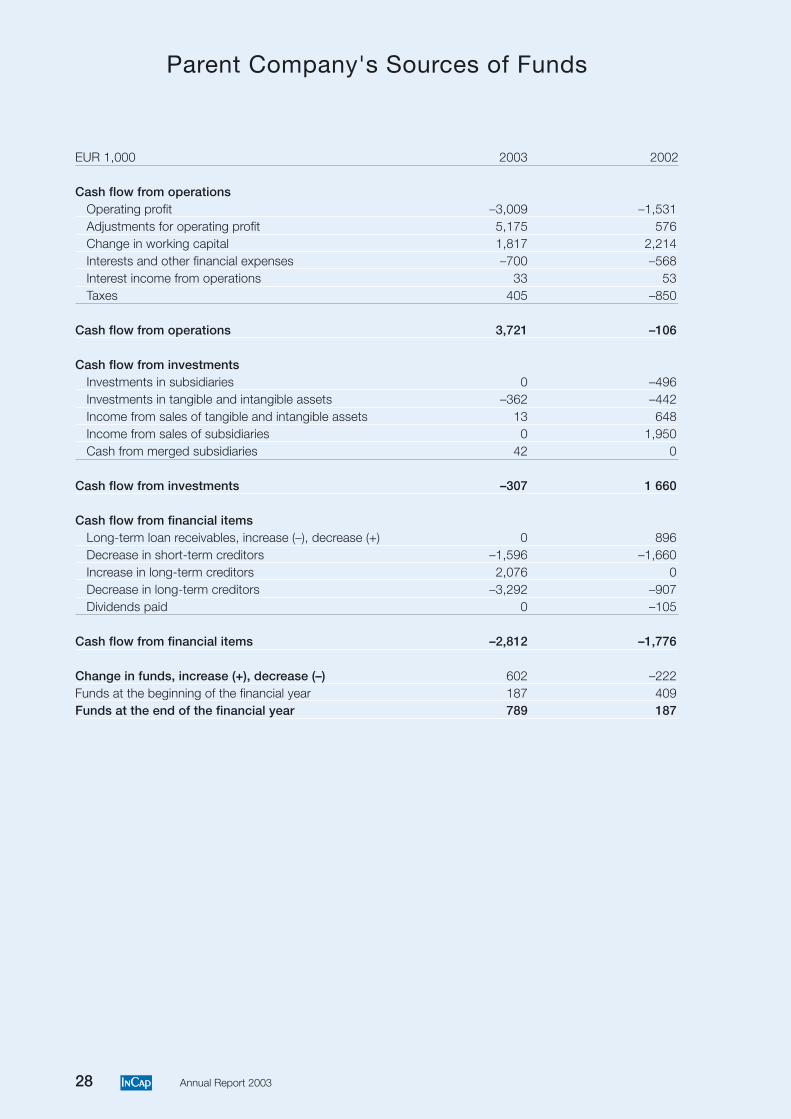
EUR 1,000 2003 2002
Cash flow from operationsOperating profit –3,009 –1,531Adjustments for operating profit 5,175 576Change in working capital 1,817 2,214Interests and other financial expenses –700 –568Interest income from operations 33 53Taxes 405 –850
Cash flow from operations 3,721 –106
Cash flow from investmentsInvestments in subsidiaries 0 –496Investments in tangible and intangible assets –362 –442Income from sales of tangible and intangible assets 13 648Income from sales of subsidiaries 0 1,950Cash from merged subsidiaries 42 0
Cash flow from investments –307 1 660
Cash flow from financial itemsLong-term loan receivables, increase (–), decrease (+) 0 896Decrease in short-term creditors –1,596 –1,660Increase in long-term creditors 2,076 0Decrease in long-term creditors –3,292 –907Dividends paid 0 –105
Cash flow from financial items –2,812 –1,776
Change in funds, increase (+), decrease (–) 602 –222Funds at the beginning of the financial year 187 409Funds at the end of the financial year 789 187
29Annual Report 2003
Extent of the consolidated annual accountsThe consolidated annual accounts include the parent com-pany Incap Corporation, which is domiciled in Oulu, andthe company’s wholly-owned subsidiaries Incap ElectronicsEstonia OÜ, Kuressaare, Estonia and Ultraprint Oy,Kempele. The subsidiary JMC Tools Oy has been includedin the consolidated annual accounts on 23 December 2003.The subsidiary Euro-Ketju Oy is a dormant company andas such has not been included in the consolidation.
A copy of the consolidated annual accounts can beobtained from the parent company’s head office at theaddress Kempeleentie 46, 90440 Kempele.
Principles of consolidationThe consolidated annual accounts have been preparedaccording to the acquisition cost method. The differencein the purchase price and shareholders’ equity of acquisi-tions of shares in subsidiaries made prior to 2002 has re-sulted in the formation of goodwill on consolidation. Inconnection with the merger of JMC Tools Oy in 2002, thecompilation of the consolidated balance sheets has beencarried out in compliance with Decision 1591/1999 of theFinnish Accounting Standards Board concerning the ac-counting treatment of exchanges of shares. In accordancewith said decision, Group goodwill is not formed in anexchange of shares.
Intra-Group transactions and marginsIntra-Group transactions, unrealised margins on internaldeliveries and internal receivables and debts have beeneliminated. There are no minority interests.
Principles of valuation and periodisation
Valuation of non-current assetsTangible assets included in non-current assets have beenentered in the balance sheet at the direct acquisition costless depreciation according to plan. Investment grants re-ceived have been booked by crediting the correspondingasset item. Depreciation according to plan has been calcu-lated on the economic lifetime of the fixed asset items ona straight-line basis.
Intangible assetsgoodwill 10 yrs.goodwill on consolidation 5 yrs.other intangible rights 1 – 10 yrs.
Tangible assetsbuildings and structures 20 – 24 yrs.production machinery 4 – 20 yrs.other machinery 4 – 15 yrs.vehicles 3 – 5 yrs.other equipment 3 – 15 yrs.
Accounting Policy Applied in the ConsolidatedAnnual Accounts for 2003
Valuation of stocksThe stocks have been valued at their direct acquisition costor the repurchase value or selling cost, whichever is low-er, and costs are stated according to the FIFO principle.
Financial assets and management of financial risksTrade debtors and creditors do not involve major interestrate or foreign exchange risks.
Items denominated in foreign currencyItems denominated in foreign currency have been translatedat the middle rate quoted by the European Central Bankon the balance sheet date. Foreign exchange differences onsales and purchase amounts have been credited or debit-ed to the appropriate items. Mentionable translation dif-ferences have not arisen in consolidating the foreign sub-sidiary.
LeasingLeasing payments for fixed assets acquired through financiallease contracts are included as rental expense in Otheroperating charges.
Research and development expenditureIn 2003 research and development expenditure has beentreated as an annual expense within Other operating ex-penses.
Periodisation of pension expensesThe pension security of employees, including supplementarybenefits, has been provided for by taking out policies withpension insurance companies. Pension expenses are calcu-lated over time and entered in the profit and loss account.
Income taxesAll the Group companies in Finland have tax loss carry-overs that have been approved in taxation and can be ap-plied during the years 2004-2012. In accordance with theprinciple of financial prudence, these carry-overs have notbeen entered as imputed tax assets in the annual accounts.Deferred tax liabilities in the consolidated annual accountsconsist of appropriations.
30 Annual Report 2003
Group Parent companyEUR 1,000 2003 2002 2003 2002
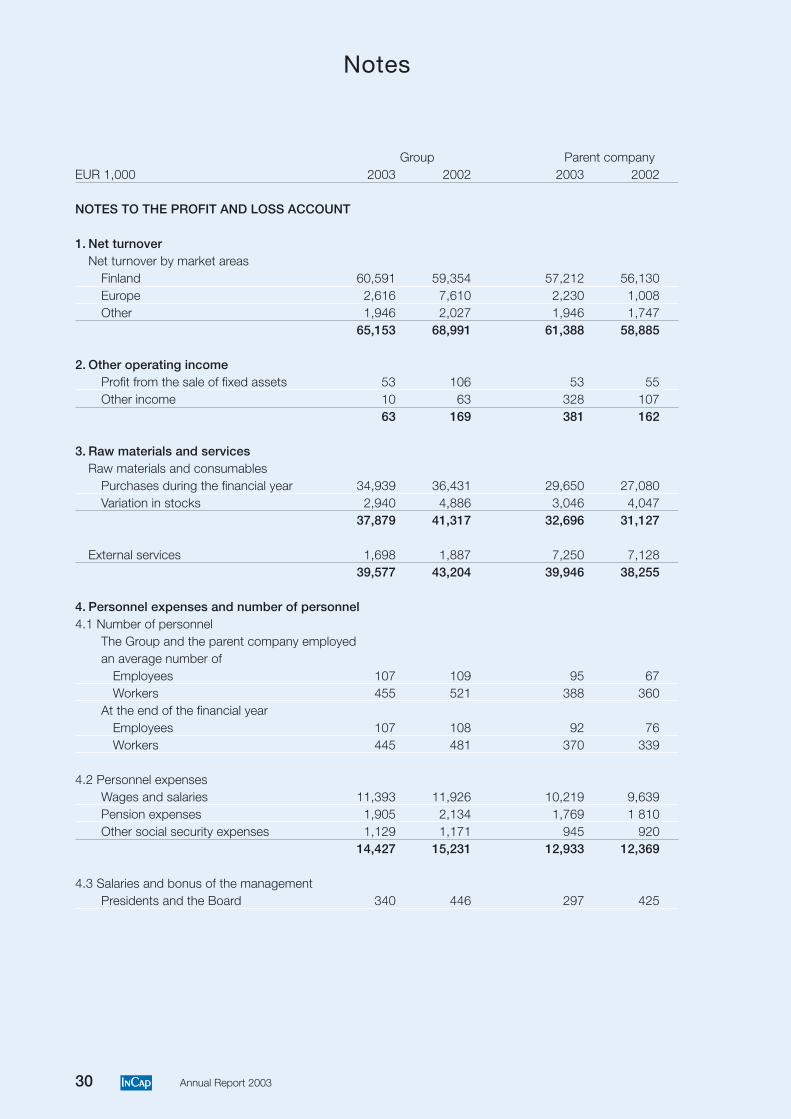
NOTES TO THE PROFIT AND LOSS ACCOUNT
1. Net turnoverNet turnover by market areas
Finland 60,591 59,354 57,212 56,130Europe 2,616 7,610 2,230 1,008Other 1,946 2,027 1,946 1,747
65,153 68,991 61,388 58,885
2. Other operating incomeProfit from the sale of fixed assets 53 106 53 55Other income 10 63 328 107
63 169 381 162
3. Raw materials and servicesRaw materials and consumables
Purchases during the financial year 34,939 36,431 29,650 27,080Variation in stocks 2,940 4,886 3,046 4,047
37,879 41,317 32,696 31,127
External services 1,698 1,887 7,250 7,12839,577 43,204 39,946 38,255
4. Personnel expenses and number of personnel4.1 Number of personnel
The Group and the parent company employedan average number of
Employees 107 109 95 67Workers 455 521 388 360
At the end of the financial yearEmployees 107 108 92 76Workers 445 481 370 339
4.2 Personnel expensesWages and salaries 11,393 11,926 10,219 9,639Pension expenses 1,905 2,134 1,769 1 810Other social security expenses 1,129 1,171 945 920
14,427 15,231 12,933 12,369
4.3 Salaries and bonus of the managementPresidents and the Board 340 446 297 425
Notes
31Annual Report 2003
Group Parent companyEUR 1,000 2003 2002 2003 2002
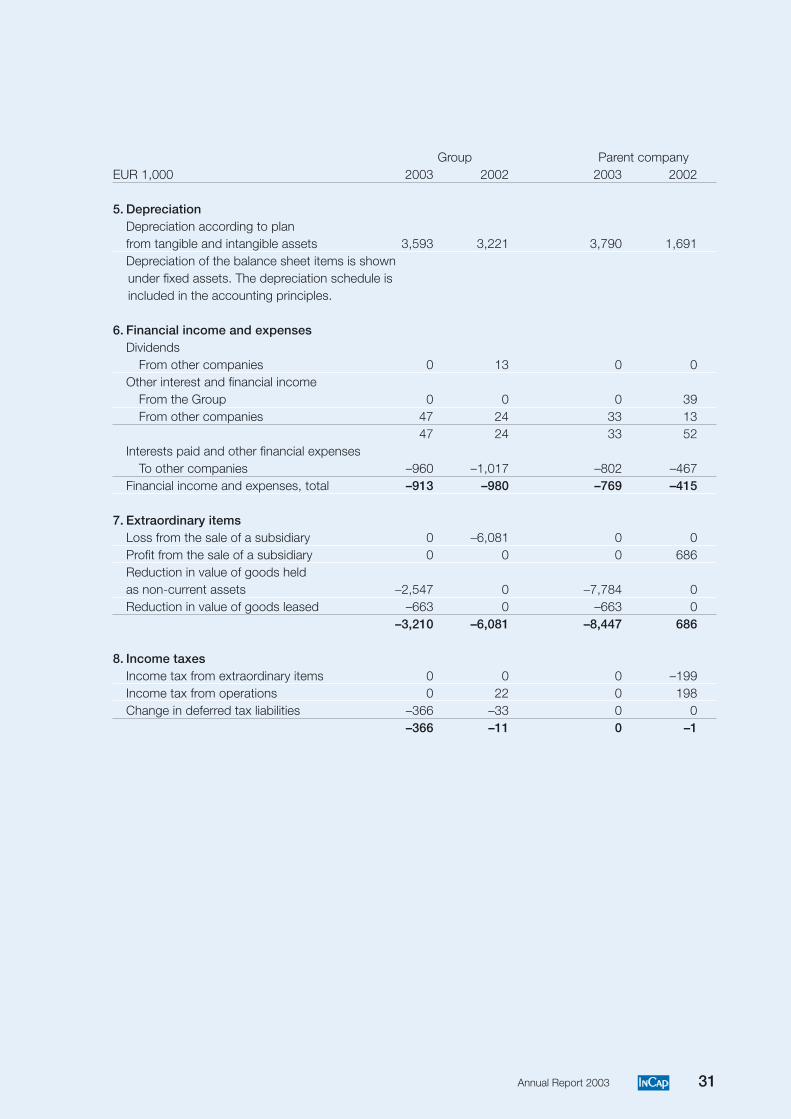
5. DepreciationDepreciation according to planfrom tangible and intangible assets 3,593 3,221 3,790 1,691Depreciation of the balance sheet items is shownunder fixed assets. The depreciation schedule isincluded in the accounting principles.
6. Financial income and expensesDividends
From other companies 0 13 0 0Other interest and financial income
From the Group 0 0 0 39From other companies 47 24 33 13
47 24 33 52Interests paid and other financial expenses
To other companies –960 –1,017 –802 –467Financial income and expenses, total –913 –980 –769 –415
7. Extraordinary itemsLoss from the sale of a subsidiary 0 –6,081 0 0Profit from the sale of a subsidiary 0 0 0 686Reduction in value of goods heldas non-current assets –2,547 0 –7,784 0Reduction in value of goods leased –663 0 –663 0
–3,210 –6,081 –8,447 686
8. Income taxesIncome tax from extraordinary items 0 0 0 –199Income tax from operations 0 22 0 198Change in deferred tax liabilities –366 –33 0 0
–366 –11 0 –1
32 Annual Report 2003
Notes
Group Parent companyEUR 1,000 2003 2002 2003 2002
NOTES TO THE BALANCE SHEET
9. Fixed assetsResearch expensesAcquisition cost, 1 Jan. 165 165 0 0
Decrease 0 0 165 0Acquisition cost, 31 Dec. 165 165 165 0
Accumulated depreciation, 1 Jan. –162 0 0 0Accumulated depreciation of JMC Tools Oy 0 0 –162 0Depreciation during the year –3 –162 –3 0
Accumulated depreciation, 31 Dec. –165 –162 –165 0
Book value, 31 Dec. 0 3 0 0
Intangible rightsAcquisition cost, 1 Jan. 1,052 1,482 877 886
Increase 38 176 204 1Decrease 0 –606 0 –10
Acquisition cost, 31 Dec. 1,090 1,052 1,081 877
Accumulated depreciation, 1 Jan. –548 –419 –474 –378Accumulated depreciation of JMC Tools Oy 0 0 –73 0Depreciation during the year –130 –129 –129 –96Reduction –55 0 –54 0
Accumulated depreciation, 31 Dec. –733 –548 –730 –474
Book value, 31 Dec. 357 504 351 403
GoodwillAcquisition cost, 1 Jan. 1,865 997 997 997
Increase 14 868 15,340 0Acquisition cost, 31 Dec. 1,879 1,865 16,337 997
Accumulated depreciation, 1 Jan. –1,201 –427 –623 –427Accumulated depreciation of JMC Tools Oy 0 –427 –320 0Depreciation during the year –335 –347 –1,393 –196Reduction –179 0 –5,416 0
Accumulated depreciation, 31 Dec. –1,715 –1,201 –7,752 –623
Book value, 31 Dec. 164 664 8 585 374
Other long-term expenditureAcquisition cost, 1 Jan. 1,598 2,119 1,397 1,368
Increase 2 233 99 32Decrease 0 –754 0 –3
Acquisition cost, 31 Dec. 1,600 1, 598 1,496 1,397
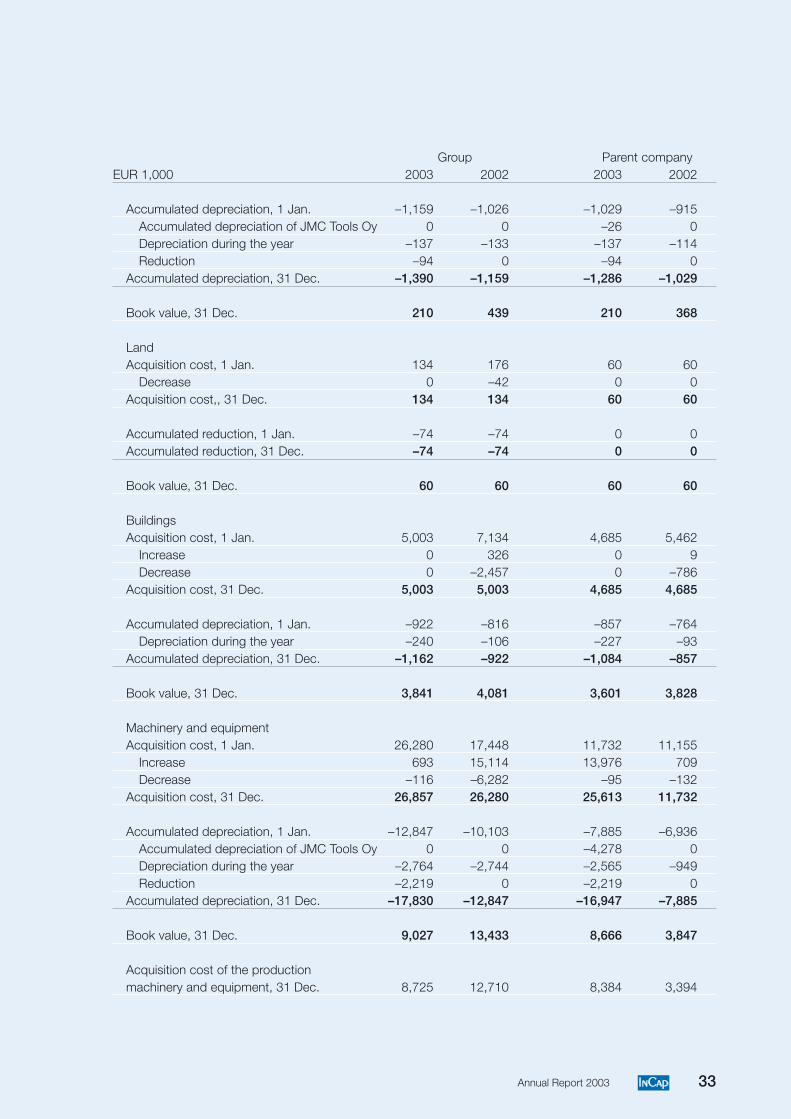
33Annual Report 2003
Group Parent companyEUR 1,000 2003 2002 2003 2002
Accumulated depreciation, 1 Jan. –1,159 –1,026 –1,029 –915Accumulated depreciation of JMC Tools Oy 0 0 –26 0Depreciation during the year –137 –133 –137 –114Reduction –94 0 –94 0
Accumulated depreciation, 31 Dec. –1,390 –1,159 –1,286 –1,029
Book value, 31 Dec. 210 439 210 368
LandAcquisition cost, 1 Jan. 134 176 60 60
Decrease 0 –42 0 0Acquisition cost,, 31 Dec. 134 134 60 60
Accumulated reduction, 1 Jan. –74 –74 0 0Accumulated reduction, 31 Dec. –74 –74 0 0
Book value, 31 Dec. 60 60 60 60
BuildingsAcquisition cost, 1 Jan. 5,003 7,134 4,685 5,462
Increase 0 326 0 9Decrease 0 –2,457 0 –786
Acquisition cost, 31 Dec. 5,003 5,003 4,685 4,685
Accumulated depreciation, 1 Jan. –922 –816 –857 –764Depreciation during the year –240 –106 –227 –93
Accumulated depreciation, 31 Dec. –1,162 –922 –1,084 –857
Book value, 31 Dec. 3,841 4,081 3,601 3,828
Machinery and equipmentAcquisition cost, 1 Jan. 26,280 17,448 11,732 11,155
Increase 693 15,114 13,976 709Decrease –116 –6,282 –95 –132
Acquisition cost, 31 Dec. 26,857 26,280 25,613 11,732
Accumulated depreciation, 1 Jan. –12,847 –10,103 –7,885 –6,936Accumulated depreciation of JMC Tools Oy 0 0 –4,278 0Depreciation during the year –2,764 –2,744 –2,565 –949Reduction –2,219 0 –2,219 0
Accumulated depreciation, 31 Dec. –17,830 –12,847 –16,947 –7,885
Book value, 31 Dec. 9,027 13,433 8,666 3,847
Acquisition cost of the productionmachinery and equipment, 31 Dec. 8,725 12,710 8,384 3,394
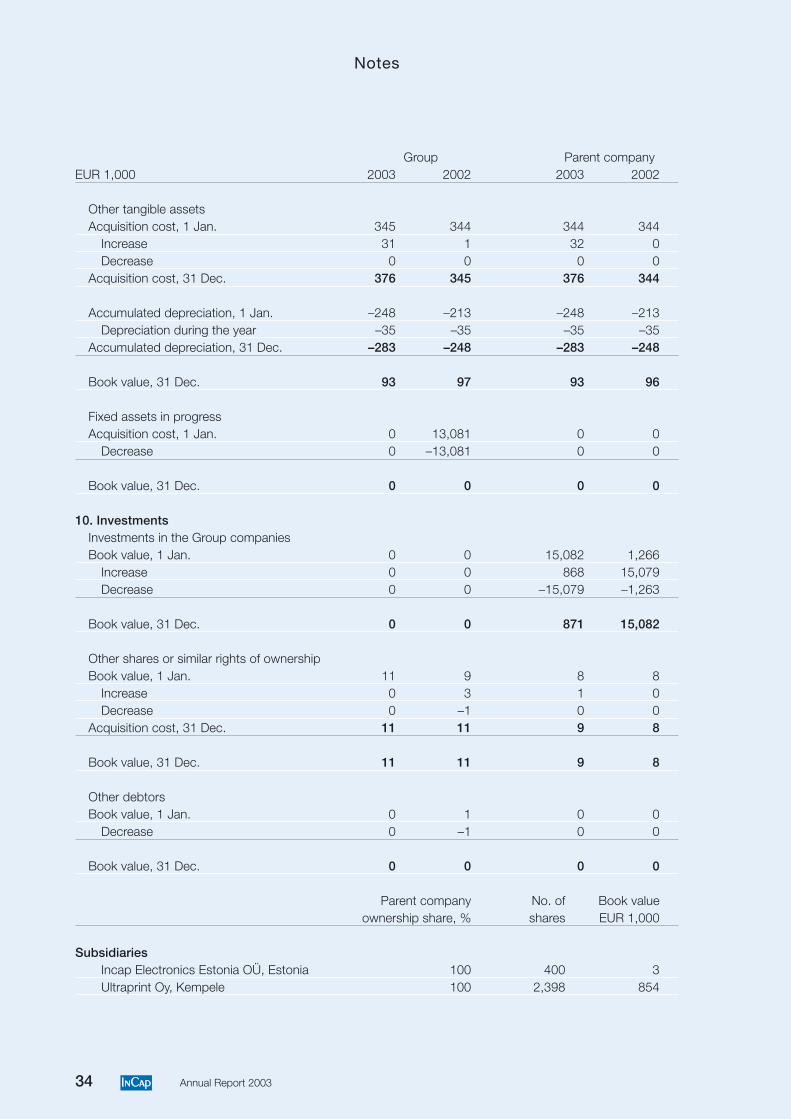
34 Annual Report 2003
Notes
Group Parent companyEUR 1,000 2003 2002 2003 2002
Other tangible assetsAcquisition cost, 1 Jan. 345 344 344 344
Increase 31 1 32 0Decrease 0 0 0 0
Acquisition cost, 31 Dec. 376 345 376 344
Accumulated depreciation, 1 Jan. –248 –213 –248 –213Depreciation during the year –35 –35 –35 –35
Accumulated depreciation, 31 Dec. –283 –248 –283 –248
Book value, 31 Dec. 93 97 93 96
Fixed assets in progressAcquisition cost, 1 Jan. 0 13,081 0 0
Decrease 0 –13,081 0 0
Book value, 31 Dec. 0 0 0 0
10. InvestmentsInvestments in the Group companiesBook value, 1 Jan. 0 0 15,082 1,266
Increase 0 0 868 15,079Decrease 0 0 –15,079 –1,263
Book value, 31 Dec. 0 0 871 15,082
Other shares or similar rights of ownershipBook value, 1 Jan. 11 9 8 8
Increase 0 3 1 0Decrease 0 –1 0 0
Acquisition cost, 31 Dec. 11 11 9 8
Book value, 31 Dec. 11 11 9 8
Other debtorsBook value, 1 Jan. 0 1 0 0
Decrease 0 –1 0 0
Book value, 31 Dec. 0 0 0 0
Parent company No. of Book valueownership share, % shares EUR 1,000
SubsidiariesIncap Electronics Estonia OÜ, Estonia 100 400 3Ultraprint Oy, Kempele 100 2,398 854
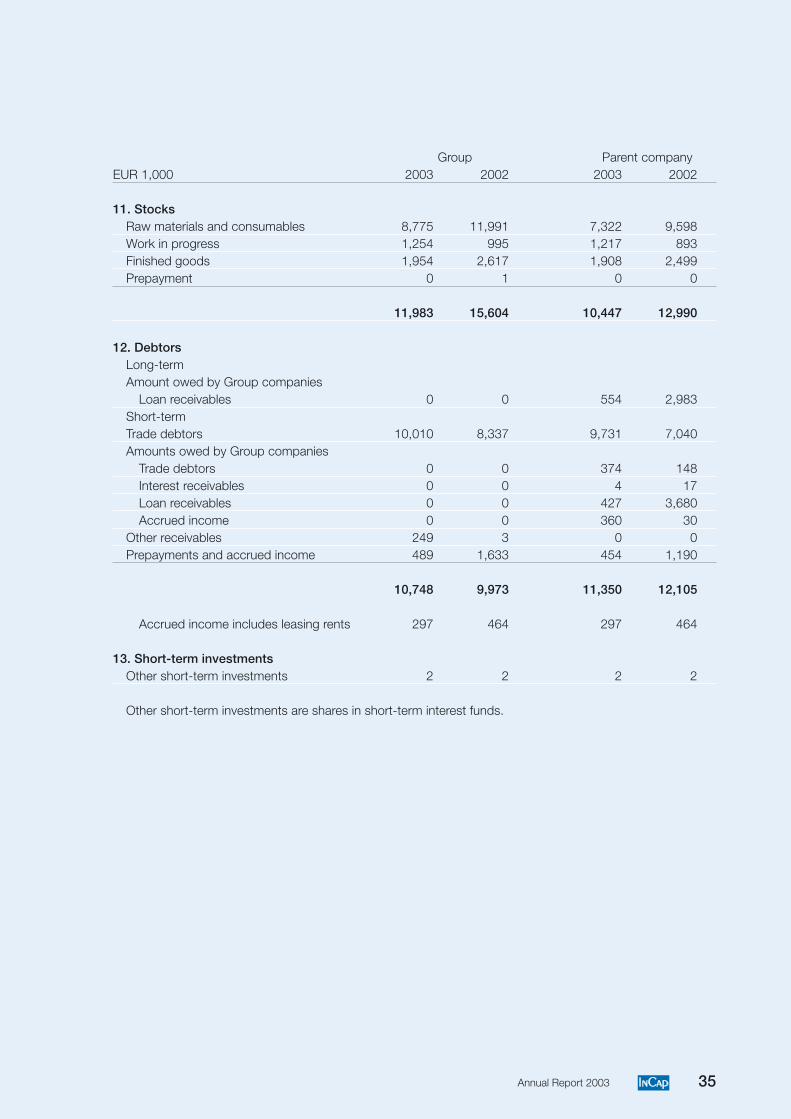
35Annual Report 2003
Group Parent companyEUR 1,000 2003 2002 2003 2002
11. StocksRaw materials and consumables 8,775 11,991 7,322 9,598Work in progress 1,254 995 1,217 893Finished goods 1,954 2,617 1,908 2,499Prepayment 0 1 0 0
11,983 15,604 10,447 12,990
12. DebtorsLong-termAmount owed by Group companies
Loan receivables 0 0 554 2,983Short-termTrade debtors 10,010 8,337 9,731 7,040Amounts owed by Group companies
Trade debtors 0 0 374 148Interest receivables 0 0 4 17Loan receivables 0 0 427 3,680Accrued income 0 0 360 30
Other receivables 249 3 0 0Prepayments and accrued income 489 1,633 454 1,190
10,748 9,973 11,350 12,105
Accrued income includes leasing rents 297 464 297 464
13. Short-term investmentsOther short-term investments 2 2 2 2
Other short-term investments are shares in short-term interest funds.
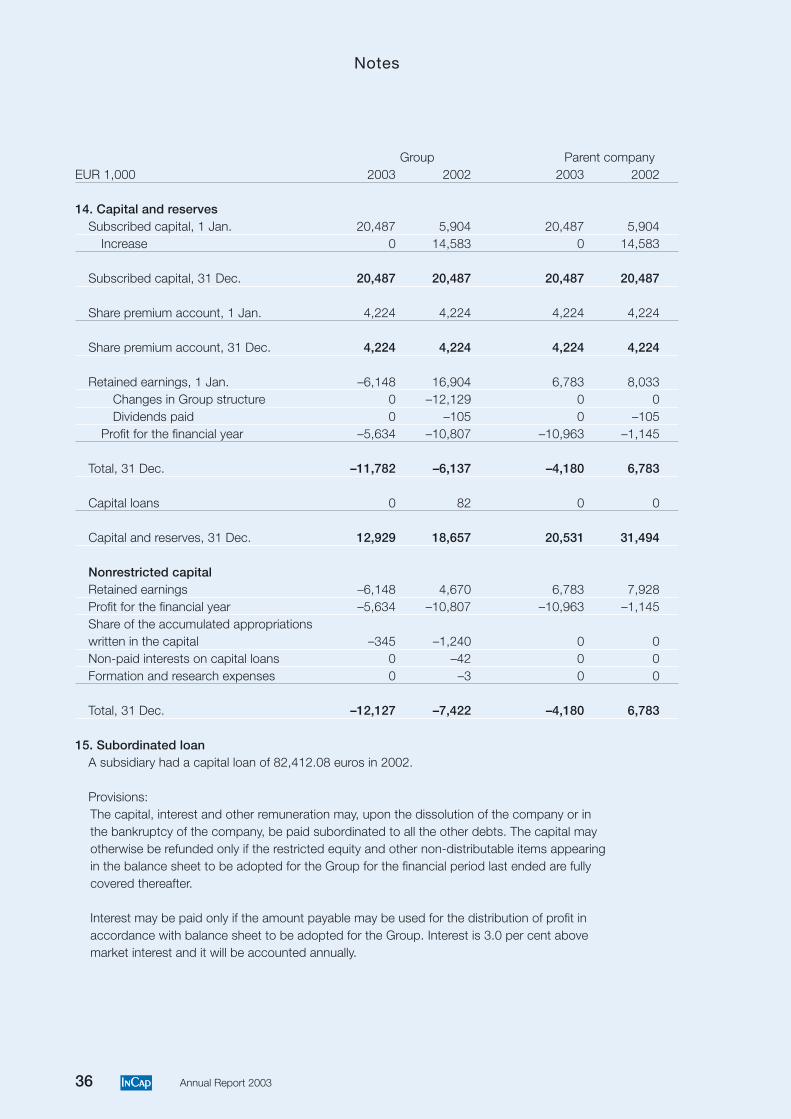
36 Annual Report 2003
Notes
Group Parent companyEUR 1,000 2003 2002 2003 2002
14. Capital and reservesSubscribed capital, 1 Jan. 20,487 5,904 20,487 5,904
Increase 0 14,583 0 14,583
Subscribed capital, 31 Dec. 20,487 20,487 20,487 20,487
Share premium account, 1 Jan. 4,224 4,224 4,224 4,224
Share premium account, 31 Dec. 4,224 4,224 4,224 4,224
Retained earnings, 1 Jan. –6,148 16,904 6,783 8,033Changes in Group structure 0 –12,129 0 0Dividends paid 0 –105 0 –105
Profit for the financial year –5,634 –10,807 –10,963 –1,145
Total, 31 Dec. –11,782 –6,137 –4,180 6,783
Capital loans 0 82 0 0
Capital and reserves, 31 Dec. 12,929 18,657 20,531 31,494
Nonrestricted capitalRetained earnings –6,148 4,670 6,783 7,928Profit for the financial year –5,634 –10,807 –10,963 –1,145Share of the accumulated appropriationswritten in the capital –345 –1,240 0 0Non-paid interests on capital loans 0 –42 0 0Formation and research expenses 0 –3 0 0
Total, 31 Dec. –12,127 –7,422 –4,180 6,783
15. Subordinated loanA subsidiary had a capital loan of 82,412.08 euros in 2002.
Provisions:The capital, interest and other remuneration may, upon the dissolution of the company or inthe bankruptcy of the company, be paid subordinated to all the other debts. The capital mayotherwise be refunded only if the restricted equity and other non-distributable items appearingin the balance sheet to be adopted for the Group for the financial period last ended are fullycovered thereafter.
Interest may be paid only if the amount payable may be used for the distribution of profit inaccordance with balance sheet to be adopted for the Group. Interest is 3.0 per cent abovemarket interest and it will be accounted annually.
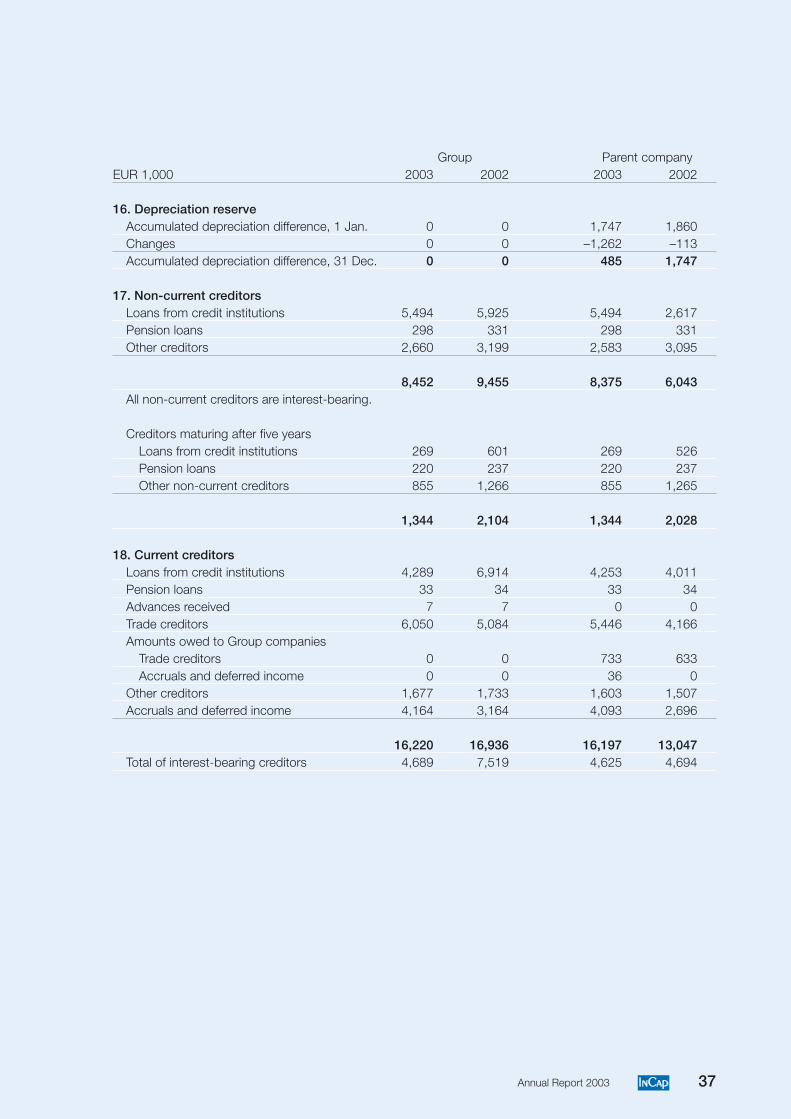
37Annual Report 2003
Group Parent companyEUR 1,000 2003 2002 2003 2002
16. Depreciation reserveAccumulated depreciation difference, 1 Jan. 0 0 1,747 1,860Changes 0 0 –1,262 –113Accumulated depreciation difference, 31 Dec. 0 0 485 1,747
17. Non-current creditorsLoans from credit institutions 5,494 5,925 5,494 2,617Pension loans 298 331 298 331Other creditors 2,660 3,199 2,583 3,095
8,452 9,455 8,375 6,043All non-current creditors are interest-bearing.
Creditors maturing after five yearsLoans from credit institutions 269 601 269 526Pension loans 220 237 220 237Other non-current creditors 855 1,266 855 1,265
1,344 2,104 1,344 2,028
18. Current creditorsLoans from credit institutions 4,289 6,914 4,253 4,011Pension loans 33 34 33 34Advances received 7 7 0 0Trade creditors 6,050 5,084 5,446 4,166Amounts owed to Group companies
Trade creditors 0 0 733 633Accruals and deferred income 0 0 36 0
Other creditors 1,677 1,733 1,603 1,507Accruals and deferred income 4,164 3,164 4,093 2,696
16,220 16,936 16,197 13,047Total of interest-bearing creditors 4,689 7,519 4,625 4,694
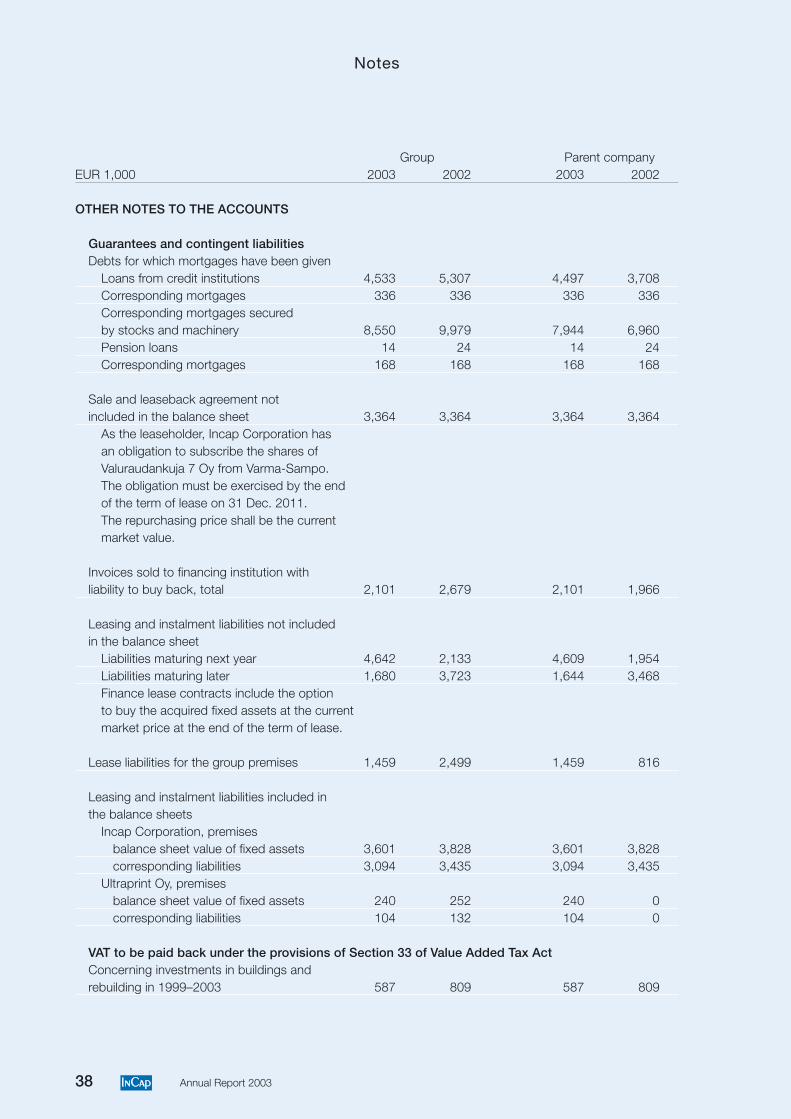
38 Annual Report 2003
Notes
Group Parent companyEUR 1,000 2003 2002 2003 2002
OTHER NOTES TO THE ACCOUNTS
Guarantees and contingent liabilitiesDebts for which mortgages have been given
Loans from credit institutions 4,533 5,307 4,497 3,708Corresponding mortgages 336 336 336 336Corresponding mortgages securedby stocks and machinery 8,550 9,979 7,944 6,960Pension loans 14 24 14 24Corresponding mortgages 168 168 168 168
Sale and leaseback agreement notincluded in the balance sheet 3,364 3,364 3,364 3,364
As the leaseholder, Incap Corporation hasan obligation to subscribe the shares ofValuraudankuja 7 Oy from Varma-Sampo.The obligation must be exercised by the endof the term of lease on 31 Dec. 2011.The repurchasing price shall be the currentmarket value.
Invoices sold to financing institution withliability to buy back, total 2,101 2,679 2,101 1,966
Leasing and instalment liabilities not includedin the balance sheet
Liabilities maturing next year 4,642 2,133 4,609 1,954Liabilities maturing later 1,680 3,723 1,644 3,468Finance lease contracts include the optionto buy the acquired fixed assets at the currentmarket price at the end of the term of lease.
Lease liabilities for the group premises 1,459 2,499 1,459 816
Leasing and instalment liabilities included inthe balance sheets
Incap Corporation, premisesbalance sheet value of fixed assets 3,601 3,828 3,601 3,828corresponding liabilities 3,094 3,435 3,094 3,435
Ultraprint Oy, premisesbalance sheet value of fixed assets 240 252 240 0corresponding liabilities 104 132 104 0
VAT to be paid back under the provisions of Section 33 of Value Added Tax ActConcerning investments in buildings andrebuilding in 1999–2003 587 809 587 809
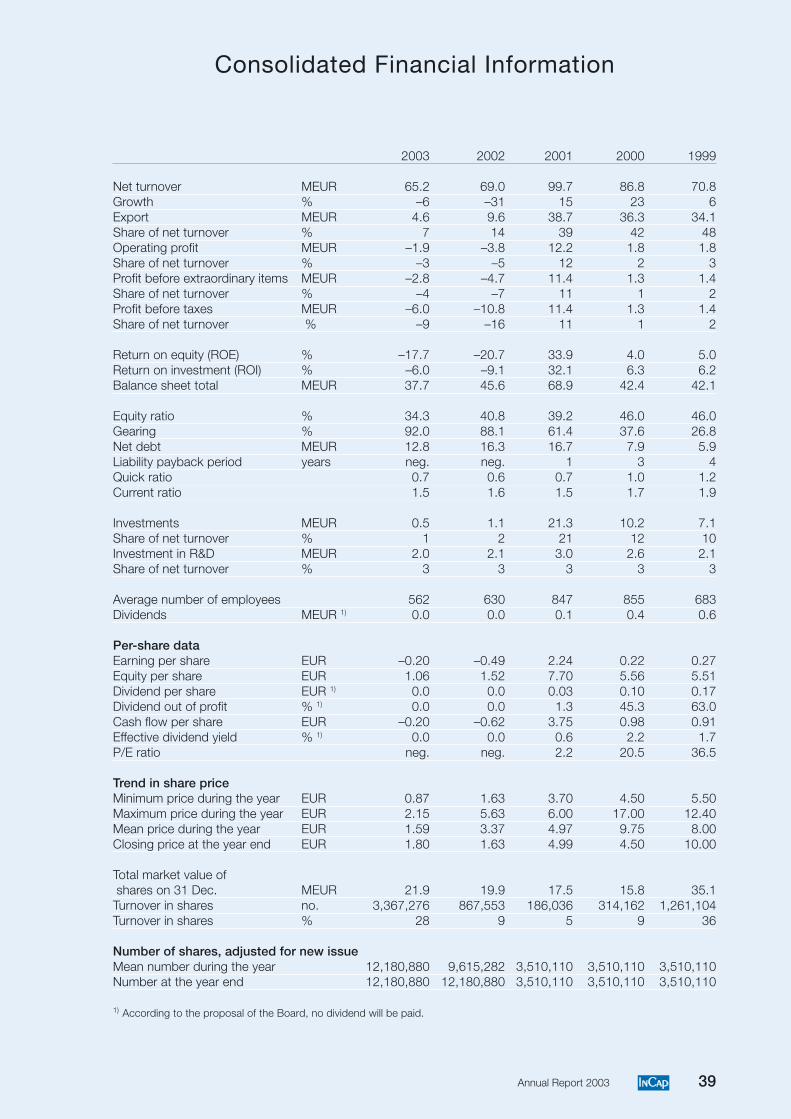
39Annual Report 2003
Consolidated Financial Information
2003 2002 2001 2000 1999
Net turnover MEUR 65.2 69.0 99.7 86.8 70.8Growth % –6 –31 15 23 6Export MEUR 4.6 9.6 38.7 36.3 34.1Share of net turnover % 7 14 39 42 48Operating profit MEUR –1.9 –3.8 12.2 1.8 1.8Share of net turnover % –3 –5 12 2 3Profit before extraordinary items MEUR –2.8 –4.7 11.4 1.3 1.4Share of net turnover % –4 –7 11 1 2Profit before taxes MEUR –6.0 –10.8 11.4 1.3 1.4Share of net turnover % –9 –16 11 1 2
Return on equity (ROE) % –17.7 –20.7 33.9 4.0 5.0Return on investment (ROI) % –6.0 –9.1 32.1 6.3 6.2Balance sheet total MEUR 37.7 45.6 68.9 42.4 42.1
Equity ratio % 34.3 40.8 39.2 46.0 46.0Gearing % 92.0 88.1 61.4 37.6 26.8Net debt MEUR 12.8 16.3 16.7 7.9 5.9Liability payback period years neg. neg. 1 3 4Quick ratio 0.7 0.6 0.7 1.0 1.2Current ratio 1.5 1.6 1.5 1.7 1.9
Investments MEUR 0.5 1.1 21.3 10.2 7.1Share of net turnover % 1 2 21 12 10Investment in R&D MEUR 2.0 2.1 3.0 2.6 2.1Share of net turnover % 3 3 3 3 3
Average number of employees 562 630 847 855 683Dividends MEUR 1) 0.0 0.0 0.1 0.4 0.6
Per-share dataEarning per share EUR –0.20 –0.49 2.24 0.22 0.27Equity per share EUR 1.06 1.52 7.70 5.56 5.51Dividend per share EUR 1) 0.0 0.0 0.03 0.10 0.17Dividend out of profit % 1) 0.0 0.0 1.3 45.3 63.0Cash flow per share EUR –0.20 –0.62 3.75 0.98 0.91Effective dividend yield % 1) 0.0 0.0 0.6 2.2 1.7P/E ratio neg. neg. 2.2 20.5 36.5
Trend in share priceMinimum price during the year EUR 0.87 1.63 3.70 4.50 5.50Maximum price during the year EUR 2.15 5.63 6.00 17.00 12.40Mean price during the year EUR 1.59 3.37 4.97 9.75 8.00Closing price at the year end EUR 1.80 1.63 4.99 4.50 10.00
Total market value of shares on 31 Dec. MEUR 21.9 19.9 17.5 15.8 35.1Turnover in shares no. 3,367,276 867,553 186,036 314,162 1,261,104Turnover in shares % 28 9 5 9 36
Number of shares, adjusted for new issueMean number during the year 12,180,880 9,615,282 3,510,110 3,510,110 3,510,110Number at the year end 12,180,880 12,180,880 3,510,110 3,510,110 3,510,110
1) According to the proposal of the Board, no dividend will be paid.
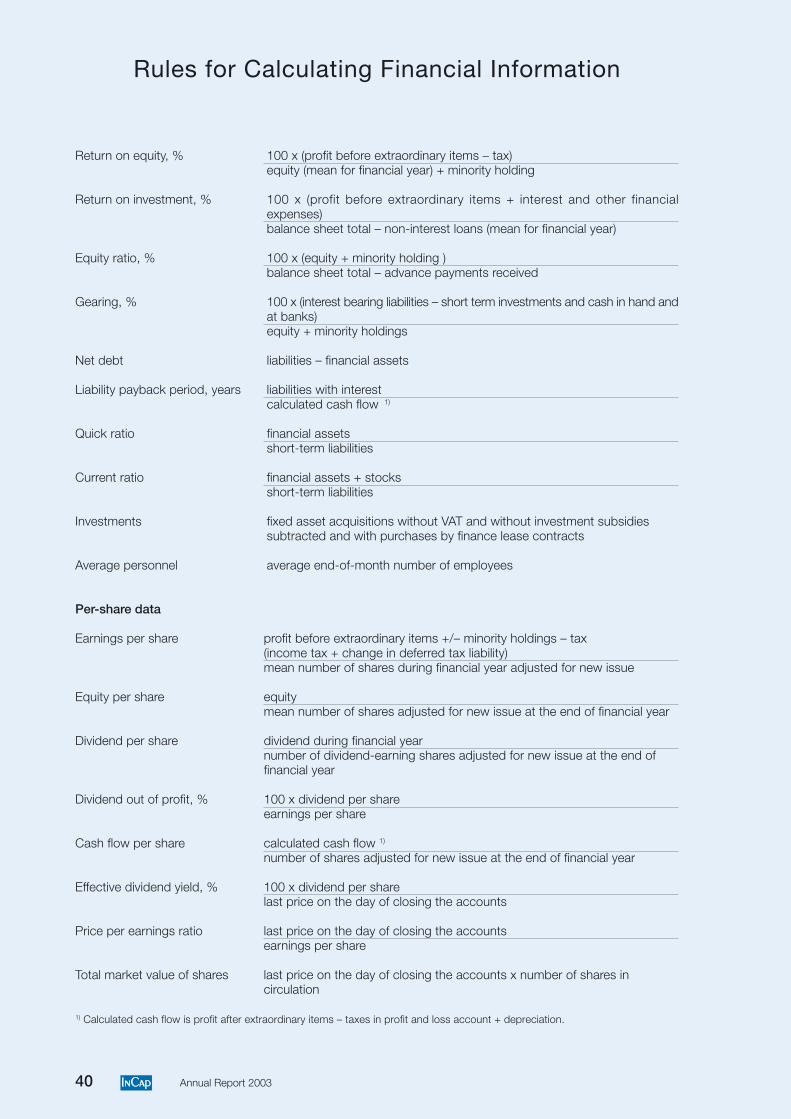
40 Annual Report 2003
Return on equity, % 100 x (profit before extraordinary items – tax)equity (mean for financial year) + minority holding
Return on investment, % 100 x (profit before extraordinary items + interest and other financialexpenses)balance sheet total – non-interest loans (mean for financial year)
Equity ratio, % 100 x (equity + minority holding )balance sheet total – advance payments received
Gearing, % 100 x (interest bearing liabilities – short term investments and cash in hand andat banks)equity + minority holdings
Net debt liabilities – financial assets
Liability payback period, years liabilities with interestcalculated cash flow 1)
Quick ratio financial assetsshort-term liabilities
Current ratio financial assets + stocksshort-term liabilities
Investments fixed asset acquisitions without VAT and without investment subsidiessubtracted and with purchases by finance lease contracts
Average personnel average end-of-month number of employees
Per-share data
Earnings per share profit before extraordinary items +/– minority holdings – tax(income tax + change in deferred tax liability)mean number of shares during financial year adjusted for new issue
Equity per share equitymean number of shares adjusted for new issue at the end of financial year
Dividend per share dividend during financial yearnumber of dividend-earning shares adjusted for new issue at the end offinancial year
Dividend out of profit, % 100 x dividend per shareearnings per share
Cash flow per share calculated cash flow 1)
number of shares adjusted for new issue at the end of financial year
Effective dividend yield, % 100 x dividend per sharelast price on the day of closing the accounts
Price per earnings ratio last price on the day of closing the accountsearnings per share
Total market value of shares last price on the day of closing the accounts x number of shares incirculation
1) Calculated cash flow is profit after extraordinary items – taxes in profit and loss account + depreciation.
Rules for Calculating Financial Information
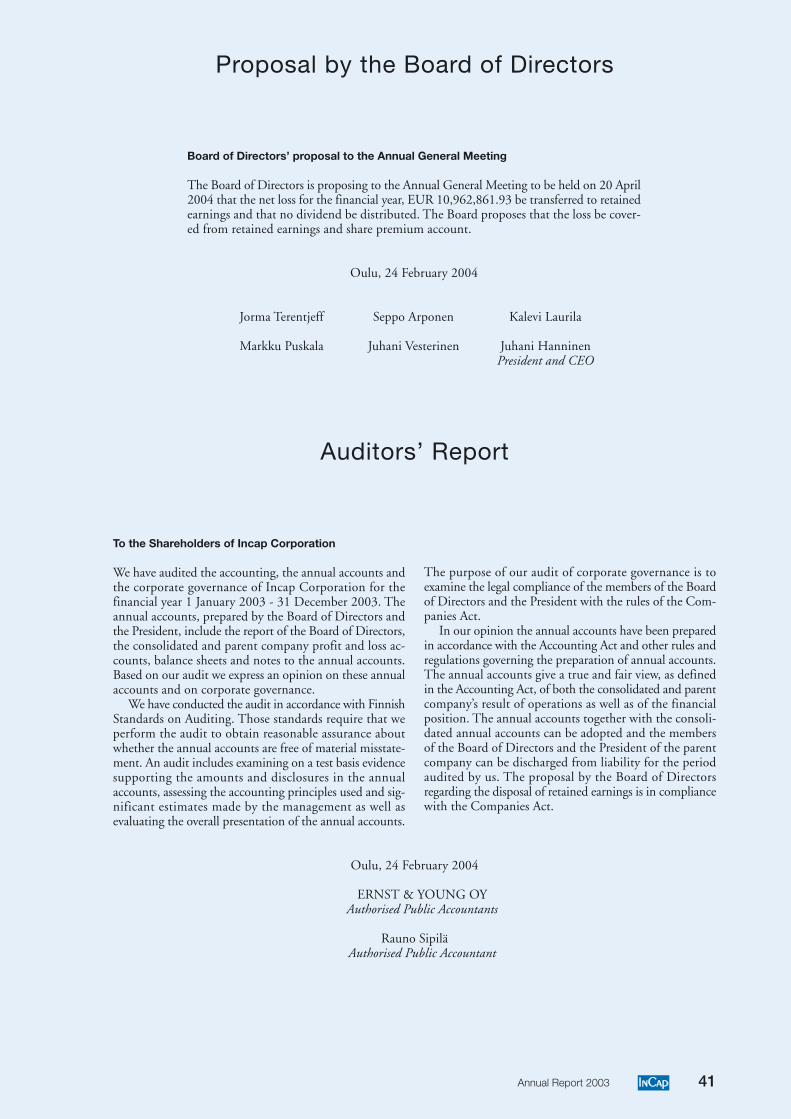
41Annual Report 2003
Auditors’ Report
To the Shareholders of Incap Corporation
We have audited the accounting, the annual accounts andthe corporate governance of Incap Corporation for thefinancial year 1 January 2003 - 31 December 2003. Theannual accounts, prepared by the Board of Directors andthe President, include the report of the Board of Directors,the consolidated and parent company profit and loss ac-counts, balance sheets and notes to the annual accounts.Based on our audit we express an opinion on these annualaccounts and on corporate governance.
We have conducted the audit in accordance with FinnishStandards on Auditing. Those standards require that weperform the audit to obtain reasonable assurance aboutwhether the annual accounts are free of material misstate-ment. An audit includes examining on a test basis evidencesupporting the amounts and disclosures in the annualaccounts, assessing the accounting principles used and sig-nificant estimates made by the management as well asevaluating the overall presentation of the annual accounts.
The purpose of our audit of corporate governance is toexamine the legal compliance of the members of the Boardof Directors and the President with the rules of the Com-panies Act.
In our opinion the annual accounts have been preparedin accordance with the Accounting Act and other rules andregulations governing the preparation of annual accounts.The annual accounts give a true and fair view, as definedin the Accounting Act, of both the consolidated and parentcompany’s result of operations as well as of the financialposition. The annual accounts together with the consoli-dated annual accounts can be adopted and the membersof the Board of Directors and the President of the parentcompany can be discharged from liability for the periodaudited by us. The proposal by the Board of Directorsregarding the disposal of retained earnings is in compliancewith the Companies Act.
Board of Directors’ proposal to the Annual General Meeting
The Board of Directors is proposing to the Annual General Meeting to be held on 20 April2004 that the net loss for the financial year, EUR 10,962,861.93 be transferred to retainedearnings and that no dividend be distributed. The Board proposes that the loss be cover-ed from retained earnings and share premium account.
Oulu, 24 February 2004
Jorma Terentjeff Seppo Arponen Kalevi Laurila
Markku Puskala Juhani Vesterinen Juhani HanninenPresident and CEO
Proposal by the Board of Directors
Oulu, 24 February 2004
ERNST & YOUNG OYAuthorised Public Accountants
Rauno SipiläAuthorised Public Accountant
42 Annual Report 2003
Shares and Shareholders
Incap Corporation has one series of shares and a total of12,180,880 shares. The share does not have a par value, andits accounting countervalue is EUR 1.68. According to thecompany’s Articles of Association, the company shall have aminimum of 10,000,000 and a maximum of 40,000,000shares; the company’s minimum share capital is 16,800,000euros and the maximum share capital 67,200,000 euros.
Incap Corporation’s shares are listed on the I List of Hel-sinki Exchanges. The company code is INC, the round lot is100 shares and the book-entry type code is INC1V. Thecompany code will change as of 1 April 2004. The new com-pany code is ICP and the new book-entry type code is ICP1V.
The price of Incap Corporation’s share varied in the rangeof EUR 2.15 to EUR 0.87 during the financial year. The lastquotation in trading at the end of the year was EUR 1.80. Atthe close of the financial year, the company had 834 share-holders, and 9.8% of the shares was owned by foreigners andnominee-registered. The total share turnover calculated ac-cording to the average number of shares, 12,180,880, was27.6% during the financial year. The company’s market capi-talisation at 30 December 2003 was EUR 21,925,584.
Authorisations by the Board of DirectorsOn 21 January 2003 the Board of Directors exercised theauthorisation it had received from the Annual General Meet-ing in 2002 by directing an issue of 702,000 warrants forsubscription by Varma Mutual Pension Insurance Company.Each warrant entitles its holder to subscribe for one IncapCorporation share from 1 June 2003 to 31 December 2005.The price of the shares to be subscribed for with the warrantsis EUR 2.50. Varma subscribed for all the warrants on 21January 2003.
On 25 April 2003 the Annual General Meeting authorisedthe Board of Directors to increase the share capital, in themanner set out in Chapter 4, Section 1, of the Companies Act,through one or more rights issues, by granting stock optionsand/or issuing convertible bonds. The authorisation is validuntil 25 April 2004 and includes the right to disapply share-holders’ pre-emptive right to subscribe for new shares. Theauthorisation granted by the Annual General Meeting wasentered in the Trade Register on 27 May 2003. On the ba-sis of the authorisation the share capital can be increased bya maximum of EUR 4,092,775.68. The Board of Directorsdid not exercise the authorisation in 2003.
Stock option scheme 1998In line with the incentive and commitment-building schemefor the personnel, in 1998 the Incap Group carried out a shareissue directed at its permanent employees, including thepossibility to subscribe for stock options. By exercising thestock options, Incap Corporation shares can be subscribed forduring 2000–2004 at a price specified in the terms and con-
ditions of the stock options. The share subscriptions coveredthe subscription of a total of 280,400 warrants. The Board ofDirectors approved the subscriptions for warrants on 31March 2000. There are a total of 51,200 valid 1998 warrants,the subscription period for which began on 1 July 2000 andwill end on 30 November 2004. As a consequence of thesubscriptions, the share capital can rise by a maximum of EUR86,000 (not an exact figure).
Stock option scheme 2000On 11 April 2000 the Annual General Meeting issued newstock options to the Group’s key employees, to the membersof the Board of Directors of Incap Corporation and the Groupcompanies as well as to Incap Corporation’s wholly-ownedsubsidiary. The stock options under the 1998 stock optionscheme could furthermore be exchanged for year 2000 war-rants in a conversion ratio determined by the Board of Direc-tors. The year 2000 stock options are divided into A, B, C andD warrants, numbering 122,700 of each. The subscriptionperiod with the A warrants began on 1 December 2000, withthe B warrants on 1 December 2001, with the C warrants on1 December 2002 and with the D warrants on 1 December2003. The subscription right for all the warrants will end on31 December 2005. The total number of warrants is 550,600and as a consequence of subscriptions, Incap Corporation’sshare capital can be increased by a maximum of EUR 925,000(not an exact figure).
On 18 April 2001 the Annual General Meeting loweredthe share subscription prices under the year 2000 stock op-tion scheme such that the subscription price of shares to besubscribed for with the A warrants is 8 euros and the price forsubscriptions with the B warrants is 10 euros. The price ofsubscribing for shares with the C and D warrants is 12 euros.The subscription price for the share will be lowered, on therecord date for each dividend payout, by the amount of theper-share cash dividends to be distributed after 11 April 2000and prior to the share subscription.
Shareholdings of the Board of Directors and the presi-dentThe members of the company’s Board of Directors and thepresident as well as the companies under their control, in ac-cordance with Chapter 1, Section 5 of the Securities MarketAct, owned a total of 2,896,272 shares, or 23.7% of the com-pany’s shares outstanding and voting rights. Under the termsof year 2000 stock option scheme, the members of the Boardof Directors have a total of 28,750 warrants, entitling themto subscribe for an equal number of shares in the manner setout in the terms and conditions of the warrants. If all the war-rants are converted into shares, the president and the Boardof Directors as well as the companies under their control willhold 24.0% of the total shares outstanding. ■
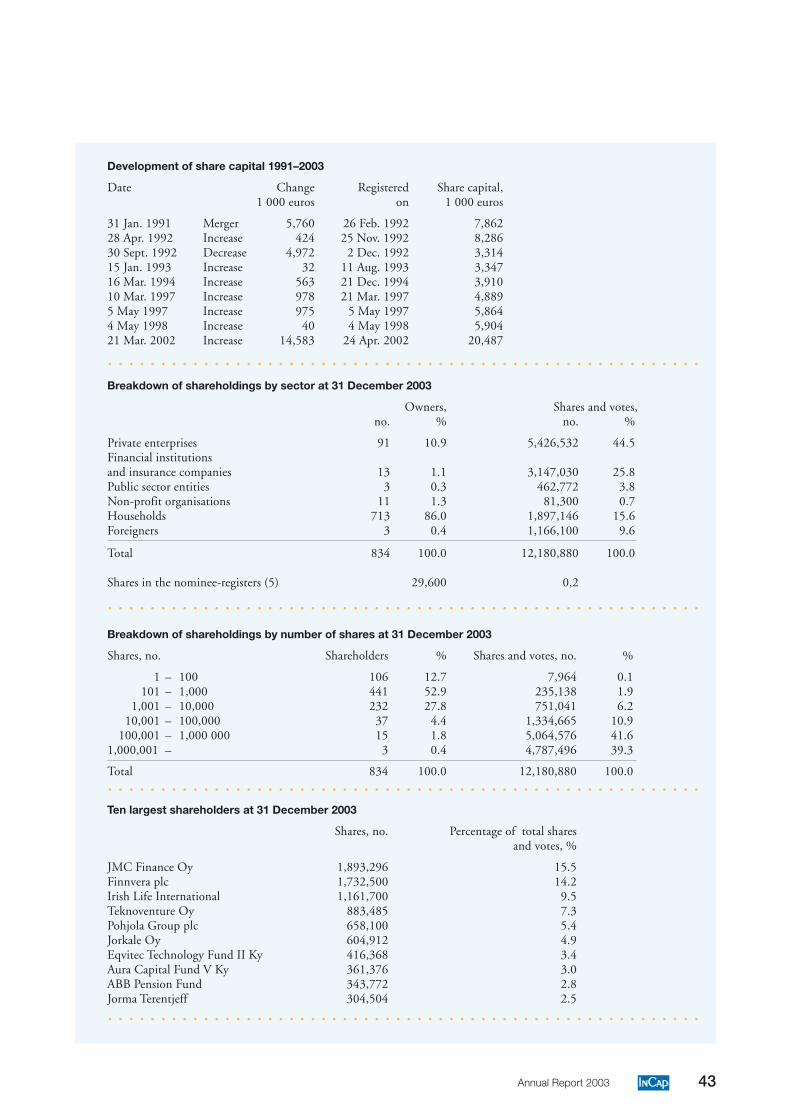
43Annual Report 2003
Development of share capital 1991–2003
Date Change Registered Share capital,1 000 euros on 1 000 euros
31 Jan. 1991 Merger 5,760 26 Feb. 1992 7,86228 Apr. 1992 Increase 424 25 Nov. 1992 8,28630 Sept. 1992 Decrease 4,972 2 Dec. 1992 3,31415 Jan. 1993 Increase 32 11 Aug. 1993 3,34716 Mar. 1994 Increase 563 21 Dec. 1994 3,91010 Mar. 1997 Increase 978 21 Mar. 1997 4,8895 May 1997 Increase 975 5 May 1997 5,8644 May 1998 Increase 40 4 May 1998 5,90421 Mar. 2002 Increase 14,583 24 Apr. 2002 20,487
Breakdown of shareholdings by sector at 31 December 2003
Owners, Shares and votes,no. % no. %
Private enterprises 91 10.9 5,426,532 44.5Financial institutionsand insurance companies 13 1.1 3,147,030 25.8Public sector entities 3 0.3 462,772 3.8Non-profit organisations 11 1.3 81,300 0.7Households 713 86.0 1,897,146 15.6Foreigners 3 0.4 1,166,100 9.6
Total 834 100.0 12,180,880 100.0
Shares in the nominee-registers (5) 29,600 0,2
Breakdown of shareholdings by number of shares at 31 December 2003
Shares, no. Shareholders % Shares and votes, no. %
1 – 100 106 12.7 7,964 0.1 101 – 1,000 441 52.9 235,138 1.9
1,001 – 10,000 232 27.8 751,041 6.2 10,001 – 100,000 37 4.4 1,334,665 10.9
100,001 – 1,000 000 15 1.8 5,064,576 41.61,000,001 – 3 0.4 4,787,496 39.3
Total 834 100.0 12,180,880 100.0
Ten largest shareholders at 31 December 2003
Shares, no. Percentage of total shares and votes, %
JMC Finance Oy 1,893,296 15.5Finnvera plc 1,732,500 14.2Irish Life International 1,161,700 9.5Teknoventure Oy 883,485 7.3Pohjola Group plc 658,100 5.4Jorkale Oy 604,912 4.9Eqvitec Technology Fund II Ky 416,368 3.4Aura Capital Fund V Ky 361,376 3.0ABB Pension Fund 343,772 2.8Jorma Terentjeff 304,504 2.5
○ ○ ○ ○ ○ ○ ○ ○ ○ ○ ○ ○ ○ ○ ○ ○ ○ ○ ○ ○ ○ ○ ○ ○ ○ ○ ○ ○ ○ ○ ○ ○ ○ ○ ○ ○ ○ ○ ○ ○ ○ ○ ○ ○ ○ ○ ○ ○ ○ ○ ○ ○ ○ ○ ○ ○
○ ○ ○ ○ ○ ○ ○ ○ ○ ○ ○ ○ ○ ○ ○ ○ ○ ○ ○ ○ ○ ○ ○ ○ ○ ○ ○ ○ ○ ○ ○ ○ ○ ○ ○ ○ ○ ○ ○ ○ ○ ○ ○ ○ ○ ○ ○ ○ ○ ○ ○ ○ ○ ○ ○ ○
○ ○ ○ ○ ○ ○ ○ ○ ○ ○ ○ ○ ○ ○ ○ ○ ○ ○ ○ ○ ○ ○ ○ ○ ○ ○ ○ ○ ○ ○ ○ ○ ○ ○ ○ ○ ○ ○ ○ ○ ○ ○ ○ ○ ○ ○ ○ ○ ○ ○ ○ ○ ○ ○ ○ ○
○ ○ ○ ○ ○ ○ ○ ○ ○ ○ ○ ○ ○ ○ ○ ○ ○ ○ ○ ○ ○ ○ ○ ○ ○ ○ ○ ○ ○ ○ ○ ○ ○ ○ ○ ○ ○ ○ ○ ○ ○ ○ ○ ○ ○ ○ ○ ○ ○ ○ ○ ○ ○ ○ ○ ○
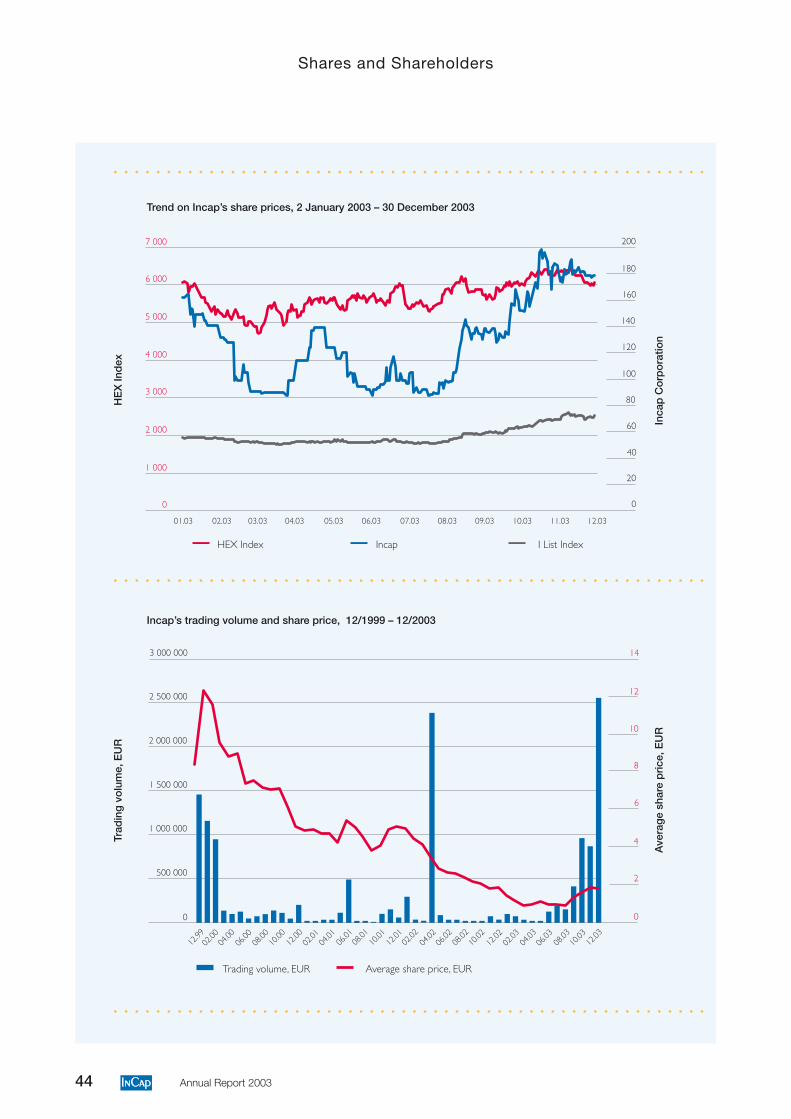
44 Annual Report 2003
Trend on Incap’s share prices, 2 January 2003 – 30 December 2003
Incap’s trading volume and share price, 12/1999 – 12/2003
HE
X In
dex
Incap
Trading volume, EUR
Inca
p C
orp
ora
tion
HEX Index
Trad
ing
vo
lum
e, E
UR
Ave
rag
e sh
are
pri
ce, E
UR
Average share price, EUR
○ ○ ○ ○ ○ ○ ○ ○ ○ ○ ○ ○ ○ ○ ○ ○ ○ ○ ○ ○ ○ ○ ○ ○ ○ ○ ○ ○ ○ ○ ○ ○ ○ ○ ○ ○ ○ ○ ○ ○ ○ ○ ○ ○ ○ ○ ○ ○ ○ ○ ○ ○ ○ ○ ○ ○
○ ○ ○ ○ ○ ○ ○ ○ ○ ○ ○ ○ ○ ○ ○ ○ ○ ○ ○ ○ ○ ○ ○ ○ ○ ○ ○ ○ ○ ○ ○ ○ ○ ○ ○ ○ ○ ○ ○ ○ ○ ○ ○ ○ ○ ○ ○ ○ ○ ○ ○ ○ ○ ○ ○ ○
○ ○ ○ ○ ○ ○ ○ ○ ○ ○ ○ ○ ○ ○ ○ ○ ○ ○ ○ ○ ○ ○ ○ ○ ○ ○ ○ ○ ○ ○ ○ ○ ○ ○ ○ ○ ○ ○ ○ ○ ○ ○ ○ ○ ○ ○ ○ ○ ○ ○ ○ ○ ○ ○ ○ ○
0
500 000
1 000 000
1 500 000
2 000 000
12.99
02.00
04.00
0
2
4
6
8
10
3 000 000
2 500 000 12
14
06.00
08.00
10.00
12.00
04.01
02.01
06.01
08.01
10.01
12.01
02.02
04.02
10.02
12.02
08.02
06.02
02.03
08.03
10.03
12.03
06.03
04.03
0
2 000
3 000
4 000
5 000
01.03 02.03 03.03 04.03 05.03 06.03 07.03 08.03 09.03 10.03 11.03 12.03
0
20
40
60
80
100
7 000
6 000
1 000
120
140
160
180
200
I List Index
Shares and Shareholders
45Annual Report 2003
Corporate Governance
During the 2003 report period, the Incap Group has compliedwith the recommendation on the Corporate Governance ofpublicly listed companies, issued by the Central Chamber ofCommerce of Finland and the Confederation of FinnishIndustry and Employers in 1997. On 1 July 2004, IncapCorporation will begin to apply the new recommendation onthe Corporate Governance of listed companies, which waspublished by the Helsinki Stock Exchange (HEX Plc), theCentral Chamber of Commerce and the Confederation ofFinnish Industry and Employers in December 2003.
Annual General MeetingIncap Corporation’s highest decision-making body is thegeneral meeting of shareholders, which convenes once a yearin an Annual General Meeting. The tasks falling within thecompetence of the Annual General Meeting are defined in theCompanies Act and the Articles of Association.
Board of DirectorsThe administration of Incap Corporation and the due arrange-ment of its operations are attended to by the Board of Direc-tors, which according to the Articles of Association has fromthree to seven members. The Annual General Meeting decideson the number of members of the Board of Directors andelects the directors. The term of office of members of theBoard of Directors commences from the date of the AnnualGeneral Meeting at which they were elected and ends at theclose of the next Annual General Meeting. Directors can bere-elected.
The Annual General Meeting held on 25 April 2003 re-elected Seppo Arponen, Kalevi Laurila, Markku Puskala,Jorma Terentjeff and Juhani Vesterinen to seats on the Boardof Directors. The Board of Directors elected Jorma Terentjeffchairman.
Incap Corporation’s Board of Directors approves theGroup-wide objectives that are drawn from the strategy andannual plans of the operating Group companies and decideson strategic investments, purchases of business operations, ac-quisitions and divestments.
The Board of Directors meets as required. In 2003 theBoard of Directors met 21 times.
Executive CommitteeThe Board of Directors has appointed from amongst itsnumber an Executive Committee which prepares matters tobe dealt with in meetings of the Board of Directors and over-sees the implementation of development projects approvedby the Board. The members of the Executive Committee areJorma Terentjeff, chairman of the Board of Directors, as wellas the Board members Juhani Vesterinen and Kalevi Laurila.
President and CEOThe company’s line operations are managed by the president,who is elected by the Board of Directors and carries out hisduties in accordance with the instructions and regulationsissued by the Board. The Board of Directors decides on thepresident’s salary and other compensation. The principal termsand conditions of the president’s executive post are definedin a written chief executive contract.
The employment contract of Incap Corporation’s presidentand CEO Seppo Ropponen ended on 7 July 2003, afterwhich Rauni Nokela served as acting president. JuhaniHanninen assumed the duties of president and CEO on1 September 2003.
Management TeamIncap Corporation’s president heads the Management Team,whose members are the managers in charge of individualfunctions. The Management Team meets once a month.
The salaries and other compensation of the Group’s man-agement and the Management Team are decided by the Boardof Directors.
InsidersThe Incap Group’s instructions to insiders are in accordancewith Helsinki Exchanges’ guidelines that entered into forceon 1 March 2000. The company had a total of 40 permanentinsiders at 31 December 2003.
Persons belonging to the group of permanent insiders mustnot trade in the company’s shares or securities comparable withshares during the 14 days prior to the publication of an in-terim report or financial statement bulletin. The appropriatetime for such trading is in 28 days from publication of aninterim report and financial statement bulletin, neverthelesswith the provision that a person who is a permanent insiderdoes not have in his or her possession at that time any otherinsider information. The members of the Board of Directorsand the Management Team as well as the secretary to theBoard of Directors must always ascertain the appropriatenessof their own trading by checking with the Chief FinancialOfficer prior to the making of buy or sell orders.
Persons who are temporary insiders must not engage intrading in the company’s shares during the time when theyare insiders participating in a given project.
The Group’s permanent insiders are recorded in a registerkept by Finnish Central Securities Depository Limited, whichis overseen by the Financial Supervision Authority. A regis-ter of project-specific insiders is kept by Corporate Admin-istration. ■

46 Annual Report 2003
Board of Directors
Jorma Terentjeff ChairmanIndustrial Counsellor, M.Sc. (Eng.), born 1949
Jorma Terentjeff has been a member of the Board of Directorsof Incap Corporation since 2001. He is Chairman of the Boardof Avanti Group Oy and previously has served as CEO of JOTAutomation Group Ltd from 1995 to 2000. Prior to these postshe was CEO of Teknoventure Oy, Aspocomp Oyj and OyEdacom Ab and he has served in a number of positions withHansacom Oy, Salcomp Oy and Salora Oy. He is also a mem-ber of several other corporate boards. He is one of the ten largestshareholders in Incap.
Seppo ArponenIndustrial Councellor, M.Sc. (Econ.), born 1943
Seppo Arponen was appointed to the Board of Directors ofIncap Corporation in 2002. He has served as COO of Finnveraplc since 1999. He previously held a number of positions inFinnvera’s predecessor organisations Kehitysaluerahasto Oy andKera Corporation, beginning in 1976. He is also a member ofseveral other corporate boards.
Kalevi LaurilaB.Sc.(Eng.), Executive MBA, born 1947
Kalevi Laurila was named to the Board of Directors of IncapCorporation in 2002. Previously he was CEO of JMC ToolsOy and Turveruukki Oy as well as a director at RautaruukkiOyj. He is also a member of several other corporate boards andis one of the ten largest shareholders in Incap.
Markku PuskalaM.Sc. (Eng.), M.Sc. (Econ.), born 1948
Markku Puskala has been a member of the Board of Directorsof Incap Corporation since 2002. Since 1998 he has been aSenior Partner of Eqvitec Partners. He has previously workedfor SFK-Finance Oy, Valmet Paper Machinery, Sensodec/Valmet Oyj, Sensodec Inc., Neles Ges. mbH, and FinnatomOy. He is a member of the Board of Directors of, among othercompanies, Normet Corporation and Teletekno Corporation.
Juhani VesterinenM.Sc. (Econ.), M.Sc. (Nat.Sc.), born 1953
Juhani Vesterinen has been a member of the Board of Directorsof Incap since 1998 and has served as chairman of the Boardfrom 1999 to 2002. During 1983-2001 he has worked in sev-eral executive positions with the Sampo Group, most recentlyas CEO of Yritys-Sampo as well as Sampo Life InsuranceCompany Limited and as deputy CEO of the former SampoInsurance Company. Juhani Vesterinen is a member of severalother boards of directors and is one of the ten largest sharehold-ers in Incap. Juhani Vesterinen is a member of Hallitusam-mattilaiset ry (Board Professionals reg. assoc.).
From left: Seppo Arponen, Jorma Terentjeff, Kalevi Laurila, Markku Puskala and Juhani Vesterinen
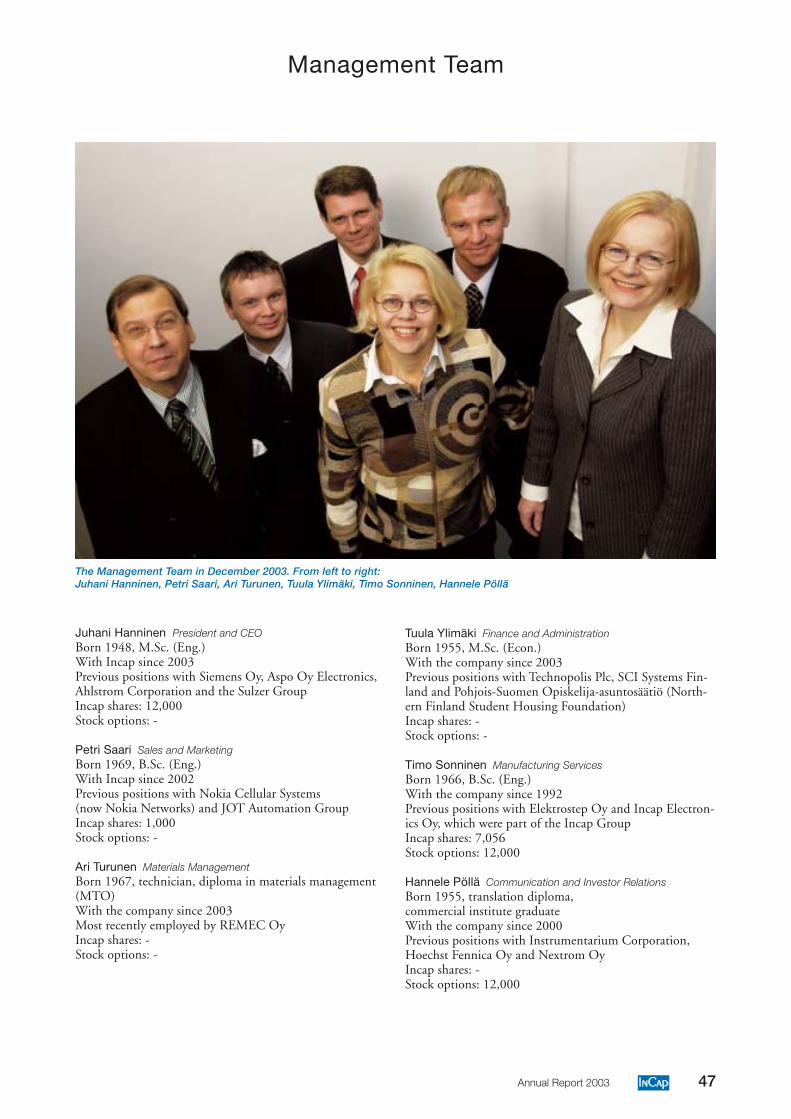
47Annual Report 2003
Management Team
Juhani Hanninen President and CEOBorn 1948, M.Sc. (Eng.)With Incap since 2003Previous positions with Siemens Oy, Aspo Oy Electronics,Ahlstrom Corporation and the Sulzer GroupIncap shares: 12,000Stock options: -
Petri Saari Sales and MarketingBorn 1969, B.Sc. (Eng.)With Incap since 2002Previous positions with Nokia Cellular Systems(now Nokia Networks) and JOT Automation GroupIncap shares: 1,000Stock options: -
Ari Turunen Materials ManagementBorn 1967, technician, diploma in materials management(MTO)With the company since 2003Most recently employed by REMEC OyIncap shares: -Stock options: -
Tuula Ylimäki Finance and AdministrationBorn 1955, M.Sc. (Econ.)With the company since 2003Previous positions with Technopolis Plc, SCI Systems Fin-land and Pohjois-Suomen Opiskelija-asuntosäätiö (North-ern Finland Student Housing Foundation)Incap shares: -Stock options: -
Timo Sonninen Manufacturing ServicesBorn 1966, B.Sc. (Eng.)With the company since 1992Previous positions with Elektrostep Oy and Incap Electron-ics Oy, which were part of the Incap GroupIncap shares: 7,056Stock options: 12,000
Hannele Pöllä Communication and Investor RelationsBorn 1955, translation diploma,commercial institute graduateWith the company since 2000Previous positions with Instrumentarium Corporation,Hoechst Fennica Oy and Nextrom OyIncap shares: -Stock options: 12,000
The Management Team in December 2003. From left to right:Juhani Hanninen, Petri Saari, Ari Turunen, Tuula Ylimäki, Timo Sonninen, Hannele Pöllä
48 Annual Report 2003
Press Releases in 2003
JanuaryIncap’s Board of Directors carries out a directed issueof 702,000 warrants for subscription by Varma MutualPension Insurance Company in accordance with theauthorisation granted to it by the Annual GeneralMeeting. Granting of the warrants is part of a twomillion euro financing arrangement that will strengthenIncap’s financial structure. Each warrant entitles tosubscribe for one share during the period from 1 June2003 to 31 December 2005 at a subscription price ofEUR 2.50 per share. (21 January 2003)
Metso Automation Oy and Incap sign a co-opera-tion agreement on design services. (23 January 2003)
FebruaryGiwano Computers Ltd. and Incap sign a co-operationagreement on the manufacturing of safe computers. (7February 2003)
Solotop Oy and Incap sign a co-operation agreementby which Solotop’s entire scale production is outsourcedto Incap. The agreement covers, among other things, themanufacture, assembly and testing of retail andhealthcare scales. The agreement is in accordance withIncap’s strategy that is geared to integrated deliveries,and the products fit in well with the company’s produc-tion structure. (11 February 2003)
Incap’s financial statements for 2002 show that theGroup’s pro forma net turnover declined by 12% on theprevious year, to EUR 63.2 million. The pro formaoperating result was in the red and declined to a loss ofEUR 6.3 million compared with the previous year’s proforma operating loss of EUR 5.2 million. The Group’sofficially reported net turnover was EUR 69.0 million,or about 30% lower than in the previous year. Theofficially reported operating result was likewise in thered, a loss of EUR 3.8 million. (25 February 2003)
MarchNo bulletins.
AprilFinn-Power Oy and Incap sign a Letter of Intent, ac-cording to which Finn-Power’s sheet metal fabricationand electrical assembly businesses in Alahärmä andKauhava will be transferred to Incap at the beginningof May. (7 April 2003)
The Annual General Meeting is held on 25 April2003 in Helsinki. The meeting changes the company’sdomicile to Oulu and grants the Board of Directorsauthorisations to increase the share capital through arights issue, an issue of convertible bonds and/or thegranting of stock options. (25 April 2003)
MayThe Letter of Intent signed with Finn-Power Oy lapsesbecause a final agreement has not been concluded bythe deadline. (2 May 2003)
Incap and Franke Finland Oy, which manufactureswasher-disinfectors for hospitals and laboratories, signa co-operation agreement on electronics manufacture,testing and testing design. (6 May 2003)
Net turnover in January-March fell by 10% com-pared with the pro forma net turnover in the sameperiod of last year and was EUR 15.3 million. Com-pared with the previous quarter, net turnover declinedby 6%. The operating result improved by 43% on theprevious year’s same-quarter pro forma result and wasa loss of EUR 0.7 million. Compared with the previ-ous quarter, the result rose by 15%. The improvementin the operating result was attributable to the savingsmeasures that were started in 2002 and to an increasein productivity. (14 May 2003)
JuneIncap and Environics Oy, which manufactures gas detec-tors and environmental monitoring systems, sign a co-operation agreement on the manufacture of the ChemProgas detector that is intended for military use. (19 June2003)
49Annual Report 2003
JulyJuhani Hanninen, M.Sc. (Eng.), is appointed as the newpresident and CEO of Incap Corporation effective1 September. (7 July 2003)
AugustTuula Ylimäki, M.Sc. (Econ.), is appointed as theGroup’s new chief financial officer effective 1 October.(6 August 2003)
Net turnover in January-June fell by 12% on thefigure reported for the same period of last year and wasEUR 29.9 million. The operating result improved by48% on the same-quarter pro forma result in 2002 andwas a loss of EUR 1.2 million. Second-quarter netturnover was down 4% on the first quarter, to EUR 14.6million. The operating result improved by 10% on theprevious quarter but was a loss of EUR 0.6 million. Theoperating result included EUR 0.3 million of non-re-curring costs. (20 August 2003)
SeptemberIncap streamlines its operations through an organisa-tional revamp that goes into effect at the beginning ofNovember. The objective is to improve customer serv-ice, clarify ways of working among the different pro-duction units, gear operations towards extensive totaldeliveries and increase the efficiency of materials func-tions. According to President and CEO JuhaniHanninen, the new, clearly defined organisationalstructure will help to allocate resources correctly: “In-stead of operating as individual factories or businesses,we’ll be a close, unified team, and customers will per-ceive this in the form of better total service. By step-ping up materials management, we’ll improve profit-ability and increase our competitiveness.” (30 Septem-ber 2003)
OctoberNo bulletins.
NovemberNet turnover in January-September fell by 4% on thefigure reported for the same period of last year and wasEUR 45.2 million The operating result, however, im-proved by 68% on the previous year’s operating loss ofEUR 5.5 million and was a loss of EUR 1.7 million.The operating result for January-September includednon-recurring costs totalling EUR 1.0 million. Third-quarter net turnover was up 5% on the previous quarter,to EUR 15.3 million. The operating result for the pe-riod improved by 15% on the previous quarter but wasstill in the red, a loss of EUR 0.5 million. Operation-ally, the third-quarter result was nevertheless in theblack, because the operating result included a total ofEUR 0.7 million of non-recurring costs. (19 Novem-ber 2003)
DecemberJorma Terentjeff, chairman of Incap Corporation’sBoard of Directors and one of Incap’s largest share-holders, sells a total of 1,161,700 Incap shares to IrishLife International Ltd, whereby his holding in Incap’sshares falls from 12 per cent to 2.5 per cent. Irish LifeInternational Ltd thereby becomes Incap’s third-largestowner by virtue of its 9.5 per cent shareholding.(3 December 2003) ■
50 Annual Report 2003
Information for Shareholders
Annual General MeetingThe Annual General Meeting of Incap Corporation will beheld on Tuesday, 20 April 2004 beginning at 2.00 p.m. in theOulu Radisson SAS hotel at the address Hallituskatu 1, Oulu.In order to attend the Annual General Meeting, sharehold-ers must be registered in the Shareholder Register kept byFinnish Central Securities Depository Ltd no later than by 8April 2004.
Registration for attending the AGM must be made no laterthan 4.00 p.m. on 13 April 2004. Notification can be madeby◆ mailing a letter to Incap Corporation,
Kempeleentie 46, 90440 Kempele,◆ or by telephone on +358 10 5628 227 /
Maija Aronen or by email to [email protected]◆ or by fax on +358 10 5628 250.
It is requested that any proxies be delivered when registeringfor the meeting.
Financial information in 2004
The publication dates for financial reports are the following:
◆ Financial Statement Bulletin for 2003on Wednesday, 25 February 2004
◆ Interim Report for January-Marchon Wednesday, 5 May 2004.
◆ Interim Report for January-Juneon Wednesday, 11 August 2004.
◆ Interim Report for January-Septemberon Wednesday, 10 November 2004.
Incap’s Annual Report, Interim Reports as well as stock ex-change releases are published in Finnish and English. Theyare also available on the company’s website at the addresswww.incap.fi. The main information directed at investors isgrouped under the website heading “Investors”.
The company’s stakeholder magazine Incap Info comes outtwice a year and it is mailed to the addresses in the ShareholderRegister kept by Finnish Central Securities Depository Ltd.Subscriptions to the magazine can be made by registering onthe company’s website.
Shareholders must make notification of changes of addressby reporting the information to the book-entry register inwhich they have a book-entry account.
All publications can be ordered fromCorporate Communications◆ at the address Incap Corporation / Corporate
Communications,Valuraudankuja 7, 00700 Helsinki,
◆ by telephone on +358 10 612 5613 / Maria Fernelius,◆ by email at the address [email protected]◆ or on the company’s website at the address
www.incap.fi.
Investor relationsThe objective of Incap’s investor communications is to provideprecise and up-to-date information on the Incap Group’s busi-ness operations and financial development. The companyseeks to ensure that all market participants receive informationthat is the same and adequate, so that they can assess thecompany as a prospective investment.
Incap’s investor relations are managed and co-ordinated byHannele Pöllä, Director Communications & IR, tel. +358 10612 5616, [email protected]. ■
51Annual Report 2003
Contact Information
Incap Corporation
Domicile: Oulue-mail: [email protected]: www.incap.fi
Corporate OfficeKempeleentie 46, FI-90440 Kempele, FinlandTel. +358 10 612 11Fax +358 10 5628 250
Helsinki UnitValuraudankuja 7, FI-00700 Helsinki, FinlandTel. +358 10 612 11Fax +358 10 612 5650
Kempele UnitKempeleentie 46, FI-90440 Kempele, FinlandTel. +358 10 612 11Fax +358 10 5628 250
Ruukki UnitAhlströmintie 1, FI-92400 Ruukki, FinlandTel. +358 10 612 11Fax +358 10 5628 240
Vaasa UnitStrömbergin Puistotie 6 B, FI-65320 Vaasa, FinlandTel. +358 10 612 11Fax +358 10 612 4077
Vuokatti UnitLastaajantie 3, FI-88610 Vuokatti, FinlandTel. +358 10 612 11Fax +358 10 612 6288
Estonian UnitIncap Electronics Estonia OÜPikk 59B, EE-93802 Kuressaare, EstoniaTel. +358 10 612 18Fax +358 10 612 8890
Ultraprint OyVääräojantie 6, FI-90440 Kempele, FinlandTel. +358 8 520 8701Fax +358 8 520 8721
○
○
○
○
○
○
○
○
○
○
○
○
○
○
○
○
○
○
○
○
○
○
○
○
○
○
○
○
○
○
○
○
○
○
○
○
○
○
○
○
○
○
○
○
○
○
○
○
○
○
○
○
○
○
○
○
○
○
○
○
○
○
○
○

Incap® 2004
The Incap Annual Report has been printed by Frenckellin Kirjapaino Oy, on evironmentally friendly Galerie Art Silk paper.
Graphic design: Graphic Design Studio Oy Ab

Incap Corporation
Kempeleentie 46FI-90440 Kempele, FinlandTel. +358 10 61211Fax +358 10 5628 250
www.incap.fi