Embed Size (px)
Citation preview
A multiwavelength study of Cygnus X-1: the first mid-infrared spectroscopic detection of compact jets
Farid Rahoui 1
Julia C. Lee1
Sebastian Heinz2
Dean C. Hines3
Katja Pottschmidt4
Jam Wilms5
Victoria Grinberg5
Received _________ _ accepted _________ _
1 Harvard University, Department of Astronomy & Harvard-Smithonian Center for
Astrophysics, 60 Garden street, Cambridge, MA 02138, USA; [email protected],
2 Astronomy Department. University of Wisconsin-Madison, 475. N. Charter St., Madi
son, WI 53706, USA; [email protected]
3Space Telescope Science Institute, N406, 3700 San Martin Drive, Baltimore, MD 21218,
USA; [email protected]
4CRESST, UMBC, and NASA Goddard Space Flight Center, Greenbelt, NID 20771,
USA; katj [email protected]
5Dr. Karl Remeis-Observatory & ECAP, University of Erlangen-Nuremberg,
S temwart str. 7, 96049 Bamberg, Germany; [email protected],
https://ntrs.nasa.gov/search.jsp?R=20110012857 2018-08-28T03:36:01+00:00Z
2-
ABSTRACT
We report on a Spitzer/IRS (mid-infrared), RXTE /PCA+HEXTE (X
ray), and Ryle (radio) simultaneous multi-wavelength study of the micro quasar
Cygnus X-I, which aimed at an investigation of the origin of its mid-infrared
emission. Compact jets were present in two out of three observations, and we
show that they strongly contribute to the mid-infrared continuum. During the
first observation, we detect the spectral break where the transition from the
optically thick to the optically thin regime takes place - at about 2.9 x 10¹³ Hz.
We then show that the jet's optically thin synchrotron emission accounts for
the Cygnus X-1's emission beyond 400 keY, although it cannot alone explain
its 3 200 ke V continuum. A compact jet was also present during the second
observation, but we do not detect the break, since it has likely shifted to higher
frequencies. In contrast, the compact jet was absent during the last observation,
and we show that the 5 30 J.Lm mid-infrared continuum of Cygnus X-I stems
from the blue supergiant companion star HD 226868. Indeed, the emission can
then be understood as the combination of the photospheric Raleigh-Jeans tail and
the bremsstrahlung from the expanding stellar wind. Yloreover, the stellar wind
is found to be clumpy, with a filling factor f= :::::: 0.09 0.10. Its bremsstrahlung
emission is likely anti-correlated to the soft X-ray emission, suggesting an anti
correlation between the mass-loss and mass-accretion rates. Nevertheless, we do
not detect any mid-infared spectroscopic evidence of interaction between the jets
and the Cygnus X-1's environment and/or companion star's stellar wind.
Subject {I,(-;(,;JL'l!IWS: binaries: close X-rays: binaries - Infrared: stars dust.
extinction Stars: individual: Cygnus X-I ISy1: and outflows
-3-
1. Introduction
Accretion-ejection phenomena are responsible for the strong radiojinfraredjX-rays
correlations observed in micro quasars (see e.g. Mirabel et al. 1998; Corbel & Fender 2002;
Gallo et al. 2003; Coriat et al. 2009). Indeed, some of the accreted material is returned
to the interstellar medium (ISM) through collimated relativistic ejections, whose power
law-like synchrotron radiation (Fv ex va) is thought to extend from the radio to the X-ray
domains. The best known are the so-called compact jets, only detected in the hard state
(HS), whose spectral continuum is well-modeled by a flat or weakly-inverted power law in
the optically thick regime (0 :S a :S 0.2) and decreasing in the optically thin one, with
a ranging between -0.4 and -1 depending on the electron energy distribution (for a
-0.6 canonical value, Blandford & Koenigl 1979; Falcke & Biermann 1995). To date, the
spectral break where this transition takes place has only been detected photometrically in
two sources, GX 339-4 and 41; 0614+091 (Corbel & Fender 2002; Migliari et al. 2006,
2010). Yet the knowledge of this cut-off frequency is crucial for a full understanding of the
properties of the compact jets, as it is closely related to the original physical conditions,
such as the magnetic field, the base radius of the jet, and the total energy of the electron
population.
Among microquasars, Cygnus X-I (Bowyer et al. 1965) is one of the few classified as a
high mass X-ray binary (HMXB). It is composed of an 8-16 A10 black hole (Shaposhnikov
& Titarchuk 2007; Caballero-Nieves et al. 2009) bound to the 17-31 09.7 ab supergiant
HD 226868 (Walborn 1973; Iorio 2008; Caballero-Nieves et al. 2009). It has a quasi-circular
5.6 d orbit (Brocksopp et al. 1999a, and reference therein), with an associated inclination
in the range of 23° - 43° (Gies et al. 2003; Caballero-Nieves et al. 2009). The distance to
the source is still a matter of debate, but several studies have found values between 1.5 and
2.5 kpc (Ziolkowski 2005; Caballero-Nieves et al. 2009, and reference
4-
Xiang et al. (2011) found 1.80 kpc with a 7% accuracy from X-ray dust scattering halo
studies. Moreover, Reid et al. (2011) derived 1.86 kpc with a 6% accuracy, from radio
parallax measurements obtained with the very large baseline array (VLBA) at 8.4 GHz
between 2009 Jan 23 and 2010 Jan 25. Both results are consistent with 2 kpc within the
uncertainties, and we adopt this value in this study.
Cygnus X-I spends two-thirds of its time in the HS (Wilms et al. 2006). Indeed,
although the companion is close to filling its Roche lobe, the transfer of material takes
place through the strong stellar winds that are focused towards the black hole (see Gies &
Bolton 1986; Gies et al. 2003; Hanke et al. 2009). This lower accretion rate transfer is less
effective than for Roche lobe overflow microquasars, thereby most of the time preventing
the transition to a disk-dominated soft state (SS, see e.g. Pottschmidt et al. 2000, 2003).
Instead, the source often exhibits a so-called failed-state transition, characterized by a
continuous increase of the X-ray flux up to an intermediate state (IS), followed by a strong
decrease and a return to the HS, with possible launches of discrete ejections. Finally, its
emission appears to be in phase with the orbital period in most of the spectral domains in
which the source has been detected, (Pooley et al. 1999; Brocksopp et al. 1999a; Lachowicz
et al. 2006). This includes the radio activity, which is similar to that of other microquasars.
In particular, the compact jets, characterized by a very flat spectrum (ex ::; 0.1) and
a 10-25 mJy flux density level are detected in the HS (Fender et al. 2000; Stirling et al. 2001).
In this paper, we report on a mid-infrared C~HR), radio, and X-ray multi-wavelength
study of Cygnus X-I, with a focus on ~nR spectroscopy. Our goals are to (1) assess the
origin of the MIR emission, (2) compare the possible variation of the MIR continuum to
that of the X-ray and/or radio emission, and (3) detect any spectroscopic feature arising
from an interaction between the the stellar wind, the interstellar medium
(ISM). The observations and the data reduction are presented in Sect. 2, while Sect. 3
is devoted to the X-ray and radio study. In Sect. 4 and Sect. 5, we analyze the broad
band MIR to radio SEDs of the source and the spectroscopic contents of the MIR spectra,
respectively. Finally, we discuss the outcomes in Sect. 6. A companion paper, Lee et al. (in
prep), will focus on the dust content of Cygnus X-I.
2. Observations and data reduction
Cygnus X-I was observed on UT 2005 ~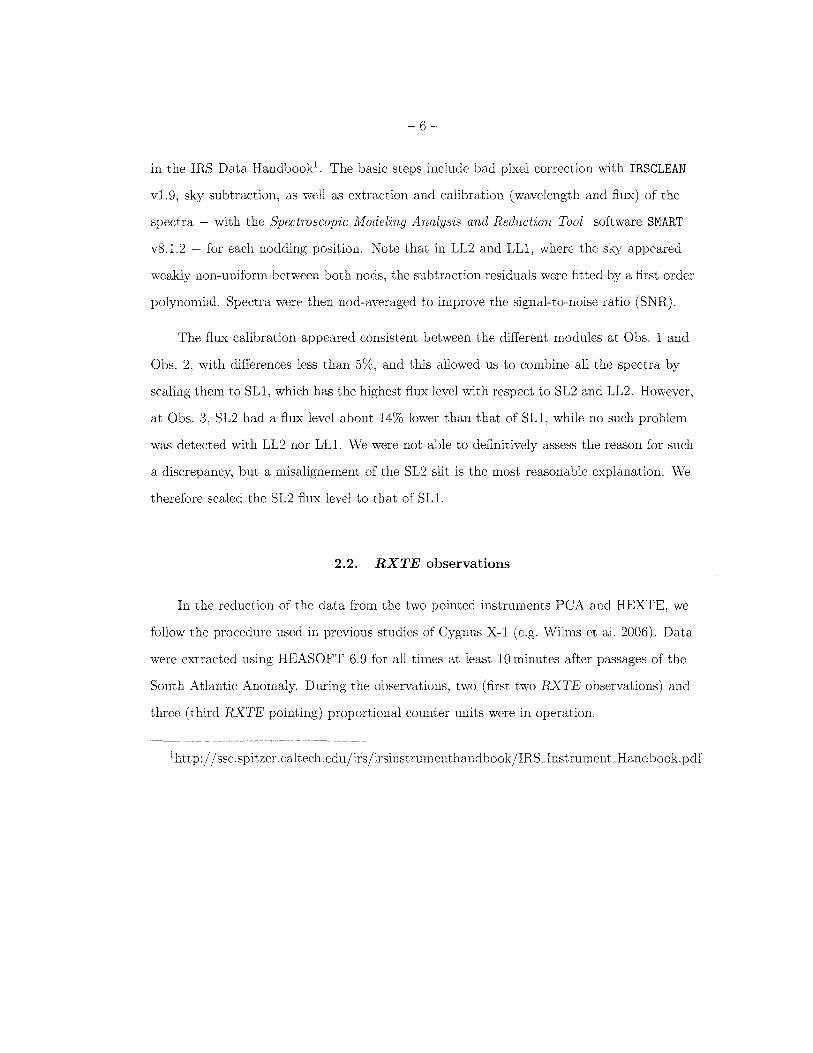
-6-
in the IRS Data Handbook1. The basic steps include bad pixel correction with IRSCLEAN
v1.9, sky subtraction, as well as extraction and calibration (wavelength and flux) of the
spectra - with the Spectroscopic Modeling Analysis and Reduction Tool software SMART
v8.1.2 for each nodding position. Note that in LL2 and LLl, where the sky appeared
weakly non-uniform between both nods, the subtraction residuals were fitted by a first order
polynomial. Spectra were then nod-averaged to improve the signal-to-noise ratio (SNR).
The flux calibration appeared consistent between the different modules at Obs. 1 and
Obs. 2, with differences less than 5%, and this allowed us to combine all the spectra by
scaling them to SLl, which has the highest flux level with respect to SL2 and LL2. However,
at Obs. 3, SL2 had a flux level about 14% lower than that of SLl, while no such problem
was detected with LL2 nor LL1. We were not able to definitively assess the reason for such
a discrepancy, but a misalignement of the SL2 slit is the most reasonable explanation. We
therefore scaled the SL2 flux level to that of SL1.
2.2. RXTE observations
In the reduction of the data from the two pointed instruments PCA and HEXTE, we
follow the procedure used in previous studies of Cygnus X-I (e.g. Wilms et al. 2006). Data
were extracted using HEASOFT 6.9 for all times at least 10 minutes after passages of the
South Atlantic Anomaly. During the observations, two (first two RXTE observations) and
three (third RXTE pointing) proportional counter units were in operation.
1 http:j j ssc.spitzer.caltech.edujirsjirsinstrumenthandbookjIRS_InstrumenLHandbook. pdf
-7
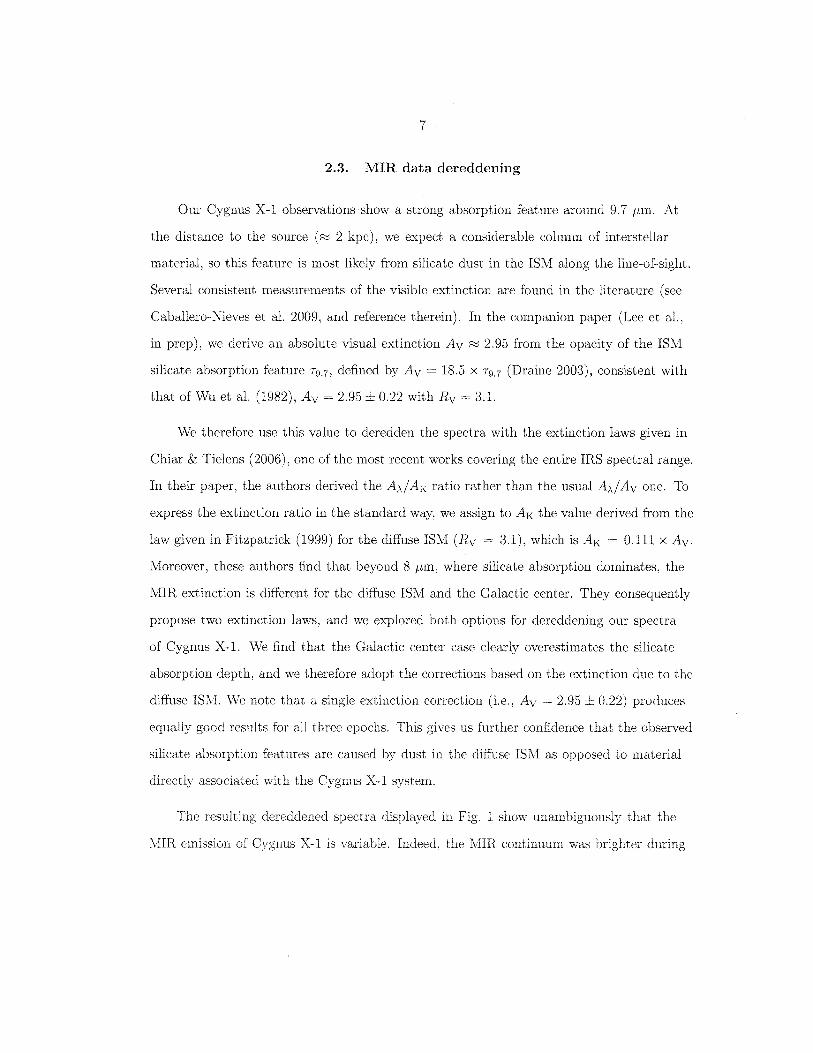
2.3. MIR data dereddening
Our Cygnus X-I observations show a strong absorption feature around 9.7 pm. At
the distance to the source (~ 2 kpc), we expect a considerable column of interstellar
material, so this feature is most likely from silicate dust in the ISM along the line-of-sight.
Several consistent measurements of the visible extinction are found in the literature (see
Caballero-Nieves et al. 2009, and reference therein). In the companion paper (Lee et al.,
in prep), we derive an absolute visual extinction Av ~ 2.95 from the opacity of the ISM
silicate absorption feature T9.7, defined by Av 18.5 X T9.7 (Draine 2003), consistent with
that of Wu et al. (1982), Av = 2.95 ± 0.22 with Rv 3.1.
We therefore use this value to deredden the spectra with the extinction laws given in
Chiar & Tielens (2006), one of the most recent works covering the entire IRS spectral range.
In their paper, the authors derived the A,,/AK ratio rather than the usual A,,/Av one. To
express the extinction ratio in the standard way, we assign to AK the value derived from the
law given in Fitzpatrick (1999) for the diffuse ISM (Rv 3.1), which is AK 0.111 x Av.
Moreover, these authors find that beyond 8 pm, where silicate absorption dominates, the
MIR extinction is different for the diffuse ISM and the Galactic center. They consequently
propose two extinction laws, and we explored both options for dereddening our spectra
of Cygnus X-I. We find that the Galactic center case clearly overestimates the silicate
absorption depth, and we therefore adopt the corrections based on the extinction due to the
diffuse ISM. We note that a single extinction correction (i.e., Av = 2.95 ± 0.22) produces
equally good results for all three epochs. This gives us further confidence that the observed
silicate absorption features are caused by dust in the diffuse ISM as opposed to material
directly associated with the Cygnus X-I system.
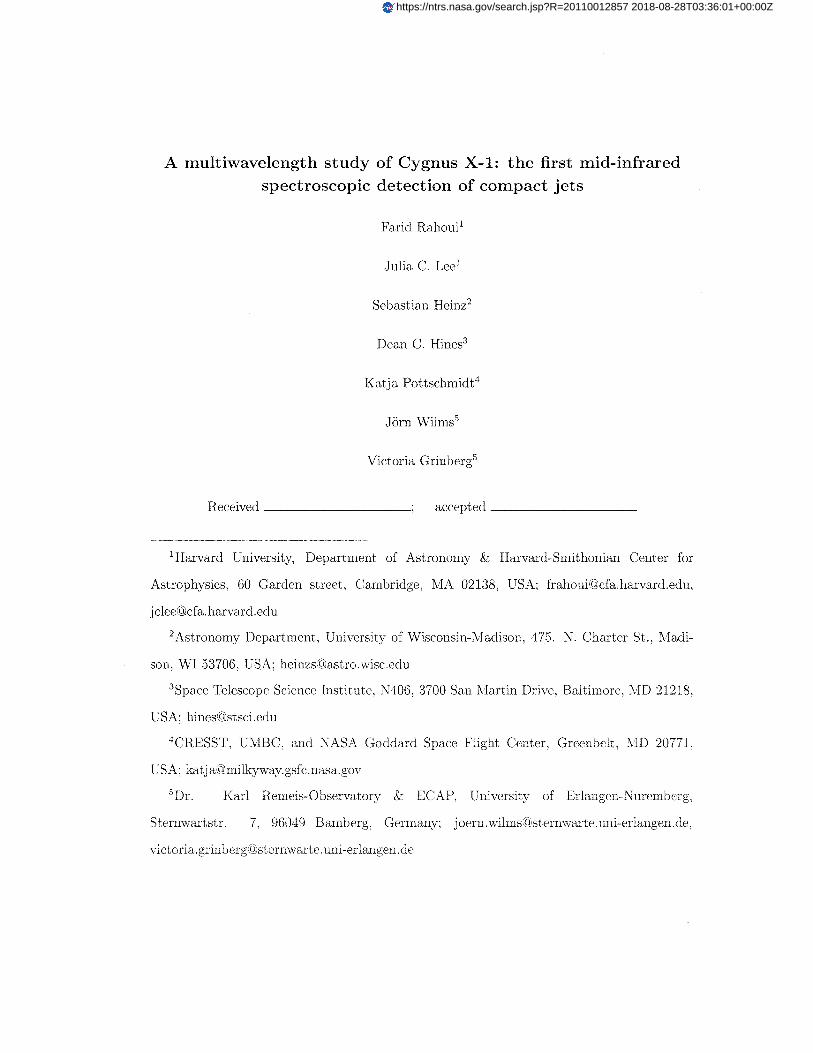
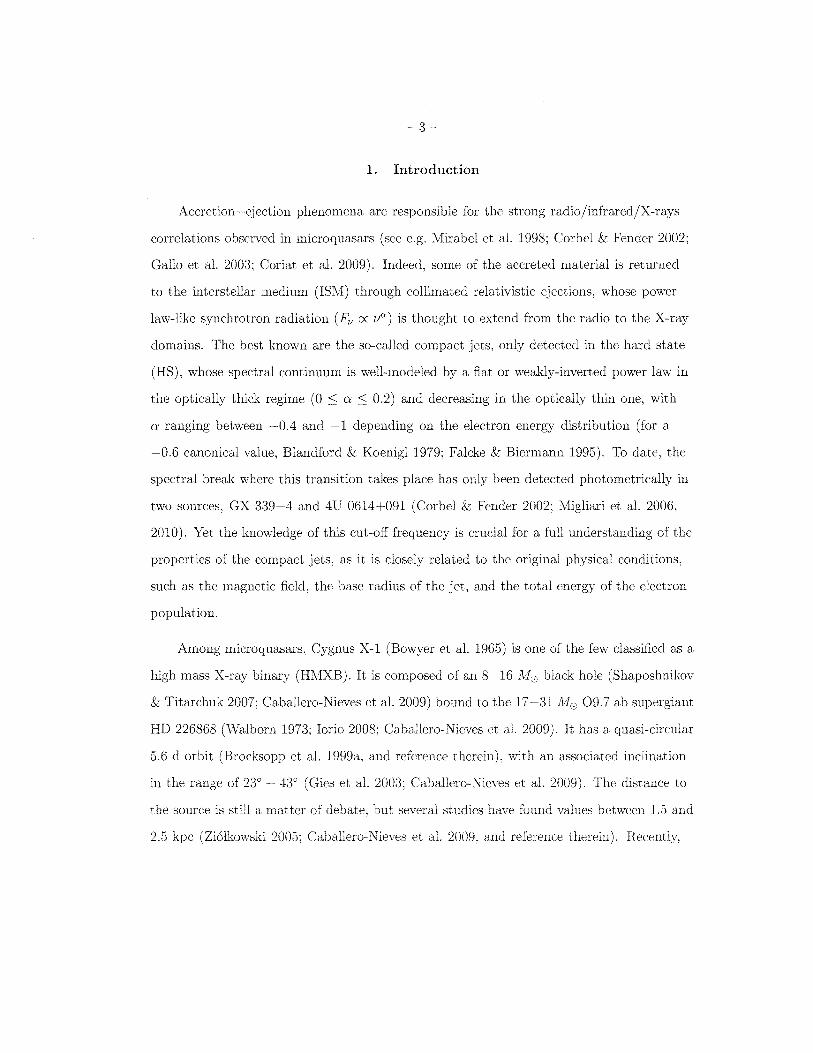
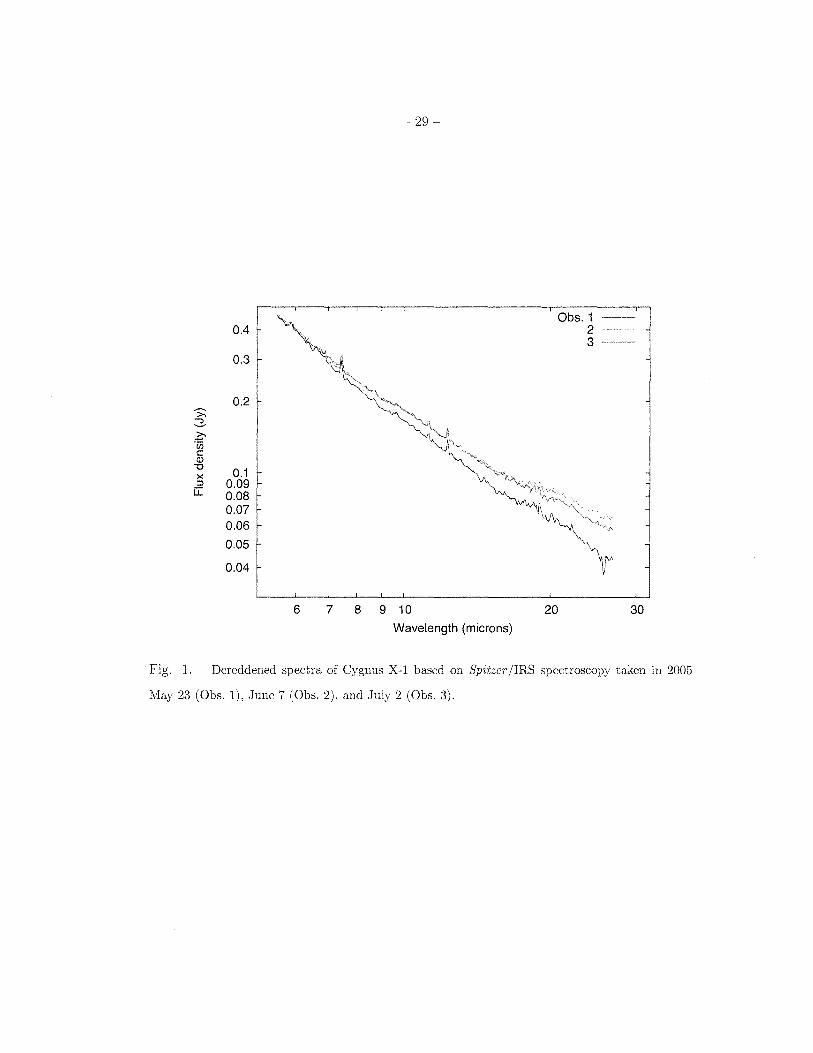
The resulting de reddened spectra displayed in Fig. 1 show unambiguously that the
MIR emission of Cygnus X-I is variable. Indeed, the MIR continuum was "n""he",,.
-8
Obs. 1 and Obs. 2, the difference with respect to Obs. 3 increasing with wavelength, from
no difference at 6 /-lm to an excess of 15-20 mJy beyond 10 /-lm.
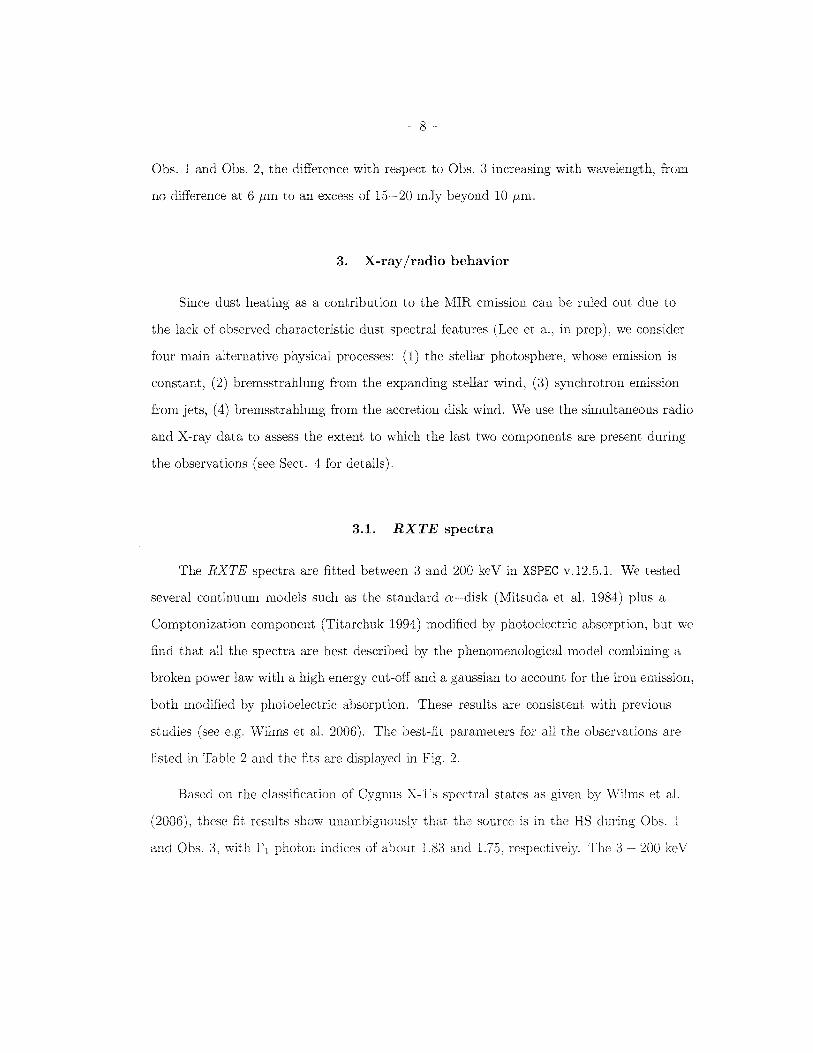
3. X-ray /radio behavior
Since dust heating as a contribution to the MIR emission can be ruled out due to
the lack of observed characteristic dust spectral features (Lee et a., in prep), we consider
four main alternative physical processes: (1) the stellar photosphere, whose emission is
constant, (2) bremsstrahlung from the expanding stellar wind, (3) synchrotron emission
from jets, (4) bremsstrahlung from the accretion disk wind. We use the simultaneous radio
and X-ray data to assess the extent to which the last two components are present during
the observations (see Sect. 4 for details).
3.1. RXTE spectra
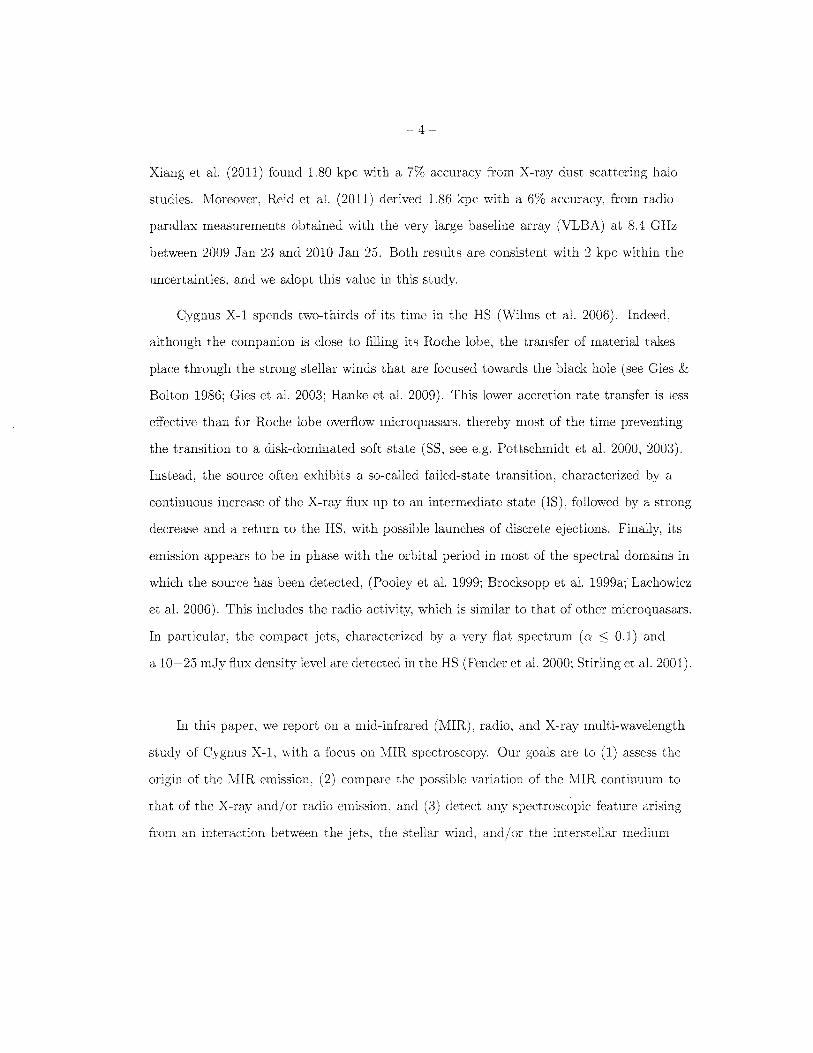
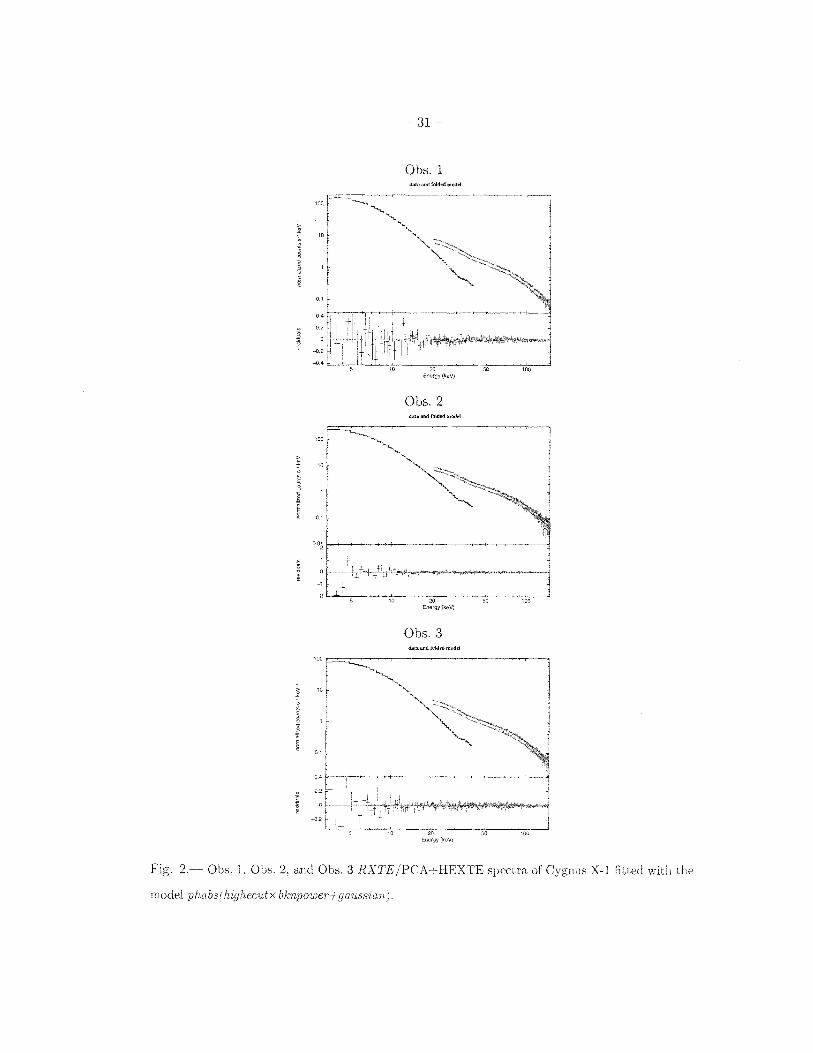
The RXTE spectra are fitted between 3 and 200 keY in XSPEC v.12.5.1. We tested
several continuum models such as the standard a-disk (Mitsuda et al. 1984) plus a
Comptonization component (Titarchuk 1994) modified by photoelectric absorption, but we
find that all the spectra are best described by the phenomenological model combining a
broken power law with a high energy cut-off and a gaussian to account for the iron emission,
both modified by photoelectric absorption. These results are consistent with previous
studies (see e.g. Wilms et al. 2006). The best-fit parameters for all the observations are
listed in Table 2 and the fits are displayed in Fig. 2.
Based on the classification of Cygnus X-1's spectral states as given by Wilms et al.
(2006), these fit results show unambiguously that the source is in the HS during Obs. 1
and Obs. 3, with [1 photon indices of about 1.83 and 1.75, The 3 200 keY
-9-
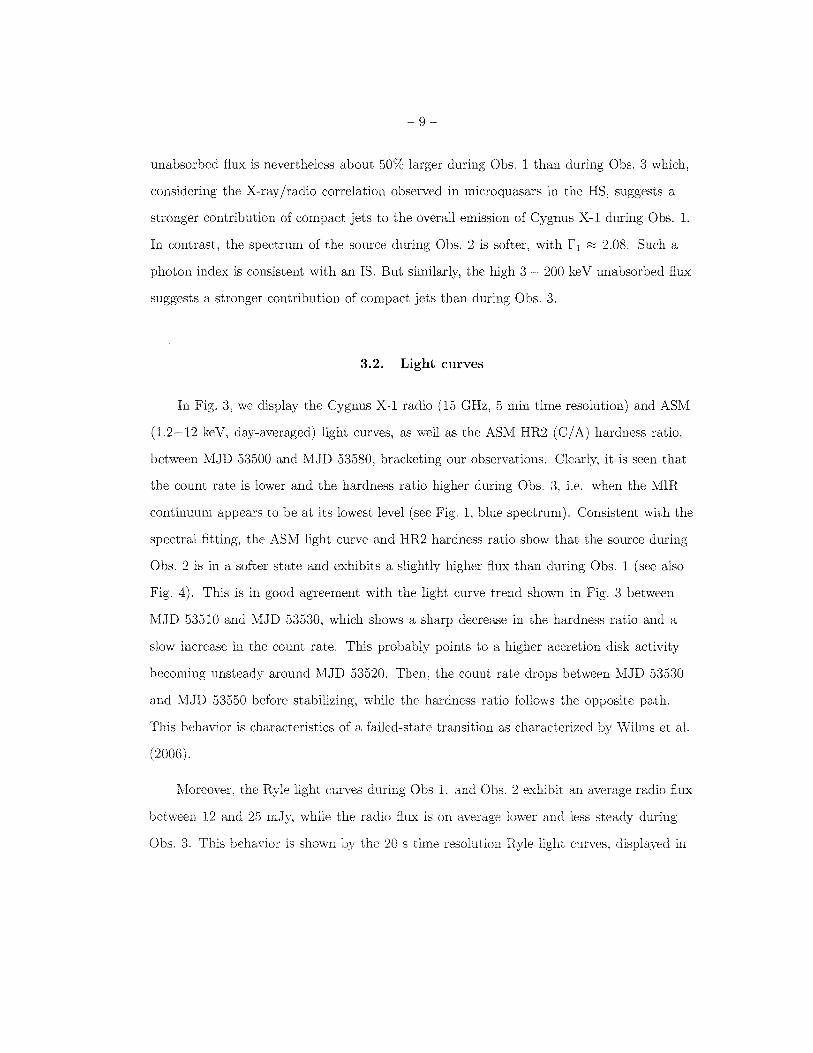
unabsorbed flux is nevertheless about 50% larger during Obs. 1 than during Obs. 3 which,
considering the X-ray Iradio correlation observed in micro quasars in the HS, suggests a
stronger contribution of compact jets to the overall emission of Cygnus X-I during Obs. 1.
In contrast, the spectrum of the source during Obs. 2 is softer, with r 1 ;:::: 2.08. Such a
photon index is consistent with an IS. But similarly, the high 3 200 ke V unabsorbed flux
suggests a stronger contribution of compact jets than during Obs. 3.
3.2. Light curves
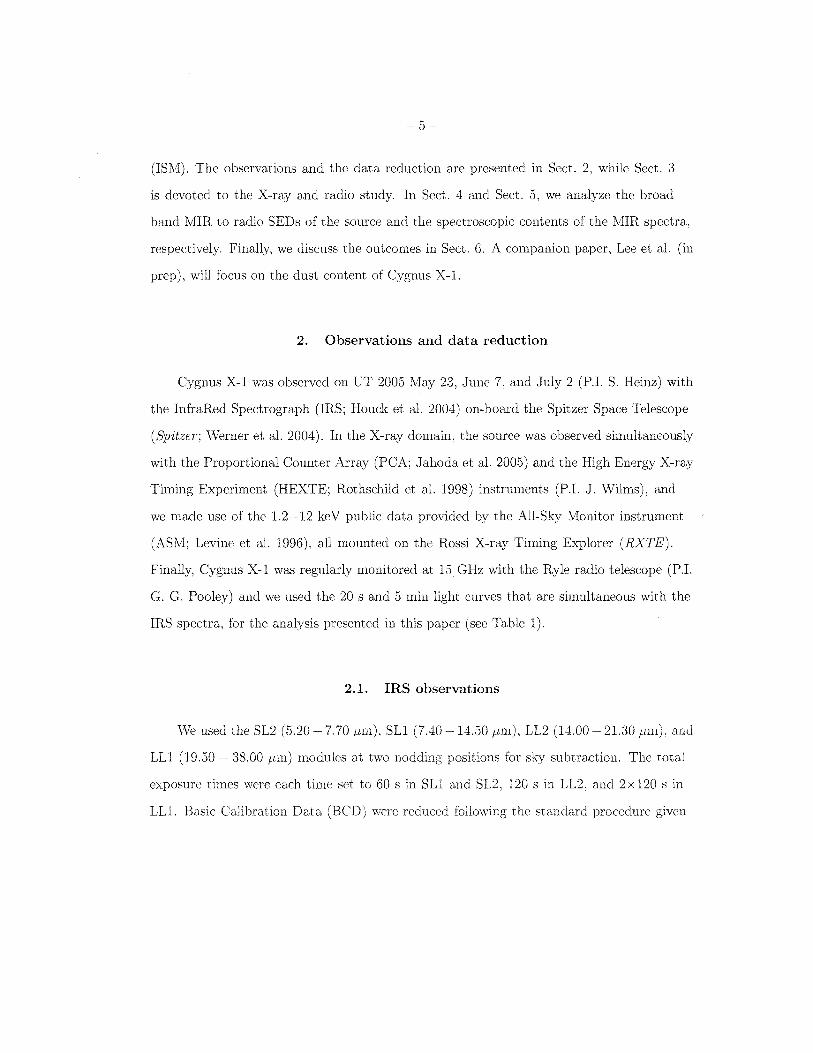
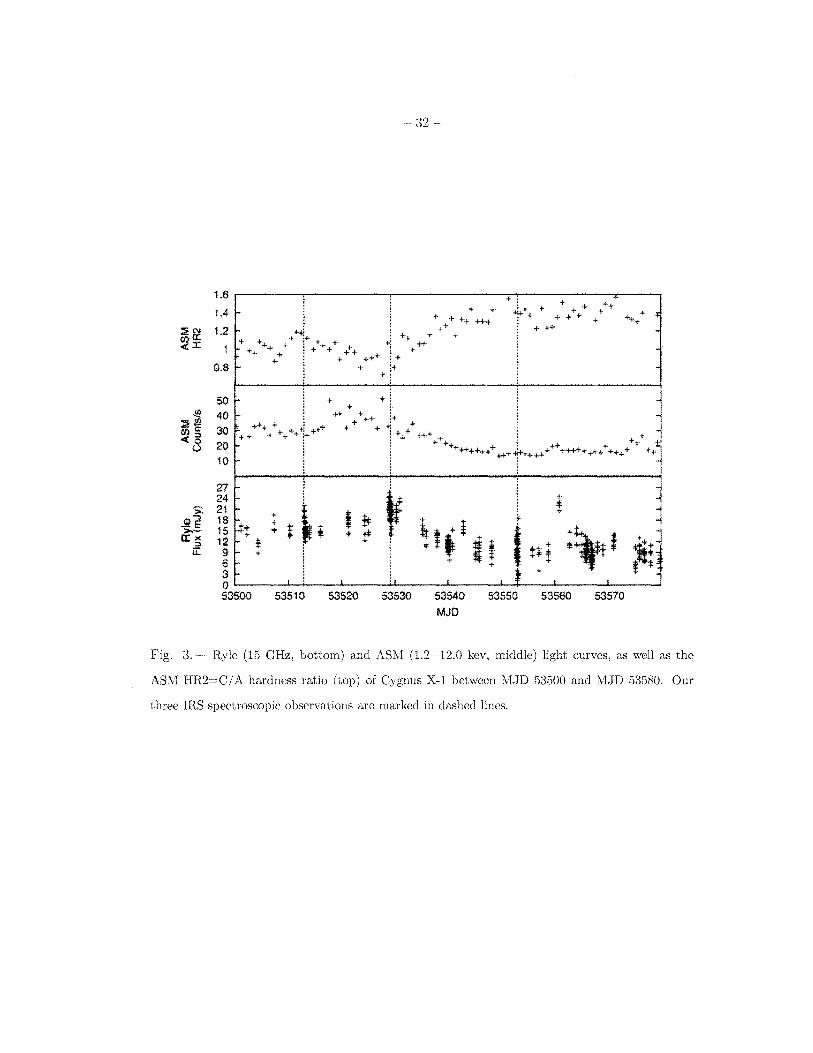
In Fig. 3, we display the Cygnus X-I radio (15 GHz, 5 min time resolution) and ASM
(1.2-12 keY, day-averaged) light curves, as well as the ASM HR2 (CIA) hardness ratio,
between MJD 53500 and MJD 53580, bracketing our observations. Clearly, it is seen that
the count rate is lower and the hardness ratio higher during Obs. 3, i.e. when the MIR
continuum appears to be at its lowest level (see Fig. 1, blue spectrum). Consistent with the
spectral fitting, the ASM light curve and HR2 hardness ratio show that the source during
Obs. 2 is in a softer state and exhibits a slightly higher flux than during Obs. 1 (see also
Fig. 4). This is in good agreement with the light curve trend shown in Fig. 3 between
MJD 53510 and MJD 53530, which shows a sharp decrease in the hardness ratio and a
slow increase in the count rate. This probably points to a higher accretion disk activity
becoming unsteady around MJD 53520. Then, the count rate drops between MJD 53530
and MJD 53550 before stabilizing, while the hardness ratio follows the opposite path.
This behavior is characteristics of a failed-state transition as characterized by Wilms et al.
(2006).
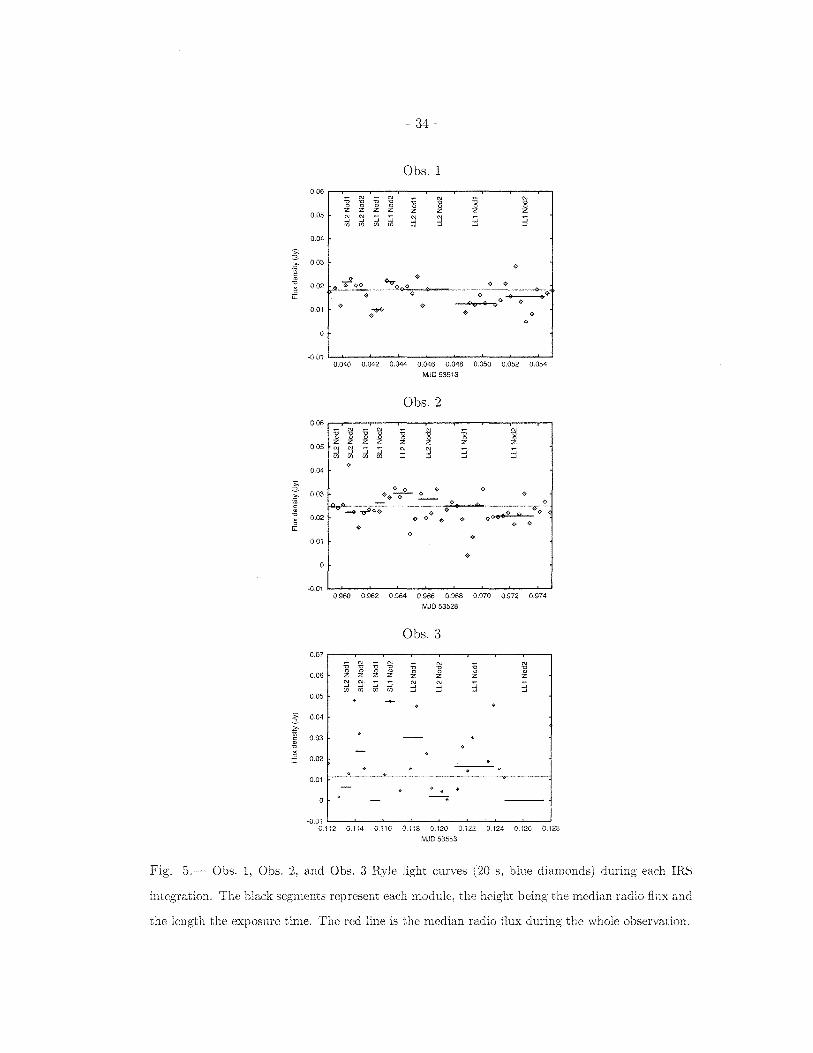
Moreover, the Ryle light curves during Obs 1. and Obs. 2 exhibit an average radio flux
bet\veen 12 and 25 mJy, while the radio flux is on average lower and less steady during
Obs. 3. This behavior is shown the 20 s time resolution Ryle curves, 1Il
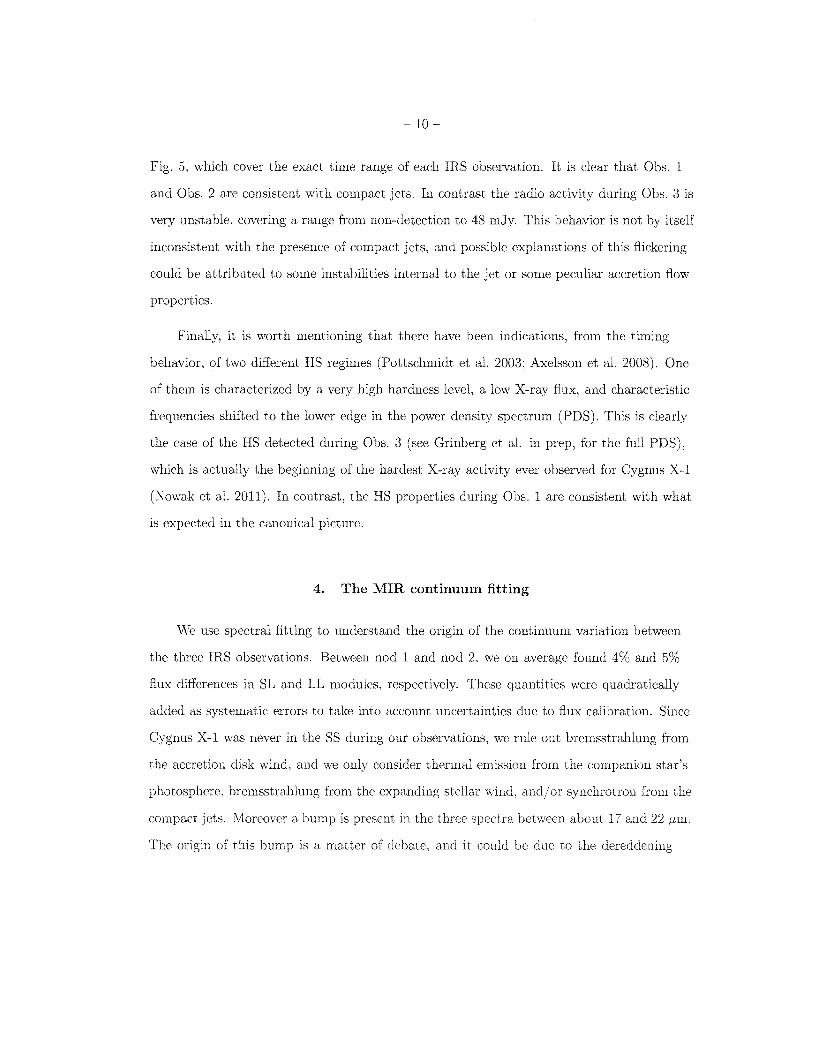
- 10-
Fig. 5, which cover the exact time range of each IRS observation. It is clear that Obs. 1
and Obs. 2 are consistent with compact jets. In contrast the radio activity during Obs. 3 is
very unstable, covering a range from non-detection to 48 mJy. This behavior is not by itself
inconsistent with the presence of compact jets, and possible explanations of this flickering
could be attributed to some instabilities internal to the jet or some peculiar accretion flow
properties.
Finally, it is worth mentioning that there have been indications, from the timing
behavior, of two different HS regimes (Pottschmidt et al. 2003; Axelsson et al. 2008). One
of them is characterized by a very high hardness level, a low X-ray flux, and characteristic
frequencies shifted to the lower edge in the power density spectrum (PDS). This is clearly
the case of the HS detected during Obs. 3 (see Grinberg et al. in prep, for the full PDS),
which is actually the beginning of the hardest X-ray activity ever observed for Cygnus X-I
(Nowak et al. 2011). In contrast, the HS properties during Obs. 1 are consistent with what
is expected in the canonical picture.
4. The MIR continuum fitting
We use spectral fitting to understand the origin of the continuum variation between
the three IRS observations. Between nod 1 and nod 2, we on average found 4% and 5%
flux differences in SL and LL modules, respectively. These quantities were quadratically
added as systematic errors to take into account uncertainties due to flux calibration. Since
Cygnus X-I was never in the SS during our observations, we rule out bremsstrahlung from
the accretion disk wind, and we only consider thermal emission from the companion star's
photosphere, bremsstrahlung from the expanding stellar wind, and/or synchrotron from the
compact jets. :vloreover a bump is present in the three spectra between about 17 and 22 /.lm.
The of this is a matter of and it could be due to the
-11-
process or to irradiation of dust around the BH (S. Markoff, private communication), but
more likely to the Spitzer/IRS LL1 24 pm deficit2.
4.1. Obs. 3: the stellar continuum
Considering the very unstable radio activity of Cygnus X-I during Obs. 3, a jet
contribution to the MIR spectrum is very unlikely. We therefore only consider the emission
from the star. To model the photosphere, we simply use a black body. Cygnus X-l's
companion star, HD 226868, is an 09.7ab supergiant and its unabsorbed emission peaks
in the ultraviolet (UV). The :!'vIIR alone is therefore not sufficient to constrain the star's
temperature, so we fix it to the most recent derived value, i.e. 28000 K as given in
Caballero-Nieves et al. (2009), based on theoretical fitting to the ultraviolet spectrum. In
their seminal papers, Wright & Barlow (1975) and Panagia & Felli (1975) showed that the
bremsstrahlung from a homogenous spherically expanding wind would be responsible for a
MIR and radio excess ex: VO.6 in supergiant stars. We therefore add a power law to take the
wind emission into account. This simple model is summarized by Eq. 1:
(1)
where R. and D* are the companion star's radius and distance, B is the black body
emission, and Nff and C\!ff are the bremsstrahlung flux density at 15 GHz and spectral index.
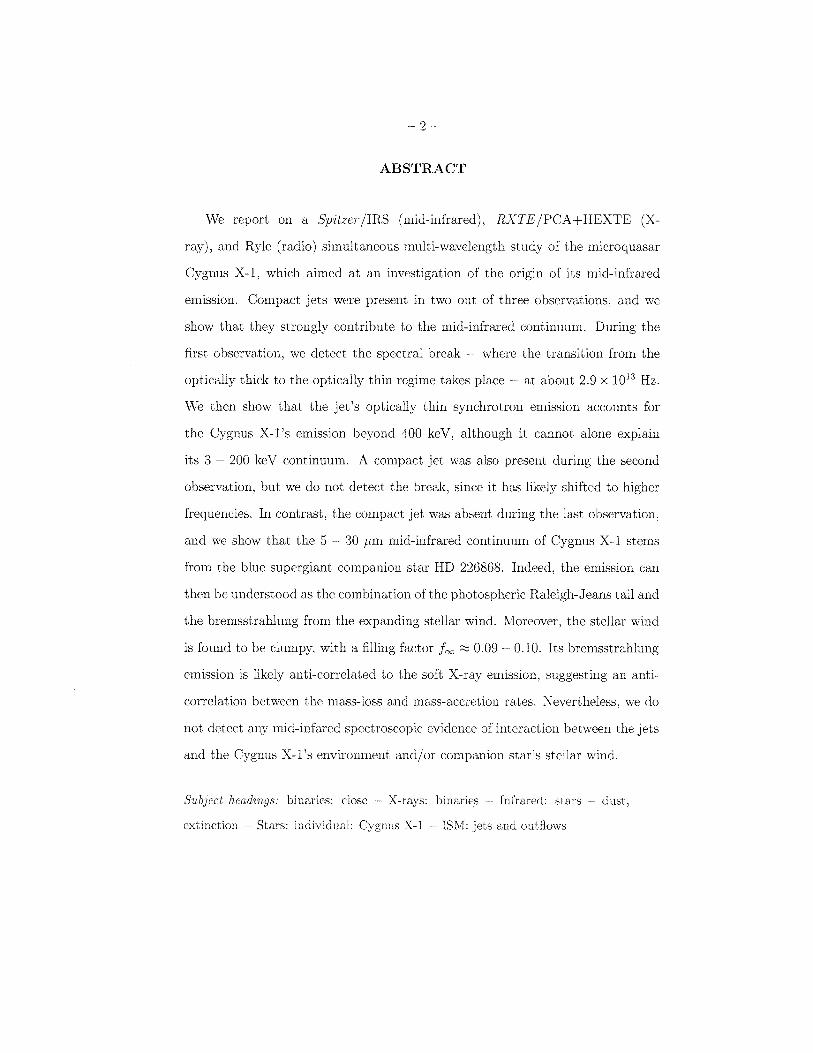
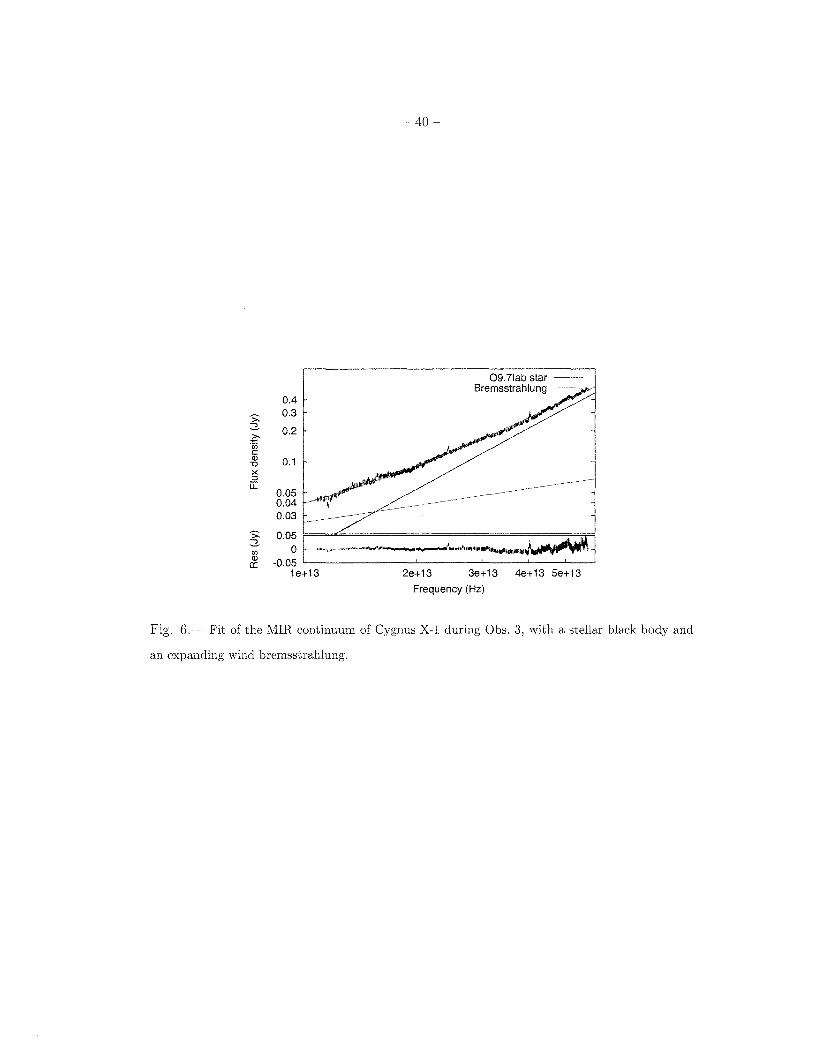
The best fit is displayed in Fig. 6 and the best-fit parameters are listed in Table 3.
The ratio R*/ D* is consistent with the one expected from the Cygnus X-l's companion
star, since the derived stellar radius for a typical 2 kpc distance is about 19.9 R0 . the
typical value for a typical late 0 supergiant . .\foreover. the power law spectral index is
12 -
characteristics of bremsstrahlung from an expanding stellar wind, with O'b ;:::::; 0.55, consistent
with the 0.6 theoretical value within the 90% uncertainties. The MIR continuum of
Cygnus X-I during Obs. 3 can therefore be described by that of HD 226868. This alone
does not rule out the possible presence of compact jets. Nevertheless, both the average
X-ray and radio fluxes are at least 50% lower than during Obs. 1 and 2. So, even if they are
present, either the compact jets are too faint to be detected in the MIR, or they break to
the optically thin regime beyond 30 J.lm. Indeed, in this regime, the IR flux is expected to
vary with respect to the radio flux as FIR ;:::::; Fradio 21/17 (Heinz 2004). Considering the low
radio flux level, this very probably excludes a significant contribution of a compact jet to
the MIR spectrum of Cygnus X-I during Obs. 3.
4.2. Obs. 1 and Obs. 2: MIR contribution from the compact jets
The radio behavior does exhibit compact jets that may be responsible for the observed
continuum increase. We consider two cases to model their contribution, (1) the spectral
break does not occur in the IRS spectral range so the optically thick synchrotron emission
can be described by a simple power law, or (2) the spectral break is located in the IRS
spectral range and the emission of the compact jets can be modeled by a broken power law.
To better constrain the compact jets emission parameters, we include the average
15 GHz flux densities of Cygnus X-I during the IRS/LL observations. We then fit these
MIR/radio spectral energy distributions (SEDs) by fixing the black body parameters and
bremsstrahlung spectral index to those of Obs. 3.
1. Case 1: power law
The overall the X-I emission is:
- 13-
F(v) (~:r x B(v, 28000) + Nff C5 ;HZ)"if + Nj C5 ;Hz)"j (2)
where Nj and CYj are the synchrotron flux density at 15 GHz and spectral index, respectively.
Here, Nff was left free to mimic a possible change in the bremsstrahlung intensity due
to a variation of the star's mass loss rate. The best-fit parameters are listed in Table 4,
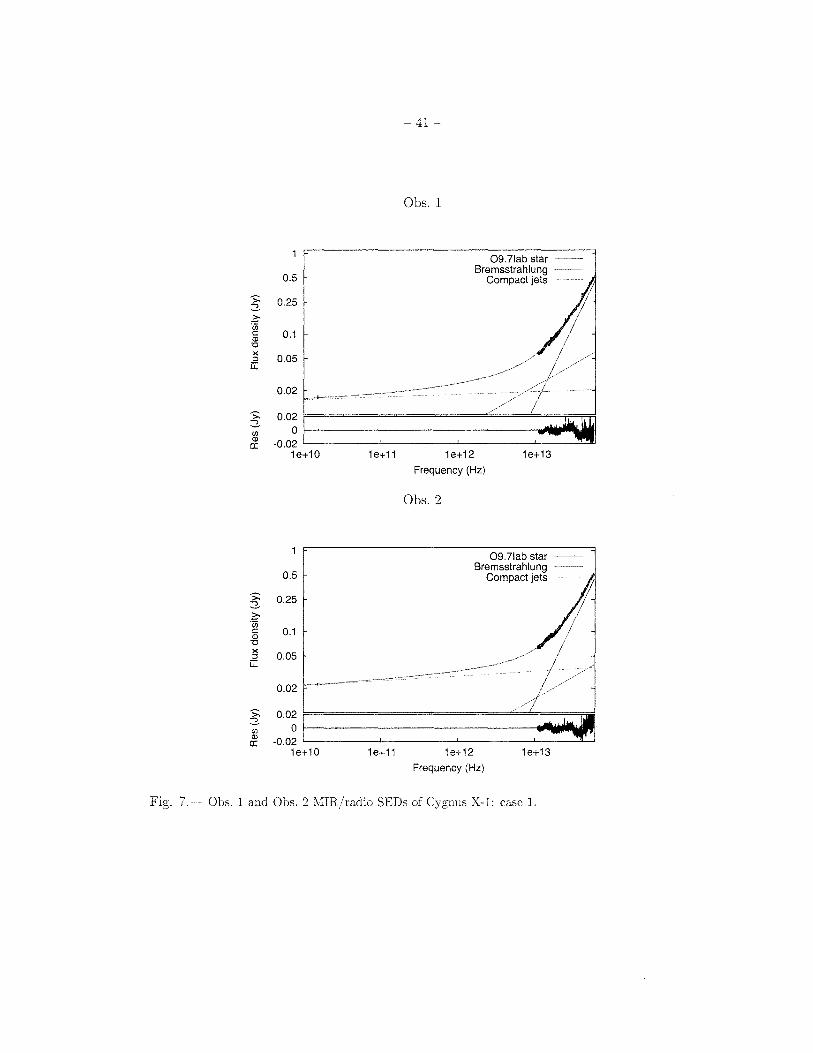
and the corresponding fitted SEDs displayed in Fig. 7. Both fits are consistent with a
contribution of compact jets to the MIR emission of Cygnus X-I during Obs. 1 and Obs. 2.
Indeed, the derived spectral indices are 0.01 ± 0.02 and 0.05 ± 0.01, respectively, consistent
with typical values. Moreover, the bremsstrahlung flux density at 15 GHz during Obs. 1 is
found to be similar to that during Obs. 3 (the no-jet case, see Sect. 4.1), 0.66 ± 0.06 mJy
compared to 0.74:!:g:~~ mJy. In contrast, Nff during Obs. 2 is lower (0.44:!:g:g~ mJy).
4.2.2. Case 2: broken power law
Here, the overall equation describing the Cygnus X-I emission is:
F(v) (~:r xB(v, 28000)+Nff {
~T Ctjl 'f Gif lYj 1 v:S: vc
+ N (_v~c _) Ctj l-Ctj2 (_V_)Ctj2 if v> v J 15 GH2 15 GHz - C
(3)
where Nj , CYjI, CYj2, and Vc are the jets' synchrotron flux density at 15 GHz, optically thick
and thin spectral indices, and cut-off frequency, respectively.
When we left free to vary all the parameters of the broken power law and the
bremsstrahlung normalization at the same time; however this results in poorly
constrained fits due to several degeneracies between the various fit parameters. \Ve therefore
prC)Cet3c1E~c1 with three each time fixing one parameter CYj2 is fixed to -0.6,
- 14-
i.e. the theoretical spectral index expected from the optically thin synchrotron emission of
the compact jets, (b) Nff is fixed to the values found in case 1, (c) Nff is fixed to the value
found during Obs. 3, i.e. we assume that the bremsstrahlung intensity is the same for all
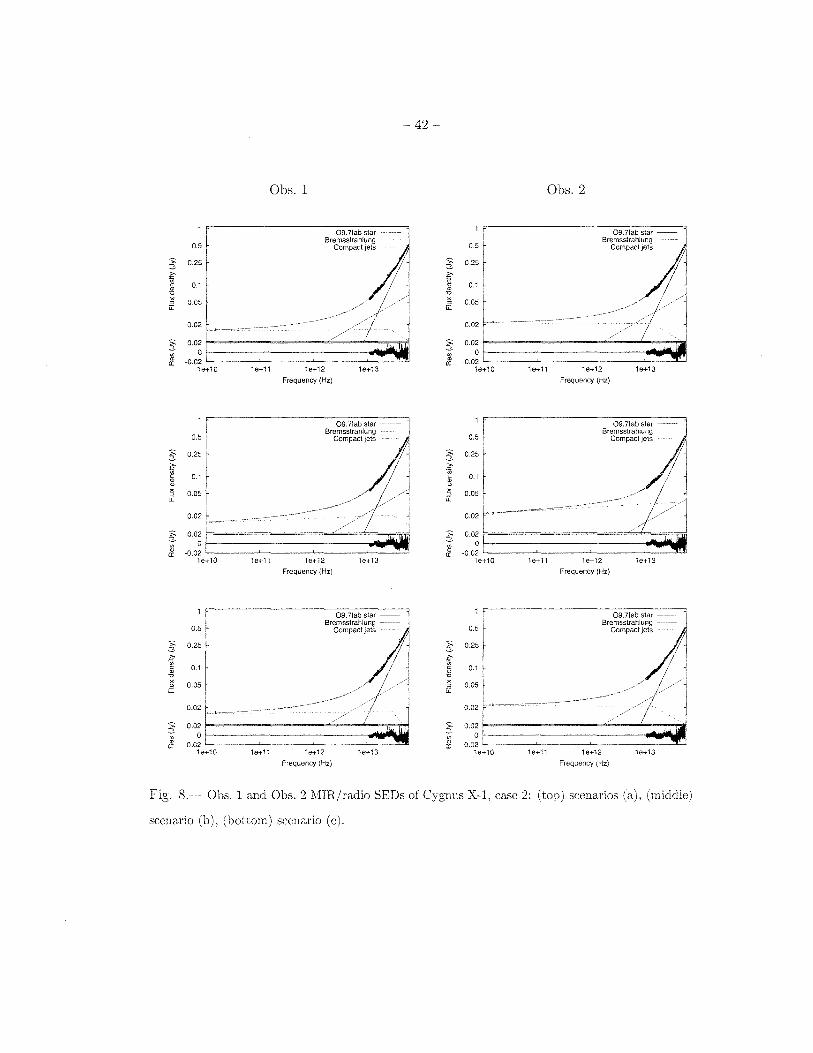
the observations. The best-fit parameters are listed in Tables 5, 6, and 7, and the SEDs are
displayed in Fig. 8, respectively.
4.2.3. Interpretation
A broken power law gives better results to describe the emission of the compact jets
during Obs. 1, with reduced 2 values of 0.81, 0.85, and 0.78 for scenarios (a), (b), and
(c), respectively, versus 0.96 for a simple power law. The low reduced 2 are largely
due to artificially forced high IRS systematic errors that were quadratically added to the
uncertainties. Nevertheless, .0.. 2 2:: 34 for only one DOF less, and the three fits give very
similar results. The spectral break is clustered in the MIR range (2.70 2.94) x 1013 Hz,
i.e. about 10.06 - 11.11 11m, and the optically thin spectral index Q:j2 for (b) and (c) is
always consistent with the expected value (between -1 and -0.4) within the uncertainties.
Moreover, for (a), the bremsstrahlung intensity is found similar to that during Obs. 3, a
hint that the mass-loss rate is the same during both observations, as expected in the HS.
So, based on the aforementioned reasons, we conclude that the consistency of all the fits
strengthens the need for a broken power law to describe the MIR continuum of Cygnus X-I
during Obs. l.
The interpretation of the results for Obs. 2 is more complex, even though the broken
power law gives lower reduced 2 (0.69 against 0.72). First, .0.. 2 "" 9.7, which is far less
significant than the values found for Obs. l. Yloreover, the fits with the broken power
law are not physically relevant. Indeed. the fit for scenario (b) gives a positive photon
index after the break "" 1 . which is inconsistent with a compact
15 -
jet. The two other fits are consistent with compact jets, but give cut-off frequencies that
are about twice smaller than during Obs. 1. This is counter-intuitive since the opposite is
expected. Indeed, the source during Obs. 2 is not in the HS but in a failed-state transition,
i.e. an IS with a softer and brighter spectrum. In models of optically thick jet emission,
the break frequency is coupled to the jet luminosity: if the luminosity increases, the break
frequency also increases. An increase in the optically thick flux requires an increase in the
jet energy density and/or the cross section of the jet, which always increases the optical
depth, thus increasing the break frequency. The fact that our best fits for Obs. 2 indicate
the opposite would imply a change in the jet geometry, e.g., a significant increase in the
distance of the base of the jet along the jet axis or an increase in the opening angle of the
jet (such that the footprint of the base of the jet shrinks, decreasing its optical depth).
Given the level of uncertainty in our data (demonstrated by the fact that our models are
under-constrained), such conclusions are still rather speculative at this point. Moreover,
several studies of Cygnus X-I showed the existence of an anti-correlation between the
mass-loss and the accretion rates (Gies et al. 2003; Boroson & Dil Vrtilek 2010), maybe
due to photoionization of the wind by the soft X-ray emission. During the IS and SS, the
bremsstrahlung contribution should therefore be lower than in the HS. This is actually
exactly the result of case 1, where we consider a simple power law instead of a broken one.
The bremsstrahlung intensity is found to be about 40% lower than that during Obs. 3,
while the cut-off frequency is assumed to occur below 5.48 /Lm. \Ve believe that it better
describes what occurs during Obs. 2.
5. MIR spectral lines analysis
In the companion paper (Lee et aL in prep), we show that the presence of warm dust
around Cygnus X-I is very UllllJ:\:Cl.Y and that the strong silicate hc,orr.flrm feature is due
- 16
to the ISM. Here, we study the spectral line variability of the MlR spectra between the
three different epochs. Moreover, because the spectral features are remarkably similar for
the three spectra in the SL modules, we only focus on the longer wavelengths, from 14.5 to
32 Jim. Finally, due to potential rapid variations with respect to the source's X-ray or radio
activity, we separately study nod 1 and nod 2, in contrast to using nod-averaged spectra
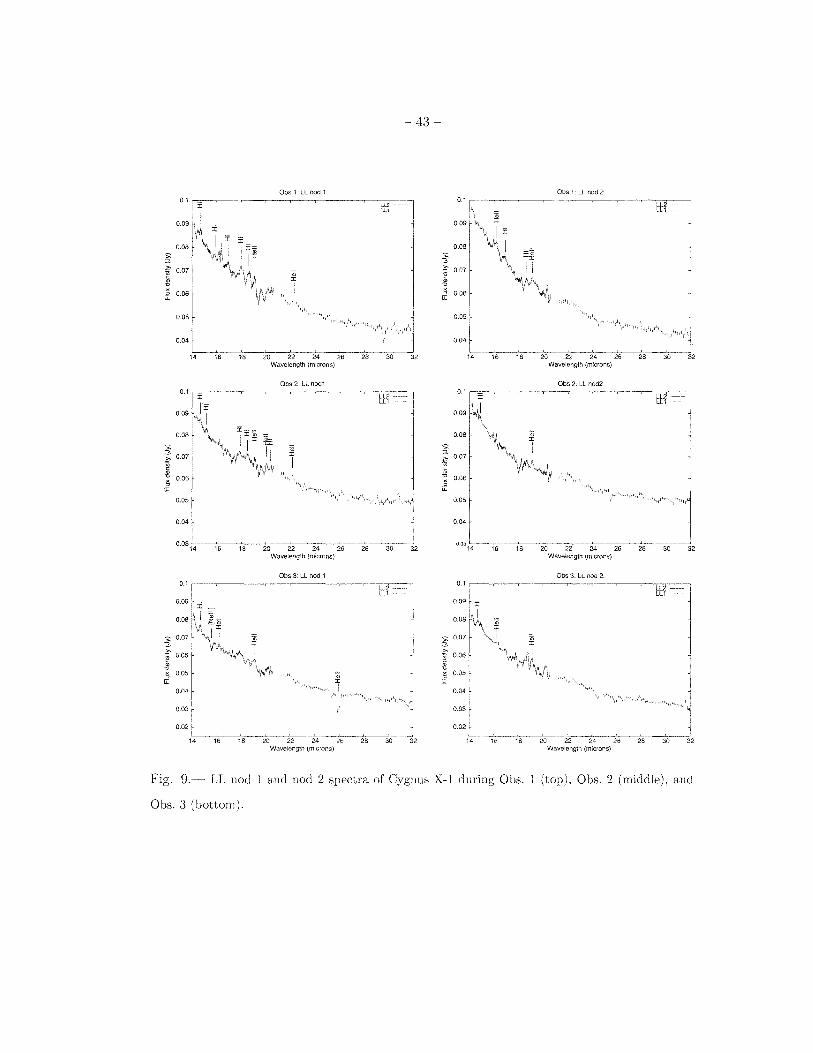
for the continuum fitting. All the non-dereddened spectra are displayed in Fig. 9 and the
features listed in Table 8. Note that we only list the features detected at 517 or more above
the continuum (assessed in 2 Jim windows using a second-order polynomial).
As seen in Fig. 9 and Table 8, the MIR spectra of Cygnus X-I are dominated by HI
and He II emission lines that likely arise from the stellar wind of HD 226868. Overall, more
features are detected during Obs. 1 and Obs. 2, probably because of a higher soft X-ray
emission flux level that photoionizes the wind. Moreover, in both cases, the spectroscopic
content appears to vary from nod to nod, with more lines in nod 1 than in nod 2. This
is likely due to slight background variations between both positions, although dramatic
changes of the photoionization state cannot be excluded.
During Obs. 3, the same features are detected at both positions with the exception of
two absorption lines at 15.60 ± 0.01 and 25.90 ± 0.02 Jim in the nod 1 spectrum, which
correspond to [Ne III] and He II. A forbidden absorption feature of Ne III is very unlikely,
and these two lines are probably a consequence of the sky subtraction. Indeed, given
that slit positions differ between observations, the slit during Obs 3 may be aligned with
non-homogeneous structures, leading to background variations between the two nods.
Finally, a total of three blue-shifted H I emission lines are present in the nod 1 and
nod 2 spectra of Cygnus X-I during Obs. 2 but not during Obs. 1 nor Obs. 3. Their
velocities vary between 1600 to -2200 km ) which hints at an origin from the stellar
wind of HD 226868. This is due to the orbital configuration of the during each
- 17
observation. Indeed, Hanke et al. (2009) showed that one should expect the presence of
blue- or red-shifted X-ray absorption lines from the stellar wind, depending on the orbital
phase of the BH (Fig. 14 in their paper). Close to phase 0.5, these lines are almost "frozen"
while they are maximally blue-shifted around phases 0.2-0.3. During Obs. 1, Obs. 2,
and Obs 3, the BH phases are 0.43, 0.27, and 0.58, respectively. Our results are therefore
consistent with the prediction given in Hanke et al. (2009).
6. Discussion
The main results of our multi-wavelength study of Cygnus X-I are: (1) the compact
jets contribute significantly to the MIR emission, with a spectral break ~ 2.9 x 10¹³ Hz
(Obs. 1), (2) when the jet carries more power, the cut-off frequency shifts as expected
to higher frequencies and becomes undetectable in the MIR (Obs. 2), (3) the strength
of the bremsstrahlung from the stellar winds is likely anti-correlated to the soft X-ray
emission, which confirms the anti-correlation between the mass-loss and accretion rates (all
observations) .
6.1. Detection of the spectral break during Obs. 1
This, to our knowledge, is the first measurement of the spectral break of a compact
jet based on spectral fitting instead of photometry, and only the second detection of such
a break in a BHXB after GX 339-4 (Corbel & Fender 2002). We can use the theoretical
expression of the expected cut-off frequency, to see if our value is consistent with that of
GX 339-4, scaled with respect to the BH mass, distance, and accretion rate. In the HS,
if Fv is the flux density at a given frequency v, Ai the accretion rate, and A1x the BH
mass, we have for a radiatively inefficient from Falcke & Biermann (1995) and Heinz &
~ 18
Sunyaev (2003):
AI ex: F12/17 l/
M2 / 3
Vb ex: l'vlx
(4)
where Vb is the cut-off frequency.
For GX 339-4, we consider a distance of 8 kpc, a BH mass of 10 M0 , and a flux
density at 15 GHz of 15 mJy, respectively (Zdziarski et al. 2004; Fender et al. 1997; Corbel
et al. 2003). For Cygnus X-I the numbers are 2 kpc, 11 M0 (Caballero-Nieves et al.
2009), and 15 mJy, respectively. Using Eq 4, we find Vox ~ 4.06 X VCYO, where Vox
and VCYO are the GX 339-4 and Cygnus X-I cut-off frequencies, respectively. For our
measured VCYO ~ 2.9 X 10¹³ Hz, this relation gives Vox ~ 1.15 X 10¹⁴ Hz, which is in
good agreement with the values derived in Corbel & Fender (2002). Therefore, despite the
intrinsic uncertainties associated with the MIR spectral fitting, we believe that we see the
cut-off frequency in the Cygnus X-I MIR spectrum during Obs. 1.
6.2. Implications for the jet geometry
We can use the presence of the synchrotron break to constrain the jet geometry. As
pointed out in Heinz (2006), the radio photosphere is located at a de-projected distance of
about 5 x 10¹³ em from the black hole, based on the fact that about 50% of the flux are
unresolved at an angular resolution of 3 mas in the VLBA observations reported by Stirling
et al. (2001).
For a Blandford-Koenigl jet (Blandford & Koenigl 1979), the location of the
photosphere along the T=l is inversely proportional to the frequency, T=l.l/ ex: V-I.
Given the higher radio flux in our observation compared to the Stirling et
al. the radio nOl:0snnere should be located at distance of about
- 19-
6 X 101.3 cm. At a frequency of vt "'" 2.9 X 10¹³ Hz, the IR photosphere would be located at
a distance of zr=I.2.9x1Q13 Hz "'" 1.7 X 1010 cm. Since the break from optically thick to thiu
occurs when the photosphere reaches the base of the jet, our result would suggest that the
base of the jet has a scale of about half a light second. For a BH of mass M "'" 10 MC'), this
corresponds to about 10,000 gravitational radii, which is fairly large compared to size scales
typically assumed for the base of the jet, usually assumed to occur on scales of a few tens
to hundreds of gravitational radii. For example, the jet in M87 is resolved down to scales of
less than 100 gravitational radii.
A simple Blandford-Koenigl model is a severe oversimplification over the almost
four orders of magnitude in frequency and thus photospheric scale between IR and radio.
Deviations are almost certainly to be expected. However, any change would still have to
obey the observed flat SED. As argued in Heinz (2006), simple geometric changes to the
Blandford-Koenigl model do not alter the behavior of the jet significantly. For example,
allowing the jet to be continually collimated (with Rjet ex z() instead of being conical
(( 1) and requiring energy conservation such that p ex Z-2( results in a slight altered
dependence of Zr=l,v ex V- l/(, and a change of the spectral index from completely flat to
ex 1 - ~ (Heinz 2006). Bringing the base of the jet inwards (toward the BH) would require
a ( > 1, implying a steeper spectrum, while micro quasars tend to have flat to slightly
inverted spectra. A simple geometric explanation for the large implied scale for the base of
the jet is thus not plausible.
It is clear that the jet must be accelerated between the base of the jet and the radio
photosphere. changing the Doppler parameter 5 along the jet. Since the optical depth to
synchrotron-self absorption is proportional to 52, a significant increase in 6 from the base of
the jet, where the IR emission originates, to the radio photosphere, would boost the radio
optical depth. moving the photosphere outward a factor of . However,
- 20
given that the jet in Cygnus X-I is likely not ultra-relativistic (Gleissner et al. 2004), it is
unlikely that this could bring the base of the jet inward by more than a factor of a few.
Finally, it is possible that the estimated resolved flux fraction of the radio of rv 50%
was overestimated in Heinz (2006). For example, if instead of 50%, only 25% of the flux
were actually resolved in that observation, it would decrease Zr=O by an order of magnitude,
again moving the size of the IR photosphere and thus the base of the jet towards scales
more typically associated with jet acceleration. However, very long baseline observations
tend to underestimate the resolved flux, rather than the unresolved flux.
If the size scale over which the jet forms is really this large, it would imply that large
scale outflows (i.e., winds) from the disk are fundamentally involved in jet formation.
Indeed, a recent study of GRS 1915+105 have shown that the accretion disk wind and the
jets were competing for the same matter supply (Neilsen & Lee 2009). Moreover, it has long
been speculated that winds support jet collimation by providing lateral pressure support.
This would make the jet in Cygnus X-I qualitatively different from AGN jets which have
been imaged down to scales significantly smaller than this in terms of gravitational radii. It
would also imply that the jet originates over a region much larger than the X-ray emitting
corona that is typically assumed to be the base of the jet. This underscores the need for
further confirmation of the nature of the outflow responsible for the observed radio emission
and, by extension, the large scale diffuse radio and emission line nebula around Cygnus X-I.
6.3. Origins of the radio and X-ray / -ray emissions during Obs. 1
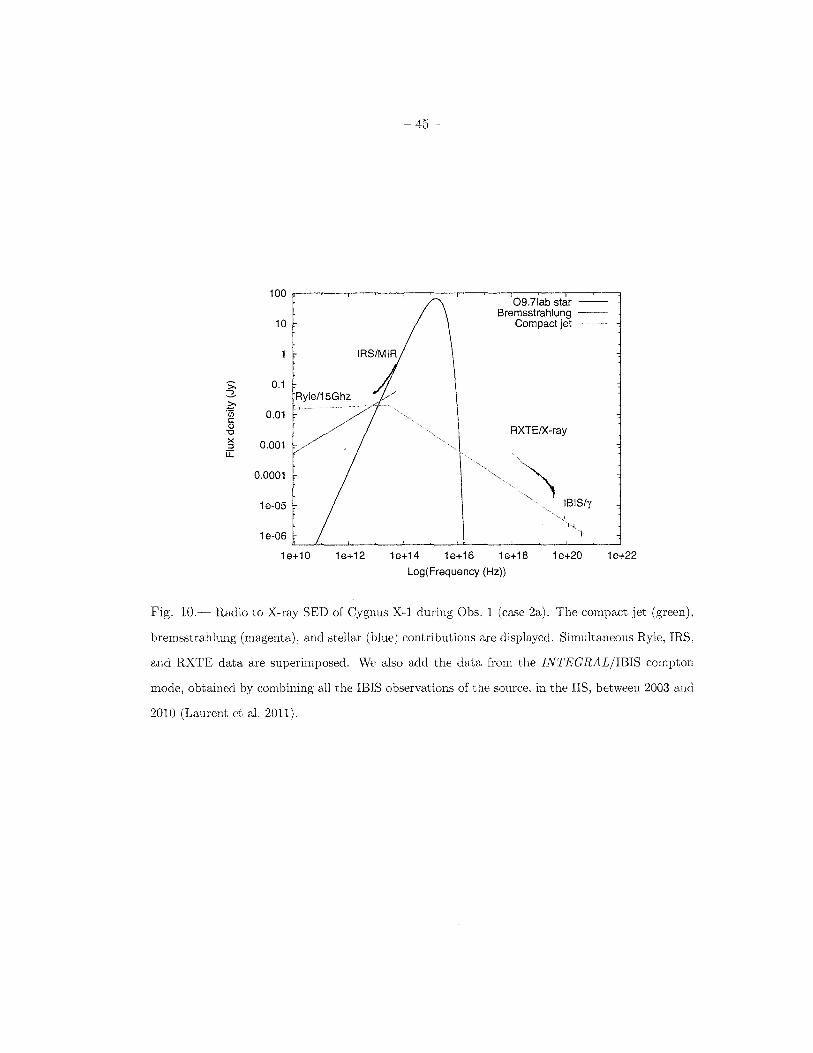
Fig 10 displays the contributions of the stellar photosphere (blue), the bremsstrahlung
from the expanding stellar wind (magenta), and the compact extrapolated to the
high-energy , from our fit of the Cygnus X-l's SED in the case 2, scenario (a).
21 -
The simultaneous Ryle, Spitzer, and RXTE data are also superimposed, as well as the
non-contemporaneous INTEGRAL/IBIS data that were recently published (Laurent et al.
2011). The authors detected for the first time polarized -ray emission beyond 400 keY,
and they argue that it is due to compact jets. Our result is fully consistent with this
scheme, as the optically thin part of the jet perfectly describes the INTEGRAL/IBIS data,
providing strong evidence that we actually detect the spectral break around 2.9 x 10¹³ Hz.
Nevertheless, it is clear that the RXTE spectrum of Cygnus X-I cannot be described by the
compact jet alone, and one or several extra components are needed. The spectral similarity
between the spectral indices of the IR and the X-ray spectra might suggest that one of
these components is synchrotron-self-compton (SSC) emission in the base of the compact
jet itself (Markoff & Nowak 2004; Markoff et al. 2005). However, this would require a
large compactness of that region, in direct contradiction of our discussion regarding the
implied large size of the IR photosphere and thus the base of the jet above. The more
natural interpretation would be Comptonization of disk photons by the corona, independent
of the optically thin synchrotron spectrum from the jet. Moreover, whether or not this
result implies a disk origin of the X-ray emission in other sources like GX 339-4, whose
NIR spectra are more consistent with a synchrotron origin of the X-ray, remains an open
question.
6.4. A clumpy stellar wind?
Bremsstrahlung is found to be variable and to contribute significantly to the MIR
emission of Cygnus X-I, more than the compact itself. The fact that its intensity is
similar in the HS (Obs. 1 and Obs. 3), and lower in the failed-transition state (Obs. 2)
is consistent with an anti-correlation of the mass-loss and accretion as it was first
shown Gies et al. (2003), who derived a mass-loss rate of about 2.57 x
22
and 2.00 x 10⁻⁶ A10 yr-1 for the HS and SS, respectively. We can also derive Alw from the
theoretical expression which links it to our fit-derived bremsstrahlung flux density S" at
15 GHz, including clumping effects (Lamers & Waters 1984; Scuderi et al. 1998):
Mw 2.2610-' x VJ: x [8" (10 ;HJ -0" (lO,eK) -0.' (1 ~;c) ']l (lOOI~~7 e-') (5)
where Ix; is the clump filling factor of the wind, Te is the electron temperature far from
the photosphere, which is well approximated as 0.5T*, /L is the mean atomic weight of the
expanding plasma per electron, usually taken at about 1.3 for 0 supergiant (Lamers &
Leitherer 1993), and Voo is the terminal velocity of the wind (~ 1600 km Gies et al.
2008). When clumping is not included (i.e. foo 1), we derive mass-loss rates of about
8.79 x 10⁻⁶ 1'v10 yr-1 and 5.95 x 10⁻⁶ M0 yr-1 for Obs. 3 (HS) and Obs. 2 (IS), respectively.
Neglecting clumping clearly leads to overestimate the mass-loss rate by a factor of 3-4, as
shown by Lamers & Waters (1984). This is therefore a hint that the Cygnus X-I wind is
clumped, and we need foo ~ 0.09 - 0.10 in Eq. 5 to match the mass-loss rates given in Gies
et al. (2008). This value is consistent with that derived from the study of the X-ray dips
(Hanke et al., in prep).
7. Conclusion
We have investigated, through SED fitting, the origin of the MIR emission of
Cygnus X-I when the source was in the HS (Obs. 1), the IS (Obs. 2), and in a peculiar
compact jet-free HS (Obs. 3). We interpret the :\IIR continuum during Obs. 3 as due to the
stellar's photosphere and clumpy expanding wind ~ 0.09 0.10). In contrast, when
are present, they clearly contribute to the yIIR emission. During Obs. 1, we detect the
break ~ 2.9 x Hz), and we argue that this value is consistent with the
23 -
base of the jet being very large, likely involving accretion disk wind in the formation and
collimation of the jet. We show that if the jet alone can account for the I-ray emission
of the source, additional processes are needed to explain the 3 200 ke V spectrum. A
compact jet is also present during Obs. 2 but we do not detect the cut-off frequency as it
has likely shifted towards higher frequencies. Nonetheless, the bremsstrahlung emission is
found lower than that during Obs. 3, which is a confirmation of the anti-correlation between
the mass-loss and accretion rates.
Our results highlight the importance of the MIR and, by extension, the far-infrared
in the study of micro quasars, as all their components may have a spectral signature in
these domains. The existence of powerful infrared space-based observatories, Herschel
today and the James Webb Space Telescope (JWST) in the near future, combined to
ground-based telescope such as the Atacama Millimeter/sub-millimeter Array (ALMA),
are therefore a unique opportunity to make strong progresses in our understanding of their
behavior and properties. We definitively recommend further studies of Cygnus X-I and
other micro quasars with these facilities.
We thank the anonymous referee for his/her useful comments. FR thanks J. Rodriguez
for providing the INTEGRAL/IBIS data. JCL thanks the Harvard Faculty of Arts and
Sciences and the Harvard College Observatory. SH acknowledges support from JPL-NASA
contract No. 1292543. This work was partially funded by the Bundesministerium fiir
Wirtschaft und Technologie through Deutsches Zentrum fUr Luft- und Raumfahrt grant
50 OR 1007 and by the European Commission through contract ITN 215212 "Black Hole
Universe". This research has made use of NASA's Astrophysics Data System. of the
SIMBAD, and VizieR databases operated at CDS, Strasbourg, France.
24 -
REFERENCES
Axelsson, M., Hjalmarsdotter, 1., Borgonovo, 1., & Larsson, S. 2008, A&A, 490, 253
Blandford, R. D., & Koenigl, A. 1979, ApL, 20, 15
Boroson, B., & Dil Vrtilek, S. 2010, ApJ, 710, 197
Bowyer, S., Byram, E. T., Chubb, T. A., & Friedman, H. 1965, Science, 147,394
Brocksopp, C., Fender, R. P., Larionov, V., Lyuty, V. M., Tarasov, A. E., Pooley, G. G.,
Paciesas, W. S., & Roche, P. 1999a, MNRAS, 309, 1063
Brocksopp, C., Tarasov, A. E., Lyuty, V. M., & Roche, P. 1999b, A&A, 343, 861
Caballero-Nieves, S. M., et al. 2009, ApJ, 701, 1895
Chiar, J. E., & Tielens, A. G. G. M. 2006, ApJ, 637, 774
Corbel, S., & Fender, R. P. 2002, ApJL, 573, L35
Corbel, S., Nowak, M. A., Fender, R. P., Tzioumis, A. K, & Markoff, S. 2003, A&A, 400,
1007
Coriat, M., Corbel, S., Buxton, M. 1\1., Bailyn, C. D., Tomsick, J. A., Kording, E., &
Kalemci, E. 2009, :YINRAS, 400, 123
Draine, B. T. 2003, ARA&A, 41, 241
Falcke, H., & Biermann, P. 1. 1995, A&A, 293, 665
Fender, R. P., Pooley, G. G .. Durouchoux, P., Tilanus, R. P. J., & Brocksopp, C. 2000,
MNRAS, 312, 853
Fender, R. P .. Spencer, R. E., Newell, S. J., & Tzioumis, A. K 1997, MNRAS, 286, L29
25 -
Fitzpatrick, E. L. 1999, PASP, 111, 63
Gallo, E., Fender, R P., & Pooley, G. G. 2003, ~NRAS, 344, 60
Gies, D. R, & Bolton, C. T. 1986, ApJ, 304, 389
Gies, D. R, et al. 2003, ApJ, 583, 424
-. 2008, ApJ, 678, 1237
Gleissner, T., et al. 2004, A&A, 425, 1061
Hanke, ~., Wilms, J., Nowak, M. A., Pottschmidt, K., Schulz, N. S., & Lee, J. C. 2009,
ApJ, 690, 330
Heinz, S. 2004, MNRAS, 355, 835
-. 2006, ApJ, 636, 316
Heinz, S., & Sunyaev, R A. 2003, MNRAS, 343, L59
Houck, J. R, et al. 2004, ApJS, 154, 18
Iorio, L. 2008, Ap&SS, 315, 335
Jahoda, K., ~arkwardt, C. B., Radeva, Y., Rots, A. H., Stark, YI. J., Swank, J. H.,
Strohmayer, T. E., & Zhang, W. 2005, ApJSS, 163, 401
Lachowicz, P., Zdziarski, A. A., Schwarzenberg-Czerny, A., Pooley, G. G., & Kitamoto, S.
2006, ~NRAS. 368, 1025
Lamers, H. J. G. 1. YI., & Leitherer, C. 1993, ApJ, 412. 771
Lamers, H. J. G. 1. YL & Waters. 1. B. F. l\1. A&A, 138,25
- 26-
Laurent, P., Rodriguez, J., Wilms, J., Cadolle Bel, M., Pottschmidt, K., & Grinberg, V.
2011, Science, 332, 438
Levine, A. M., Bradt, H., Cui, W., Jernigan, J. G., Morgan, E. H., Remillard, R., Shirey,
R. E., & Smith, D. A. 1996, ApJL, 469, L33+
Markoff, S., & Nowak, M. A. 2004, ApJ, 609, 972
Markoff, S., Nowak, :vI. A., & Wilms, J. 2005, ApJ, 635, 1203
Migliari, S., Tomsick, J. A., Maccarone, T. J., Gallo, E., Fender, R. P., Nelemans, G., &
Russell, D. M. 2006, ApJL, 643, L41
Migliari, S., et al. 2010, ApJ, 710,117
Mirabel,!. F., Dhawan, V., Chaty, S., Rodriguez, L. F., Marti, J., Robinson, C. R., Swank,
J., & Geballe, T. 1998, A&A, 330, L9
Mitsuda, K., et al. 1984, PASJ, 36, 741
Neilsen, J., & Lee, J. C. 2009, Nature, 458, 481
Nowak, :vI. A., et al. 2011, ApJ, 728, 13
Panagia, N., & Felli, M. 1975, A&A, 39, 1
Pooley, G. G., Fender, R. P., & Brocksopp, C. 1999, MNRAS, 302, L1
Pottschmidt, K., Wilms, J., Nowak, M. A., Heindl, \V. A., Smith, D. M., & Staubert, R.
2000, A&A, 357, L17
Pottschmidt, K., et al. 2003, A&A, 407, 1039
- 27
Reid, M. J., McClintock, J. E., Narayan, R, Gou, L., Remillard, R A., & Orosz, J. A. 2011,
in Bulletin of the American Astronomical Society, Vol. 43, American Astronomical
Society Meeting Abstracts #217, 223.01-+
Rothschild, R E., et al. 1998, ApJ, 496, 538
Scuderi, S., Panagia, N., Stanghellini, C., Trigilio, C., & Umana, G. 1998, A&A, 332, 251
Shaposhnikov, N., & Titarchuk, L. 2007, ApJ, 663, 445
Stirling, A. M., Spencer, R E., de la Force, C. J., Garrett, M. A., Fender, R P., & Ogley,
R N. 2001, MNRAS, 327, 1273
Titarchuk, L. 1994, ApJ, 434, 570
Walborn, N. R 1973, ApJL, 179, L123+
Werner, M. W., et al. 2004, ApJS, 154, 1
Wilms, J., Nowak, M. A., Pottschmidt, K., Pooley, G. G., & Fritz, S. 2006, A&A, 447, 245
Wright, A. E., & Barlow, M. J. 1975, MNRAS, 170,41
Wu, C., Holm, A. V., Eaton, J. A., Milgrom, M., & Hammerschlag-Hensberge, G. 1982,
PASP, 94, 149
Xiang, J., Lee, J. C., Nowak, M. A., & Wilms, J. 2011, ApJ, submitted
Zdziarski, A. A., Gierliriski, M., l'vlikolajewska, J., Wardziriski, G., Smith, D. M., Harmon,
B. A., & Kitamoto, S. 2004, ~INRAS, 351, 791
Ziolkowski, J. 2005, MNRAS, 358, 851
This lHClHU,"~l was prepared with the AAS macros v5.2.
Ob8, #
2
;)
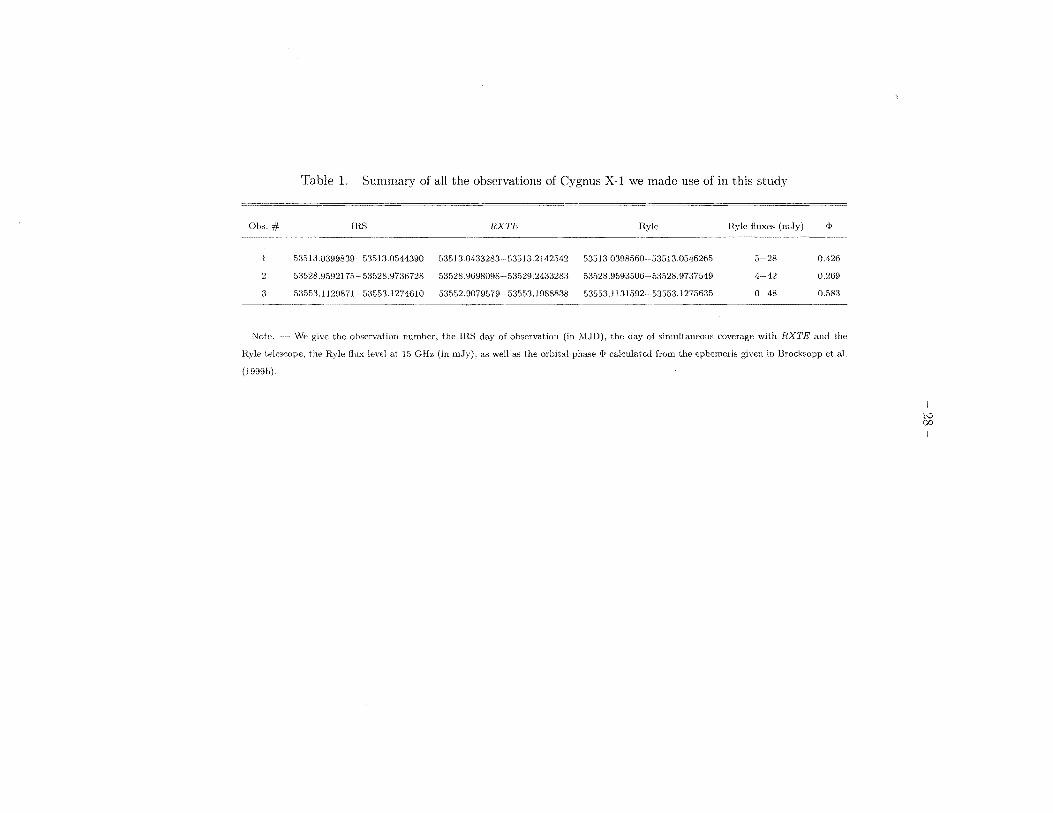
Table 1. Summary of all the observations of Cygnus X-l we made use of in this study
lRS RXTE Ry!e
53513,0399839- 53S13,0544390 53513,0433283-53513,2142542 53513,0398560-53513,0546265
5:3528,9592175-53528,9736728 53528,9698098-53529,2433283 53528,9593506-53528,9737549
5:35[,;>.1 129871 -,5:3553,1274610 53552,9079579-53553,1988838 53553,1131592-5355:3,1275635
Ry!e fluxes (mJy)
5-28
4-1.2
0-48
1>
0.426
0,269
0.583
Note, We give the observation number, the IRS day of observation (in MJD), the day of simultaneous coverage with RXTE and the
Hyle telescope, th" Ryle flux level at 15 GHz (in mJy), as well as the orbital phase 1> calculated from the ephemeris given in Brocksopp et al.
(HI99b),
tv (X)
I
- 29-
Obs.1 0.4 2
3 0.3
0.2 >; :::;.. z-. 'w c: Q) "0
0.1 >< :::l 0.09 iI 0.08
0.07 0.06
0.05
0.04
6 7 8 9 10 20 30
Wavelength (microns)
Fig. 1.- Dereddened spectra of Cygnus X-I based on Spitzer/IRS spectroscopy taken in 2005
May 23 (Obs. 1), June 7 (Obs. 2), and July 2 (Obs. 3).
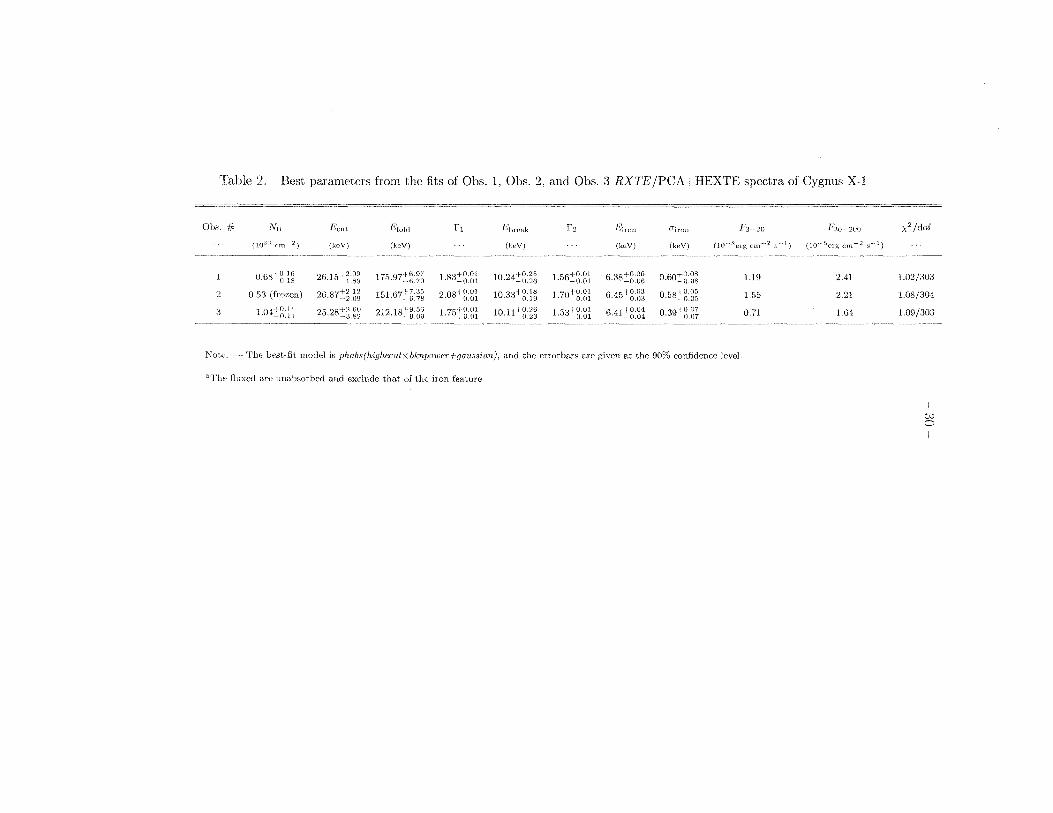
2. Best parameters from the fits of Obs. 1, Obs. 2, and Obs. 3 RXTE/PCA+HEXTE spectra of Cygnus X-I
O},s. # Nil
2
:3
(lO?2
E'ent })fold
(keY) (keV)
212.18:,~gg
rl Ehrcak
(b·Y)
1.83~~gi 1O.24~g~~
208+ 0 .01 . --0.01 1O.33:,g:~
1.75:,gg; 1O.11+g;~
rz Eiron O"iron 1"3--20
(keY) (keY) (10 "Serg cm-- 2 B 1)
1.56~ggi 6.38:,gg~ O.60-+gg~ 1.19
1.70:,gg: 6.45:,:gg~ 1.55
1.53:,:g?,; 6.41 :,:gg! 0.39:,:gg~ 0.71
Note. The bmt-fit model is phabs(highec1ltx bknpowcr+ga1lssian), and the cITorbars are given at the 90% confidence level.
"The fluxed are unabsorbed and exclude that of the iron feature
F20 -200
(10· Serg cm- 2
2.41
2.21
1.64
')
X2
/ dof
1.02/303
1.08/304
1.09/303
c.v o I
- 31
Obs.1 data and folded model
100
10
Fig. 2.~ Obs. LObs. 2, and Obs. 3 RXTE/PCA+HEXTE spectra of X-l fitted with the
model
32 -
1.6 +
+ + 1.4 + + ++++ + +++
+ ,. + ~~ 1.2 +:
+ ~'+ +,. ,. ~:r: + +
++ + +++ + 0.8 + +
50 + +1 + ~ 40 -<+ :+ 2 ... +++ +
, 1 ~~ 30 + ++
U 20 ++ 10
27
t 24 +
~. " >: 21 + l ~ ...
JR~ 18 + iF ~Jtti! >-.- 15 + '" *
.;::I.: I ;~I a:: x + '" i; .il 12 * + t. $ u.. 9 ,.
6 + f * 3 +
0 53500 53510 53520 53530 53540 53550 53560 53570
MJD
Fig. 3.- Ryle (15 GHz, bottom) and ASM (1.2-12.0 kev, middle) light curves, as well as the
ASM HR2=C / A hardness ratio (top) of Cygnus X-I between MJD 53500 and MJD 53580. Our
three IRS spectroscopic observations are marked in dashed lines.
1.45
1.4 t 1.35
1.3
C\I cr: 1.25 :c ~ (f) 1.2 «
1.15
1.1
1.05 r
1 0.2
- 33-
0.25 0.3 0.35
1.2-12 keV ASM flux (Crab)
Obs.3 --Obs.1 Obs.2 .
0.4 0.45
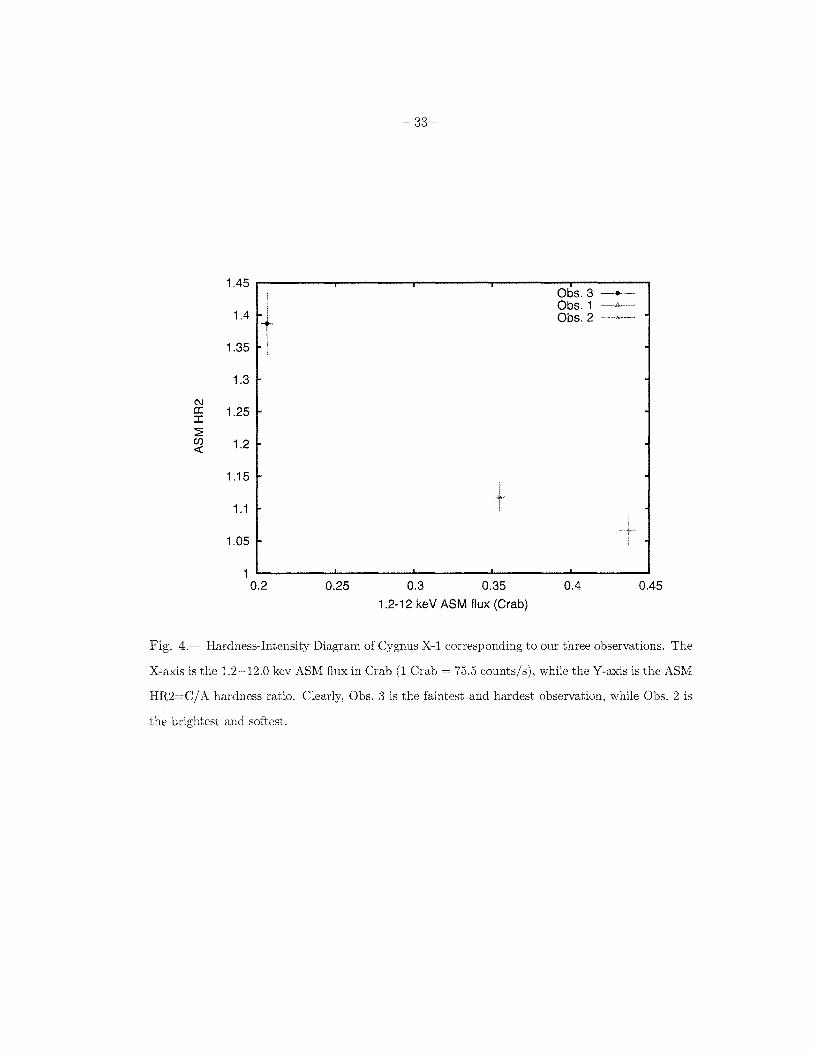
Fig. 4.- Hardness-Intensity Diagram of Cygnus X-I corresponding to our three observations. The
X-axis is the 1.2-12.0 kev ASM flux in Crab (1 Crab 75.5 counts/s), while the Y-axis is the ASM
HR2=C/A hardness ratio. Clearly, Obs. 3 is the faintest and hardest observation, while Obs. 2 is
the brightest and softest.
-o.Q1'--'----''----'---''--...... ---'----'--...... -I 0.040 0.042 0.044 0.046 0.048 0.050 0.052 0.054
MJD 53513
Obs.2
112 0.114 0.116 0.118 0.120 0.122 0.124 0.126 0.128
fI.JD53553
5.- Obs. 1. Obs. 2, and Obs. 3 curves s. blue UHHHVllU" each IRS
The black segments represent each the the median radio flux and
the the exposure time. The red line is the median radio flux during the whole observation.
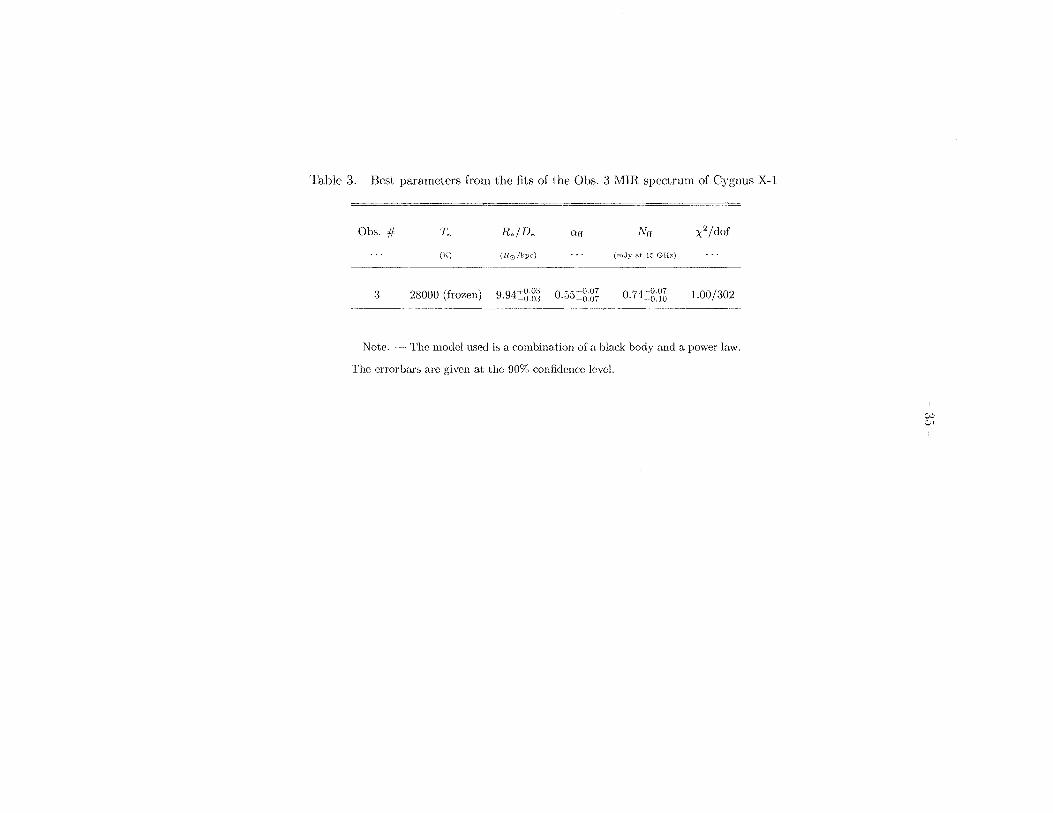
Table 3. Best parameters from the fits of the Obs. 3 MIR spectrum of Cygnus X-1
Obi;. # T* R./D. aff
(l<) (Hu/kpc)
3 28000 (frozen) 9.91!gg~ 0.55!gg;
Nff
(mJyat 15 GHz)
0.74[-0.07 --0.10
X2
/ dof
1.00/302
Note. The model used is a combination of a black body and a power law.
The error bars are given at the 90% confidence level.
C;.:i c..n
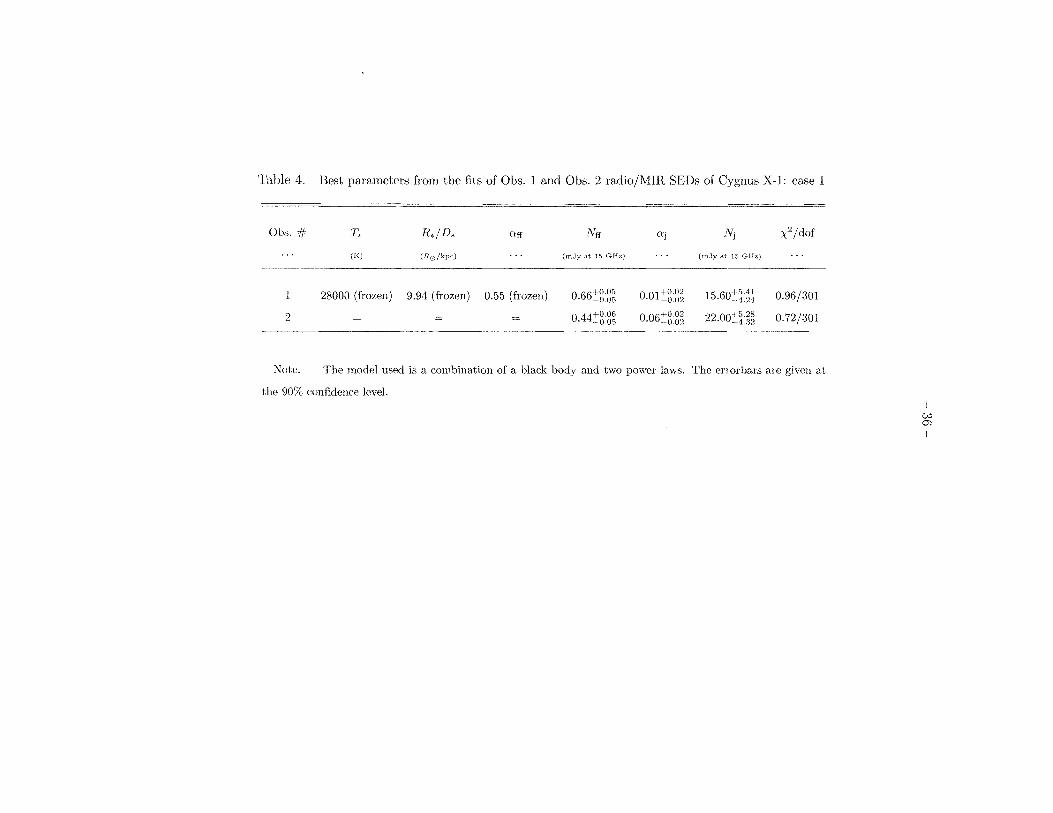
Table 4. Best parameters from the fits of Obs. 1 and Obs. 2 radio/MIR SEDs of Cygnus X-I: case 1
Obs. # 7~ R./D* nff Nff nj Nj x2/ dof
(K) (RC)/kpc) (mJyat ]5 GHz) (m.Tyat 15 Gllz)
28000 (frozen) 9.94 (frozen) 0.55 (frozen) 0.66~ggg O.01~gg~ l5.60~~~~ 0.96/301
2 0.44:t:ggg 0.06+gg~ 22.00~~~~ 0.72/301
Note. The model used is a combination of a black body and two power laws. The errorbars are given at
the 90% confidence level.
w CJ)
I
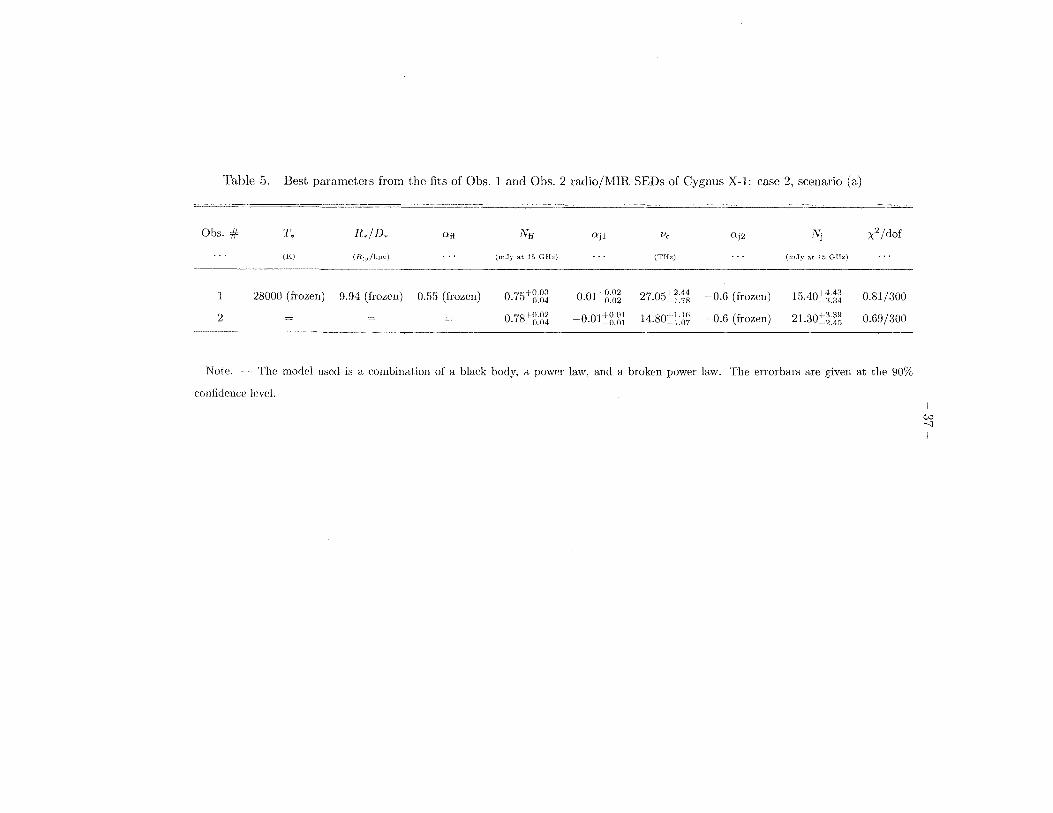
Table 5. Best parameters from the fits of Obs. 1 and Obs. 2 radio/MIll SEDs of Cygnus X-l: case 2, scenario (a)
Obs. if "1'. R./D* aff Nff ajl I/c aj2 Nj X2/ dof
(K) (Ho/kpc) (rnJy at 15 GHz) (THz) (mSy /l,t, 15 GHz)
28000 (frO?~en) 9.94 (frozen) 0.55 (frozen) 0.75":gg~ O.01":gg~ 27.05~ii~ --0.6 (frozen) 15.40-tt~~ 0.81/300
2 0.78~gg~ -o.Ol-+:ggi 14.80~U~ -0.6 (frozen) 21.30-+:~ig 0.69/300
Not(~. The model used is a combination of a black body, a power law, and a broken power law. The errorbars are given at the 90%
confidence level.
CN -1 I
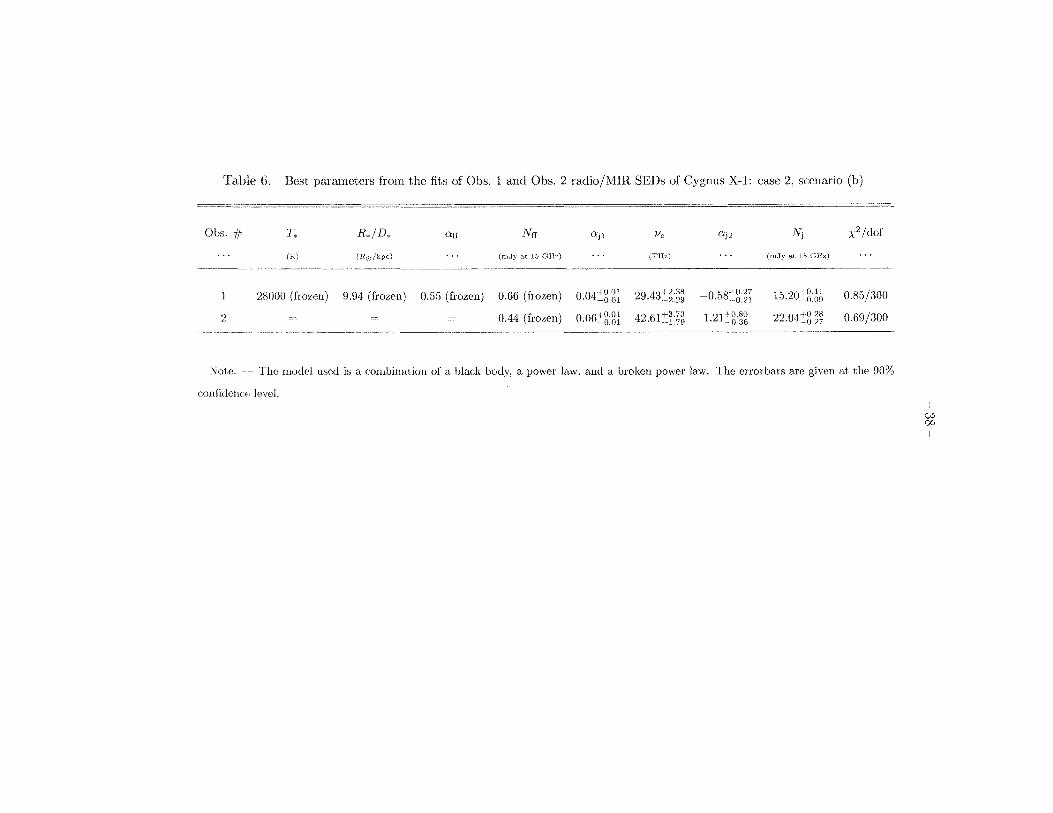
Table 6. Best parameters from the fits of Obs. 1 and Obs. 2 radio/MIR SEDs of Cygnus X-I: case 2, scenario (b)
Obs. # 1'. Ii./]). (kff Nff njl lie nj2 Nj X2
/ dof
(K) ( I10/kpc) (lILly at 15 GHz) (TH.) (mJyat 15 GHz)
28000 (fror,en) 9.94 (fror,en) 0.55 (frozen) 0.66 (frozen) o.o4!88i 29.43-l~~~ -O.58!g~I 15.20:+86~ 0.85/300
2 0.44 (fror,en) o.o6:+:g8i 42.61:+:f~~ 1 21 1080 . --0_36 22.04~g~~ 0.69/300
Note. The model used is a combination of a black body, a power law, and a broken power law. The errorbars are given at the 90%
confidence level.
eN (Xl
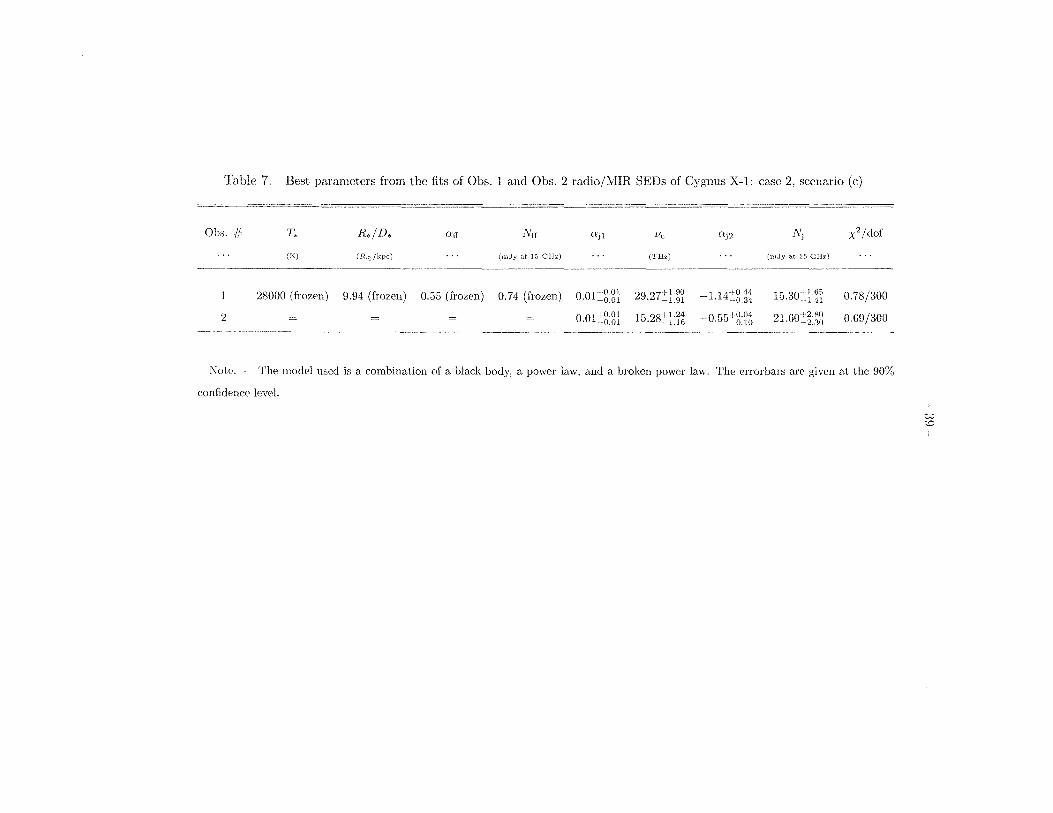
Table 7. Best parameters from the fits of Obs. 1 and Obs. 2 radio/MIR SEDs of Cygnus X-I: case 2, scenario (e)
Obs. # 1~ R*/D* (Xff Nff Ctjl Vc Ctj2 N J x2/ dof
(K) (I'O/kpc) (mJ)' at lS GHz) (THz) (mJyat 15 GHz)
28000 (fro:t,en) 9.94 (frozen) 0.55 (frozen) 0.74 (frozen) o·01~ggi 29.27~ig7 --1.14~iU! 15.30:ti~~ 0.78/300
2 o·01~ggi 15.28!U~ -0.55:t_87& 21.60!~~g 0.69/300
Note. The model used is a combination of a black body, a power law, and a broken power law. The errorbars are given at the 90%
confidence level.
w CD
>; 2-C 'iii c: Q) -0 >< :l u::
0.4 0.3
0.2
0.1
0.05 0.04 0.03
- 40
09.71ab star -Bremsstrahlung -~-;Jv"1
o.o~ t ~""""""~".-"'''----~-.I''''''~' __ 'iJlllf1lI~j -0.05 '--_______ -'-_____ ..L... -----'----'---'-
1e+13 2e+13 3e+13 4e+13 5e+13
Frequency (Hz)
Fig. 6.- Fit of the MIR continuum of Cygnus X-I during Obs. 3, with a stellar black body and
an expanding wind bremsstrahlung.
0.5
>; 0.25 2-.z:. 'iii c: 0.1 OJ -0 >< 0.05 :::> iI
0.02
>; 0.02 2-
0 (j) OJ -0.02 a:
1e+10
0.5
>; 0.25 2-.z:. 'iii c: 0.1 OJ -0 >< 0.05 :::> iI
0.02
>; 0.02 2-
0 (j) OJ -0.02 a:
1e+10
~ 41 ~
Obs.1
1e+11 1e+12
09.71ab star Bremsstrahlung
Compact jets
1e+13
Frequency (Hz)
Obs.2
1e+11 1e+12
09.71ab star -Bremsstrahlung
Compact jets
1e+13
Frequency (Hz)
Fig. 7.- Obs. 1 and Obs. 2 YIIR/radio SEDs of Cygnus X-1: case 1.
0.5
>, 0.25 ::2-
.~ "
0.1 "0 ~
0.05 => u:
0.02
>, 0.02 ::2- 0 '" " -0.02 a:
1e+10
0.5
3: 0.25
'" ·in c 0.1 " "0 ~ 0.05 => u:
0.02
>, 0.02 ::2- 0 ~ a: -0.02
1e+10
0.5
:;; 0.25 ::2-
'~ 0.1
" "0
~ u: 0.05
0.02
3: 0.02
'" " a:
1e+11
Obs.l
09.71ab star Bremsstrahlung
Compact jets
/ / 1e+12 1e+13
Frequency (Hz)
09.71ab star Bremsstrahlung
Compact jets
/
!
!
1e+11 1e+12 1e+13
Frequency (Hz)
16+11 1e+12
09.71ab star Bremsstrahlung
Compact jets
1e+13
Frequency (Hz)
42 -
0.5
>- 0.25 ::2-
i 0.1 " "0 ~
0.05 " u:
0.02
>, 0.02 ::2- 0 if>
" -0.02 a: 1e+10
0.5
~ 0.25
'" .~ 0.1
'" "0 x
0.05 => u:
0.02
>- 0.02 ::2-~ -0.02 a:
1e+10
Obs.2
09.71ab star -Bremsstrahlung
Compact jets
1e+11 1e+12 1e+13
Frequency (Hz)
1e+11 1e+12
09.7lao star Bremsstrahlung
Compact jets
1e+13
Frequency (Hz)
1e+11 1e+12 1e+13
Frequency (Hz)
Fig_ 8.- Obs. I and Obs. 2 MIR/radio SEDs of Cygnus X-I, case 2: (top) scenarios (a). (middle)
scenario (b), (bottom) scenario (c).
43 -
Obs1:LLnod1 Obs 1: LL nao 2
0.08
~ ~ ~ ~
if 0.06
0.05
0.04
Wavelength (microns) Wavelength (microns)
Obs 2: LL nodi Obs 2: LL nod2 0.1
0.09
0.08 0.08
~
f 0.06 ~
>-2-
0.Q7
f 0.06 ~
u: u: 0.05
0.Q4
003 14 16 18 20 22 24 26 28 30 32
Wavelength (microns) Wavelength {microns)
Obs 3: LL nod 1 0.1
tL1 0.09
0.08
3' 0.07 ~
>-0.06 "!
-0 f 0.06
0.05 x ~
u: x 0.05 0:
0.04 0.04
0.03 0.03
0.02 0.02
14 16 18 20 22 24 26 28 30 32 Waveler.gth (microns) Wavelength {microns)
Fig. 9.~ LL nod I and nod 2 spectra of Cygnus X-I during Obs. 1 (top), Obs. 2 (middle), and
Obs.3
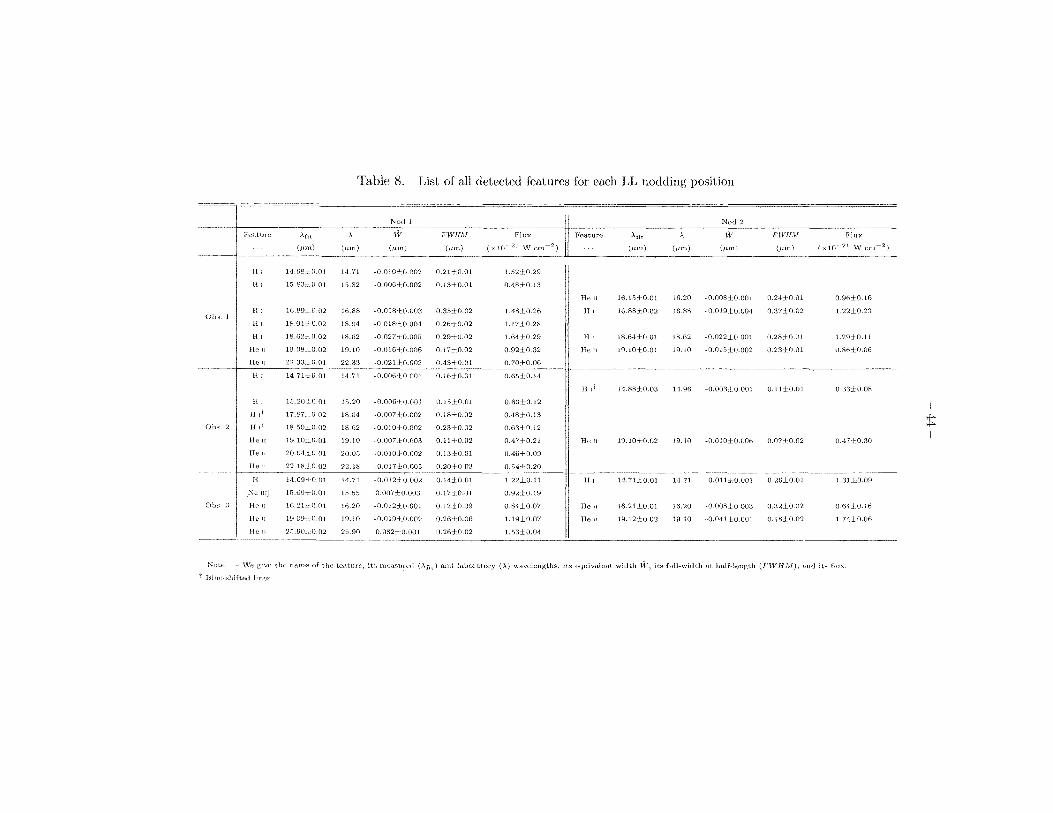
Table 8. List of all detected features for each LL nodding position
Nod I Nod 2
Featllre Aflt A W FWlIM Flux Feature Ant A W FWIlM Flmc
(pm) (trm) (p.rn) UHU) (x 1O~21 \'1,' cm-- 2 ) Clnn) (tim) (Jim) (ron) (XI0~'21 \V cm- 2 )
HI 14.681 (LOI 14.71 ·03110HL002 0.21±O.OI L52:LO.29
Hi 15.82 . (U)061 0.002 0.13±0.Ol O.48±0.13
He u 16.15~lO.Ol 16.20 ·0.008cl,0.0(1l O.2H·0.OI 0.9610.16
HI HL89:L 0.02 lG.88 ·0.OI810.0m O.;3f)±O.02 1.48±0.26 HI 16.88.LO.02 W.88 ·O.OI9.H.004 0.37±0.02 1.22±0.23 1 I
HI IS.OU 0.02 18.04 ·0.018J,0.004 O.2tHO.02 1.17·1.0.28
III 18.62:1. 0.02 18.62 -OJ)27..:LO.QQ,S O.29±0.O2 1.64±O.29 III 18.6HO.01 18.62 ·0.022H).001 0.28±0.01 1.2000.11
He !J 19.08jO.02 19.10 ·0.OI6,lO.00G 0.17+.0.02 0.92±0.:J2 He l! 19.101.0.01 19.10 ·0.015i.0.002 0.23-10.01 O,86:l:0.()6
Hell 0.01 22.33 ·0.021,Lo.002 O.4:H.O.Ol O.70J·O.06
HI 14.7H 0.01 14.71 ·0.000·10.001 0.16:1.0.01 0,65-10.14
HIt 14.88i.0.03 14.96 ·0.00310.001 O.IH-O.OI 0.3310.08
HI 15.20J 0.01 15.20 ·0.00610.001 O.15J-O,01 0.60-10.12
H jt l7.SH 0.02 IB.04 ·0.007±0.002 O.18±O.O2 0.48HJ.13 ~
2 I HIt HU'iOJ O'(l2 18.62 ·0.010" 0.002 0.23,(0.02 0.63i.O.12 ~
He If 19.HUO.01 EUO ·O.OOH.O.OO:l 0.IHO.02 0.4HO.21 Hell IO.!O±O.02 19.10 ·0.O!OlO.O06 0.OH·O.02 0.47.1.0.30 I
He H 20.0410.01 2().OS ·O.OIOJ 0.002 0.13±O.01 0.46±11.09
He !! 22.ISJ.O.02 22.18 ·O.OI7±0.OO,S O.20±O.03 0.5471:0.20
HI 14.69:1 0.01 14.71 ·0.01210.002 O.IHO.OI 1.22±0.11 II HI 14.7I±0.0I 14.71 ·O.OII±,O.OOl O.26C±.0.01 1.:-n+0.09
[Nc wJ 15.GO:U)'()} 1f).f),S O.007±0.003 0.1HO.OI O.92i.O.19
fIell H>'21-10.01 16.20 ·0.012±0.001 0.12·i(l.09 0.84±0.07 He II !6.21±0.01 16.20 ·0.OO810.0m O.32±(U)2 0.64±O.16
Hell Ifl.09:-l: 0.01 Hl.lO ·0.01910.002 0.20,LO.O" 1.19±0.O7 Hell 19.12,1.0.02 19.10 ·0.04HO.OOl 0.1800.02 L74±O.OG
He H 25.90:HUl2 25.90 O.082±O.OOI O.2(HO.02 1.53.t 0.04
Note:. \Ve the name of the feature, its mcas1!red (),fid and lahoratory (>.) wavelengths, its equivalont widt.h Hr, its full-width at half-lcll?,th (FWHAI), and it.s flux.
10
>: 0.1 2-~ '00 0.01 c: Q) "0 x 0.001 ::>
IT:
0.0001
1e-05
1e-06
1e+10 1e+12
- 45-
09.71ab star -Bremsstrahlung -
Compact jet
RXTEIX-ray
IBIS/y
1e+14 1e+16 1e+18 1e+20 1e+22 Log(Frequency (Hz))
Fig. 10.- Radio to X-ray SED of Cygnus X-I during Obs. 1 (case 2a). The compact jet (green),
bremsstrahlung (magenta), and stellar (blue) contributions are displayed. Simultaneous Ryle, IRS,
and RXTE data are superimposed. We also add the data from the INTEGRAL/IBIS compton
mode, obtained by combining all the IBIS observations of the source, in the HS, between 2003 and
2010 (Laurent et al. 2011).