Embed Size (px)
Citation preview
A MULTISECTORAL BILATERAL WORLD TRADE MODEL
Qiang MA
1. Abstract
This study presents the specification, estimation and historical simulation of a multisectoralbilateral trade model for 120 commodity categories and fourteen countries and two regionscovering the rest of the world. The model shows, for each trade flow, the country of origin, thecountry of destination, and the commodity traded. The primary purpose of the study is to enablethe making of long-range annual forecasts of bilateral trade flows within the Inforum internationalmultisectoral modeling system.1 Besides their own intrinsic interest, the detailed bilateral tradeflows ensure rigorous accounting consistency in the trade forecasts and also permit examinationof specific changes in international competitive relations. The analysis uses time-seriesregressions on annual OECD and UN data of international trade by commodity of origin anddestination for the 1974-91 period.
2. Overview of the Model
The bilateral trade model differentiates 120 categories of commodity trade (Table 1), anddistinguishes fourteen countries and two regions covering the rest of the world. The countriesare Canada, the United States, Mexico, Austria, Belgium, France, Germany, Italy, the UnitedKingdom, Spain, Japan, China, South Korea and Taiwan. The two regions are the rest of theOECD (ROECD) and the rest of the world (ROW). Taiwan, ROECD and ROW excepted, eachcountry has a complete, multisectoral forecasting model in the Inforum family.
Prior to the development of the bilateral trade model, the country models in the Inforuminternational system were linked through national import and export functions. For instance, theItalian furniture export function connects the total furniture exports of Italy to a weighted averageof the furniture imports of all the other countries in the linked system and to the ratio of Italianexport prices to a weighted average of domestic furniture price in the other partner countries.Though the relation works at the industry level -- namely, furniture
1 Inforum originally stood for the INterindustry FORecasting at the University of Maryland, a research groupaffiliated with the Department of Economics. Since its founding by Clopper Almon in 1967, Inforum has come todesignate an international group with partners in Europe, Asia, and North America. This group has created a systemof large scale input-output models of the United States and its major trading partners. The models are usedextensively by the government and private industry in making policy decisions. For a more complete treatment ofthe structure, methodology, and applications of the Inforum national models, the reader is referred to a symposiumon Economic Systems Research, vol. 3, number 1, 1991.
INFORUM November 1995
Table 1. Sector Number and Title of the Bilateral Trade Model
SECTOR SECTOR TITLE SECTOR SECTOR TITLE1 Unmilled cereals 61 Glass2 Fresh fruits and vegetables 62 Cement3 Other crops 63 Ceramics4 Livestock 64 Non-metallic mineral products nec.5 Silk 65 Basic iron and steel6 Cotton 66 Copper7 Wool 67 Aluminum8 Other natural fibers 68 Nickel9 Crude wood 69 Lead and zinc10 Fishery 70 Other Non-ferrous metal11 Iron ore 71 Metal furnitures and fixtures12 Coal 72 Structural metal products13 Non-ferrous metal ore 73 Metal containers14 Crude petroleum 74 Wire products15 Natural gas 75 Hardware16 Non-metallic ore 76 Boilers and turbines17 Electrical energy 77 Aircraft engines18 Meat 78 Internal combustion engines19 Dairy and eggs 79 Other power machinery20 Preserved fruits and vegetables 80 Agricultural machinery21 Preserved seafood 81 Construction,mining,oilfield eq22 Vegetable and animal oils and fats 82 Metal and woodworking machinery23 Grain mill products 83 Sewing and knitting machines24 Bakery products 84 Textile machinery25 Sugar 85 Paper mill machines26 Cocoa, chocolate,etc 86 Printing machines27 Food products nec. 87 Food-processing machines28 Prepared animal feeds 88 Other special machinery29 Alcoholic beverage 89 Service industry machinery30 Non-alcoholic beverage 90 Pumps,ex measuring pumps31 Tobacco products 91 Mechanical handling equipment32 Yarns and threads 92 Other non-electrical machinery33 Cotton fabric 93 Radio,TV,phonograph34 Other textile products 94 Other telecommunication equipment35 Floor coverings 95 Household electrical appliances36 Wearing apparel 96 Computers and accessories37 Leather and hides 97 Other office machinery38 Leather products ex. footwear 98 Semiconductors & integrated circuits39 Footwear 99 Electric motors40 Plywood and veneer 100 Batteries41 Other wood products 101 Electric bulbs,lighting eq.42 Furnitures and fixtures 102 Electrical indl appliance43 Pulp and waste paper 103 Shipbuilding and repairing44 Newsprint 104 Warships45 Paper products 105 Railroad equipment46 Printing, publishing 106 Motor vehicles47 Basic chemicals ex. fertilizers 107 Motorcycles and bicycles48 Fertilizers 108 Motor vehicles parts49 Synthetic resins, man-made fibers 109 Aircraft50 Paints, varnishes and lacquers 110 Other transport equipment51 Drugs and medicines 111 Professional measurement instruments52 Soap and other toilet preparations 112 Photographic and optical goods53 Chemical products nec. 113 Watches and clocks54 Petroleum refineries 114 Jewellery and related articles55 Fuel oils 115 Musical instruments56 Product of petroleum 116 Sporting goods57 Product of coal 117 Ordnance58 Tyre and tube 118 Works of art59 Rubber products,nec. 119 Manufactured goods nec.60 Plastic products,nec. 120 Scraps,used,unclassified
INFORUM November 19952
-- it says nothing about bilateral trade. That is, it does not show how much Italian furniture isgoing to Germany, how much to the United States, or how much to France. Conversely, theimport functions do not specify from which countries the imports come.
The bilateral trade model builds strict accounting consistency into the linked system. Itdescribes, for each commodity trade flow, the country of origin and country of destination.Furthermore, by linking the Inforum’s multisectoral national forecasting models with bilateraltrade flows, the bilateral trade model permits the analysis of specific trade effects at a verydetailed level. The bilaterally- and sectorally-linked world forecasting system, for instance, canaddress quantitatively specific questions such as, How will the U.S. exports of Dairy productsto the United Kingdom be affected when Canada lowers its price of Dairy products by tenpercent? How will German exports of semiconductors and integrated circuits to Italy be affectedwhen Japan speeds up capital investment in its semiconductor industry? What is the industrialimpact of eliminating the U.S. quota on the imports of motor vehicles from Japan, or of loweringthe Chinese tariff on imports of motor vehicles, or of imposing uniform VAT (Value AddedTaxes) rates across countries?
The process with which the bilateral trade model is used to produce forecasts of bilateraltrade flows among these countries may be described in the following manner. First, the trademodel takes the sector-specific export prices and capital investment from the national models inthe national sectoring schemes and converts them into the trade model classification. On thebasis of these national projections, the trade model forecasts some 120 commodity-specific trade-shares matrices. Then, it takes as given each national model’s import projection in the nationalsectoring schemes, converts it into the trade model commodity classification, and then allocatesthem through the trade-shares matrix to their source countries. Summing the allocations to eachexporter across importers gives exports by product by exporter in the trade model nomenclature,which are then translated into respective national classification schemes for use in the nationalmodels. The process is repeated until an equilibrium solution is arrived.
The centerpiece of the bilateral trade model is the trade-shares matrix. It is derived from thetrade flow matrix M, defined as follows. For each of the 120 commodities, M is a square, 16by 16 matrix with a row and a column for each country or region. The ith row of an M matrixshows the exports of country i to each of the other countries. The diagonal elements are all zero,except where intraregional flows exist. The total imports of country j are given by the columnsum M.j = ∑iMij, and total exports of country i is the row sum Mi. = ∑jMij. The trade-sharesmatrix, S, is obtained by dividing each column of M by its column sum. Hence, Sij is theproportion of goods from country i in country j’s imports.
As an example of the matrix M, Table 2 shows the international flows of auto parts for thecalendar year 1990 (the base year of the trade model). Each column shows the imports, inmillions of U.S. dollars, of the country whose name appears at the top of the column from eachcountry named down the side. The bottom row shows total imports of each country (the Mj).Table 3 shows the S matrix corresponding to the M-matrix of Table 2. As the bilateral trade
INFORUM November 19953
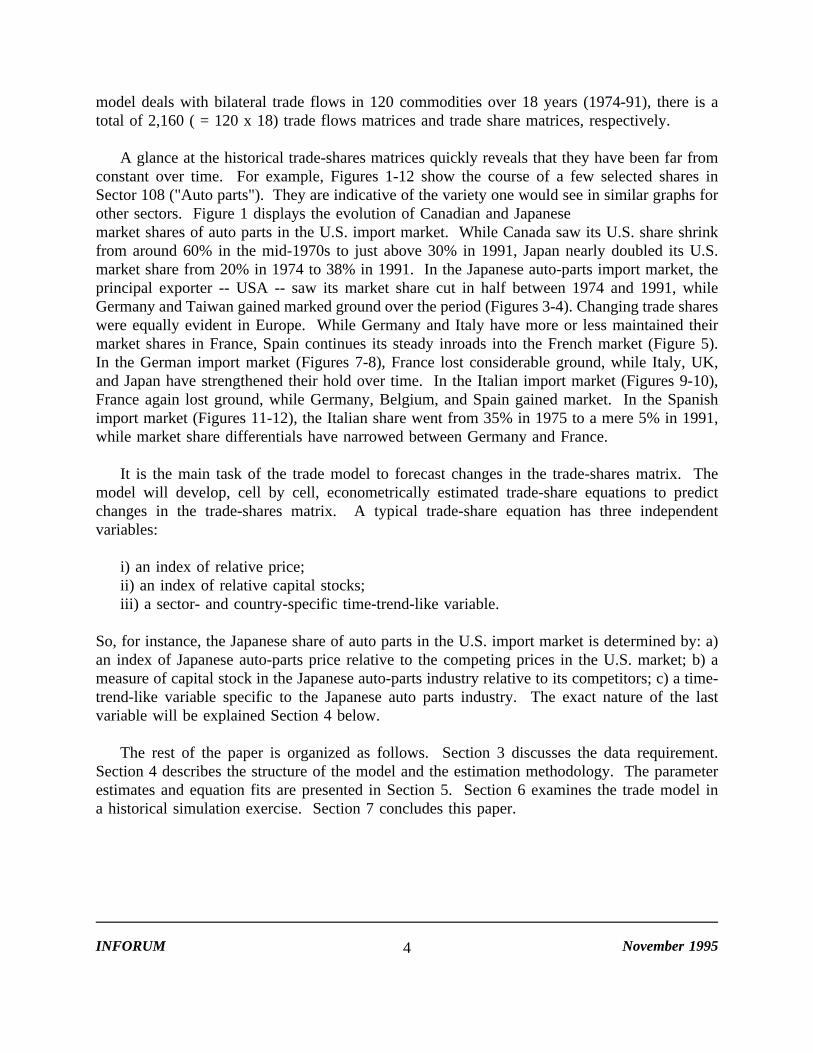
model deals with bilateral trade flows in 120 commodities over 18 years (1974-91), there is atotal of 2,160 ( = 120 x 18) trade flows matrices and trade share matrices, respectively.
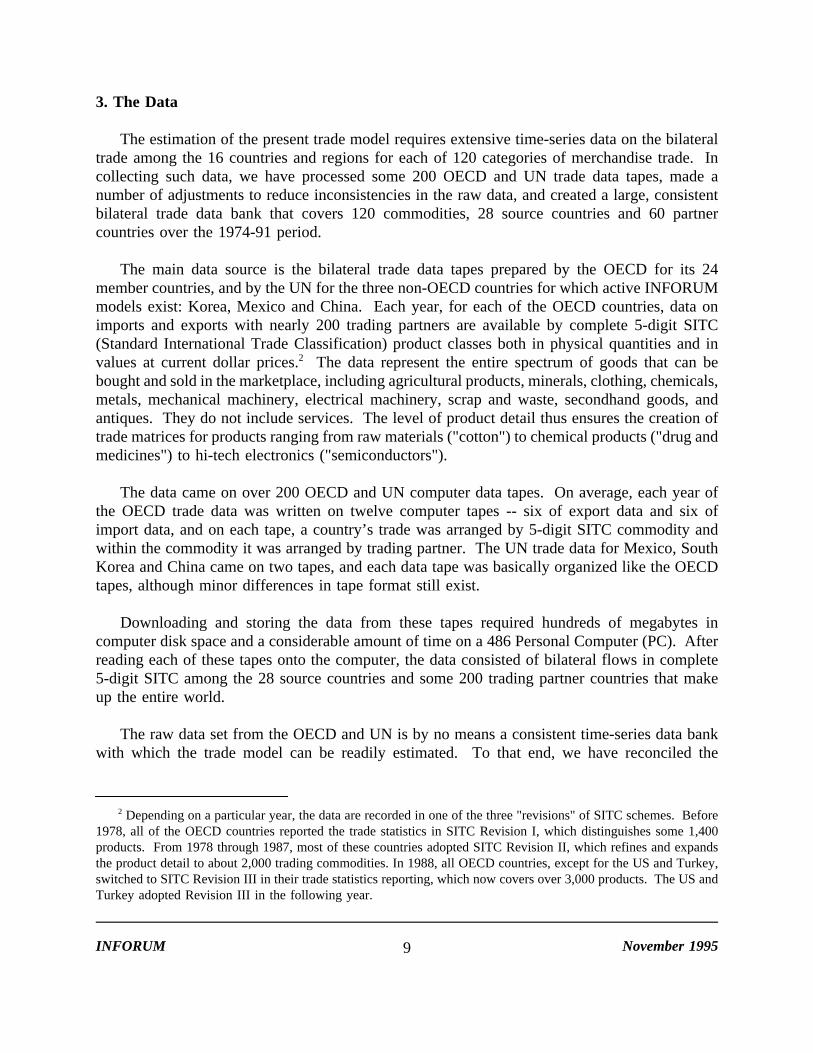
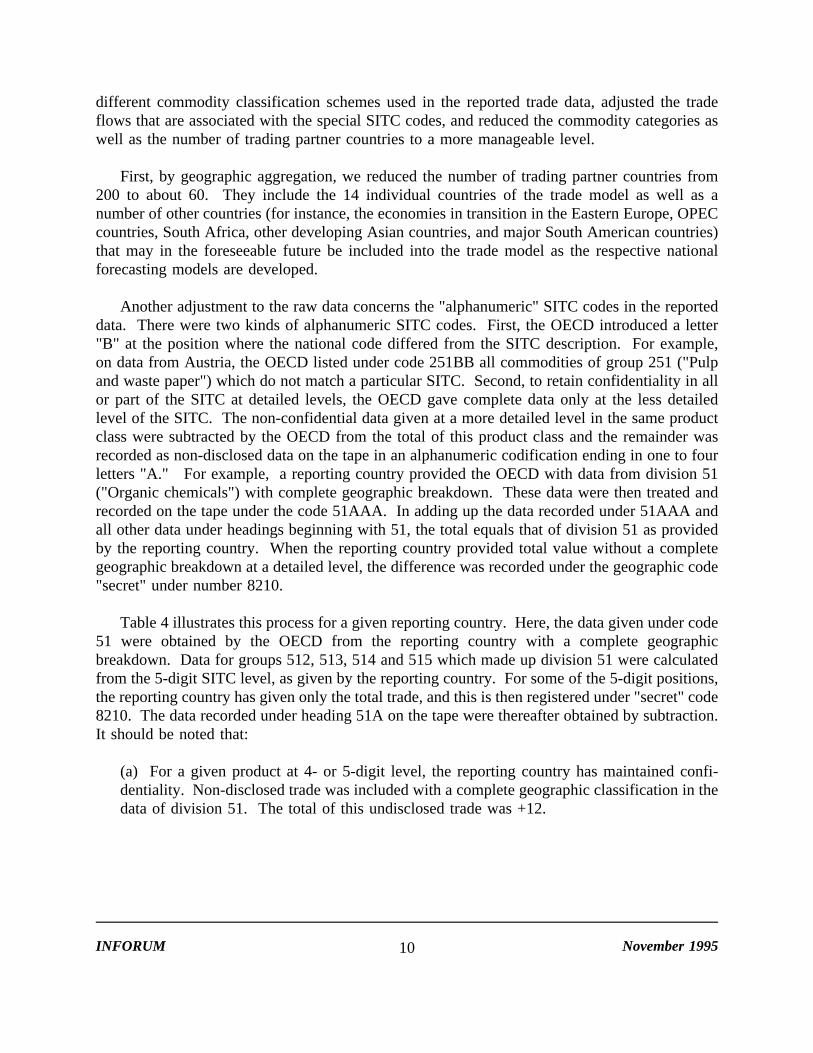
A glance at the historical trade-shares matrices quickly reveals that they have been far fromconstant over time. For example, Figures 1-12 show the course of a few selected shares inSector 108 ("Auto parts"). They are indicative of the variety one would see in similar graphs forother sectors. Figure 1 displays the evolution of Canadian and Japanesemarket shares of auto parts in the U.S. import market. While Canada saw its U.S. share shrinkfrom around 60% in the mid-1970s to just above 30% in 1991, Japan nearly doubled its U.S.market share from 20% in 1974 to 38% in 1991. In the Japanese auto-parts import market, theprincipal exporter -- USA -- saw its market share cut in half between 1974 and 1991, whileGermany and Taiwan gained marked ground over the period (Figures 3-4). Changing trade shareswere equally evident in Europe. While Germany and Italy have more or less maintained theirmarket shares in France, Spain continues its steady inroads into the French market (Figure 5).In the German import market (Figures 7-8), France lost considerable ground, while Italy, UK,and Japan have strengthened their hold over time. In the Italian import market (Figures 9-10),France again lost ground, while Germany, Belgium, and Spain gained market. In the Spanishimport market (Figures 11-12), the Italian share went from 35% in 1975 to a mere 5% in 1991,while market share differentials have narrowed between Germany and France.
It is the main task of the trade model to forecast changes in the trade-shares matrix. Themodel will develop, cell by cell, econometrically estimated trade-share equations to predictchanges in the trade-shares matrix. A typical trade-share equation has three independentvariables:
i) an index of relative price;ii) an index of relative capital stocks;iii) a sector- and country-specific time-trend-like variable.
So, for instance, the Japanese share of auto parts in the U.S. import market is determined by: a)an index of Japanese auto-parts price relative to the competing prices in the U.S. market; b) ameasure of capital stock in the Japanese auto-parts industry relative to its competitors; c) a time-trend-like variable specific to the Japanese auto parts industry. The exact nature of the lastvariable will be explained Section 4 below.
The rest of the paper is organized as follows. Section 3 discusses the data requirement.Section 4 describes the structure of the model and the estimation methodology. The parameterestimates and equation fits are presented in Section 5. Section 6 examines the trade model ina historical simulation exercise. Section 7 concludes this paper.
INFORUM November 19954
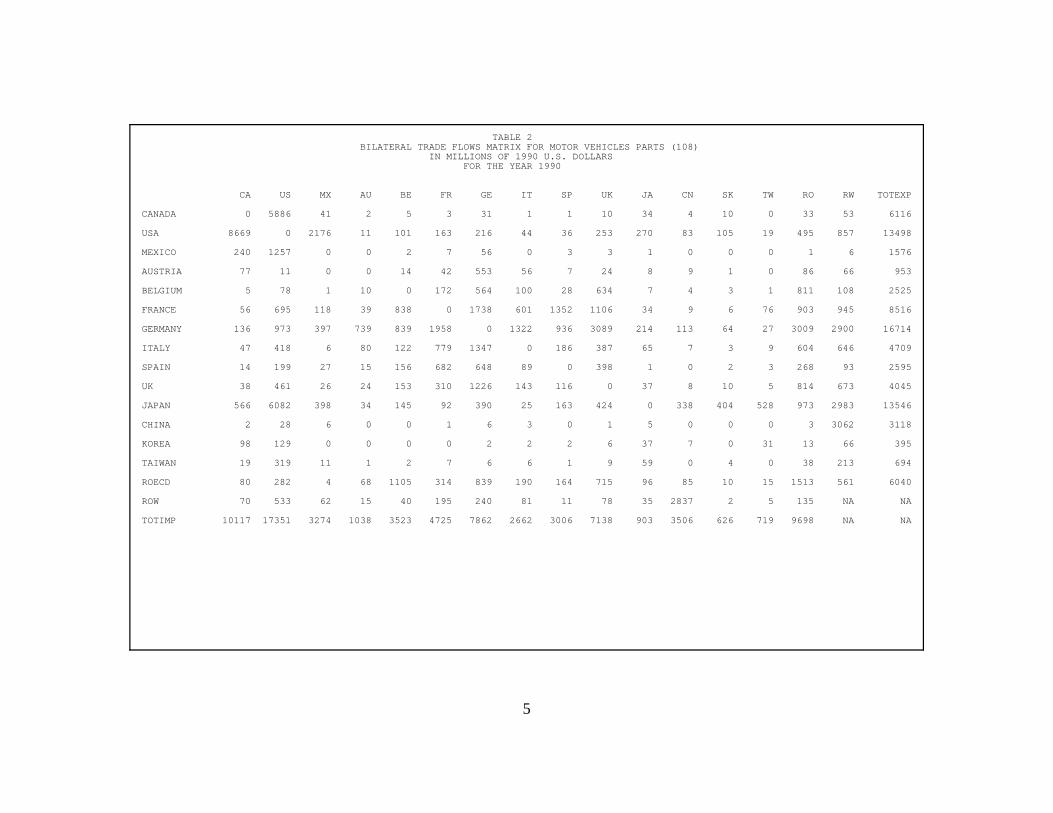
TABLE 2BILATERAL TRADE FLOWS MATRIX FOR MOTOR VEHICLES PARTS (108)
IN MILLIONS OF 1990 U.S. DOLLARSFOR THE YEAR 1990
CA US MX AU BE FR GE IT SP UK JA CN SK TW RO RW TOTEXP
CANADA 0 5886 41 2 5 3 31 1 1 10 34 4 10 0 33 53 6116
USA 8669 0 2176 11 101 163 216 44 36 253 270 83 105 19 495 857 13498
MEXICO 240 1257 0 0 2 7 56 0 3 3 1 0 0 0 1 6 1576
AUSTRIA 77 11 0 0 14 42 553 56 7 24 8 9 1 0 86 66 953
BELGIUM 5 78 1 10 0 172 564 100 28 634 7 4 3 1 811 108 2525
FRANCE 56 695 118 39 838 0 1738 601 1352 1106 34 9 6 76 903 945 8516
GERMANY 136 973 397 739 839 1958 0 1322 936 3089 214 113 64 27 3009 2900 16714
ITALY 47 418 6 80 122 779 1347 0 186 387 65 7 3 9 604 646 4709
SPAIN 14 199 27 15 156 682 648 89 0 398 1 0 2 3 268 93 2595
UK 38 461 26 24 153 310 1226 143 116 0 37 8 10 5 814 673 4045
JAPAN 566 6082 398 34 145 92 390 25 163 424 0 338 404 528 973 2983 13546
CHINA 2 28 6 0 0 1 6 3 0 1 5 0 0 0 3 3062 3118
KOREA 98 129 0 0 0 0 2 2 2 6 37 7 0 31 13 66 395
TAIWAN 19 319 11 1 2 7 6 6 1 9 59 0 4 0 38 213 694
ROECD 80 282 4 68 1105 314 839 190 164 715 96 85 10 15 1513 561 6040
ROW 70 533 62 15 40 195 240 81 11 78 35 2837 2 5 135 NA NA
TOTIMP 10117 17351 3274 1038 3523 4725 7862 2662 3006 7138 903 3506 626 719 9698 NA NA
5
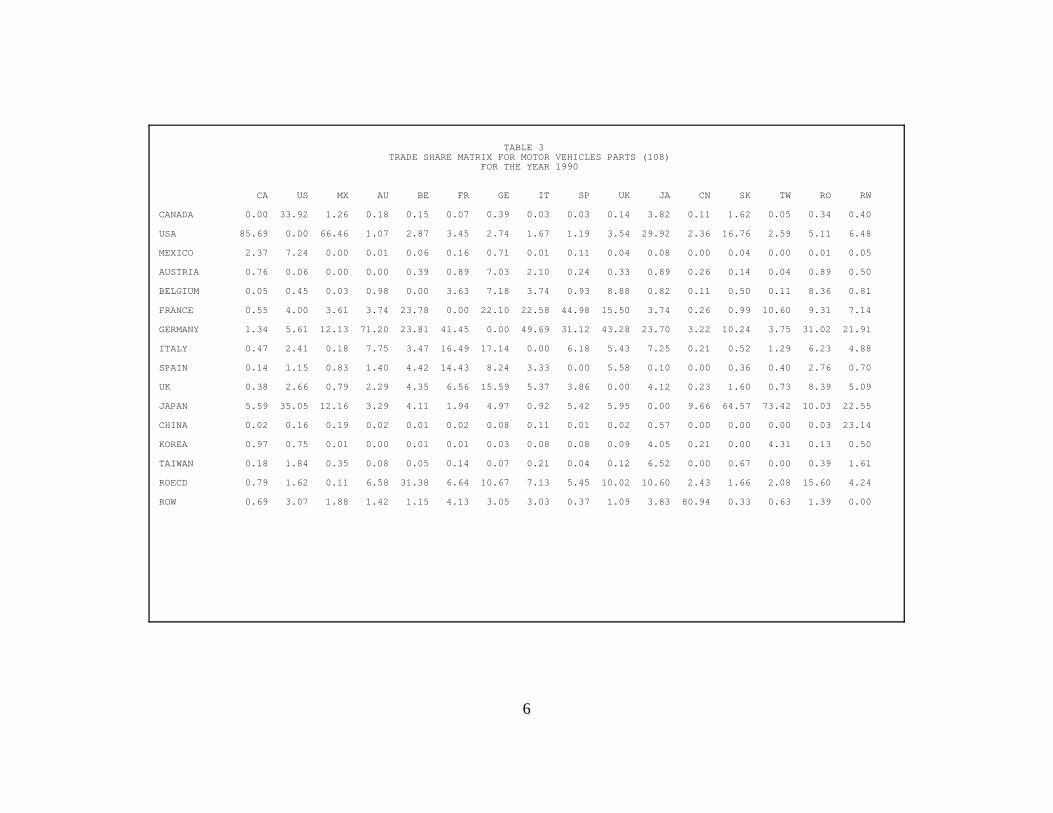
TABLE 3TRADE SHARE MATRIX FOR MOTOR VEHICLES PARTS (108)
FOR THE YEAR 1990
CA US MX AU BE FR GE IT SP UK JA CN SK TW RO RW
CANADA 0.00 33.92 1.26 0.18 0.15 0.07 0.39 0.03 0.03 0.14 3.82 0.11 1.62 0.05 0.34 0.40
USA 85.69 0.00 66.46 1.07 2.87 3.45 2.74 1.67 1.19 3.54 29.92 2.36 16.76 2.59 5.11 6.48
MEXICO 2.37 7.24 0.00 0.01 0.06 0.16 0.71 0.01 0.11 0.04 0.08 0.00 0.04 0.00 0.01 0.05
AUSTRIA 0.76 0.06 0.00 0.00 0.39 0.89 7.03 2.10 0.24 0.33 0.89 0.26 0.14 0.04 0.89 0.50
BELGIUM 0.05 0.45 0.03 0.98 0.00 3.63 7.18 3.74 0.93 8.88 0.82 0.11 0.50 0.11 8.36 0.81
FRANCE 0.55 4.00 3.61 3.74 23.78 0.00 22.10 22.58 44.98 15.50 3.74 0.26 0.99 10.60 9.31 7.14
GERMANY 1.34 5.61 12.13 71.20 23.81 41.45 0.00 49.69 31.12 43.28 23.70 3.22 10.24 3.75 31.02 21.91
ITALY 0.47 2.41 0.18 7.75 3.47 16.49 17.14 0.00 6.18 5.43 7.25 0.21 0.52 1.29 6.23 4.88
SPAIN 0.14 1.15 0.83 1.40 4.42 14.43 8.24 3.33 0.00 5.58 0.10 0.00 0.36 0.40 2.76 0.70
UK 0.38 2.66 0.79 2.29 4.35 6.56 15.59 5.37 3.86 0.00 4.12 0.23 1.60 0.73 8.39 5.09
JAPAN 5.59 35.05 12.16 3.29 4.11 1.94 4.97 0.92 5.42 5.95 0.00 9.66 64.57 73.42 10.03 22.55
CHINA 0.02 0.16 0.19 0.02 0.01 0.02 0.08 0.11 0.01 0.02 0.57 0.00 0.00 0.00 0.03 23.14
KOREA 0.97 0.75 0.01 0.00 0.01 0.01 0.03 0.08 0.08 0.09 4.05 0.21 0.00 4.31 0.13 0.50
TAIWAN 0.18 1.84 0.35 0.08 0.05 0.14 0.07 0.21 0.04 0.12 6.52 0.00 0.67 0.00 0.39 1.61
ROECD 0.79 1.62 0.11 6.58 31.38 6.64 10.67 7.13 5.45 10.02 10.60 2.43 1.66 2.08 15.60 4.24
ROW 0.69 3.07 1.88 1.42 1.15 4.13 3.05 3.03 0.37 1.09 3.83 80.94 0.33 0.63 1.39 0.00
6
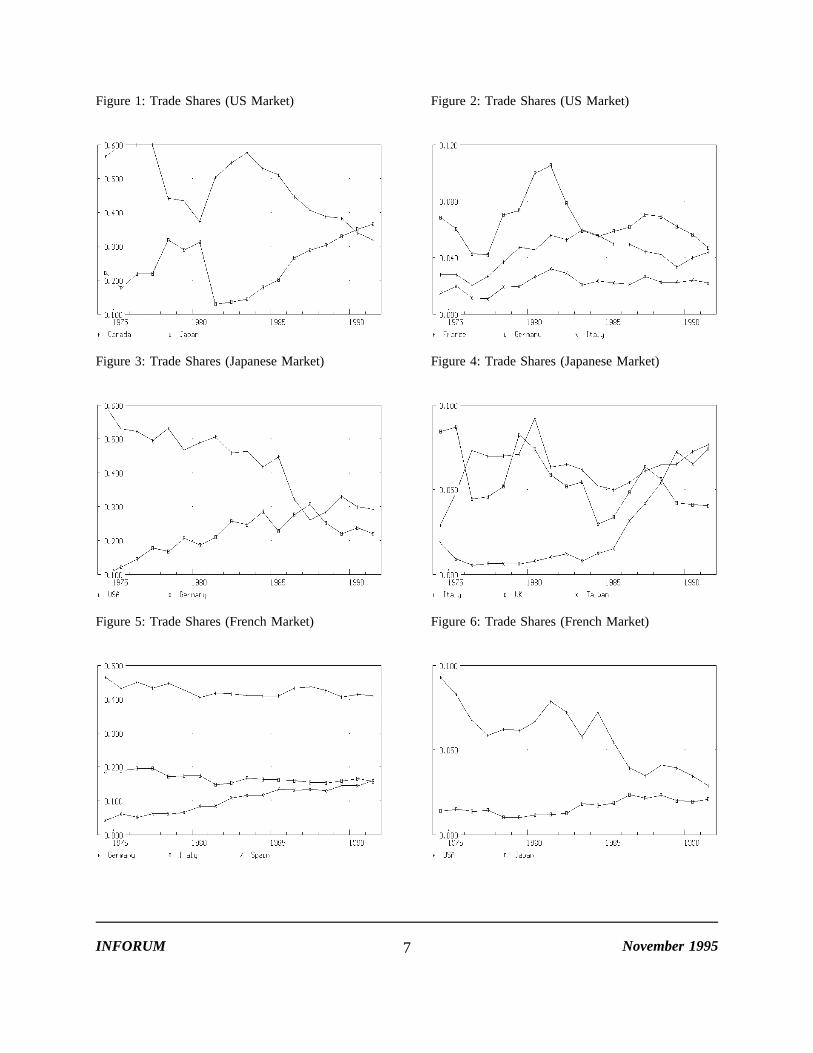
Figure 1: Trade Shares (US Market) Figure 2: Trade Shares (US Market)
Figure 3: Trade Shares (Japanese Market) Figure 4: Trade Shares (Japanese Market)
Figure 5: Trade Shares (French Market) Figure 6: Trade Shares (French Market)
INFORUM November 19957
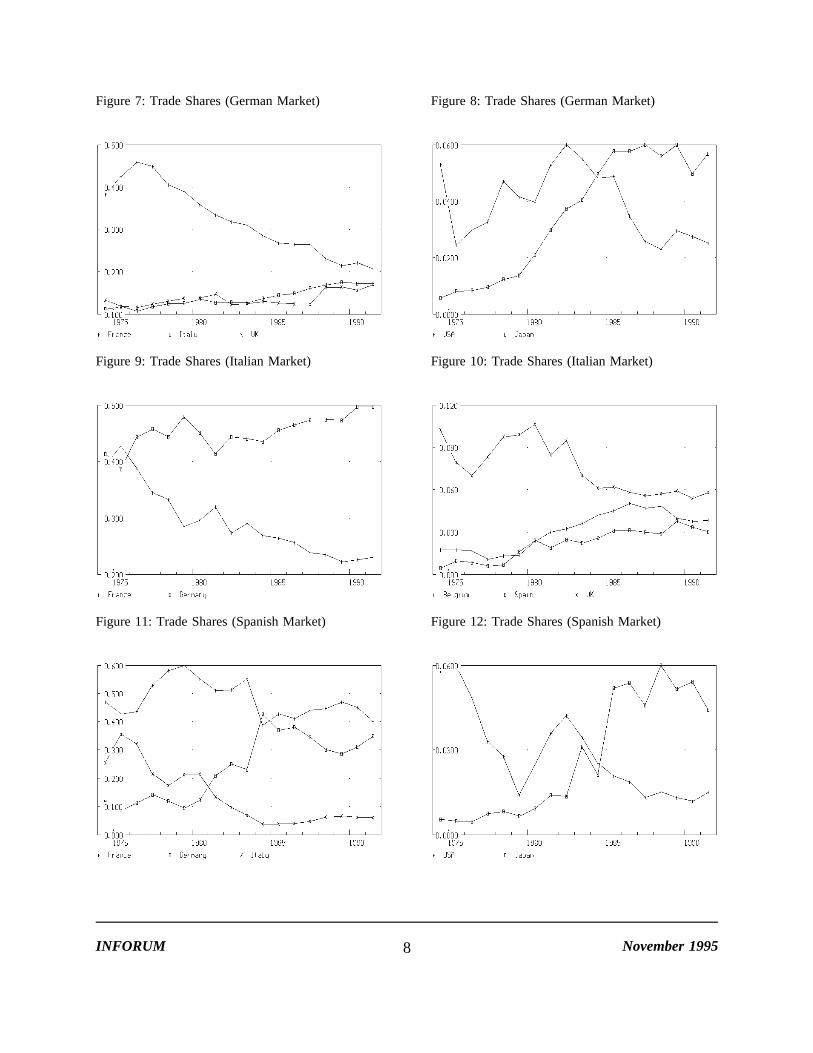
Figure 7: Trade Shares (German Market) Figure 8: Trade Shares (German Market)
Figure 9: Trade Shares (Italian Market) Figure 10: Trade Shares (Italian Market)
Figure 11: Trade Shares (Spanish Market) Figure 12: Trade Shares (Spanish Market)
INFORUM November 19958
3. The Data
The estimation of the present trade model requires extensive time-series data on the bilateraltrade among the 16 countries and regions for each of 120 categories of merchandise trade. Incollecting such data, we have processed some 200 OECD and UN trade data tapes, made anumber of adjustments to reduce inconsistencies in the raw data, and created a large, consistentbilateral trade data bank that covers 120 commodities, 28 source countries and 60 partnercountries over the 1974-91 period.
The main data source is the bilateral trade data tapes prepared by the OECD for its 24member countries, and by the UN for the three non-OECD countries for which active INFORUMmodels exist: Korea, Mexico and China. Each year, for each of the OECD countries, data onimports and exports with nearly 200 trading partners are available by complete 5-digit SITC(Standard International Trade Classification) product classes both in physical quantities and invalues at current dollar prices.2 The data represent the entire spectrum of goods that can bebought and sold in the marketplace, including agricultural products, minerals, clothing, chemicals,metals, mechanical machinery, electrical machinery, scrap and waste, secondhand goods, andantiques. They do not include services. The level of product detail thus ensures the creation oftrade matrices for products ranging from raw materials ("cotton") to chemical products ("drug andmedicines") to hi-tech electronics ("semiconductors").
The data came on over 200 OECD and UN computer data tapes. On average, each year ofthe OECD trade data was written on twelve computer tapes -- six of export data and six ofimport data, and on each tape, a country’s trade was arranged by 5-digit SITC commodity andwithin the commodity it was arranged by trading partner. The UN trade data for Mexico, SouthKorea and China came on two tapes, and each data tape was basically organized like the OECDtapes, although minor differences in tape format still exist.
Downloading and storing the data from these tapes required hundreds of megabytes incomputer disk space and a considerable amount of time on a 486 Personal Computer (PC). Afterreading each of these tapes onto the computer, the data consisted of bilateral flows in complete5-digit SITC among the 28 source countries and some 200 trading partner countries that makeup the entire world.
The raw data set from the OECD and UN is by no means a consistent time-series data bankwith which the trade model can be readily estimated. To that end, we have reconciled the
2 Depending on a particular year, the data are recorded in one of the three "revisions" of SITC schemes. Before1978, all of the OECD countries reported the trade statistics in SITC Revision I, which distinguishes some 1,400products. From 1978 through 1987, most of these countries adopted SITC Revision II, which refines and expandsthe product detail to about 2,000 trading commodities. In 1988, all OECD countries, except for the US and Turkey,switched to SITC Revision III in their trade statistics reporting, which now covers over 3,000 products. The US andTurkey adopted Revision III in the following year.
INFORUM November 19959
different commodity classification schemes used in the reported trade data, adjusted the tradeflows that are associated with the special SITC codes, and reduced the commodity categories aswell as the number of trading partner countries to a more manageable level.
First, by geographic aggregation, we reduced the number of trading partner countries from200 to about 60. They include the 14 individual countries of the trade model as well as anumber of other countries (for instance, the economies in transition in the Eastern Europe, OPECcountries, South Africa, other developing Asian countries, and major South American countries)that may in the foreseeable future be included into the trade model as the respective nationalforecasting models are developed.
Another adjustment to the raw data concerns the "alphanumeric" SITC codes in the reporteddata. There were two kinds of alphanumeric SITC codes. First, the OECD introduced a letter"B" at the position where the national code differed from the SITC description. For example,on data from Austria, the OECD listed under code 251BB all commodities of group 251 ("Pulpand waste paper") which do not match a particular SITC. Second, to retain confidentiality in allor part of the SITC at detailed levels, the OECD gave complete data only at the less detailedlevel of the SITC. The non-confidential data given at a more detailed level in the same productclass were subtracted by the OECD from the total of this product class and the remainder wasrecorded as non-disclosed data on the tape in an alphanumeric codification ending in one to fourletters "A." For example, a reporting country provided the OECD with data from division 51("Organic chemicals") with complete geographic breakdown. These data were then treated andrecorded on the tape under the code 51AAA. In adding up the data recorded under 51AAA andall other data under headings beginning with 51, the total equals that of division 51 as providedby the reporting country. When the reporting country provided total value without a completegeographic breakdown at a detailed level, the difference was recorded under the geographic code"secret" under number 8210.
Table 4 illustrates this process for a given reporting country. Here, the data given under code51 were obtained by the OECD from the reporting country with a complete geographicbreakdown. Data for groups 512, 513, 514 and 515 which made up division 51 were calculatedfrom the 5-digit SITC level, as given by the reporting country. For some of the 5-digit positions,the reporting country has given only the total trade, and this is then registered under "secret" code8210. The data recorded under heading 51A on the tape were thereafter obtained by subtraction.It should be noted that:
(a) For a given product at 4- or 5-digit level, the reporting country has maintained confi-dentiality. Non-disclosed trade was included with a complete geographic classification in thedata of division 51. The total of this undisclosed trade was +12.
INFORUM November 199510
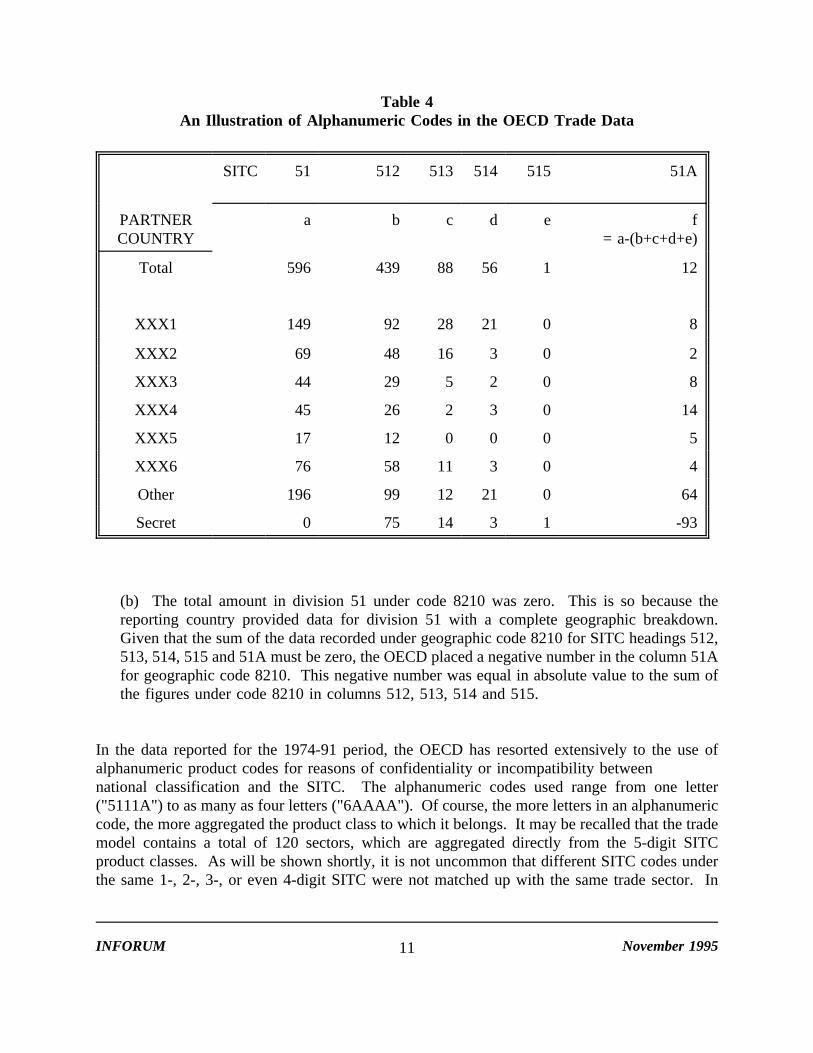
Table 4An Illustration of Alphanumeric Codes in the OECD Trade Data
SITC 51 512 513 514 515 51A
PARTNERCOUNTRY
a b c d e f= a-(b+c+d+e)
Total 596 439 88 56 1 12
XXX1 149 92 28 21 0 8
XXX2 69 48 16 3 0 2
XXX3 44 29 5 2 0 8
XXX4 45 26 2 3 0 14
XXX5 17 12 0 0 0 5
XXX6 76 58 11 3 0 4
Other 196 99 12 21 0 64
Secret 0 75 14 3 1 -93
(b) The total amount in division 51 under code 8210 was zero. This is so because thereporting country provided data for division 51 with a complete geographic breakdown.Given that the sum of the data recorded under geographic code 8210 for SITC headings 512,513, 514, 515 and 51A must be zero, the OECD placed a negative number in the column 51Afor geographic code 8210. This negative number was equal in absolute value to the sum ofthe figures under code 8210 in columns 512, 513, 514 and 515.
In the data reported for the 1974-91 period, the OECD has resorted extensively to the use ofalphanumeric product codes for reasons of confidentiality or incompatibility betweennational classification and the SITC. The alphanumeric codes used range from one letter("5111A") to as many as four letters ("6AAAA"). Of course, the more letters in an alphanumericcode, the more aggregated the product class to which it belongs. It may be recalled that the trademodel contains a total of 120 sectors, which are aggregated directly from the 5-digit SITCproduct classes. As will be shown shortly, it is not uncommon that different SITC codes underthe same 1-, 2-, 3-, or even 4-digit SITC were not matched up with the same trade sector. In
INFORUM November 199511
aggregating the trade data from the SITC product classes to the sectoring plan of the trade model,we could either exclude the non-classifiable and non-disclosed data, or come up with some wayof converting the alphanumeric codes into SITC codes. Excluding the data means that total tradeat the trade model sector level will not be consistent with the totals as provided in SITC. Tomaintain such consistency, we adopted an approach in which the data in an alphanumeric code,say 51A, were systematically "re-allocated" over the SITC codes that fall under the same productclass 51 (i.e., 512, 513, 514 and 515). We called it a "purification" process.
First, in re-allocating data associated with the alphanumeric SITC codes ending with letters"A", we applied an iterative procedure called rAs method.3 Here, the row controls and columncontrols were determined from the raw data, and the initial "guess" matrix were constructed withthe 5-digit commodity codes across the top of the column and trading partners down the side.The rAs procedure then would be able to eliminate the alphanumeric code, say 51A, and the"secret" trading partner 8210, without altering the total value of the data under heading 51. Foralphanumeric codes ending with letters "B," a reporting country’s data were directly distributedto its respective trading partners according to the share of each non-alphanumeric 5-digit SITCcode under the same heading.
The last adjustment to the raw data dealt with the aggregation of the 5-digit SITC data intothe 120 sectors of the trade model. One of the difficulties lies in the treatment of some SITCcodes that are multi-sector. There are essentially two ways of dealing with the problem:assigning each multi-sector commodity entirely to the single trade model sector judged to be mostappropriate, or splitting them among all the relevant sectors. We adopt the second method, whichwas also adopted by the Economics and Statistics Department of OECD, the United NationsStatistical Office and the World Bank. These organizations jointly developed a set of"conversion tables" that distribute each multi-sector 5-digit SITC commodity among the relevant4-digit ISIC (International Standard Industry Classification) codes according to the industrialcomposition of trade by Common Market countries in 1975. While this was clearly unsatisfacto-ry because it applied the same fixed allocation factors for all years and to trade by all countries(including non-EEC Members), it nevertheless appears preferable to the alternative approach ofallocating multi-industry commodities in their entirety to the single most appropriate sector.
The concordance table used in the present study is based on the OECD "Conversion Tables",however, we have made a number of adjustments to meet the sectoring plan of the trade model.In particular, we have expanded the OECD "Conversion Tables" to cover 17 non-manufacturingsectors. We also reclassified some of the manufacturing sectors to reflect finer breakdown insectors such as electronics and non-electrical machinery.
With the bilateral trade data bank, we have constructed time-series 16 x 16 trade matrices in
3The rAs method (short for Row and Column Sum method) was first applied to input-output tables, discussedin Bacharach (1970). The method uses an initial guess of a matrix and derives a consistent matrix where the rowsand columns sum to some given totals.
INFORUM November 199512
120 commodities, covering 14 individual countries and 2 regions for the rest of the world. Inprinciple, each trade matrix may be formed from either the import data or the export data, sincethe data for country A’s exports of product i to country B are the same as country B’s importsof i from country A. In practice, however, recording discrepancies between the import data andexport data do exist, because of differences in valuation (imports are usually valued in c.i.f.,while exports in f.o.b.), timing gaps (recording of imports happens one period later than recordingof exports), exports of ships to open-registry countries, etc. In the current study, we have derivedthe trade matrices fundamentally from the import statistics. It is my argument that the importdata tend to identify the country of origin better than the export data identify the country ofdestination, because imports loom larger in the collection of customs revenue than exports.
Specifically, the imports of the 28 source countries were aggregated into those of 14individual countries and a region (the rest of OECD), filling up the first 15 columns of thematrix. For the last column, imports of the rest of the world from each of the 15 countries andregion were filled as exports by each of the 15 countries and region to all countries other thanthose appearing on the first 15 columns.
From the example of the trade matrices shown on Table 2 in Section 2, the reader may havenoticed that the matrix is not "closed," in the sense that the intraregional trade flows between theROW and the ROW are absent. The absence of these intraregional flows is dictated by dataavailability. Presumably, these flows can be determined in two steps. In the first, total importsof the ROW can be derived from the residuals between the total world imports by commodityand the sum totals of the total imports of the first 15 countries and regions in the aforementionedtrade matrix. In the second, the intraregional trade flows between the ROW and the ROW aredetermined from the residuals between total imports of the ROW and ROW’s imports from thefirst 15 countries and regions in the trade matrix. For the first step, the total world imports atthe 5-digit SITC level would be needed to derive total world imports by the 120 trade modelsectors. However, we were not able to obtain such statistics in machine-readable format. TheUN publishes total world exports and imports in its Yearbook of International Trade Statistics,although the data are not printed at the complete 5-digit SITC level. Time constraints preventedus from using them to fill the intraregional flows between ROW and ROW at this time, whichwould have to be done by hand.
The current-dollar trade flows were converted into constant-dollar flows using a set of exportprice indices constructed from the national sources. We first collected the export price deflatorsfrom the 13 national models to be linked by the trade model. Then, the export price deflatorsfor the rest of OECD (ROECD) were calculated as trade-weighted averages of export deflatorsof the 10 OECD countries in the trade model, while the export price deflators for Taiwan andROW were computed as trade-weighted averages of the export deflators of all 13 countries plusROECD.
The price indices from the national models were, of course, computed in local nationalcurrencies and in different base years. The year 1990 was selected as the common base year for
INFORUM November 199513
these price indices. Further, a time series of exchange rate vis-a-vis the US dollar was used tomake national price indices comparable from one country to another. The exchange rate givenby the International Monetary Fund’s International Financial Statistics Yearbook was chosenbecause the US dollar -- the common unit of the bilateral trade data -- was used as the numeraire.Finally, these price indices were converted from their national sectors into the 120 trade modelsectors.
It may be noted that some of the national price series lacked sufficient history to be useddirectly in our analysis. Specifically, the Austrian price series began in 1976, while the Chineseand Mexican price series started in 1980. In these cases, we made the following assumptions:
(1) For China and Mexico, we assume that the Chinese and Mexican exporters wereprice-takers before the year 1980, and we used the U.S. export prices to extend backwardsthe price series of these two countries.
(2) For Austria, we assume the Austrian export prices were heavily influenced by the Germanprices, and extended the Austrian price series from 1976 backwards by the German prices.
4. The Model Structure and Estimation Methodology
This section presents the econometric analysis of the multisectoral bilateral world trademodel. The trade model, the reader may recall, is primarily developed to channel import demandinto export supply in 120 commodity categories among the sixteen countries and regions.Specifically, the trade model takes exogenously the projections of total import demand byindustry from each country model and allocates them back to the supplying countries accordingto each supplier’s share of the given import market. Export supply is derived by summing theallocations, by exporter, over all the importing markets. The forecasts of trade flows generatedin this way are mutually consistent for all countries.
Key to the above "import-allocation" process is the trade-shares matrix, which gives, for eachcountry importing a certain product, the proportions imported from each source country. Thismatrix, as we noted in Section 2, is different for each year. Accurate estimation of this matrixis critical to a consistent quantitative prediction of world trade.
A prediction of the typical Sij element of the trade-shares matrix S has been theoreticallydiscussed in the studies of Armington (1969a, 1969b) and Rhomberg (1970) and statisticallyanalyzed by Klein and Van Peeterssen (1972), Moriguchi and Johnson (1972), Taplin (1972),Hickman and Lau (1973), Moriguchi (1973), Nyhus (1975), Marwah (1976), Samuelson (1980),and Parikh (1985). The basic postulate in these studies is that each element of the trade-sharesmatrix is a function of relative price and non-price factors. The present study shares with theearlier studies the same basic postulate for the trade share function. Its point of departure liesin the specific functional form for the share equations, the choice of non-price factors, and the
INFORUM November 199514
restrictions placed on the structural parameters.
There are three independent variables in our share equation: relative prices, relative capitalstock as a proxy for quality change of product not reflected in the price indices, and a time-trend-like variable. The rationale for the first explanatory variable -- relative prices -- in the shareequation is straightforward. In a given import market, the import shares of the various exportingcountries and relative prices of the exporting countries are expected to be inversely related.Suppose, for the sake of simplicity, there are only two exporters in the U.S. import market forauto parts: Japan and Canada. Suppose further that in Year 1, Japan and Canada equally splitthe U.S. market. Now the Japanese yen appreciates 10% against the U.S. dollar, while the U.S. -Canada exchange rate remains unchanged. Japanese auto parts now appear relatively more
expensive in U.S. dollar terms than Canadian auto parts to American buyers, giving Canada arelative price advantage in the U.S. auto-parts import market. U.S. importers, responding to pricechanges, substitute Canadian auto parts for Japanese auto parts. For any given level of auto partsimports by the U.S., the proportion imported from Japan is thus expected to fall, while thereverse is expected for the rival Canada. In an import market with more than two rival suppliers,we may extend the above analysis concerning the substitution effect as follows. Whereas in thecase of two-country rivalry, one exporter (Japan) is explicitly pitted against the other (Canada)in the fight for market share, with multi-country rivalry, a given exporter may be thought of asbeing pitted against a "representative rival", which does not refer to a specific competitor, butall of its competitors somehow grouped together. In other words, like the exporter Japan in thetwo-exporter example, the share of a given exporter in the import market with multiple exportersis expected to fall if the product it exports is becoming more expensive relative to a weightedaverage of the prices of its competitors. It should be noted that in reality, the price effectnormally takes more than one year to be completely felt. This suggests that a proper lagstructure needs to be built into the price indices. As will be seen shortly, we have built a three-year lag structure into the relative price term.
Note that in this study the relative price term is formulated by using domestic export pricesthat are available from the country models in the Inforum international system. This means (1)we are assuming no price discrimination on the part of the exporter. That is to say that if, forexample, Japan supplies certain goods to the United Kingdom and Canada, she charges both thesame price; (2) we are ignoring the impact of tariffs on the prices paid for imported goods. Bothassumptions are dictated by data availability. To incorporate the possibility of price discrimina-tion by the exporter, for instance, we would need data on bilateral export prices, which do notpresently exist in the Inforum international system.
On the other hand, to determine whether tariffs have had a significant effect on the tradingpatterns during the 1974-91 period, one would need to include the tariff rates by commodity andby country for the 120 commodity categories and 16 countries and regions in the trade model,annually. One would also need to deal with the many inherent problems in computing tariffswhen more than one good is in a trade sector. While this data requirement places the taskoutside the scope of the current study, we note that the mere existence of tariffs does not,
INFORUM November 199515
necessarily, imply any trade diversion among suppliers. This is true if the tariff, such as theMost-Favored-Nation (MFN) tariff, is uniform from country to country. In fact, the principle ofMFN tariffs is a major cornerstone of the General Agreement on Tariffs and Trade (GATT)reached in 1948 among the world’s major trading nations. Through the past eight rounds ofGATT multilateral tariff negotiations, sharp reductions in tariff barriers have been achieved. Thesame period, of course, has also seen growing bilateralism and regionalism in world trade, mostnotably the formation and expansion of the European Economic Community (EEC). It is myargument, however, that changes in tariffs have been, on balance, nearly neutral with respect totrade shares, as the substantial tariff cuts achieved through the successive GATT negotiationshave largely offset the effects of trade-diversion resulted from various regional and bilateral tradeagreements. Hence, the estimations of share equation parameters are not expected to be verybiased in general by the ignoring the effect of tariffs and their change in the price term.
In addition to relative prices, temporal variations in bilateral trade shares may be positivelyrelated to relative quality change of product in the exporting country not reflected in the priceindex. Introduction of new capital investment by an exporting country may induce qualitychanges of its products that may not be reflected in the price indices, yet such quality changescan help an exporting country to maintain or increase its export market share. We may thus usethe capital stock as a proxy variable measuring an exporting country’s relative non-pricecompetitiveness due to quality change of product. So if Japan’s capital stock growth rate in theautomobile industry is exceeding the share-weighted average of capital stock growth rates of allcompeting exporting countries in the U.S. market, ceteris paribus, then the share of Japan in theimports of automobiles in United States is expected to go up. It should be noted that to reflectthe well-established lag effects of the capital investment, a three-year lag structure is also builtinto the capital stock indices. Note that capital stock indices are cumulated from capitalinvestment data. The indices are further adjusted by the "Almon unit buckets" (Almon, 1989),because the time series on investment is not long enough to construct capital stock series for thebeginning period of the present trade model, which is 1974. The adjusted capital stock, alsocalled "bucket 1 capital stock" by Almon, contains young equipment for which maintenance isunnecessary. It is this capital stock that we use as a proxy for quality change of product notreflected in the price index.
Other non-price factors, including changes in tastes, habits, preferential credit terms, andquantitative trade restrictions are, in most cases, difficult to quantify or predict. We assume thesevariables have trends, and add an exponential time trend variable to the share equation. Unlikethe relative price and relative capital stock terms, the expected sign of the time trend could, ofcourse, be either positive or negative. It should also be noted that the trend variable may presenta potential problem, namely, the time trend term, in the long run, may force the bilateral flowto be larger than the total or, in the opposite case, negative. One solution is to adopt a specialtime-trend-like variable, first formulated by Nyhus (1975) to have time "slow down". The so-called Nyhus trend is cumulated from (1 - Sijt-1) with zero decay rate, so that as the share Sijt getslarger, each increment to time variable becomes smaller, thus slowing down the time.
INFORUM November 199516
Although Sijt-1, the lagged value of the dependent variable, forms part of the Nyhus trend, theNyhus trend itself cannot simply be considered a "lagged dependent variable." A laggeddependent variable is generally undesirable in a regression equation because it can lead to veryerratic estimates of the coefficients on the other variables. This is because the lagged value ofmost variables will explain the current value fairly well without any help from other variables.The lagged value by itself explains so much of the variability that there is little to be explainedby the other variables. The Nyhus trend, however, is not a "true" lagged dependent variable,because the estimated coefficients on all the past values of Sijt are constrained to be the same.Because of this estimation constraint, the estimated parameter on the Nyhus trend will not actlike a "true" lagged dependent variable.4
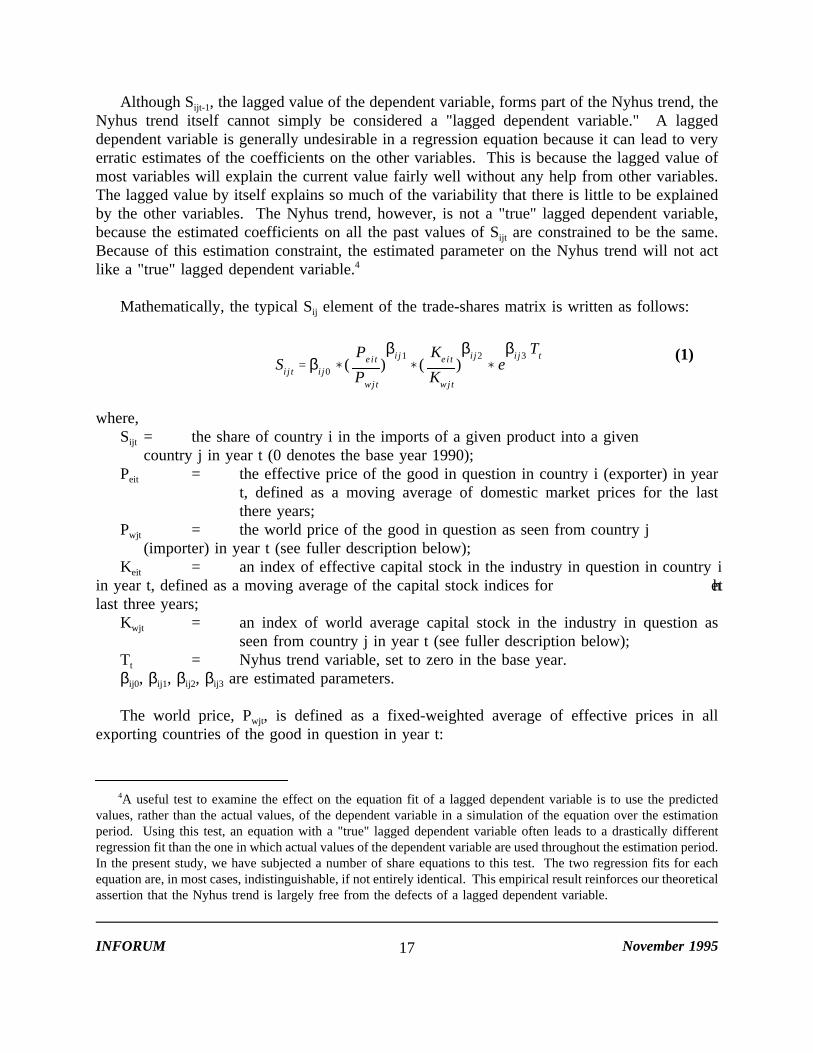
Mathematically, the typical Sij element of the trade-shares matrix is written as follows:
where,
(1)Sij t βi j0 (
Peit
Pwjt
)βi j1
(Keit
Kwjt
)βi j2
eβi j3 Tt
Sijt = the share of country i in the imports of a given product into a givencountry j in year t (0 denotes the base year 1990);
Peit = the effective price of the good in question in country i (exporter) in yeart, defined as a moving average of domestic market prices for the lastthere years;
Pwjt = the world price of the good in question as seen from country j(importer) in year t (see fuller description below);
Keit = an index of effective capital stock in the industry in question in country iin year t, defined as a moving average of the capital stock indices for thelast three years;
Kwjt = an index of world average capital stock in the industry in question asseen from country j in year t (see fuller description below);
Tt = Nyhus trend variable, set to zero in the base year.βij0, βij1, βij2, βij3 are estimated parameters.
The world price, Pwjt, is defined as a fixed-weighted average of effective prices in allexporting countries of the good in question in year t:
4A useful test to examine the effect on the equation fit of a lagged dependent variable is to use the predictedvalues, rather than the actual values, of the dependent variable in a simulation of the equation over the estimationperiod. Using this test, an equation with a "true" lagged dependent variable often leads to a drastically differentregression fit than the one in which actual values of the dependent variable are used throughout the estimation period.In the present study, we have subjected a number of share equations to this test. The two regression fits for eachequation are, in most cases, indistinguishable, if not entirely identical. This empirical result reinforces our theoreticalassertion that the Nyhus trend is largely free from the defects of a lagged dependent variable.
INFORUM November 199517
and the world average capital stock, Kwjt, is defined as a fixed-weighted average of capital stocks
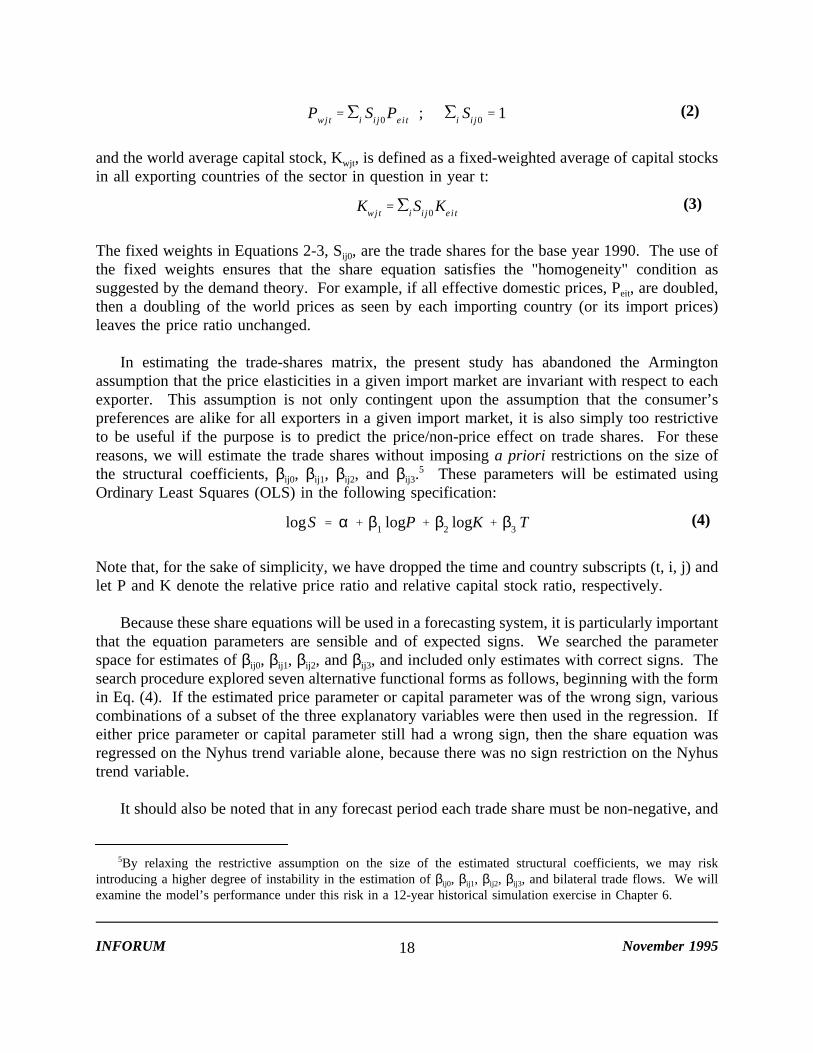
(2)Pwjt i Sij0 Peit ; i Si j0 1
in all exporting countries of the sector in question in year t:
The fixed weights in Equations 2-3, Sij0, are the trade shares for the base year 1990. The use of
(3)Kwjt i Sij0 Keit
the fixed weights ensures that the share equation satisfies the "homogeneity" condition assuggested by the demand theory. For example, if all effective domestic prices, Peit, are doubled,then a doubling of the world prices as seen by each importing country (or its import prices)leaves the price ratio unchanged.
In estimating the trade-shares matrix, the present study has abandoned the Armingtonassumption that the price elasticities in a given import market are invariant with respect to eachexporter. This assumption is not only contingent upon the assumption that the consumer’spreferences are alike for all exporters in a given import market, it is also simply too restrictiveto be useful if the purpose is to predict the price/non-price effect on trade shares. For thesereasons, we will estimate the trade shares without imposing a priori restrictions on the size ofthe structural coefficients, βij0, βij1, βij2, and βij3.
5 These parameters will be estimated usingOrdinary Least Squares (OLS) in the following specification:
Note that, for the sake of simplicity, we have dropped the time and country subscripts (t, i, j) and
(4)logS α β1 logP β2 logK β3 T
let P and K denote the relative price ratio and relative capital stock ratio, respectively.
Because these share equations will be used in a forecasting system, it is particularly importantthat the equation parameters are sensible and of expected signs. We searched the parameterspace for estimates of βij0, βij1, βij2, and βij3, and included only estimates with correct signs. Thesearch procedure explored seven alternative functional forms as follows, beginning with the formin Eq. (4). If the estimated price parameter or capital parameter was of the wrong sign, variouscombinations of a subset of the three explanatory variables were then used in the regression. Ifeither price parameter or capital parameter still had a wrong sign, then the share equation wasregressed on the Nyhus trend variable alone, because there was no sign restriction on the Nyhustrend variable.
It should also be noted that in any forecast period each trade share must be non-negative, and
5By relaxing the restrictive assumption on the size of the estimated structural coefficients, we may riskintroducing a higher degree of instability in the estimation of βij0, βij1, βij2, βij3, and bilateral trade flows. We willexamine the model’s performance under this risk in a 12-year historical simulation exercise in Chapter 6.
INFORUM November 199518
that the sum of shares from all sources in a given market must add up to 1 (i.e. ∑i Sij = 1 for allj and t). The non-negativity condition is automatically satisfied through the use of thelogarithmic functional form, but the adding-up condition is not. Methods must, therefore, befound for modifying the forecast trade shares so that the adding-up condition is met. Onesuggested method relies upon the "residual-share" approach, where for n exporting countries ina given importing market, only (n-1) shares are forecast with econometrically estimatedequations. The n-th share is then derived as 1 minus the sum of the (n-1) shares. The methodis not chosen for the present trade model, mainly because of the prospect that whenever the sumof (n-1) forecast shares exceeds 1, the n-th share becomes negative, which violates the non-negativity condition stated above.
The present study adopts an alternative approach. It estimates all of the n share equationsseparately and then adjusts the shares to meet the adding-up condition. In this way, the forecastshares in each market will satisfy both the adding-up condition and the non-negativity condition.In scaling the forecast shares to meet the adding-up condition in each import market, those withthe best fits should be adjusted proportionally less than those with poor fits. There is a set ofgood weights at hand: the standard errors of the estimated equations. Thus, the adding-upcondition in each import market is imposed by distributing the residual in proportion to thestandard error of each estimated share equation.
5. Parameter Estimates and Equation Fits
The present trade model consists of some 28,920 ( = 120 x (16 x 16 - 15)) estimated trade-share equations, one for each off-diagonal element of the trade-shares matrix, plus the diagonalelement representing the intraregional trade for the rest of OECD. It may be recalled that, inestimating the share equations, a search procedure is used to explore the parameter space andretain only estimates with correct signs. After eliminating zero shares and those with less than5 observations in the sample period (1974-91), a total of 19,125 trade share equations wereactually estimated.
The direct consequence of our search estimation technique is that the functional forms for theestimated share equations are not uniform. Some equations will retain all three independentvariables as specified in Equation (1), while others will have only a subset of the threeexplanatory variables. A breakdown of eight different functional forms for the share equationsis shown on Table 5.
Table 5Trade Share Equations: A Breakdown of Functional Forms
Function Type EQ Count EQ Weight Trade Weight
I: P, K, T 6,143 21.2 37.1
INFORUM November 199519
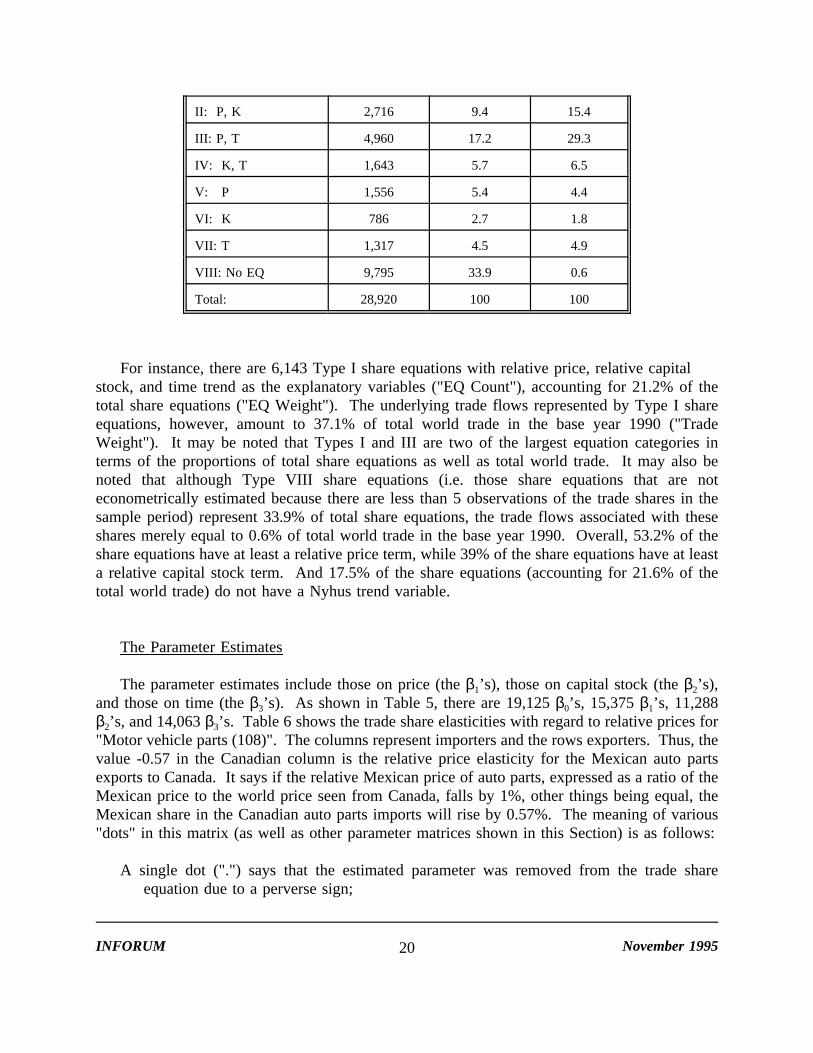
II: P, K 2,716 9.4 15.4
III: P, T 4,960 17.2 29.3
IV: K, T 1,643 5.7 6.5
V: P 1,556 5.4 4.4
VI: K 786 2.7 1.8
VII: T 1,317 4.5 4.9
VIII: No EQ 9,795 33.9 0.6
Total: 28,920 100 100
For instance, there are 6,143 Type I share equations with relative price, relative capitalstock, and time trend as the explanatory variables ("EQ Count"), accounting for 21.2% of thetotal share equations ("EQ Weight"). The underlying trade flows represented by Type I shareequations, however, amount to 37.1% of total world trade in the base year 1990 ("TradeWeight"). It may be noted that Types I and III are two of the largest equation categories interms of the proportions of total share equations as well as total world trade. It may also benoted that although Type VIII share equations (i.e. those share equations that are noteconometrically estimated because there are less than 5 observations of the trade shares in thesample period) represent 33.9% of total share equations, the trade flows associated with theseshares merely equal to 0.6% of total world trade in the base year 1990. Overall, 53.2% of theshare equations have at least a relative price term, while 39% of the share equations have at leasta relative capital stock term. And 17.5% of the share equations (accounting for 21.6% of thetotal world trade) do not have a Nyhus trend variable.
The Parameter Estimates
The parameter estimates include those on price (the β1’s), those on capital stock (the β2’s),and those on time (the β3’s). As shown in Table 5, there are 19,125 β0’s, 15,375 β1’s, 11,288β2’s, and 14,063 β3’s. Table 6 shows the trade share elasticities with regard to relative prices for"Motor vehicle parts (108)". The columns represent importers and the rows exporters. Thus, thevalue -0.57 in the Canadian column is the relative price elasticity for the Mexican auto partsexports to Canada. It says if the relative Mexican price of auto parts, expressed as a ratio of theMexican price to the world price seen from Canada, falls by 1%, other things being equal, theMexican share in the Canadian auto parts imports will rise by 0.57%. The meaning of various"dots" in this matrix (as well as other parameter matrices shown in this Section) is as follows:
A single dot (".") says that the estimated parameter was removed from the trade shareequation due to a perverse sign;
INFORUM November 199520
A double-dot ("..") denotes an absence of bilateral trade flows in the entire historicalperiod (1974-91);
A triple-dot ("...") indicates that the relevant trade share was not estimated because thenumber of valid observations is less than 5;
A quadruple-dot ("....") refers to a limited number of cases where the trade shareequations were not estimated because the exporter in question was the only supplier ina given import market throughout the historical period (1974-91).
Table 7 shows the capital parameter matrix for "Motor vehicle parts" (108). Here, the value0.68 in the Canadian column says if the relative capital stock of the US auto parts industry,expressed as a ratio of the US capital stock to the average world capital stock seen from Canada,rises by 1%, other things being equal, the US share in the Canadian auto parts imports willincrease by 0.68%.
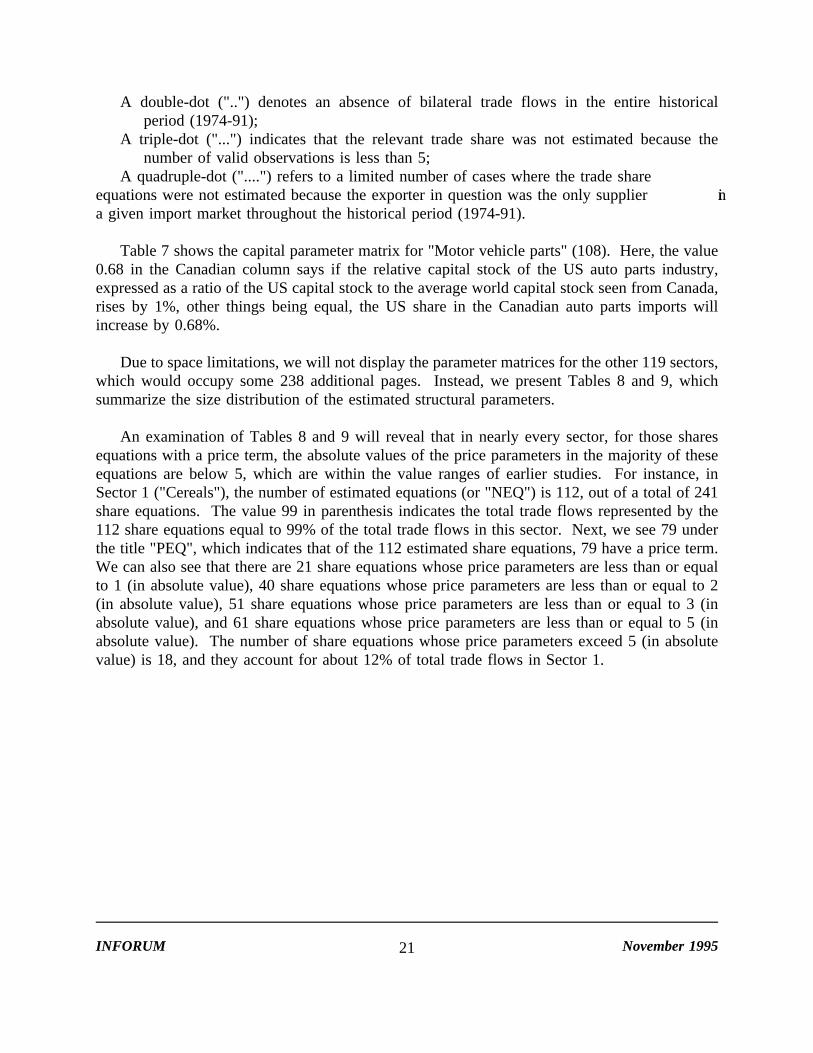
Due to space limitations, we will not display the parameter matrices for the other 119 sectors,which would occupy some 238 additional pages. Instead, we present Tables 8 and 9, whichsummarize the size distribution of the estimated structural parameters.
An examination of Tables 8 and 9 will reveal that in nearly every sector, for those sharesequations with a price term, the absolute values of the price parameters in the majority of theseequations are below 5, which are within the value ranges of earlier studies. For instance, inSector 1 ("Cereals"), the number of estimated equations (or "NEQ") is 112, out of a total of 241share equations. The value 99 in parenthesis indicates the total trade flows represented by the112 share equations equal to 99% of the total trade flows in this sector. Next, we see 79 underthe title "PEQ", which indicates that of the 112 estimated share equations, 79 have a price term.We can also see that there are 21 share equations whose price parameters are less than or equalto 1 (in absolute value), 40 share equations whose price parameters are less than or equal to 2(in absolute value), 51 share equations whose price parameters are less than or equal to 3 (inabsolute value), and 61 share equations whose price parameters are less than or equal to 5 (inabsolute value). The number of share equations whose price parameters exceed 5 (in absolutevalue) is 18, and they account for about 12% of total trade flows in Sector 1.
INFORUM November 199521
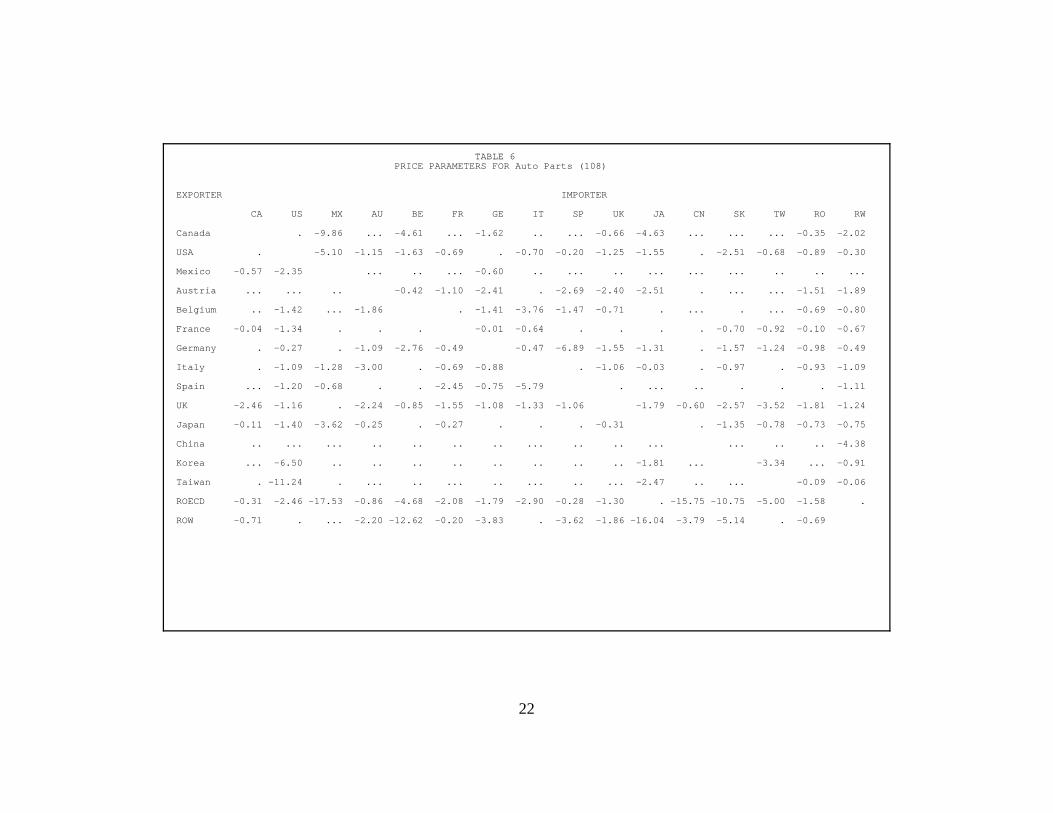
TABLE 6PRICE PARAMETERS FOR Auto Parts (108)
EXPORTER IMPORTER
CA US MX AU BE FR GE IT SP UK JA CN SK TW RO RW
Canada . -9.86 ... -4.61 ... -1.62 .. ... -0.66 -4.63 ... ... ... -0.35 -2.02
USA . -5.10 -1.15 -1.63 -0.69 . -0.70 -0.20 -1.25 -1.55 . -2.51 -0.68 -0.89 -0.30
Mexico -0.57 -2.35 ... .. ... -0.60 .. ... .. ... ... ... .. .. ...
Austria ... ... .. -0.42 -1.10 -2.41 . -2.69 -2.40 -2.51 . ... ... -1.51 -1.89
Belgium .. -1.42 ... -1.86 . -1.41 -3.76 -1.47 -0.71 . ... . ... -0.69 -0.80
France -0.04 -1.34 . . . -0.01 -0.64 . . . . -0.70 -0.92 -0.10 -0.67
Germany . -0.27 . -1.09 -2.76 -0.49 -0.47 -6.89 -1.55 -1.31 . -1.57 -1.24 -0.98 -0.49
Italy . -1.09 -1.28 -3.00 . -0.69 -0.88 . -1.06 -0.03 . -0.97 . -0.93 -1.09
Spain ... -1.20 -0.68 . . -2.45 -0.75 -5.79 . ... .. . . . -1.11
UK -2.46 -1.16 . -2.24 -0.85 -1.55 -1.08 -1.33 -1.06 -1.79 -0.60 -2.57 -3.52 -1.81 -1.24
Japan -0.11 -1.40 -3.62 -0.25 . -0.27 . . . -0.31 . -1.35 -0.78 -0.73 -0.75
China .. ... ... .. .. .. .. ... .. .. ... ... .. .. -4.38
Korea ... -6.50 .. .. .. .. .. .. .. .. -1.81 ... -3.34 ... -0.91
Taiwan . -11.24 . ... .. ... .. ... .. ... -2.47 .. ... -0.09 -0.06
ROECD -0.31 -2.46 -17.53 -0.86 -4.68 -2.08 -1.79 -2.90 -0.28 -1.30 . -15.75 -10.75 -5.00 -1.58 .
ROW -0.71 . ... -2.20 -12.62 -0.20 -3.83 . -3.62 -1.86 -16.04 -3.79 -5.14 . -0.69
22
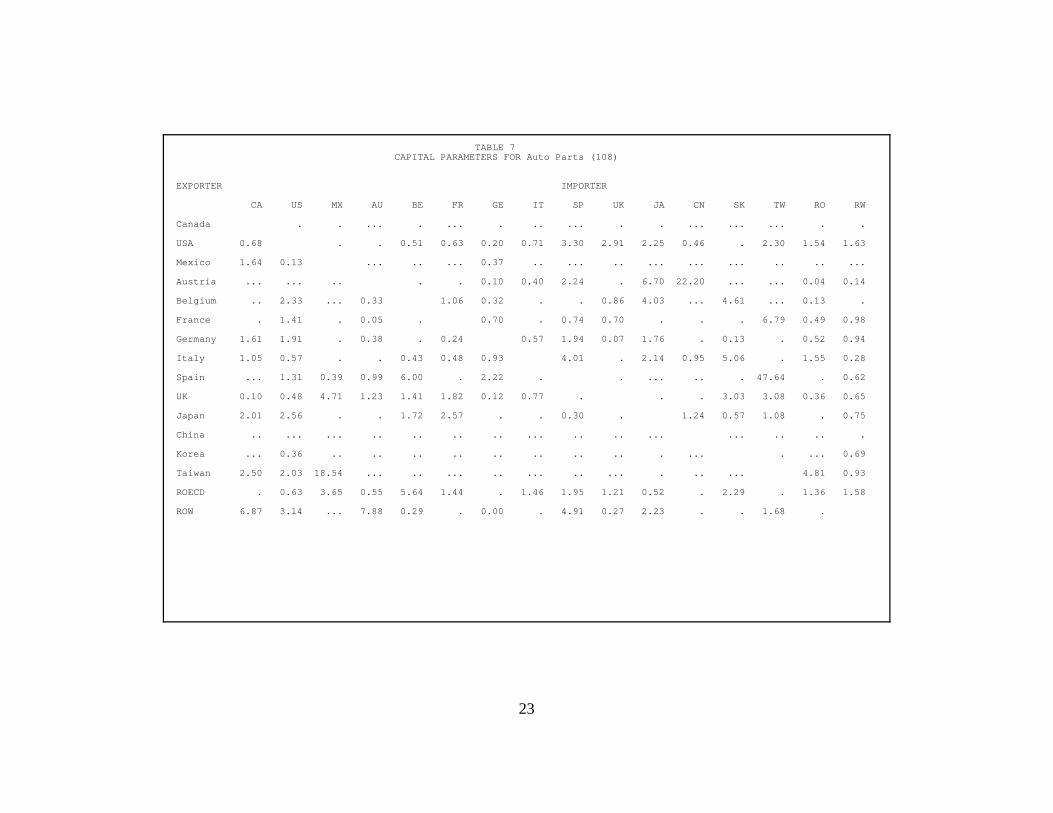
TABLE 7CAPITAL PARAMETERS FOR Auto Parts (108)
EXPORTER IMPORTER
CA US MX AU BE FR GE IT SP UK JA CN SK TW RO RW
Canada . . ... . ... . .. ... . . ... ... ... . .
USA 0.68 . . 0.51 0.63 0.20 0.71 3.30 2.91 2.25 0.46 . 2.30 1.54 1.63
Mexico 1.64 0.13 ... .. ... 0.37 .. ... .. ... ... ... .. .. ...
Austria ... ... .. . . 0.10 0.40 2.24 . 6.70 22.20 ... ... 0.04 0.14
Belgium .. 2.33 ... 0.33 1.06 0.32 . . 0.86 4.03 ... 4.61 ... 0.13 .
France . 1.41 . 0.05 . 0.70 . 0.74 0.70 . . . 6.79 0.49 0.98
Germany 1.61 1.91 . 0.38 . 0.24 0.57 1.94 0.07 1.76 . 0.13 . 0.52 0.94
Italy 1.05 0.57 . . 0.43 0.48 0.93 4.01 . 2.14 0.95 5.06 . 1.55 0.28
Spain ... 1.31 0.39 0.99 6.00 . 2.22 . . ... .. . 47.64 . 0.62
UK 0.10 0.48 4.71 1.23 1.41 1.82 0.12 0.77 . . . 3.03 3.08 0.36 0.65
Japan 2.01 2.56 . . 1.72 2.57 . . 0.30 . 1.24 0.57 1.08 . 0.75
China .. ... ... .. .. .. .. ... .. .. ... ... .. .. .
Korea ... 0.36 .. .. .. .. .. .. .. .. . ... . ... 0.69
Taiwan 2.50 2.03 18.54 ... .. ... .. ... .. ... . .. ... 4.81 0.93
ROECD . 0.63 3.65 0.55 5.64 1.44 . 1.46 1.95 1.21 0.52 . 2.29 . 1.36 1.58
ROW 6.87 3.14 ... 7.88 0.29 . 0.00 . 4.91 0.27 2.23 . . 1.68 .
23
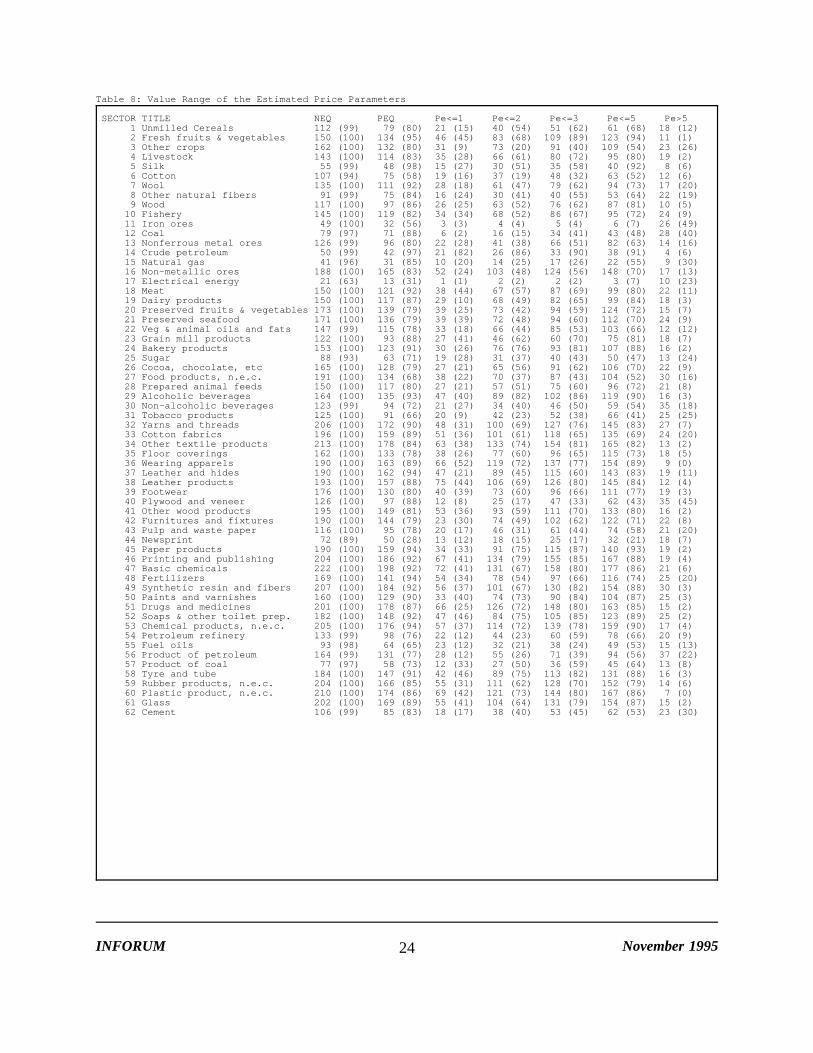
Table 8: Value Range of the Estimated Price Parameters
SECTOR TITLE NEQ PEQ Pe<=1 Pe<=2 Pe<=3 Pe<=5 Pe>51 Unmilled Cereals 112 (99) 79 (80) 21 (15) 40 (54) 51 (62) 61 (68) 18 (12)2 Fresh fruits & vegetables 150 (100) 134 (95) 46 (45) 83 (68) 109 (89) 123 (94) 11 (1)3 Other crops 162 (100) 132 (80) 31 (9) 73 (20) 91 (40) 109 (54) 23 (26)4 Livestock 143 (100) 114 (83) 35 (28) 66 (61) 80 (72) 95 (80) 19 (2)5 Silk 55 (99) 48 (98) 15 (27) 30 (51) 35 (58) 40 (92) 8 (6)6 Cotton 107 (94) 75 (58) 19 (16) 37 (19) 48 (32) 63 (52) 12 (6)7 Wool 135 (100) 111 (92) 28 (18) 61 (47) 79 (62) 94 (73) 17 (20)8 Other natural fibers 91 (99) 75 (84) 16 (24) 30 (41) 40 (55) 53 (64) 22 (19)9 Wood 117 (100) 97 (86) 26 (25) 63 (52) 76 (62) 87 (81) 10 (5)10 Fishery 145 (100) 119 (82) 34 (34) 68 (52) 86 (67) 95 (72) 24 (9)11 Iron ores 49 (100) 32 (56) 3 (3) 4 (4) 5 (4) 6 (7) 26 (49)12 Coal 79 (97) 71 (88) 6 (2) 16 (15) 34 (41) 43 (48) 28 (40)13 Nonferrous metal ores 126 (99) 96 (80) 22 (28) 41 (38) 66 (51) 82 (63) 14 (16)14 Crude petroleum 50 (99) 42 (97) 21 (82) 26 (86) 33 (90) 38 (91) 4 (6)15 Natural gas 41 (96) 31 (85) 10 (20) 14 (25) 17 (26) 22 (55) 9 (30)16 Non-metallic ores 188 (100) 165 (83) 52 (24) 103 (48) 124 (56) 148 (70) 17 (13)17 Electrical energy 21 (63) 13 (31) 1 (1) 2 (2) 2 (2) 3 (7) 10 (23)18 Meat 150 (100) 121 (92) 38 (44) 67 (57) 87 (69) 99 (80) 22 (11)19 Dairy products 150 (100) 117 (87) 29 (10) 68 (49) 82 (65) 99 (84) 18 (3)20 Preserved fruits & vegetables 173 (100) 139 (79) 39 (25) 73 (42) 94 (59) 124 (72) 15 (7)21 Preserved seafood 171 (100) 136 (79) 39 (39) 72 (48) 94 (60) 112 (70) 24 (9)22 Veg & animal oils and fats 147 (99) 115 (78) 33 (18) 66 (44) 85 (53) 103 (66) 12 (12)23 Grain mill products 122 (100) 93 (88) 27 (41) 46 (62) 60 (70) 75 (81) 18 (7)24 Bakery products 153 (100) 123 (91) 30 (26) 76 (76) 93 (81) 107 (88) 16 (2)25 Sugar 88 (93) 63 (71) 19 (28) 31 (37) 40 (43) 50 (47) 13 (24)26 Cocoa, chocolate, etc 165 (100) 128 (79) 27 (21) 65 (56) 91 (62) 106 (70) 22 (9)27 Food products, n.e.c. 191 (100) 134 (68) 38 (22) 70 (37) 87 (43) 104 (52) 30 (16)28 Prepared animal feeds 150 (100) 117 (80) 27 (21) 57 (51) 75 (60) 96 (72) 21 (8)29 Alcoholic beverages 164 (100) 135 (93) 47 (40) 89 (82) 102 (86) 119 (90) 16 (3)30 Non-alcoholic beverages 123 (99) 94 (72) 21 (27) 34 (40) 46 (50) 59 (54) 35 (18)31 Tobacco products 125 (100) 91 (66) 20 (9) 42 (23) 52 (38) 66 (41) 25 (25)32 Yarns and threads 206 (100) 172 (90) 48 (31) 100 (69) 127 (76) 145 (83) 27 (7)33 Cotton fabrics 196 (100) 159 (89) 51 (36) 101 (61) 118 (65) 135 (69) 24 (20)34 Other textile products 213 (100) 178 (84) 63 (38) 133 (74) 154 (81) 165 (82) 13 (2)35 Floor coverings 162 (100) 133 (78) 38 (26) 77 (60) 96 (65) 115 (73) 18 (5)36 Wearing apparels 190 (100) 163 (89) 66 (52) 119 (72) 137 (77) 154 (89) 9 (0)37 Leather and hides 190 (100) 162 (94) 47 (21) 89 (45) 115 (60) 143 (83) 19 (11)38 Leather products 193 (100) 157 (88) 75 (44) 106 (69) 126 (80) 145 (84) 12 (4)39 Footwear 176 (100) 130 (80) 40 (39) 73 (60) 96 (66) 111 (77) 19 (3)40 Plywood and veneer 126 (100) 97 (88) 12 (8) 25 (17) 47 (33) 62 (43) 35 (45)41 Other wood products 195 (100) 149 (81) 53 (36) 93 (59) 111 (70) 133 (80) 16 (2)42 Furnitures and fixtures 190 (100) 144 (79) 23 (30) 74 (49) 102 (62) 122 (71) 22 (8)43 Pulp and waste paper 116 (100) 95 (78) 20 (17) 46 (31) 61 (44) 74 (58) 21 (20)44 Newsprint 72 (89) 50 (28) 13 (12) 18 (15) 25 (17) 32 (21) 18 (7)45 Paper products 190 (100) 159 (94) 34 (33) 91 (75) 115 (87) 140 (93) 19 (2)46 Printing and publishing 204 (100) 186 (92) 67 (41) 134 (79) 155 (85) 167 (88) 19 (4)47 Basic chemicals 222 (100) 198 (92) 72 (41) 131 (67) 158 (80) 177 (86) 21 (6)48 Fertilizers 169 (100) 141 (94) 54 (34) 78 (54) 97 (66) 116 (74) 25 (20)49 Synthetic resin and fibers 207 (100) 184 (92) 56 (37) 101 (67) 130 (82) 154 (88) 30 (3)50 Paints and varnishes 160 (100) 129 (90) 33 (40) 74 (73) 90 (84) 104 (87) 25 (3)51 Drugs and medicines 201 (100) 178 (87) 66 (25) 126 (72) 148 (80) 163 (85) 15 (2)52 Soaps & other toilet prep. 182 (100) 148 (92) 47 (46) 84 (75) 105 (85) 123 (89) 25 (2)53 Chemical products, n.e.c. 205 (100) 176 (94) 57 (37) 114 (72) 139 (78) 159 (90) 17 (4)54 Petroleum refinery 133 (99) 98 (76) 22 (12) 44 (23) 60 (59) 78 (66) 20 (9)55 Fuel oils 93 (98) 64 (65) 23 (12) 32 (21) 38 (24) 49 (53) 15 (13)56 Product of petroleum 164 (99) 131 (77) 28 (12) 55 (26) 71 (39) 94 (56) 37 (22)57 Product of coal 77 (97) 58 (73) 12 (33) 27 (50) 36 (59) 45 (64) 13 (8)58 Tyre and tube 184 (100) 147 (91) 42 (46) 89 (75) 113 (82) 131 (88) 16 (3)59 Rubber products, n.e.c. 204 (100) 166 (85) 55 (31) 111 (62) 128 (70) 152 (79) 14 (6)60 Plastic product, n.e.c. 210 (100) 174 (86) 69 (42) 121 (73) 144 (80) 167 (86) 7 (0)61 Glass 202 (100) 169 (89) 55 (41) 104 (64) 131 (79) 154 (87) 15 (2)62 Cement 106 (99) 85 (83) 18 (17) 38 (40) 53 (45) 62 (53) 23 (30)
INFORUM November 199524
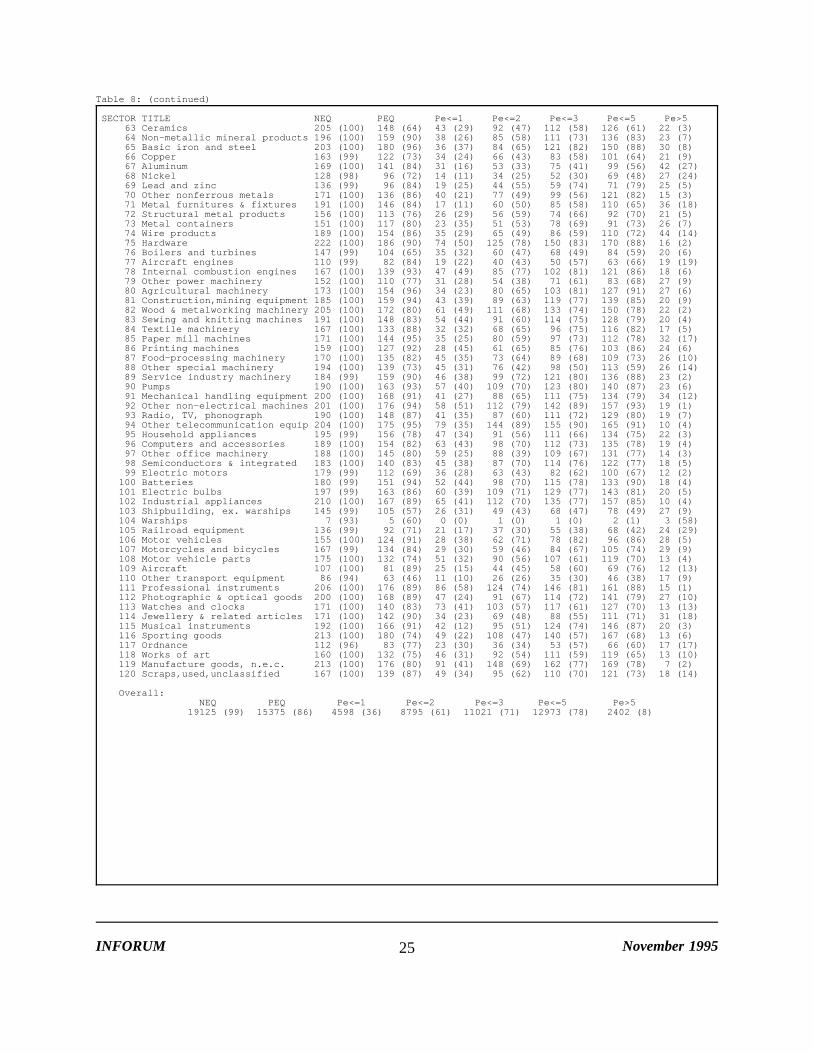
Table 8: (continued)
SECTOR TITLE NEQ PEQ Pe<=1 Pe<=2 Pe<=3 Pe<=5 Pe>563 Ceramics 205 (100) 148 (64) 43 (29) 92 (47) 112 (58) 126 (61) 22 (3)64 Non-metallic mineral products 196 (100) 159 (90) 38 (26) 85 (58) 111 (73) 136 (83) 23 (7)65 Basic iron and steel 203 (100) 180 (96) 36 (37) 84 (65) 121 (82) 150 (88) 30 (8)66 Copper 163 (99) 122 (73) 34 (24) 66 (43) 83 (58) 101 (64) 21 (9)67 Aluminum 169 (100) 141 (84) 31 (16) 53 (33) 75 (41) 99 (56) 42 (27)68 Nickel 128 (98) 96 (72) 14 (11) 34 (25) 52 (30) 69 (48) 27 (24)69 Lead and zinc 136 (99) 96 (84) 19 (25) 44 (55) 59 (74) 71 (79) 25 (5)70 Other nonferrous metals 171 (100) 136 (86) 40 (21) 77 (49) 99 (56) 121 (82) 15 (3)71 Metal furnitures & fixtures 191 (100) 146 (84) 17 (11) 60 (50) 85 (58) 110 (65) 36 (18)72 Structural metal products 156 (100) 113 (76) 26 (29) 56 (59) 74 (66) 92 (70) 21 (5)73 Metal containers 151 (100) 117 (80) 23 (35) 51 (53) 78 (69) 91 (73) 26 (7)74 Wire products 189 (100) 154 (86) 35 (29) 65 (49) 86 (59) 110 (72) 44 (14)75 Hardware 222 (100) 186 (90) 74 (50) 125 (78) 150 (83) 170 (88) 16 (2)76 Boilers and turbines 147 (99) 104 (65) 35 (32) 60 (47) 68 (49) 84 (59) 20 (6)77 Aircraft engines 110 (99) 82 (84) 19 (22) 40 (43) 50 (57) 63 (66) 19 (19)78 Internal combustion engines 167 (100) 139 (93) 47 (49) 85 (77) 102 (81) 121 (86) 18 (6)79 Other power machinery 152 (100) 110 (77) 31 (28) 54 (38) 71 (61) 83 (68) 27 (9)80 Agricultural machinery 173 (100) 154 (96) 34 (23) 80 (65) 103 (81) 127 (91) 27 (6)81 Construction,mining equipment 185 (100) 159 (94) 43 (39) 89 (63) 119 (77) 139 (85) 20 (9)82 Wood & metalworking machinery 205 (100) 172 (80) 61 (49) 111 (68) 133 (74) 150 (78) 22 (2)83 Sewing and knitting machines 191 (100) 148 (83) 54 (44) 91 (60) 114 (75) 128 (79) 20 (4)84 Textile machinery 167 (100) 133 (88) 32 (32) 68 (65) 96 (75) 116 (82) 17 (5)85 Paper mill machines 171 (100) 144 (95) 35 (25) 80 (59) 97 (73) 112 (78) 32 (17)86 Printing machines 159 (100) 127 (92) 28 (45) 61 (65) 85 (76) 103 (86) 24 (6)87 Food-processing machinery 170 (100) 135 (82) 45 (35) 73 (64) 89 (68) 109 (73) 26 (10)88 Other special machinery 194 (100) 139 (73) 45 (31) 76 (42) 98 (50) 113 (59) 26 (14)89 Service industry machinery 184 (99) 159 (90) 46 (38) 99 (72) 121 (80) 136 (88) 23 (2)90 Pumps 190 (100) 163 (93) 57 (40) 109 (70) 123 (80) 140 (87) 23 (6)91 Mechanical handling equipment 200 (100) 168 (91) 41 (27) 88 (65) 111 (75) 134 (79) 34 (12)92 Other non-electrical machines 201 (100) 176 (94) 58 (51) 112 (79) 142 (89) 157 (93) 19 (1)93 Radio, TV, phonograph 190 (100) 148 (87) 41 (35) 87 (60) 111 (72) 129 (80) 19 (7)94 Other telecommunication equip 204 (100) 175 (95) 79 (35) 144 (89) 155 (90) 165 (91) 10 (4)95 Household appliances 195 (99) 156 (78) 47 (34) 91 (56) 111 (66) 134 (75) 22 (3)96 Computers and accessories 189 (100) 154 (82) 63 (43) 98 (70) 112 (73) 135 (78) 19 (4)97 Other office machinery 188 (100) 145 (80) 59 (25) 88 (39) 109 (67) 131 (77) 14 (3)98 Semiconductors & integrated 183 (100) 140 (83) 45 (38) 87 (70) 114 (76) 122 (77) 18 (5)99 Electric motors 179 (99) 112 (69) 36 (28) 63 (43) 82 (62) 100 (67) 12 (2)100 Batteries 180 (99) 151 (94) 52 (44) 98 (70) 115 (78) 133 (90) 18 (4)101 Electric bulbs 197 (99) 163 (86) 60 (39) 109 (71) 129 (77) 143 (81) 20 (5)102 Industrial appliances 210 (100) 167 (89) 65 (41) 112 (70) 135 (77) 157 (85) 10 (4)103 Shipbuilding, ex. warships 145 (99) 105 (57) 26 (31) 49 (43) 68 (47) 78 (49) 27 (9)104 Warships 7 (93) 5 (60) 0 (0) 1 (0) 1 (0) 2 (1) 3 (58)105 Railroad equipment 136 (99) 92 (71) 21 (17) 37 (30) 55 (38) 68 (42) 24 (29)106 Motor vehicles 155 (100) 124 (91) 28 (38) 62 (71) 78 (82) 96 (86) 28 (5)107 Motorcycles and bicycles 167 (99) 134 (84) 29 (30) 59 (46) 84 (67) 105 (74) 29 (9)108 Motor vehicle parts 175 (100) 132 (74) 51 (32) 90 (56) 107 (61) 119 (70) 13 (4)109 Aircraft 107 (100) 81 (89) 25 (15) 44 (45) 58 (60) 69 (76) 12 (13)110 Other transport equipment 86 (94) 63 (46) 11 (10) 26 (26) 35 (30) 46 (38) 17 (9)111 Professional instruments 206 (100) 176 (89) 86 (58) 124 (74) 146 (81) 161 (88) 15 (1)112 Photographic & optical goods 200 (100) 168 (89) 47 (24) 91 (67) 114 (72) 141 (79) 27 (10)113 Watches and clocks 171 (100) 140 (83) 73 (41) 103 (57) 117 (61) 127 (70) 13 (13)114 Jewellery & related articles 171 (100) 142 (90) 34 (23) 69 (48) 88 (55) 111 (71) 31 (18)115 Musical instruments 192 (100) 166 (91) 42 (12) 95 (51) 124 (74) 146 (87) 20 (3)116 Sporting goods 213 (100) 180 (74) 49 (22) 108 (47) 140 (57) 167 (68) 13 (6)117 Ordnance 112 (96) 83 (77) 23 (30) 36 (34) 53 (57) 66 (60) 17 (17)118 Works of art 160 (100) 132 (75) 46 (31) 92 (54) 111 (59) 119 (65) 13 (10)119 Manufacture goods, n.e.c. 213 (100) 176 (80) 91 (41) 148 (69) 162 (77) 169 (78) 7 (2)120 Scraps,used,unclassified 167 (100) 139 (87) 49 (34) 95 (62) 110 (70) 121 (73) 18 (14)
Overall:NEQ PEQ Pe<=1 Pe<=2 Pe<=3 Pe<=5 Pe>5
19125 (99) 15375 (86) 4598 (36) 8795 (61) 11021 (71) 12973 (78) 2402 (8)
INFORUM November 199525
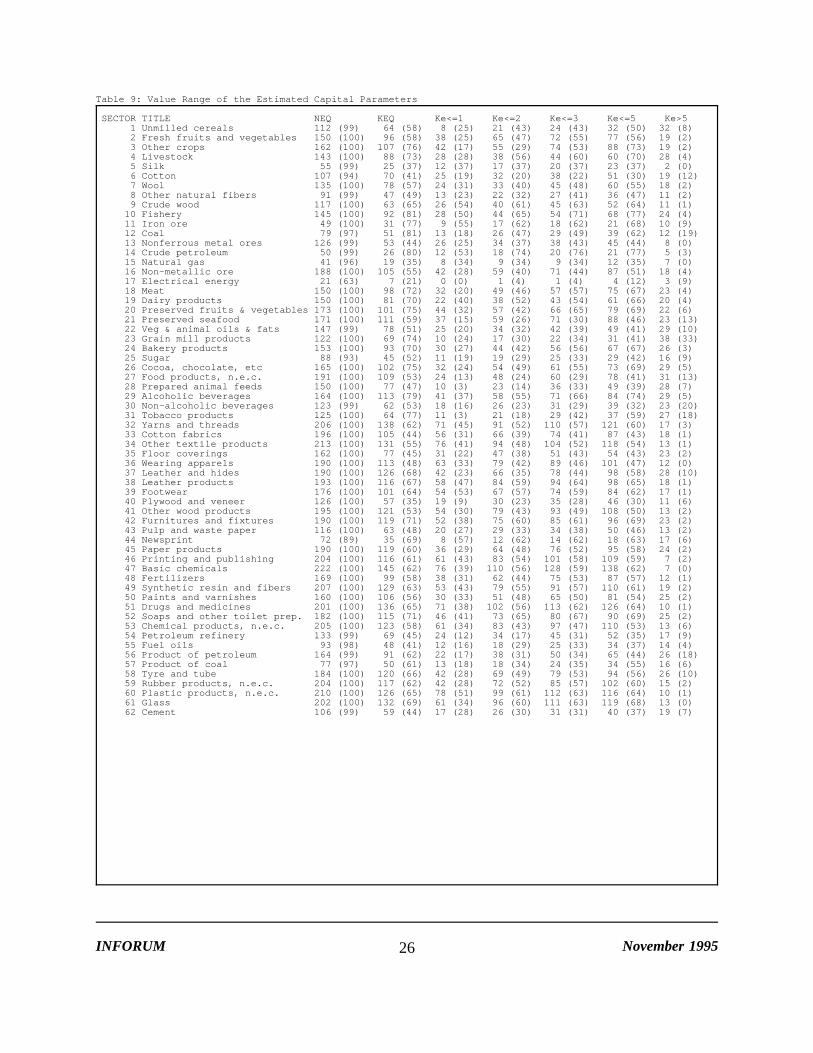
Table 9: Value Range of the Estimated Capital Parameters
SECTOR TITLE NEQ KEQ Ke<=1 Ke<=2 Ke<=3 Ke<=5 Ke>51 Unmilled cereals 112 (99) 64 (58) 8 (25) 21 (43) 24 (43) 32 (50) 32 (8)2 Fresh fruits and vegetables 150 (100) 96 (58) 38 (25) 65 (47) 72 (55) 77 (56) 19 (2)3 Other crops 162 (100) 107 (76) 42 (17) 55 (29) 74 (53) 88 (73) 19 (2)4 Livestock 143 (100) 88 (73) 28 (28) 38 (56) 44 (60) 60 (70) 28 (4)5 Silk 55 (99) 25 (37) 12 (37) 17 (37) 20 (37) 23 (37) 2 (0)6 Cotton 107 (94) 70 (41) 25 (19) 32 (20) 38 (22) 51 (30) 19 (12)7 Wool 135 (100) 78 (57) 24 (31) 33 (40) 45 (48) 60 (55) 18 (2)8 Other natural fibers 91 (99) 47 (49) 13 (23) 22 (32) 27 (41) 36 (47) 11 (2)9 Crude wood 117 (100) 63 (65) 26 (54) 40 (61) 45 (63) 52 (64) 11 (1)10 Fishery 145 (100) 92 (81) 28 (50) 44 (65) 54 (71) 68 (77) 24 (4)11 Iron ore 49 (100) 31 (77) 9 (55) 17 (62) 18 (62) 21 (68) 10 (9)12 Coal 79 (97) 51 (81) 13 (18) 26 (47) 29 (49) 39 (62) 12 (19)13 Nonferrous metal ores 126 (99) 53 (44) 26 (25) 34 (37) 38 (43) 45 (44) 8 (0)14 Crude petroleum 50 (99) 26 (80) 12 (53) 18 (74) 20 (76) 21 (77) 5 (3)15 Natural gas 41 (96) 19 (35) 8 (34) 9 (34) 9 (34) 12 (35) 7 (0)16 Non-metallic ore 188 (100) 105 (55) 42 (28) 59 (40) 71 (44) 87 (51) 18 (4)17 Electrical energy 21 (63) 7 (21) 0 (0) 1 (4) 1 (4) 4 (12) 3 (9)18 Meat 150 (100) 98 (72) 32 (20) 49 (46) 57 (57) 75 (67) 23 (4)19 Dairy products 150 (100) 81 (70) 22 (40) 38 (52) 43 (54) 61 (66) 20 (4)20 Preserved fruits & vegetables 173 (100) 101 (75) 44 (32) 57 (42) 66 (65) 79 (69) 22 (6)21 Preserved seafood 171 (100) 111 (59) 37 (15) 59 (26) 71 (30) 88 (46) 23 (13)22 Veg & animal oils & fats 147 (99) 78 (51) 25 (20) 34 (32) 42 (39) 49 (41) 29 (10)23 Grain mill products 122 (100) 69 (74) 10 (24) 17 (30) 22 (34) 31 (41) 38 (33)24 Bakery products 153 (100) 93 (70) 30 (27) 44 (42) 56 (56) 67 (67) 26 (3)25 Sugar 88 (93) 45 (52) 11 (19) 19 (29) 25 (33) 29 (42) 16 (9)26 Cocoa, chocolate, etc 165 (100) 102 (75) 32 (24) 54 (49) 61 (55) 73 (69) 29 (5)27 Food products, n.e.c. 191 (100) 109 (53) 24 (13) 48 (24) 60 (29) 78 (41) 31 (13)28 Prepared animal feeds 150 (100) 77 (47) 10 (3) 23 (14) 36 (33) 49 (39) 28 (7)29 Alcoholic beverages 164 (100) 113 (79) 41 (37) 58 (55) 71 (66) 84 (74) 29 (5)30 Non-alcoholic beverages 123 (99) 62 (53) 18 (16) 26 (23) 31 (29) 39 (32) 23 (20)31 Tobacco products 125 (100) 64 (77) 11 (3) 21 (18) 29 (42) 37 (59) 27 (18)32 Yarns and threads 206 (100) 138 (62) 71 (45) 91 (52) 110 (57) 121 (60) 17 (3)33 Cotton fabrics 196 (100) 105 (44) 56 (31) 66 (39) 74 (41) 87 (43) 18 (1)34 Other textile products 213 (100) 131 (55) 76 (41) 94 (48) 104 (52) 118 (54) 13 (1)35 Floor coverings 162 (100) 77 (45) 31 (22) 47 (38) 51 (43) 54 (43) 23 (2)36 Wearing apparels 190 (100) 113 (48) 63 (33) 79 (42) 89 (46) 101 (47) 12 (0)37 Leather and hides 190 (100) 126 (68) 42 (23) 66 (35) 78 (44) 98 (58) 28 (10)38 Leather products 193 (100) 116 (67) 58 (47) 84 (59) 94 (64) 98 (65) 18 (1)39 Footwear 176 (100) 101 (64) 54 (53) 67 (57) 74 (59) 84 (62) 17 (1)40 Plywood and veneer 126 (100) 57 (35) 19 (9) 30 (23) 35 (28) 46 (30) 11 (6)41 Other wood products 195 (100) 121 (53) 54 (30) 79 (43) 93 (49) 108 (50) 13 (2)42 Furnitures and fixtures 190 (100) 119 (71) 52 (38) 75 (60) 85 (61) 96 (69) 23 (2)43 Pulp and waste paper 116 (100) 63 (48) 20 (27) 29 (33) 34 (38) 50 (46) 13 (2)44 Newsprint 72 (89) 35 (69) 8 (57) 12 (62) 14 (62) 18 (63) 17 (6)45 Paper products 190 (100) 119 (60) 36 (29) 64 (48) 76 (52) 95 (58) 24 (2)46 Printing and publishing 204 (100) 116 (61) 61 (43) 83 (54) 101 (58) 109 (59) 7 (2)47 Basic chemicals 222 (100) 145 (62) 76 (39) 110 (56) 128 (59) 138 (62) 7 (0)48 Fertilizers 169 (100) 99 (58) 38 (31) 62 (44) 75 (53) 87 (57) 12 (1)49 Synthetic resin and fibers 207 (100) 129 (63) 53 (43) 79 (55) 91 (57) 110 (61) 19 (2)50 Paints and varnishes 160 (100) 106 (56) 30 (33) 51 (48) 65 (50) 81 (54) 25 (2)51 Drugs and medicines 201 (100) 136 (65) 71 (38) 102 (56) 113 (62) 126 (64) 10 (1)52 Soaps and other toilet prep. 182 (100) 115 (71) 46 (41) 73 (65) 80 (67) 90 (69) 25 (2)53 Chemical products, n.e.c. 205 (100) 123 (58) 61 (34) 83 (43) 97 (47) 110 (53) 13 (6)54 Petroleum refinery 133 (99) 69 (45) 24 (12) 34 (17) 45 (31) 52 (35) 17 (9)55 Fuel oils 93 (98) 48 (41) 12 (16) 18 (29) 25 (33) 34 (37) 14 (4)56 Product of petroleum 164 (99) 91 (62) 22 (17) 38 (31) 50 (34) 65 (44) 26 (18)57 Product of coal 77 (97) 50 (61) 13 (18) 18 (34) 24 (35) 34 (55) 16 (6)58 Tyre and tube 184 (100) 120 (66) 42 (28) 69 (49) 79 (53) 94 (56) 26 (10)59 Rubber products, n.e.c. 204 (100) 117 (62) 42 (28) 72 (52) 85 (57) 102 (60) 15 (2)60 Plastic products, n.e.c. 210 (100) 126 (65) 78 (51) 99 (61) 112 (63) 116 (64) 10 (1)61 Glass 202 (100) 132 (69) 61 (34) 96 (60) 111 (63) 119 (68) 13 (0)62 Cement 106 (99) 59 (44) 17 (28) 26 (30) 31 (31) 40 (37) 19 (7)
INFORUM November 199526

Table 9: (continued)
SECTOR TITLE NEQ KEQ Ke<=1 Ke<=2 Ke<=3 Ke<=5 Ke>563 Ceramics 205 (100) 126 (49) 40 (24) 55 (30) 73 (36) 99 (43) 27 (6)64 Non-metallic mineral products 196 (100) 116 (63) 44 (24) 66 (47) 89 (56) 105 (62) 11 (1)65 Basic iron and steel 203 (100) 123 (73) 64 (52) 83 (63) 95 (67) 106 (70) 17 (4)66 Copper 163 (99) 96 (66) 36 (30) 53 (55) 65 (59) 77 (63) 19 (3)67 Aluminum 169 (100) 104 (64) 30 (23) 47 (37) 56 (40) 76 (47) 28 (17)68 Nickel 128 (98) 77 (70) 19 (18) 33 (32) 44 (50) 62 (67) 15 (3)69 Lead and zinc 136 (99) 82 (66) 24 (34) 39 (48) 53 (58) 62 (62) 20 (4)70 Other nonferrous metals 171 (100) 96 (65) 41 (28) 55 (51) 68 (57) 78 (62) 18 (3)71 Metal furnitures & fixtures 191 (100) 112 (61) 48 (29) 68 (43) 80 (48) 92 (54) 20 (6)72 Structural metal products 156 (100) 76 (38) 32 (25) 46 (33) 54 (36) 60 (37) 16 (1)73 Metal containers 151 (100) 94 (66) 34 (46) 51 (52) 57 (55) 75 (64) 19 (2)74 Wire products 189 (100) 107 (57) 44 (34) 65 (46) 76 (51) 89 (55) 18 (2)75 Hardware 222 (100) 131 (64) 83 (51) 106 (59) 112 (60) 121 (63) 10 (1)76 Boilers and turbines 147 (99) 86 (52) 27 (20) 37 (27) 51 (39) 57 (41) 29 (11)77 Aircraft engines 110 (99) 74 (67) 18 (36) 31 (42) 40 (45) 52 (49) 22 (17)78 Internal combustion engines 167 (100) 113 (68) 41 (27) 72 (53) 84 (56) 98 (65) 15 (3)79 Other power machinery 152 (100) 75 (56) 18 (6) 28 (23) 38 (31) 52 (40) 23 (16)80 Agricultural machinery 173 (100) 98 (69) 50 (42) 65 (51) 75 (61) 83 (67) 15 (2)81 Construction,mining equipment 185 (100) 125 (70) 52 (29) 72 (50) 83 (59) 101 (67) 24 (3)82 Wood & metalworking machinery 205 (100) 118 (47) 57 (26) 86 (40) 97 (42) 108 (45) 10 (2)83 Sewing and knitting machines 191 (100) 106 (43) 41 (15) 65 (28) 76 (34) 91 (39) 15 (5)84 Textile machinery 167 (100) 96 (52) 39 (31) 62 (42) 67 (47) 77 (48) 19 (4)85 Paper mill machines 171 (100) 111 (69) 33 (19) 60 (43) 71 (57) 85 (64) 26 (4)86 Printing machines 159 (100) 110 (68) 40 (35) 64 (55) 79 (60) 87 (61) 23 (7)87 Food-processing machinery 170 (100) 99 (59) 38 (34) 61 (44) 74 (56) 84 (57) 15 (2)88 Other special machinery 194 (100) 124 (61) 36 (16) 51 (27) 72 (39) 88 (43) 36 (18)89 Service industry machinery 184 (99) 111 (68) 55 (46) 73 (56) 81 (61) 98 (66) 13 (2)90 Pumps 190 (100) 118 (75) 54 (40) 76 (66) 89 (69) 99 (72) 19 (3)91 Mechanical handling equipment 200 (100) 126 (76) 57 (40) 77 (58) 92 (66) 106 (72) 20 (3)92 Other non-electrical machines 201 (100) 123 (63) 58 (41) 85 (51) 105 (58) 108 (60) 15 (4)93 Radio, TV, phonograph 190 (100) 97 (40) 50 (25) 67 (32) 83 (38) 93 (40) 4 (0)94 Other telecommunication equip 204 (100) 120 (52) 59 (27) 80 (35) 103 (44) 109 (49) 11 (3)95 Household appliances 195 (99) 106 (59) 52 (39) 74 (51) 84 (52) 93 (58) 13 (1)96 Computers and accessories 189 (100) 119 (58) 51 (30) 76 (38) 90 (41) 103 (48) 16 (11)97 Other office machinery 188 (100) 93 (41) 37 (18) 59 (30) 74 (35) 86 (38) 7 (2)98 Semiconductors & integrated 183 (100) 107 (53) 46 (23) 69 (45) 80 (47) 91 (52) 16 (2)99 Electric motors 179 (99) 99 (54) 30 (22) 44 (37) 55 (40) 73 (47) 26 (7)100 Batteries 180 (99) 100 (60) 39 (29) 70 (47) 76 (52) 85 (57) 15 (3)101 Electric bulbs 197 (99) 112 (61) 55 (41) 77 (51) 82 (52) 99 (61) 13 (1)102 Industrial appliances 210 (100) 154 (80) 83 (52) 113 (69) 125 (73) 136 (75) 18 (5)103 Shipbuilding, ex. warships 145 (99) 91 (61) 23 (13) 35 (49) 47 (54) 61 (56) 30 (5)104 Warships 7 (93) 2 (59) 0 (0) 0 (0) 0 (0) 1 (58) 1 (1)105 Railroad equipment 136 (99) 82 (68) 19 (12) 33 (27) 48 (44) 57 (63) 25 (5)106 Motor vehicles 155 (100) 83 (50) 30 (23) 50 (43) 60 (46) 72 (48) 11 (2)107 Motorcycles and bicycles 167 (99) 71 (27) 18 (11) 26 (15) 34 (17) 46 (22) 25 (5)108 Motor vehicles parts 175 (100) 116 (73) 56 (49) 81 (61) 95 (71) 106 (72) 10 (2)109 Aircraft 107 (100) 63 (77) 21 (24) 39 (58) 44 (65) 53 (76) 10 (1)110 Other transport equipment 86 (94) 42 (61) 3 (4) 8 (7) 12 (7) 21 (43) 21 (19)111 Professional instruments 206 (100) 113 (48) 62 (34) 84 (44) 94 (46) 102 (48) 11 (0)112 Photographic & optical goods 200 (100) 119 (63) 58 (35) 83 (53) 95 (58) 111 (62) 8 (1)113 Watches and clocks 171 (100) 92 (33) 43 (13) 55 (22) 66 (26) 73 (31) 19 (2)114 Jewellery & related articles 171 (100) 90 (48) 25 (20) 35 (27) 48 (33) 59 (45) 31 (3)115 Musical instruments 192 (100) 116 (48) 60 (28) 76 (33) 93 (44) 100 (47) 16 (2)116 Sporting goods 213 (100) 127 (67) 64 (39) 88 (56) 101 (63) 112 (65) 15 (2)117 Ordnance 112 (96) 70 (86) 9 (15) 22 (53) 30 (54) 44 (70) 26 (16)118 Works of art 160 (100) 90 (56) 43 (44) 59 (48) 67 (51) 77 (52) 13 (4)119 Manufactured goods, n.e.c. 213 (100) 136 (68) 74 (44) 94 (52) 99 (55) 118 (64) 18 (3)120 Scraps,used, unclassified 167 (100) 98 (46) 46 (26) 66 (35) 77 (37) 89 (45) 9 (1)
Overall:NEQ KEQ Ke<=1 Ke<=2 Ke<=3 Ke<=5 Ke>5
19125 (99) 11288 (61) 4497 (33) 6569 (47) 7780 (52) 9142 (57) 2146 (4)
INFORUM November 199527
The Fit of Equation
To see how well the equations fit the historical data, Figures 1-18 plot the predicted sharesagainst the actual historical values for some of the most significant bilateral trade flows in the1974-91 period. The selected sectors include Dairy products (19), Wearing apparels (36), Basicchemicals (47), Synthetic fiber (49), Iron and steel (65), Telecommunications equipment (94),Computers and accessories (96), Industrial appliances (102), Motor vehicles (106), and Auto parts(108). The underlying bilateral trade flows behind each of the graphs are among some of thelargest bilateral trade flows in the base year 1990. For example, the trade flow behind Figure30 -- Canada’s import of Motor vehicles parts (108) from USA -- is valued at $8.6 billion in1990, and is the 11th largest single bilateral trade flow of a total of 30,720 trade flows ranked.The trade flow behind Figure 29 -- Britain’s import of Motor vehicles (106) from Germany --is valued at more than $6 billion in 1990, and is the 22nd largest single bilateral trade flow inthe world. The trade flow behind Figure 28 -- USA’s import of Motor vehicles (106) fromGermany -- is valued at $6 billion in 1990, and is the 25th largest. And the trade flow behindFigure 24 -- USA’s import of Telecommunications equipment (94) -- is valued at $5.5 billion in1990, and is the 32nd largest single trade flow.
These figures provide robust evidence on the fit of the trade share equations across a varietyof sectors, in various import markets, for a number of exporters. To have a more comprehensivelook at the fit of the trade share equations across all sectors, Table 10 is presented. Here, the"NEQ" column indicates the number of estimated share equations in a given sector. For instance,in Sector 19 ("Dairy products"), the number of estimated share equations is 150. The numberin parenthesis is the base year 1990 share (in percentage) of total trade flows in Sector 19 asrepresented by the estimated share equations. In this case, the total trade flows represented bythe estimated share equations account for all of the trade flows in this sector. The next column,PEQ, refers to the number of estimated share equations with a price term. In this case, Sector19 has 117 share equations with a price term, accounting for 87% of total trade flows in thissector. Of the 117 share equations, 46 have a price parameter whose t-value is greater than orequal 2 (in absolute value). This is shown under the column "Pt2". In addition, of the 150estimated share equations, 81 have a capital term, shown under the column "KEQ", and 24 havea capital parameter whose t-value is greater than or equal to 2 (in absolute value), shown underthe column "Kt2". Regarding the time variable, the column, TEQ, shows that in Sector 19, 113of the estimated share equations have a Nyhus trend. Further, the next column, Tt2, shows that43 of them have a time parameter whose t-value is greater than or equal to 2 (in absolute value).Finally, the last two columns show the number of share equations whose independent variablescan "explain" at least 50% of the variations in the trade shares over the sample period ("R50")and the number of share equations whose independent variables can "explain" less than 50% ofthe variations in the trade shares.
A final point needs to be made about the fit of the equation. Through the regression
INFORUM November 199528
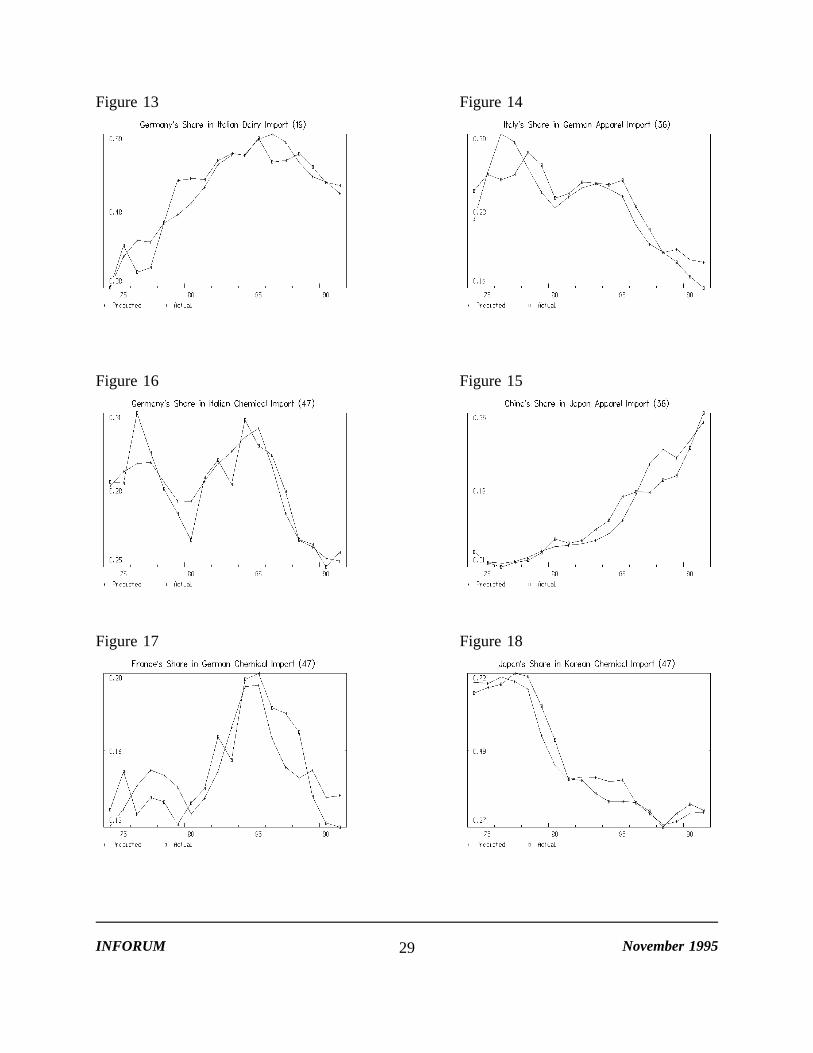
Figure 13 Figure 14
Figure 15Figure 16
Figure 17 Figure 18
INFORUM November 199529
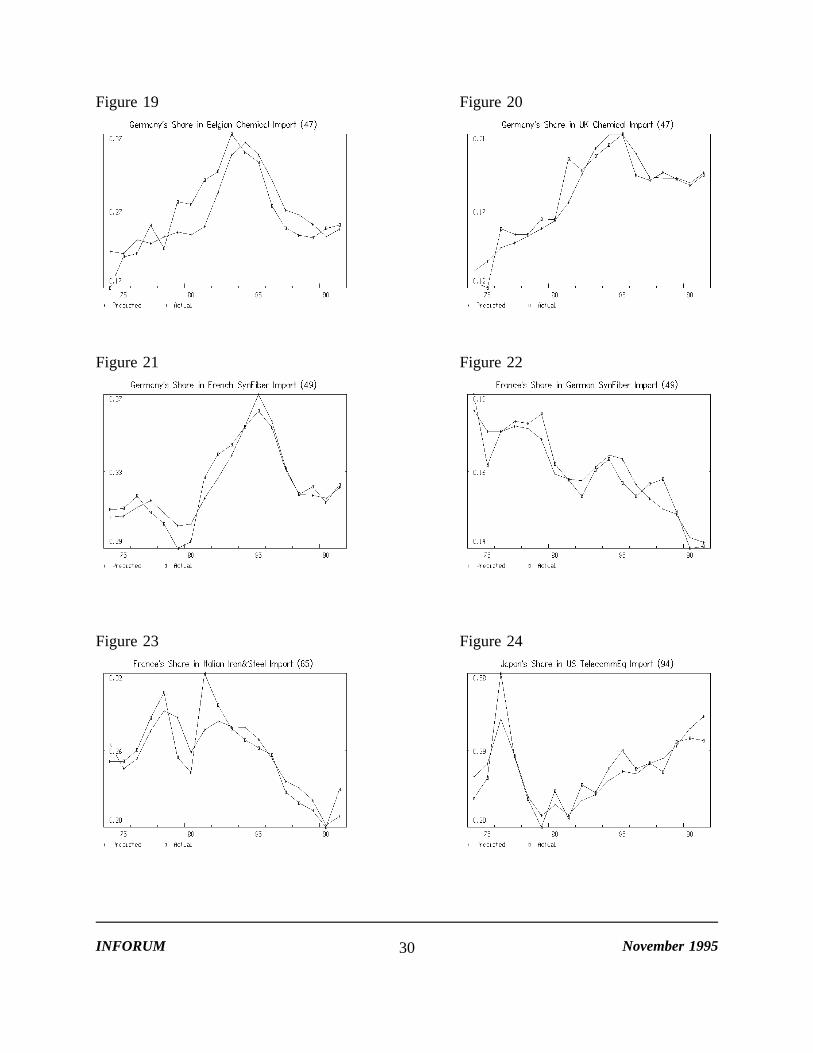
Figure 19 Figure 20
Figure 21 Figure 22
Figure 23 Figure 24
INFORUM November 199530
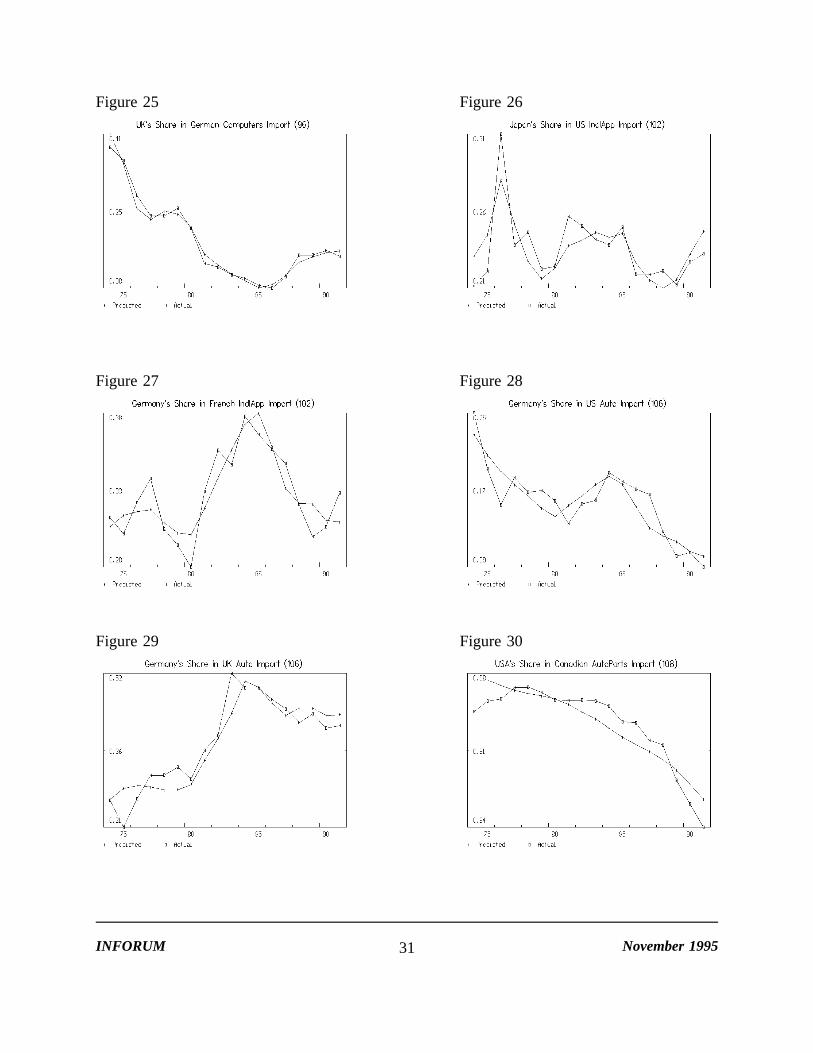
Figure 25 Figure 26
Figure 27 Figure 28
Figure 29 Figure 30
INFORUM November 199531
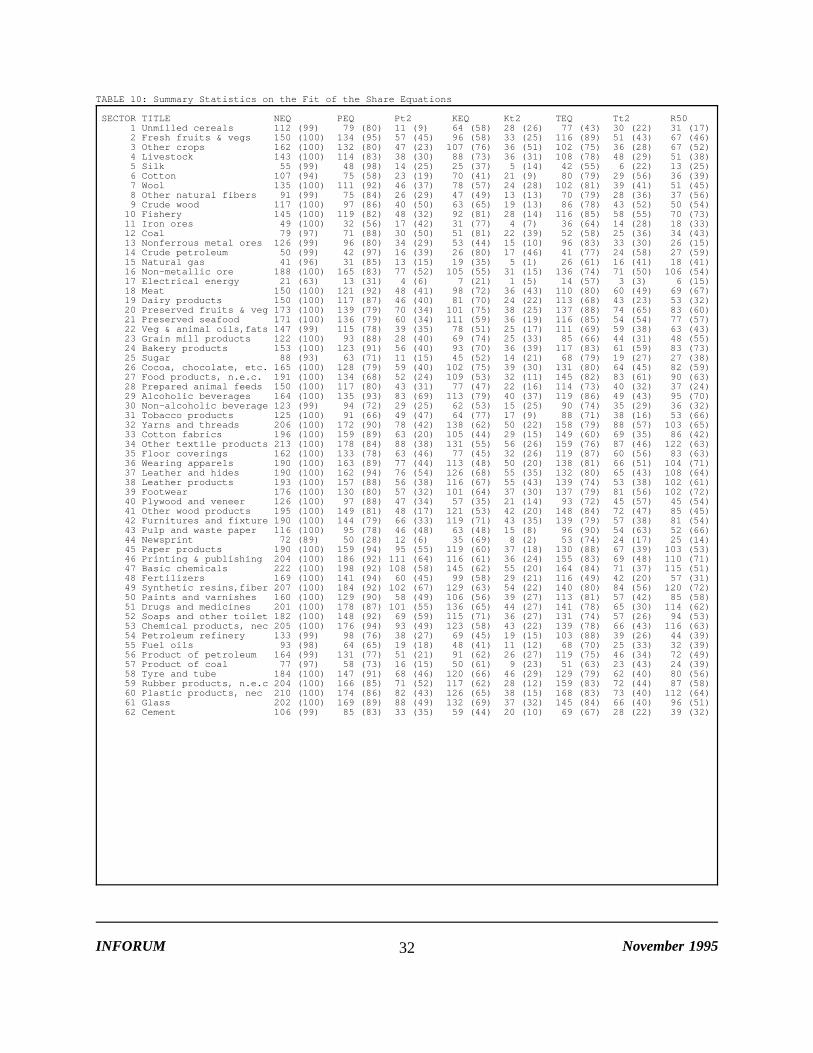
TABLE 10: Summary Statistics on the Fit of the Share Equations
SECTOR TITLE NEQ PEQ Pt2 KEQ Kt2 TEQ Tt2 R501 Unmilled cereals 112 (99) 79 (80) 11 (9) 64 (58) 28 (26) 77 (43) 30 (22) 31 (17)2 Fresh fruits & vegs 150 (100) 134 (95) 57 (45) 96 (58) 33 (25) 116 (89) 51 (43) 67 (46)3 Other crops 162 (100) 132 (80) 47 (23) 107 (76) 36 (51) 102 (75) 36 (28) 67 (52)4 Livestock 143 (100) 114 (83) 38 (30) 88 (73) 36 (31) 108 (78) 48 (29) 51 (38)5 Silk 55 (99) 48 (98) 14 (25) 25 (37) 5 (14) 42 (55) 6 (22) 13 (25)6 Cotton 107 (94) 75 (58) 23 (19) 70 (41) 21 (9) 80 (79) 29 (56) 36 (39)7 Wool 135 (100) 111 (92) 46 (37) 78 (57) 24 (28) 102 (81) 39 (41) 51 (45)8 Other natural fibers 91 (99) 75 (84) 26 (29) 47 (49) 13 (13) 70 (79) 28 (36) 37 (56)9 Crude wood 117 (100) 97 (86) 40 (50) 63 (65) 19 (13) 86 (78) 43 (52) 50 (54)10 Fishery 145 (100) 119 (82) 48 (32) 92 (81) 28 (14) 116 (85) 58 (55) 70 (73)11 Iron ores 49 (100) 32 (56) 17 (42) 31 (77) 4 (7) 36 (64) 14 (28) 18 (33)12 Coal 79 (97) 71 (88) 30 (50) 51 (81) 22 (39) 52 (58) 25 (36) 34 (43)13 Nonferrous metal ores 126 (99) 96 (80) 34 (29) 53 (44) 15 (10) 96 (83) 33 (30) 26 (15)14 Crude petroleum 50 (99) 42 (97) 16 (39) 26 (80) 17 (46) 41 (77) 24 (58) 27 (59)15 Natural gas 41 (96) 31 (85) 13 (15) 19 (35) 5 (1) 26 (61) 16 (41) 18 (41)16 Non-metallic ore 188 (100) 165 (83) 77 (52) 105 (55) 31 (15) 136 (74) 71 (50) 106 (54)17 Electrical energy 21 (63) 13 (31) 4 (6) 7 (21) 1 (5) 14 (57) 3 (3) 6 (15)18 Meat 150 (100) 121 (92) 48 (41) 98 (72) 36 (43) 110 (80) 60 (49) 69 (67)19 Dairy products 150 (100) 117 (87) 46 (40) 81 (70) 24 (22) 113 (68) 43 (23) 53 (32)20 Preserved fruits & veg 173 (100) 139 (79) 70 (34) 101 (75) 38 (25) 137 (88) 74 (65) 83 (60)21 Preserved seafood 171 (100) 136 (79) 60 (34) 111 (59) 36 (19) 116 (85) 54 (54) 77 (57)22 Veg & animal oils,fats 147 (99) 115 (78) 39 (35) 78 (51) 25 (17) 111 (69) 59 (38) 63 (43)23 Grain mill products 122 (100) 93 (88) 28 (40) 69 (74) 25 (33) 85 (66) 44 (31) 48 (55)24 Bakery products 153 (100) 123 (91) 56 (40) 93 (70) 36 (39) 117 (83) 61 (59) 83 (73)25 Sugar 88 (93) 63 (71) 11 (15) 45 (52) 14 (21) 68 (79) 19 (27) 27 (38)26 Cocoa, chocolate, etc. 165 (100) 128 (79) 59 (40) 102 (75) 39 (30) 131 (80) 64 (45) 82 (59)27 Food products, n.e.c. 191 (100) 134 (68) 52 (24) 109 (53) 32 (11) 145 (82) 83 (61) 90 (63)28 Prepared animal feeds 150 (100) 117 (80) 43 (31) 77 (47) 22 (16) 114 (73) 40 (32) 37 (24)29 Alcoholic beverages 164 (100) 135 (93) 83 (69) 113 (79) 40 (37) 119 (86) 49 (43) 95 (70)30 Non-alcoholic beverage 123 (99) 94 (72) 29 (25) 62 (53) 15 (25) 90 (74) 35 (29) 36 (32)31 Tobacco products 125 (100) 91 (66) 49 (47) 64 (77) 17 (9) 88 (71) 38 (16) 53 (66)32 Yarns and threads 206 (100) 172 (90) 78 (42) 138 (62) 50 (22) 158 (79) 88 (57) 103 (65)33 Cotton fabrics 196 (100) 159 (89) 63 (20) 105 (44) 29 (15) 149 (60) 69 (35) 86 (42)34 Other textile products 213 (100) 178 (84) 88 (38) 131 (55) 56 (26) 159 (76) 87 (46) 122 (63)35 Floor coverings 162 (100) 133 (78) 63 (46) 77 (45) 32 (26) 119 (87) 60 (56) 83 (63)36 Wearing apparels 190 (100) 163 (89) 77 (44) 113 (48) 50 (20) 138 (81) 66 (51) 104 (71)37 Leather and hides 190 (100) 162 (94) 76 (54) 126 (68) 55 (35) 132 (80) 65 (43) 108 (64)38 Leather products 193 (100) 157 (88) 56 (38) 116 (67) 55 (43) 139 (74) 53 (38) 102 (61)39 Footwear 176 (100) 130 (80) 57 (32) 101 (64) 37 (30) 137 (79) 81 (56) 102 (72)40 Plywood and veneer 126 (100) 97 (88) 47 (34) 57 (35) 21 (14) 93 (72) 45 (57) 45 (54)41 Other wood products 195 (100) 149 (81) 48 (17) 121 (53) 42 (20) 148 (84) 72 (47) 85 (45)42 Furnitures and fixture 190 (100) 144 (79) 66 (33) 119 (71) 43 (35) 139 (79) 57 (38) 81 (54)43 Pulp and waste paper 116 (100) 95 (78) 46 (48) 63 (48) 15 (8) 96 (90) 54 (63) 52 (66)44 Newsprint 72 (89) 50 (28) 12 (6) 35 (69) 8 (2) 53 (74) 24 (17) 25 (14)45 Paper products 190 (100) 159 (94) 95 (55) 119 (60) 37 (18) 130 (88) 67 (39) 103 (53)46 Printing & publishing 204 (100) 186 (92) 111 (64) 116 (61) 36 (24) 155 (83) 69 (48) 110 (71)47 Basic chemicals 222 (100) 198 (92) 108 (58) 145 (62) 55 (20) 164 (84) 71 (37) 115 (51)48 Fertilizers 169 (100) 141 (94) 60 (45) 99 (58) 29 (21) 116 (49) 42 (20) 57 (31)49 Synthetic resins,fiber 207 (100) 184 (92) 102 (67) 129 (63) 54 (22) 140 (80) 84 (56) 120 (72)50 Paints and varnishes 160 (100) 129 (90) 58 (49) 106 (56) 39 (27) 113 (81) 57 (42) 85 (58)51 Drugs and medicines 201 (100) 178 (87) 101 (55) 136 (65) 44 (27) 141 (78) 65 (30) 114 (62)52 Soaps and other toilet 182 (100) 148 (92) 69 (59) 115 (71) 36 (27) 131 (74) 57 (26) 94 (53)53 Chemical products, nec 205 (100) 176 (94) 93 (49) 123 (58) 43 (22) 139 (78) 66 (43) 116 (63)54 Petroleum refinery 133 (99) 98 (76) 38 (27) 69 (45) 19 (15) 103 (88) 39 (26) 44 (39)55 Fuel oils 93 (98) 64 (65) 19 (18) 48 (41) 11 (12) 68 (70) 25 (33) 32 (39)56 Product of petroleum 164 (99) 131 (77) 51 (21) 91 (62) 26 (27) 119 (75) 46 (34) 72 (49)57 Product of coal 77 (97) 58 (73) 16 (15) 50 (61) 9 (23) 51 (63) 23 (43) 24 (39)58 Tyre and tube 184 (100) 147 (91) 68 (46) 120 (66) 46 (29) 129 (79) 62 (40) 80 (56)59 Rubber products, n.e.c 204 (100) 166 (85) 71 (52) 117 (62) 28 (12) 159 (83) 72 (44) 87 (58)60 Plastic products, nec 210 (100) 174 (86) 82 (43) 126 (65) 38 (15) 168 (83) 73 (40) 112 (64)61 Glass 202 (100) 169 (89) 88 (49) 132 (69) 37 (32) 145 (84) 66 (40) 96 (51)62 Cement 106 (99) 85 (83) 33 (35) 59 (44) 20 (10) 69 (67) 28 (22) 39 (32)
INFORUM November 199532
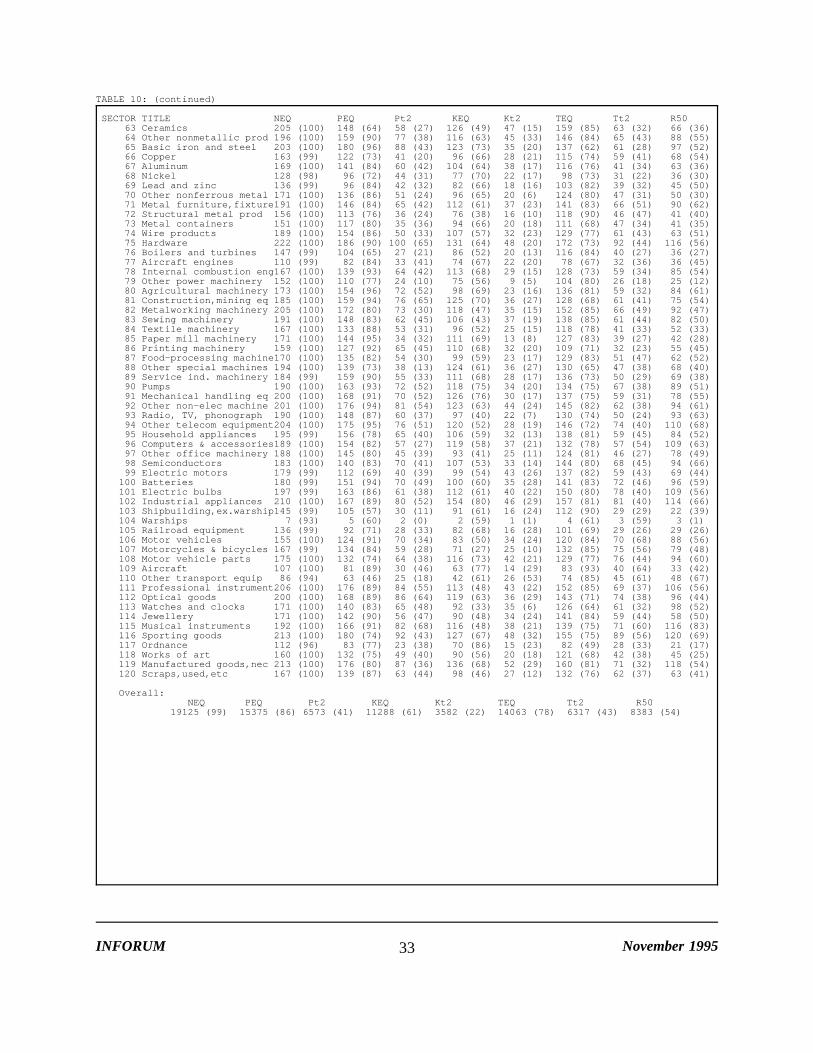
TABLE 10: (continued)
SECTOR TITLE NEQ PEQ Pt2 KEQ Kt2 TEQ Tt2 R5063 Ceramics 205 (100) 148 (64) 58 (27) 126 (49) 47 (15) 159 (85) 63 (32) 66 (36)64 Other nonmetallic prod 196 (100) 159 (90) 77 (38) 116 (63) 45 (33) 146 (84) 65 (43) 88 (55)65 Basic iron and steel 203 (100) 180 (96) 88 (43) 123 (73) 35 (20) 137 (62) 61 (28) 97 (52)66 Copper 163 (99) 122 (73) 41 (20) 96 (66) 28 (21) 115 (74) 59 (41) 68 (54)67 Aluminum 169 (100) 141 (84) 60 (42) 104 (64) 38 (17) 116 (76) 41 (34) 63 (36)68 Nickel 128 (98) 96 (72) 44 (31) 77 (70) 22 (17) 98 (73) 31 (22) 36 (30)69 Lead and zinc 136 (99) 96 (84) 42 (32) 82 (66) 18 (16) 103 (82) 39 (32) 45 (50)70 Other nonferrous metal 171 (100) 136 (86) 51 (24) 96 (65) 20 (6) 124 (80) 47 (31) 50 (30)71 Metal furniture,fixture191 (100) 146 (84) 65 (42) 112 (61) 37 (23) 141 (83) 66 (51) 90 (62)72 Structural metal prod 156 (100) 113 (76) 36 (24) 76 (38) 16 (10) 118 (90) 46 (47) 41 (40)73 Metal containers 151 (100) 117 (80) 35 (36) 94 (66) 20 (18) 111 (68) 47 (34) 41 (35)74 Wire products 189 (100) 154 (86) 50 (33) 107 (57) 32 (23) 129 (77) 61 (43) 63 (51)75 Hardware 222 (100) 186 (90) 100 (65) 131 (64) 48 (20) 172 (73) 92 (44) 116 (56)76 Boilers and turbines 147 (99) 104 (65) 27 (21) 86 (52) 20 (13) 116 (84) 40 (27) 36 (27)77 Aircraft engines 110 (99) 82 (84) 33 (41) 74 (67) 22 (20) 78 (67) 32 (36) 36 (45)78 Internal combustion eng167 (100) 139 (93) 64 (42) 113 (68) 29 (15) 128 (73) 59 (34) 85 (54)79 Other power machinery 152 (100) 110 (77) 24 (10) 75 (56) 9 (5) 104 (80) 26 (18) 25 (12)80 Agricultural machinery 173 (100) 154 (96) 72 (52) 98 (69) 23 (16) 136 (81) 59 (32) 84 (61)81 Construction,mining eq 185 (100) 159 (94) 76 (65) 125 (70) 36 (27) 128 (68) 61 (41) 75 (54)82 Metalworking machinery 205 (100) 172 (80) 73 (30) 118 (47) 35 (15) 152 (85) 66 (49) 92 (47)83 Sewing machinery 191 (100) 148 (83) 62 (45) 106 (43) 37 (19) 138 (85) 61 (44) 82 (50)84 Textile machinery 167 (100) 133 (88) 53 (31) 96 (52) 25 (15) 118 (78) 41 (33) 52 (33)85 Paper mill machinery 171 (100) 144 (95) 34 (32) 111 (69) 13 (8) 127 (83) 39 (27) 42 (28)86 Printing machinery 159 (100) 127 (92) 65 (45) 110 (68) 32 (20) 109 (71) 32 (23) 55 (45)87 Food-processing machine170 (100) 135 (82) 54 (30) 99 (59) 23 (17) 129 (83) 51 (47) 62 (52)88 Other special machines 194 (100) 139 (73) 38 (13) 124 (61) 36 (27) 130 (65) 47 (38) 68 (40)89 Service ind. machinery 184 (99) 159 (90) 55 (33) 111 (68) 28 (17) 136 (73) 50 (29) 69 (38)90 Pumps 190 (100) 163 (93) 72 (52) 118 (75) 34 (20) 134 (75) 67 (38) 89 (51)91 Mechanical handling eq 200 (100) 168 (91) 70 (52) 126 (76) 30 (17) 137 (75) 59 (31) 78 (55)92 Other non-elec machine 201 (100) 176 (94) 81 (54) 123 (63) 44 (24) 145 (82) 62 (38) 94 (61)93 Radio, TV, phonograph 190 (100) 148 (87) 60 (37) 97 (40) 22 (7) 130 (74) 50 (24) 93 (63)94 Other telecom equipment204 (100) 175 (95) 76 (51) 120 (52) 28 (19) 146 (72) 74 (40) 110 (68)95 Household appliances 195 (99) 156 (78) 65 (40) 106 (59) 32 (13) 138 (81) 59 (45) 84 (52)96 Computers & accessories189 (100) 154 (82) 57 (27) 119 (58) 37 (21) 132 (78) 57 (54) 109 (63)97 Other office machinery 188 (100) 145 (80) 45 (39) 93 (41) 25 (11) 124 (81) 46 (27) 78 (49)98 Semiconductors 183 (100) 140 (83) 70 (41) 107 (53) 33 (14) 144 (80) 68 (45) 94 (66)99 Electric motors 179 (99) 112 (69) 40 (39) 99 (54) 43 (26) 137 (82) 59 (43) 69 (44)100 Batteries 180 (99) 151 (94) 70 (49) 100 (60) 35 (28) 141 (83) 72 (46) 96 (59)101 Electric bulbs 197 (99) 163 (86) 61 (38) 112 (61) 40 (22) 150 (80) 78 (40) 109 (56)102 Industrial appliances 210 (100) 167 (89) 80 (52) 154 (80) 46 (29) 157 (81) 81 (40) 114 (66)103 Shipbuilding,ex.warship145 (99) 105 (57) 30 (11) 91 (61) 16 (24) 112 (90) 29 (29) 22 (39)104 Warships 7 (93) 5 (60) 2 (0) 2 (59) 1 (1) 4 (61) 3 (59) 3 (1)105 Railroad equipment 136 (99) 92 (71) 28 (33) 82 (68) 16 (28) 101 (69) 29 (26) 29 (26)106 Motor vehicles 155 (100) 124 (91) 70 (34) 83 (50) 34 (24) 120 (84) 70 (68) 88 (56)107 Motorcycles & bicycles 167 (99) 134 (84) 59 (28) 71 (27) 25 (10) 132 (85) 75 (56) 79 (48)108 Motor vehicle parts 175 (100) 132 (74) 64 (38) 116 (73) 42 (21) 129 (77) 76 (44) 94 (60)109 Aircraft 107 (100) 81 (89) 30 (46) 63 (77) 14 (29) 83 (93) 40 (64) 33 (42)110 Other transport equip 86 (94) 63 (46) 25 (18) 42 (61) 26 (53) 74 (85) 45 (61) 48 (67)111 Professional instrument206 (100) 176 (89) 84 (55) 113 (48) 43 (22) 152 (85) 69 (37) 106 (56)112 Optical goods 200 (100) 168 (89) 86 (64) 119 (63) 36 (29) 143 (71) 74 (38) 96 (44)113 Watches and clocks 171 (100) 140 (83) 65 (48) 92 (33) 35 (6) 126 (64) 61 (32) 98 (52)114 Jewellery 171 (100) 142 (90) 56 (47) 90 (48) 34 (24) 141 (84) 59 (44) 58 (50)115 Musical instruments 192 (100) 166 (91) 82 (68) 116 (48) 38 (21) 139 (75) 71 (60) 116 (83)116 Sporting goods 213 (100) 180 (74) 92 (43) 127 (67) 48 (32) 155 (75) 89 (56) 120 (69)117 Ordnance 112 (96) 83 (77) 23 (38) 70 (86) 15 (23) 82 (49) 28 (33) 21 (17)118 Works of art 160 (100) 132 (75) 49 (40) 90 (56) 20 (18) 121 (68) 42 (38) 45 (25)119 Manufactured goods,nec 213 (100) 176 (80) 87 (36) 136 (68) 52 (29) 160 (81) 71 (32) 118 (54)120 Scraps,used,etc 167 (100) 139 (87) 63 (44) 98 (46) 27 (12) 132 (76) 62 (37) 63 (41)
Overall:NEQ PEQ Pt2 KEQ Kt2 TEQ Tt2 R50
19125 (99) 15375 (86) 6573 (41) 11288 (61) 3582 (22) 14063 (78) 6317 (43) 8383 (54)
INFORUM November 199533
graphs and the summary statistic table on the preceding pages, we have attempted to demonstratethat there is ample empirical evidence on the robustness of the three explanatory variables in thetrade share equations. Given the fact that in most cases the trade share experiences both ups anddowns over the 18-year estimation period, the close fit of most of the share equations appearseven more remarkable, because they suggest that the two independent variables that areeconomically meaningful (i.e. the relative prices and relative capital stock), rather than the trendvariable, are the more significant explanatory variables in the trade share equations.
6. Historical Simulation: 1980-91
Historical simulation is one of the basic tests model-builders apply to any forecasting modelto gauge its predictive accuracy. This test runs the model over the period for which it wasestimated. Actual values of exogenous variables are used. Lagged values of endogenousvariables may be either their actual values (for a static simulation) or the values calculated bythe model (for a dynamic simulation). Here, we will be concerned only with the dynamicsimulation.
We run the trade model for twelve sample years (1980-91). In solving the model, thecompetitive prices and relative capital stock for each country are computed from the export pricesand capital investment supplied by the country models in the Inforum international system, andthe solutions are obtained for trade-shares matrix. Then, for the given total import demand byindustry of each country, the solutions are also obtained for bilateral trade flows and eachcountry’s exports.
Before we proceed to evaluate the trade model’s performance in the historical simulation, weshould note that good historical simulation results are not necessarily indicative of the strongexplanatory power of the underlying model. It is certainly true that a model can be "rigged" todo well in dynamic historical simulation. All that is necessary is to put exogenous variables ineach equation that provide the bulk of the explanation. For example, in a macroeconomic modelof the U.S. economy, one could put into its equation for inflation in the GDP deflator the rateof inflation in the Consumer Price Index (CPI), and left the latter exogenous. Obviously suchan equation would have fit well and would perform well in historical simulation. Its explanatorypower and its value in forecasting, however, is nil. On the other hand, if a model does not havesuch rigging, the historical simulation can ba a meaningful as well as demanding test.
We submit that the dynamic historical simulation reported below belongs in the lattercategory, because the explanatory variables in the trade-share equations -- relative prices, relativecapital investment and the Nyhus trend -- are not exogenous to the linked system; they are solvedin the country models and then fed to the trade model. Thus, the better the historical simulationresults, the stronger the explanatory power of the model.
To judge the predictive accuracy of the trade model, we have compared its historical
INFORUM November 199534
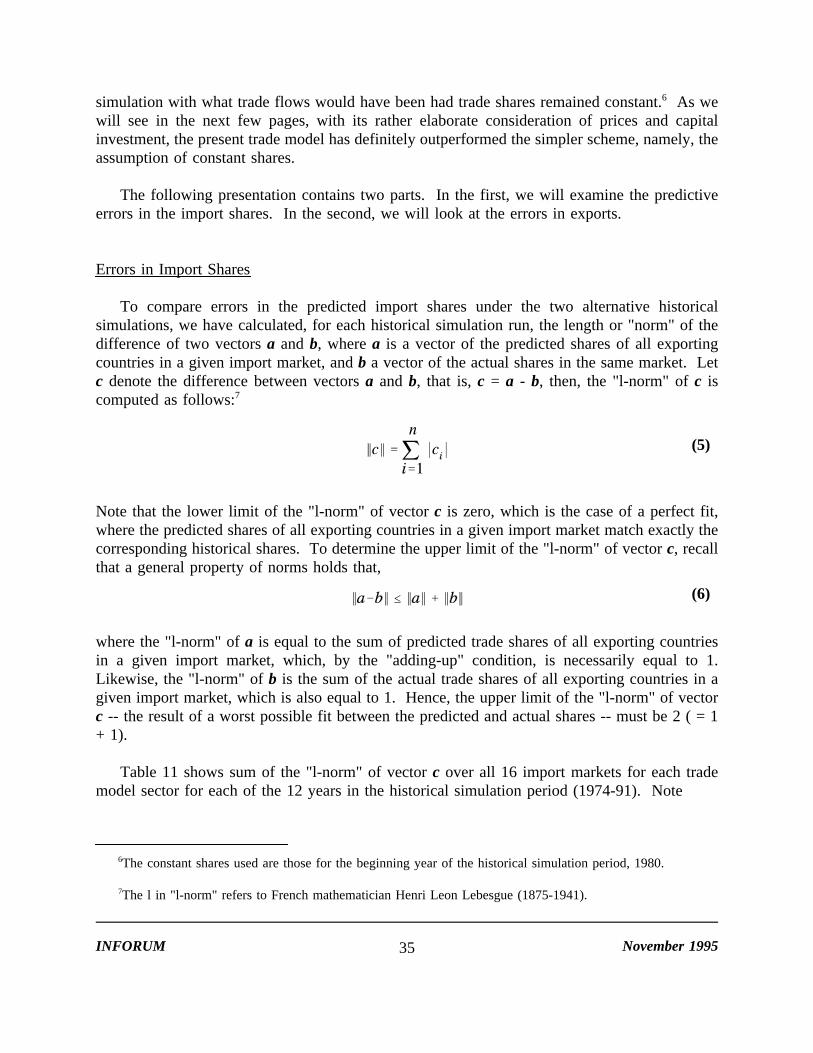
simulation with what trade flows would have been had trade shares remained constant.6 As wewill see in the next few pages, with its rather elaborate consideration of prices and capitalinvestment, the present trade model has definitely outperformed the simpler scheme, namely, theassumption of constant shares.
The following presentation contains two parts. In the first, we will examine the predictiveerrors in the import shares. In the second, we will look at the errors in exports.
Errors in Import Shares
To compare errors in the predicted import shares under the two alternative historicalsimulations, we have calculated, for each historical simulation run, the length or "norm" of thedifference of two vectors a and b, where a is a vector of the predicted shares of all exportingcountries in a given import market, and b a vector of the actual shares in the same market. Letc denote the difference between vectors a and b, that is, c = a - b, then, the "l-norm" of c iscomputed as follows:7
Note that the lower limit of the "l-norm" of vector c is zero, which is the case of a perfect fit,
(5)
where the predicted shares of all exporting countries in a given import market match exactly thecorresponding historical shares. To determine the upper limit of the "l-norm" of vector c, recallthat a general property of norms holds that,
where the "l-norm" of a is equal to the sum of predicted trade shares of all exporting countries
(6)
in a given import market, which, by the "adding-up" condition, is necessarily equal to 1.Likewise, the "l-norm" of b is the sum of the actual trade shares of all exporting countries in agiven import market, which is also equal to 1. Hence, the upper limit of the "l-norm" of vectorc -- the result of a worst possible fit between the predicted and actual shares -- must be 2 ( = 1+ 1).
Table 11 shows sum of the "l-norm" of vector c over all 16 import markets for each trademodel sector for each of the 12 years in the historical simulation period (1974-91). Note
6The constant shares used are those for the beginning year of the historical simulation period, 1980.
7The l in "l-norm" refers to French mathematician Henri Leon Lebesgue (1875-1941).
INFORUM November 199535
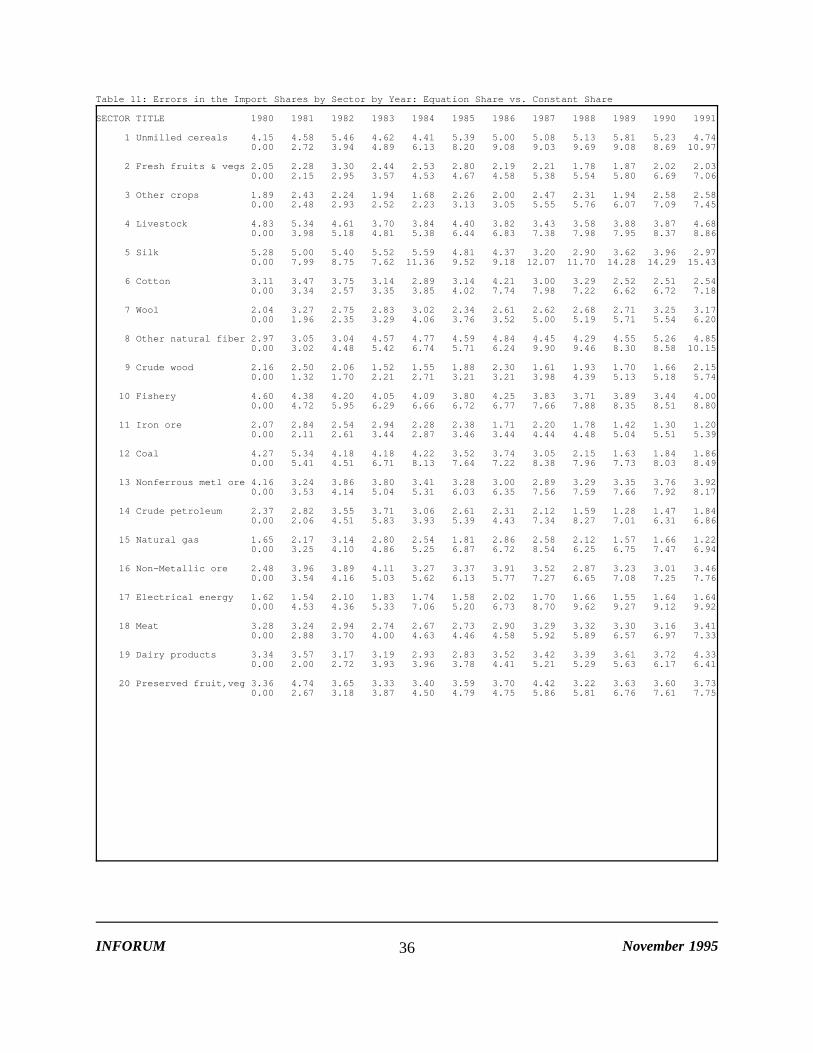
Table 11: Errors in the Import Shares by Sector by Year: Equation Share vs. Constant Share
SECTOR TITLE 1980 1981 1982 1983 1984 1985 1986 1987 1988 1989 1990 1991
1 Unmilled cereals 4.15 4.58 5.46 4.62 4.41 5.39 5.00 5.08 5.13 5.81 5.23 4.740.00 2.72 3.94 4.89 6.13 8.20 9.08 9.03 9.69 9.08 8.69 10.97
2 Fresh fruits & vegs 2.05 2.28 3.30 2.44 2.53 2.80 2.19 2.21 1.78 1.87 2.02 2.030.00 2.15 2.95 3.57 4.53 4.67 4.58 5.38 5.54 5.80 6.69 7.06
3 Other crops 1.89 2.43 2.24 1.94 1.68 2.26 2.00 2.47 2.31 1.94 2.58 2.580.00 2.48 2.93 2.52 2.23 3.13 3.05 5.55 5.76 6.07 7.09 7.45
4 Livestock 4.83 5.34 4.61 3.70 3.84 4.40 3.82 3.43 3.58 3.88 3.87 4.680.00 3.98 5.18 4.81 5.38 6.44 6.83 7.38 7.98 7.95 8.37 8.86
5 Silk 5.28 5.00 5.40 5.52 5.59 4.81 4.37 3.20 2.90 3.62 3.96 2.970.00 7.99 8.75 7.62 11.36 9.52 9.18 12.07 11.70 14.28 14.29 15.43
6 Cotton 3.11 3.47 3.75 3.14 2.89 3.14 4.21 3.00 3.29 2.52 2.51 2.540.00 3.34 2.57 3.35 3.85 4.02 7.74 7.98 7.22 6.62 6.72 7.18
7 Wool 2.04 3.27 2.75 2.83 3.02 2.34 2.61 2.62 2.68 2.71 3.25 3.170.00 1.96 2.35 3.29 4.06 3.76 3.52 5.00 5.19 5.71 5.54 6.20
8 Other natural fiber 2.97 3.05 3.04 4.57 4.77 4.59 4.84 4.45 4.29 4.55 5.26 4.850.00 3.02 4.48 5.42 6.74 5.71 6.24 9.90 9.46 8.30 8.58 10.15
9 Crude wood 2.16 2.50 2.06 1.52 1.55 1.88 2.30 1.61 1.93 1.70 1.66 2.150.00 1.32 1.70 2.21 2.71 3.21 3.21 3.98 4.39 5.13 5.18 5.74
10 Fishery 4.60 4.38 4.20 4.05 4.09 3.80 4.25 3.83 3.71 3.89 3.44 4.000.00 4.72 5.95 6.29 6.66 6.72 6.77 7.66 7.88 8.35 8.51 8.80
11 Iron ore 2.07 2.84 2.54 2.94 2.28 2.38 1.71 2.20 1.78 1.42 1.30 1.200.00 2.11 2.61 3.44 2.87 3.46 3.44 4.44 4.48 5.04 5.51 5.39
12 Coal 4.27 5.34 4.18 4.18 4.22 3.52 3.74 3.05 2.15 1.63 1.84 1.860.00 5.41 4.51 6.71 8.13 7.64 7.22 8.38 7.96 7.73 8.03 8.49
13 Nonferrous metl ore 4.16 3.24 3.86 3.80 3.41 3.28 3.00 2.89 3.29 3.35 3.76 3.920.00 3.53 4.14 5.04 5.31 6.03 6.35 7.56 7.59 7.66 7.92 8.17
14 Crude petroleum 2.37 2.82 3.55 3.71 3.06 2.61 2.31 2.12 1.59 1.28 1.47 1.840.00 2.06 4.51 5.83 3.93 5.39 4.43 7.34 8.27 7.01 6.31 6.86
15 Natural gas 1.65 2.17 3.14 2.80 2.54 1.81 2.86 2.58 2.12 1.57 1.66 1.220.00 3.25 4.10 4.86 5.25 6.87 6.72 8.54 6.25 6.75 7.47 6.94
16 Non-Metallic ore 2.48 3.96 3.89 4.11 3.27 3.37 3.91 3.52 2.87 3.23 3.01 3.460.00 3.54 4.16 5.03 5.62 6.13 5.77 7.27 6.65 7.08 7.25 7.76
17 Electrical energy 1.62 1.54 2.10 1.83 1.74 1.58 2.02 1.70 1.66 1.55 1.64 1.640.00 4.53 4.36 5.33 7.06 5.20 6.73 8.70 9.62 9.27 9.12 9.92
18 Meat 3.28 3.24 2.94 2.74 2.67 2.73 2.90 3.29 3.32 3.30 3.16 3.410.00 2.88 3.70 4.00 4.63 4.46 4.58 5.92 5.89 6.57 6.97 7.33
19 Dairy products 3.34 3.57 3.17 3.19 2.93 2.83 3.52 3.42 3.39 3.61 3.72 4.330.00 2.00 2.72 3.93 3.96 3.78 4.41 5.21 5.29 5.63 6.17 6.41
20 Preserved fruit,veg 3.36 4.74 3.65 3.33 3.40 3.59 3.70 4.42 3.22 3.63 3.60 3.730.00 2.67 3.18 3.87 4.50 4.79 4.75 5.86 5.81 6.76 7.61 7.75
INFORUM November 199536
Table 11: (continued)
SECTOR TITLE 1980 1981 1982 1983 1984 1985 1986 1987 1988 1989 1990 1991
21 Preserved seafood 4.23 5.11 4.15 4.45 4.69 5.27 5.18 4.55 4.78 4.34 4.42 4.360.00 2.67 3.62 4.47 5.12 5.28 5.52 6.72 7.99 7.81 7.68 7.95
22 Veg &animal oil,fat 3.40 3.30 3.36 3.52 2.97 2.71 3.17 3.74 3.23 3.64 4.21 4.810.00 2.46 2.99 4.53 4.96 5.62 5.63 6.91 7.45 8.14 9.17 9.60
23 Grain mill products 5.18 6.22 6.63 6.24 6.38 5.33 4.19 5.22 5.12 4.77 4.56 4.300.00 4.87 6.90 7.31 7.67 9.09 8.53 10.56 10.95 10.11 10.30 10.13
24 Bakery products 3.27 5.34 4.79 4.73 4.25 3.46 3.82 3.75 4.29 4.18 4.12 4.750.00 3.81 5.04 6.09 7.18 7.10 7.23 7.47 8.31 9.16 9.50 9.98
25 Sugar 4.53 4.75 3.84 3.44 4.30 3.44 3.67 3.29 3.17 4.05 2.76 3.580.00 5.19 5.25 5.50 6.25 6.50 6.32 8.33 8.69 8.22 8.32 9.15
26 Cocoa,chocolate,etc 4.39 4.03 4.33 5.69 5.34 5.61 4.85 5.62 5.23 5.35 5.56 5.450.00 3.87 4.71 5.79 6.09 6.60 6.45 7.73 7.38 7.84 7.82 8.13
27 Food products,nec 5.03 5.97 6.30 5.74 6.14 5.30 5.17 4.36 4.45 4.55 4.36 5.170.00 2.48 3.88 4.75 4.91 5.73 5.66 6.43 6.43 6.85 7.03 7.30
28 Prepared animalfeed 5.75 4.76 4.42 5.11 4.43 4.29 3.86 3.48 3.16 3.04 3.58 3.710.00 4.12 5.49 6.54 6.33 6.97 6.86 7.71 7.97 8.08 8.02 8.56
29 Alcoholic beverages 3.25 4.97 4.27 4.02 3.42 3.55 4.05 4.43 3.40 3.35 3.33 3.100.00 3.35 5.17 7.39 8.54 8.29 7.30 8.06 7.80 8.53 7.79 7.70
30 Nonalcoholic bevera 4.14 5.06 5.52 5.19 5.62 5.52 5.49 4.41 5.39 4.56 5.13 5.580.00 6.34 6.55 8.30 9.41 10.65 11.33 13.16 12.55 11.20 10.88 11.13
31 Tobacco products 4.46 5.03 3.96 5.70 3.53 4.41 5.91 4.56 5.10 5.01 5.52 6.390.00 2.77 4.12 6.14 6.29 6.85 5.28 7.97 7.53 7.32 7.50 7.42
32 Yarns and threads 3.82 3.45 3.42 2.90 3.09 2.24 3.00 3.19 2.59 2.73 2.91 3.200.00 3.43 4.19 4.74 5.54 6.17 6.20 8.24 8.09 8.08 8.01 8.60
33 Cotton fabrics 3.30 3.17 3.75 2.90 3.02 3.23 3.34 2.73 2.76 2.70 2.79 3.210.00 3.29 4.14 5.02 5.70 6.29 6.01 8.12 7.86 7.71 7.63 7.99
34 Other textile prod 2.27 2.54 3.38 2.23 2.14 2.28 2.61 2.52 2.40 2.41 2.40 2.470.00 2.03 2.79 3.61 4.14 4.97 5.41 6.41 6.59 6.81 6.75 7.17
35 Floor coverings 3.27 3.74 3.62 4.00 3.40 3.33 4.04 2.83 2.95 3.23 3.50 3.010.00 3.60 5.64 7.65 7.79 7.30 7.64 8.43 8.54 8.99 9.15 9.35
36 Wearing apparels 3.06 2.87 3.56 2.56 2.46 2.55 2.23 2.46 2.47 2.71 3.15 3.390.00 2.52 3.53 4.42 4.98 5.22 5.02 6.61 6.93 7.44 8.02 8.80
37 Leather and hides 3.14 4.13 3.78 3.18 2.94 2.71 3.41 2.99 2.29 2.18 2.58 2.500.00 2.73 3.23 3.97 4.84 5.23 5.20 6.08 6.73 7.35 8.08 8.46
38 Leather Products 3.79 3.94 3.90 3.91 4.14 4.09 3.71 3.74 3.73 3.20 4.15 4.650.00 2.61 3.37 5.23 5.88 6.32 7.31 9.60 10.59 10.40 11.09 11.71
39 Footwear 4.08 4.28 4.68 4.61 4.47 4.15 4.16 3.66 4.03 3.63 4.40 4.890.00 3.58 4.46 5.51 5.36 5.55 5.58 7.06 6.92 7.68 8.66 9.33
40 Plywood and veneer 5.15 5.80 4.95 5.28 4.33 4.27 4.90 3.70 4.44 4.05 4.18 5.070.00 4.03 5.67 6.53 6.83 8.58 8.65 10.45 10.65 10.86 11.24 11.74
INFORUM November 199537
Table 11: (continued)
SECTOR TITLE 1980 1981 1982 1983 1984 1985 1986 1987 1988 1989 1990 1991
41 Other wood products 2.60 3.30 2.59 2.35 2.38 2.09 3.24 2.81 2.77 3.10 3.89 4.530.00 3.02 3.26 3.49 4.31 4.53 4.68 6.24 6.12 6.63 6.85 7.18
42 Furniture & fixture 2.36 3.41 3.19 2.71 2.49 2.51 2.72 2.83 2.58 2.64 3.22 3.510.00 2.81 3.82 3.93 4.33 4.99 4.98 6.37 5.91 5.87 6.01 6.33
43 Pulp & waste paper 2.29 2.44 2.52 2.22 2.03 1.93 2.08 2.81 2.93 2.79 2.87 3.170.00 1.50 2.20 2.88 2.81 2.93 2.79 3.67 4.09 4.16 4.38 5.17
44 Newsprint 3.44 4.37 4.16 4.10 4.11 4.17 4.10 5.06 4.09 3.86 4.01 4.270.00 3.58 3.15 4.95 5.83 5.13 7.04 8.04 10.00 9.37 9.78 10.52
45 Paper products 2.49 3.60 2.78 2.05 2.35 2.82 3.74 4.28 4.58 3.96 3.47 3.650.00 1.99 2.53 3.48 4.42 4.89 4.51 5.20 5.70 5.91 5.24 5.20
46 Printing,publishing 1.78 2.54 2.75 2.07 2.06 2.16 2.48 2.45 2.49 2.29 2.48 2.910.00 2.06 3.04 3.69 4.19 4.70 4.15 4.56 4.40 5.48 5.57 6.05
47 Basic chemicals 1.50 2.04 1.68 1.50 1.60 1.33 2.10 1.84 2.00 1.94 1.96 1.890.00 2.22 2.84 3.45 4.10 4.28 3.79 4.57 4.80 4.97 4.97 5.05
48 Fertilizers 3.61 3.67 3.08 2.80 2.66 2.77 3.07 3.34 3.36 2.52 2.78 3.370.00 3.25 4.29 4.53 5.22 5.24 5.95 6.46 7.10 7.33 7.03 7.36
49 Synthetic fibers 2.00 2.57 2.27 1.97 1.75 1.64 1.76 2.21 2.36 2.00 1.86 1.730.00 1.66 2.31 3.15 3.65 4.10 3.64 4.27 4.45 4.64 4.53 4.63
50 Paints,varnishes 1.86 2.52 2.28 1.83 2.00 2.18 2.27 3.03 3.46 3.57 3.15 3.230.00 2.05 2.61 3.51 4.22 4.54 4.58 5.22 5.50 5.93 5.62 5.80
51 Drugs and medicines 1.77 2.57 2.63 2.22 1.92 2.05 2.21 2.46 2.02 2.31 2.10 2.310.00 1.99 2.90 3.62 4.23 4.87 4.39 5.26 5.29 5.89 5.86 5.96
52 Soaps &other toilet 1.80 2.77 2.78 2.15 2.10 2.15 2.70 2.66 2.73 2.52 2.66 2.650.00 2.00 2.99 4.21 5.08 5.26 4.85 5.40 5.11 5.53 5.00 5.25
53 Chemical prod.,nec 1.73 2.18 2.50 1.72 1.63 1.70 2.19 2.77 2.94 2.70 2.19 2.980.00 1.74 3.34 4.01 4.53 5.45 4.91 5.49 5.38 6.24 6.15 6.37
54 Petroleum refinery 3.41 4.47 4.04 3.30 2.97 2.92 2.94 2.83 2.54 2.95 3.03 3.430.00 3.79 4.85 5.70 6.01 6.05 6.15 7.02 6.72 7.05 6.54 6.69
55 Fuel oils 2.82 4.11 4.01 4.12 3.37 3.07 2.36 1.97 1.77 2.39 2.65 3.380.00 4.46 5.92 7.84 8.37 8.94 9.34 9.78 10.48 10.49 9.79 10.17
56 Prod of petroleum 5.55 8.04 5.73 5.38 5.10 5.16 5.08 5.99 4.72 4.19 4.03 4.780.00 5.55 4.73 6.91 7.36 7.62 7.61 9.04 9.94 9.93 10.43 9.71
57 Product of coal 4.84 4.94 5.24 5.85 5.30 4.51 4.42 3.42 3.31 3.39 2.76 3.670.00 4.22 6.24 7.34 6.97 7.60 7.58 8.57 9.09 9.81 10.98 11.89
58 Tyre and tube 4.54 5.24 4.49 4.87 4.31 4.47 4.90 4.16 4.63 4.70 4.95 5.430.00 2.94 4.39 5.74 6.04 6.38 6.10 7.01 7.33 7.42 7.51 7.57
59 Rubber products,nec 2.88 3.29 3.06 2.55 2.44 2.25 3.21 3.31 3.31 3.13 3.02 3.090.00 2.45 3.39 4.38 4.22 4.49 4.09 5.20 5.34 5.94 6.10 6.38
60 Plastic product,nec 2.80 2.67 2.80 2.23 2.15 2.08 2.51 2.72 3.01 3.04 3.21 3.390.00 2.01 2.60 3.42 3.66 3.93 4.12 5.35 5.59 5.81 6.08 6.71
INFORUM November 199538
Table 11: (continued)
SECTOR TITLE 1980 1981 1982 1983 1984 1985 1986 1987 1988 1989 1990 1991
61 Glass 1.92 2.53 2.89 2.26 1.59 1.70 2.40 2.46 2.04 2.29 2.27 2.510.00 2.37 3.31 4.05 4.31 4.34 4.03 4.90 5.03 5.40 5.20 5.45
62 Cement 6.03 7.65 7.67 6.21 7.10 6.50 5.49 4.73 4.93 4.68 5.56 5.060.00 3.35 6.35 8.00 8.37 9.76 10.93 12.83 15.08 14.57 14.61 13.85
63 Ceramics 3.94 4.35 4.73 3.55 3.09 3.00 3.83 4.50 4.04 4.57 4.32 4.770.00 3.01 5.07 4.92 5.30 5.36 5.55 6.85 8.91 9.69 9.36 9.59
64 Nonmetallic prd,nec 2.08 2.85 2.21 1.91 1.80 2.16 2.73 2.80 2.80 2.66 3.06 3.110.00 2.30 3.08 3.89 4.44 4.86 4.60 5.44 6.51 6.86 6.93 7.17
65 Basic iron & steel 2.31 3.05 2.99 3.07 2.75 2.48 2.91 2.68 2.63 2.21 2.51 3.150.00 2.47 2.76 2.89 3.73 3.78 3.44 4.81 5.43 5.67 5.86 6.19
66 Copper 4.55 3.49 3.98 4.13 3.32 2.83 2.60 2.50 2.96 2.67 2.94 3.530.00 3.76 4.49 4.67 6.20 5.85 5.83 7.69 8.41 8.75 8.73 8.59
67 Aluminum 5.03 3.85 3.33 3.12 3.21 2.81 2.33 2.92 3.51 2.93 2.82 2.870.00 4.80 6.36 7.19 7.67 7.55 7.43 8.17 7.81 8.09 8.00 7.90
68 Nickel 5.15 5.94 5.79 5.46 4.90 4.70 5.24 6.02 4.33 3.95 3.79 3.470.00 4.02 4.64 4.86 5.54 6.31 6.38 7.22 8.85 9.16 9.55 9.16
69 Lead and zinc 5.76 4.77 3.83 5.03 4.64 3.63 3.64 4.20 3.51 4.16 3.65 4.500.00 5.71 5.64 7.52 7.93 7.53 7.14 9.38 8.43 9.00 8.98 9.04
70 Other nonferrous 4.07 4.23 3.77 4.46 3.09 3.26 3.56 4.01 3.18 3.50 4.01 4.790.00 4.58 5.78 5.67 5.49 6.11 5.66 7.35 7.63 8.10 8.27 9.34
71 Metal furnitures 2.39 3.24 3.41 3.61 3.76 4.22 4.56 4.56 4.02 3.95 4.43 3.650.00 2.63 3.04 4.15 4.65 5.20 5.76 7.04 7.26 7.36 7.39 7.60
72 Structural metal pd 3.48 4.75 4.74 5.65 4.58 3.14 3.96 4.53 3.68 4.44 4.09 4.750.00 4.62 4.67 7.12 6.96 7.24 6.67 9.95 9.34 7.97 8.61 9.10
73 Metal containers 4.76 5.21 4.94 5.51 5.08 5.07 4.99 4.01 4.21 3.69 4.25 4.110.00 5.53 6.75 7.48 7.37 8.35 8.04 8.19 8.29 8.39 8.03 8.15
74 Wire products 3.62 4.35 4.23 4.74 3.91 3.93 4.74 4.63 4.89 5.25 4.68 4.580.00 4.03 6.04 5.53 6.36 7.31 6.76 8.38 7.85 8.52 8.64 9.24
75 Hardware 1.86 2.34 2.60 1.73 1.46 1.34 2.00 2.04 1.79 1.89 1.85 1.930.00 1.49 2.53 3.20 3.41 3.71 3.52 4.30 4.40 4.66 4.35 4.66
76 Boilers and turbine 4.70 5.71 5.28 6.79 5.28 5.09 5.11 5.44 5.15 5.56 4.53 4.610.00 4.05 4.91 6.60 6.88 7.41 6.13 7.98 7.37 7.76 7.19 7.88
77 Aircraft engines 3.49 4.45 4.46 5.08 4.92 4.17 4.03 4.37 3.90 3.53 3.69 4.200.00 3.87 4.93 6.67 7.18 7.32 7.46 8.92 9.32 9.40 8.67 8.78
78 Internal combust eg 3.00 4.12 4.46 4.00 3.40 4.12 4.51 3.49 3.58 3.45 3.81 3.670.00 3.07 4.42 6.03 6.74 6.97 6.88 7.93 8.39 8.51 8.78 8.62
79 Other power machine 7.07 7.89 5.21 4.98 5.71 5.16 6.67 5.95 8.01 5.17 6.21 5.710.00 6.79 7.63 8.53 10.39 10.10 9.87 11.65 13.06 9.84 9.97 10.32
80 Agricultural machin 2.40 3.61 3.09 2.97 2.35 2.23 3.14 3.73 3.33 2.46 2.70 3.590.00 2.88 3.88 5.08 4.79 5.93 5.38 6.56 6.55 6.59 6.27 6.59
INFORUM November 199539
Table 11: (continued)
SECTOR TITLE 1980 1981 1982 1983 1984 1985 1986 1987 1988 1989 1990 1991
81 Construction equip 2.36 3.40 2.96 3.09 2.74 2.37 3.66 2.75 2.69 3.22 2.90 2.960.00 2.87 3.72 4.98 5.57 6.06 5.57 6.52 6.21 6.73 6.67 6.76
82 Metalworking machin 2.27 3.01 2.64 2.76 2.29 1.83 2.58 2.50 2.23 1.87 2.20 3.060.00 2.69 3.22 3.53 4.04 3.75 3.67 4.65 4.75 5.39 5.31 5.26
83 Sewing machines 3.79 4.37 4.19 2.86 3.03 2.96 3.15 3.31 3.46 3.81 3.72 4.020.00 3.54 3.02 3.94 4.31 4.39 4.62 5.98 6.29 6.74 6.87 7.00
84 Textile machinery 2.91 3.11 2.99 2.76 3.25 2.27 2.64 2.73 2.67 2.68 3.22 3.380.00 2.64 3.88 3.91 5.07 4.70 4.23 5.10 5.21 5.38 6.19 6.05
85 Paper mill machines 4.99 4.52 5.41 4.21 3.55 3.74 4.13 4.31 3.91 4.31 3.43 4.460.00 4.22 5.29 5.41 5.03 4.75 4.86 6.53 6.83 7.14 7.24 6.19
86 Printing machines 2.79 3.36 2.90 2.87 2.41 2.49 3.07 3.00 2.71 2.98 2.75 3.040.00 3.84 4.27 5.34 5.56 6.19 6.00 6.53 6.49 6.65 6.42 6.30
87 Food-processing mach3.04 3.45 2.29 2.78 2.09 2.61 2.57 2.52 2.56 2.24 2.88 2.500.00 3.24 3.52 4.82 4.32 5.12 4.39 5.52 5.72 5.75 5.90 5.76
88 Other special mach 3.70 4.55 4.90 3.87 3.38 2.98 3.80 4.79 4.38 4.16 4.28 5.190.00 2.12 3.95 3.68 4.15 4.32 4.85 5.83 6.11 6.70 6.32 6.45
89 Service ind. machin 1.73 2.42 2.12 1.95 1.73 1.62 2.15 2.38 2.34 2.36 2.56 3.290.00 2.27 3.12 3.43 3.66 4.07 3.87 4.98 4.71 5.07 5.13 5.43
90 Pumps 1.70 2.38 2.32 2.27 1.93 1.81 2.78 2.19 2.16 2.69 2.49 3.060.00 2.21 2.99 3.88 4.42 4.68 4.61 5.29 4.86 5.28 5.08 5.24
91 Mechanical hand. eq 2.57 3.15 3.35 2.81 3.19 2.99 3.00 2.74 3.05 2.88 2.85 3.130.00 3.45 4.83 4.89 5.54 5.63 5.64 6.33 6.20 6.17 5.89 5.96
92 Other non-elec mach 1.93 2.38 2.38 2.00 2.03 2.45 2.57 2.67 2.12 2.26 2.16 2.140.00 1.96 3.03 3.45 3.98 4.08 4.03 4.98 5.06 5.33 5.15 5.47
93 Radio,TV,phonograph 2.67 3.96 4.63 4.06 3.21 3.27 4.08 3.93 3.18 2.46 3.08 3.830.00 2.31 3.72 4.40 4.25 4.17 3.91 5.53 7.66 8.47 9.20 9.98
94 Other telecom eq 4.02 4.85 4.45 3.90 4.10 2.83 3.05 3.94 3.34 3.63 4.03 4.700.00 3.61 3.70 4.81 5.20 4.85 4.58 6.50 7.10 7.20 7.78 7.93
95 Household appliance 3.01 2.87 3.63 3.51 3.41 3.44 3.32 4.20 3.64 3.71 3.88 5.100.00 2.12 3.00 3.63 4.37 4.49 4.37 6.00 7.07 7.43 7.31 7.47
96 Computers 3.43 4.95 4.84 4.44 4.15 4.21 4.22 4.05 3.66 3.35 3.54 4.100.00 3.15 3.96 4.88 5.42 6.70 7.47 8.21 8.67 8.93 9.88 10.13
97 Other office machin 4.30 4.55 4.90 4.91 4.74 5.36 4.04 4.15 4.27 4.28 4.03 6.150.00 3.29 4.41 5.34 6.19 7.22 6.63 8.59 8.86 8.49 8.38 8.69
98 Semiconductors 5.05 5.01 5.31 4.30 4.03 4.96 4.36 4.02 3.38 2.88 3.28 4.170.00 3.91 3.52 4.39 4.85 5.51 6.23 7.09 7.65 7.87 8.12 8.30
99 Electric motors 4.72 4.64 4.63 4.21 3.59 3.63 4.07 5.27 4.83 4.78 5.14 4.900.00 2.61 3.83 4.08 4.10 4.64 4.84 6.91 6.83 6.84 6.95 7.34
100 Batteries 4.54 4.98 6.22 5.00 4.71 5.01 4.34 4.94 4.28 4.38 3.83 4.380.00 3.25 5.20 5.60 5.80 6.88 6.95 7.76 7.62 7.99 8.11 8.34
INFORUM November 199540
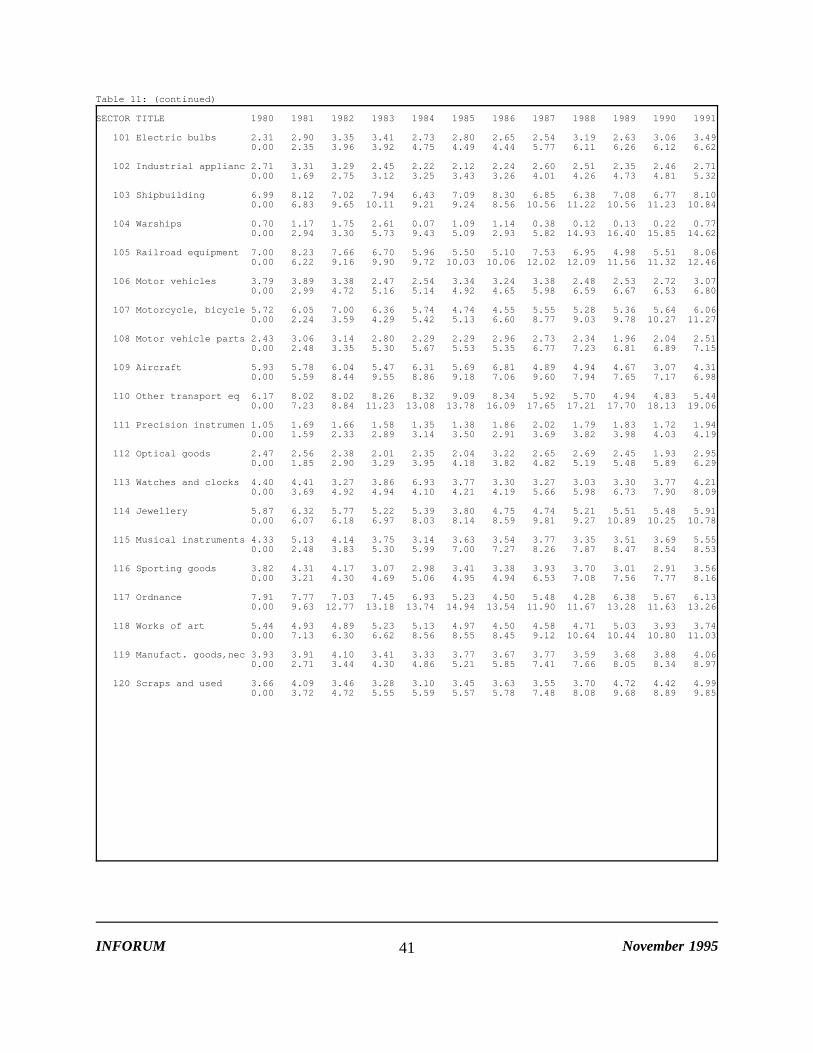
Table 11: (continued)
SECTOR TITLE 1980 1981 1982 1983 1984 1985 1986 1987 1988 1989 1990 1991
101 Electric bulbs 2.31 2.90 3.35 3.41 2.73 2.80 2.65 2.54 3.19 2.63 3.06 3.490.00 2.35 3.96 3.92 4.75 4.49 4.44 5.77 6.11 6.26 6.12 6.62
102 Industrial applianc 2.71 3.31 3.29 2.45 2.22 2.12 2.24 2.60 2.51 2.35 2.46 2.710.00 1.69 2.75 3.12 3.25 3.43 3.26 4.01 4.26 4.73 4.81 5.32
103 Shipbuilding 6.99 8.12 7.02 7.94 6.43 7.09 8.30 6.85 6.38 7.08 6.77 8.100.00 6.83 9.65 10.11 9.21 9.24 8.56 10.56 11.22 10.56 11.23 10.84
104 Warships 0.70 1.17 1.75 2.61 0.07 1.09 1.14 0.38 0.12 0.13 0.22 0.770.00 2.94 3.30 5.73 9.43 5.09 2.93 5.82 14.93 16.40 15.85 14.62
105 Railroad equipment 7.00 8.23 7.66 6.70 5.96 5.50 5.10 7.53 6.95 4.98 5.51 8.060.00 6.22 9.16 9.90 9.72 10.03 10.06 12.02 12.09 11.56 11.32 12.46
106 Motor vehicles 3.79 3.89 3.38 2.47 2.54 3.34 3.24 3.38 2.48 2.53 2.72 3.070.00 2.99 4.72 5.16 5.14 4.92 4.65 5.98 6.59 6.67 6.53 6.80
107 Motorcycle, bicycle 5.72 6.05 7.00 6.36 5.74 4.74 4.55 5.55 5.28 5.36 5.64 6.060.00 2.24 3.59 4.29 5.42 5.13 6.60 8.77 9.03 9.78 10.27 11.27
108 Motor vehicle parts 2.43 3.06 3.14 2.80 2.29 2.29 2.96 2.73 2.34 1.96 2.04 2.510.00 2.48 3.35 5.30 5.67 5.53 5.35 6.77 7.23 6.81 6.89 7.15
109 Aircraft 5.93 5.78 6.04 5.47 6.31 5.69 6.81 4.89 4.94 4.67 3.07 4.310.00 5.59 8.44 9.55 8.86 9.18 7.06 9.60 7.94 7.65 7.17 6.98
110 Other transport eq 6.17 8.02 8.02 8.26 8.32 9.09 8.34 5.92 5.70 4.94 4.83 5.440.00 7.23 8.84 11.23 13.08 13.78 16.09 17.65 17.21 17.70 18.13 19.06
111 Precision instrumen 1.05 1.69 1.66 1.58 1.35 1.38 1.86 2.02 1.79 1.83 1.72 1.940.00 1.59 2.33 2.89 3.14 3.50 2.91 3.69 3.82 3.98 4.03 4.19
112 Optical goods 2.47 2.56 2.38 2.01 2.35 2.04 3.22 2.65 2.69 2.45 1.93 2.950.00 1.85 2.90 3.29 3.95 4.18 3.82 4.82 5.19 5.48 5.89 6.29
113 Watches and clocks 4.40 4.41 3.27 3.86 6.93 3.77 3.30 3.27 3.03 3.30 3.77 4.210.00 3.69 4.92 4.94 4.10 4.21 4.19 5.66 5.98 6.73 7.90 8.09
114 Jewellery 5.87 6.32 5.77 5.22 5.39 3.80 4.75 4.74 5.21 5.51 5.48 5.910.00 6.07 6.18 6.97 8.03 8.14 8.59 9.81 9.27 10.89 10.25 10.78
115 Musical instruments 4.33 5.13 4.14 3.75 3.14 3.63 3.54 3.77 3.35 3.51 3.69 5.550.00 2.48 3.83 5.30 5.99 7.00 7.27 8.26 7.87 8.47 8.54 8.53
116 Sporting goods 3.82 4.31 4.17 3.07 2.98 3.41 3.38 3.93 3.70 3.01 2.91 3.560.00 3.21 4.30 4.69 5.06 4.95 4.94 6.53 7.08 7.56 7.77 8.16
117 Ordnance 7.91 7.77 7.03 7.45 6.93 5.23 4.50 5.48 4.28 6.38 5.67 6.130.00 9.63 12.77 13.18 13.74 14.94 13.54 11.90 11.67 13.28 11.63 13.26
118 Works of art 5.44 4.93 4.89 5.23 5.13 4.97 4.50 4.58 4.71 5.03 3.93 3.740.00 7.13 6.30 6.62 8.56 8.55 8.45 9.12 10.64 10.44 10.80 11.03
119 Manufact. goods,nec 3.93 3.91 4.10 3.41 3.33 3.77 3.67 3.77 3.59 3.68 3.88 4.060.00 2.71 3.44 4.30 4.86 5.21 5.85 7.41 7.66 8.05 8.34 8.97
120 Scraps and used 3.66 4.09 3.46 3.28 3.10 3.45 3.63 3.55 3.70 4.72 4.42 4.990.00 3.72 4.72 5.55 5.59 5.57 5.78 7.48 8.08 9.68 8.89 9.85
INFORUM November 199541
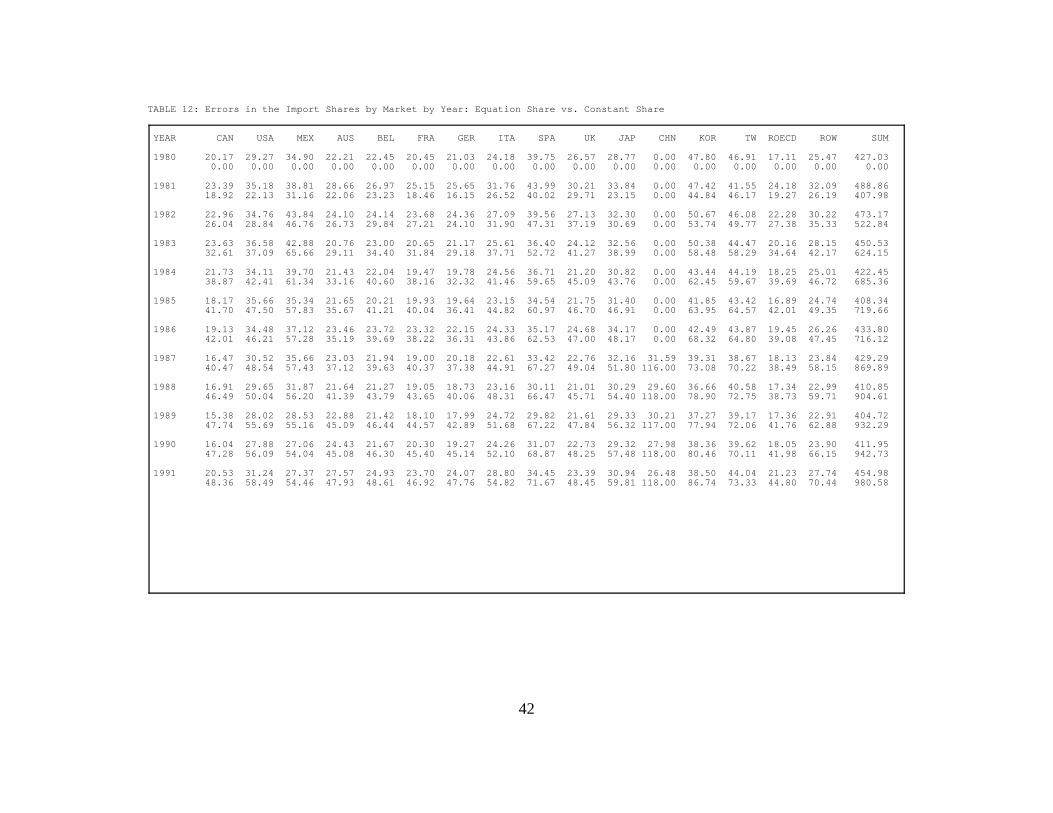
TABLE 12: Errors in the Import Shares by Market by Year: Equation Share vs. Constant Share
YEAR CAN USA MEX AUS BEL FRA GER ITA SPA UK JAP CHN KOR TW ROECD ROW SUM
1980 20.17 29.27 34.90 22.21 22.45 20.45 21.03 24.18 39.75 26.57 28.77 0.00 47.80 46.91 17.11 25.47 427.030.00 0.00 0.00 0.00 0.00 0.00 0.00 0.00 0.00 0.00 0.00 0.00 0.00 0.00 0.00 0.00 0.00
1981 23.39 35.18 38.81 28.66 26.97 25.15 25.65 31.76 43.99 30.21 33.84 0.00 47.42 41.55 24.18 32.09 488.8618.92 22.13 31.16 22.06 23.23 18.46 16.15 26.52 40.02 29.71 23.15 0.00 44.84 46.17 19.27 26.19 407.98
1982 22.96 34.76 43.84 24.10 24.14 23.68 24.36 27.09 39.56 27.13 32.30 0.00 50.67 46.08 22.28 30.22 473.1726.04 28.84 46.76 26.73 29.84 27.21 24.10 31.90 47.31 37.19 30.69 0.00 53.74 49.77 27.38 35.33 522.84
1983 23.63 36.58 42.88 20.76 23.00 20.65 21.17 25.61 36.40 24.12 32.56 0.00 50.38 44.47 20.16 28.15 450.5332.61 37.09 65.66 29.11 34.40 31.84 29.18 37.71 52.72 41.27 38.99 0.00 58.48 58.29 34.64 42.17 624.15
1984 21.73 34.11 39.70 21.43 22.04 19.47 19.78 24.56 36.71 21.20 30.82 0.00 43.44 44.19 18.25 25.01 422.4538.87 42.41 61.34 33.16 40.60 38.16 32.32 41.46 59.65 45.09 43.76 0.00 62.45 59.67 39.69 46.72 685.36
1985 18.17 35.66 35.34 21.65 20.21 19.93 19.64 23.15 34.54 21.75 31.40 0.00 41.85 43.42 16.89 24.74 408.3441.70 47.50 57.83 35.67 41.21 40.04 36.41 44.82 60.97 46.70 46.91 0.00 63.95 64.57 42.01 49.35 719.66
1986 19.13 34.48 37.12 23.46 23.72 23.32 22.15 24.33 35.17 24.68 34.17 0.00 42.49 43.87 19.45 26.26 433.8042.01 46.21 57.28 35.19 39.69 38.22 36.31 43.86 62.53 47.00 48.17 0.00 68.32 64.80 39.08 47.45 716.12
1987 16.47 30.52 35.66 23.03 21.94 19.00 20.18 22.61 33.42 22.76 32.16 31.59 39.31 38.67 18.13 23.84 429.2940.47 48.54 57.43 37.12 39.63 40.37 37.38 44.91 67.27 49.04 51.80 116.00 73.08 70.22 38.49 58.15 869.89
1988 16.91 29.65 31.87 21.64 21.27 19.05 18.73 23.16 30.11 21.01 30.29 29.60 36.66 40.58 17.34 22.99 410.8546.49 50.04 56.20 41.39 43.79 43.65 40.06 48.31 66.47 45.71 54.40 118.00 78.90 72.75 38.73 59.71 904.61
1989 15.38 28.02 28.53 22.88 21.42 18.10 17.99 24.72 29.82 21.61 29.33 30.21 37.27 39.17 17.36 22.91 404.7247.74 55.69 55.16 45.09 46.44 44.57 42.89 51.68 67.22 47.84 56.32 117.00 77.94 72.06 41.76 62.88 932.29
1990 16.04 27.88 27.06 24.43 21.67 20.30 19.27 24.26 31.07 22.73 29.32 27.98 38.36 39.62 18.05 23.90 411.9547.28 56.09 54.04 45.08 46.30 45.40 45.14 52.10 68.87 48.25 57.48 118.00 80.46 70.11 41.98 66.15 942.73
1991 20.53 31.24 27.37 27.57 24.93 23.70 24.07 28.80 34.45 23.39 30.94 26.48 38.50 44.04 21.23 27.74 454.9848.36 58.49 54.46 47.93 48.61 46.92 47.76 54.82 71.67 48.45 59.81 118.00 86.74 73.33 44.80 70.44 980.58
42
that the lower limit of this sum total is zero, while its upper limit is 32 ( = 16 x 2). Note alsothat within each sector, the first line indicates the sum of the "l-norm" of vector c for theequation-share based trade model, and the second line shows the sum of the "l-norm" of vectorc for the simulation results based on the constant share approach. As the constant shares usedare those for the year 1980, the first number on the second line for each sector is always zero,because the predicted share is the actual share in 1980 in the alternative historical simulation.
Even a casual examination of Table 11 will reveal the substantial improvements in thepredictive accuracy obtained by the current equation share based trade model over the simplerapproach based on the constant share. Note also that while the trade model’s predictive errorsin import shares tend to be fairly stable over time in every trade sector, the errors resulted fromthe constant-share approach appear to be an increasing function of time across all trade sectors.
Table 12 presents the sum of the "l-norm" of vector c over all 120 trade sectors for eachimport market for each of the 12 years in the historical simulation period. Note that the lowerlimit of this sum total is zero, while the upper limit of this sum is 240 ( = 120 x 2). Note alsothat within each year, the first line indicates the sum of the "l-norm" of vector c over all sectorsfor the equation-share based trade model, and the second line shows the sum of the "l-norm" ofvector c for the simulation results based on the constant share approach. As the constant sharesused are those for the year 1980, the second line for the year 1980 for each import market isalways zero, because the predicted share is the actual share in 1980 in the alternative historicalsimulation.
Note that the last column of Table 12 lists the sum total by row. Each row sum correspondsto the sum of the "l-norm" of vector c over all sectors and all import markets in each year.Again, we observe that as time progresses, the improvement in the predictive accuracy in importshare obtained by the equation-based trade model over the simpler approach based on theconstant share grows more and more pronounced. By 1991, the error resulted from the constant-share approach is more than twice as large as that produced by the equation-share based trademodel. And if we add up these errors over the 12 years in the historical simulation period, thenfor the constant-share approach, the sum is equal to 8,305.41, which is nearly twice as large asthe corresponding error sum for the equation-based trade model (4,788.86). The moral of theforegone analysis should be clear by now: when dealing with trade flows, constant shares are nota good assumption.
Errors in Exports
Ultimately, the trade model is developed to forecast exports for each country in the linkedinternational system. Therefore, the predictive accuracy of the trade model from the exporter sideshould also be examined. The statistic used here is normalized root mean square error (NRMSE),defined as follows:where,
INFORUM November 199543
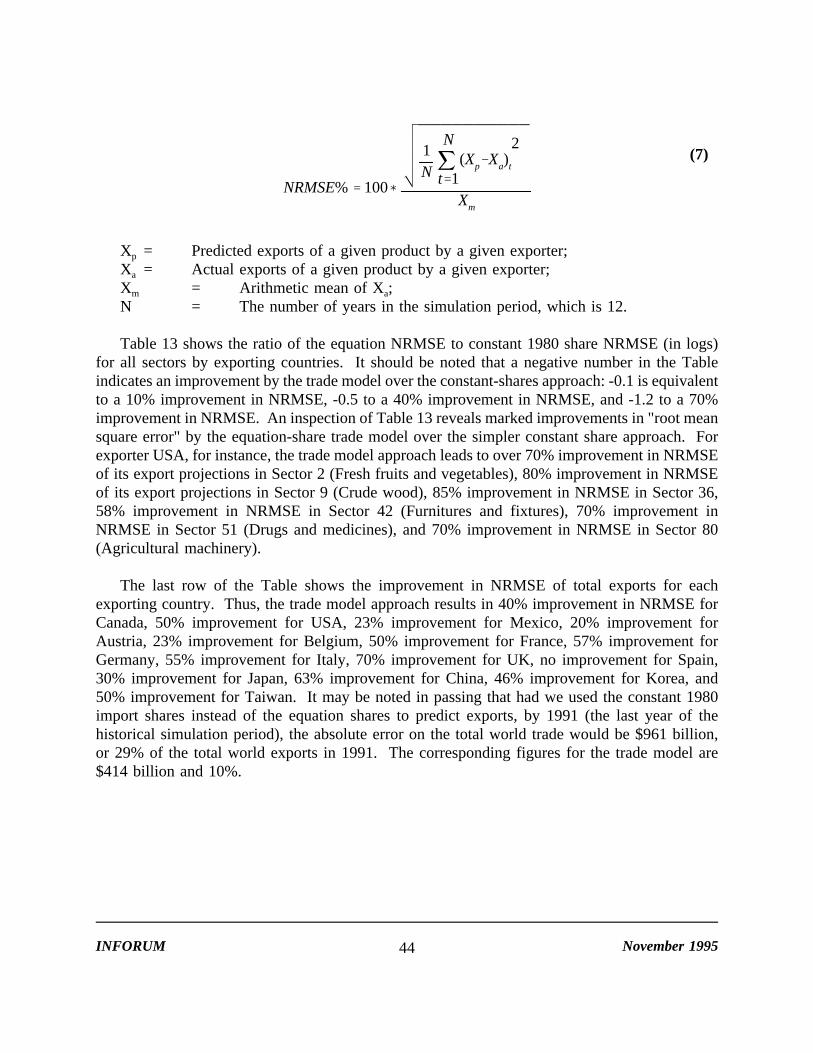
Xp = Predicted exports of a given product by a given exporter;
(7)
NRMSE% 100
1N
N
t 1(Xp Xa)t
2
Xm
Xa = Actual exports of a given product by a given exporter;Xm = Arithmetic mean of Xa;N = The number of years in the simulation period, which is 12.
Table 13 shows the ratio of the equation NRMSE to constant 1980 share NRMSE (in logs)for all sectors by exporting countries. It should be noted that a negative number in the Tableindicates an improvement by the trade model over the constant-shares approach: -0.1 is equivalentto a 10% improvement in NRMSE, -0.5 to a 40% improvement in NRMSE, and -1.2 to a 70%improvement in NRMSE. An inspection of Table 13 reveals marked improvements in "root meansquare error" by the equation-share trade model over the simpler constant share approach. Forexporter USA, for instance, the trade model approach leads to over 70% improvement in NRMSEof its export projections in Sector 2 (Fresh fruits and vegetables), 80% improvement in NRMSEof its export projections in Sector 9 (Crude wood), 85% improvement in NRMSE in Sector 36,58% improvement in NRMSE in Sector 42 (Furnitures and fixtures), 70% improvement inNRMSE in Sector 51 (Drugs and medicines), and 70% improvement in NRMSE in Sector 80(Agricultural machinery).
The last row of the Table shows the improvement in NRMSE of total exports for eachexporting country. Thus, the trade model approach results in 40% improvement in NRMSE forCanada, 50% improvement for USA, 23% improvement for Mexico, 20% improvement forAustria, 23% improvement for Belgium, 50% improvement for France, 57% improvement forGermany, 55% improvement for Italy, 70% improvement for UK, no improvement for Spain,30% improvement for Japan, 63% improvement for China, 46% improvement for Korea, and50% improvement for Taiwan. It may be noted in passing that had we used the constant 1980import shares instead of the equation shares to predict exports, by 1991 (the last year of thehistorical simulation period), the absolute error on the total world trade would be $961 billion,or 29% of the total world exports in 1991. The corresponding figures for the trade model are$414 billion and 10%.
INFORUM November 199544
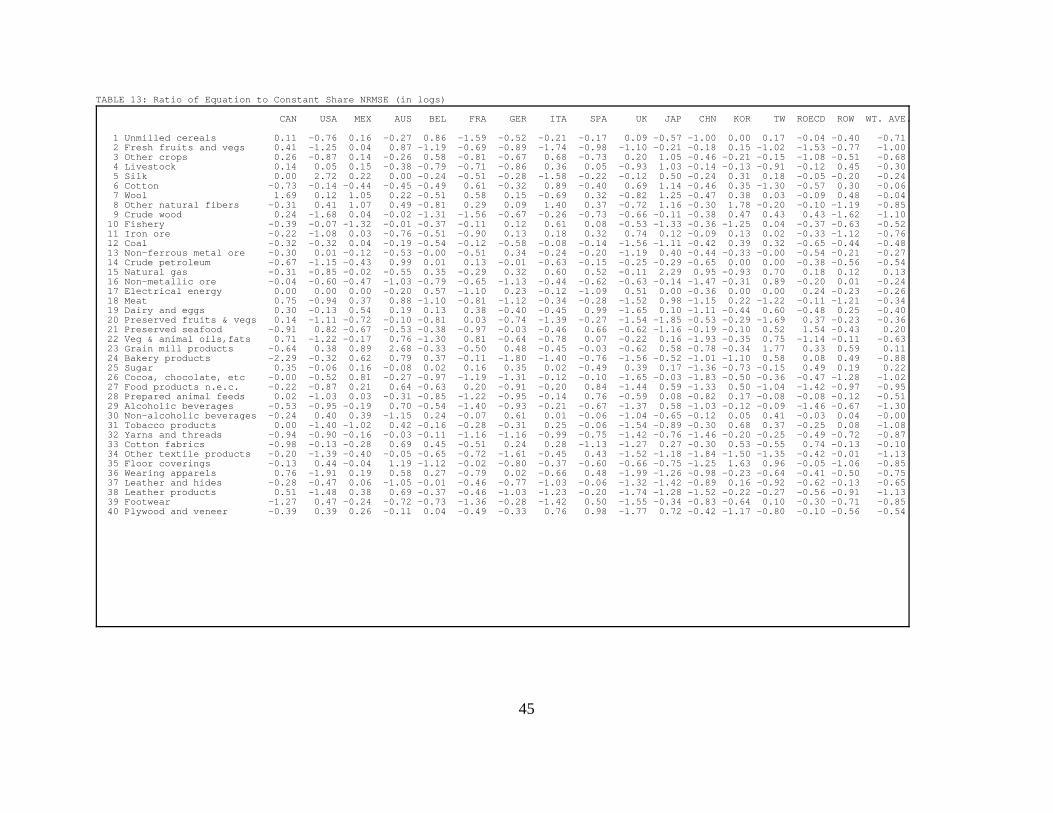
TABLE 13: Ratio of Equation to Constant Share NRMSE (in logs)
CAN USA MEX AUS BEL FRA GER ITA SPA UK JAP CHN KOR TW ROECD ROW WT. AVE.
1 Unmilled cereals 0.11 -0.76 0.16 -0.27 0.86 -1.59 -0.52 -0.21 -0.17 0.09 -0.57 -1.00 0.00 0.17 -0.04 -0.40 -0.712 Fresh fruits and vegs 0.41 -1.25 0.04 0.87 -1.19 -0.69 -0.89 -1.74 -0.98 -1.10 -0.21 -0.18 0.15 -1.02 -1.53 -0.77 -1.003 Other crops 0.26 -0.87 0.14 -0.26 0.58 -0.81 -0.67 0.68 -0.73 0.20 1.05 -0.46 -0.21 -0.15 -1.08 -0.51 -0.684 Livestock 0.14 0.05 0.15 -0.38 -0.79 -0.71 -0.86 0.36 0.05 -0.93 1.03 -0.14 -0.13 -0.91 -0.12 0.45 -0.305 Silk 0.00 2.72 0.22 0.00 -0.24 -0.51 -0.28 -1.58 -0.22 -0.12 0.50 -0.24 0.31 0.18 -0.05 -0.20 -0.246 Cotton -0.73 -0.14 -0.44 -0.45 -0.49 0.61 -0.32 0.89 -0.40 0.69 1.14 -0.46 0.35 -1.30 -0.57 0.30 -0.067 Wool 1.69 0.12 1.05 0.22 -0.51 0.58 0.15 -0.69 0.32 -0.82 1.25 -0.47 0.38 0.03 -0.09 0.48 -0.048 Other natural fibers -0.31 0.41 1.07 0.49 -0.81 0.29 0.09 1.40 0.37 -0.72 1.16 -0.30 1.78 -0.20 -0.10 -1.19 -0.859 Crude wood 0.24 -1.68 0.04 -0.02 -1.31 -1.56 -0.67 -0.26 -0.73 -0.66 -0.11 -0.38 0.47 0.43 0.43 -1.62 -1.1010 Fishery -0.39 -0.07 -1.32 -0.01 -0.37 -0.11 0.12 0.61 0.08 -0.53 -1.33 -0.36 -1.25 0.04 -0.37 -0.63 -0.5211 Iron ore -0.22 -1.08 0.03 -0.76 -0.51 -0.90 0.13 0.18 0.32 0.74 0.12 -0.09 0.13 0.02 -0.33 -1.12 -0.7612 Coal -0.32 -0.32 0.04 -0.19 -0.54 -0.12 -0.58 -0.08 -0.14 -1.56 -1.11 -0.42 0.39 0.32 -0.65 -0.44 -0.4813 Non-ferrous metal ore -0.30 0.01 -0.12 -0.53 -0.00 -0.51 0.34 -0.24 -0.20 -1.19 0.40 -0.44 -0.33 -0.00 -0.54 -0.21 -0.2714 Crude petroleum -0.67 -1.15 -0.43 0.99 0.01 0.13 -0.01 -0.63 -0.15 -0.25 -0.29 -0.65 0.00 0.00 -0.38 -0.56 -0.5415 Natural gas -0.31 -0.85 -0.02 -0.55 0.35 -0.29 0.32 0.60 0.52 -0.11 2.29 0.95 -0.93 0.70 0.18 0.12 0.1316 Non-metallic ore -0.04 -0.60 -0.47 -1.03 -0.79 -0.65 -1.13 -0.44 -0.62 -0.63 -0.14 -1.47 -0.31 0.89 -0.20 0.01 -0.2417 Electrical energy 0.00 0.00 0.00 -0.20 0.57 -1.10 0.23 -0.12 -1.09 0.51 0.00 -0.36 0.00 0.00 0.24 -0.23 -0.2618 Meat 0.75 -0.94 0.37 0.88 -1.10 -0.81 -1.12 -0.34 -0.28 -1.52 0.98 -1.15 0.22 -1.22 -0.11 -1.21 -0.3419 Dairy and eggs 0.30 -0.13 0.54 0.19 0.13 0.38 -0.40 -0.45 0.99 -1.65 0.10 -1.11 -0.44 0.60 -0.48 0.25 -0.4020 Preserved fruits & vegs 0.14 -1.11 -0.72 -0.10 -0.81 0.03 -0.74 -1.39 -0.27 -1.54 -1.85 -0.53 -0.29 -1.69 0.37 -0.23 -0.3621 Preserved seafood -0.91 0.82 -0.67 -0.53 -0.38 -0.97 -0.03 -0.46 0.66 -0.62 -1.16 -0.19 -0.10 0.52 1.54 -0.43 0.2022 Veg & animal oils,fats 0.71 -1.22 -0.17 0.76 -1.30 0.81 -0.64 -0.78 0.07 -0.22 0.16 -1.93 -0.35 0.75 -1.14 -0.11 -0.6323 Grain mill products -0.64 0.38 0.89 2.68 -0.33 -0.50 0.48 -0.45 -0.03 -0.62 0.58 -0.78 -0.34 1.77 0.33 0.59 0.1124 Bakery products -2.29 -0.32 0.62 0.79 0.37 -0.11 -1.80 -1.40 -0.76 -1.56 -0.52 -1.01 -1.10 0.58 0.08 0.49 -0.8825 Sugar 0.35 -0.06 0.16 -0.08 0.02 0.16 0.35 0.02 -0.49 0.39 0.17 -1.36 -0.73 -0.15 0.49 0.19 0.2226 Cocoa, chocolate, etc -0.00 -0.52 0.81 -0.27 -0.97 -1.19 -1.31 -0.12 -0.10 -1.65 -0.03 -1.83 -0.50 -0.36 -0.47 -1.28 -1.0227 Food products n.e.c. -0.22 -0.87 0.21 0.64 -0.63 0.20 -0.91 -0.20 0.84 -1.44 0.59 -1.33 0.50 -1.04 -1.42 -0.97 -0.9528 Prepared animal feeds 0.02 -1.03 0.03 -0.31 -0.85 -1.22 -0.95 -0.14 0.76 -0.59 0.08 -0.82 0.17 -0.08 -0.08 -0.12 -0.5129 Alcoholic beverages -0.53 -0.95 -0.19 0.70 -0.54 -1.40 -0.93 -0.21 -0.67 -1.37 0.58 -1.03 -0.12 -0.09 -1.46 -0.67 -1.3030 Non-alcoholic beverages -0.24 0.40 0.39 -1.15 0.24 -0.07 0.61 0.01 -0.06 -1.04 -0.65 -0.12 0.05 0.41 -0.03 0.04 -0.0031 Tobacco products 0.00 -1.40 -1.02 0.42 -0.16 -0.28 -0.31 0.25 -0.06 -1.54 -0.89 -0.30 0.68 0.37 -0.25 0.08 -1.0832 Yarns and threads -0.94 -0.90 -0.16 -0.03 -0.11 -1.16 -1.16 -0.99 -0.75 -1.42 -0.76 -1.46 -0.20 -0.25 -0.49 -0.72 -0.8733 Cotton fabrics -0.98 -0.13 -0.28 0.69 0.45 -0.51 0.24 0.28 -1.13 -1.27 0.27 -0.30 0.53 -0.55 0.74 -0.13 -0.1034 Other textile products -0.20 -1.39 -0.40 -0.05 -0.65 -0.72 -1.61 -0.45 0.43 -1.52 -1.18 -1.84 -1.50 -1.35 -0.42 -0.01 -1.1335 Floor coverings -0.13 0.44 -0.04 1.19 -1.12 -0.02 -0.80 -0.37 -0.60 -0.66 -0.75 -1.25 1.63 0.96 -0.05 -1.06 -0.8536 Wearing apparels 0.76 -1.91 0.19 0.58 0.27 -0.79 0.02 -0.66 0.48 -1.99 -1.26 -0.98 -0.23 -0.64 -0.41 -0.50 -0.7537 Leather and hides -0.28 -0.47 0.06 -1.05 -0.01 -0.46 -0.77 -1.03 -0.06 -1.32 -1.42 -0.89 0.16 -0.92 -0.62 -0.13 -0.6538 Leather products 0.51 -1.48 0.38 0.69 -0.37 -0.46 -1.03 -1.23 -0.20 -1.74 -1.28 -1.52 -0.22 -0.27 -0.56 -0.91 -1.1339 Footwear -1.27 0.47 -0.24 -0.72 -0.73 -1.36 -0.28 -1.42 0.50 -1.55 -0.34 -0.83 -0.64 0.10 -0.30 -0.71 -0.8540 Plywood and veneer -0.39 0.39 0.26 -0.11 0.04 -0.49 -0.33 0.76 0.98 -1.77 0.72 -0.42 -1.17 -0.80 -0.10 -0.56 -0.54
45
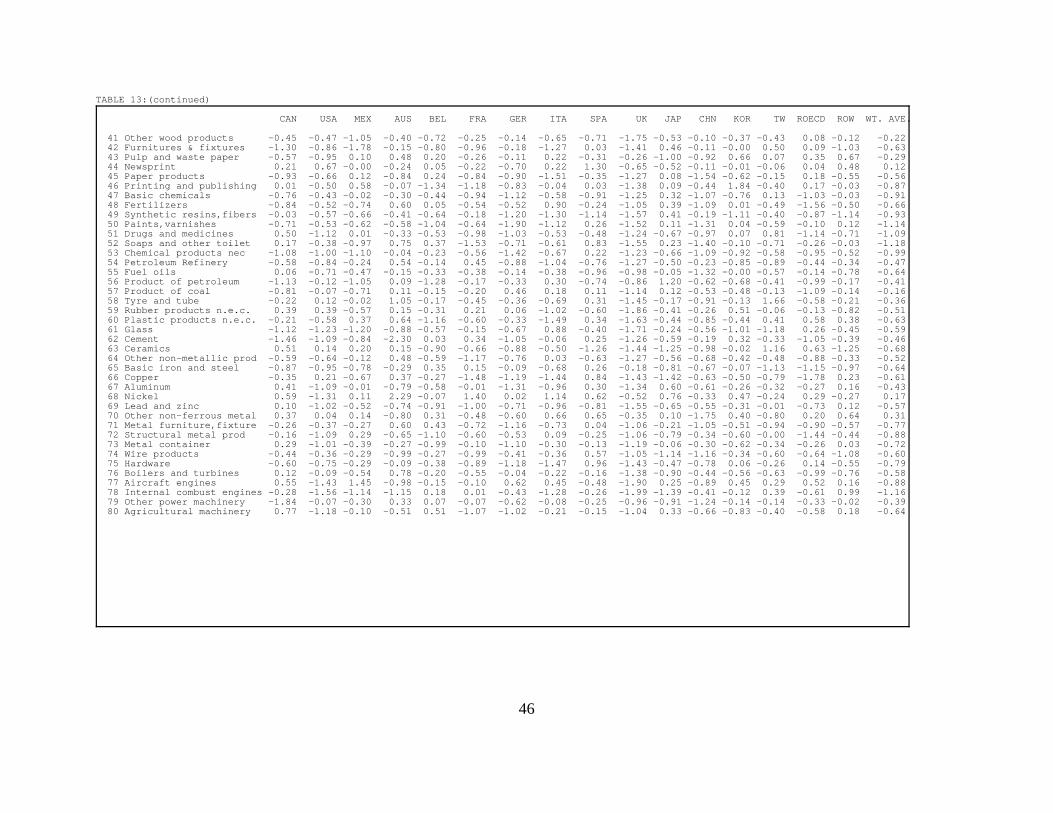
TABLE 13:(continued)
CAN USA MEX AUS BEL FRA GER ITA SPA UK JAP CHN KOR TW ROECD ROW WT. AVE.
41 Other wood products -0.45 -0.47 -1.05 -0.40 -0.72 -0.25 -0.14 -0.65 -0.71 -1.75 -0.53 -0.10 -0.37 -0.43 0.08 -0.12 -0.2242 Furnitures & fixtures -1.30 -0.86 -1.78 -0.15 -0.80 -0.96 -0.18 -1.27 0.03 -1.41 0.46 -0.11 -0.00 0.50 0.09 -1.03 -0.6343 Pulp and waste paper -0.57 -0.95 0.10 0.48 0.20 -0.26 -0.11 0.22 -0.31 -0.26 -1.00 -0.92 0.66 0.07 0.35 0.67 -0.2944 Newsprint 0.21 0.67 -0.00 -0.24 0.05 -0.22 -0.70 0.22 1.30 -0.65 -0.52 -0.11 -0.01 -0.06 0.04 0.48 0.1245 Paper products -0.93 -0.66 0.12 -0.84 0.24 -0.84 -0.90 -1.51 -0.35 -1.27 0.08 -1.54 -0.62 -0.15 0.18 -0.55 -0.5646 Printing and publishing 0.01 -0.50 0.58 -0.07 -1.34 -1.18 -0.83 -0.04 0.03 -1.38 0.09 -0.44 1.84 -0.40 0.17 -0.03 -0.8747 Basic chemicals -0.76 -0.43 -0.02 -0.30 -0.44 -0.94 -1.12 -0.58 -0.91 -1.25 0.32 -1.07 -0.76 0.13 -1.03 -0.03 -0.9148 Fertilizers -0.84 -0.52 -0.74 0.60 0.05 -0.54 -0.52 0.90 -0.24 -1.05 0.39 -1.09 0.01 -0.49 -1.56 -0.50 -0.6649 Synthetic resins,fibers -0.03 -0.57 -0.66 -0.41 -0.64 -0.18 -1.20 -1.30 -1.14 -1.57 0.41 -0.19 -1.11 -0.40 -0.87 -1.14 -0.9350 Paints,varnishes -0.71 -0.53 -0.62 -0.58 -1.04 -0.64 -1.90 -1.12 0.26 -1.52 0.11 -1.31 0.04 -0.59 -0.10 0.12 -1.1451 Drugs and medicines 0.50 -1.12 0.01 -0.33 -0.53 -0.98 -1.03 -0.53 -0.48 -1.24 -0.67 -0.97 0.07 0.81 -1.14 -0.71 -1.0952 Soaps and other toilet 0.17 -0.38 -0.97 0.75 0.37 -1.53 -0.71 -0.61 0.83 -1.55 0.23 -1.40 -0.10 -0.71 -0.26 -0.03 -1.1853 Chemical products nec -1.08 -1.00 -1.10 -0.04 -0.23 -0.56 -1.42 -0.67 0.22 -1.23 -0.66 -1.09 -0.92 -0.58 -0.95 -0.52 -0.9954 Petroleum Refinery -0.58 -0.84 -0.24 0.54 -0.14 0.45 -0.88 -1.04 -0.76 -1.27 -0.50 -0.23 -0.85 -0.89 -0.44 -0.34 -0.4755 Fuel oils 0.06 -0.71 -0.47 -0.15 -0.33 -0.38 -0.14 -0.38 -0.96 -0.98 -0.05 -1.32 -0.00 -0.57 -0.14 -0.78 -0.6456 Product of petroleum -1.13 -0.12 -1.05 0.09 -1.28 -0.17 -0.33 0.30 -0.74 -0.86 1.20 -0.62 -0.68 -0.41 -0.99 -0.17 -0.4157 Product of coal -0.81 -0.07 -0.71 0.11 -0.15 -0.20 0.46 0.18 0.11 -1.14 0.12 -0.53 -0.48 -0.13 -1.09 -0.14 -0.1658 Tyre and tube -0.22 0.12 -0.02 1.05 -0.17 -0.45 -0.36 -0.69 0.31 -1.45 -0.17 -0.91 -0.13 1.66 -0.58 -0.21 -0.3659 Rubber products n.e.c. 0.39 0.39 -0.57 0.15 -0.31 0.21 0.06 -1.02 -0.60 -1.86 -0.41 -0.26 0.51 -0.06 -0.13 -0.82 -0.5160 Plastic products n.e.c. -0.21 -0.58 0.37 0.64 -1.16 -0.60 -0.33 -1.49 0.34 -1.63 -0.44 -0.85 -0.44 0.41 0.58 0.38 -0.6361 Glass -1.12 -1.23 -1.20 -0.88 -0.57 -0.15 -0.67 0.88 -0.40 -1.71 -0.24 -0.56 -1.01 -1.18 0.26 -0.45 -0.5962 Cement -1.46 -1.09 -0.84 -2.30 0.03 0.34 -1.05 -0.06 0.25 -1.26 -0.59 -0.19 0.32 -0.33 -1.05 -0.39 -0.4663 Ceramics 0.51 0.14 0.20 0.15 -0.90 -0.66 -0.88 -0.50 -1.26 -1.44 -1.25 -0.98 -0.02 1.16 0.63 -1.25 -0.6864 Other non-metallic prod -0.59 -0.64 -0.12 0.48 -0.59 -1.17 -0.76 0.03 -0.63 -1.27 -0.56 -0.68 -0.42 -0.48 -0.88 -0.33 -0.5265 Basic iron and steel -0.87 -0.95 -0.78 -0.29 0.35 0.15 -0.09 -0.68 0.26 -0.18 -0.81 -0.67 -0.07 -1.13 -1.15 -0.97 -0.6466 Copper -0.35 0.21 -0.67 0.37 -0.27 -1.48 -1.19 -1.44 0.84 -1.43 -1.42 -0.63 -0.50 -0.79 -1.78 0.23 -0.6167 Aluminum 0.41 -1.09 -0.01 -0.79 -0.58 -0.01 -1.31 -0.96 0.30 -1.34 0.60 -0.61 -0.26 -0.32 -0.27 0.16 -0.4368 Nickel 0.59 -1.31 0.11 2.29 -0.07 1.40 0.02 1.14 0.62 -0.52 0.76 -0.33 0.47 -0.24 0.29 -0.27 0.1769 Lead and zinc 0.10 -1.02 -0.52 -0.74 -0.91 -1.00 -0.71 -0.96 -0.81 -1.55 -0.65 -0.55 -0.31 -0.01 -0.73 0.12 -0.5770 Other non-ferrous metal 0.37 0.04 0.14 -0.80 0.31 -0.48 -0.60 0.66 0.65 -0.35 0.10 -1.75 0.40 -0.80 0.20 0.64 0.3171 Metal furniture,fixture -0.26 -0.37 -0.27 0.60 0.43 -0.72 -1.16 -0.73 0.04 -1.06 -0.21 -1.05 -0.51 -0.94 -0.90 -0.57 -0.7772 Structural metal prod -0.16 -1.09 0.29 -0.65 -1.10 -0.60 -0.53 0.09 -0.25 -1.06 -0.79 -0.34 -0.60 -0.00 -1.44 -0.44 -0.8873 Metal container 0.29 -1.01 -0.39 -0.27 -0.99 -0.10 -1.10 -0.30 -0.13 -1.19 -0.06 -0.30 -0.62 -0.34 -0.26 0.03 -0.7274 Wire products -0.44 -0.36 -0.29 -0.99 -0.27 -0.99 -0.41 -0.36 0.57 -1.05 -1.14 -1.16 -0.34 -0.60 -0.64 -1.08 -0.6075 Hardware -0.60 -0.75 -0.29 -0.09 -0.38 -0.89 -1.18 -1.47 0.96 -1.43 -0.47 -0.78 0.06 -0.26 0.14 -0.55 -0.7976 Boilers and turbines 0.12 -0.09 -0.54 0.78 -0.20 -0.55 -0.04 -0.22 -0.16 -1.38 -0.90 -0.44 -0.56 -0.63 -0.99 -0.76 -0.5877 Aircraft engines 0.55 -1.43 1.45 -0.98 -0.15 -0.10 0.62 0.45 -0.48 -1.90 0.25 -0.89 0.45 0.29 0.52 0.16 -0.8878 Internal combust engines -0.28 -1.56 -1.14 -1.15 0.18 0.01 -0.43 -1.28 -0.26 -1.99 -1.39 -0.41 -0.12 0.39 -0.61 0.99 -1.1679 Other power machinery -1.84 -0.07 -0.30 0.33 0.07 -0.07 -0.62 -0.08 -0.25 -0.96 -0.91 -1.24 -0.14 -0.14 -0.33 -0.02 -0.3980 Agricultural machinery 0.77 -1.18 -0.10 -0.51 0.51 -1.07 -1.02 -0.21 -0.15 -1.04 0.33 -0.66 -0.83 -0.40 -0.58 0.18 -0.64
46
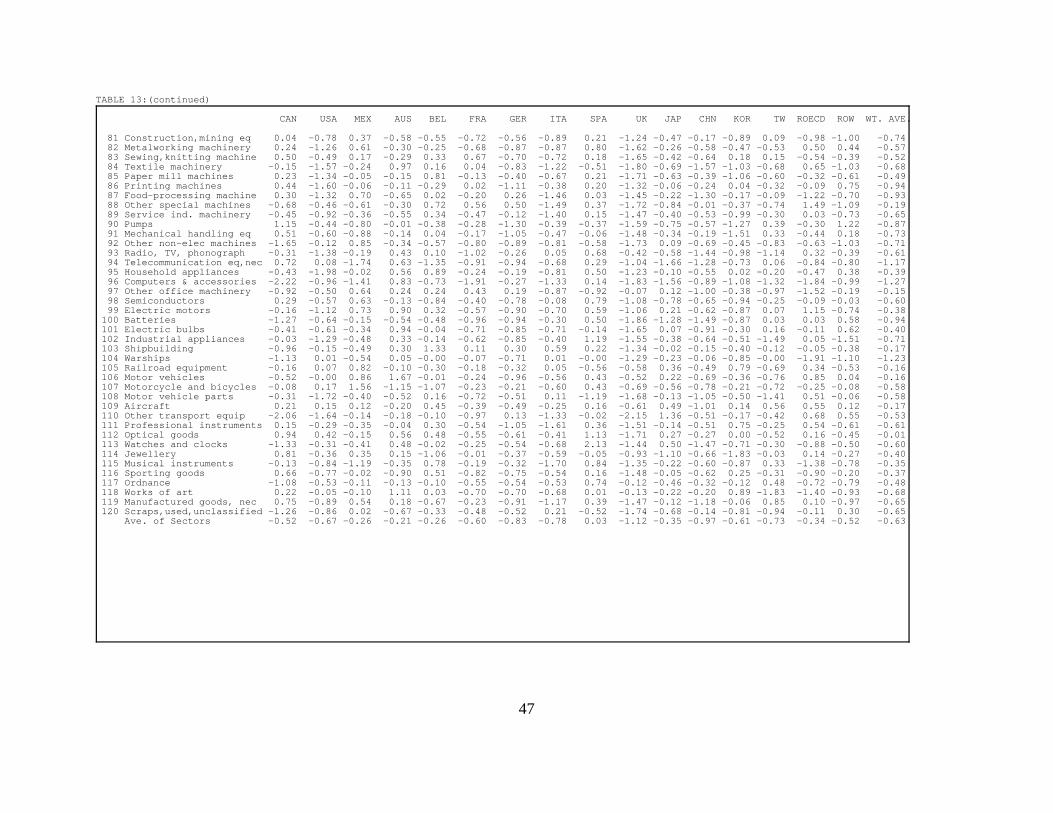
TABLE 13:(continued)
CAN USA MEX AUS BEL FRA GER ITA SPA UK JAP CHN KOR TW ROECD ROW WT. AVE.
81 Construction,mining eq 0.04 -0.78 0.37 -0.58 -0.55 -0.72 -0.56 -0.89 0.21 -1.24 -0.47 -0.17 -0.89 0.09 -0.98 -1.00 -0.7482 Metalworking machinery 0.24 -1.26 0.61 -0.30 -0.25 -0.68 -0.87 -0.87 0.80 -1.62 -0.26 -0.58 -0.47 -0.53 0.50 0.44 -0.5783 Sewing,knitting machine 0.50 -0.49 0.17 -0.29 0.33 0.67 -0.70 -0.72 0.18 -1.65 -0.42 -0.64 0.18 0.15 -0.54 -0.39 -0.5284 Textile machinery -0.15 -1.57 -0.24 0.97 0.16 0.04 -0.83 -1.22 -0.51 -1.80 -0.69 -1.57 -1.03 -0.68 0.65 -1.03 -0.6885 Paper mill machines 0.23 -1.34 -0.05 -0.15 0.81 -0.13 -0.40 -0.67 0.21 -1.71 -0.63 -0.39 -1.06 -0.60 -0.32 -0.61 -0.4986 Printing machines 0.44 -1.60 -0.06 -0.11 -0.29 0.02 -1.11 -0.38 0.20 -1.32 -0.06 -0.24 0.04 -0.32 -0.09 0.75 -0.9487 Food-processing machine 0.30 -1.32 0.70 -0.65 0.02 -0.20 0.26 -1.46 0.03 -1.45 -0.22 -1.30 -0.17 -0.09 -1.22 -0.70 -0.9388 Other special machines -0.68 -0.46 -0.61 -0.30 0.72 0.56 0.50 -1.49 0.37 -1.72 -0.84 -0.01 -0.37 -0.74 1.49 -1.09 -0.1989 Service ind. machinery -0.45 -0.92 -0.36 -0.55 0.34 -0.47 -0.12 -1.40 0.15 -1.47 -0.40 -0.53 -0.99 -0.30 0.03 -0.73 -0.6590 Pumps 1.15 -0.44 -0.80 -0.01 -0.38 -0.28 -1.30 -0.39 -0.37 -1.59 -0.75 -0.57 -1.27 0.39 -0.30 1.22 -0.8791 Mechanical handling eq 0.51 -0.60 -0.88 -0.14 0.04 -0.17 -1.05 -0.47 -0.06 -1.48 -0.34 -0.19 -1.51 0.33 -0.44 0.18 -0.7392 Other non-elec machines -1.65 -0.12 0.85 -0.34 -0.57 -0.80 -0.89 -0.81 -0.58 -1.73 0.09 -0.69 -0.45 -0.83 -0.63 -1.03 -0.7193 Radio, TV, phonograph -0.31 -1.38 -0.19 0.43 0.10 -1.02 -0.26 0.05 0.68 -0.42 -0.58 -1.44 -0.98 -1.14 0.32 -0.39 -0.6194 Telecommunication eq,nec 0.72 0.08 -1.74 0.63 -1.35 -0.91 -0.94 -0.68 0.29 -1.04 -1.66 -1.28 -0.73 0.06 -0.84 -0.80 -1.1795 Household appliances -0.43 -1.98 -0.02 0.56 0.89 -0.24 -0.19 -0.81 0.50 -1.23 -0.10 -0.55 0.02 -0.20 -0.47 0.38 -0.3996 Computers & accessories -2.22 -0.96 -1.41 0.83 -0.73 -1.91 -0.27 -1.33 0.14 -1.83 -1.56 -0.89 -1.08 -1.32 -1.84 -0.99 -1.2797 Other office machinery -0.92 -0.50 0.64 0.24 0.24 0.43 0.19 -0.87 -0.92 -0.07 0.12 -1.00 -0.38 -0.97 -1.52 -0.19 -0.1598 Semiconductors 0.29 -0.57 0.63 -0.13 -0.84 -0.40 -0.78 -0.08 0.79 -1.08 -0.78 -0.65 -0.94 -0.25 -0.09 -0.03 -0.6099 Electric motors -0.16 -1.12 0.73 0.90 0.32 -0.57 -0.90 -0.70 0.59 -1.06 0.21 -0.62 -0.87 0.07 1.15 -0.74 -0.38100 Batteries -1.27 -0.64 -0.15 -0.54 -0.48 -0.96 -0.94 -0.30 0.50 -1.86 -1.28 -1.49 -0.87 0.03 0.03 0.58 -0.94101 Electric bulbs -0.41 -0.61 -0.34 0.94 -0.04 -0.71 -0.85 -0.71 -0.14 -1.65 0.07 -0.91 -0.30 0.16 -0.11 0.62 -0.40102 Industrial appliances -0.03 -1.29 -0.48 0.33 -0.14 -0.62 -0.85 -0.40 1.19 -1.55 -0.38 -0.64 -0.51 -1.49 0.05 -1.51 -0.71103 Shipbuilding -0.96 -0.15 -0.49 0.30 1.33 0.11 0.30 0.59 0.22 -1.34 -0.02 -0.15 -0.40 -0.12 -0.05 -0.38 -0.17104 Warships -1.13 0.01 -0.54 0.05 -0.00 -0.07 -0.71 0.01 -0.00 -1.29 -0.23 -0.06 -0.85 -0.00 -1.91 -1.10 -1.23105 Railroad equipment -0.16 0.07 0.82 -0.10 -0.30 -0.18 -0.32 0.05 -0.56 -0.58 0.36 -0.49 0.79 -0.69 0.34 -0.53 -0.16106 Motor vehicles -0.52 -0.00 0.86 1.67 -0.01 -0.24 -0.96 -0.56 0.43 -0.52 0.22 -0.69 -0.36 -0.76 0.85 0.04 -0.16107 Motorcycle and bicycles -0.08 0.17 1.56 -1.15 -1.07 -0.23 -0.21 -0.60 0.43 -0.69 -0.56 -0.78 -0.21 -0.72 -0.25 -0.08 -0.58108 Motor vehicle parts -0.31 -1.72 -0.40 -0.52 0.16 -0.72 -0.51 0.11 -1.19 -1.68 -0.13 -1.05 -0.50 -1.41 0.51 -0.06 -0.58109 Aircraft 0.21 0.15 0.12 -0.20 0.45 -0.39 -0.49 -0.25 0.16 -0.61 0.49 -1.01 0.14 0.56 0.55 0.12 -0.17110 Other transport equip -2.06 -1.64 -0.14 -0.18 -0.10 -0.97 0.13 -1.33 -0.02 -2.15 1.36 -0.51 -0.17 -0.42 0.68 0.55 -0.53111 Professional instruments 0.15 -0.29 -0.35 -0.04 0.30 -0.54 -1.05 -1.61 0.36 -1.51 -0.14 -0.51 0.75 -0.25 0.54 -0.61 -0.61112 Optical goods 0.94 0.42 -0.15 0.56 0.48 -0.55 -0.61 -0.41 1.13 -1.71 0.27 -0.27 0.00 -0.52 0.16 -0.45 -0.01113 Watches and clocks -1.33 -0.31 -0.41 0.48 -0.02 -0.25 -0.54 -0.68 2.13 -1.44 0.50 -1.47 -0.71 -0.30 -0.88 -0.50 -0.60114 Jewellery 0.81 -0.36 0.35 0.15 -1.06 -0.01 -0.37 -0.59 -0.05 -0.93 -1.10 -0.66 -1.83 -0.03 0.14 -0.27 -0.40115 Musical instruments -0.13 -0.84 -1.19 -0.35 0.78 -0.19 -0.32 -1.70 0.84 -1.35 -0.22 -0.60 -0.87 0.33 -1.38 -0.78 -0.35116 Sporting goods 0.66 -0.77 -0.02 -0.90 0.51 -0.82 -0.75 -0.54 0.16 -1.48 -0.05 -0.62 0.25 -0.31 -0.90 -0.20 -0.37117 Ordnance -1.08 -0.53 -0.11 -0.13 -0.10 -0.55 -0.54 -0.53 0.74 -0.12 -0.46 -0.32 -0.12 0.48 -0.72 -0.79 -0.48118 Works of art 0.22 -0.05 -0.10 1.11 0.03 -0.70 -0.70 -0.68 0.01 -0.13 -0.22 -0.20 0.89 -1.83 -1.40 -0.93 -0.68119 Manufactured goods, nec 0.75 -0.89 0.54 0.18 -0.67 -0.23 -0.91 -1.17 0.39 -1.47 -0.12 -1.18 -0.06 0.85 0.10 -0.97 -0.65120 Scraps,used,unclassified -1.26 -0.86 0.02 -0.67 -0.33 -0.48 -0.52 0.21 -0.52 -1.74 -0.68 -0.14 -0.81 -0.94 -0.11 0.30 -0.65
Ave. of Sectors -0.52 -0.67 -0.26 -0.21 -0.26 -0.60 -0.83 -0.78 0.03 -1.12 -0.35 -0.97 -0.61 -0.73 -0.34 -0.52 -0.63
47
7. Concluding Remarks
The multisectoral bilateral world trade model developed and tested in the current studyrepresents a major advance in the modeling of the international trade linkages. Because the trademodel is estimated at a level of disaggregation by commodities and countries that is notcustomarily employed in the literature, it is finally possible to link complete, multisectoralnational models with consistent, bilateral trade flows and to examine sector- and country-specificissues in an international general equilibrium framework. Of course, the economies are actuallylinked by trade which is conducted at a much deeper level of product detail; but the step fromno or few sectors to the maximum detail supportable by sectoral statistics and input-output tablesis a significant increase in realism.
While the empirical results in the current study bring forward the fundamental role of relativeprices in explaining the temporal variations in international trade shares, the study also finds thatcapital investment -- a proxy for quality change of product not reflected in the price index -- isalso a significant determinant of changes in the trade shares. In many cases, changes in bilateraltrade shares also show a significant trend not explainable by either relative prices or capitalinvestment. Testing the model in a historical simulation shows that the equation shares definitelyoutperform the "naive" assumption of constant shares.
On a practical note, the current study has devoted a considerable effort to the organizationof a detailed bilateral world trade database. We have processed over 200 bilateral trade datatapes from the OECD and UN, and made a number of adjustments to alleviate the inconsistenciesin the raw data. The result is a detailed, consistent, usable time-series bilateral trade databasethat contains 18 years of bilateral flows in 120 products for 28 source countries and 60 partnercountries and country groupings that make up the entire world. To be sure, the researcher whoneeds detailed bilateral trade data could, like this author, always go back and read the sameOECD and UN trade data tapes, try to remove the inconsistencies in the raw data, and reduceas many as 3,000 commodity categories and 200 partner countries to a more manageable level.However, the trade database built in the current study clearly offers a better alternative, becauseit has already taken much of drudgery out of the routine data work. The extensive collection ofbilateral trade flows can be easily accessed through a personal computer and carried in floppydiskettes. Using an accompanying data-handling software, VAM, one can, for instance, bring upin a spreadsheet the 16 x 16 trade (flows) matrices for each of the 120 products in each year ora given source country’s exports to or imports from its partner countries over the 1974-91 period,or graph the time series, or perform other data transformations. Evidently, its usefulness goesbeyond the present study.
In summary, the bilateral trade model developed in the paper can be expected to greatlyenhance the consistency of the trade forecasts and significantly expand the modeling capabilitiesof the Inforum international forecasting system.
INFORUM November 199548
References
Almon, Clopper. Industrial Effects of a Free Trade Agreement between Mexico and the USA.Research report prepared for the U.S. Department of Labor, March 1991.
. The Craft of Economic Modeling. Second Edition. College Park, MD: TheInterindustry Economic Research Fund, Inc. 1990.
Amano, Akihiro, E. Kurihara, and L. Samuelson. "Trade Linkage Submodels in the EPAWorld Economic Model." Economic Bulletin, 19. Tokyo: Economic Planning Agency,Economic Research Institute, 1980.
Armington, P.S. "A Theory of Demand for Products Distinguished by Place of Production,"International Monetary Fund Staff Papers. 16: 159-176, 1969a.
. "The Geographic Patterns of Trade and the Effects of Price Changes," InternationalMonetary Fund Staff Papers. 16: 179-197, 1969b.
Bacharach, M. Biproportional Matrices and Input-Output Change, Cambridge: CambridgeUniversity Press, 1970.
Balassa, B. The Theory of Economic Integration, Homewood, 1961.
Brenton, P. "Modeling Bilateral Trade Flows: An Empirical Analysis Using DisaggregateCommodity Data," Journal of Policy Modeling. 11 (4):547-567, 1989.
Bryant, R.C. et al. Empirical Macroeconomics for Interdependent Economies. WashingtonD.C.: The Brookings Institution, 1988.
Christou, C. and D. E. Nyhus. Industrial Effects of the European Community Integration.Inforum Working Paper, University of Maryland, 92-1, 1992.
Cline, W.R. United States External Adjustment and the World Economy. Washington, D.C.:Institute for International Economics, 1989.
Fair, R.C. Specification, Estimation, and Analysis of Macroeconometric Models. Cambridge,Mass.: Harvard University Press, 1984.
Hickman, B.G., and Lau, L.J. "Elasticities of Substitution and Export Demands in a WorldTrade Model," European Economic Review, 4 (1973), pp. 347-380.
Houthakker, H.S., and Magee, S.P. "Income and Price Elasticities in World Trade," TheReview of Economics and Statistics, LI (May, 1969), pp. 111-125.
INFORUM November 199549
Italianer, Alexander. Theory and Practice of International Trade Linkage Models. Dordrecht:Martinus Nijhoff Publishers, 1986.
Junz, H.B., and Rhomberg, R.R. "Price Competitiveness in Export Trade Among IndustrialCountries," American Economic Review, 63 (May, 1973), pp. 412-418.
Klein, L.R. and Van Peeterssen, A. "Forecasting World Trade within Project LINK," in R.J.Ball, (ed.) The International Linkage of National Economic Models, Amsterdam: North-Holland, 1973.
Kreinin, M.E., "Price Elasticities in International Trade," The Review of Economics andStatistics, vol. 49 (November, 1967), pp. 510-517.
Linnemann, H. An Econometric Study of International Trade Flows, 1966.
Magee, S.P. "Prices, Incomes and Foreign Trade," in Kenen, P.B. (ed.), International Trade andFinance: Frontiers for Research. Cambridge: Cambridge University Press, pp. 175-252,1975.
Marwah, Kanta. "A World Model of International Trade: Forecasting Market Shares and TradeFlows," Empirical Economics, Vol. 1, Issue 1, pp. 1-39, 1976.
Maskus, Keith E. "Comparing International Trade Data and Product and National Characteris-tics Data for the Analysis of Trade Models," Paper presented at the Conference on Researchin Income and Wealth. Nov. 3-4, 1989, Washington, D.C.
Moriguchi, C. "Forecasting and Simulation Analysis of the World Economy," AmericanEconomic Review, vol. 63, No. 2, pp. 402-409.
Nyhus, Douglas E. "The Inforum International System," Economic Systems Research. Vol. 3,No. 1, 1991.
. "The INFORUM-ERI International System of Macroeconomic Input-OutputModels," in M. Ciaschini, ed., Input-Output Analysis: Current Developments. New York:Chapman and Hall, 1988.
. "A Detailed Model of Bilateral Commodity Trade and the Effects of Exchange RateChanges," in Peterson (ed.), Econometric Contribution To Public Policy. London: Macmillan,1978.
. The Trade Model of a Dynamic World Input-output Forecasting System. Ph.D.Thesis, University of Maryland, 1975.
INFORUM November 199550
Parikh, A., The Estimation and Forecasting of Trade Shares, Development Papers No. 5,Economic and Social Commission for Asia and the Pacific, United Nations, 1-344, 1986.
Preeg, E.H., Traders and Diplomats, Brookings Institution, Washington, D.C., 1970.
Rhomberg, R.R. "Possible Approaches to a Model of World Trade and Payments," Internation-al Monetary Fund Staff Papers. 17 : 1-26, 1970.
. "Towards a General Trade Model," in Ball, R.J. (ed.), The International Linkageof National Economic Models. Amsterdam: North-Holland, 9-20, 1973.
Samuelson, L. "A New Model of World Trade," OECD Economic Outlook, Occasional Studies.December, 1973.
Taplin, G.B. "Models of World Trade," International Monetary Fund Staff Papers. 14 : 433-455, 1967.
Uno, Kimio. Technology, Investment, and Trade. Amsterdam: Elsevier Science Publishers,1991.
Waelbroeck, J. "The Methodology of Linkage," in Ball, R.J. (ed.), The International Linkageof National Economic Models. Amsterdam: North-Holland, 45-61, 1973.
INFORUM November 199551