Embed Size (px)
Citation preview


248
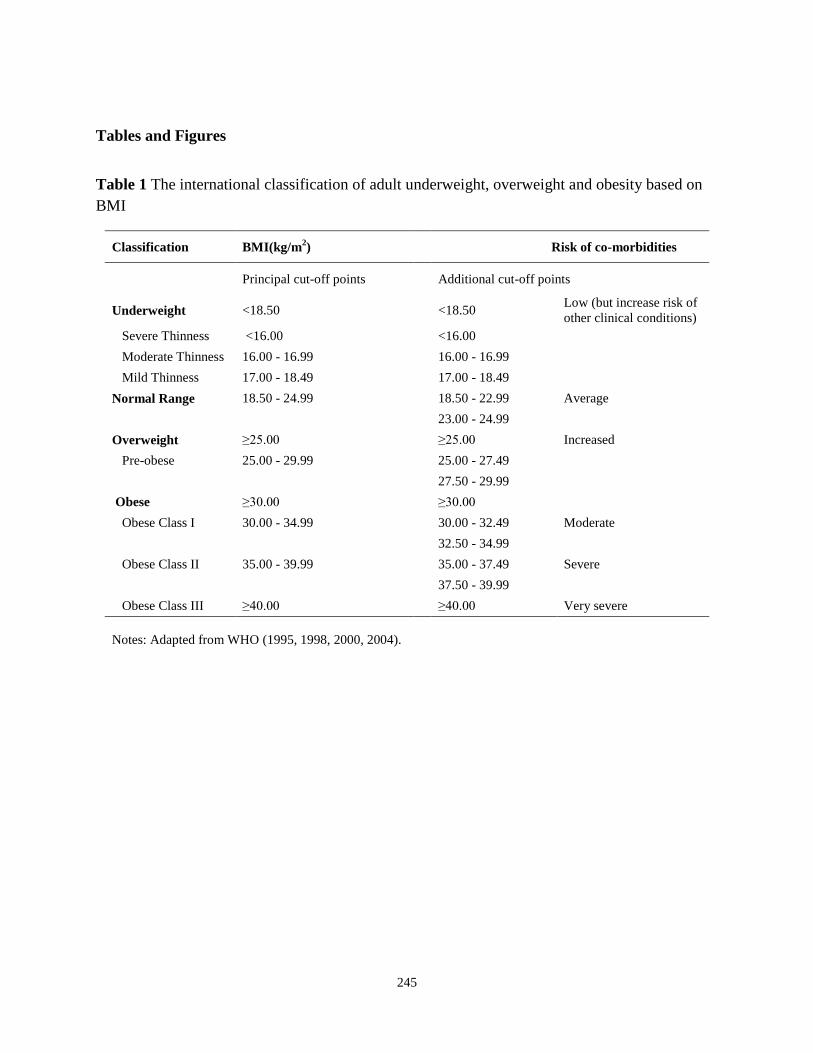
Table 4 Typology of studies of different levels
Exposure
x (measured at individual level)
X (measured at
ecological level)
Outcome y (measured at
individual level)
(y,x) Traditional risk factor study
(y,X) Multilevel Study
Y (measured at
ecological level)
(Y, x)
(Y,X) Ecological study
Notes: Adapted from (Subramanian et al. 2009).
249
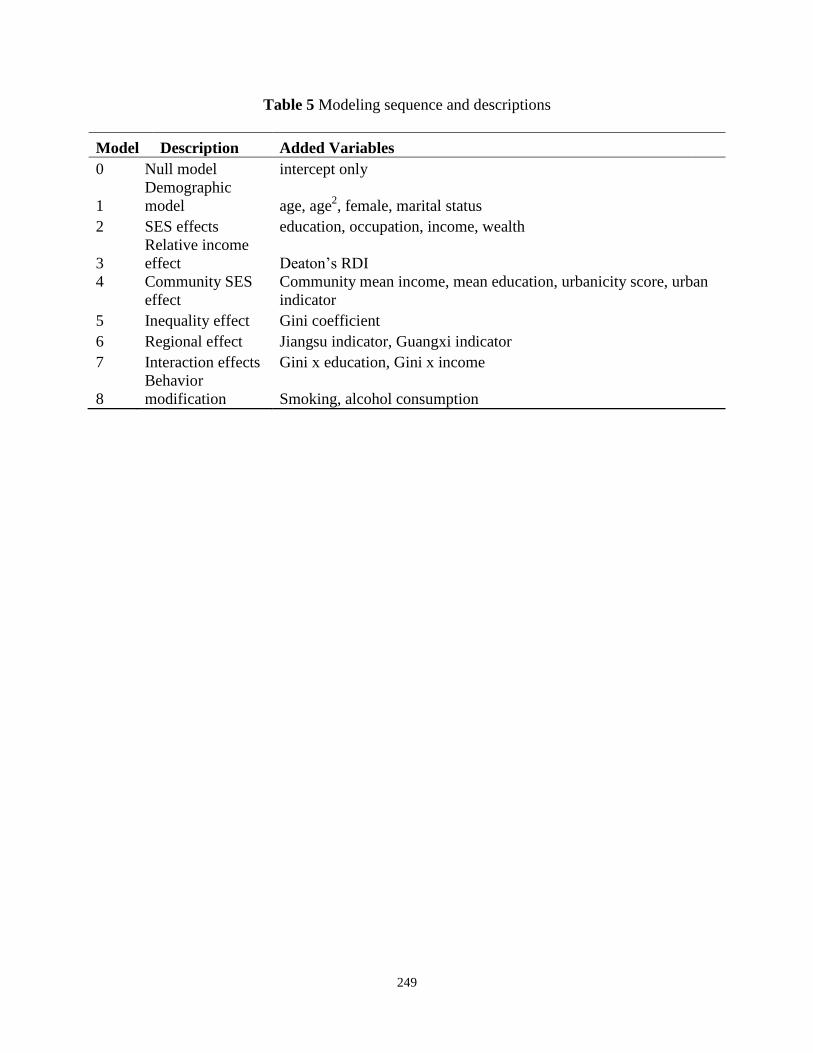
Table 5 Modeling sequence and descriptions Model Description Added Variables
0 Null model intercept only
1 Demographic model age, age2, female, marital status
2 SES effects education, occupation, income, wealth
3 Relative income effect Deaton’s RDI
4 Community SES effect
Community mean income, mean education, urbanicity score, urban indicator
5 Inequality effect Gini coefficient 6 Regional effect Jiangsu indicator, Guangxi indicator 7 Interaction effects Gini x education, Gini x income
8 Behavior modification Smoking, alcohol consumption
250
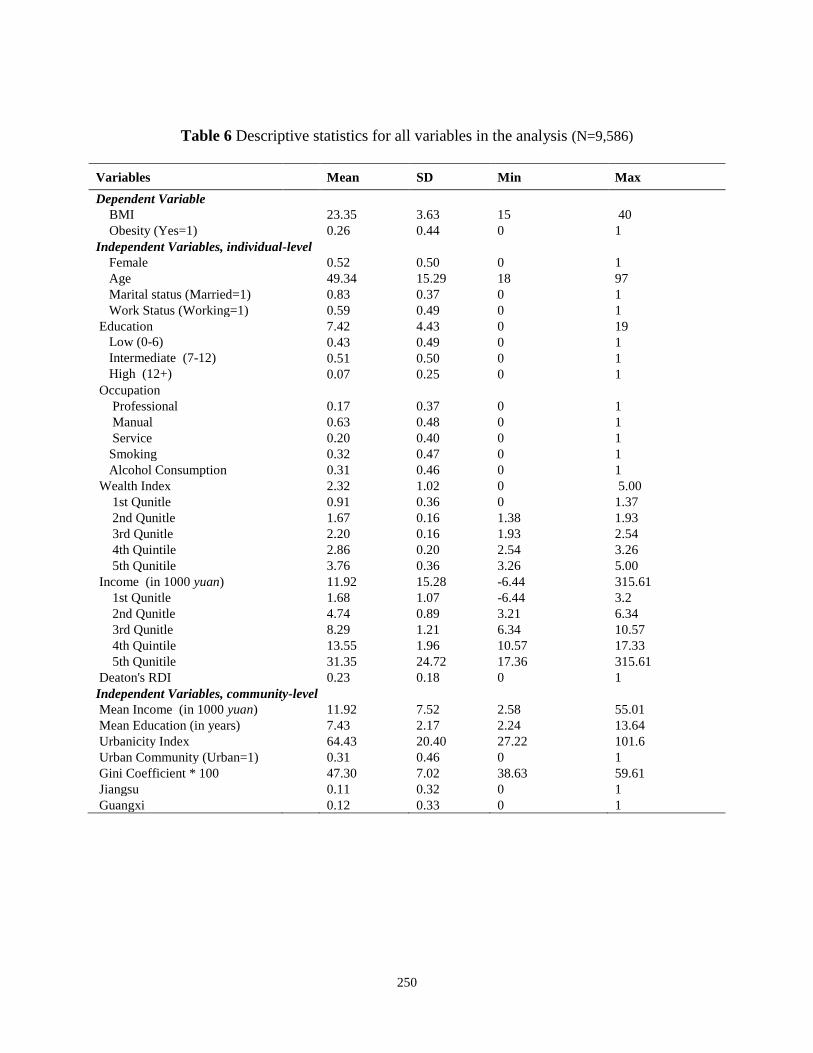
Table 6 Descriptive statistics for all variables in the analysis (N=9,586)
Variables Mean SD Min Max
Dependent Variable BMI 23.35 3.63 15 40 Obesity (Yes=1) 0.26 0.44 0 1 Independent Variables, individual-level
Female 0.52 0.50 0 1 Age 49.34 15.29 18 97 Marital status (Married=1) 0.83 0.37 0 1 Work Status (Working=1) 0.59 0.49 0 1
Education 7.42 4.43 0 19 Low (0-6) 0.43 0.49 0 1 Intermediate (7-12) 0.51 0.50 0 1 High (12+) 0.07 0.25 0 1
Occupation Professional 0.17 0.37 0 1 Manual 0.63 0.48 0 1 Service 0.20 0.40 0 1 Smoking 0.32 0.47 0 1 Alcohol Consumption 0.31 0.46 0 1
Wealth Index 2.32 1.02 0 5.00 1st Qunitle 0.91 0.36 0 1.37 2nd Qunitle 1.67 0.16 1.38 1.93 3rd Qunitle 2.20 0.16 1.93 2.54 4th Quintile 2.86 0.20 2.54 3.26 5th Qunitile 3.76 0.36 3.26 5.00
Income (in 1000 yuan) 11.92 15.28 -6.44 315.61 1st Qunitle 1.68 1.07 -6.44 3.2 2nd Qunitle 4.74 0.89 3.21 6.34 3rd Qunitle 8.29 1.21 6.34 10.57 4th Quintile 13.55 1.96 10.57 17.33 5th Qunitile 31.35 24.72 17.36 315.61
Deaton's RDI 0.23 0.18 0 1 Independent Variables, community-level Mean Income (in 1000 yuan) 11.92 7.52 2.58 55.01 Mean Education (in years) 7.43 2.17 2.24 13.64 Urbanicity Index 64.43 20.40 27.22 101.6 Urban Community (Urban=1) 0.31 0.46 0 1 Gini Coefficient * 100 47.30 7.02 38.63 59.61 Jiangsu 0.11 0.32 0 1 Guangxi 0.12 0.33 0 1
251
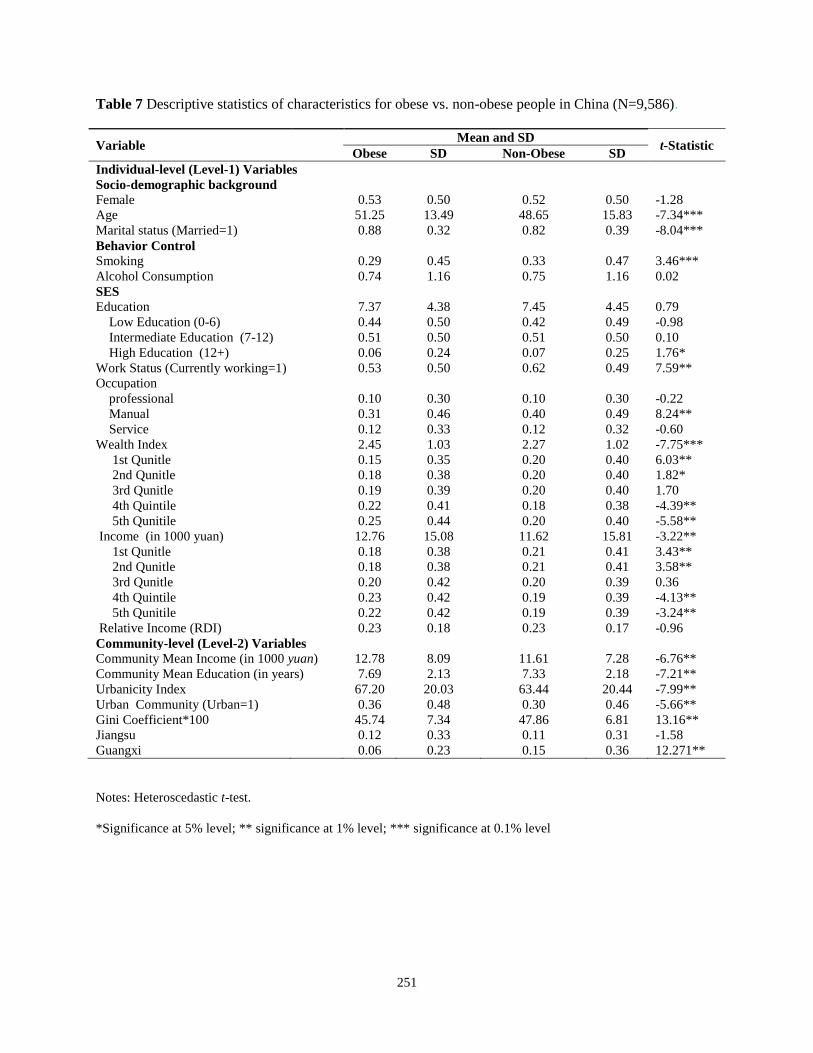
Table 7 Descriptive statistics of characteristics for obese vs. non-obese people in China (N=9,586).
Variable Mean and SD
t-Statistic Obese SD Non-Obese SD
Individual-level (Level-1) Variables Socio-demographic background Female 0.53 0.50 0.52 0.50 -1.28 Age 51.25 13.49 48.65 15.83 -7.34*** Marital status (Married=1) 0.88 0.32 0.82 0.39 -8.04*** Behavior Control Smoking 0.29 0.45 0.33 0.47 3.46*** Alcohol Consumption 0.74 1.16 0.75 1.16 0.02 SES Education 7.37 4.38 7.45 4.45 0.79
Low Education (0-6) 0.44 0.50 0.42 0.49 -0.98 Intermediate Education (7-12) 0.51 0.50 0.51 0.50 0.10 High Education (12+) 0.06 0.24 0.07 0.25 1.76*
Work Status (Currently working=1) 0.53 0.50 0.62 0.49 7.59** Occupation
professional 0.10 0.30 0.10 0.30 -0.22 Manual 0.31 0.46 0.40 0.49 8.24** Service 0.12 0.33 0.12 0.32 -0.60
Wealth Index 2.45 1.03 2.27 1.02 -7.75*** 1st Qunitle 0.15 0.35 0.20 0.40 6.03** 2nd Qunitle 0.18 0.38 0.20 0.40 1.82* 3rd Qunitle 0.19 0.39 0.20 0.40 1.70 4th Quintile 0.22 0.41 0.18 0.38 -4.39** 5th Qunitile 0.25 0.44 0.20 0.40 -5.58**
Income (in 1000 yuan) 12.76 15.08 11.62 15.81 -3.22** 1st Qunitle 0.18 0.38 0.21 0.41 3.43** 2nd Qunitle 0.18 0.38 0.21 0.41 3.58** 3rd Qunitle 0.20 0.42 0.20 0.39 0.36 4th Quintile 0.23 0.42 0.19 0.39 -4.13** 5th Qunitile 0.22 0.42 0.19 0.39 -3.24**
Relative Income (RDI) 0.23 0.18 0.23 0.17 -0.96 Community-level (Level-2) Variables Community Mean Income (in 1000 yuan) 12.78 8.09 11.61 7.28 -6.76** Community Mean Education (in years) 7.69 2.13 7.33 2.18 -7.21** Urbanicity Index 67.20 20.03 63.44 20.44 -7.99** Urban Community (Urban=1) 0.36 0.48 0.30 0.46 -5.66** Gini Coefficient*100 45.74 7.34 47.86 6.81 13.16** Jiangsu 0.12 0.33 0.11 0.31 -1.58 Guangxi 0.06 0.23 0.15 0.36 12.271**
Notes: Heteroscedastic t-test.
*Significance at 5% level; ** significance at 1% level; *** significance at 0.1% level
252
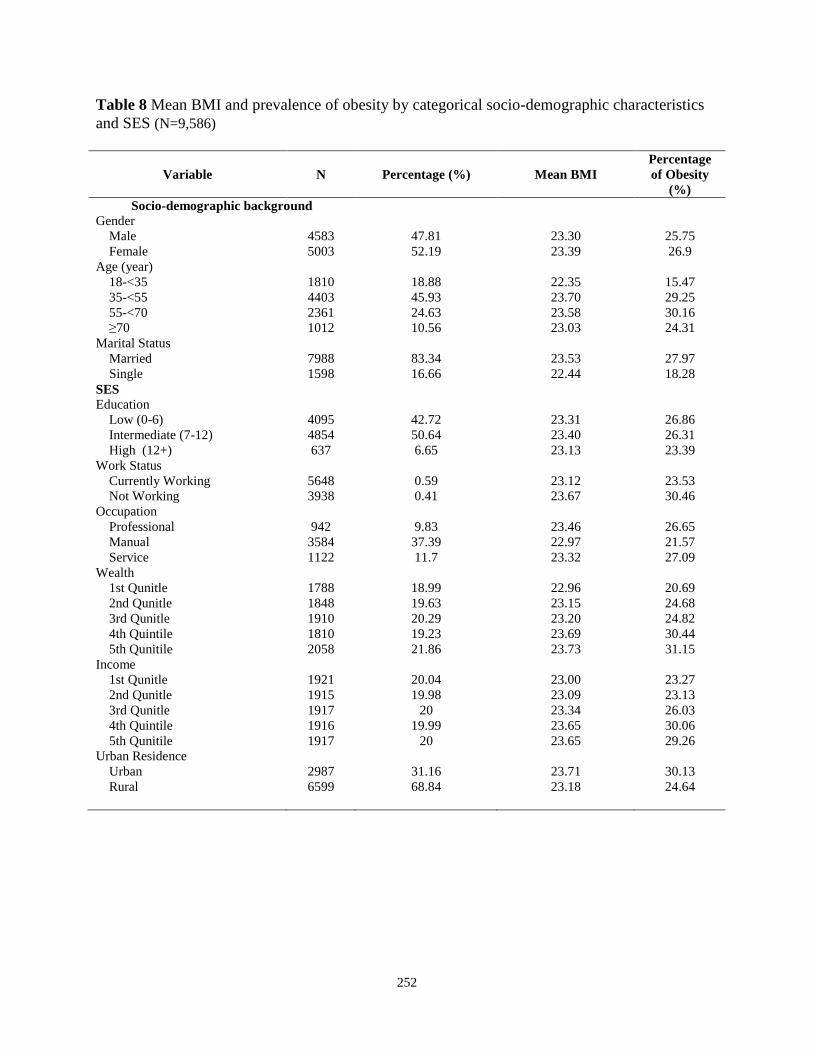
Table 8 Mean BMI and prevalence of obesity by categorical socio-demographic characteristics and SES (N=9,586)
Variable N Percentage (%) Mean BMI
Percentage
of Obesity
(%)
Socio-demographic background Gender
Male 4583 47.81 23.30 25.75 Female 5003 52.19 23.39 26.9
Age (year) 18-<35 1810 18.88 22.35 15.47 35-<55 4403 45.93 23.70 29.25 55-<70 2361 24.63 23.58 30.16 ≥70 1012 10.56 23.03 24.31
Marital Status Married 7988 83.34 23.53 27.97 Single 1598 16.66 22.44 18.28
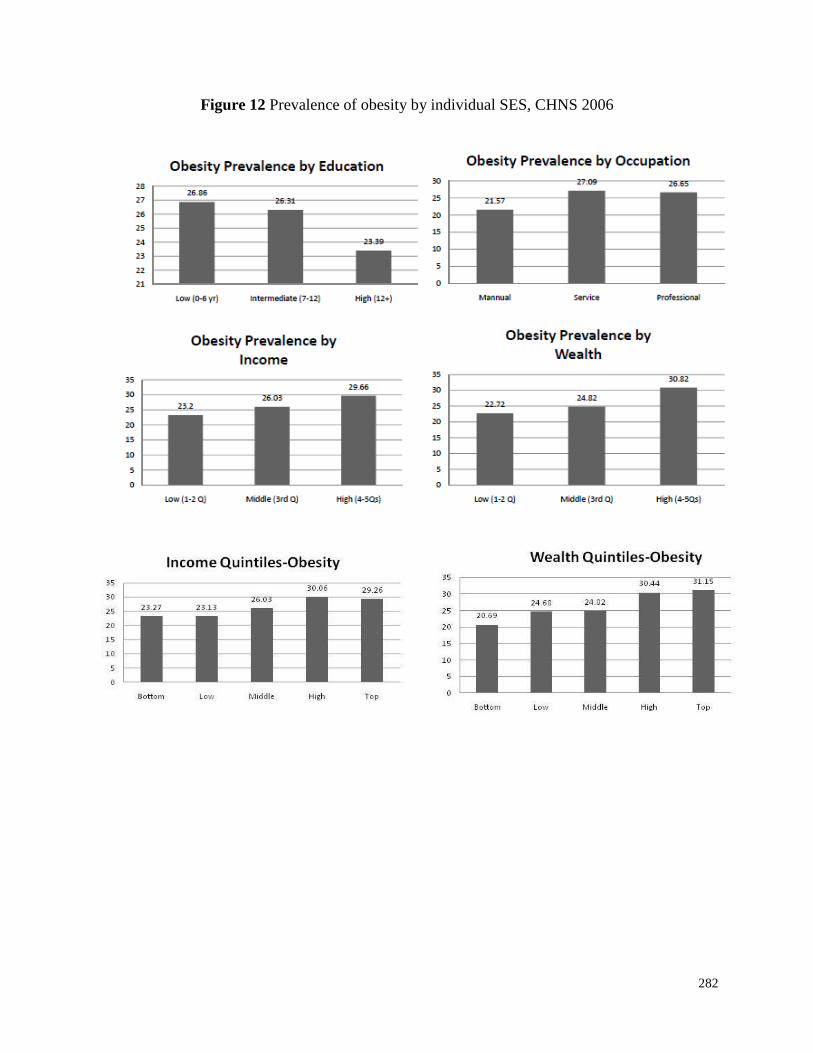
SES Education
Low (0-6) 4095 42.72 23.31 26.86 Intermediate (7-12) 4854 50.64 23.40 26.31 High (12+) 637 6.65 23.13 23.39
Work Status Currently Working 5648 0.59 23.12 23.53 Not Working 3938 0.41 23.67 30.46
Occupation Professional 942 9.83 23.46 26.65 Manual 3584 37.39 22.97 21.57 Service 1122 11.7 23.32 27.09
Wealth 1st Qunitle 1788 18.99 22.96 20.69 2nd Qunitle 1848 19.63 23.15 24.68 3rd Qunitle 1910 20.29 23.20 24.82 4th Quintile 1810 19.23 23.69 30.44 5th Qunitile 2058 21.86 23.73 31.15
Income 1st Qunitle 1921 20.04 23.00 23.27 2nd Qunitle 1915 19.98 23.09 23.13 3rd Qunitle 1917 20 23.34 26.03 4th Quintile 1916 19.99 23.65 30.06 5th Qunitile 1917 20 23.65 29.26
Urban Residence Urban 2987 31.16 23.71 30.13 Rural 6599 68.84 23.18 24.64
253
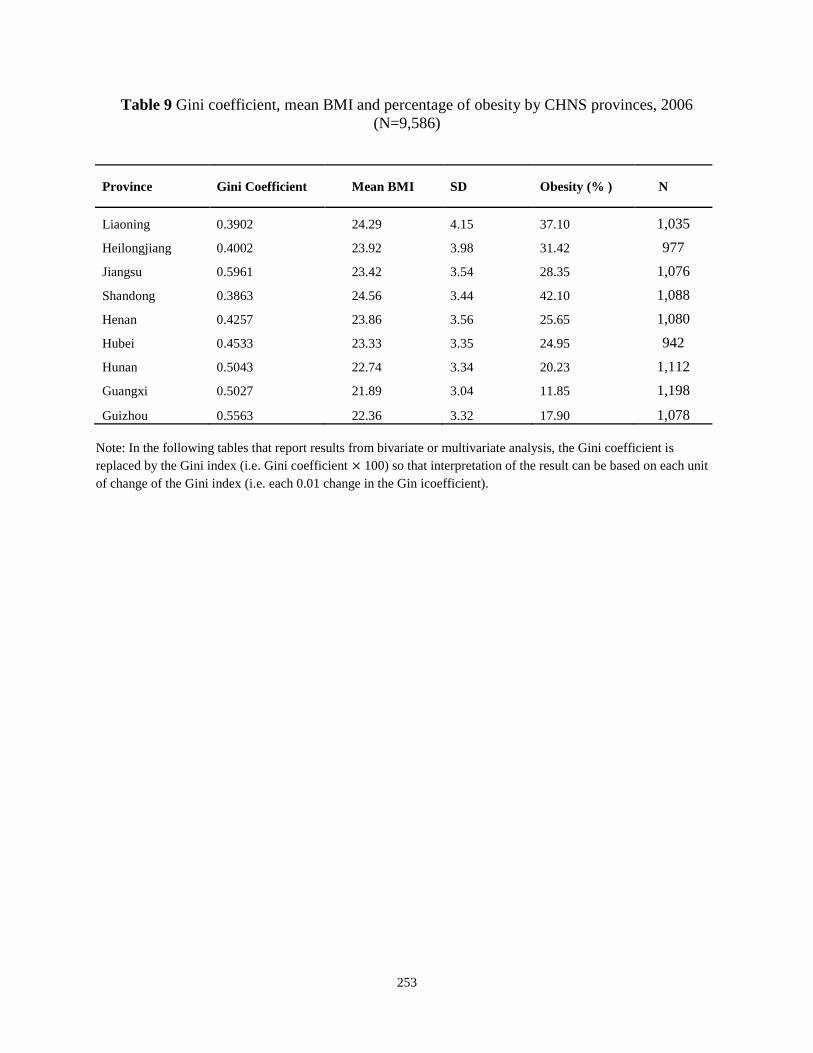
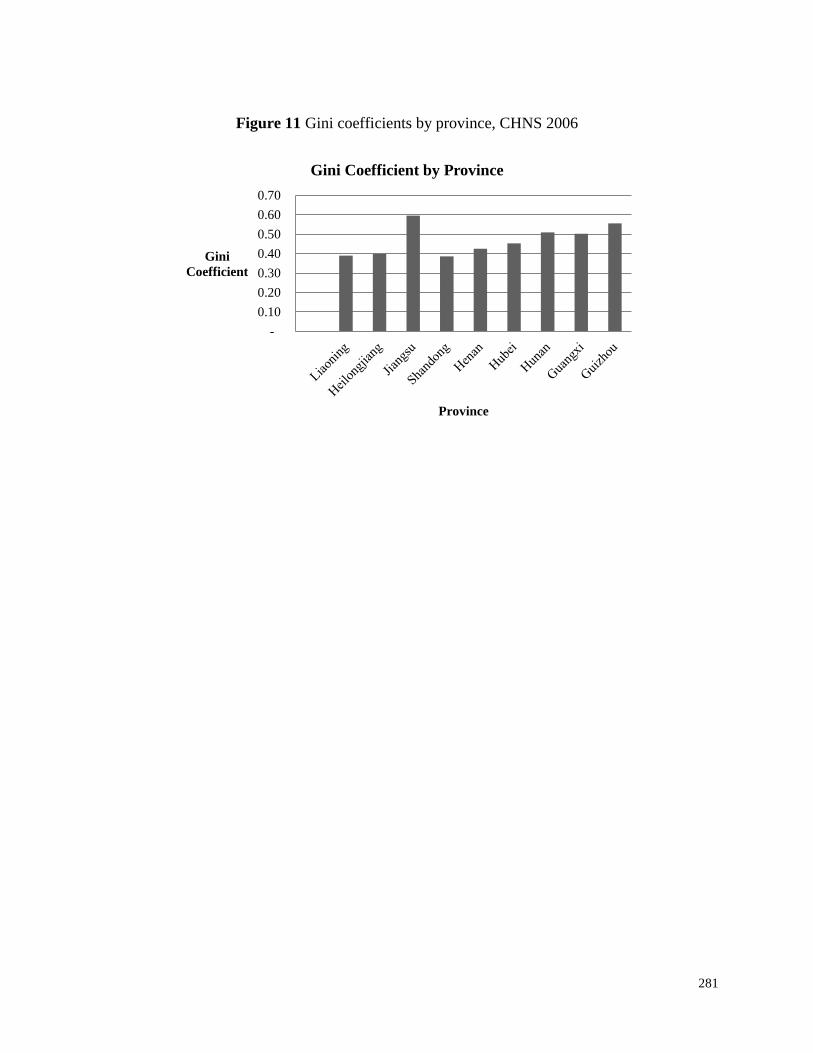
Table 9 Gini coefficient, mean BMI and percentage of obesity by CHNS provinces, 2006 (N=9,586)
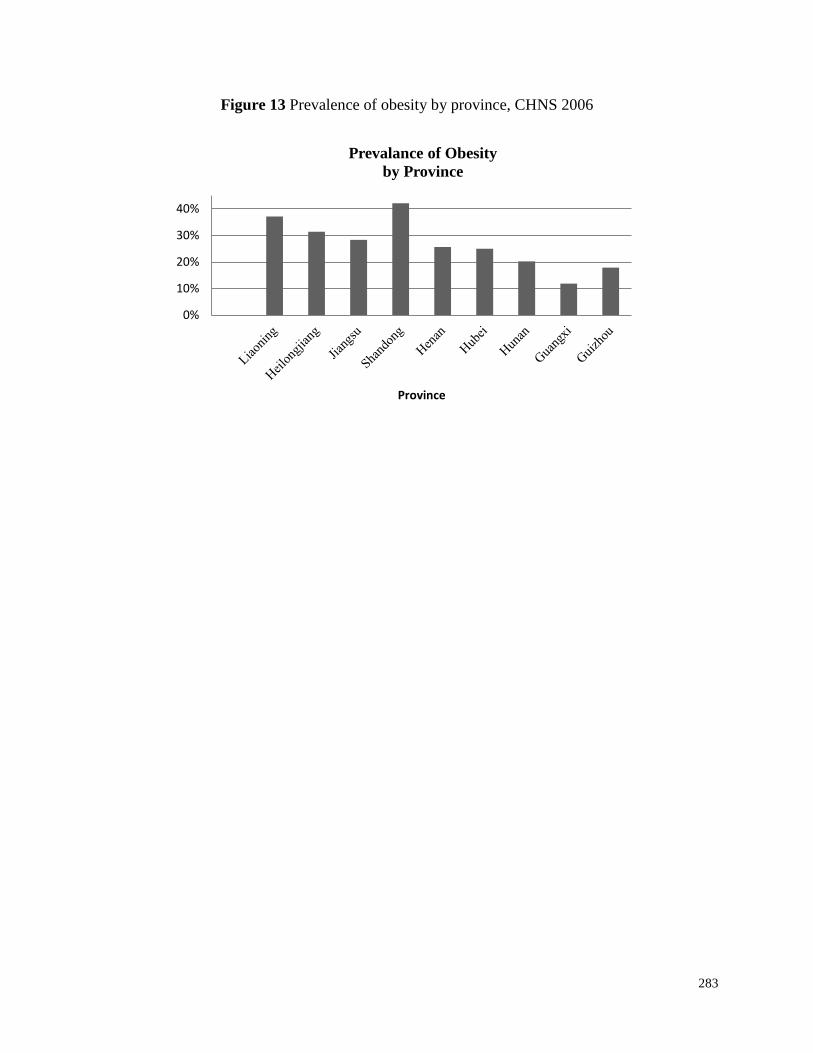
Province Gini Coefficient Mean BMI SD Obesity (% ) N
Liaoning 0.3902 24.29 4.15 37.10 1,035 Heilongjiang 0.4002 23.92 3.98 31.42 977 Jiangsu 0.5961 23.42 3.54 28.35 1,076 Shandong 0.3863 24.56 3.44 42.10 1,088 Henan 0.4257 23.86 3.56 25.65 1,080
Hubei 0.4533 23.33 3.35 24.95 942 Hunan 0.5043 22.74 3.34 20.23 1,112 Guangxi 0.5027 21.89 3.04 11.85 1,198
Guizhou 0.5563 22.36 3.32 17.90 1,078 Note: In the following tables that report results from bivariate or multivariate analysis, the Gini coefficient is replaced by the Gini index (i.e. Gini coefficient 100) so that interpretation of the result can be based on each unit of change of the Gini index (i.e. each 0.01 change in the Gin icoefficient).
254
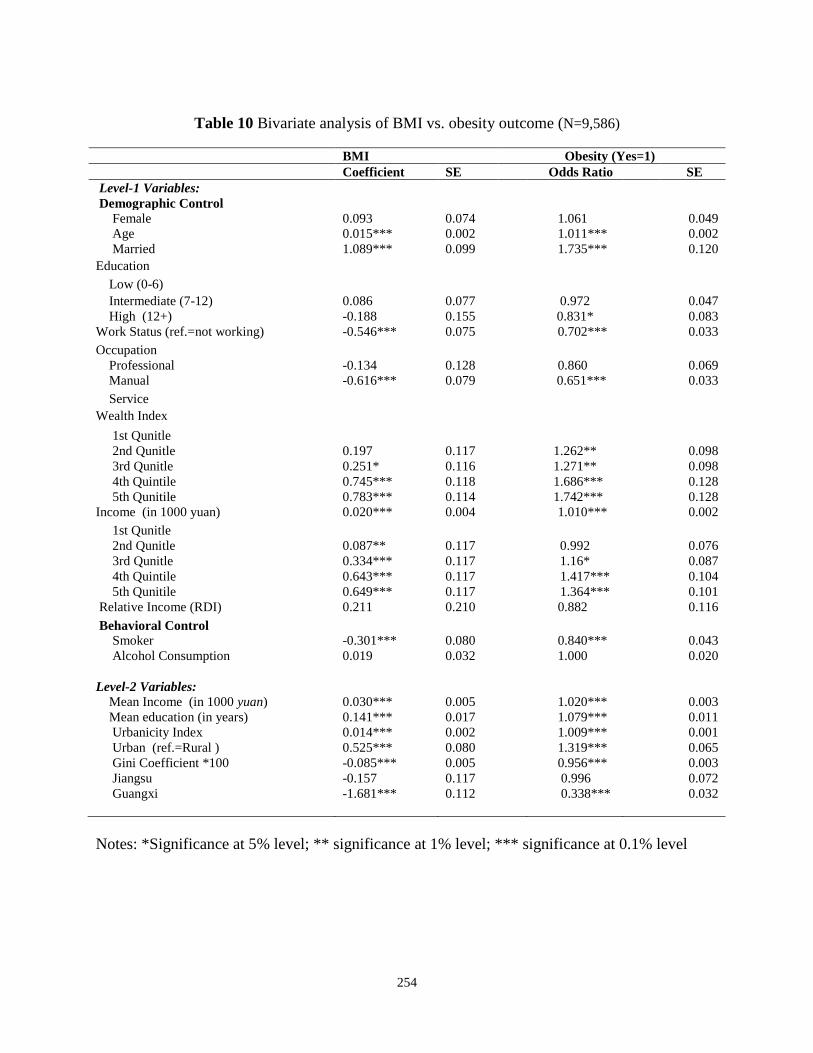
Table 10 Bivariate analysis of BMI vs. obesity outcome (N=9,586) BMI Obesity (Yes=1)
Coefficient SE Odds Ratio SE
Level-1 Variables: Demographic Control
Female 0.093 0.074 1.061 0.049 Age 0.015*** 0.002 1.011*** 0.002 Married 1.089*** 0.099 1.735*** 0.120
Education Low (0-6) Intermediate (7-12) 0.086 0.077 0.972 0.047 High (12+) -0.188 0.155 0.831* 0.083
Work Status (ref.=not working) -0.546*** 0.075 0.702*** 0.033 Occupation
Professional -0.134 0.128 0.860 0.069 Manual -0.616*** 0.079 0.651*** 0.033 Service
Wealth Index 1st Qunitle 2nd Qunitle 0.197 0.117 1.262** 0.098 3rd Qunitle 0.251* 0.116 1.271** 0.098 4th Quintile 0.745*** 0.118 1.686*** 0.128 5th Qunitile 0.783*** 0.114 1.742*** 0.128
Income (in 1000 yuan) 0.020*** 0.004 1.010*** 0.002 1st Qunitle 2nd Qunitle 0.087** 0.117 0.992 0.076 3rd Qunitle 0.334*** 0.117 1.16* 0.087 4th Quintile 0.643*** 0.117 1.417*** 0.104 5th Qunitile 0.649*** 0.117 1.364*** 0.101
Relative Income (RDI) 0.211 0.210 0.882 0.116 Behavioral Control
Smoker -0.301*** 0.080 0.840*** 0.043 Alcohol Consumption 0.019 0.032 1.000 0.020
Level-2 Variables: Mean Income (in 1000 yuan) 0.030*** 0.005 1.020*** 0.003 Mean education (in years) 0.141*** 0.017 1.079*** 0.011 Urbanicity Index 0.014*** 0.002 1.009*** 0.001 Urban (ref.=Rural ) 0.525*** 0.080 1.319*** 0.065 Gini Coefficient *100 -0.085*** 0.005 0.956*** 0.003 Jiangsu -0.157 0.117 0.996 0.072 Guangxi -1.681*** 0.112 0.338*** 0.032
Notes: *Significance at 5% level; ** significance at 1% level; *** significance at 0.1% level
255
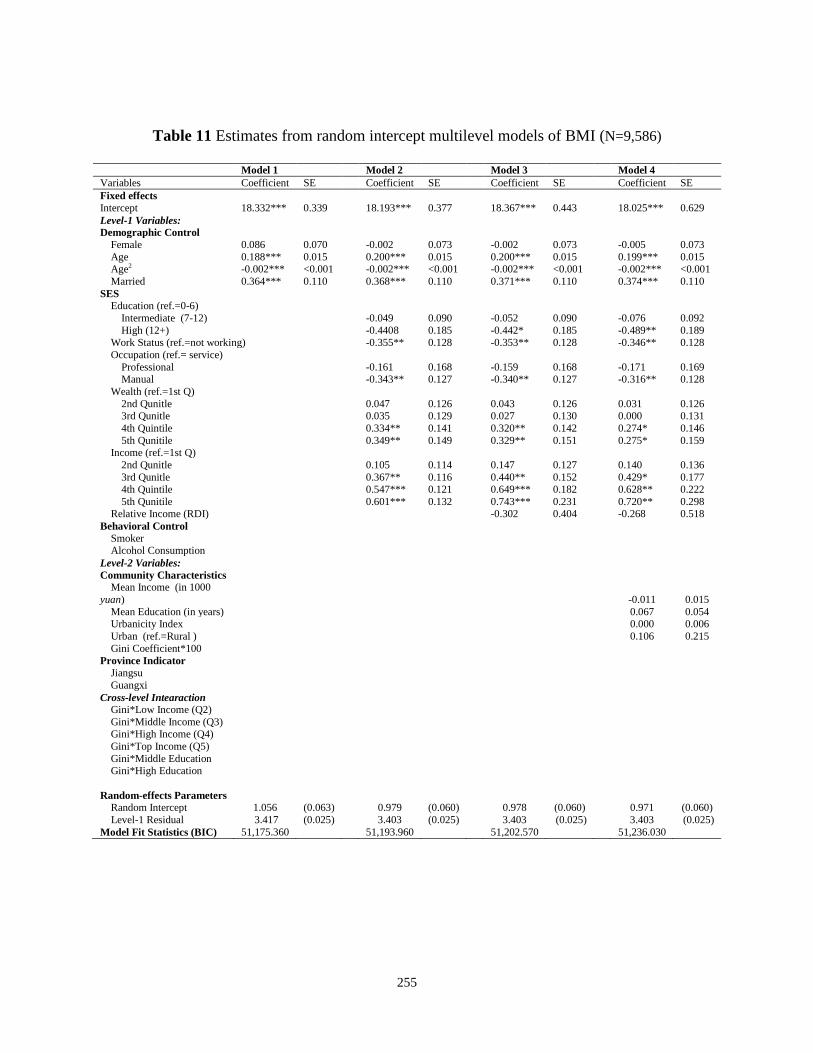
Table 11 Estimates from random intercept multilevel models of BMI (N=9,586)
Model 1 Model 2 Model 3 Model 4 Variables Coefficient SE Coefficient SE Coefficient SE Coefficient SE Fixed effects Intercept 18.332*** 0.339 18.193*** 0.377 18.367*** 0.443 18.025*** 0.629 Level-1 Variables: Demographic Control
Female 0.086 0.070 -0.002 0.073 -0.002 0.073 -0.005 0.073 Age 0.188*** 0.015 0.200*** 0.015 0.200*** 0.015 0.199*** 0.015 Age2 -0.002*** <0.001 -0.002*** <0.001 -0.002*** <0.001 -0.002*** <0.001 Married 0.364*** 0.110 0.368*** 0.110 0.371*** 0.110 0.374*** 0.110
SES Education (ref.=0-6)
Intermediate (7-12) -0.049 0.090 -0.052 0.090 -0.076 0.092 High (12+) -0.4408 0.185 -0.442* 0.185 -0.489** 0.189
Work Status (ref.=not working) -0.355** 0.128 -0.353** 0.128 -0.346** 0.128 Occupation (ref.= service)
Professional -0.161 0.168 -0.159 0.168 -0.171 0.169 Manual -0.343** 0.127 -0.340** 0.127 -0.316** 0.128
Wealth (ref.=1st Q) 2nd Qunitle 0.047 0.126 0.043 0.126 0.031 0.126 3rd Qunitle 0.035 0.129 0.027 0.130 0.000 0.131 4th Quintile 0.334** 0.141 0.320** 0.142 0.274* 0.146 5th Qunitile 0.349** 0.149 0.329** 0.151 0.275* 0.159
Income (ref.=1st Q) 2nd Qunitle 0.105 0.114 0.147 0.127 0.140 0.136 3rd Qunitle 0.367** 0.116 0.440** 0.152 0.429* 0.177 4th Quintile 0.547*** 0.121 0.649*** 0.182 0.628** 0.222 5th Qunitile 0.601*** 0.132 0.743*** 0.231 0.720** 0.298
Relative Income (RDI) -0.302 0.404 -0.268 0.518 Behavioral Control
Smoker Alcohol Consumption
Level-2 Variables: Community Characteristics
Mean Income (in 1000 yuan) -0.011 0.015
Mean Education (in years) 0.067 0.054 Urbanicity Index 0.000 0.006 Urban (ref.=Rural ) 0.106 0.215 Gini Coefficient*100
Province Indicator Jiangsu Guangxi
Cross-level Intearaction Gini*Low Income (Q2) Gini*Middle Income (Q3) Gini*High Income (Q4) Gini*Top Income (Q5) Gini*Middle Education Gini*High Education
Random-effects Parameters Random Intercept 1.056 (0.063) 0.979 (0.060) 0.978 (0.060) 0.971 (0.060) Level-1 Residual 3.417 (0.025) 3.403 (0.025) 3.403 (0.025) 3.403 (0.025) Model Fit Statistics (BIC) 51,175.360 51,193.960 51,202.570 51,236.030
256
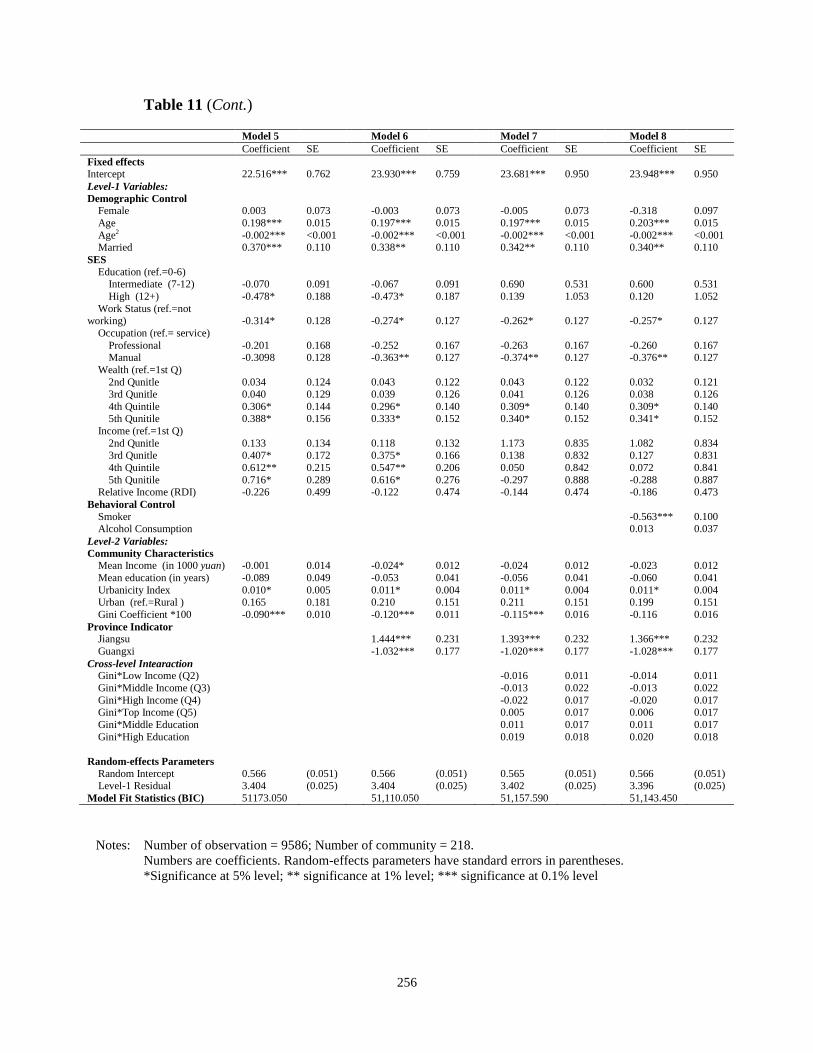
Table 11 (Cont.)
Model 5 Model 6 Model 7 Model 8 Coefficient SE Coefficient SE Coefficient SE Coefficient SE Fixed effects Intercept 22.516*** 0.762 23.930*** 0.759 23.681*** 0.950 23.948*** 0.950 Level-1 Variables: Demographic Control
Female 0.003 0.073 -0.003 0.073 -0.005 0.073 -0.318 0.097 Age 0.198*** 0.015 0.197*** 0.015 0.197*** 0.015 0.203*** 0.015 Age2 -0.002*** <0.001 -0.002*** <0.001 -0.002*** <0.001 -0.002*** <0.001 Married 0.370*** 0.110 0.338** 0.110 0.342** 0.110 0.340** 0.110
SES Education (ref.=0-6)
Intermediate (7-12) -0.070 0.091 -0.067 0.091 0.690 0.531 0.600 0.531 High (12+) -0.478* 0.188 -0.473* 0.187 0.139 1.053 0.120 1.052
Work Status (ref.=not working) -0.314* 0.128 -0.274* 0.127 -0.262* 0.127 -0.257* 0.127
Occupation (ref.= service) Professional -0.201 0.168 -0.252 0.167 -0.263 0.167 -0.260 0.167 Manual -0.3098 0.128 -0.363** 0.127 -0.374** 0.127 -0.376** 0.127
Wealth (ref.=1st Q) 2nd Qunitle 0.034 0.124 0.043 0.122 0.043 0.122 0.032 0.121 3rd Qunitle 0.040 0.129 0.039 0.126 0.041 0.126 0.038 0.126 4th Quintile 0.306* 0.144 0.296* 0.140 0.309* 0.140 0.309* 0.140 5th Qunitile 0.388* 0.156 0.333* 0.152 0.340* 0.152 0.341* 0.152
Income (ref.=1st Q) 2nd Qunitle 0.133 0.134 0.118 0.132 1.173 0.835 1.082 0.834 3rd Qunitle 0.407* 0.172 0.375* 0.166 0.138 0.832 0.127 0.831 4th Quintile 0.612** 0.215 0.547** 0.206 0.050 0.842 0.072 0.841 5th Qunitile 0.716* 0.289 0.616* 0.276 -0.297 0.888 -0.288 0.887
Relative Income (RDI) -0.226 0.499 -0.122 0.474 -0.144 0.474 -0.186 0.473 Behavioral Control
Smoker -0.563*** 0.100 Alcohol Consumption 0.013 0.037
Level-2 Variables: Community Characteristics
Mean Income (in 1000 yuan) -0.001 0.014 -0.024* 0.012 -0.024 0.012 -0.023 0.012 Mean education (in years) -0.089 0.049 -0.053 0.041 -0.056 0.041 -0.060 0.041 Urbanicity Index 0.010* 0.005 0.011* 0.004 0.011* 0.004 0.011* 0.004 Urban (ref.=Rural ) 0.165 0.181 0.210 0.151 0.211 0.151 0.199 0.151 Gini Coefficient *100 -0.090*** 0.010 -0.120*** 0.011 -0.115*** 0.016 -0.116 0.016
Province Indicator Jiangsu 1.444*** 0.231 1.393*** 0.232 1.366*** 0.232 Guangxi -1.032*** 0.177 -1.020*** 0.177 -1.028*** 0.177
Cross-level Intearaction Gini*Low Income (Q2) -0.016 0.011 -0.014 0.011 Gini*Middle Income (Q3) -0.013 0.022 -0.013 0.022 Gini*High Income (Q4) -0.022 0.017 -0.020 0.017 Gini*Top Income (Q5) 0.005 0.017 0.006 0.017 Gini*Middle Education 0.011 0.017 0.011 0.017 Gini*High Education 0.019 0.018 0.020 0.018
Random-effects Parameters Random Intercept 0.566 (0.051) 0.566 (0.051) 0.565 (0.051) 0.566 (0.051) Level-1 Residual 3.404 (0.025) 3.404 (0.025) 3.402 (0.025) 3.396 (0.025) Model Fit Statistics (BIC) 51173.050 51,110.050 51,157.590 51,143.450
Notes: Number of observation = 9586; Number of community = 218. Numbers are coefficients. Random-effects parameters have standard errors in parentheses. *Significance at 5% level; ** significance at 1% level; *** significance at 0.1% level
257
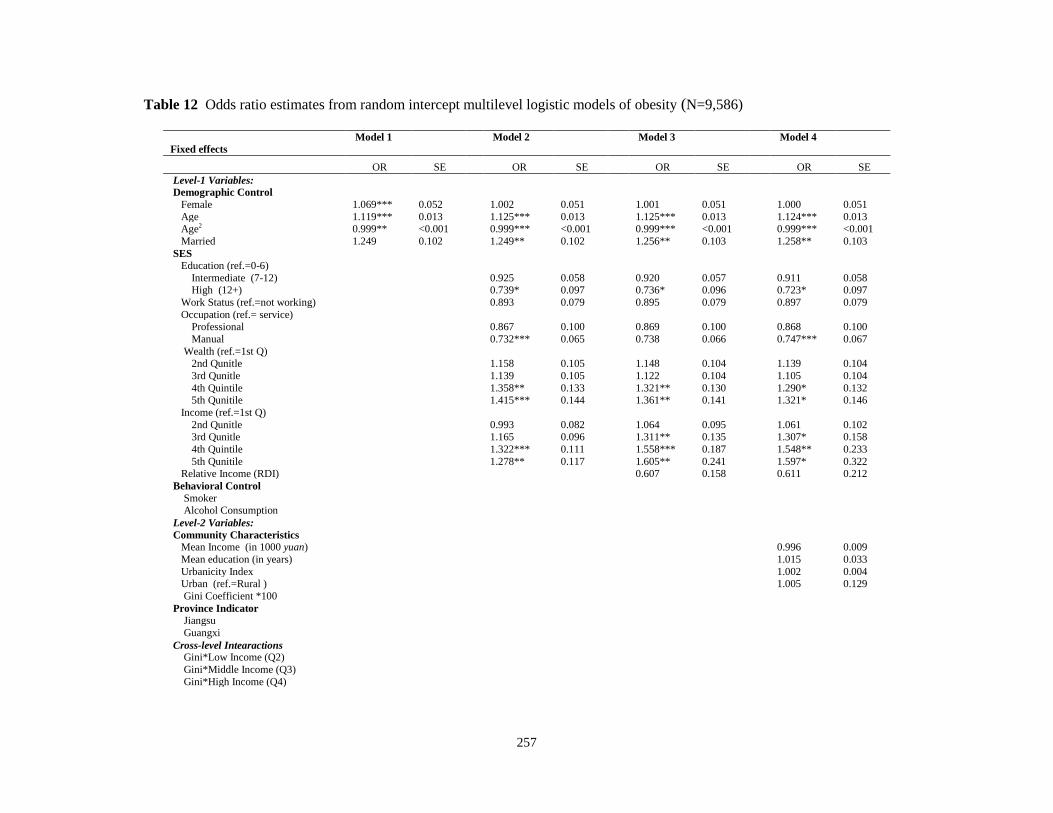
Table 12 Odds ratio estimates from random intercept multilevel logistic models of obesity (N=9,586)
Model 1 Model 2 Model 3 Model 4 Fixed effects
OR SE OR SE OR SE OR SE Level-1 Variables: Demographic Control
Female 1.069*** 0.052 1.002 0.051 1.001 0.051 1.000 0.051 Age 1.119*** 0.013 1.125*** 0.013 1.125*** 0.013 1.124*** 0.013 Age2 0.999** <0.001 0.999*** <0.001 0.999*** <0.001 0.999*** <0.001 Married 1.249 0.102 1.249** 0.102 1.256** 0.103 1.258** 0.103
SES Education (ref.=0-6)
Intermediate (7-12) 0.925 0.058 0.920 0.057 0.911 0.058 High (12+) 0.739* 0.097 0.736* 0.096 0.723* 0.097
Work Status (ref.=not working) 0.893 0.079 0.895 0.079 0.897 0.079 Occupation (ref.= service)
Professional 0.867 0.100 0.869 0.100 0.868 0.100 Manual 0.732*** 0.065 0.738 0.066 0.747*** 0.067
Wealth (ref.=1st Q) 2nd Qunitle 1.158 0.105 1.148 0.104 1.139 0.104 3rd Qunitle 1.139 0.105 1.122 0.104 1.105 0.104 4th Quintile 1.358** 0.133 1.321** 0.130 1.290* 0.132 5th Qunitile 1.415*** 0.144 1.361** 0.141 1.321* 0.146
Income (ref.=1st Q) 2nd Qunitle 0.993 0.082 1.064 0.095 1.061 0.102 3rd Qunitle 1.165 0.096 1.311** 0.135 1.307* 0.158 4th Quintile 1.322*** 0.111 1.558*** 0.187 1.548** 0.233 5th Qunitile 1.278** 0.117 1.605** 0.241 1.597* 0.322
Relative Income (RDI) 0.607 0.158 0.611 0.212 Behavioral Control
Smoker Alcohol Consumption
Level-2 Variables: Community Characteristics
Mean Income (in 1000 yuan) 0.996 0.009 Mean education (in years) 1.015 0.033 Urbanicity Index 1.002 0.004 Urban (ref.=Rural ) 1.005 0.129 Gini Coefficient *100
Province Indicator Jiangsu Guangxi
Cross-level Intearactions Gini*Low Income (Q2) Gini*Middle Income (Q3) Gini*High Income (Q4)
258
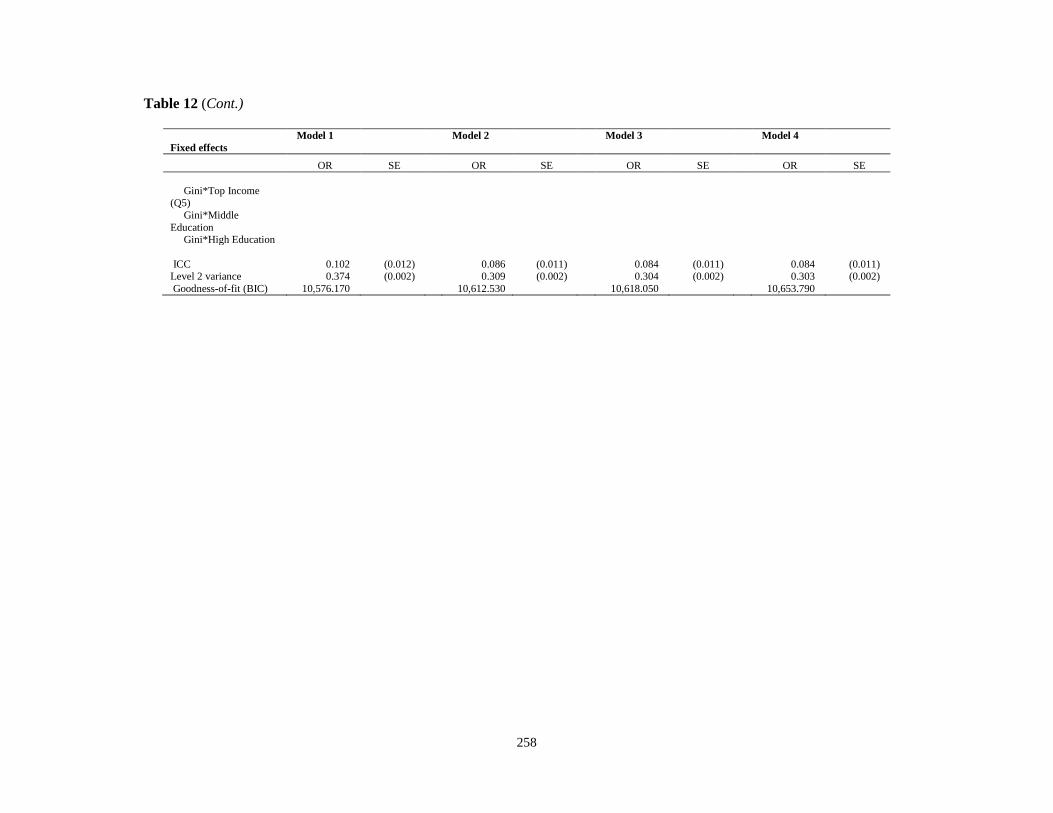
Table 12 (Cont.)
Model 1 Model 2 Model 3 Model 4 Fixed effects
OR SE OR SE OR SE OR SE Gini*Top Income
(Q5) Gini*Middle
Education Gini*High Education
ICC 0.102 (0.012) 0.086 (0.011) 0.084 (0.011) 0.084 (0.011) Level 2 variance 0.374 (0.002) 0.309 (0.002) 0.304 (0.002) 0.303 (0.002) Goodness-of-fit (BIC) 10,576.170 10,612.530 10,618.050 10,653.790
259
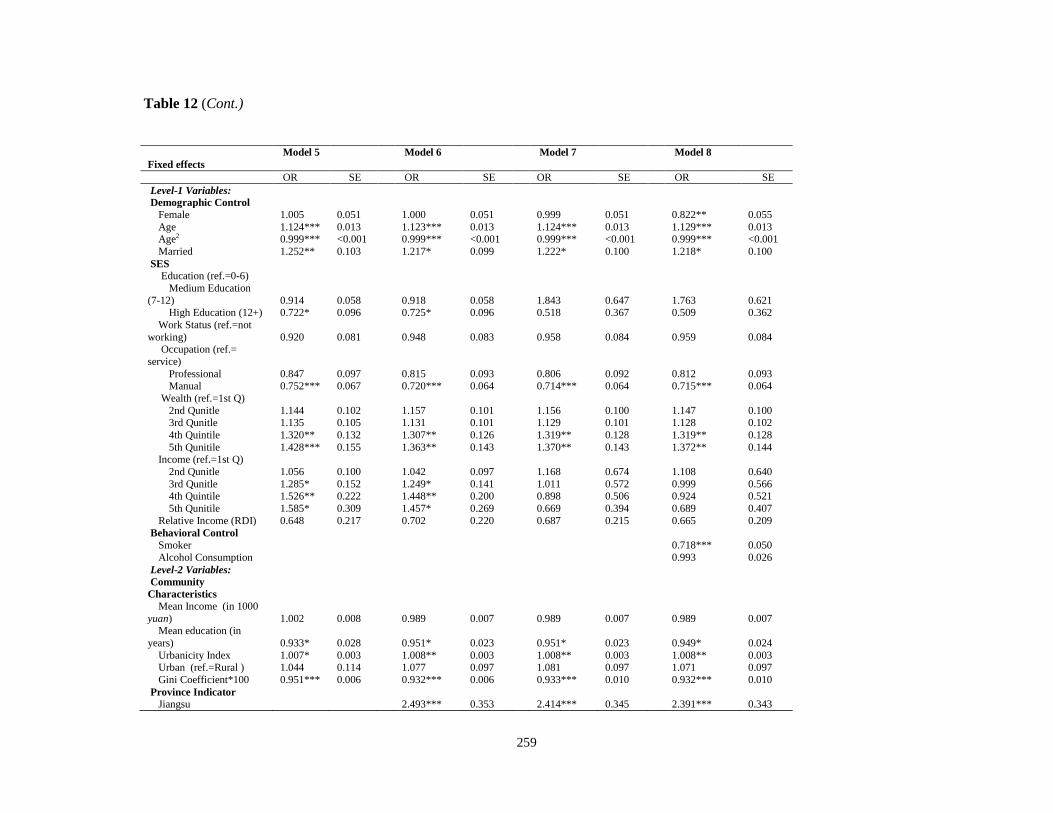
Table 12 (Cont.)
Model 5 Model 6 Model 7 Model 8 Fixed effects OR SE OR SE OR SE OR SE Level-1 Variables: Demographic Control
Female 1.005 0.051 1.000 0.051 0.999 0.051 0.822** 0.055 Age 1.124*** 0.013 1.123*** 0.013 1.124*** 0.013 1.129*** 0.013 Age2 0.999*** <0.001 0.999*** <0.001 0.999*** <0.001 0.999*** <0.001 Married 1.252** 0.103 1.217* 0.099 1.222* 0.100 1.218* 0.100
SES Education (ref.=0-6)
Medium Education (7-12) 0.914 0.058 0.918 0.058 1.843 0.647 1.763 0.621
High Education (12+) 0.722* 0.096 0.725* 0.096 0.518 0.367 0.509 0.362 Work Status (ref.=not
working) 0.920 0.081 0.948 0.083 0.958 0.084 0.959 0.084 Occupation (ref.=
service) Professional 0.847 0.097 0.815 0.093 0.806 0.092 0.812 0.093 Manual 0.752*** 0.067 0.720*** 0.064 0.714*** 0.064 0.715*** 0.064
Wealth (ref.=1st Q) 2nd Qunitle 1.144 0.102 1.157 0.101 1.156 0.100 1.147 0.100 3rd Qunitle 1.135 0.105 1.131 0.101 1.129 0.101 1.128 0.102 4th Quintile 1.320** 0.132 1.307** 0.126 1.319** 0.128 1.319** 0.128 5th Qunitile 1.428*** 0.155 1.363** 0.143 1.370** 0.143 1.372** 0.144
Income (ref.=1st Q) 2nd Qunitle 1.056 0.100 1.042 0.097 1.168 0.674 1.108 0.640 3rd Qunitle 1.285* 0.152 1.249* 0.141 1.011 0.572 0.999 0.566 4th Quintile 1.526** 0.222 1.448** 0.200 0.898 0.506 0.924 0.521 5th Qunitile 1.585* 0.309 1.457* 0.269 0.669 0.394 0.689 0.407
Relative Income (RDI) 0.648 0.217 0.702 0.220 0.687 0.215 0.665 0.209 Behavioral Control
Smoker 0.718*** 0.050 Alcohol Consumption 0.993 0.026
Level-2 Variables: Community
Characteristics Mean Income (in 1000
yuan) 1.002 0.008 0.989 0.007 0.989 0.007 0.989 0.007 Mean education (in
years) 0.933* 0.028 0.951* 0.023 0.951* 0.023 0.949* 0.024 Urbanicity Index 1.007* 0.003 1.008** 0.003 1.008** 0.003 1.008** 0.003 Urban (ref.=Rural ) 1.044 0.114 1.077 0.097 1.081 0.097 1.071 0.097 Gini Coefficient*100 0.951*** 0.006 0.932*** 0.006 0.933*** 0.010 0.932*** 0.010
Province Indicator Jiangsu 2.493*** 0.353 2.414*** 0.345 2.391*** 0.343
260
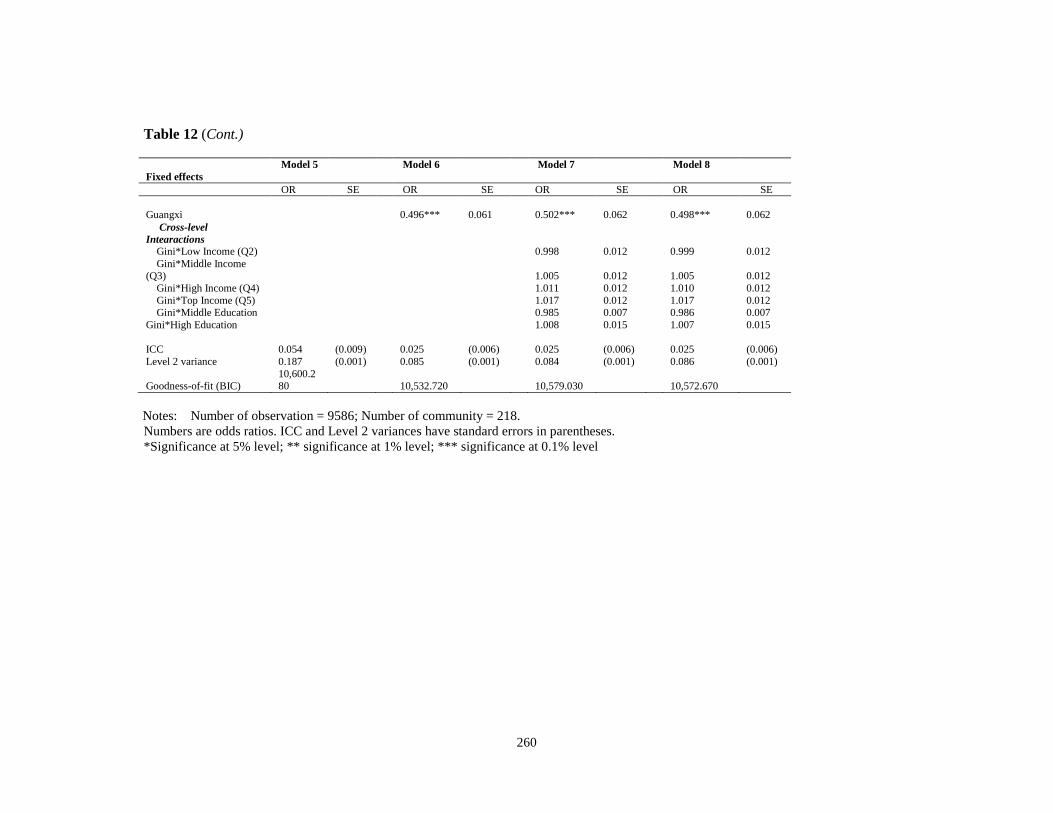
Table 12 (Cont.)
Model 5 Model 6 Model 7 Model 8 Fixed effects OR SE OR SE OR SE OR SE Guangxi 0.496*** 0.061 0.502*** 0.062 0.498*** 0.062
Cross-level
Intearactions Gini*Low Income (Q2) 0.998 0.012 0.999 0.012 Gini*Middle Income
(Q3) 1.005 0.012 1.005 0.012 Gini*High Income (Q4) 1.011 0.012 1.010 0.012 Gini*Top Income (Q5) 1.017 0.012 1.017 0.012 Gini*Middle Education 0.985 0.007 0.986 0.007
Gini*High Education 1.008 0.015 1.007 0.015 ICC 0.054 (0.009) 0.025 (0.006) 0.025 (0.006) 0.025 (0.006) Level 2 variance 0.187 (0.001) 0.085 (0.001) 0.084 (0.001) 0.086 (0.001)
Goodness-of-fit (BIC) 10,600.280 10,532.720 10,579.030 10,572.670
Notes: Number of observation = 9586; Number of community = 218.
Numbers are odds ratios. ICC and Level 2 variances have standard errors in parentheses. *Significance at 5% level; ** significance at 1% level; *** significance at 0.1% level
261
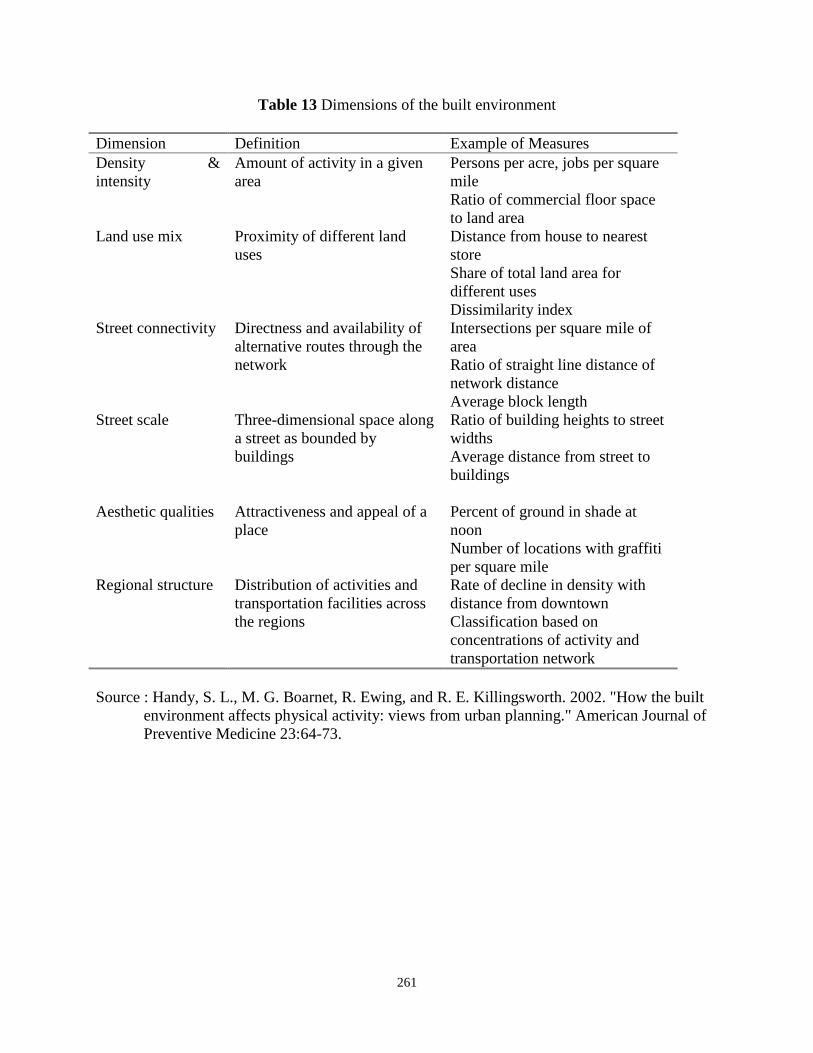
Table 13 Dimensions of the built environment Dimension Definition Example of Measures Density & intensity
Amount of activity in a given area
Persons per acre, jobs per square mile Ratio of commercial floor space to land area
Land use mix Proximity of different land uses
Distance from house to nearest store Share of total land area for different uses Dissimilarity index
Street connectivity Directness and availability of alternative routes through the network
Intersections per square mile of area Ratio of straight line distance of network distance Average block length
Street scale Three-dimensional space along a street as bounded by buildings
Ratio of building heights to street widths Average distance from street to buildings
Aesthetic qualities Attractiveness and appeal of a place
Percent of ground in shade at noon Number of locations with graffiti per square mile
Regional structure Distribution of activities and transportation facilities across the regions
Rate of decline in density with distance from downtown Classification based on concentrations of activity and transportation network
Source : Handy, S. L., M. G. Boarnet, R. Ewing, and R. E. Killingsworth. 2002. "How the built
environment affects physical activity: views from urban planning." American Journal of Preventive Medicine 23:64-73.
262
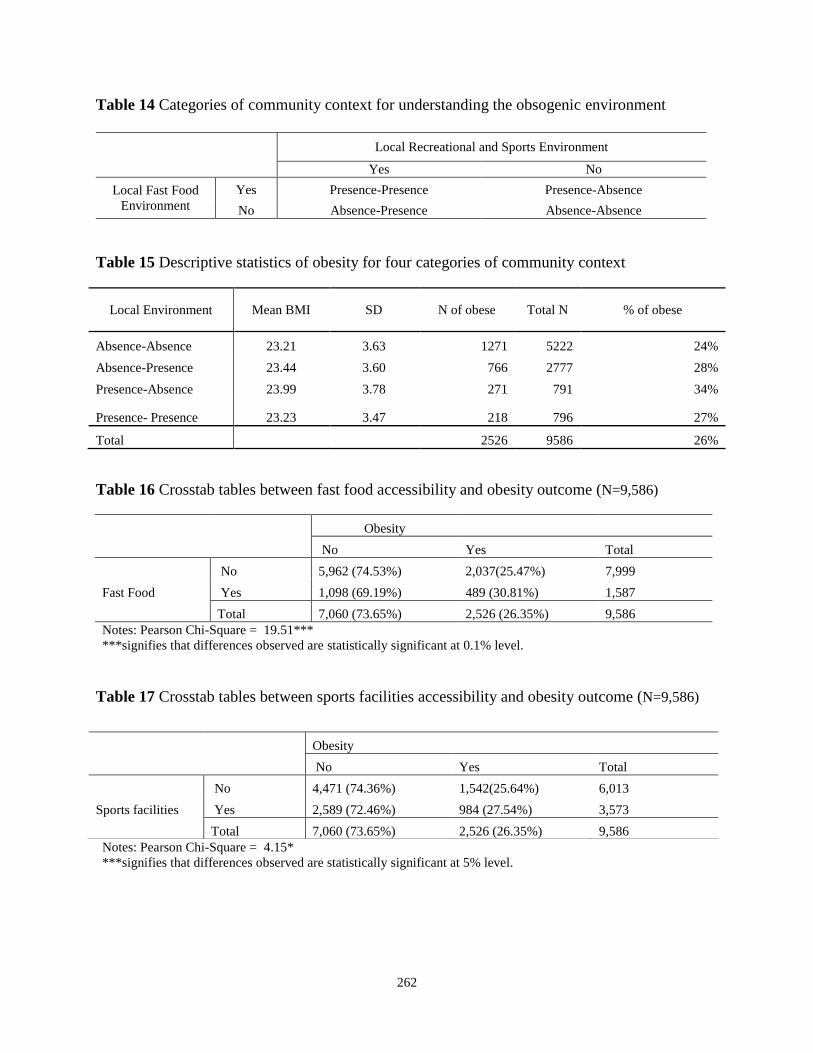
Table 14 Categories of community context for understanding the obsogenic environment
Local Recreational and Sports Environment
Yes No Local Fast Food
Environment Yes Presence-Presence Presence-Absence No Absence-Presence Absence-Absence
Table 15 Descriptive statistics of obesity for four categories of community context
Local Environment Mean BMI SD N of obese Total N % of obese
Absence-Absence 23.21 3.63 1271 5222 24% Absence-Presence 23.44 3.60 766 2777 28% Presence-Absence 23.99 3.78 271 791 34%
Presence- Presence 23.23 3.47 218 796 27%
Total
2526 9586 26%
Table 16 Crosstab tables between fast food accessibility and obesity outcome (N=9,586)
Obesity
No Yes Total
Fast Food No 5,962 (74.53%) 2,037(25.47%) 7,999 Yes 1,098 (69.19%) 489 (30.81%) 1,587
Total 7,060 (73.65%) 2,526 (26.35%) 9,586 Notes: Pearson Chi-Square = 19.51*** ***signifies that differences observed are statistically significant at 0.1% level.
Table 17 Crosstab tables between sports facilities accessibility and obesity outcome (N=9,586)
Notes: Pearson Chi-Square = 4.15* ***signifies that differences observed are statistically significant at 5% level.
Obesity
No Yes Total
Sports facilities No 4,471 (74.36%) 1,542(25.64%) 6,013 Yes 2,589 (72.46%) 984 (27.54%) 3,573
Total 7,060 (73.65%) 2,526 (26.35%) 9,586
263
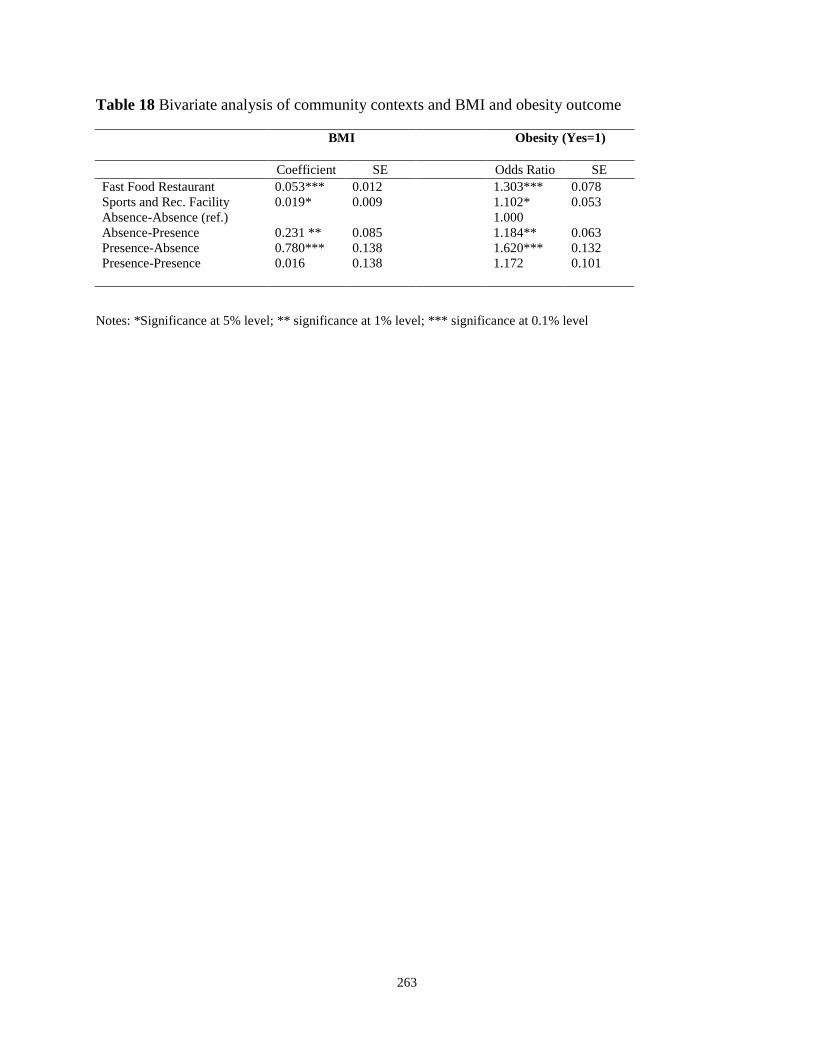
Table 18 Bivariate analysis of community contexts and BMI and obesity outcome
BMI
Obesity (Yes=1)
Coefficient SE Odds Ratio SE Fast Food Restaurant 0.053*** 0.012
1.303*** 0.078
Sports and Rec. Facility 0.019* 0.009
1.102* 0.053 Absence-Absence (ref.)
1.000
Absence-Presence 0.231 ** 0.085
1.184** 0.063 Presence-Absence 0.780*** 0.138
1.620*** 0.132
Presence-Presence 0.016 0.138
1.172 0.101
Notes: *Significance at 5% level; ** significance at 1% level; *** significance at 0.1% level
264
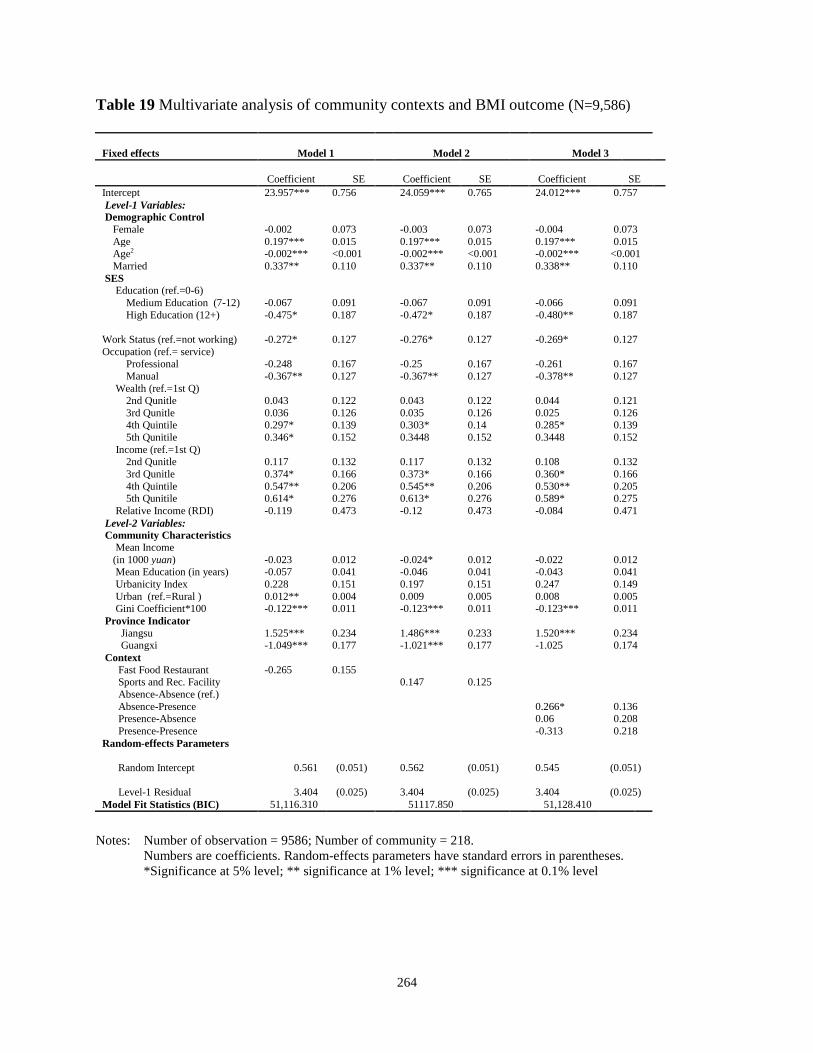
Table 19 Multivariate analysis of community contexts and BMI outcome (N=9,586)
Model 1
Model 2
Model 3 Fixed effects
Coefficient SE Coefficient SE
Coefficient
SE
Intercept 23.957*** 0.756 24.059*** 0.765
24.012*** 0.757 Level-1 Variables:
Demographic Control
Female -0.002 0.073 -0.003 0.073
-0.004 0.073 Age 0.197*** 0.015 0.197*** 0.015
0.197*** 0.015
Age2 -0.002*** <0.001 -0.002*** <0.001
-0.002*** <0.001 Married 0.337** 0.110 0.337** 0.110
0.338** 0.110
SES
Education (ref.=0-6)
Medium Education (7-12) -0.067 0.091 -0.067 0.091
-0.066 0.091
High Education (12+) -0.475* 0.187 -0.472* 0.187
-0.480** 0.187
-0.272* 0.127
-0.276* 0.127
-0.269* 0.127 Work Status (ref.=not working) Occupation (ref.= service)
Professional -0.248 0.167 -0.25 0.167
-0.261 0.167
Manual -0.367** 0.127 -0.367** 0.127
-0.378** 0.127 Wealth (ref.=1st Q)
2nd Qunitle 0.043 0.122 0.043 0.122
0.044 0.121 3rd Qunitle 0.036 0.126 0.035 0.126
0.025 0.126
4th Quintile 0.297* 0.139 0.303* 0.14
0.285* 0.139 5th Qunitile 0.346* 0.152 0.3448 0.152
0.3448 0.152
Income (ref.=1st Q)
2nd Qunitle 0.117 0.132 0.117 0.132
0.108 0.132
3rd Qunitle 0.374* 0.166 0.373* 0.166
0.360* 0.166 4th Quintile 0.547** 0.206 0.545** 0.206
0.530** 0.205
5th Qunitile 0.614* 0.276 0.613* 0.276
0.589* 0.275 Relative Income (RDI) -0.119 0.473 -0.12 0.473
-0.084 0.471
Level-2 Variables:
Community Characteristics
Mean Income -0.023 0.012
-0.024* 0.012
-0.022 0.012 (in 1000 yuan) Mean Education (in years) -0.057 0.041 -0.046 0.041
-0.043 0.041
Urbanicity Index 0.228 0.151 0.197 0.151
0.247 0.149 Urban (ref.=Rural ) 0.012** 0.004 0.009 0.005
0.008 0.005
Gini Coefficient*100 -0.122*** 0.011 -0.123*** 0.011
-0.123*** 0.011 Province Indicator
Jiangsu 1.525*** 0.234 1.486*** 0.233
1.520*** 0.234 Guangxi -1.049*** 0.177 -1.021*** 0.177
-1.025 0.174
Context
Fast Food Restaurant -0.265 0.155 Sports and Rec. Facility
0.147 0.125
Absence-Absence (ref.)
Absence-Presence
0.266* 0.136
Presence-Absence
0.06 0.208 Presence-Presence
-0.313 0.218
Random-effects Parameters
Random Intercept 0.561 (0.051)
0.562 (0.051) 0.545 (0.051)
Level-1 Residual 3.404 (0.025)
3.404 (0.025)
3.404 (0.025)
Model Fit Statistics (BIC) 51,116.310 51117.850 51,128.410
Notes: Number of observation = 9586; Number of community = 218. Numbers are coefficients. Random-effects parameters have standard errors in parentheses. *Significance at 5% level; ** significance at 1% level; *** significance at 0.1% level
265
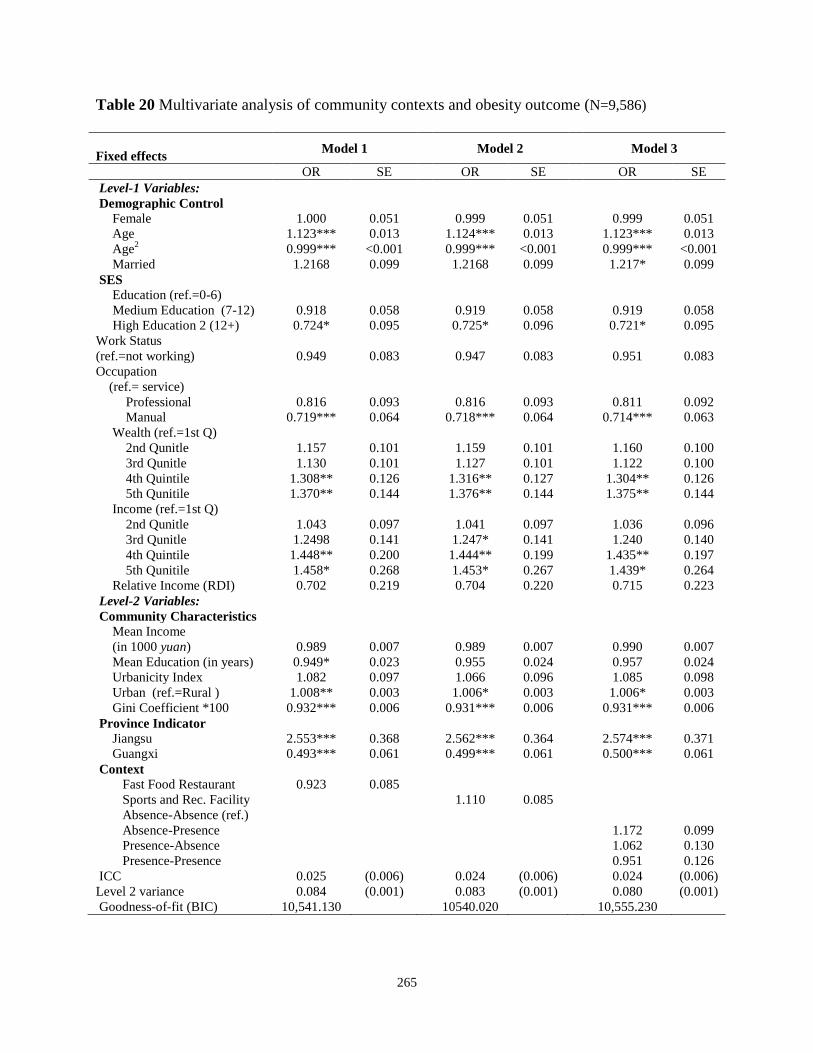
Table 20 Multivariate analysis of community contexts and obesity outcome (N=9,586)
Model 1 Model 2
Model 3
Fixed effects
OR SE OR SE OR SE
Level-1 Variables:
Demographic Control
Female 1.000 0.051 0.999 0.051 0.999 0.051 Age 1.123*** 0.013 1.124*** 0.013 1.123*** 0.013 Age2 0.999*** <0.001 0.999*** <0.001 0.999*** <0.001 Married 1.2168 0.099 1.2168 0.099 1.217* 0.099
SES
Education (ref.=0-6)
Medium Education (7-12) 0.918 0.058 0.919 0.058 0.919 0.058
High Education 2 (12+) 0.724* 0.095 0.725* 0.096 0.721* 0.095 Work Status (ref.=not working) 0.949 0.083
0.947 0.083
0.951 0.083
Occupation (ref.= service)
Professional 0.816 0.093 0.816 0.093 0.811 0.092 Manual 0.719*** 0.064 0.718*** 0.064 0.714*** 0.063
Wealth (ref.=1st Q)
2nd Qunitle 1.157 0.101 1.159 0.101 1.160 0.100
3rd Qunitle 1.130 0.101 1.127 0.101 1.122 0.100 4th Quintile 1.308** 0.126 1.316** 0.127 1.304** 0.126 5th Qunitile 1.370** 0.144 1.376** 0.144 1.375** 0.144
Income (ref.=1st Q)
2nd Qunitle 1.043 0.097 1.041 0.097 1.036 0.096
3rd Qunitle 1.2498 0.141 1.247* 0.141 1.240 0.140 4th Quintile 1.448** 0.200 1.444** 0.199 1.435** 0.197 5th Qunitile 1.458* 0.268 1.453* 0.267 1.439* 0.264
Relative Income (RDI) 0.702 0.219 0.704 0.220 0.715 0.223 Level-2 Variables:
Community Characteristics
Mean Income (in 1000 yuan) 0.989 0.007
0.989 0.007
0.990 0.007
Mean Education (in years) 0.949* 0.023 0.955 0.024 0.957 0.024 Urbanicity Index 1.082 0.097 1.066 0.096 1.085 0.098 Urban (ref.=Rural ) 1.008** 0.003 1.006* 0.003 1.006* 0.003 Gini Coefficient *100 0.932*** 0.006 0.931*** 0.006 0.931*** 0.006
Province Indicator
Jiangsu 2.553*** 0.368 2.562*** 0.364 2.574*** 0.371 Guangxi 0.493*** 0.061 0.499*** 0.061 0.500*** 0.061
Context
Fast Food Restaurant 0.923 0.085
Sports and Rec. Facility
1.110 0.085
Absence-Absence (ref.)
Absence-Presence
1.172 0.099
Presence-Absence
1.062 0.130 Presence-Presence
0.951 0.126
ICC 0.025 (0.006) 0.024 (0.006) 0.024 (0.006) Level 2 variance 0.084 (0.001) 0.083 (0.001) 0.080 (0.001) Goodness-of-fit (BIC) 10,541.130
10540.020
10,555.230
266
Notes: Number of observation = 9586; Number of community = 218. Numbers are odds ratios. ICC and Level 2 variances have standard errors in parentheses. *Significance at 5% level; ** significance at 1% level; *** significance at 0.1% level
267
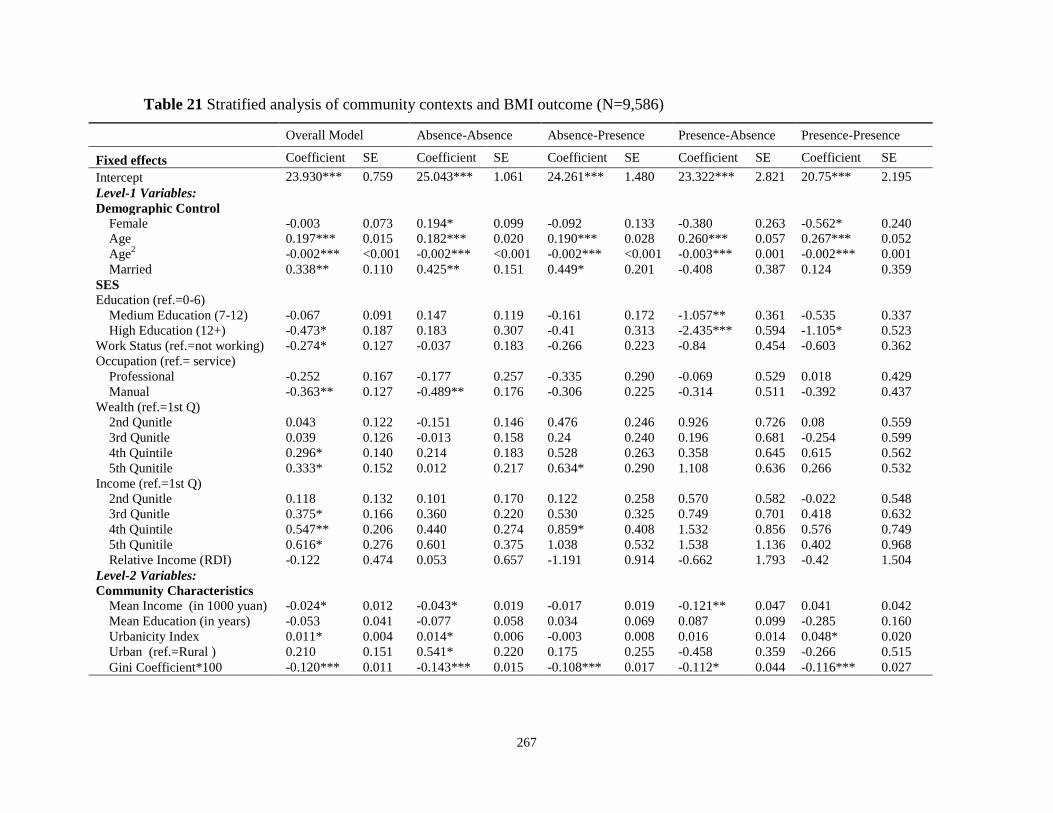
Table 21 Stratified analysis of community contexts and BMI outcome (N=9,586)
Overall Model Absence-Absence Absence-Presence Presence-Absence Presence-Presence
Fixed effects Coefficient SE Coefficient SE Coefficient SE Coefficient SE Coefficient SE Intercept 23.930*** 0.759 25.043*** 1.061 24.261*** 1.480 23.322*** 2.821 20.75*** 2.195 Level-1 Variables:
Demographic Control Female -0.003 0.073 0.194* 0.099 -0.092 0.133 -0.380 0.263 -0.562* 0.240 Age 0.197*** 0.015 0.182*** 0.020 0.190*** 0.028 0.260*** 0.057 0.267*** 0.052 Age2 -0.002*** <0.001 -0.002*** <0.001 -0.002*** <0.001 -0.003*** 0.001 -0.002*** 0.001 Married 0.338** 0.110 0.425** 0.151 0.449* 0.201 -0.408 0.387 0.124 0.359
SES Education (ref.=0-6) Medium Education (7-12) -0.067 0.091 0.147 0.119 -0.161 0.172 -1.057** 0.361 -0.535 0.337 High Education (12+) -0.473* 0.187 0.183 0.307 -0.41 0.313 -2.435*** 0.594 -1.105* 0.523
Work Status (ref.=not working) -0.274* 0.127 -0.037 0.183 -0.266 0.223 -0.84 0.454 -0.603 0.362 Occupation (ref.= service) Professional -0.252 0.167 -0.177 0.257 -0.335 0.290 -0.069 0.529 0.018 0.429
Manual -0.363** 0.127 -0.489** 0.176 -0.306 0.225 -0.314 0.511 -0.392 0.437 Wealth (ref.=1st Q) 2nd Qunitle 0.043 0.122 -0.151 0.146 0.476 0.246 0.926 0.726 0.08 0.559
3rd Qunitle 0.039 0.126 -0.013 0.158 0.24 0.240 0.196 0.681 -0.254 0.599 4th Quintile 0.296* 0.140 0.214 0.183 0.528 0.263 0.358 0.645 0.615 0.562 5th Qunitile 0.333* 0.152 0.012 0.217 0.634* 0.290 1.108 0.636 0.266 0.532
Income (ref.=1st Q) 2nd Qunitle 0.118 0.132 0.101 0.170 0.122 0.258 0.570 0.582 -0.022 0.548 3rd Qunitle 0.375* 0.166 0.360 0.220 0.530 0.325 0.749 0.701 0.418 0.632 4th Quintile 0.547** 0.206 0.440 0.274 0.859* 0.408 1.532 0.856 0.576 0.749 5th Qunitile 0.616* 0.276 0.601 0.375 1.038 0.532 1.538 1.136 0.402 0.968 Relative Income (RDI) -0.122 0.474 0.053 0.657 -1.191 0.914 -0.662 1.793 -0.42 1.504
Level-2 Variables: Community Characteristics Mean Income (in 1000 yuan) -0.024* 0.012 -0.043* 0.019 -0.017 0.019 -0.121** 0.047 0.041 0.042
Mean Education (in years) -0.053 0.041 -0.077 0.058 0.034 0.069 0.087 0.099 -0.285 0.160 Urbanicity Index 0.011* 0.004 0.014* 0.006 -0.003 0.008 0.016 0.014 0.048* 0.020 Urban (ref.=Rural ) 0.210 0.151 0.541* 0.220 0.175 0.255 -0.458 0.359 -0.266 0.515 Gini Coefficient*100 -0.120*** 0.011 -0.143*** 0.015 -0.108*** 0.017 -0.112* 0.044 -0.116*** 0.027
268
Table 21 (Cont.)
Notes: Number of observation = 9586; Number of community = 218. Numbers are coefficients. Random-effects parameters have standard errors in parentheses. In the Presence-Absence context, Guangxi Province is omitted due to collinearity. *Significance at 5% level; ** significance at 1% level; *** significance at 0.1% level
Overall Model Absence-Absence Absence-Presence Presence-Absence Presence-Presence
Fixed effects Coefficient SE Coefficient SE Coefficient SE Coefficient SE Coefficient SE Province Indicator Jiangsu 1.444*** 0.231 1.357*** 0.388 1.218** 0.384 2.297** 0.814 2.125*** 0.547
Guangxi -1.032*** 0.177 -1.062*** 0.220 -1.077*** 0.278 (omitted) -0.315 0.532 Random-effects Parameters
Random intercept 0.566 (0.051) 0.504 (0.068) 0.463 (0.093) 1.63E-11 (9.03E-11) 1.15E-10 (6.89E-10) Level-1 Residual 3.404 (0.025) 3.404 (0.034) 3.358 (0.046) 3.552 (0.089) 3.225 (0.081) Model Chi-square 665.27 392.59 258.33 105.62 124.76 Model df 25
25 25 24 25 -2 LL 50,853.35 27,687.34 14,647.36 4,249.81 4,122.89 LRT 145.958*** N 9,586 5,222 2,777 791 796
269
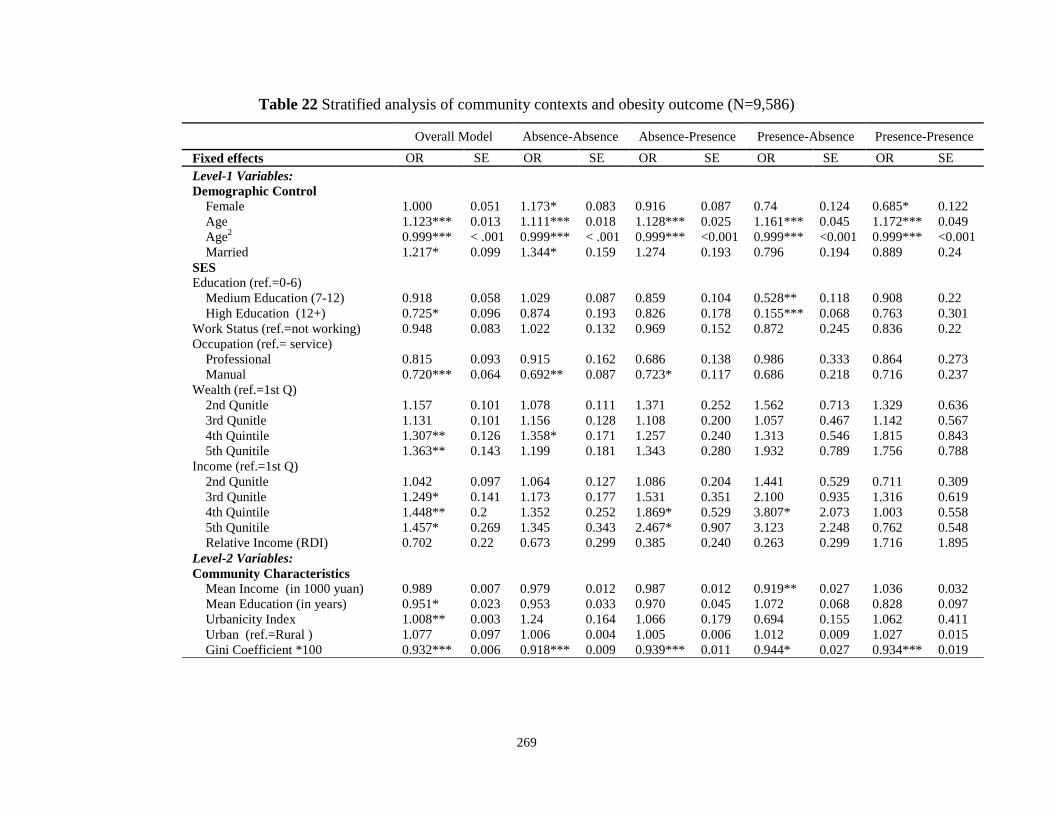
Table 22 Stratified analysis of community contexts and obesity outcome (N=9,586)
Overall Model Absence-Absence Absence-Presence Presence-Absence Presence-Presence
Fixed effects OR SE OR SE OR SE OR SE OR SE Level-1 Variables:
Demographic Control
Female 1.000 0.051 1.173* 0.083 0.916 0.087 0.74 0.124 0.685* 0.122 Age 1.123*** 0.013 1.111*** 0.018 1.128*** 0.025 1.161*** 0.045 1.172*** 0.049 Age2 0.999*** < .001 0.999*** < .001 0.999*** <0.001 0.999*** <0.001 0.999*** <0.001 Married 1.217* 0.099 1.344* 0.159 1.274 0.193 0.796 0.194 0.889 0.24
SES
Education (ref.=0-6) Medium Education (7-12) 0.918 0.058 1.029 0.087 0.859 0.104 0.528** 0.118 0.908 0.22
High Education (12+) 0.725* 0.096 0.874 0.193 0.826 0.178 0.155*** 0.068 0.763 0.301 Work Status (ref.=not working) 0.948 0.083 1.022 0.132 0.969 0.152 0.872 0.245 0.836 0.22 Occupation (ref.= service)
Professional 0.815 0.093 0.915 0.162 0.686 0.138 0.986 0.333 0.864 0.273 Manual 0.720*** 0.064 0.692** 0.087 0.723* 0.117 0.686 0.218 0.716 0.237
Wealth (ref.=1st Q) 2nd Qunitle 1.157 0.101 1.078 0.111 1.371 0.252 1.562 0.713 1.329 0.636
3rd Qunitle 1.131 0.101 1.156 0.128 1.108 0.200 1.057 0.467 1.142 0.567 4th Quintile 1.307** 0.126 1.358* 0.171 1.257 0.240 1.313 0.546 1.815 0.843 5th Qunitile 1.363** 0.143 1.199 0.181 1.343 0.280 1.932 0.789 1.756 0.788
Income (ref.=1st Q) 2nd Qunitle 1.042 0.097 1.064 0.127 1.086 0.204 1.441 0.529 0.711 0.309
3rd Qunitle 1.249* 0.141 1.173 0.177 1.531 0.351 2.100 0.935 1.316 0.619 4th Quintile 1.448** 0.2 1.352 0.252 1.869* 0.529 3.807* 2.073 1.003 0.558 5th Qunitile 1.457* 0.269 1.345 0.343 2.467* 0.907 3.123 2.248 0.762 0.548 Relative Income (RDI) 0.702 0.22 0.673 0.299 0.385 0.240 0.263 0.299 1.716 1.895
Level-2 Variables:
Community Characteristics
Mean Income (in 1000 yuan) 0.989 0.007 0.979 0.012 0.987 0.012 0.919** 0.027 1.036 0.032 Mean Education (in years) 0.951* 0.023 0.953 0.033 0.970 0.045 1.072 0.068 0.828 0.097 Urbanicity Index 1.008** 0.003 1.24 0.164 1.066 0.179 0.694 0.155 1.062 0.411 Urban (ref.=Rural ) 1.077 0.097 1.006 0.004 1.005 0.006 1.012 0.009 1.027 0.015 Gini Coefficient *100 0.932*** 0.006 0.918*** 0.009 0.939*** 0.011 0.944* 0.027 0.934*** 0.019
270
Table 22 (Cont.)
Overall Model Absence-Absence Absence-Presence Presence-Absence Presence-Presence
Fixed effects OR SE OR SE OR SE OR SE OR SE
Province Indicator
Jiangsu 2.493*** 0.353 2.908*** 0.713 2.077** 0.524 3.232* 1.699 2.908** 1.210 Guangxi 0.496*** 0.061 0.539*** 0.085 0.449*** 0.094 (omitted)
0.751 0.311
Random-effects Parameters
ICC 0.025 (0.006) 0.017 (0.008) 0.024 (0.011) 0.001 (0.017) <0.001 (<0.001) Level-2 Variance 0.085 (0.001) 0.056 (0.003) 0.082 (0.004) < 0.001 (<0.001) <0.001 (<0.001) Model Chi-square 476.58
260.86
171.89
81.11
66.00
Model df 25
25
25
24
25 -2 LL 10,285.180
5,411.650
2,997.18
915.616
858.091
LRT 102.646* N 9,586 5,222 2,777 791 796
Notes: Number of observation = 9586; Number of community = 218. Numbers are odds ratios. Random-effects parameters have standard errors in parentheses. In the Presence-Absence context, Guangxi Province is omitted due to collinearity. *Significance at 5% level; ** significance at 1% level; *** significance at 0.1% level
271
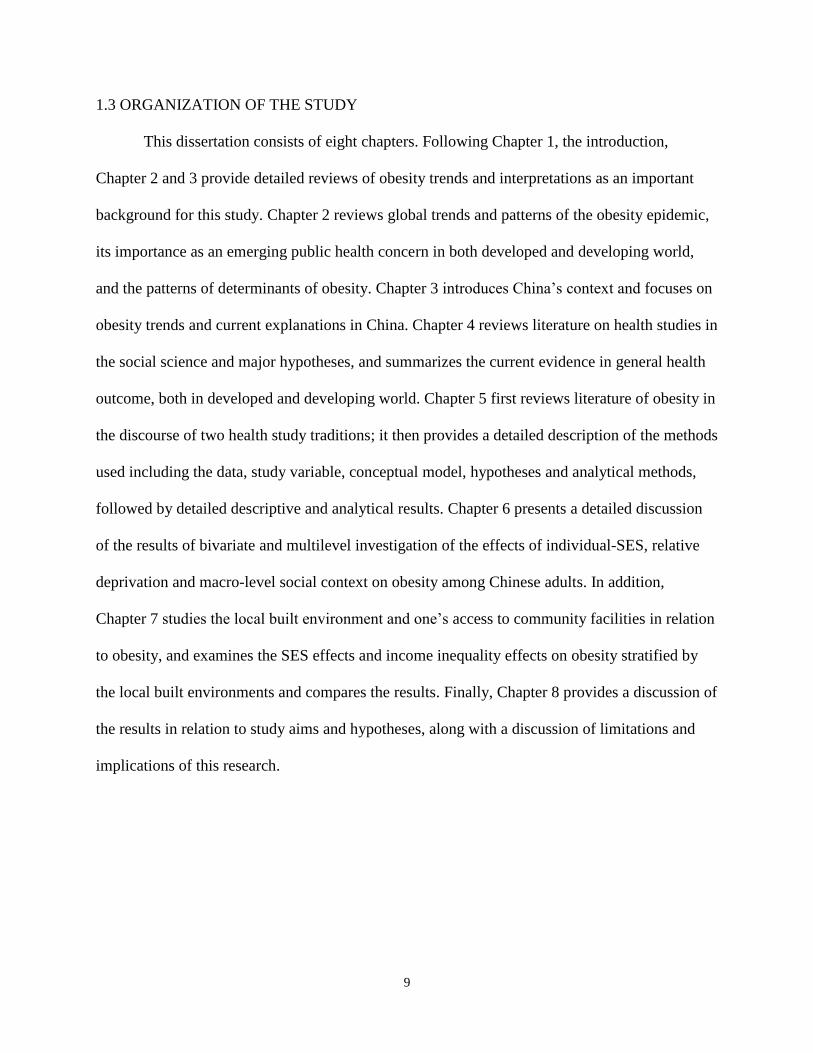
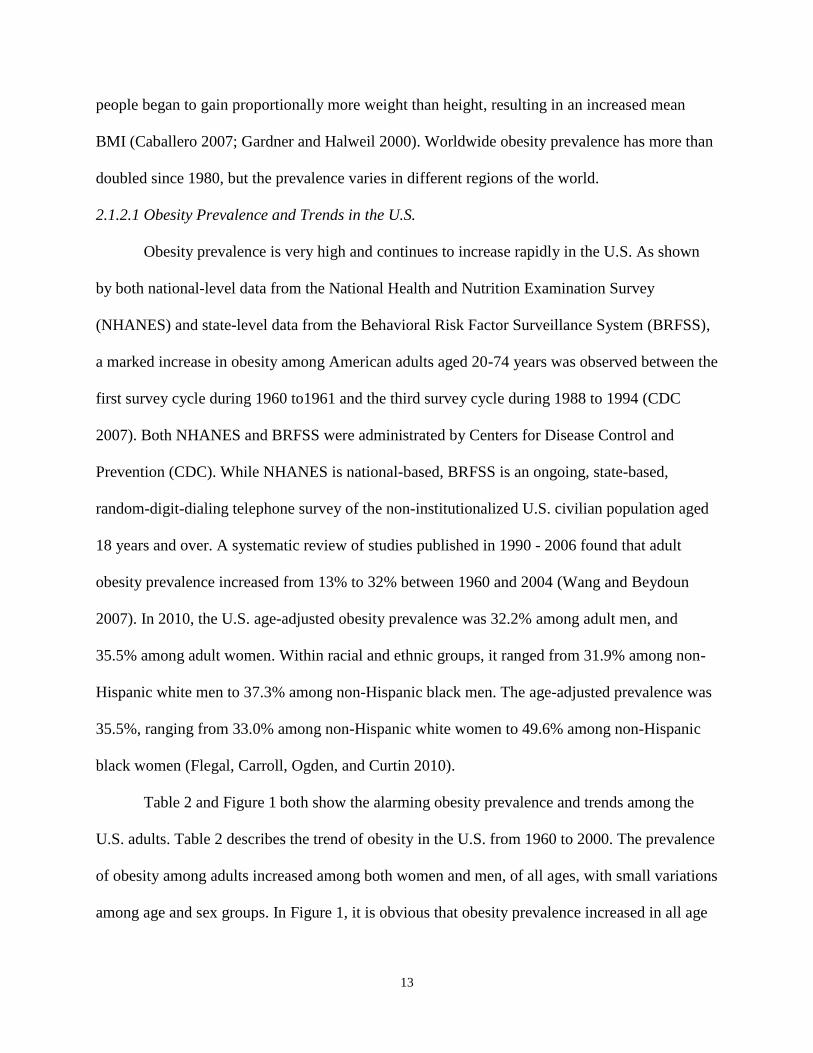
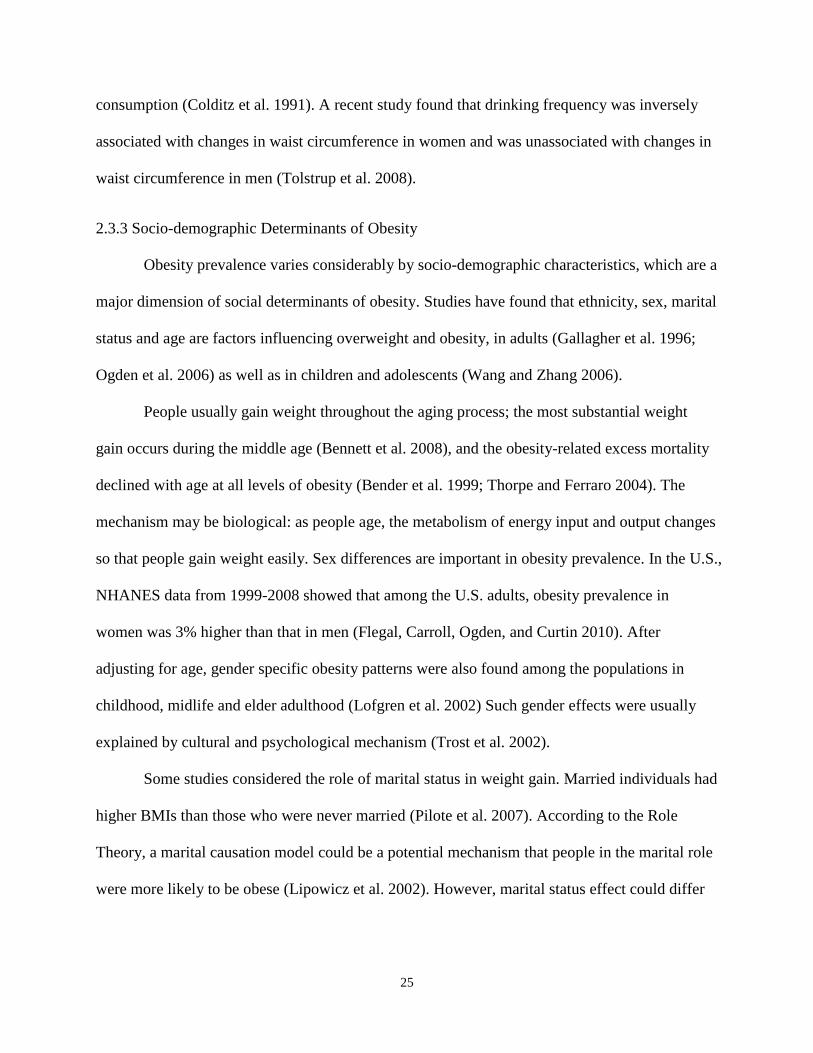
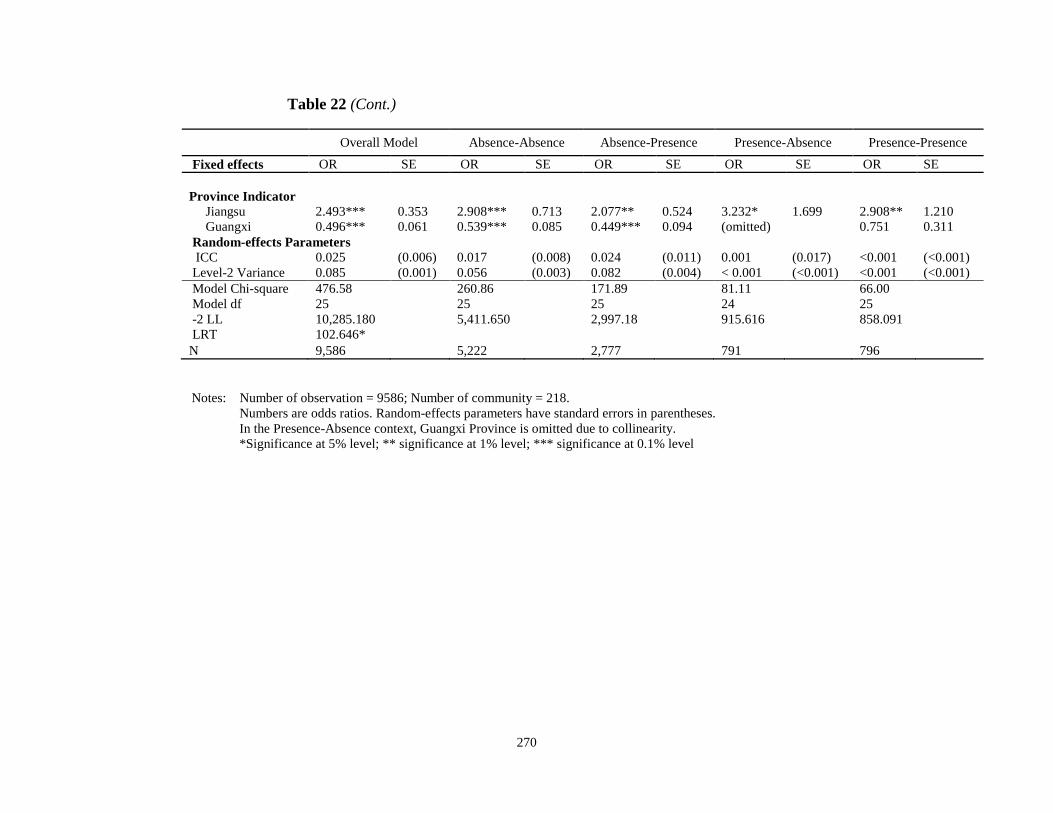
Figure 1 Overweight and obesity prevalence by age: United States, 1971-2006
Source: CDC/NCHS, NHANES 2008. "U.S. Obesity Trends: Trends by State 1985–2008." vol.
2010 http://www.win.niddk.nih.gov/statistics/index.htm. Accessed on April 20th, 2010.
272
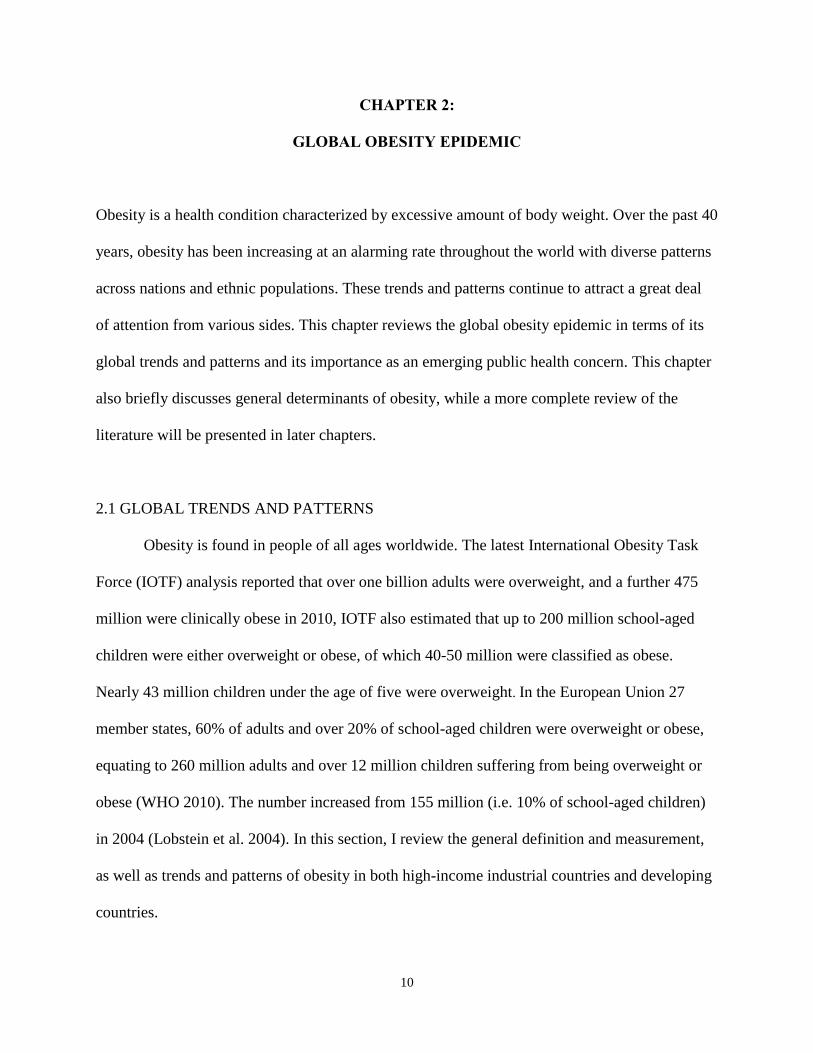
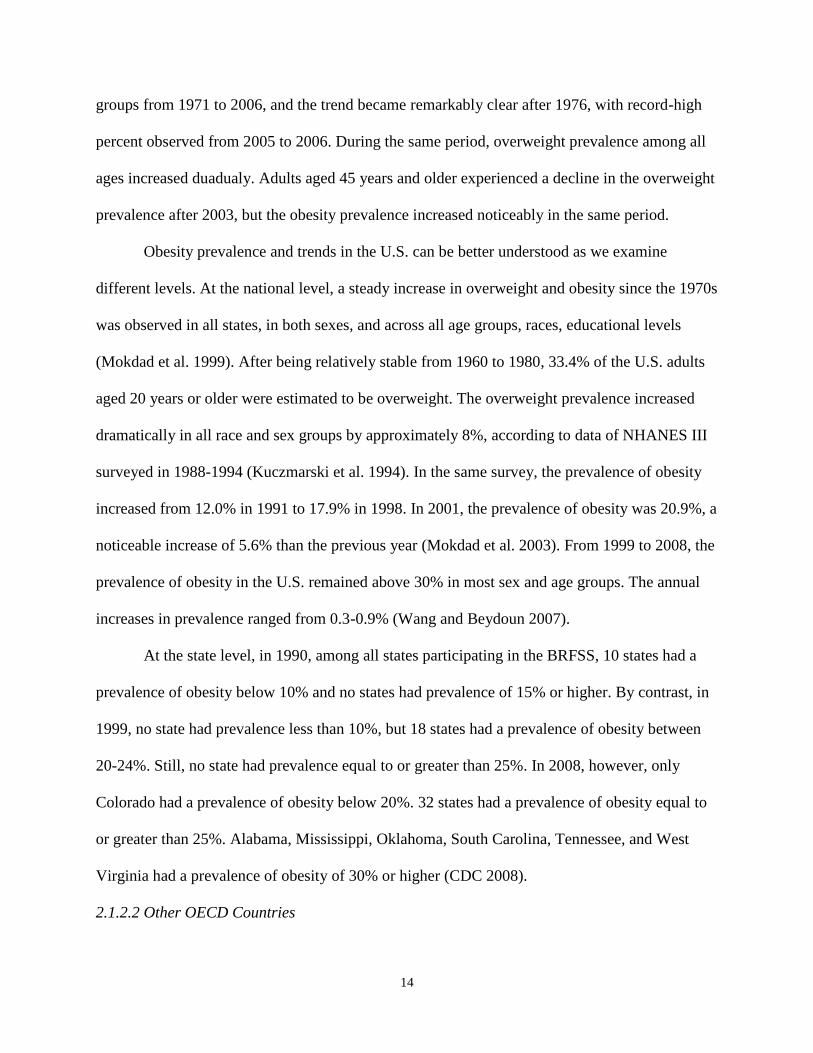
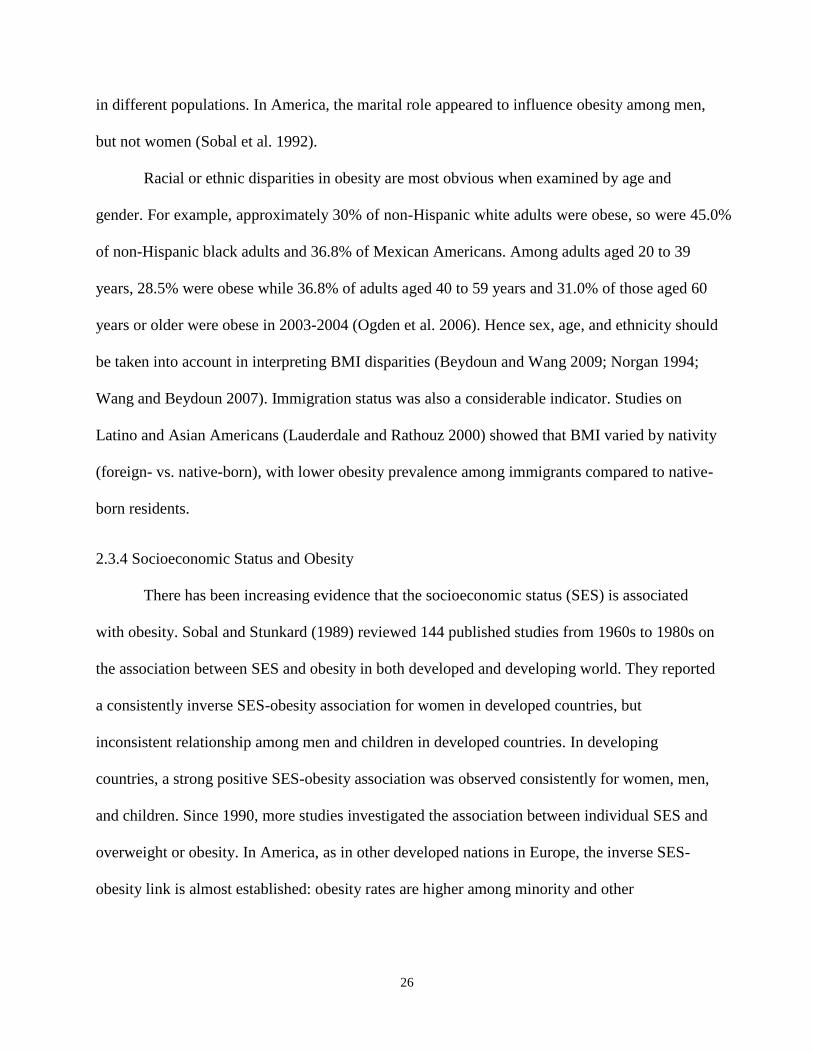
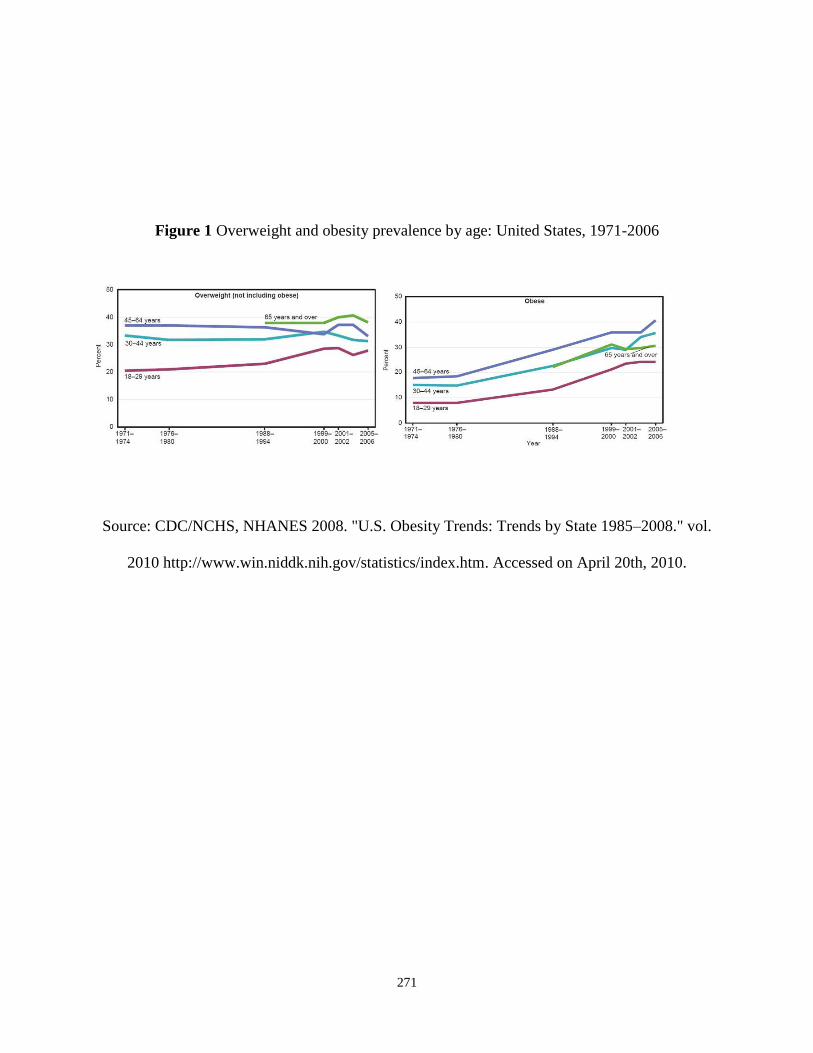
Figure 2 Percentage of adult population with a BMI >= 30 in OECD member countries
273
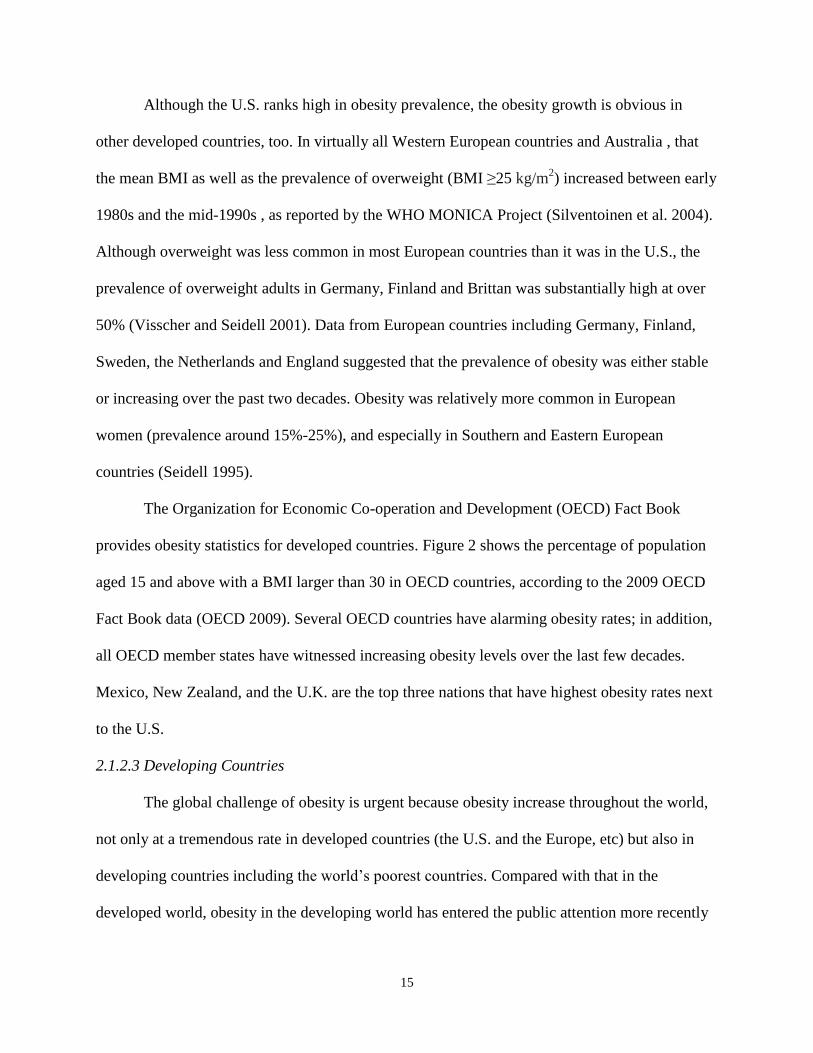
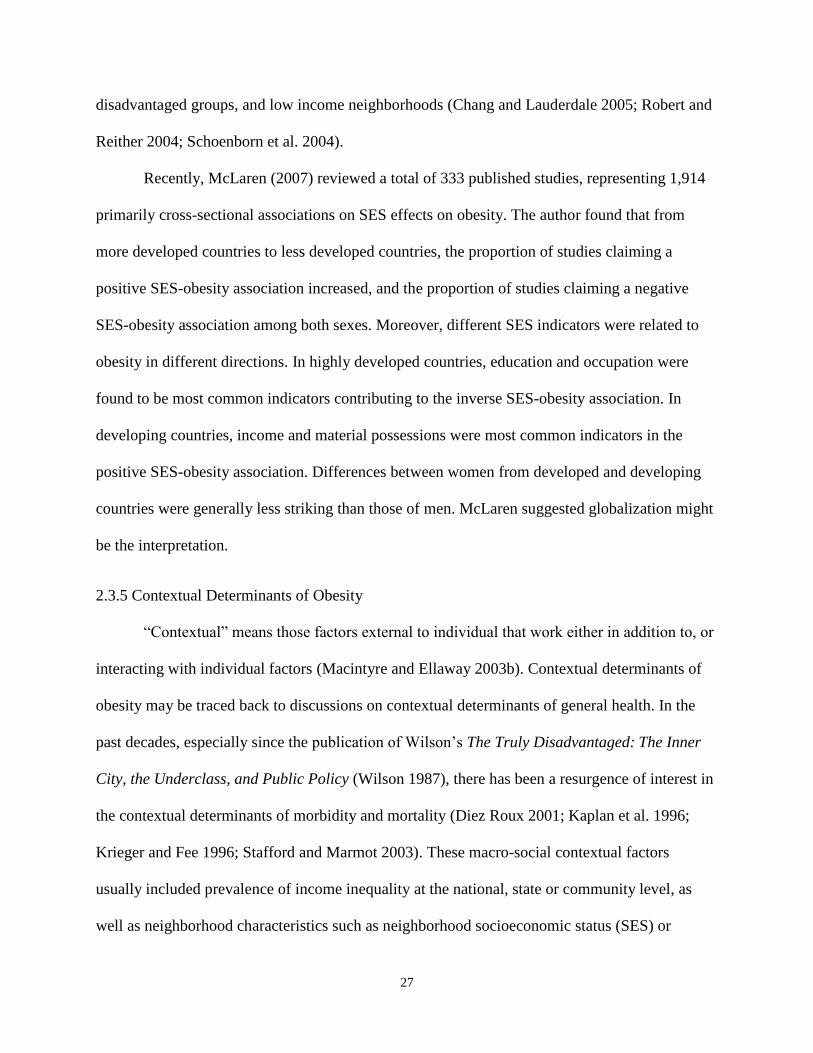
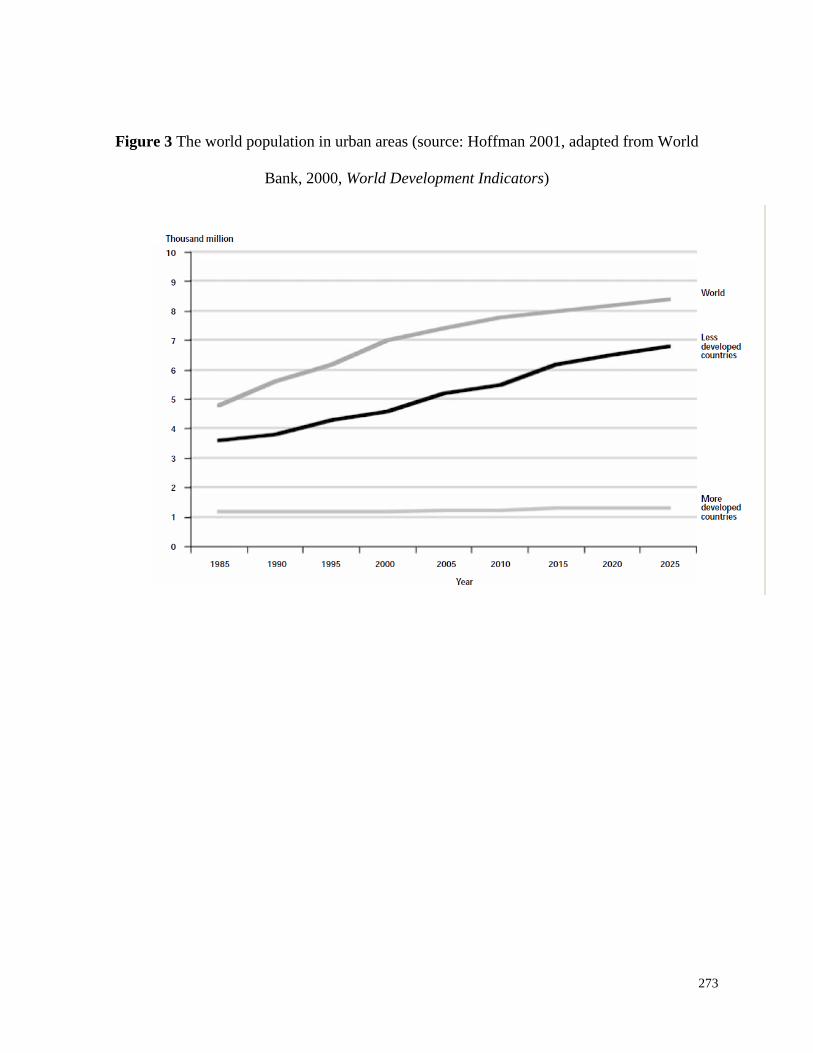
Figure 3 The world population in urban areas (source: Hoffman 2001, adapted from World
Bank, 2000, World Development Indicators)
274
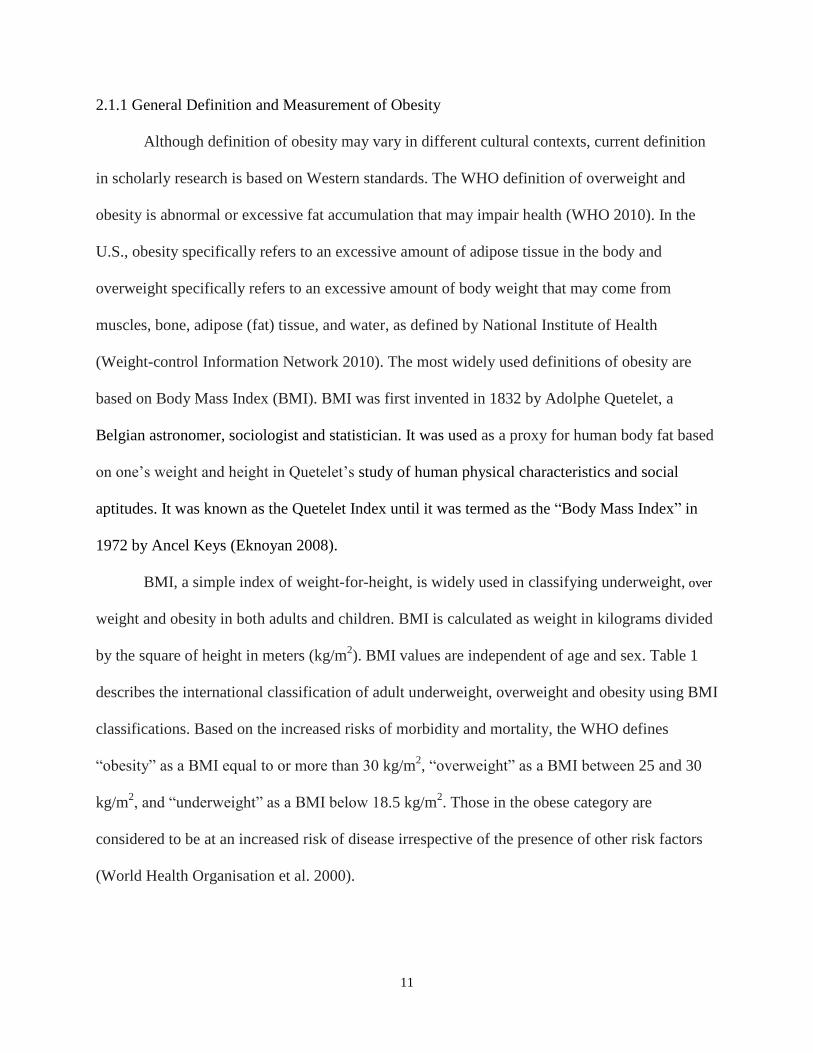
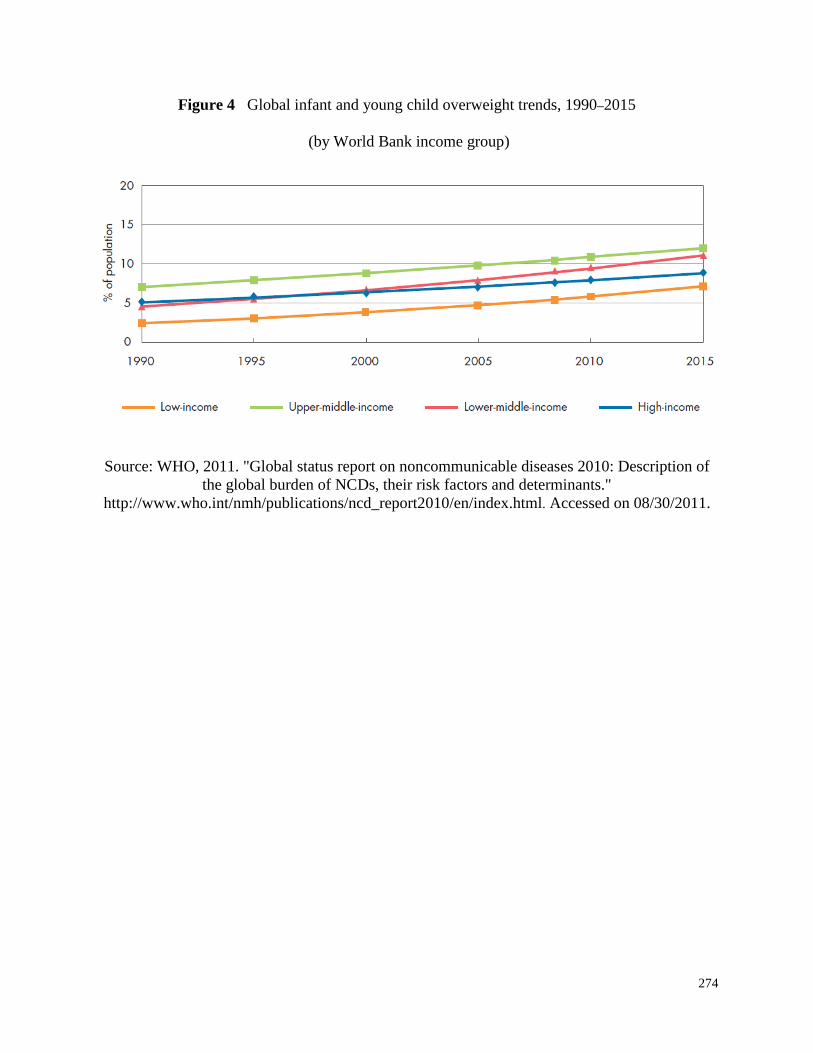
Figure 4 Global infant and young child overweight trends, 1990‒2015
(by World Bank income group)
Source: WHO, 2011. "Global status report on noncommunicable diseases 2010: Description of the global burden of NCDs, their risk factors and determinants."
http://www.who.int/nmh/publications/ncd_report2010/en/index.html. Accessed on 08/30/2011.
275
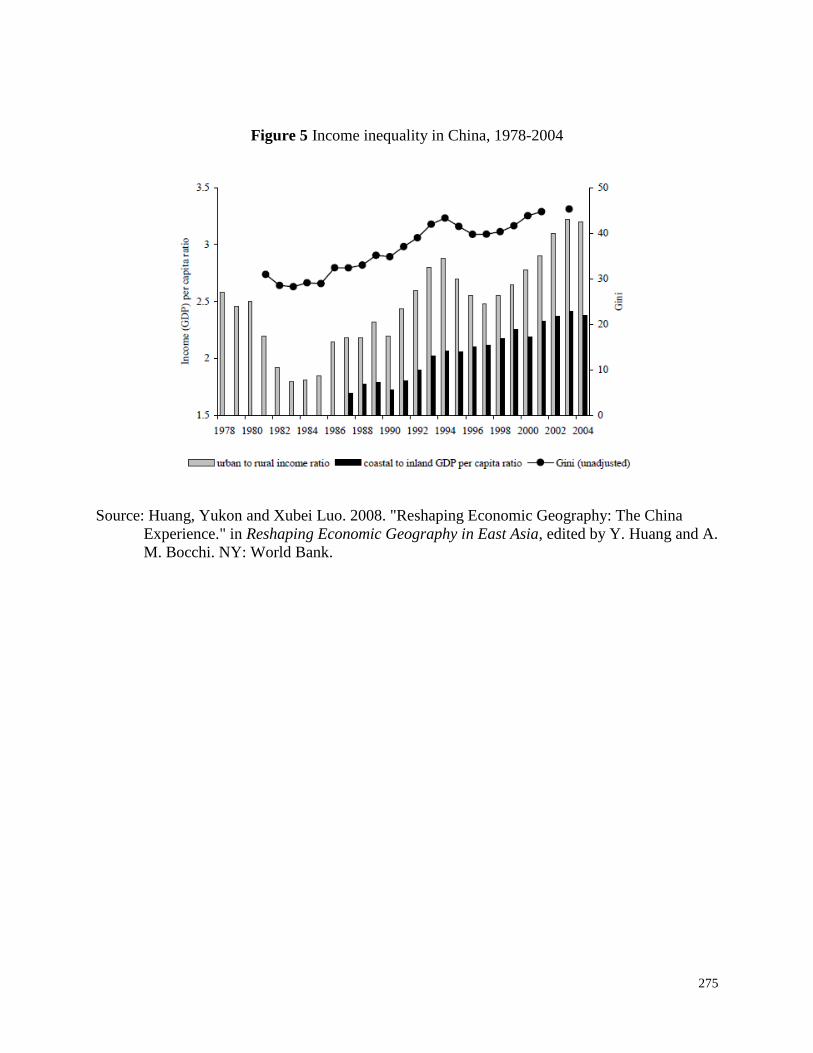
Figure 5 Income inequality in China, 1978-2004
Source: Huang, Yukon and Xubei Luo. 2008. "Reshaping Economic Geography: The China Experience." in Reshaping Economic Geography in East Asia, edited by Y. Huang and A. M. Bocchi. NY: World Bank.
276
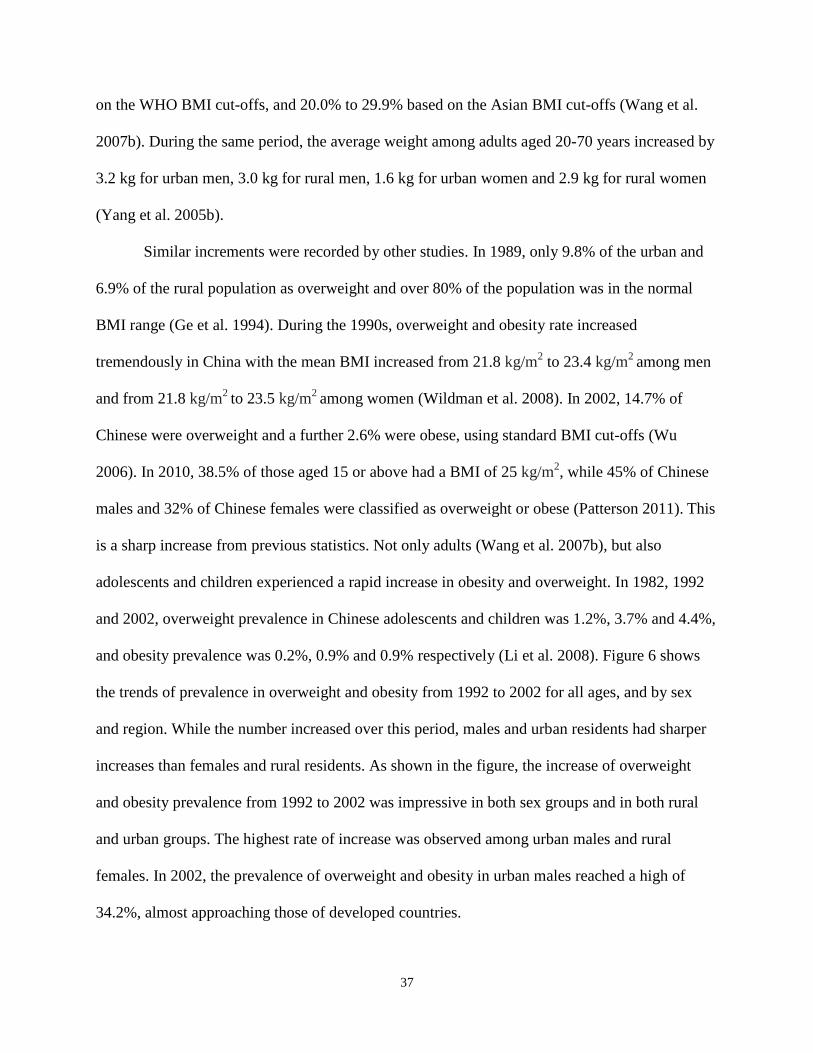
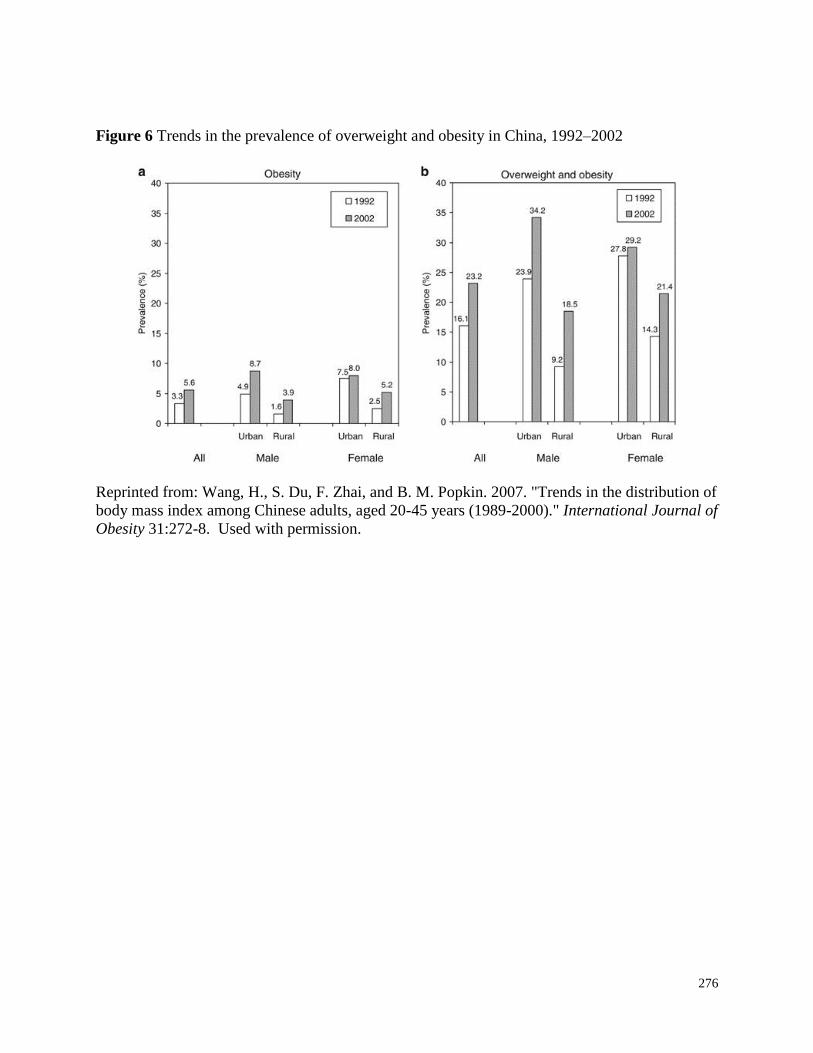
Figure 6 Trends in the prevalence of overweight and obesity in China, 1992–2002
Reprinted from: Wang, H., S. Du, F. Zhai, and B. M. Popkin. 2007. "Trends in the distribution of body mass index among Chinese adults, aged 20-45 years (1989-2000)." International Journal of
Obesity 31:272-8. Used with permission.
277
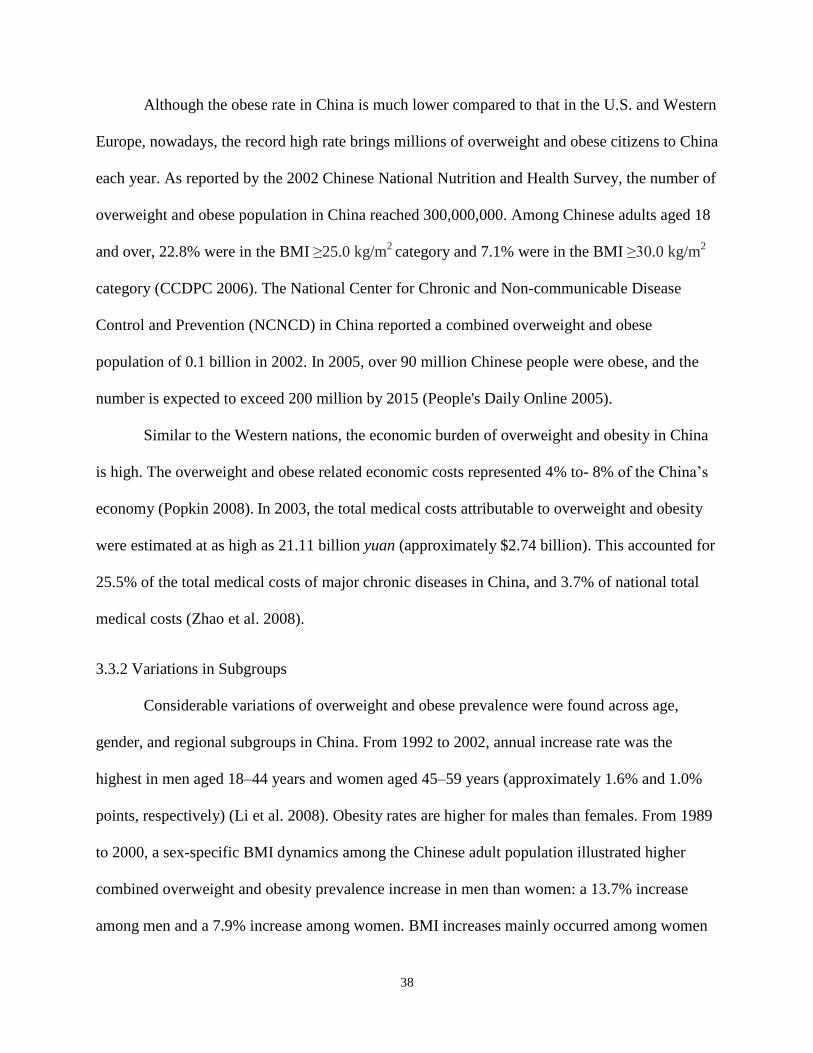
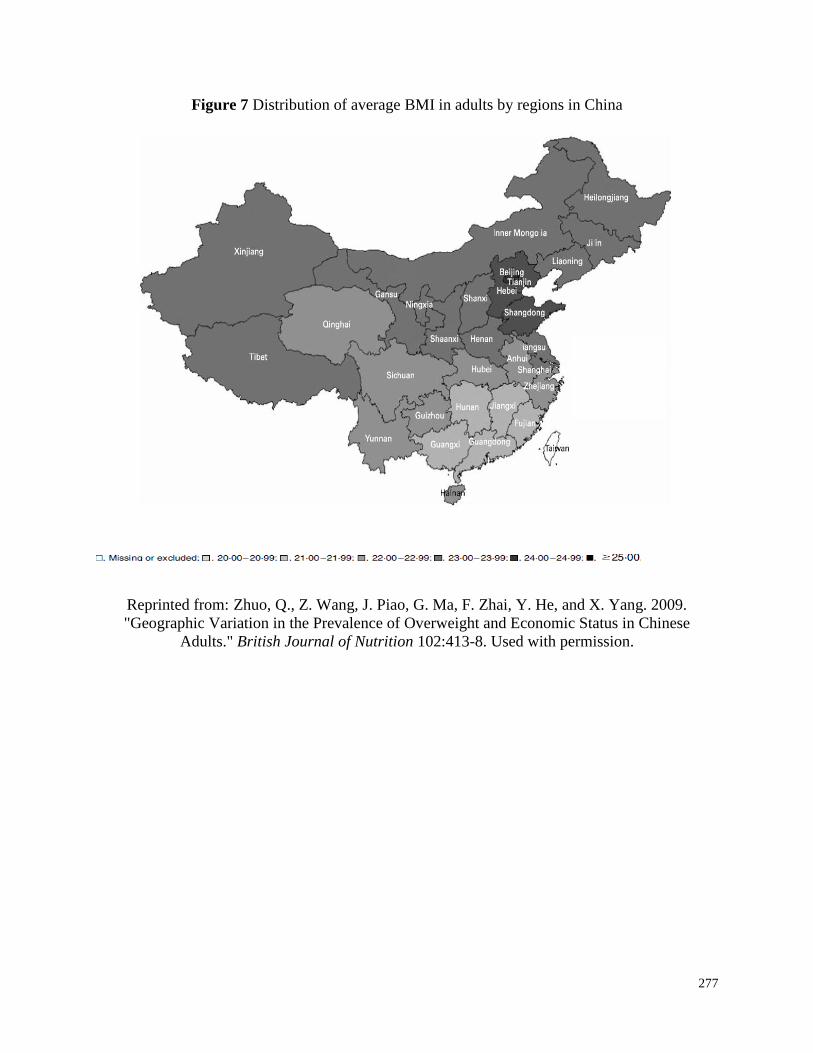
Figure 7 Distribution of average BMI in adults by regions in China
Reprinted from: Zhuo, Q., Z. Wang, J. Piao, G. Ma, F. Zhai, Y. He, and X. Yang. 2009. "Geographic Variation in the Prevalence of Overweight and Economic Status in Chinese
Adults." British Journal of Nutrition 102:413-8. Used with permission.
278
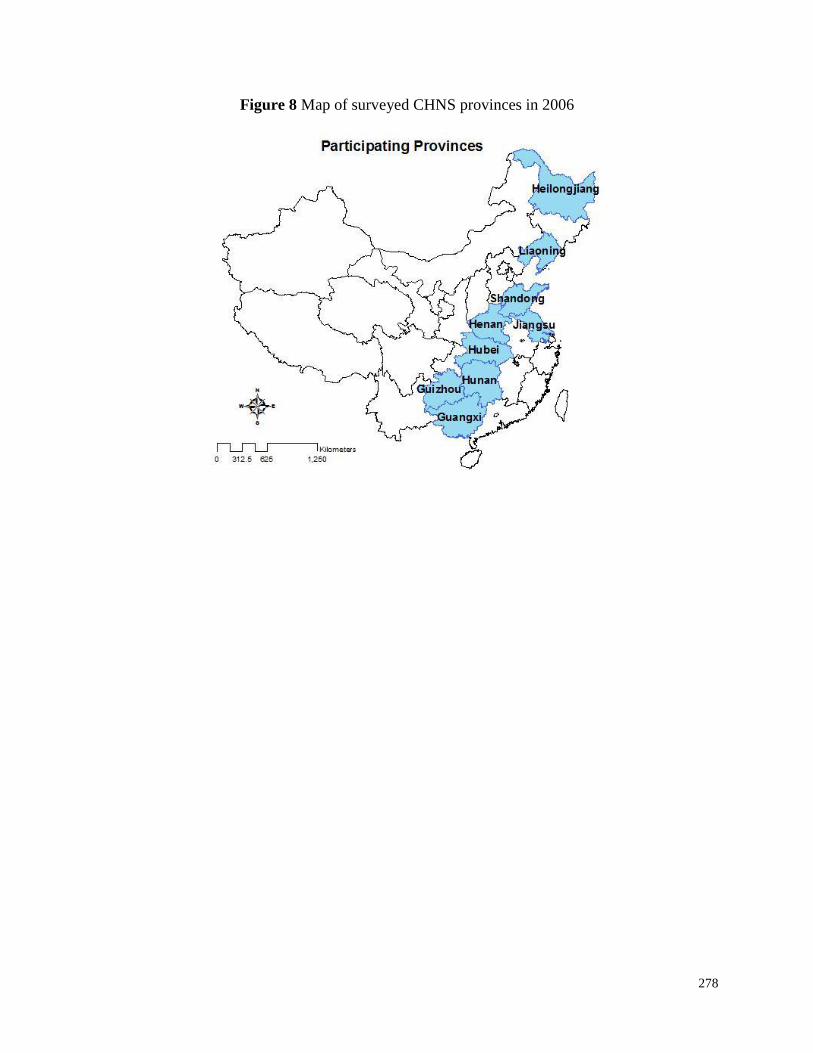
Figure 8 Map of surveyed CHNS provinces in 2006
279
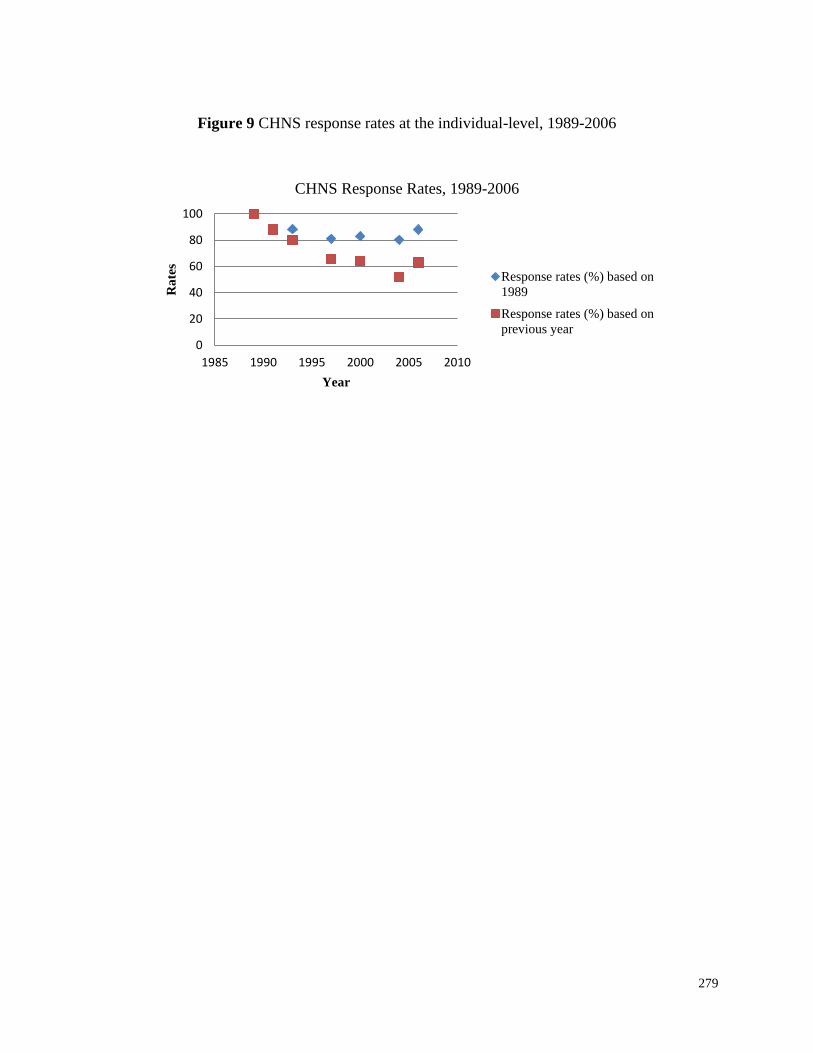
Figure 9 CHNS response rates at the individual-level, 1989-2006
0
20
40
60
80
100
1985 1990 1995 2000 2005 2010
Ra
tes
Year
CHNS Response Rates, 1989-2006
Response rates (%) based on1989
Response rates (%) based onprevious year
280
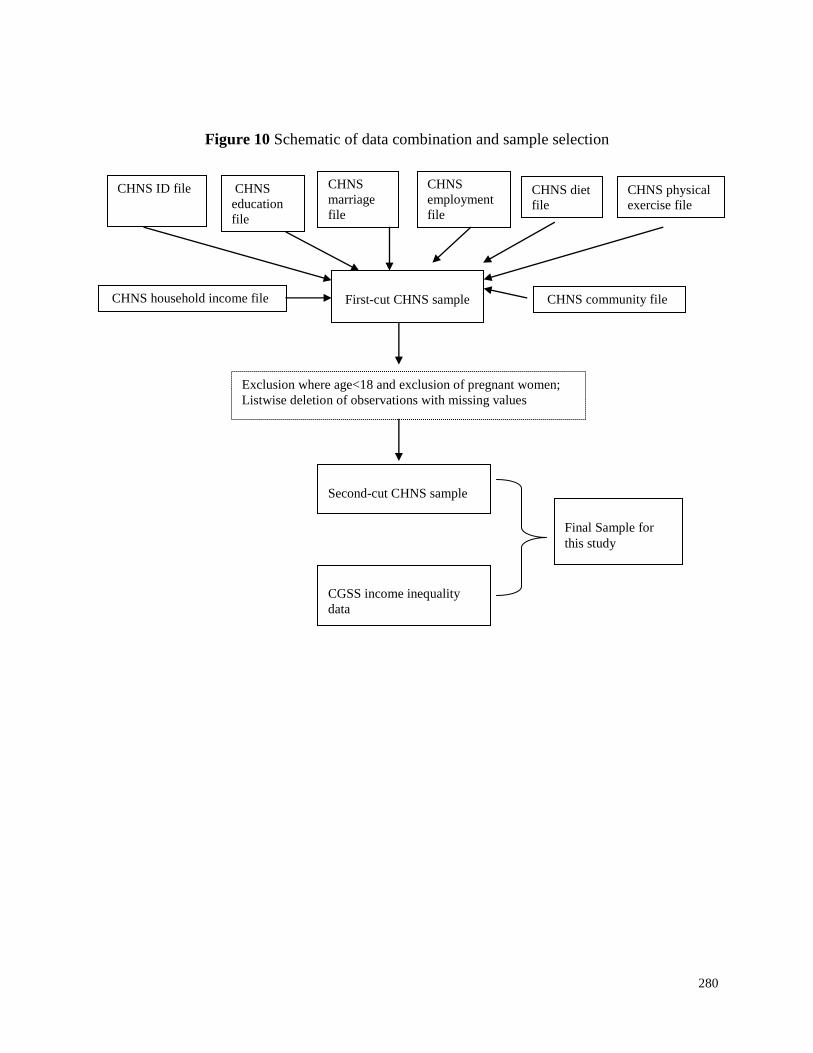
Figure 10 Schematic of data combination and sample selection
CHNS employment file
CHNS ID file CHNS physical exercise file
CHNS diet file
CHNS marriage file
CHNS education file
First-cut CHNS sample CHNS community file CHNS household income file
Exclusion where age<18 and exclusion of pregnant women; Listwise deletion of observations with missing values
Second-cut CHNS sample
Final Sample for this study
CGSS income inequality data
281
Figure 11 Gini coefficients by province, CHNS 2006
- 0.10 0.20 0.30 0.40 0.50 0.60 0.70
Gini
Coefficient
Province
Gini Coefficient by Province
282
Figure 12 Prevalence of obesity by individual SES, CHNS 2006
283
Figure 13 Prevalence of obesity by province, CHNS 2006
0%
10%
20%
30%
40%
Province
Prevalance of Obesity
by Province
284
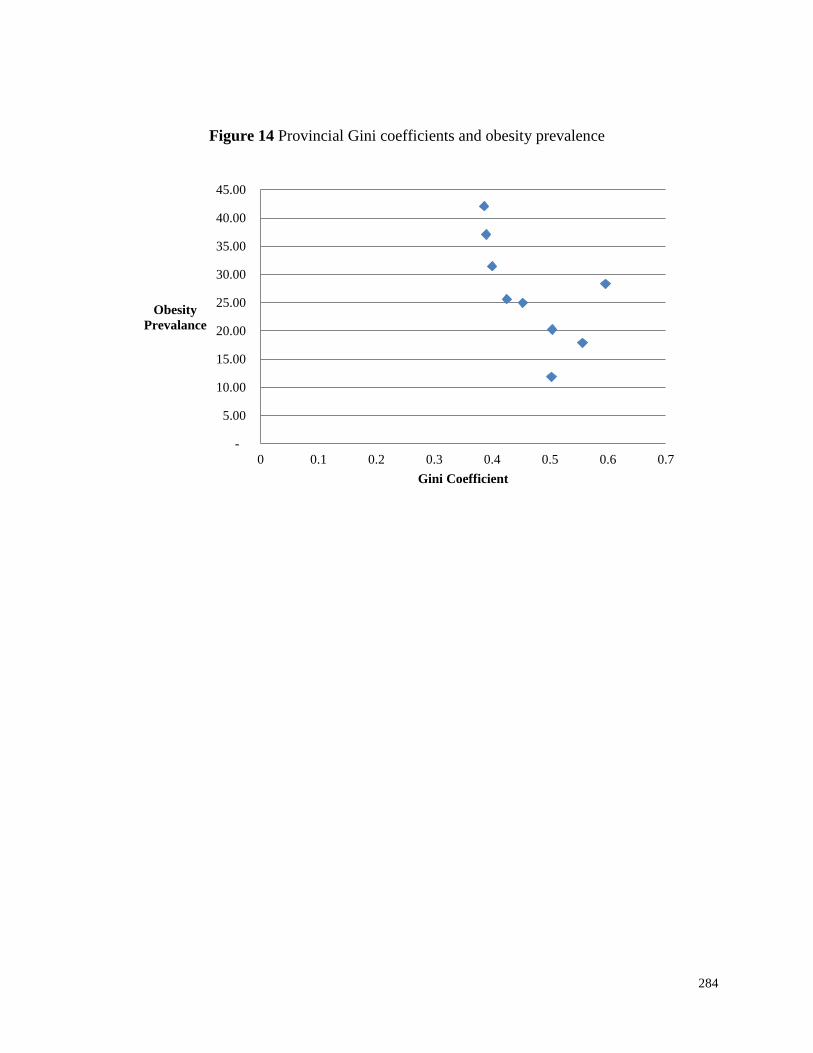
Figure 14 Provincial Gini coefficients and obesity prevalence
-
5.00
10.00
15.00
20.00
25.00
30.00
35.00
40.00
45.00
0 0.1 0.2 0.3 0.4 0.5 0.6 0.7
Obesity
Prevalance
Gini Coefficient
285
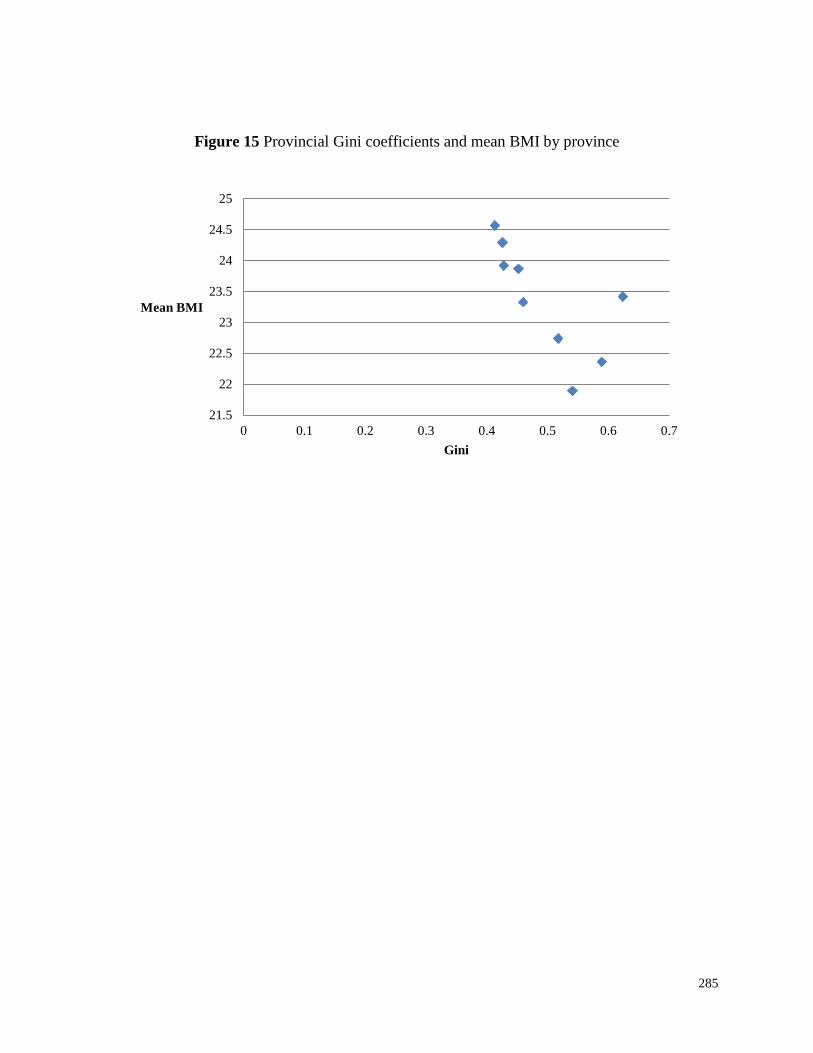
Figure 15 Provincial Gini coefficients and mean BMI by province
21.5
22
22.5
23
23.5
24
24.5
25
0 0.1 0.2 0.3 0.4 0.5 0.6 0.7
Mean BMI
Gini
286
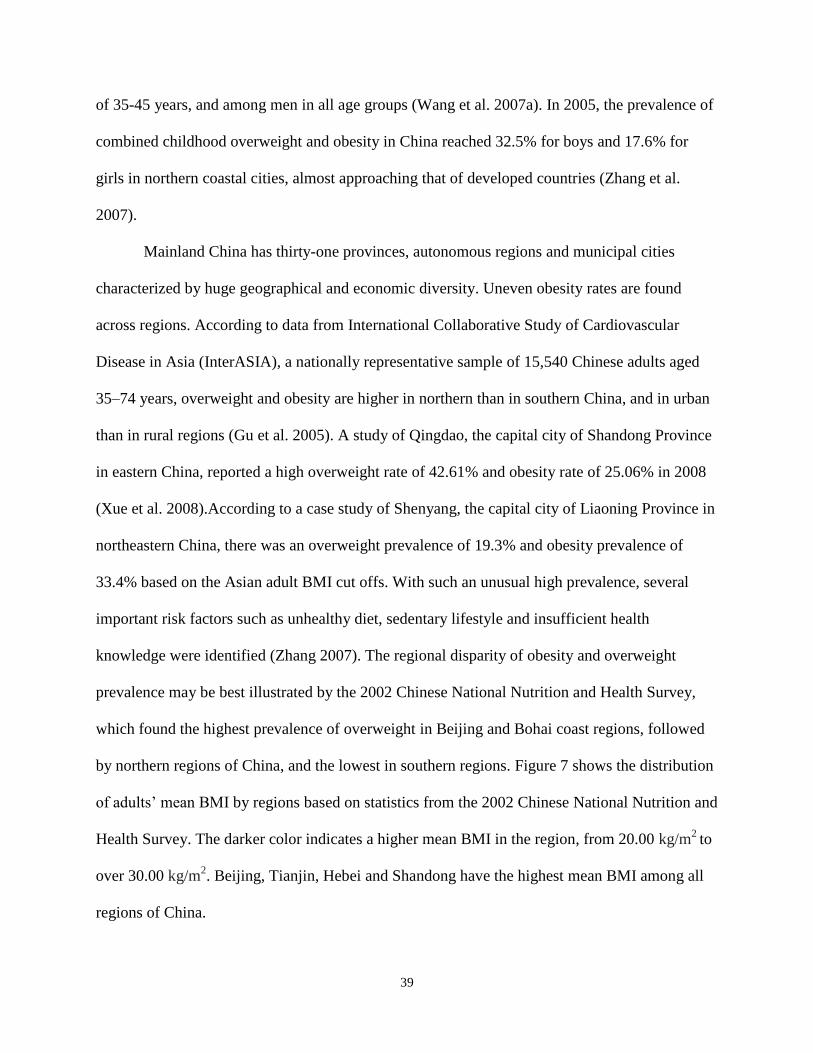
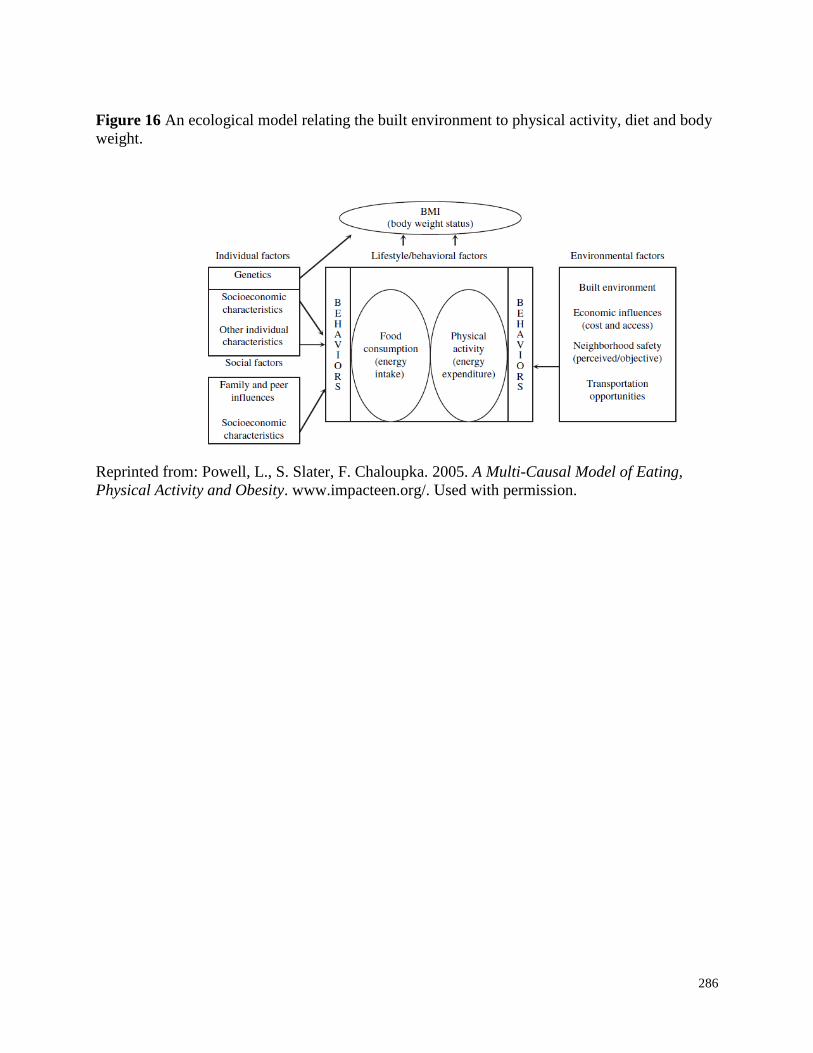
Figure 16 An ecological model relating the built environment to physical activity, diet and body weight.
Reprinted from: Powell, L., S. Slater, F. Chaloupka. 2005. A Multi-Causal Model of Eating,
Physical Activity and Obesity. www.impacteen.org/. Used with permission.

![Critical ideals of graphs - CINVESTAV · G], the determinantal ideals of L(G;X G) are ideals on Z[X G] which we call critical ideals of G. Next we study how the critical ideals encode](https://img.pdfslide.us/doc/110x75/5fa3f5e4efc6f36b113a3fab/critical-ideals-of-graphs-cinvestav-g-the-determinantal-ideals-of-lgx-g-are.jpg)