Embed Size (px)
Citation preview
1
Supplementary Information
A multichannel nanosensor for instantaneous readout
of cancer drug mechanisms
Subinoy Rana, Ngoc D. B. Le, Rubul Mout, Krishnendu Saha, Gulen Yesilbag Tonga, Robert E.
S. Bain, Oscar R. Miranda, Caren M. Rotello, and Vincent M. Rotello
Table of contents
Section 1: Synthesis of the Sensor Elements .................................................................................. 2
Section 2: Sensor Fabrication ....................................................................................................... 10
Section 3: Determination of FICI ................................................................................................. 19
Section 4: Statistical Methods....................................................................................................... 20
Section 5: Validation of the Drug Screening Methodology.......................................................... 24
Section 6: Discussions on the Importance of the Fluorescence Channels .................................... 35
Section 7: Supplementary Data..................................................................................................... 39
Section 8: 1H NMR Spectra .......................................................................................................... 48
Supplementary References............................................................................................................ 52
A multichannel nanosensor for instantaneous readout of cancer drug mechanisms
SUPPLEMENTARY INFORMATIONDOI: 10.1038/NNANO.2014.285
NATURE NANOTECHNOLOGY | www.nature.com/naturenanotechnology 1
© 2014 Macmillan Publishers Limited. All rights reserved.
2
Section 1: Synthesis of the Sensor Elements
1.1 Cloning and expression of fluorescent proteins. Genetic manipulations and bacterial culture
were performed according to standard protocols. The gene encoding EBFP2 protein was PCR
amplified from a pBad-EBFP2 plasmid1 (Addgene, No. 14891) using primers 5′-ACGATGGAT
CCATGGTGAG C-3′ (forward) and 5′-GTGACAAGCTTTTACTTGTACAG-3′ (reverse). The
amplified product was cloned into pQE80 vector digested with BamHI and HindIII restriction
sites (downstream of 6xHis tag) to obtain the expression construct pQE80-6xHis-EBFP2.
To construct pQE80-6xHis-tdTomato plasmid, tdTomato gene was sub-cloned from pASTA3
(from Addgene2,3) plasmid into BamHI and HindIII (downstream of 6xHis tag) restriction sites
of pQE80 expression vector. pET21d-EGFP plasmid (Novagen4) containing 6xHis tag in the N-
terminus was used for EGFP expression.
To produce recombinant proteins, Escherichia coli BL21(DE3) strain was transformed with
the respective plasmids. Transformed colonies were picked up to grow small cultures in 50 mL
2xYT media at 37 °C for overnight. The following day, 15 mL of grown culture was inoculated
into one liter 2xYT media and allowed to grow at 37 °C until optical density (OD) at 600 nm
reaches ~0.6. At this point, the protein expression was induced by adding isopropyl-β-D-
thiogalactopyranoside (IPTG; 1 mM final concentration) at 25 °C. After four hours of induction,
the cells were harvested and the pellets were lysed using microfluidiser. His-tag fluorescent
proteins were purified from the lysed supernatant using Co2+-nitrilotriacetate columns (HisPur™
cobalt spin columns, Pierce, Thermo Scientific). The integrity and the expression of native
protein were confirmed by 12% SDS-PAGE gel, absorbance, and fluorescence spectra.
© 2014 Macmillan Publishers Limited. All rights reserved.
3
1.2 Synthesis of BenzNP. The organic ligand and the NP core were synthesised following the
previous report5,6. This section describes the full experimental details of all performed reactions
for the syntheses of the ligand and the particle, as well as their standard characterizations (1H
NMR spectra and Supplementary Fig. 1 – 3).
1.2.1 General. All chemicals and solvents for syntheses were purchased from Fisher Scientific,
except HAuCl4 that was purchased from Strem Chemicals Inc., and used without further
purification, unless otherwise stated. Yields refer to chromatographically and spectroscopically
(1H NMR) homogeneous material, unless otherwise stated. Reactions were monitored by thin-
layer chromatography performed on 0.25 mm Sorbent Technologies aluminium backed silica gel
plates (w/UV254), using ultraviolet radiation as the visualizing agent and one of the following as
developing agents: an acidic solution of ceric ammonium molybdate and heat, or KMnO4/heat.
1.2.2 NMR spectroscopy. NMR spectra were recorded on Bruker Avance 400 instrument and
were calibrated using residual undeuterated solvent as an internal reference (CHCl3 at 7.26
p.p.m. 1H-NMR). The following abbreviations were used to explain NMR peak multiplicities: s,
singlet; d, doublet; t, triplet; q, quartet; p, quintet (pentet); m, multiplet; br, broad (see the 1H
NMR spectra section).
1.2.3 Mass spectrometry. Matrix assisted laser desorption/ionization mass spectrometry
(MALDI-MS) has been performed to characterize the surface ligand on the BenzNP. A saturated
α-cyano-4-hydroxycinnamic acid (α-CHCA) stock solution was prepared in 70% acetonitrile,
30% H2O, and 0.1% TFA. An equal volume of 2 μM BenzNP solution was added to the matrix
stock solution. 2.5 μL of this mixture was spotted on the sample carrier, and MALDI-MS
analysis was performed on a Bruker Autoflex III mass spectrometer.
© 2014 Macmillan Publishers Limited. All rights reserved.
4
1.2.3 Dynamic light scattering. Hydrodynamic diameter and zeta potential of BenzNP was
measured at 25 °C by dynamic light scattering (DLS) in 5 mM phosphate buffer (pH 7.4) using a
Malvern Zetasizer Nano ZS instrument. The measurement angle was 173° (back-scatter). Data
were analysed by the “multiple narrow modes” (high resolution) based on non-negative-least-
squares (NNLS). 1 µM of BenzNP was placed in a cuvette and average of 3 measurements was
considered.
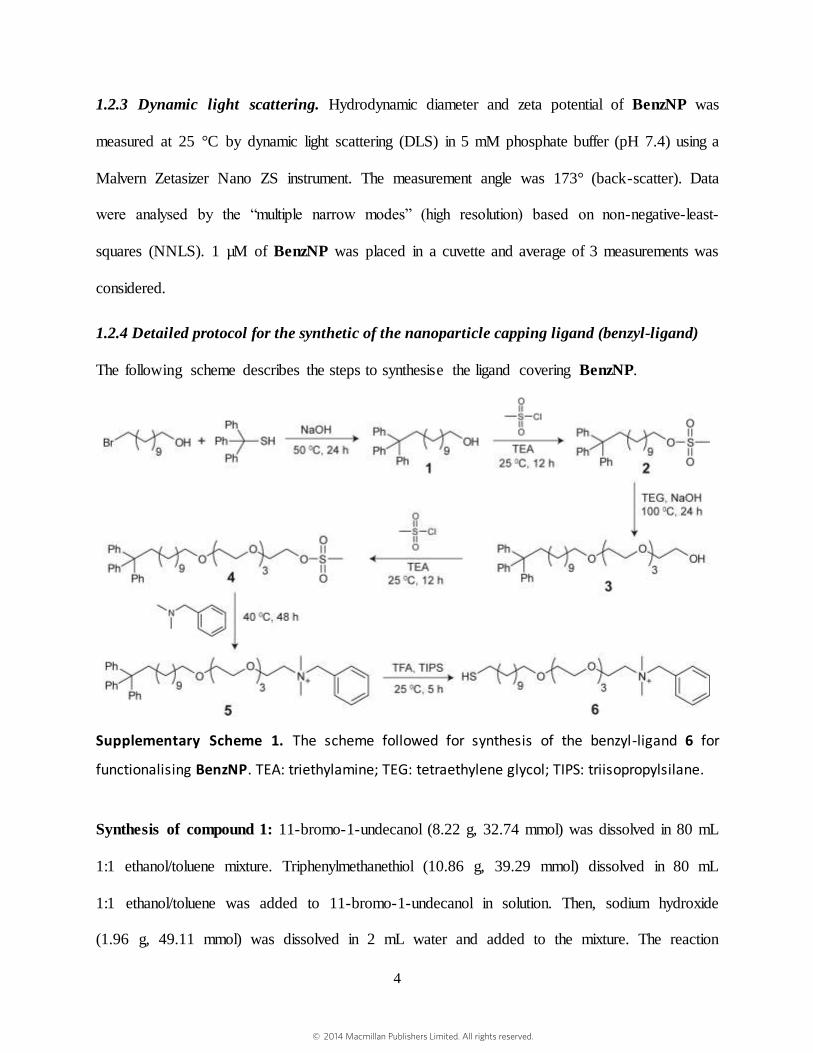
1.2.4 Detailed protocol for the synthetic of the nanoparticle capping ligand (benzyl-ligand)
The following scheme describes the steps to synthesise the ligand covering BenzNP.
Supplementary Scheme 1. The scheme followed for synthesis of the benzyl-ligand 6 for
functionalising BenzNP. TEA: triethylamine; TEG: tetraethylene glycol; TIPS: triisopropylsilane.
Synthesis of compound 1: 11-bromo-1-undecanol (8.22 g, 32.74 mmol) was dissolved in 80 mL
1:1 ethanol/toluene mixture. Triphenylmethanethiol (10.86 g, 39.29 mmol) dissolved in 80 mL
1:1 ethanol/toluene was added to 11-bromo-1-undecanol in solution. Then, sodium hydroxide
(1.96 g, 49.11 mmol) was dissolved in 2 mL water and added to the mixture. The reaction
© 2014 Macmillan Publishers Limited. All rights reserved.

5
mixture was stirred for 24 h at 50 °C. Upon completion, the reaction mixture was extracted twice
with a saturated solution of sodium bicarbonate (NaHCO3) The organic layer was extracted,
dried over sodium sulfate (Na2SO4), and concentrated using a rotavapour. The crude product was
purified by column chromatography over silica gel using hexane/ethyl acetate (1:1, v/v) as the
eluent. The solvent was removed in vacuum to obtain compound 1 as colourless oil (yield: 13.88
g, 95%).
1H NMR (400 MHz, CDCl3, TMS) of Compound 1 : δ 7.48-7.40 (m, 6H, HAr-), 7.37-7.27 (m,
6H, HAr-), 7.26-7.18 (m, 3H, HAr-), 3.65 (t, J = 6.7Hz, 2H,CH2OH), 2.16 (t, J = 7.2Hz, 2H,-
CH2-), 1.66-1.52 (m, 2H, -SCH2CH2) , 1.44-1.12 (m, 16H, -CH2CH2OH + -(CH2)8 CH2OH).
Synthesis of compound 2: Compound 1 (13.88 g, 31.1 mmol) in 150 mL dry dichloromethane
(DCM) was mixed with triethylamine (TEA) (4.72g, 6.48 mL, 46.65 mmol), followed by
dropwise addition of methanesulfonyl chloride (3.92 g, 2.65mL, 34.21 mmol) in ice bath. After
30 minutes the reaction mixture was warmed to room temperature and stirred for 12 h. After the
reaction was completed (by TLC), solvent was evaporated. The compound was diluted again
with 100 mL DCM and extracted with 100 mL 0.1 M HCl twice. The organic layer was
collected, neutralized with a saturated NaHCO3 solution, and washed with water three times.
Following extraction, the organic layer was dried over Na2SO4 and concentrated at reduced
pressure. The crude product was purified by column chromatography over silica gel using
hexane/ethyl acetate (1:1, v/v) as the eluent. Solvent was removed in vacuum to obtain the
mesylated compound 2 as light yellow oil (yield: 15 g, 92%).
1H NMR (400 MHz, CDCl3, TMS) of Compound 2: δ 7.48-7.40 (m, 6H, HAr-), 7.34-7.27 (m,
6H, HAr-), 7.26-7.19 (m, 3H, HAr-), 4.24 (t, J = 6.8Hz, 2H, -CH2SO3CH3), 3.01 (s, 3H, -
SO3CH3), 2.16 (t, J = 7.6Hz, -SCH2-), 1.76 (p, J = 6.8Hz, 2H, -CH2CH2SO3CH3), 1.41 (p, J =
7.2Hz, 4H, -SCH2CH2- + -SCH2CH2CH2-), 1.35-1.1 (m, 12H, -(CH2)6 CH2CH2SO3CH3).
© 2014 Macmillan Publishers Limited. All rights reserved.
6
Synthesis of compound 3: First, NaOH (1.37 g, 34.3 mmol) solution (1 mL) was added to 99.24
mL of tetraethylene glycol (TEG) (111.15 g, 57.22 mmol) and stirred for 2 h at 80 °C. To this
reaction mixture, 15 g of compound 2 was added and stirred for 48 h at 100 °C. The product was
extracted in hexane/ethyl acetate (4:1, v/v) six times. Then, the organic layer was concentrated at
reduced pressure and the crude product was purified by column chromatography over silica gel
using ethyl acetate as the eluent. The solvent was removed in vacuum to obtain compound 3 as
light yellow oil (yield: 15.28 g, 68%).
1H NMR (400 MHz, CDCl3, TMS) of Compound 3: δ 7.47-7.40 (m, 6H, HAr-), 7.34-7.26 (m,
6H, HAr-), 7.25-7.19 (m, 3H, HAr-), 3.77-3.57 (m,16H, -CH2-(OCH2CH2)4-OH), 3.46 (t, J = 6.8
Hz, 2H, -CH2-(OCH2CH2)4-OH), 2.95 (br, s, 1H, -TEG-OH), 2.15 (t, J = 7.2Hz, -SCH2-), 1.59
(p, J = 7.2Hz, 2H, -CH2CH2TEG-OH), 1.4 (p, J = 7.6Hz, 2H, -SCH2CH2-), 1.35-1.13(m, 14H, -
(CH2)7 CH2CH2TEG-OH).
Synthesis of compound 4: Triethylamine (3.26g, 4.49 mL, 32.2 mmol) was added to compound
3 (10 g, 16.1 mmol) in 100 mL dry DCM in an ice bath. Methanesulfonyl chloride (2.77 g, 1.87
mL, 24.1 mmol) was added dropwise to the reaction mixture in ice-bath. After 30 minutes the
reaction mixture was warmed up to room temperature and stirred overnight. The reaction mixture
was worked up and the organic layer was extracted. The extracted DCM layer was dried over
Na2SO4 and concentrated at reduced pressure. The crude product was purified by column
chromatography over silica gel using ethyl acetate as the eluent. Solvent was removed in vacuum
to obtain compound 4 as light yellow oil (yield 10.7 g, 95 %).
1H NMR (400 MHz, CDCl3, TMS) of Compound 4: δ 7.44-7.37 (m, 6H, HAr-), 7.31-7.23 (m,
6H, HAr-), 7.22-7.16 (m, 3H, HAr-), 4.40-4.34 (m, 2H, -CH2OSO3CH3), 3.78-3.54 (m, 14H,
CH2-(OCH2CH2)3-CH2CH2OSO3CH3), 3.44 (t, J = 6.8Hz, 2H, CH2-CH2-(OCH2CH2)3-), 3.07 (s,
© 2014 Macmillan Publishers Limited. All rights reserved.
7
3H, -OSO3CH3), 2.12 (t, J = 7.2Hz, 2H, -SCH2-), 1.56 (p, J = 7.2Hz, 2H, -CH2CH2TEG-
N(CH3)2), 1.38 (p, J=7.6Hz, 2H, -SCH2CH2-), 1.32-1.11 (m, 14H, -(CH2)7CH2CH2TEG).
Synthesis of compound 5: Compound 4 (1.075 g, 1.53 mmol) was added to
dimethylbenzylamine (0.62 g, 0.7 ml, 4.6 mmol) in 10 mL ethanol. The reaction mixture was
stirred at 40 °C for 48 h. After evaporating ethanol at reduced pressure, the light yellow residue
was purified by successive washings with hexane (10 mL, 4 times) and hexane/diethylether (1:1
v/v, 10 mL, 6 times) and then dried in high vacuum. The product formation was quantitative and
was confirmed by NMR spectroscopy.
1H NMR (400MHz, CDCl3, TMS) of Compound 5: δ 7.64-7.58 (m, 2H, HAr-), 7.38-7.32 (m,
9H, HAr-), 7.24-7.17 (m, 6H, HAr-), 7.16-7.09 (m, 3H, HAr-), 4.9 (s, 2H, -CH2-C6H5), 3.94 (s,
br, 2H, -OCH2CH2N(CH3)2-), 3.8 (s, br, 2H, -OCH2CH2N(CH3)2-), 3.77-3.22 (m, 12H, -
(OCH2CH2)3-CH2CH2N(CH3)2-), 3.33 (t, J = 6.8Hz, 2H, -CH2CH2O-), 3.23 (s, 6H, -N(CH3)2-),
2.06 (t, J = 7.2Hz, 2H, -SCH2-), 1.51-1.42 (p, J = 6.8Hz, 2H, -CH2CH2O-), 1.36-1.28 (p, J =
7.6Hz, 2H, -SCH2CH2-) 1.24-1.08 (m, 14H, -(CH2)7 CH2CH2O-).
Synthesis of compound 6: An excess of trifluoroacetic acid (TFA, 20 equivalents, 3.69 g, 2.5
mL, 32.4 mmol) was added to compound 5 (1.2 g, 1.62 mmol) in 10 mL dry DCM. The colour of
the solution turned yellow upon addition of TFA. Then, triisopropylsilane (TIPS, 3 equivalents,
0.77g, 1 mL, 4.86 mmol) was added to the reaction mixture. The reaction mixture was stirred for
12 h under N2 at room temperature. The solvent, most of TFA, and TIPS were evaporated under
reduced pressure. The yellow residue was purified by repeated washing with hexane (10 mL, 4
times) and dried in high vacuum. The final product formation was quantitative and was
confirmed by NMR spectroscopy.
1H NMR (400 MHz, CDCl3, TMS) of Compound 6: δ 7.57-7.47 (m, 5H), 4.61 (s, 2H, -CH2-
C6H5), 4.01 (s, br, 2H, -OCH2CH2N(CH3)2-), 3.74-3.48 (m, 14H, -(OCH2CH2)3-
© 2014 Macmillan Publishers Limited. All rights reserved.
8
CH2CH2N(CH3)2-), 3.41 (t, J = 6.8Hz, 2H, -CH2CH2O-), 3.14 (s, 6H, -N(CH3)2-), 2.52 (q, J =
7.2Hz, HSCH2-), 1.65-1.48 (m, 4H, -CH2CH2O-,+ HSCH2CH2-), 1.43-1.20 (m, 15H, -(CH2)7
CH2CH2O- + HS-).
1.2.5 Synthesis of benzyl-ligand protected gold nanoparticle (BenzNP)
We followed two-step method for synthesising BenzNP, where a gold nanoparticle core was
synthesised followed by place-exchange with the ligand of interest. First, pentanethiol-coated
AuNPs with core diameter ~2 nm were synthesised using the Brust-Schiffrin two-phase synthesis
protocol7,8. Subsequently, Murray place-exchange9 method was followed to obtain the benzyl-
ligand protected AuNPs. Pentanethiol conjugated AuNPs (10 mg) and compound 6 (27 mg) was
dissolved in a mixture of 5 mL dry DCM, and 1 mL methanol and stirred under nitrogen
atmosphere for 72 h at room temperature. Then, solvents were removed under reduced pressure
and the resulting precipitate was washed with hexane (10 mL) three times and with DCM (10
mL) twice. Then the precipitate was dissolved in distilled water and dialyzed for 72 h (membrane
molecular weight cut-off =10,000) to remove excess ligands, pentanethiol, acetic acid, and other
salts present in the nanoparticle solution. After dialysis, the particle was lyophilised to yield a
solid brownish product. The particles were then redispersed in deionised water (Milli-Q,
Millipore). 1H NMR-spectra in D2O showed substantial broadening of the proton peaks with no
sign of free ligands. The particle was further characterized by transmission electron microscopy,
MALDI-MS, and DLS (Supplementary Fig. 1, 2, and 3, respectively).
© 2014 Macmillan Publishers Limited. All rights reserved.
9
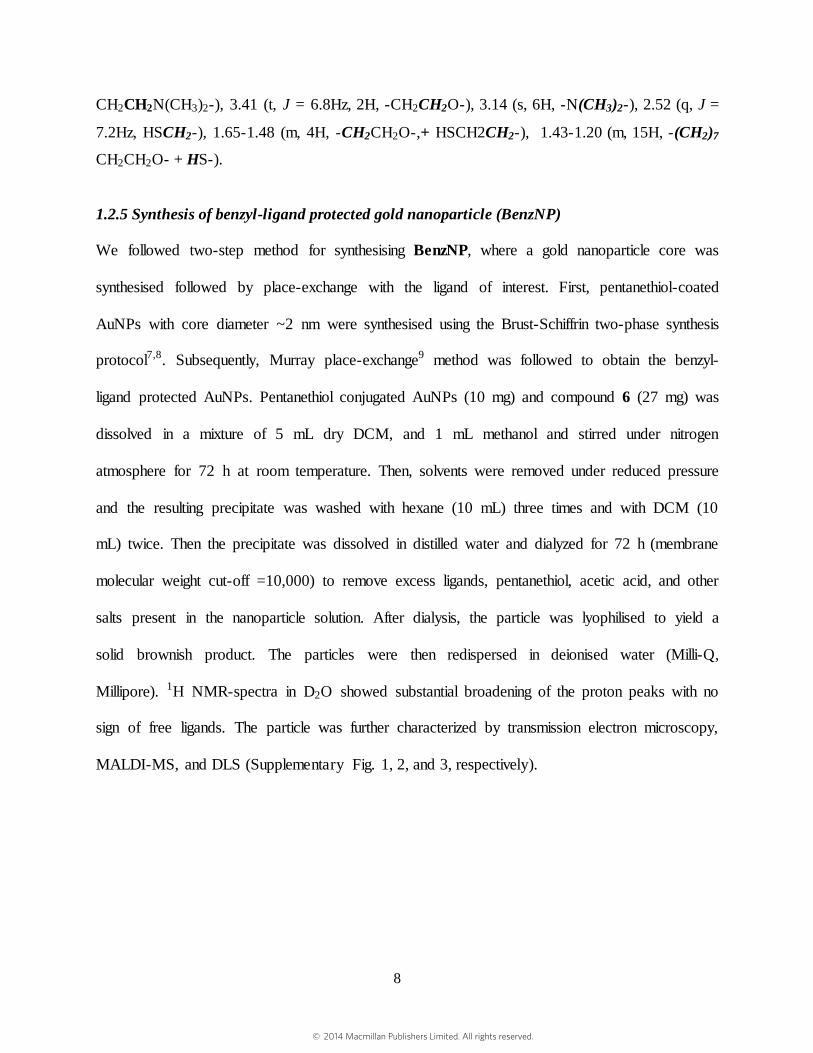
Supplementary Figure 1. Transmission electron micrograph of BenzNP.
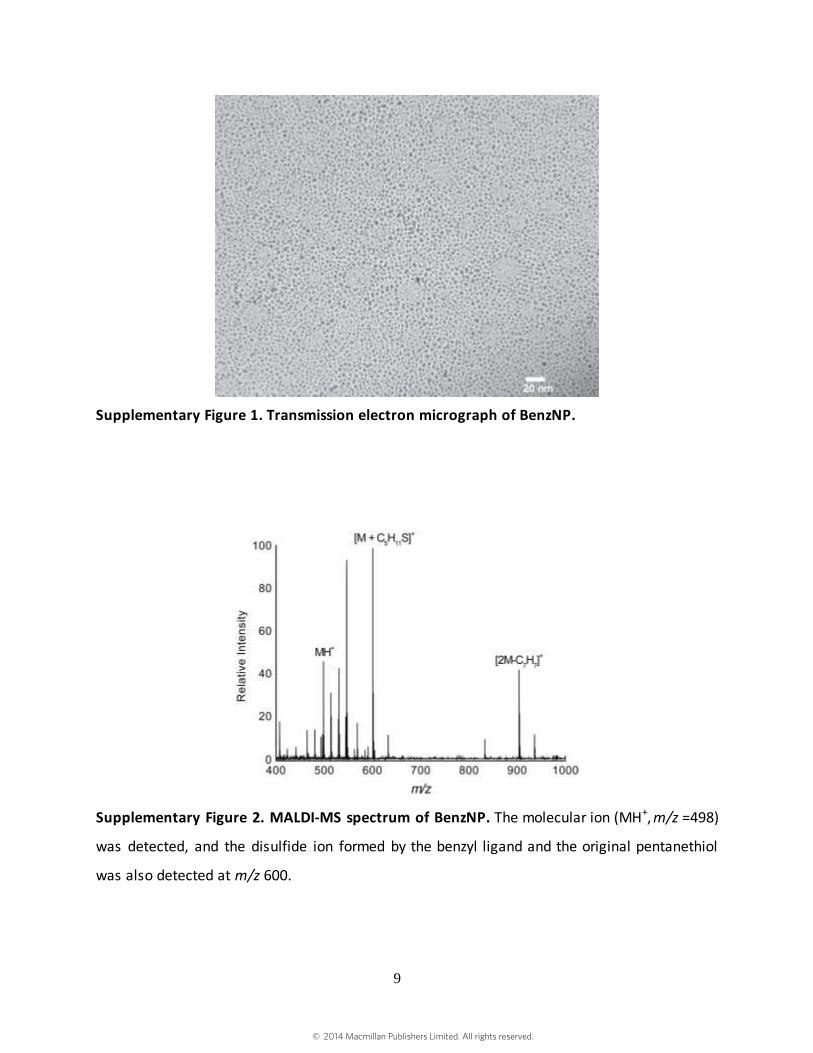
Supplementary Figure 2. MALDI-MS spectrum of BenzNP. The molecular ion (MH+, m/z =498)
was detected, and the disulfide ion formed by the benzyl ligand and the original pentanethiol
was also detected at m/z 600.
© 2014 Macmillan Publishers Limited. All rights reserved.
10
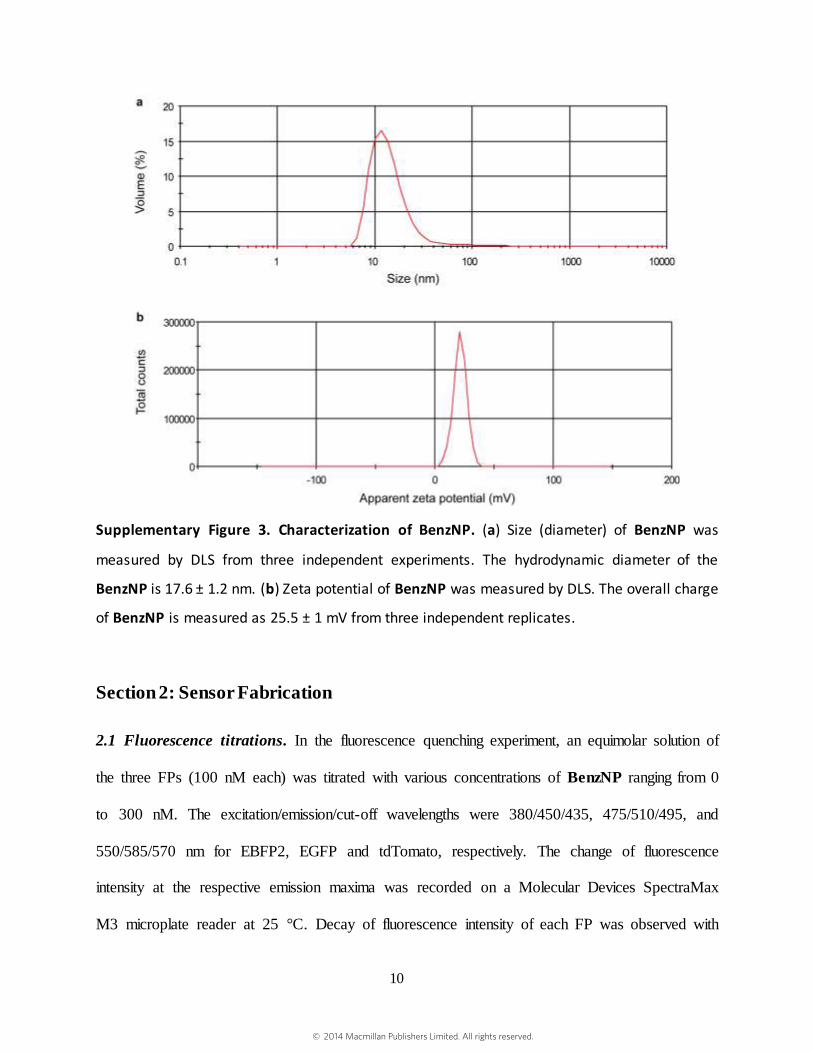
Supplementary Figure 3. Characterization of BenzNP. (a) Size (diameter) of BenzNP was
measured by DLS from three independent experiments. The hydrodynamic diameter of the
BenzNP is 17.6 ± 1.2 nm. (b) Zeta potential of BenzNP was measured by DLS. The overall charge
of BenzNP is measured as 25.5 ± 1 mV from three independent replicates.
Section 2: Sensor Fabrication
2.1 Fluorescence titrations. In the fluorescence quenching experiment, an equimolar solution of
the three FPs (100 nM each) was titrated with various concentrations of BenzNP ranging from 0
to 300 nM. The excitation/emission/cut-off wavelengths were 380/450/435, 475/510/495, and
550/585/570 nm for EBFP2, EGFP and tdTomato, respectively. The change of fluorescence
intensity at the respective emission maxima was recorded on a Molecular Devices SpectraMax
M3 microplate reader at 25 °C. Decay of fluorescence intensity of each FP was observed with
© 2014 Macmillan Publishers Limited. All rights reserved.

11
increasing NP concentration. Nonlinear least-squares curve fitting analysis was employed to
estimate the binding constant (Ka) and association stoichiometry (n) using a 1:1 binding
model10,11.
Supplementary Figure 4. Titration of FPs with BenzNP. Fluorescence titration of an equimolar
mixture of the three FPs by BenzNP. The emissions for each FP were measured independently
at the corresponding emission wavelengths. The data points are averages of three replicates
and the error bars represent the ±standard deviations. The black solid lines through the data
points represent the best curve fitting using the model of single set of identical binding sites.
Supplementary Table 1. Binding parameters for the BenzNP-FP complexes as determined by
the fitting of the fluorescence titration curves (Supplementary Fig. 4).
Protein Binding constant (Ka), M-1 Binding ratio (n) R
2
EBFP2 (1.66 ± 0.5) × 108 2.0 ± 0.09 0.99641
EGFP (9.26 ± 2.8) × 109 1.3 ± 0.03 0.99508
tdTomato (6.69 ± 2.6) × 107 0.8 ± 0.04 0.99678
2.2 Sensor preparation: First, a FP solution was prepared by mixing the FPs at the final
concentration of 100 nM (for each FP). The BenzNP-FP sensor was generated by incubating the
© 2014 Macmillan Publishers Limited. All rights reserved.
12
FP solution with BenzNP (at the final concentration of 150 nM) for 30 min in 5 mM sodium
phosphate buffer (pH 7.4). The FP and BenzNP-FP solutions were maintained in the dark to
minimise photobleaching of the FPs, if any. This conjugate was then added to the drug-treated
cells for screening studies.
Section 3: Drug Screening
3.1 Cell culture. BT549 cell line was purchased from ATCC (ATCC® HTB-122™). pTD cell
line12 was donated by Prof. D. Josph Jerry. BT549 cells were cultured in DMEM media
supplemented with 10% FBS and 1% antibiotics. Cells were grown in a humidified atmosphere
containing 5% CO2 at 37 °C. The TD cells were cultured in DMEM high glucose media
supplemented with 10% FBS and 1% antibiotics. At ~80% confluence, cells were trypsinised
and plated in 96-well plates (Greiner black-and-clear bottom) and cultured for the next studies.
3.2 IC50 of the drugs. The IC50 values of the drugs were determined by Alamar blue assay. Cells
were seeded at 10,000 (BT549 cells) or 15,000 (pTD cells) per well in 96-well microplates
(Greiner black-and-clear bottom). After 24 h, the cells were washed twice with phosphate
buffered saline (PBS) and treated with drugs at different concentrations. The drug treatment was
continued for 24 h for all the drugs except hydrogen peroxide and sodium nitroprusside for
which 5 h treatment was effective. Drug treatment was done in cell culture media lacking
antibiotics. After the drug treatments, cells were washed with PBS twice and the percentage cell
viability was determined by using Alamar blue assay following the manufacturer‟s protocol
(Invitrogen). The IC50 values were determined by fitting the data using a dose response model
with variable Hill slope built in OriginPro 8.5 (Supplementary Fig. 5, Supplementary Table 3-4).
© 2014 Macmillan Publishers Limited. All rights reserved.
13
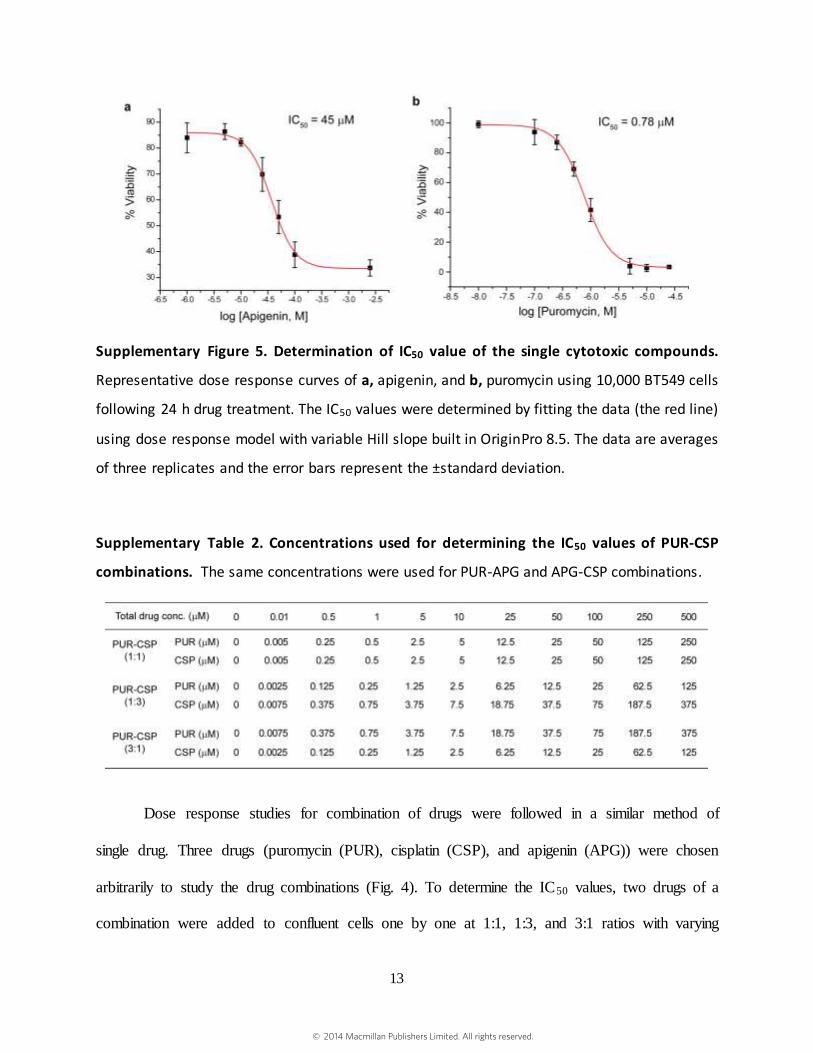
Supplementary Figure 5. Determination of IC50 value of the single cytotoxic compounds.
Representative dose response curves of a, apigenin, and b, puromycin using 10,000 BT549 cells
following 24 h drug treatment. The IC50 values were determined by fitting the data (the red line)
using dose response model with variable Hill slope built in OriginPro 8.5. The data are averages
of three replicates and the error bars represent the ±standard deviation.
Supplementary Table 2. Concentrations used for determining the IC50 values of PUR-CSP
combinations. The same concentrations were used for PUR-APG and APG-CSP combinations.
Dose response studies for combination of drugs were followed in a similar method of
single drug. Three drugs (puromycin (PUR), cisplatin (CSP), and apigenin (APG)) were chosen
arbitrarily to study the drug combinations (Fig. 4). To determine the IC50 values, two drugs of a
combination were added to confluent cells one by one at 1:1, 1:3, and 3:1 ratios with varying
© 2014 Macmillan Publishers Limited. All rights reserved.
14
concentrations (Supplementary Table 2). The concentrations of drugs used were same for all the
different combinations (PUR-CSP, PUR-APG, and APG-CSP). The IC50 values were determined
by fitting the data using the same dose response model (Supplementary Fig. 6 and
Supplementary Table 5).
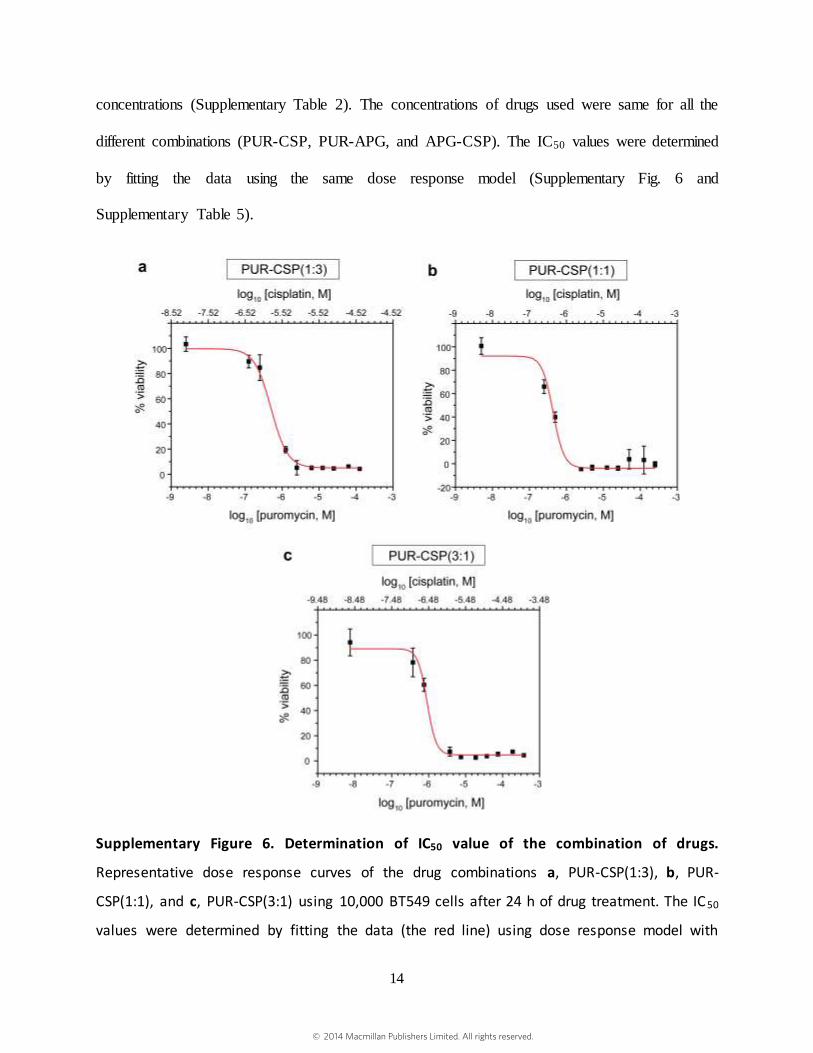
Supplementary Figure 6. Determination of IC50 value of the combination of drugs.
Representative dose response curves of the drug combinations a, PUR-CSP(1:3), b, PUR-
CSP(1:1), and c, PUR-CSP(3:1) using 10,000 BT549 cells after 24 h of drug treatment. The IC50
values were determined by fitting the data (the red line) using dose response model with
© 2014 Macmillan Publishers Limited. All rights reserved.
15
variable Hill slope built in Origin 8.5 program. The data are averages of three replicates and the
error bars represent the ±standard deviation. The IC50 concentrations are reported in
Supplementary Table 5.
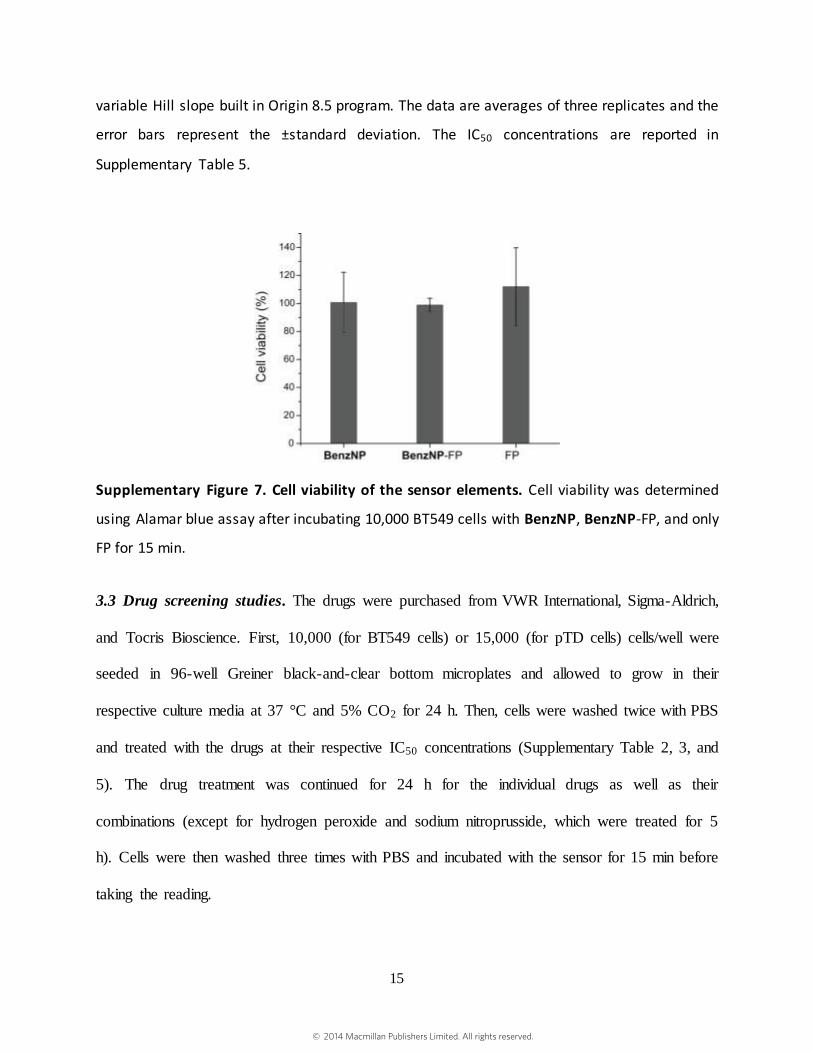
Supplementary Figure 7. Cell viability of the sensor elements. Cell viability was determined
using Alamar blue assay after incubating 10,000 BT549 cells with BenzNP, BenzNP-FP, and only
FP for 15 min.
3.3 Drug screening studies. The drugs were purchased from VWR International, Sigma-Aldrich,
and Tocris Bioscience. First, 10,000 (for BT549 cells) or 15,000 (for pTD cells) cells/well were
seeded in 96-well Greiner black-and-clear bottom microplates and allowed to grow in their
respective culture media at 37 °C and 5% CO2 for 24 h. Then, cells were washed twice with PBS
and treated with the drugs at their respective IC50 concentrations (Supplementary Table 2, 3, and
5). The drug treatment was continued for 24 h for the individual drugs as well as their
combinations (except for hydrogen peroxide and sodium nitroprusside, which were treated for 5
h). Cells were then washed three times with PBS and incubated with the sensor for 15 min before
taking the reading.
© 2014 Macmillan Publishers Limited. All rights reserved.
16
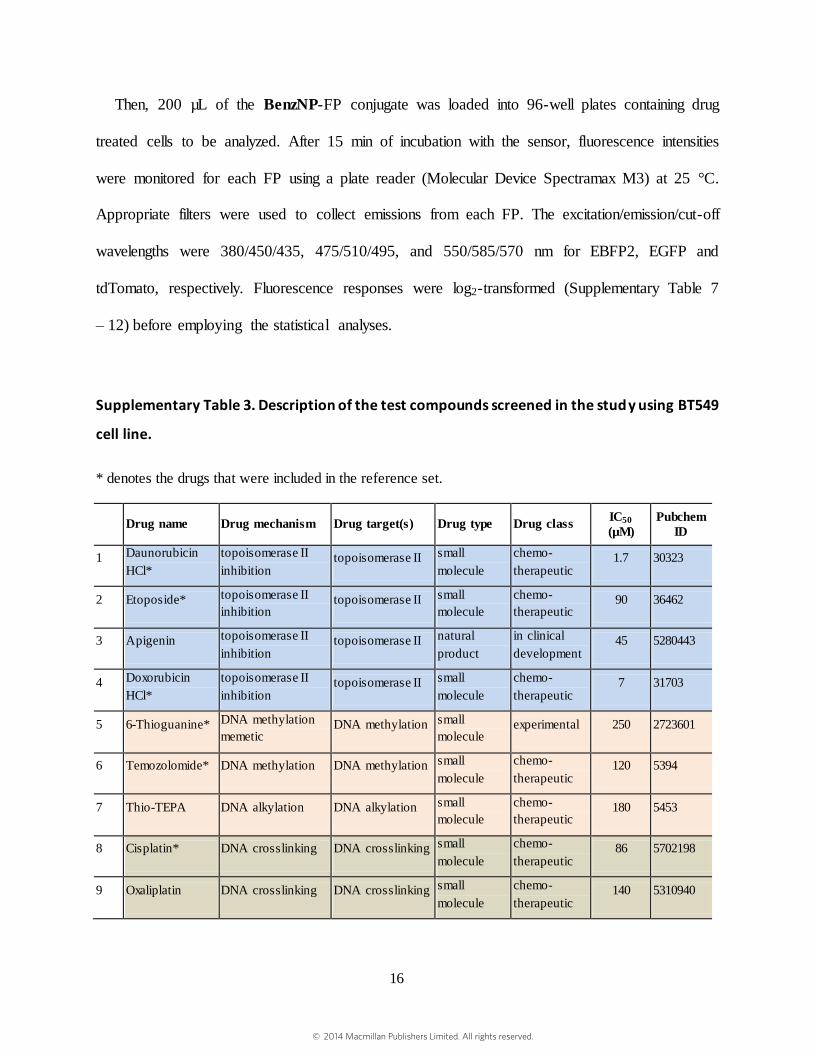
Then, 200 µL of the BenzNP-FP conjugate was loaded into 96-well plates containing drug
treated cells to be analyzed. After 15 min of incubation with the sensor, fluorescence intensities
were monitored for each FP using a plate reader (Molecular Device Spectramax M3) at 25 °C.
Appropriate filters were used to collect emissions from each FP. The excitation/emission/cut-off
wavelengths were 380/450/435, 475/510/495, and 550/585/570 nm for EBFP2, EGFP and
tdTomato, respectively. Fluorescence responses were log2-transformed (Supplementary Table 7
– 12) before employing the statistical analyses.
Supplementary Table 3. Description of the test compounds screened in the study using BT549
cell line.
* denotes the drugs that were included in the reference set.
Drug name Drug mechanism Drug target(s) Drug type Drug class
IC50
(µM)
Pubchem
ID
1 Daunorubicin
HCl*
topoisomerase II
inhibition topoisomerase II small
molecule
chemo-
therapeutic 1.7 30323
2 Etoposide* topoisomerase II
inhibition topoisomerase II small
molecule
chemo-
therapeutic 90 36462
3 Apigenin topoisomerase II
inhibition topoisomerase II natural
product
in clinical
development 45 5280443
4 Doxorubicin
HCl*
topoisomerase II
inhibition topoisomerase II small
molecule
chemo-
therapeutic 7 31703
5 6-Thioguanine* DNA methylation
memetic DNA methylation small
molecule experimental 250 2723601
6 Temozolomide* DNA methylation DNA methylation small
molecule
chemo-
therapeutic 120 5394
7 Thio-TEPA DNA alkylation DNA alkylation small
molecule
chemo-
therapeutic 180 5453
8 Cisplatin* DNA crosslinking DNA crosslinking small
molecule
chemo-
therapeutic 86 5702198
9 Oxaliplatin DNA crosslinking DNA crosslinking small
molecule
chemo-
therapeutic 140 5310940
© 2014 Macmillan Publishers Limited. All rights reserved.

17
10 Chlorambucil* DNA crosslinking DNA crosslinking small
molecule
chemo-
therapeutic 605 2708
11 Paclitaxel disruption of
mitosis microtubules natural
product
chemo-
therapeutic 0.012 36314
12 Vinblastin
sulfate*
disruption of
mitosis microtubules natural
product
chemo-
therapeutic 0.012 6710780
13 Vincristine
sulfate*
disruption of
mitosis microtubules natural
product
chemo-
therapeutic 0.01 249332
14 Anisomycin protein synthesis
inhibition antibiotic natural
product experimental 0.4 253602
15 Emetine protein synthesis
inhibition antibiotic natural
product clinical 0.2 10219
16 Puromycin protein synthesis
inhibition antibiotic natural
product experimental 0.78 439530
17 Roscovitine* CDK inhibition CDKs small
molecule
in clinical
development 0.06 160355
18 Purvalanol A CDK inhibition CDKs small
molecule experimental 4.64 456214
19 Olomoucine* CDK inhibition CDKs small
molecule experimental 117 4592
20 Apicidin* HDAC inibition HDAC natural
product experimental 7 15489645
21 Vorinostat* HDAC inibition HDAC small
molecule clinical 160 5311
22 Scriptaid HDAC inibition HDAC small
molecule experimental 19 5186
23 Hydrogen
peroxide* necrosis necrotic small
molecule experimental 480 784
24 Sodium
nitroprusside* necrosis necrotic small
molecule experimental 450 11963622
25 β-lapachone necrosis necrotic small
molecule
in clinical
development 0.65 3885
26 ALLN protein degradation proteasome small
molecule experimental 7.1 4332
27 MG-132 protein degradation proteasome small
molecule experimental 0.8 462382
28 Irinotecan topoisomerase I
inhibition topoisomerase I small
molecule
chemo-
therapeutic 20 60838
29 Topotecan topoisomerase I
inhibition topoisomerase I small
molecule
chemo-
therapeutic 52 60700
CDK: cyclin-dependent kinase; HDAC: histone deacetylase
© 2014 Macmillan Publishers Limited. All rights reserved.

18
Supplementary Table 4. Description of the chemotherapeutic candidates screened in the
study using pTD cell line.
Drug name Drug mechanism Drug target(s) Drug type Drug class
IC50
(µM)
Pubcehm
ID
1 Doxorubicin
HCl
Topoisomerase II
inhibition Topoisomerase II Small
molecule
Chemo-
therapeutic 1 31703
2 Daunorubicin
HCl
Topoisomerase II
inhibition Topoisomerase II Small
molecule
Chemo-
therapeutic 1.5 30323
3 6-Thioguanine DNA methylation
memetic
DNA
methylation
small
molecule experimental 5 2723601
4 Gemcitabine Nucleic acid
synthesis
inhibition
Nucleic acid
synthesis
small
molecule
chemo-
therapeutic 0.09 60750
5 Cisplatin DNA crosslinking DNA
crosslinking
small
molecule
chemo-
therapeutic 12 5702198
6 Chlorambucil DNA crosslinking DNA
crosslinking
small
molecule
chemo-
therapeutic 250 2708
7 Carboplatin DNA crosslinking DNA
crosslinking
small
molecule
chemo-
therapeutic 340 10339178
8 Paclitaxel disruption of
mitosis microtubules natural
product
chemo-
therapeutic 5 36314
9 Vinblastin
sulfate
disruption of
mitosis microtubules natural
product
chemo-
therapeutic 5 6710780
10 Vincristine
sulfate
disruption of
mitosis microtubules natural
product
chemo-
therapeutic 1 249332
11 Hydrogen
peroxide necrosis necrotic small
molecule experimental 100 784
12 Sodium
nitroprusside necrosis necrotic small
molecule experimental 500 11963622
13 Camptothecin topoisomerase I
inhibition topoisomerase I natural
product
chemo-
therapeutic 1 104842
14 Irinotecan topoisomerase I
inhibition topoisomerase I natural
product
chemo-
therapeutic 5 60838
© 2014 Macmillan Publishers Limited. All rights reserved.
19
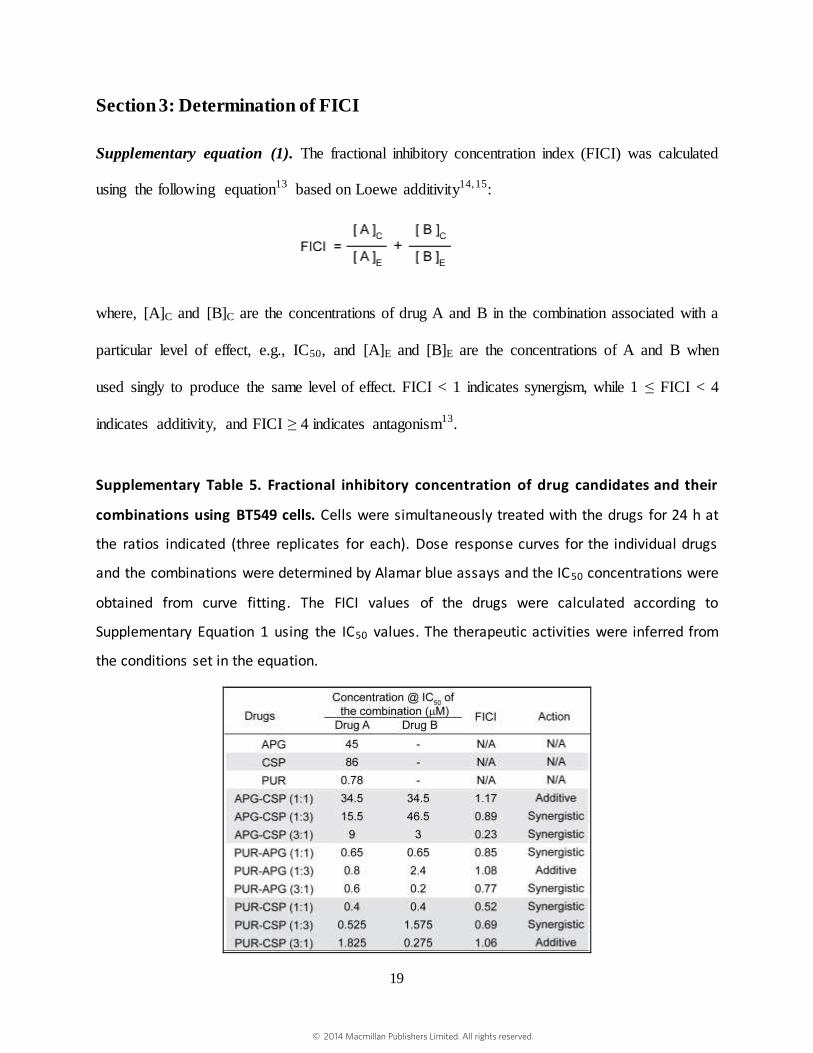
Section 3: Determination of FICI
Supplementary equation (1). The fractional inhibitory concentration index (FICI) was calculated
using the following equation13 based on Loewe additivity14,15:
where, [A]C and [B]C are the concentrations of drug A and B in the combination associated with a
particular level of effect, e.g., IC50, and [A]E and [B]E are the concentrations of A and B when
used singly to produce the same level of effect. FICI < 1 indicates synergism, while 1 ≤ FICI < 4
indicates additivity, and FICI ≥ 4 indicates antagonism13.
Supplementary Table 5. Fractional inhibitory concentration of drug candidates and their
combinations using BT549 cells. Cells were simultaneously treated with the drugs for 24 h at
the ratios indicated (three replicates for each). Dose response curves for the individual drugs
and the combinations were determined by Alamar blue assays and the IC50 concentrations were
obtained from curve fitting. The FICI values of the drugs were calculated according to
Supplementary Equation 1 using the IC50 values. The therapeutic activities were inferred from
the conditions set in the equation.
© 2014 Macmillan Publishers Limited. All rights reserved.
20
Section 4: Statistical Methods
4.1 Hierarchical clustering analysis. Hierarchical clustering analysis (HCA) is an unbiased
clustering approach. HCA of the average data set was performed using the hclust function of the
stats package of R assuming a complete linkage method16. hclust begins with each case serving
as its own cluster; at each step in the clustering process, the two most similar cases or clusters are
joined; the process iterates until all cases fall into a single cluster. HCA allows cases with
mechanisms outside the reference set to be identified as novel, if they are dissimilar from the
other cases in the set; in this case, they are linked to the other cases/clusters relatively high in the
denodrogram.
4.2 Linear discriminant analysis. The raw fluorescence response data matrix was processed by
classical linear discriminant analysis (LDA) using SYSTAT software (version 11.0,
SystatSoftware, Richmond, CA, USA). In LDA, all variables were used in the model (complete
mode) and the tolerance was set as 0.001. The raw fluorescence response patterns were
transformed to canonical patterns where the ratio of between-class variance to the within-class
variance was maximised, where the classes were defined as the drug mechanisms in the
reference set. This defines the LDA solution space.
To identify the unknown (blinded) samples, we first re-ran LDA on the reference set using the
lda function in the MASS package17 of R; these results replicated the SYSTAT analysis.
Predicted classifications for the blinded samples were then obtained using the predict.lda
function that uses the fluorescence response patterns of each new case to compute the
Mahalanobis distance of that case to the centroid of each mechanism cluster in the LDA solution
space (Fig. 3b). Blinded cases are predicted to belong to the closest mechanism class, defined by
the shortest Mahalanobis distance. Because some distance is always shortest, LDA is incapable
© 2014 Macmillan Publishers Limited. All rights reserved.
21
of identifying blinded or completely unknown samples as having novel mechanisms. However,
by considering the expected distribution of Mahalanobis distances under these conditions, cases
can be identified as outliers if they fall far from the closest centroid (i.e., have an associated p-
value < 0.01). Here, the distances are proportional to an F distribution18: for n cases overall, p
dimensions in the LDA solution and Mahalanobis distances d2,
).,(~)1)(1(
)(2
pnpFnnp
pnnd
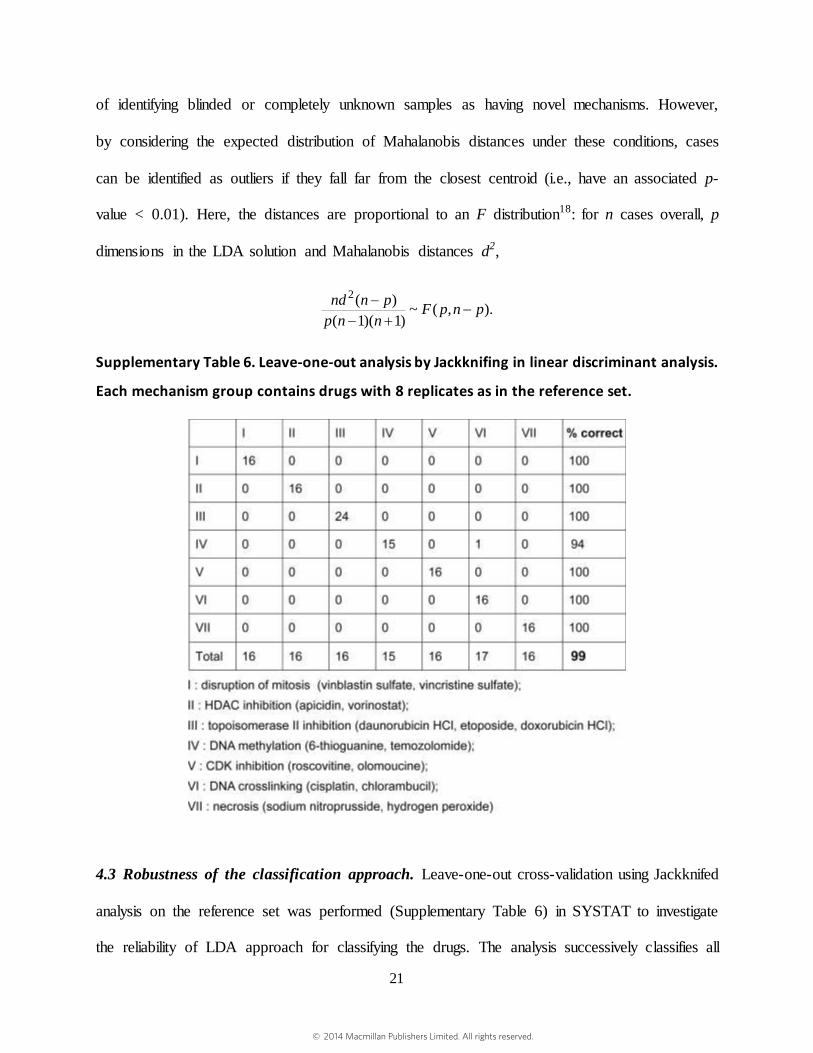
Supplementary Table 6. Leave-one-out analysis by Jackknifing in linear discriminant analysis.
Each mechanism group contains drugs with 8 replicates as in the reference set.
4.3 Robustness of the classification approach. Leave-one-out cross-validation using Jackknifed
analysis on the reference set was performed (Supplementary Table 6) in SYSTAT to investigate
the reliability of LDA approach for classifying the drugs. The analysis successively classifies all
© 2014 Macmillan Publishers Limited. All rights reserved.

22
cases but one to develop a discriminant function and then categorises the case that was left out.
This process is repeated with each case left out in turn. To assess the classification of unknown
cases based on the shortest Mahalanobis distance, the distribution of all the distances was
investigated. The distribution of squared Mahalanobis distances between each drug mechanism
from the training set and blinded unknowns were plotted (Supplementary Fig. 8) as cumulative
density functions (CDF) using the cdfplot function in StataSE 13. CDFs were also prepared for
those drugs identified as novel mechanisms (Supplementary Fig. 9).
Supplementary Figure 8. Cumulative density functions for the squared Mahalanobis distance
between blinded unknowns and each mechanism from the reference set.
© 2014 Macmillan Publishers Limited. All rights reserved.
23
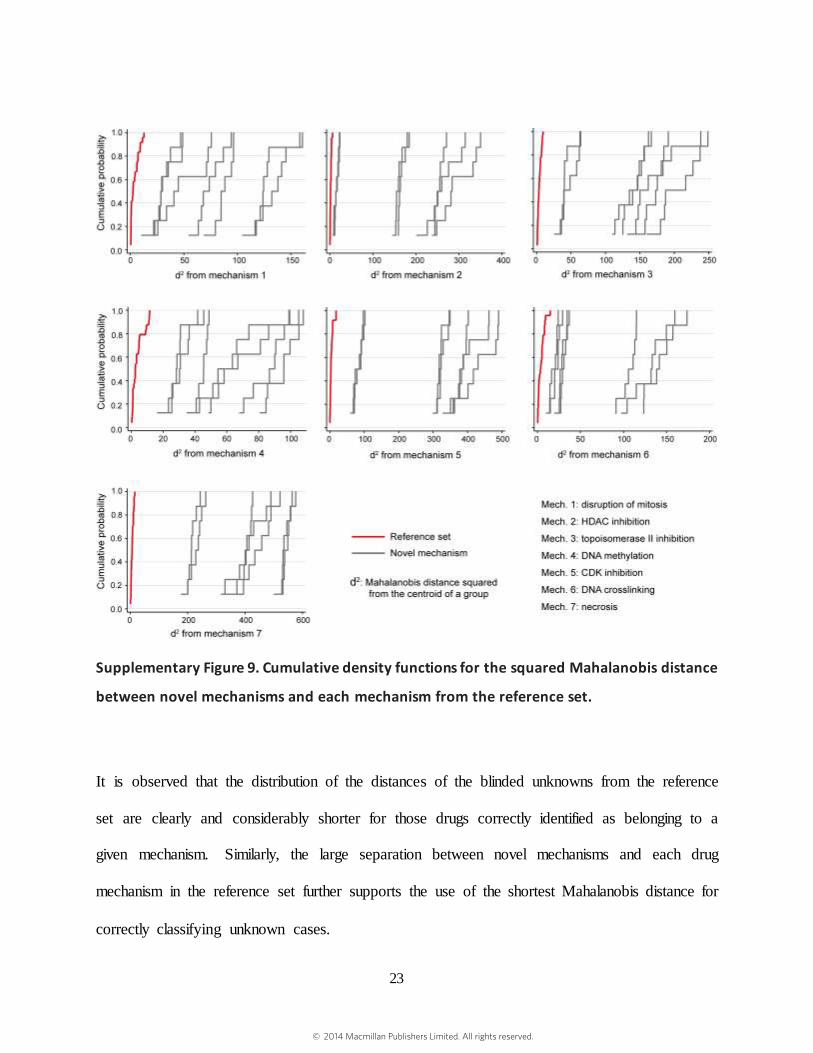
Supplementary Figure 9. Cumulative density functions for the squared Mahalanobis distance
between novel mechanisms and each mechanism from the reference set.
It is observed that the distribution of the distances of the blinded unknowns from the reference
set are clearly and considerably shorter for those drugs correctly identified as belonging to a
given mechanism. Similarly, the large separation between novel mechanisms and each drug
mechanism in the reference set further supports the use of the shortest Mahalanobis distance for
correctly classifying unknown cases.
© 2014 Macmillan Publishers Limited. All rights reserved.

24
Section 5: Validation of the Drug Screening Methodology
Supplementary Figure 10. Drug screening using pTD cells. a, Heat map of the fluorescence
responses pTD cells when treated with 11 reference drugs, where I0 and I are respectively the
fluorescence before and after the addition of the sensor to the cells. Agglomerative hierarchical
analysis was performed on the averages of the fluorescence responses. The dendrogram shows
degree of association. b, Linear discriminant analysis of the fluorescence responses resulted in
canonical scores with three discriminants explaining 90.6, 8.5, and 0.9% of total variance and
plotted with 95% confidence ellipses around the centroid of each group (based on the standard
error of the mean).
© 2014 Macmillan Publishers Limited. All rights reserved.
25
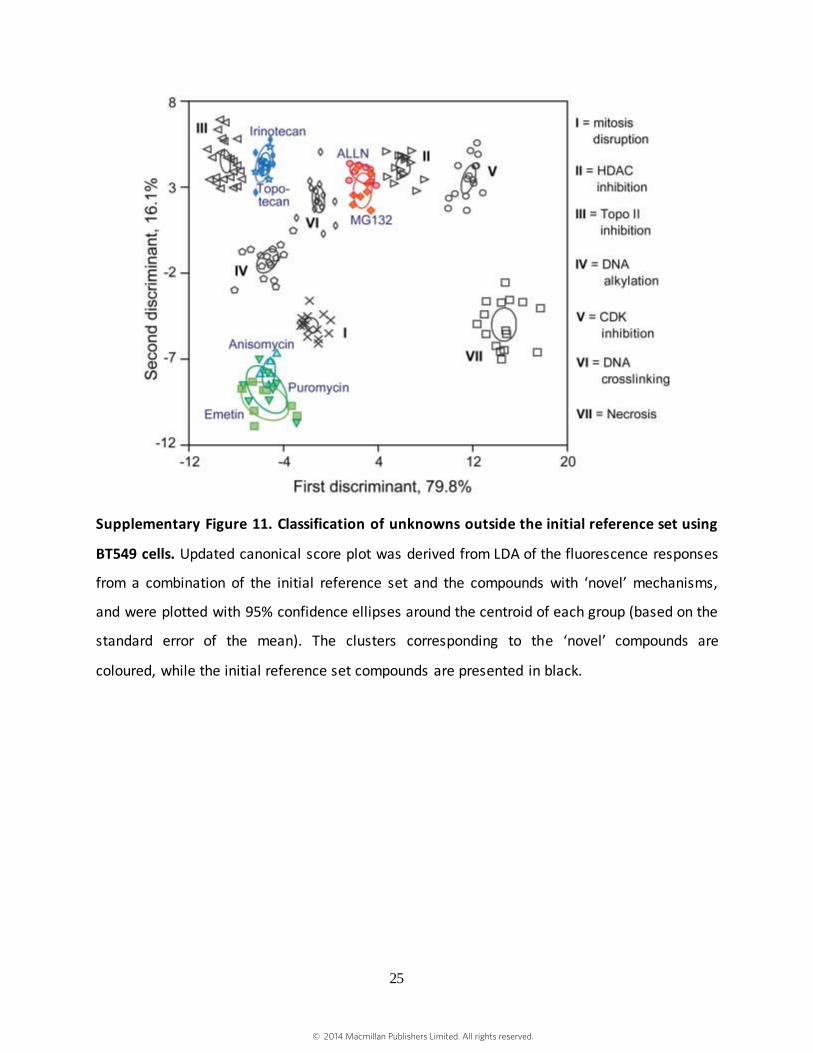
Supplementary Figure 11. Classification of unknowns outside the initial reference set using
BT549 cells. Updated canonical score plot was derived from LDA of the fluorescence responses
from a combination of the initial reference set and the compounds with ‘novel’ mechanisms,
and were plotted with 95% confidence ellipses around the centroid of each group (based on the
standard error of the mean). The clusters corresponding to the ‘novel’ compounds are
coloured, while the initial reference set compounds are presented in black.
© 2014 Macmillan Publishers Limited. All rights reserved.
26
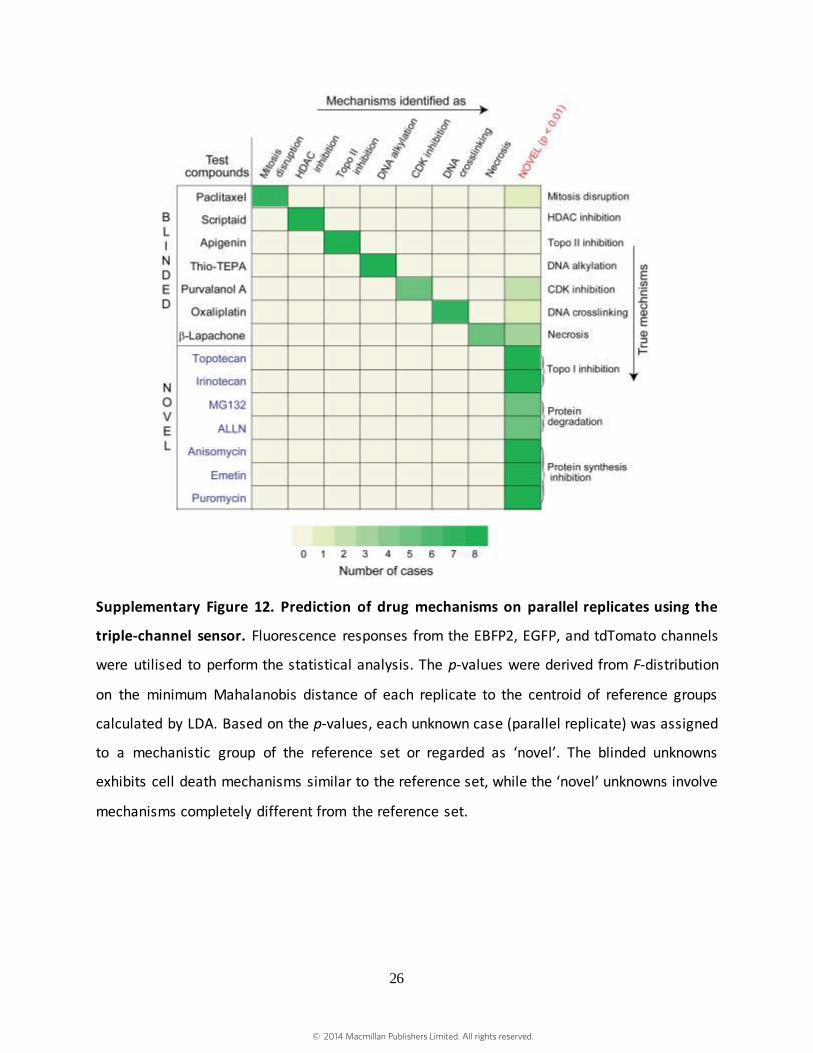
Supplementary Figure 12. Prediction of drug mechanisms on parallel replicates using the
triple-channel sensor. Fluorescence responses from the EBFP2, EGFP, and tdTomato channels
were utilised to perform the statistical analysis. The p-values were derived from F-distribution
on the minimum Mahalanobis distance of each replicate to the centroid of reference groups
calculated by LDA. Based on the p-values, each unknown case (parallel replicate) was assigned
to a mechanistic group of the reference set or regarded as ‘novel’. The blinded unknowns
exhibits cell death mechanisms similar to the reference set, while the ‘novel’ unknowns involve
mechanisms completely different from the reference set.
© 2014 Macmillan Publishers Limited. All rights reserved.
27
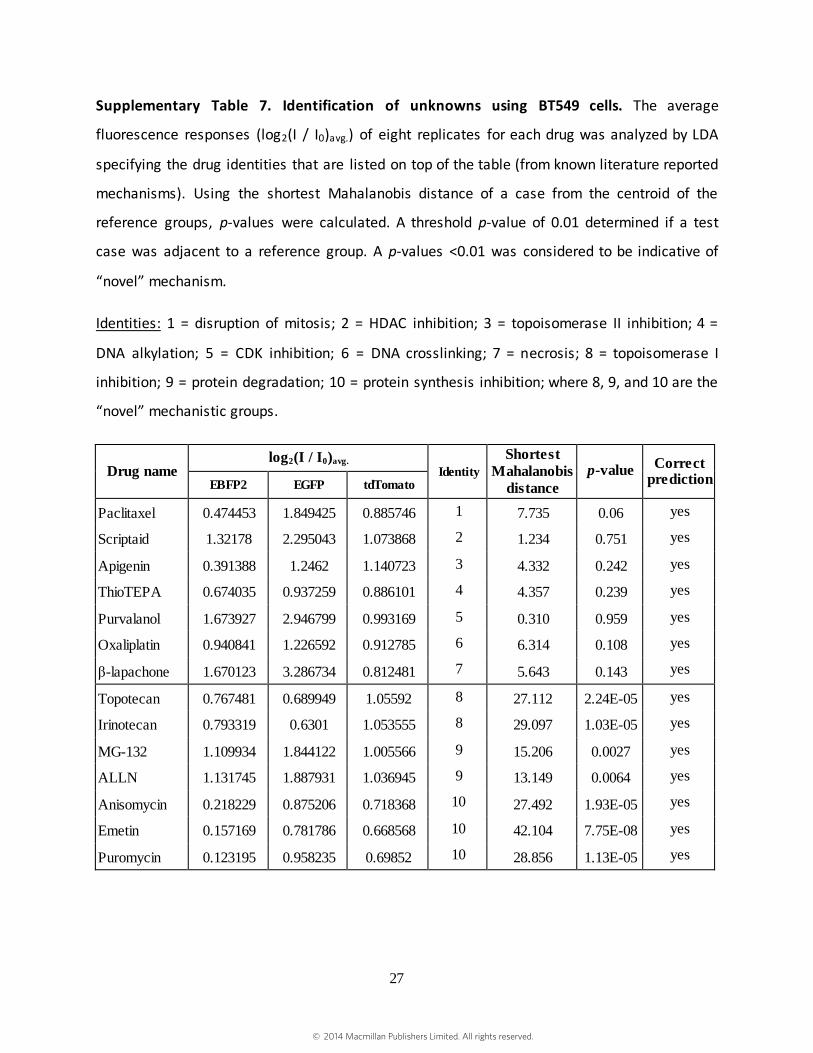
Supplementary Table 7. Identification of unknowns using BT549 cells. The average
fluorescence responses (log2(I / I0)avg.) of eight replicates for each drug was analyzed by LDA
specifying the drug identities that are listed on top of the table (from known literature reported
mechanisms). Using the shortest Mahalanobis distance of a case from the centroid of the
reference groups, p-values were calculated. A threshold p-value of 0.01 determined if a test
case was adjacent to a reference group. A p-values <0.01 was considered to be indicative of
“novel” mechanism.
Identities: 1 = disruption of mitosis; 2 = HDAC inhibition; 3 = topoisomerase II inhibition; 4 =
DNA alkylation; 5 = CDK inhibition; 6 = DNA crosslinking; 7 = necrosis; 8 = topoisomerase I
inhibition; 9 = protein degradation; 10 = protein synthesis inhibition; where 8, 9, and 10 are the
“novel” mechanistic groups.
Drug name log2(I / I0)avg.
Identity
Shortest
Mahalanobis
distance
p-value Correct
prediction EBFP2 EGFP tdTomato
Paclitaxel 0.474453 1.849425 0.885746 1 7.735 0.06 yes
Scriptaid 1.32178 2.295043 1.073868 2 1.234 0.751 yes
Apigenin 0.391388 1.2462 1.140723 3 4.332 0.242 yes
ThioTEPA 0.674035 0.937259 0.886101 4 4.357 0.239 yes
Purvalanol 1.673927 2.946799 0.993169 5 0.310 0.959 yes
Oxaliplatin 0.940841 1.226592 0.912785 6 6.314 0.108 yes
β-lapachone 1.670123 3.286734 0.812481 7 5.643 0.143 yes
Topotecan 0.767481 0.689949 1.05592 8 27.112 2.24E-05 yes
Irinotecan 0.793319 0.6301 1.053555 8 29.097 1.03E-05 yes
MG-132 1.109934 1.844122 1.005566 9 15.206 0.0027 yes
ALLN 1.131745 1.887931 1.036945 9 13.149 0.0064 yes
Anisomycin 0.218229 0.875206 0.718368 10 27.492 1.93E-05 yes
Emetin 0.157169 0.781786 0.668568 10 42.104 7.75E-08 yes
Puromycin 0.123195 0.958235 0.69852 10 28.856 1.13E-05 yes
© 2014 Macmillan Publishers Limited. All rights reserved.
28
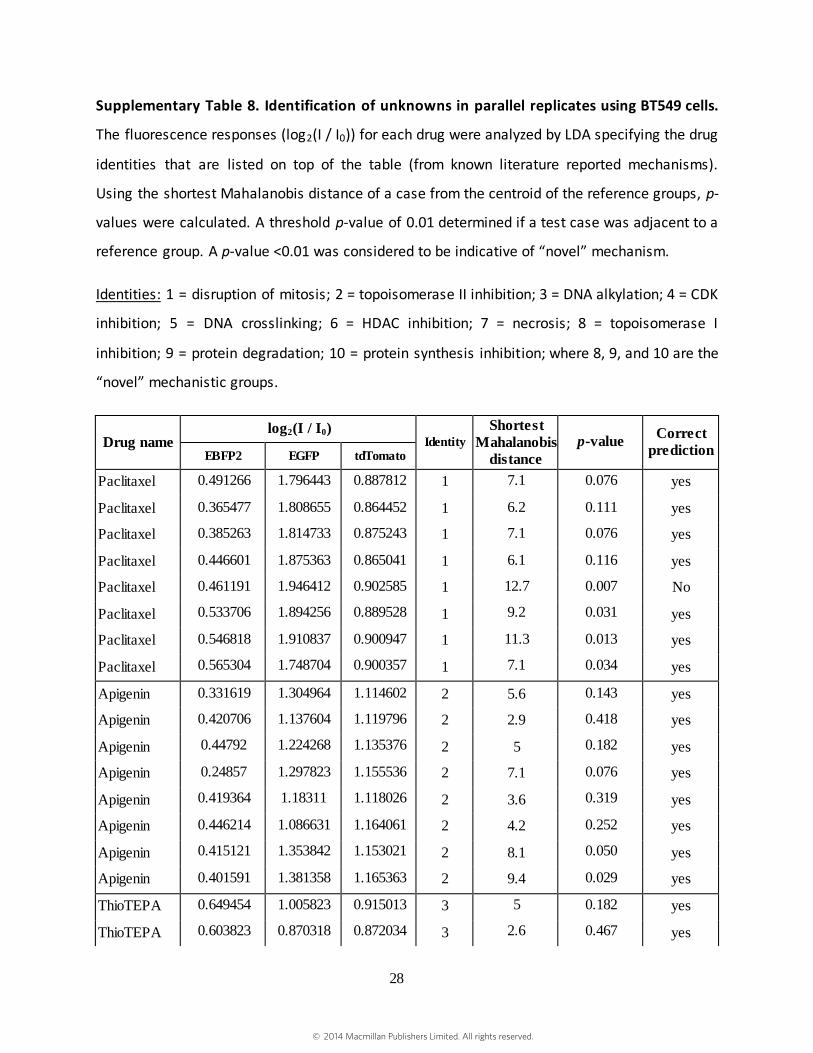
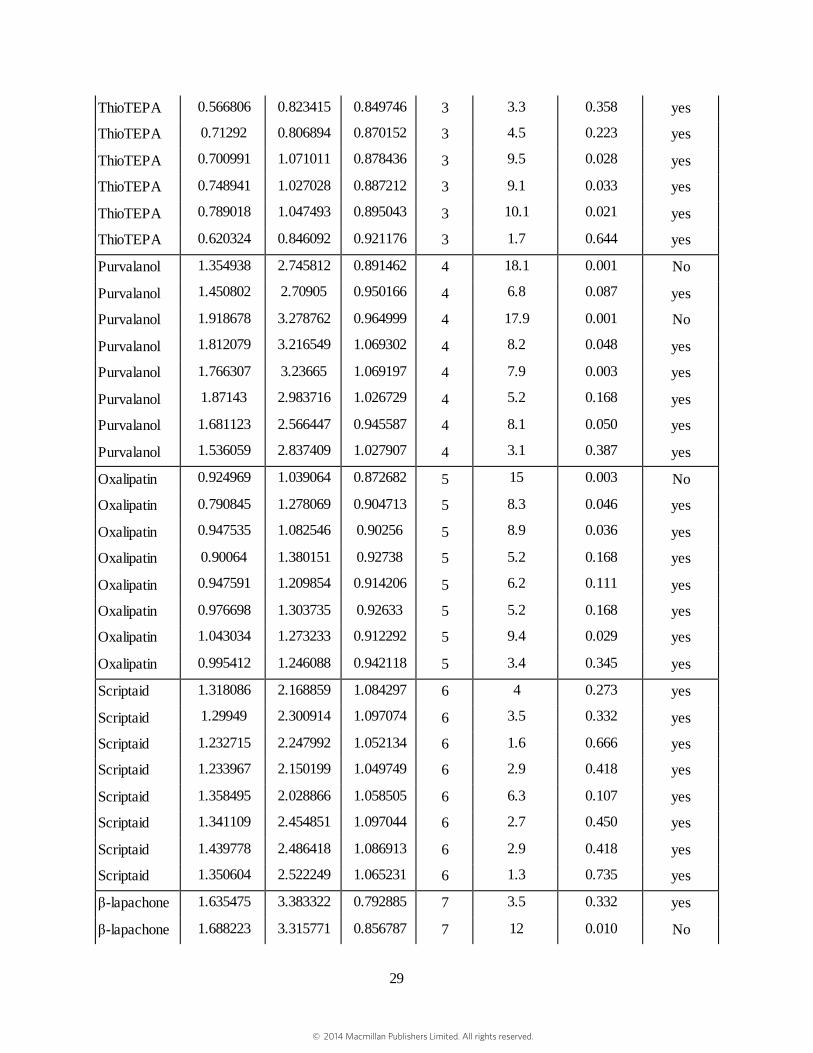
Supplementary Table 8. Identification of unknowns in parallel replicates using BT549 cells.
The fluorescence responses (log2(I / I0)) for each drug were analyzed by LDA specifying the drug
identities that are listed on top of the table (from known literature reported mechanisms).
Using the shortest Mahalanobis distance of a case from the centroid of the reference groups, p-
values were calculated. A threshold p-value of 0.01 determined if a test case was adjacent to a
reference group. A p-value <0.01 was considered to be indicative of “novel” mechanism.
Identities: 1 = disruption of mitosis; 2 = topoisomerase II inhibition; 3 = DNA alkylation; 4 = CDK
inhibition; 5 = DNA crosslinking; 6 = HDAC inhibition; 7 = necrosis; 8 = topoisomerase I
inhibition; 9 = protein degradation; 10 = protein synthesis inhibition; where 8, 9, and 10 are the
“novel” mechanistic groups.
Drug name log2(I / I0)
Identity
Shortest
Mahalanobis
distance
p-value Correct
prediction EBFP2 EGFP tdTomato
Paclitaxel 0.491266 1.796443 0.887812 1 7.1 0.076 yes
Paclitaxel 0.365477 1.808655 0.864452 1 6.2 0.111 yes
Paclitaxel 0.385263 1.814733 0.875243 1 7.1 0.076 yes
Paclitaxel 0.446601 1.875363 0.865041 1 6.1 0.116 yes
Paclitaxel 0.461191 1.946412 0.902585 1 12.7 0.007 No
Paclitaxel 0.533706 1.894256 0.889528 1 9.2 0.031 yes
Paclitaxel 0.546818 1.910837 0.900947 1 11.3 0.013 yes
Paclitaxel 0.565304 1.748704 0.900357 1 7.1 0.034 yes
Apigenin 0.331619 1.304964 1.114602 2 5.6 0.143 yes
Apigenin 0.420706 1.137604 1.119796 2 2.9 0.418 yes
Apigenin 0.44792 1.224268 1.135376 2 5 0.182 yes
Apigenin 0.24857 1.297823 1.155536 2 7.1 0.076 yes
Apigenin 0.419364 1.18311 1.118026 2 3.6 0.319 yes
Apigenin 0.446214 1.086631 1.164061 2 4.2 0.252 yes
Apigenin 0.415121 1.353842 1.153021 2 8.1 0.050 yes
Apigenin 0.401591 1.381358 1.165363 2 9.4 0.029 yes
ThioTEPA 0.649454 1.005823 0.915013 3 5 0.182 yes
ThioTEPA 0.603823 0.870318 0.872034 3 2.6 0.467 yes
© 2014 Macmillan Publishers Limited. All rights reserved.
29
ThioTEPA 0.566806 0.823415 0.849746 3 3.3 0.358 yes
ThioTEPA 0.71292 0.806894 0.870152 3 4.5 0.223 yes
ThioTEPA 0.700991 1.071011 0.878436 3 9.5 0.028 yes
ThioTEPA 0.748941 1.027028 0.887212 3 9.1 0.033 yes
ThioTEPA 0.789018 1.047493 0.895043 3 10.1 0.021 yes
ThioTEPA 0.620324 0.846092 0.921176 3 1.7 0.644 yes
Purvalanol 1.354938 2.745812 0.891462 4 18.1 0.001 No
Purvalanol 1.450802 2.70905 0.950166 4 6.8 0.087 yes
Purvalanol 1.918678 3.278762 0.964999 4 17.9 0.001 No
Purvalanol 1.812079 3.216549 1.069302 4 8.2 0.048 yes
Purvalanol 1.766307 3.23665 1.069197 4 7.9 0.003 yes
Purvalanol 1.87143 2.983716 1.026729 4 5.2 0.168 yes
Purvalanol 1.681123 2.566447 0.945587 4 8.1 0.050 yes
Purvalanol 1.536059 2.837409 1.027907 4 3.1 0.387 yes
Oxalipatin 0.924969 1.039064 0.872682 5 15 0.003 No
Oxalipatin 0.790845 1.278069 0.904713 5 8.3 0.046 yes
Oxalipatin 0.947535 1.082546 0.90256 5 8.9 0.036 yes
Oxalipatin 0.90064 1.380151 0.92738 5 5.2 0.168 yes
Oxalipatin 0.947591 1.209854 0.914206 5 6.2 0.111 yes
Oxalipatin 0.976698 1.303735 0.92633 5 5.2 0.168 yes
Oxalipatin 1.043034 1.273233 0.912292 5 9.4 0.029 yes
Oxalipatin 0.995412 1.246088 0.942118 5 3.4 0.345 yes
Scriptaid 1.318086 2.168859 1.084297 6 4 0.273 yes
Scriptaid 1.29949 2.300914 1.097074 6 3.5 0.332 yes
Scriptaid 1.232715 2.247992 1.052134 6 1.6 0.666 yes
Scriptaid 1.233967 2.150199 1.049749 6 2.9 0.418 yes
Scriptaid 1.358495 2.028866 1.058505 6 6.3 0.107 yes
Scriptaid 1.341109 2.454851 1.097044 6 2.7 0.450 yes
Scriptaid 1.439778 2.486418 1.086913 6 2.9 0.418 yes
Scriptaid 1.350604 2.522249 1.065231 6 1.3 0.735 yes
β-lapachone 1.635475 3.383322 0.792885 7 3.5 0.332 yes
β-lapachone 1.688223 3.315771 0.856787 7 12 0.010 No
© 2014 Macmillan Publishers Limited. All rights reserved.

30
β-lapachone 1.735551 3.367408 0.835724 7 10.6 0.017 yes
β-lapachone 1.81585 3.404662 0.801989 7 12.9 0.007 No
β-lapachone 1.794584 3.359697 0.826125 7 12.8 0.007 No
β-lapachone 1.593027 3.178195 0.784549 7 2.3 0.522 yes
β-lapachone 1.602053 3.275111 0.789168 7 2.1 0.560 yes
β-lapachone 1.496224 3.009709 0.812623 7 7.1 0.076 yes
Topotecan 0.9124558 0.576372 1.0719014 8 34.55 8.12E-07 yes
Topotecan 0.7450821 0.753095 1.0313165 8 19.71 0.0003 yes
Topotecan 0.7804058 0.662567 1.0470668 8 26.11 2.5E-05 yes
Topotecan 0.744172 0.711525 1.0671398 8 29.46 6.32E-06 yes
Topotecan 0.6908895 0.80616 1.0702224 8 25.79 2.86E-05 yes
Topotecan 0.7709816 0.713901 1.0576847 8 25.98 2.64E-05 yes
Topotecan 0.7775269 0.723867 1.058921 8 25.43 3.31E-05 yes
Topotecan 0.7183373 0.572104 1.0431048 8 25.51 3.2E-05 yes
Irinotecan 0.9111066 0.626794 1.0873711 8 34.78 7.39E-07 yes
Irinotecan 0.8906265 0.599745 1.0422428 8 27.15 1.63E-05 yes
Irinotecan 0.6956894 0.514066 1.0048161 8 16.48 0.001 yes
Irinotecan 0.9017144 0.612873 1.0581076 8 29.10 7.33E-06 yes
Irinotecan 0.736761 0.681736 1.0498032 8 25.60 3.08E-05 yes
Irinotecan 0.7294804 0.654143 1.0803982 8 32.83 1.62E-06 yes
Irinotecan 0.7196964 0.697728 1.0441147 8 23.40 7.7E-05 yes
Irinotecan 0.7614738 0.653716 1.0615859 8 30.32 4.46E-06 yes
MG-132 1.1203962 1.820018 1.0453932 9 16.48 0.001 yes
MG-132 1.1054221 1.92109 0.9707078 9 14.16 0.003804 yes
MG-132 1.1020249 1.780509 0.9932195 9 14.50 0.003291 yes
MG-132 1.0754434 1.707923 0.9966842 9 10.43 0.018 No
MG-132 1.0027647 1.810005 0.9880495 9 14.26 0.003644 yes
MG-132 1.1234936 1.904117 1.0037248 9 12.33 0.008294 yes
MG-132 1.2186177 1.869946 1.0275463 9 11.51 0.012 No
MG-132 1.1313061 1.939365 1.0192029 9 10.66 0.017 No
ALLN 0.9805836 1.919773 1.0380716 9 20.00 0.0003 yes
ALLN 1.1916907 1.948941 1.0400151 9 9.10 0.032838 No
© 2014 Macmillan Publishers Limited. All rights reserved.
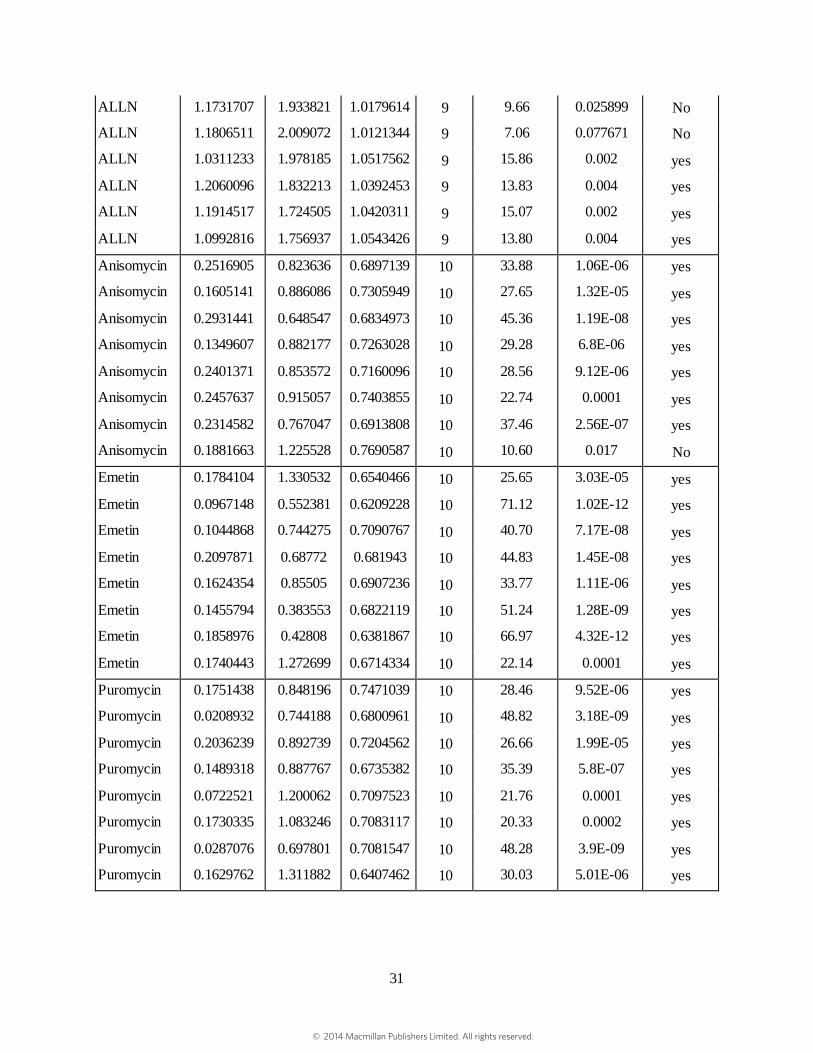
31
ALLN 1.1731707 1.933821 1.0179614 9 9.66 0.025899 No
ALLN 1.1806511 2.009072 1.0121344 9 7.06 0.077671 No
ALLN 1.0311233 1.978185 1.0517562 9 15.86 0.002 yes
ALLN 1.2060096 1.832213 1.0392453 9 13.83 0.004 yes
ALLN 1.1914517 1.724505 1.0420311 9 15.07 0.002 yes
ALLN 1.0992816 1.756937 1.0543426 9 13.80 0.004 yes
Anisomycin 0.2516905 0.823636 0.6897139 10 33.88 1.06E-06 yes
Anisomycin 0.1605141 0.886086 0.7305949 10 27.65 1.32E-05 yes
Anisomycin 0.2931441 0.648547 0.6834973 10 45.36 1.19E-08 yes
Anisomycin 0.1349607 0.882177 0.7263028 10 29.28 6.8E-06 yes
Anisomycin 0.2401371 0.853572 0.7160096 10 28.56 9.12E-06 yes
Anisomycin 0.2457637 0.915057 0.7403855 10 22.74 0.0001 yes
Anisomycin 0.2314582 0.767047 0.6913808 10 37.46 2.56E-07 yes
Anisomycin 0.1881663 1.225528 0.7690587 10 10.60 0.017 No
Emetin 0.1784104 1.330532 0.6540466 10 25.65 3.03E-05 yes
Emetin 0.0967148 0.552381 0.6209228 10 71.12 1.02E-12 yes
Emetin 0.1044868 0.744275 0.7090767 10 40.70 7.17E-08 yes
Emetin 0.2097871 0.68772 0.681943 10 44.83 1.45E-08 yes
Emetin 0.1624354 0.85505 0.6907236 10 33.77 1.11E-06 yes
Emetin 0.1455794 0.383553 0.6822119 10 51.24 1.28E-09 yes
Emetin 0.1858976 0.42808 0.6381867 10 66.97 4.32E-12 yes
Emetin 0.1740443 1.272699 0.6714334 10 22.14 0.0001 yes
Puromycin 0.1751438 0.848196 0.7471039 10 28.46 9.52E-06 yes
Puromycin 0.0208932 0.744188 0.6800961 10 48.82 3.18E-09 yes
Puromycin 0.2036239 0.892739 0.7204562 10 26.66 1.99E-05 yes
Puromycin 0.1489318 0.887767 0.6735382 10 35.39 5.8E-07 yes
Puromycin 0.0722521 1.200062 0.7097523 10 21.76 0.0001 yes
Puromycin 0.1730335 1.083246 0.7083117 10 20.33 0.0002 yes
Puromycin 0.0287076 0.697801 0.7081547 10 48.28 3.9E-09 yes
Puromycin 0.1629762 1.311882 0.6407462 10 30.03 5.01E-06 yes
© 2014 Macmillan Publishers Limited. All rights reserved.
32
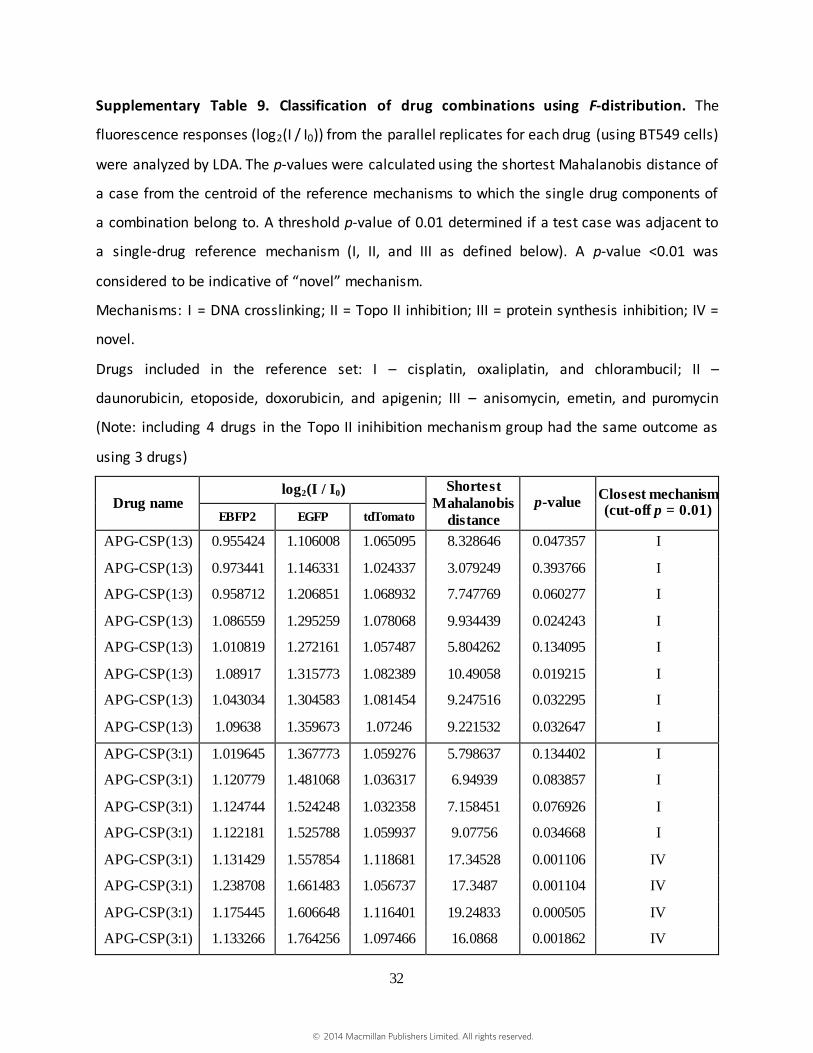
Supplementary Table 9. Classification of drug combinations using F-distribution. The
fluorescence responses (log2(I / I0)) from the parallel replicates for each drug (using BT549 cells)
were analyzed by LDA. The p-values were calculated using the shortest Mahalanobis distance of
a case from the centroid of the reference mechanisms to which the single drug components of
a combination belong to. A threshold p-value of 0.01 determined if a test case was adjacent to
a single-drug reference mechanism (I, II, and III as defined below). A p-value <0.01 was
considered to be indicative of “novel” mechanism.
Mechanisms: I = DNA crosslinking; II = Topo II inhibition; III = protein synthesis inhibition; IV =
novel.
Drugs included in the reference set: I – cisplatin, oxaliplatin, and chlorambucil; II –
daunorubicin, etoposide, doxorubicin, and apigenin; III – anisomycin, emetin, and puromycin
(Note: including 4 drugs in the Topo II inihibition mechanism group had the same outcome as
using 3 drugs)
Drug name log2(I / I0) Shortest
Mahalanobis
distance
p-value Closest mechanism (cut-off p = 0.01)
EBFP2 EGFP tdTomato
APG-CSP(1:3) 0.955424 1.106008 1.065095 8.328646 0.047357 I
APG-CSP(1:3) 0.973441 1.146331 1.024337 3.079249 0.393766 I
APG-CSP(1:3) 0.958712 1.206851 1.068932 7.747769 0.060277 I
APG-CSP(1:3) 1.086559 1.295259 1.078068 9.934439 0.024243 I
APG-CSP(1:3) 1.010819 1.272161 1.057487 5.804262 0.134095 I
APG-CSP(1:3) 1.08917 1.315773 1.082389 10.49058 0.019215 I
APG-CSP(1:3) 1.043034 1.304583 1.081454 9.247516 0.032295 I
APG-CSP(1:3) 1.09638 1.359673 1.07246 9.221532 0.032647 I
APG-CSP(3:1) 1.019645 1.367773 1.059276 5.798637 0.134402 I
APG-CSP(3:1) 1.120779 1.481068 1.036317 6.94939 0.083857 I
APG-CSP(3:1) 1.124744 1.524248 1.032358 7.158451 0.076926 I
APG-CSP(3:1) 1.122181 1.525788 1.059937 9.07756 0.034668 I
APG-CSP(3:1) 1.131429 1.557854 1.118681 17.34528 0.001106 IV
APG-CSP(3:1) 1.238708 1.661483 1.056737 17.3487 0.001104 IV
APG-CSP(3:1) 1.175445 1.606648 1.116401 19.24833 0.000505 IV
APG-CSP(3:1) 1.133266 1.764256 1.097466 16.0868 0.001862 IV
© 2014 Macmillan Publishers Limited. All rights reserved.
33
PUR-CSP(1:1) -0.08615 1.622911 0.888862 50.80128 2.91E-09 IV
PUR-CSP(1:1) 0.045809 1.085335 0.824777 15.86019 0.002045 IV
PUR-CSP(1:1) 0.282299 0.933211 0.849196 15.8895 0.002021 IV
PUR-CSP(1:1) 0.248663 1.370993 0.856552 18.06363 0.000822 IV
PUR-CSP(1:1) 0.295679 1.064149 0.845494 14.82667 0.003143 IV
PUR-CSP(1:1) 0.246915 0.939114 0.86624 18.94159 0.000573 IV
PUR-CSP(1:1) 0.367902 1.21823 0.877871 23.49026 8.99E-05 IV
PUR-CSP(1:1) 0.313811 1.178281 0.87533 21.08848 0.000238 IV
PUR-CSP(1:3) 0.132131 0.81462 0.816707 11.42469 0.013002 III
PUR-CSP(1:3) 0.173898 0.822729 0.784728 5.812084 0.133668 III
PUR-CSP(1:3) 0.12376 0.854606 0.813764 10.79458 0.016921 III
PUR-CSP(1:3) 0.158445 0.882777 0.782024 5.256716 0.167431 III
PUR-CSP(1:3) 0.188832 1.110528 0.847513 14.76294 0.003227 IV
PUR-CSP(1:3) 0.198981 0.889976 0.854416 16.8847 0.001338 IV
PUR-CSP(1:3) 0.222699 1.165705 0.84713 14.54853 0.003529 IV
PUR-CSP(1:3) 0.245328 0.982695 0.788376 5.695164 0.140181 III
PUR-APG(1:1) 0.729879 0.973113 0.675937 53.83391 1E-09 IV
PUR-APG(1:1) 0.812728 1.22745 0.674566 55.89781 4.89E-10 IV
PUR-APG(1:1) 0.591799 0.892395 0.703146 30.84083 4.87E-06 IV
PUR-APG(1:1) 1.015348 0.891376 0.659702 64.25754 2.87E-11 IV
PUR-APG(1:1) 0.712939 0.860641 0.740408 34.52504 1.17E-06 IV
PUR-APG(1:1) 0.665525 1.118378 0.774402 30.29744 6.02E-06 IV
PUR-APG(1:1) 0.796373 1.293681 0.753162 31.54274 3.71E-06 IV
PUR-APG(1:1) 0.644193 1.19995 0.729385 37.98025 3.15E-07 IV
PUR-APG(3:1) 0.352239 0.718765 0.62538 11.31612 0.013606 III
PUR-APG(3:1) 0.523196 0.829024 0.659261 24.7313 5.46E-05 IV
PUR-APG(3:1) 0.448536 0.865448 0.614883 21.09229 0.000238 IV
PUR-APG(3:1) 0.516575 0.620904 0.595459 33.79111 1.55E-06 IV
PUR-APG(3:1) 0.370689 0.636177 0.669956 10.03931 0.023203 III
PUR-APG(3:1) 0.538742 0.500122 0.637354 33.15634 1.98E-06 IV
PUR-APG(3:1) 0.501424 0.751816 0.661113 22.37575 0.000141 IV
PUR-APG(3:1) 0.47177 0.754987 0.639533 20.88916 0.000258 IV
© 2014 Macmillan Publishers Limited. All rights reserved.
34
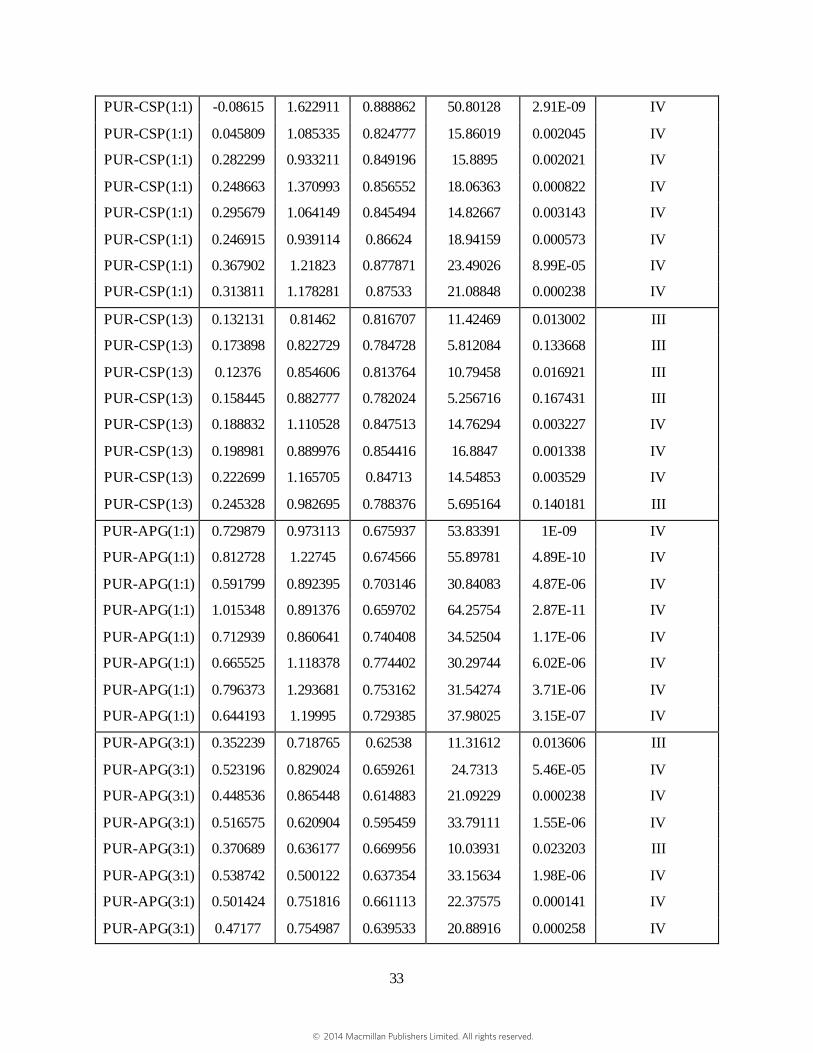
Supplementary Figure 13. Categorizing the mechanisms of drug combinations. BT549 Cells
were treated with the drug combinations for 24 h at their corresponding IC 50 concentrations.
Canonical score plot of the synergistic combinations of b, apigenin-cisplatin, c, puromycin-
cisplatin, and d, puromycin-apigenin were derived from LDA of the fluorescence responses and
plotted with 95% confidence ellipses around the centroid of each group. The identities of
individual drugs from the mechanistic groups, to which the drug components of the
combinations belong to, were retained in the LDA analysis.
© 2014 Macmillan Publishers Limited. All rights reserved.
35
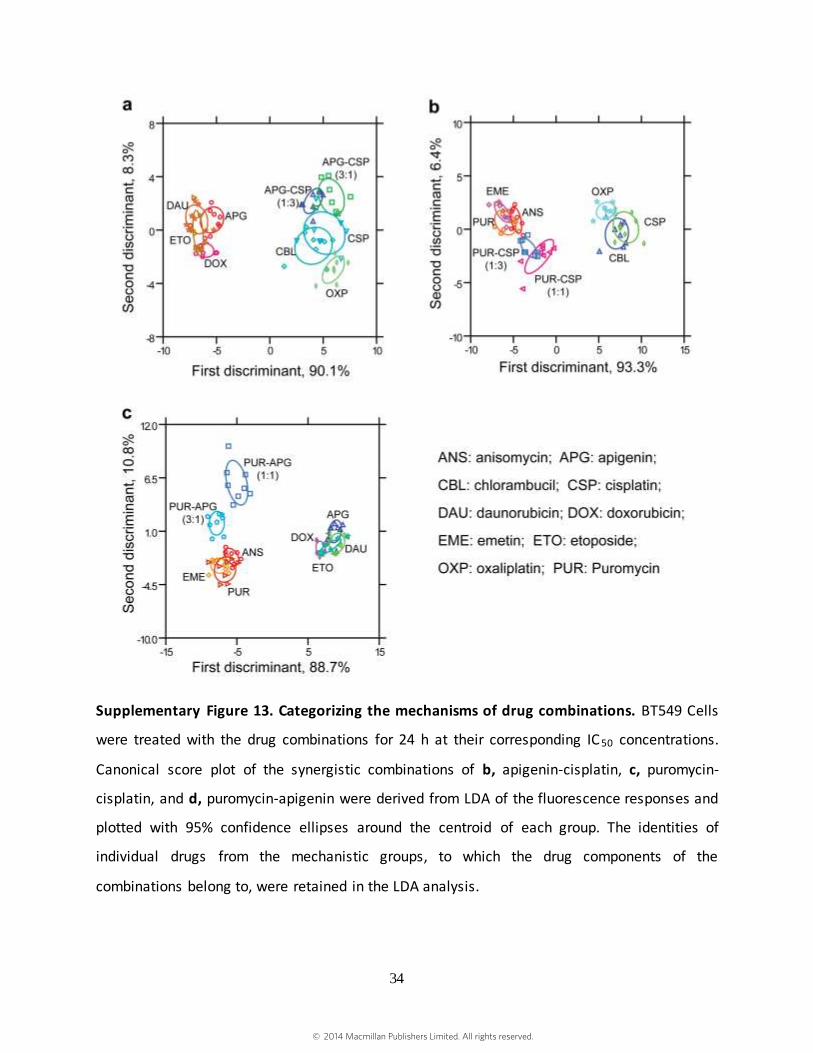
Section 6: Discussions on the Importance of the Fluorescence Channels
It is worth examining the importance of the individual FP in the multi-channel sensor. We drug
categorised the drugs as well as identified the unknowns using to investigate whether or not
different FP pairs provide equivalent or better classification resolution than the triple-channel.
Supplementary Figure 14. Significance of the FPs in categorizing the drug mechanisms using
BT549 cells. The canonical score plots were derived from LDA of the fluorescence responses
© 2014 Macmillan Publishers Limited. All rights reserved.

36
obtained from the FP combinations of a, EBFP2-EGFP, b, EBFP2-tdtomato, c, EGFP-tdTomato,
and d, EBFP2-EGFP-tdTomato, and plotted with 95% confidence ellipses around the centroid of
each group (based on the standard error of the mean). The Jackknifed classification accuracy is
noted on the top of each plot. Identities: I= disruption of mitosis (vinblastine sulfate, vincristine
sulfate); II= HDAC inhibition (apicidin, vorinostat); III= topoisomerase II inhibition (daunorubicin
HCl, etoposide, doxorubicin HCl); IV= DNA alkylation (6-thioguanine, temozolomide); V= CDK
inhibition (roscovitine, olomoucine); VI= DNA crosslinking (cisplatin, chlorambucil); VII= necrosis
(sodium nitroprusside, hydrogen peroxide); VIII= topoisomerase I inhibition (topotecan,
irniotecan); IX= protein degradation (MG-132, ALLN); X= protein synthesis inhibition
(anisomycin, emetin, puromycin).
Apparently, the responses for tdTomato in the triple-channel sensor seem to vary slightly
across the drug set (Fig. 3a and Supplementary Fig. 10). However, a systematic analysis of the
fluorescence responses with and without tdTomato (Supplementary Fig. 14) demonstrates that
this FP provides a significant contribution towards the overall categorization. Interestingly,
tdTomato in combination with EGFP provided much higher classification accuracy (Jackknifed)
than the EBFP2-EGFP pair (97% vs. 87%). Also, it is evident that the triple-channel combination
categorised the reference set with the greatest classification accuracy. The high classification
accuracy of the EGFP-tdTomato pair prompted us to further compare its ability to identify the
blinded unknowns and „novel‟ categories with the triple-channel combination (Supplementary
Fig. 15 and Supplementary Table 10).
© 2014 Macmillan Publishers Limited. All rights reserved.

37
Supplementary Figure 15. Prediction of drug mechanisms on parallel replicates using
fluorescence responses from EGFP-tdTomato pair. Fluorescence responses only from the
EGFP, and tdTomato channels were utilised to perform the statistical analysis. The p-values
were derived from F-distribution on the minimum Mahalanobis distance (derived from LDA) of
each replicate to the centroid of reference groups. Based on the p-values, each unknown case
(parallel replicate) was assigned to a reference mechanistic group or regarded as ‘novel’. The
blinded unknowns exhibits cell death mechanisms s imilar to the reference set, while the ‘novel’
unknowns involve mechanisms completely different from the reference set.
© 2014 Macmillan Publishers Limited. All rights reserved.
38
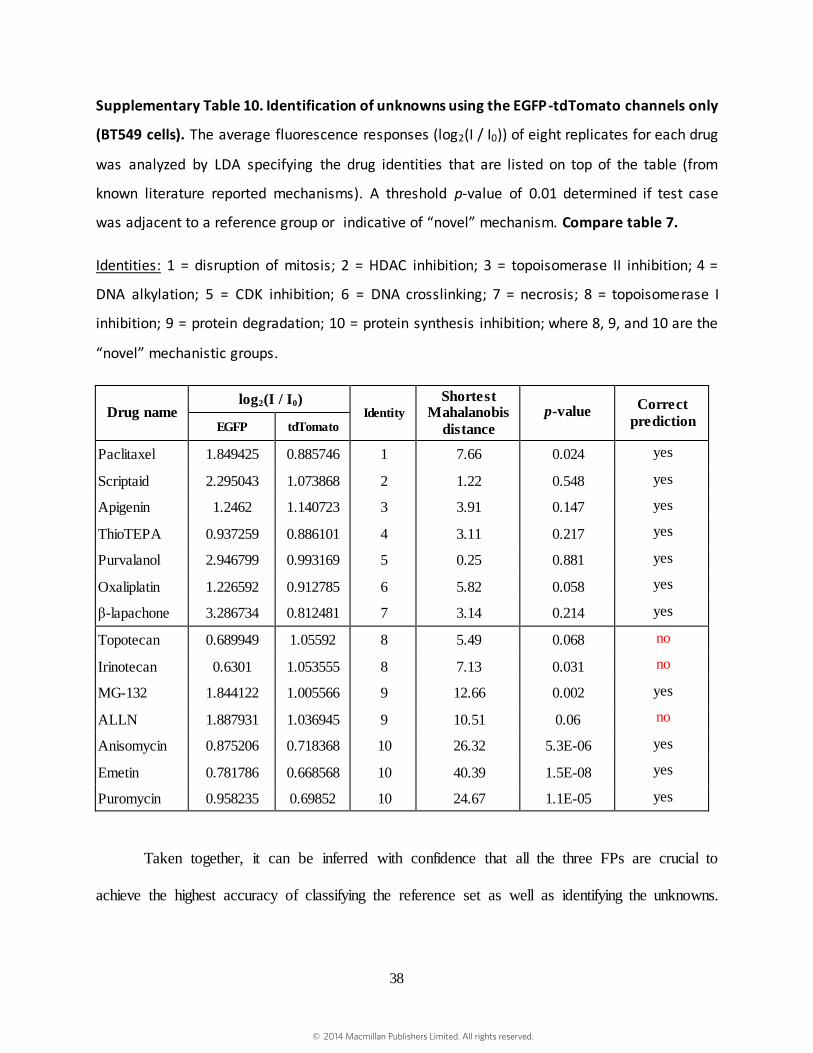
Supplementary Table 10. Identification of unknowns using the EGFP-tdTomato channels only
(BT549 cells). The average fluorescence responses (log2(I / I0)) of eight replicates for each drug
was analyzed by LDA specifying the drug identities that are listed on top of the table (from
known literature reported mechanisms). A threshold p-value of 0.01 determined if test case
was adjacent to a reference group or indicative of “novel” mechanism. Compare table 7.
Identities: 1 = disruption of mitosis; 2 = HDAC inhibition; 3 = topoisomerase II inhibition; 4 =
DNA alkylation; 5 = CDK inhibition; 6 = DNA crosslinking; 7 = necrosis; 8 = topoisomerase I
inhibition; 9 = protein degradation; 10 = protein synthesis inhibition; where 8, 9, and 10 are the
“novel” mechanistic groups.
Drug name log2(I / I0)
Identity
Shortest Mahalanobis
distance
p-value Correct
prediction EGFP tdTomato
Paclitaxel 1.849425 0.885746 1 7.66 0.024 yes
Scriptaid 2.295043 1.073868 2 1.22 0.548 yes
Apigenin 1.2462 1.140723 3 3.91 0.147 yes
ThioTEPA 0.937259 0.886101 4 3.11 0.217 yes
Purvalanol 2.946799 0.993169 5 0.25 0.881 yes
Oxaliplatin 1.226592 0.912785 6 5.82 0.058 yes
β-lapachone 3.286734 0.812481 7 3.14 0.214 yes
Topotecan 0.689949 1.05592 8 5.49 0.068 no
Irinotecan 0.6301 1.053555 8 7.13 0.031 no
MG-132 1.844122 1.005566 9 12.66 0.002 yes
ALLN 1.887931 1.036945 9 10.51 0.06 no
Anisomycin 0.875206 0.718368 10 26.32 5.3E-06 yes
Emetin 0.781786 0.668568 10 40.39 1.5E-08 yes
Puromycin 0.958235 0.69852 10 24.67 1.1E-05 yes
Taken together, it can be inferred with confidence that all the three FPs are crucial to
achieve the highest accuracy of classifying the reference set as well as identifying the unknowns.
© 2014 Macmillan Publishers Limited. All rights reserved.
39
In fact, tdTomato with seemingly less variant fluorescence responses provides great contribution
towards the classification ability of the triple-channel sensor.
Section 7: Supplementary Data
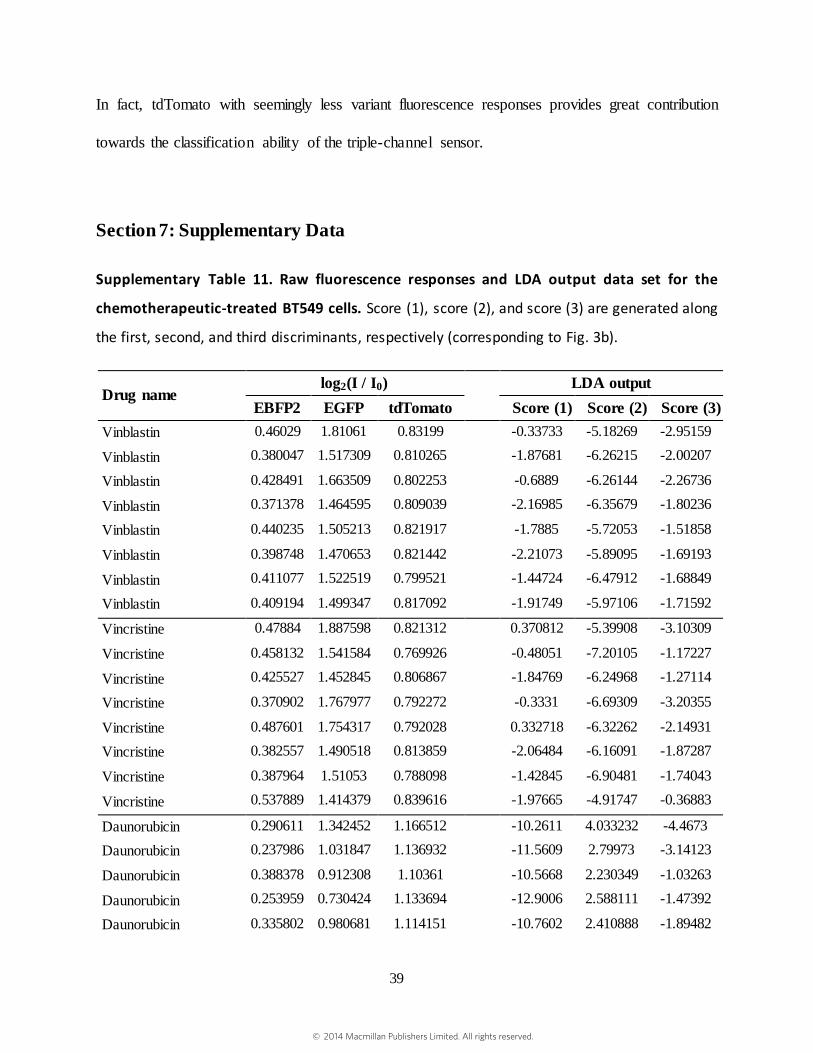
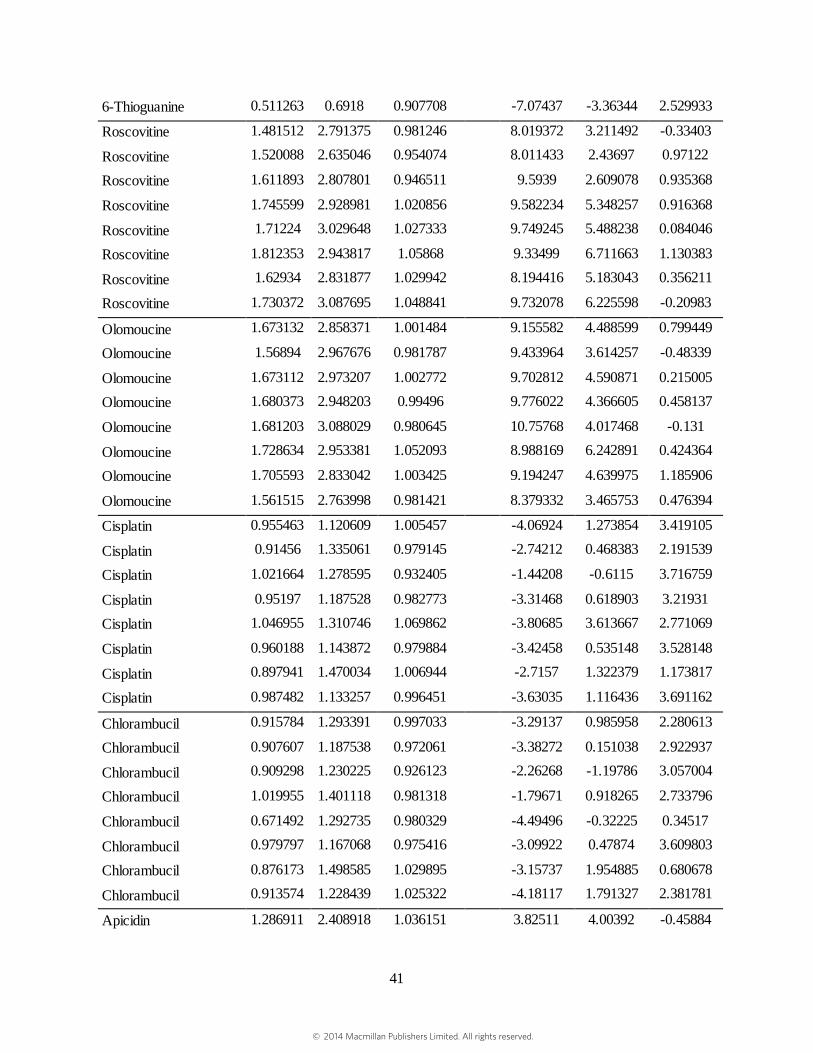
Supplementary Table 11. Raw fluorescence responses and LDA output data set for the
chemotherapeutic-treated BT549 cells. Score (1), score (2), and score (3) are generated along
the first, second, and third discriminants, respectively (corresponding to Fig. 3b).
Drug name log2(I / I0) LDA output
EBFP2 EGFP tdTomato Score (1) Score (2) Score (3)
Vinblastin 0.46029 1.81061 0.83199 -0.33733 -5.18269 -2.95159
Vinblastin 0.380047 1.517309 0.810265 -1.87681 -6.26215 -2.00207
Vinblastin 0.428491 1.663509 0.802253 -0.6889 -6.26144 -2.26736
Vinblastin 0.371378 1.464595 0.809039 -2.16985 -6.35679 -1.80236
Vinblastin 0.440235 1.505213 0.821917 -1.7885 -5.72053 -1.51858
Vinblastin 0.398748 1.470653 0.821442 -2.21073 -5.89095 -1.69193
Vinblastin 0.411077 1.522519 0.799521 -1.44724 -6.47912 -1.68849
Vinblastin 0.409194 1.499347 0.817092 -1.91749 -5.97106 -1.71592
Vincristine 0.47884 1.887598 0.821312 0.370812 -5.39908 -3.10309
Vincristine 0.458132 1.541584 0.769926 -0.48051 -7.20105 -1.17227
Vincristine 0.425527 1.452845 0.806867 -1.84769 -6.24968 -1.27114
Vincristine 0.370902 1.767977 0.792272 -0.3331 -6.69309 -3.20355
Vincristine 0.487601 1.754317 0.792028 0.332718 -6.32262 -2.14931
Vincristine 0.382557 1.490518 0.813859 -2.06484 -6.16091 -1.87287
Vincristine 0.387964 1.51053 0.788098 -1.42845 -6.90481 -1.74043
Vincristine 0.537889 1.414379 0.839616 -1.97665 -4.91747 -0.36883
Daunorubicin 0.290611 1.342452 1.166512 -10.2611 4.033232 -4.4673
Daunorubicin 0.237986 1.031847 1.136932 -11.5609 2.79973 -3.14123
Daunorubicin 0.388378 0.912308 1.10361 -10.5668 2.230349 -1.03263
Daunorubicin 0.253959 0.730424 1.133694 -12.9006 2.588111 -1.47392
Daunorubicin 0.335802 0.980681 1.114151 -10.7602 2.410888 -1.89482
© 2014 Macmillan Publishers Limited. All rights reserved.
40
Daunorubicin 0.381056 0.774999 1.159992 -12.3976 3.821506 -0.81627
Daunorubicin 0.298169 1.005882 1.157684 -11.7194 3.606631 -2.65441
Daunorubicin 0.359246 1.02196 1.182147 -11.7352 4.551149 -2.39747
Etoposide 0.263882 1.092634 1.126215 -10.8869 2.597442 -3.14939
Etoposide 0.266421 0.582569 1.071296 -12.3419 0.675232 -0.17555
Etoposide 0.241704 0.78753 1.083549 -11.7137 1.074914 -1.4991
Etoposide 0.275676 0.741085 1.116499 -12.3761 2.14986 -1.21932
Etoposide 0.25879 0.897028 1.081166 -11.0145 1.120591 -1.88593
Etoposide 0.300674 1.053831 1.095843 -10.2576 1.786211 -2.42435
Etoposide 0.35388 0.90617 1.144354 -11.6082 3.335384 -1.58862
Etoposide 0.369534 0.900618 1.183357 -12.2994 4.55412 -1.712
Doxorubicin 0.301946 1.167641 1.110823 -9.97471 2.30297 -3.09219
Doxorubicin 0.252626 0.797817 1.061572 -11.1652 0.457361 -1.29893
Doxorubicin 0.222929 0.806211 1.074457 -11.5604 0.75054 -1.68494
Doxorubicin 0.341384 0.867091 1.056599 -10.1682 0.639718 -0.86121
Doxorubicin 0.244624 1.332412 1.109955 -9.49449 2.179048 -4.3942
Doxorubicin 0.240686 1.327656 1.094736 -9.24574 1.706824 -4.2931
Doxorubicin 0.329514 0.987095 1.063413 -9.77711 0.871492 -1.61158
Doxorubicin 0.256307 1.054607 1.089364 -10.4045 1.445764 -2.75533
Temozolomide 0.24285 0.553495 0.863899 -8.58582 -5.6408 1.27703
Temozolomide 0.453463 0.451371 0.913575 -8.74864 -3.51167 3.203663
Temozolomide 0.644015 0.70445 0.890903 -5.85385 -3.42219 3.708041
Temozolomide 0.491118 0.880961 0.867413 -5.4707 -4.5339 1.70556
Temozolomide 0.56293 0.716296 0.890127 -6.28627 -3.70666 2.970621
Temozolomide 0.524007 0.818792 0.892328 -6.06144 -3.71232 2.113265
Temozolomide 0.520839 0.79449 0.907881 -6.50598 -3.26965 2.0953
Temozolomide 0.874005 0.743587 0.932008 -5.02408 -1.40781 5.153067
6-Thioguanine 0.753964 0.630333 0.884803 -5.4173 -3.28323 5.050558
6-Thioguanine 0.534404 0.599958 0.88291 -6.9036 -4.08193 3.364929
6-Thioguanine 0.490049 0.670069 0.865123 -6.48403 -4.72313 2.769025
6-Thioguanine 0.542452 0.765211 0.847565 -5.33957 -5.02405 2.862058
6-Thioguanine 0.646323 0.66954 0.906376 -6.31548 -2.96973 3.789952
6-Thioguanine 0.693022 0.757648 0.912566 -5.70529 -2.58093 3.697676
6-Thioguanine 0.47827 0.585993 0.919337 -8.035 -3.18219 2.697015
© 2014 Macmillan Publishers Limited. All rights reserved.
41
6-Thioguanine 0.511263 0.6918 0.907708 -7.07437 -3.36344 2.529933
Roscovitine 1.481512 2.791375 0.981246 8.019372 3.211492 -0.33403
Roscovitine 1.520088 2.635046 0.954074 8.011433 2.43697 0.97122
Roscovitine 1.611893 2.807801 0.946511 9.5939 2.609078 0.935368
Roscovitine 1.745599 2.928981 1.020856 9.582234 5.348257 0.916368
Roscovitine 1.71224 3.029648 1.027333 9.749245 5.488238 0.084046
Roscovitine 1.812353 2.943817 1.05868 9.33499 6.711663 1.130383
Roscovitine 1.62934 2.831877 1.029942 8.194416 5.183043 0.356211
Roscovitine 1.730372 3.087695 1.048841 9.732078 6.225598 -0.20983
Olomoucine 1.673132 2.858371 1.001484 9.155582 4.488599 0.799449
Olomoucine 1.56894 2.967676 0.981787 9.433964 3.614257 -0.48339
Olomoucine 1.673112 2.973207 1.002772 9.702812 4.590871 0.215005
Olomoucine 1.680373 2.948203 0.99496 9.776022 4.366605 0.458137
Olomoucine 1.681203 3.088029 0.980645 10.75768 4.017468 -0.131
Olomoucine 1.728634 2.953381 1.052093 8.988169 6.242891 0.424364
Olomoucine 1.705593 2.833042 1.003425 9.194247 4.639975 1.185906
Olomoucine 1.561515 2.763998 0.981421 8.379332 3.465753 0.476394
Cisplatin 0.955463 1.120609 1.005457 -4.06924 1.273854 3.419105
Cisplatin 0.91456 1.335061 0.979145 -2.74212 0.468383 2.191539
Cisplatin 1.021664 1.278595 0.932405 -1.44208 -0.6115 3.716759
Cisplatin 0.95197 1.187528 0.982773 -3.31468 0.618903 3.21931
Cisplatin 1.046955 1.310746 1.069862 -3.80685 3.613667 2.771069
Cisplatin 0.960188 1.143872 0.979884 -3.42458 0.535148 3.528148
Cisplatin 0.897941 1.470034 1.006944 -2.7157 1.322379 1.173817
Cisplatin 0.987482 1.133257 0.996451 -3.63035 1.116436 3.691162
Chlorambucil 0.915784 1.293391 0.997033 -3.29137 0.985958 2.280613
Chlorambucil 0.907607 1.187538 0.972061 -3.38272 0.151038 2.922937
Chlorambucil 0.909298 1.230225 0.926123 -2.26268 -1.19786 3.057004
Chlorambucil 1.019955 1.401118 0.981318 -1.79671 0.918265 2.733796
Chlorambucil 0.671492 1.292735 0.980329 -4.49496 -0.32225 0.34517
Chlorambucil 0.979797 1.167068 0.975416 -3.09922 0.47874 3.609803
Chlorambucil 0.876173 1.498585 1.029895 -3.15737 1.954885 0.680678
Chlorambucil 0.913574 1.228439 1.025322 -4.18117 1.791327 2.381781
Apicidin 1.286911 2.408918 1.036151 3.82511 4.00392 -0.45884
© 2014 Macmillan Publishers Limited. All rights reserved.

42
Apicidin 1.358421 2.202612 1.031102 3.341972 3.974146 1.213719
Apicidin 1.419501 2.515991 1.015953 5.581591 3.895202 0.269808
Apicidin 1.420256 2.401426 1.066837 4.021933 5.360708 0.480312
Apicidin 1.377233 2.381202 0.994637 5.061612 3.041342 0.742974
Apicidin 1.399874 2.363998 1.045443 4.1256 4.630792 0.65116
Apicidin 1.314384 2.482715 1.067468 3.75337 5.075125 -0.82401
Apicidin 1.267388 2.210915 1.074821 1.961208 4.989752 0.087086
Vorinostat 1.335615 2.429201 1.062762 3.711098 4.974364 -0.34289
Vorinostat 1.165903 2.322986 1.039631 2.57271 3.661068 -1.07429
Vorinostat 1.27831 2.2844 1.044964 2.978595 4.170837 0.028058
Vorinostat 1.206381 2.338187 1.023428 3.217675 3.317066 -0.69142
Vorinostat 1.312167 2.271006 1.02524 3.508365 3.683462 0.52382
Vorinostat 1.315973 2.343126 1.066188 3.092412 4.964513 -0.10245
Vorinostat 1.311374 2.407644 1.068408 3.341969 5.051724 -0.48038
Vorinostat 1.313587 2.456546 1.061648 3.731532 4.88337 -0.65747
Hydrogen peroxide 1.620219 3.488785 0.697291 18.14489 -1.76265 -1.9612
Hydrogen peroxide 1.312069 3.411004 0.725453 16.34856 0.109502 -0.86531
Hydrogen peroxide 1.481707 3.251791 0.73834 17.7015 -0.34352 -0.58014
Hydrogen peroxide 1.504301 3.201843 0.741305 19.2286 -1.09804 0.536763
Hydrogen peroxide 1.397866 3.154278 0.721031 18.03658 -0.5116 0.54902
Hydrogen peroxide 1.473657 3.131516 0.705418 15.1054 -2.36669 -0.11895
Hydrogen peroxide 1.441867 2.773747 0.747939 16.42744 -2.08836 -1.11461
Hydrogen peroxide 1.45703 2.873859 0.730249 12.09778 -1.94325 0.037757
Sodium nitroprusside 1.340388 3.327158 0.705639 15.18832 -5.22575 -2.2055
Sodium nitroprusside 1.307178 3.288366 0.792712 13.0878 -2.74466 -2.92352
Sodium nitroprusside 1.576952 3.29071 0.794769 14.74492 -1.79079 -0.6753
Sodium nitroprusside 1.461543 3.362476 0.80259 14.22895 -1.89746 -2.06458
Sodium nitroprusside 1.344505 3.316989 0.814749 13.03358 -1.94438 -2.91206
Sodium nitroprusside 1.841151 3.295679 0.754473 17.20701 -2.12453 1.820263
Sodium nitroprusside 1.549163 3.356486 0.831951 14.17343 -0.73058 -1.50891
Sodium nitroprusside 1.657052 3.372415 0.785417 15.83527 -1.76155 -0.34101
© 2014 Macmillan Publishers Limited. All rights reserved.
43
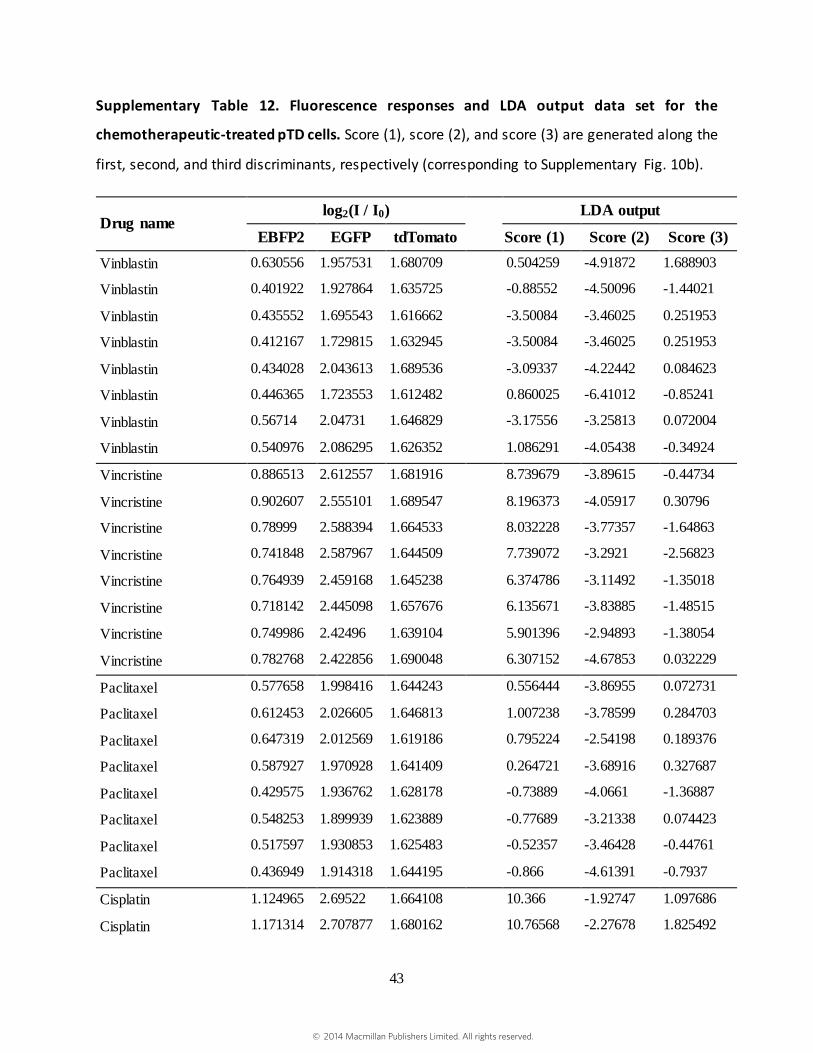
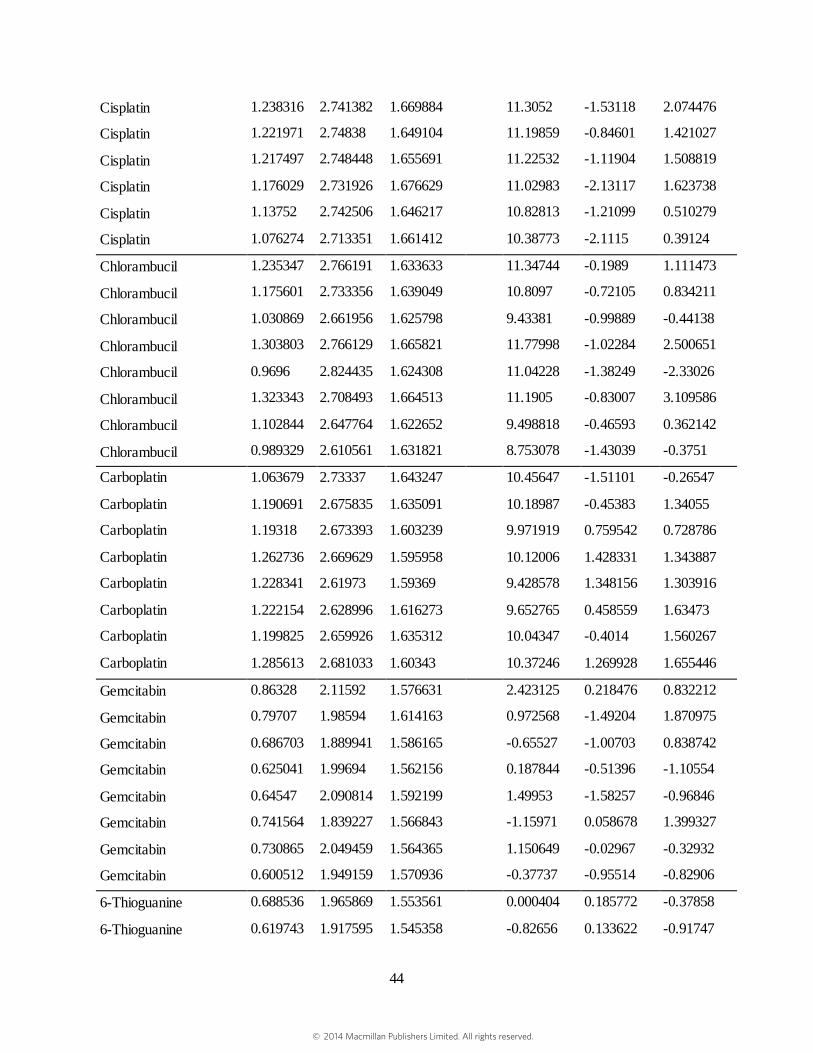
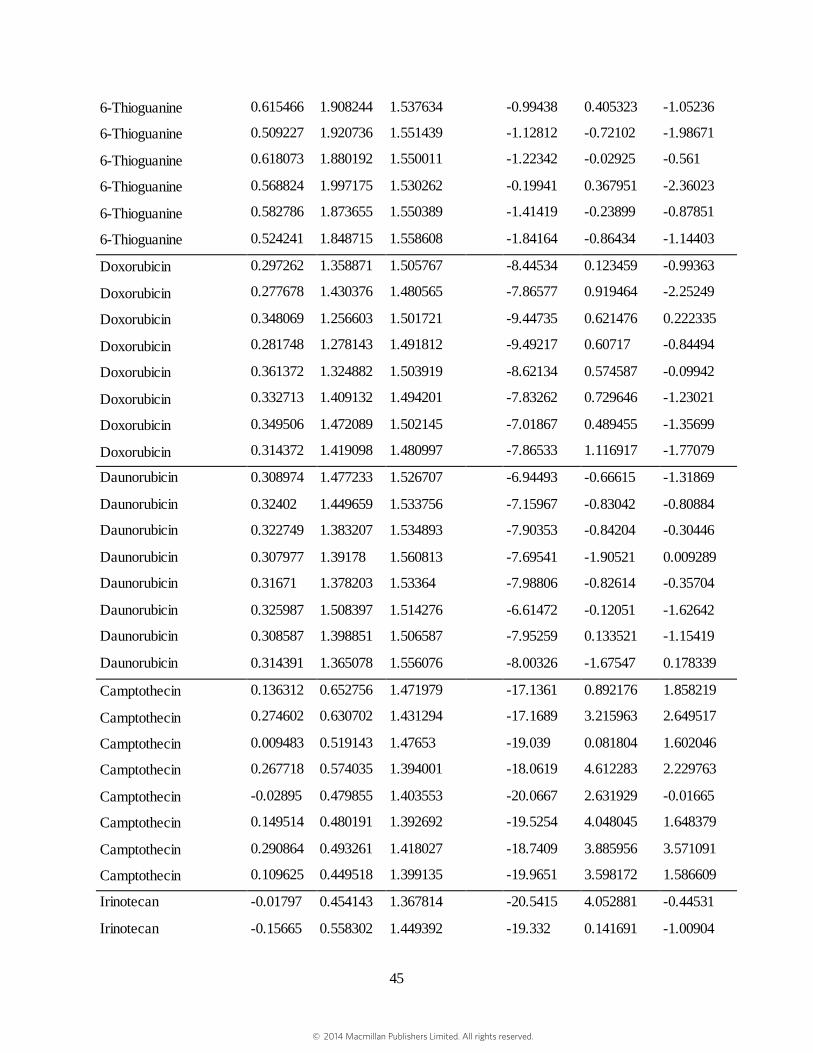
Supplementary Table 12. Fluorescence responses and LDA output data set for the
chemotherapeutic-treated pTD cells. Score (1), score (2), and score (3) are generated along the
first, second, and third discriminants, respectively (corresponding to Supplementary Fig. 10b).
Drug name log2(I / I0) LDA output
EBFP2 EGFP tdTomato Score (1) Score (2) Score (3)
Vinblastin 0.630556 1.957531 1.680709 0.504259 -4.91872 1.688903
Vinblastin 0.401922 1.927864 1.635725 -0.88552 -4.50096 -1.44021
Vinblastin 0.435552 1.695543 1.616662 -3.50084 -3.46025 0.251953
Vinblastin 0.412167 1.729815 1.632945 -3.50084 -3.46025 0.251953
Vinblastin 0.434028 2.043613 1.689536 -3.09337 -4.22442 0.084623
Vinblastin 0.446365 1.723553 1.612482 0.860025 -6.41012 -0.85241
Vinblastin 0.56714 2.04731 1.646829 -3.17556 -3.25813 0.072004
Vinblastin 0.540976 2.086295 1.626352 1.086291 -4.05438 -0.34924
Vincristine 0.886513 2.612557 1.681916 8.739679 -3.89615 -0.44734
Vincristine 0.902607 2.555101 1.689547 8.196373 -4.05917 0.30796
Vincristine 0.78999 2.588394 1.664533 8.032228 -3.77357 -1.64863
Vincristine 0.741848 2.587967 1.644509 7.739072 -3.2921 -2.56823
Vincristine 0.764939 2.459168 1.645238 6.374786 -3.11492 -1.35018
Vincristine 0.718142 2.445098 1.657676 6.135671 -3.83885 -1.48515
Vincristine 0.749986 2.42496 1.639104 5.901396 -2.94893 -1.38054
Vincristine 0.782768 2.422856 1.690048 6.307152 -4.67853 0.032229
Paclitaxel 0.577658 1.998416 1.644243 0.556444 -3.86955 0.072731
Paclitaxel 0.612453 2.026605 1.646813 1.007238 -3.78599 0.284703
Paclitaxel 0.647319 2.012569 1.619186 0.795224 -2.54198 0.189376
Paclitaxel 0.587927 1.970928 1.641409 0.264721 -3.68916 0.327687
Paclitaxel 0.429575 1.936762 1.628178 -0.73889 -4.0661 -1.36887
Paclitaxel 0.548253 1.899939 1.623889 -0.77689 -3.21338 0.074423
Paclitaxel 0.517597 1.930853 1.625483 -0.52357 -3.46428 -0.44761
Paclitaxel 0.436949 1.914318 1.644195 -0.866 -4.61391 -0.7937
Cisplatin 1.124965 2.69522 1.664108 10.366 -1.92747 1.097686
Cisplatin 1.171314 2.707877 1.680162 10.76568 -2.27678 1.825492
© 2014 Macmillan Publishers Limited. All rights reserved.
44
Cisplatin 1.238316 2.741382 1.669884 11.3052 -1.53118 2.074476
Cisplatin 1.221971 2.74838 1.649104 11.19859 -0.84601 1.421027
Cisplatin 1.217497 2.748448 1.655691 11.22532 -1.11904 1.508819
Cisplatin 1.176029 2.731926 1.676629 11.02983 -2.13117 1.623738
Cisplatin 1.13752 2.742506 1.646217 10.82813 -1.21099 0.510279
Cisplatin 1.076274 2.713351 1.661412 10.38773 -2.1115 0.39124
Chlorambucil 1.235347 2.766191 1.633633 11.34744 -0.1989 1.111473
Chlorambucil 1.175601 2.733356 1.639049 10.8097 -0.72105 0.834211
Chlorambucil 1.030869 2.661956 1.625798 9.43381 -0.99889 -0.44138
Chlorambucil 1.303803 2.766129 1.665821 11.77998 -1.02284 2.500651
Chlorambucil 0.9696 2.824435 1.624308 11.04228 -1.38249 -2.33026
Chlorambucil 1.323343 2.708493 1.664513 11.1905 -0.83007 3.109586
Chlorambucil 1.102844 2.647764 1.622652 9.498818 -0.46593 0.362142
Chlorambucil 0.989329 2.610561 1.631821 8.753078 -1.43039 -0.3751
Carboplatin 1.063679 2.73337 1.643247 10.45647 -1.51101 -0.26547
Carboplatin 1.190691 2.675835 1.635091 10.18987 -0.45383 1.34055
Carboplatin 1.19318 2.673393 1.603239 9.971919 0.759542 0.728786
Carboplatin 1.262736 2.669629 1.595958 10.12006 1.428331 1.343887
Carboplatin 1.228341 2.61973 1.59369 9.428578 1.348156 1.303916
Carboplatin 1.222154 2.628996 1.616273 9.652765 0.458559 1.63473
Carboplatin 1.199825 2.659926 1.635312 10.04347 -0.4014 1.560267
Carboplatin 1.285613 2.681033 1.60343 10.37246 1.269928 1.655446
Gemcitabin 0.86328 2.11592 1.576631 2.423125 0.218476 0.832212
Gemcitabin 0.79707 1.98594 1.614163 0.972568 -1.49204 1.870975
Gemcitabin 0.686703 1.889941 1.586165 -0.65527 -1.00703 0.838742
Gemcitabin 0.625041 1.99694 1.562156 0.187844 -0.51396 -1.10554
Gemcitabin 0.64547 2.090814 1.592199 1.49953 -1.58257 -0.96846
Gemcitabin 0.741564 1.839227 1.566843 -1.15971 0.058678 1.399327
Gemcitabin 0.730865 2.049459 1.564365 1.150649 -0.02967 -0.32932
Gemcitabin 0.600512 1.949159 1.570936 -0.37737 -0.95514 -0.82906
6-Thioguanine 0.688536 1.965869 1.553561 0.000404 0.185772 -0.37858
6-Thioguanine 0.619743 1.917595 1.545358 -0.82656 0.133622 -0.91747
© 2014 Macmillan Publishers Limited. All rights reserved.
45
6-Thioguanine 0.615466 1.908244 1.537634 -0.99438 0.405323 -1.05236
6-Thioguanine 0.509227 1.920736 1.551439 -1.12812 -0.72102 -1.98671
6-Thioguanine 0.618073 1.880192 1.550011 -1.22342 -0.02925 -0.561
6-Thioguanine 0.568824 1.997175 1.530262 -0.19941 0.367951 -2.36023
6-Thioguanine 0.582786 1.873655 1.550389 -1.41419 -0.23899 -0.87851
6-Thioguanine 0.524241 1.848715 1.558608 -1.84164 -0.86434 -1.14403
Doxorubicin 0.297262 1.358871 1.505767 -8.44534 0.123459 -0.99363
Doxorubicin 0.277678 1.430376 1.480565 -7.86577 0.919464 -2.25249
Doxorubicin 0.348069 1.256603 1.501721 -9.44735 0.621476 0.222335
Doxorubicin 0.281748 1.278143 1.491812 -9.49217 0.60717 -0.84494
Doxorubicin 0.361372 1.324882 1.503919 -8.62134 0.574587 -0.09942
Doxorubicin 0.332713 1.409132 1.494201 -7.83262 0.729646 -1.23021
Doxorubicin 0.349506 1.472089 1.502145 -7.01867 0.489455 -1.35699
Doxorubicin 0.314372 1.419098 1.480997 -7.86533 1.116917 -1.77079
Daunorubicin 0.308974 1.477233 1.526707 -6.94493 -0.66615 -1.31869
Daunorubicin 0.32402 1.449659 1.533756 -7.15967 -0.83042 -0.80884
Daunorubicin 0.322749 1.383207 1.534893 -7.90353 -0.84204 -0.30446
Daunorubicin 0.307977 1.39178 1.560813 -7.69541 -1.90521 0.009289
Daunorubicin 0.31671 1.378203 1.53364 -7.98806 -0.82614 -0.35704
Daunorubicin 0.325987 1.508397 1.514276 -6.61472 -0.12051 -1.62642
Daunorubicin 0.308587 1.398851 1.506587 -7.95259 0.133521 -1.15419
Daunorubicin 0.314391 1.365078 1.556076 -8.00326 -1.67547 0.178339
Camptothecin 0.136312 0.652756 1.471979 -17.1361 0.892176 1.858219
Camptothecin 0.274602 0.630702 1.431294 -17.1689 3.215963 2.649517
Camptothecin 0.009483 0.519143 1.47653 -19.039 0.081804 1.602046
Camptothecin 0.267718 0.574035 1.394001 -18.0619 4.612283 2.229763
Camptothecin -0.02895 0.479855 1.403553 -20.0667 2.631929 -0.01665
Camptothecin 0.149514 0.480191 1.392692 -19.5254 4.048045 1.648379
Camptothecin 0.290864 0.493261 1.418027 -18.7409 3.885956 3.571091
Camptothecin 0.109625 0.449518 1.399135 -19.9651 3.598172 1.586609
Irinotecan -0.01797 0.454143 1.367814 -20.5415 4.052881 -0.44531
Irinotecan -0.15665 0.558302 1.449392 -19.332 0.141691 -1.00904
© 2014 Macmillan Publishers Limited. All rights reserved.

46
Irinotecan -0.06199 0.44893 1.392628 -20.5944 2.874087 -0.36174
Irinotecan -0.13783 0.460991 1.431576 -20.4729 0.974091 -0.45265
Irinotecan -0.08313 0.560204 1.42537 -19.2114 1.459164 -0.73912
Irinotecan -0.01824 0.295653 1.521986 -21.3602 -1.65551 3.907726
Irinotecan -0.3494 0.431042 1.510202 -21.0358 -3.16044 -0.85185
Irinotecan -0.29223 0.334469 1.459628 -22.2429 -0.87995 -0.56956
Sodium nitroprusside 1.439304 2.661759 1.538715 10.27296 4.582811 2.094137
Sodium nitroprusside 1.425193 2.617447 1.508984 9.541505 5.646792 1.661684
Sodium nitroprusside 1.342859 2.67758 1.55496 10.22507 3.418096 1.289067
Sodium nitroprusside 1.317269 2.588025 1.533766 8.99966 4.122276 1.247499
Sodium nitroprusside 1.256974 2.61168 1.556089 9.200386 2.928583 0.892496
Sodium nitroprusside 1.333782 2.664011 1.511392 9.769687 5.013199 0.396116
Sodium nitroprusside 1.287174 2.679908 1.511017 9.787883 4.754916 -0.2238
Sodium nitroprusside 1.308869 2.64991 1.517661 9.56591 4.644858 0.366204
Hydrogen peroxide 1.280304 2.67307 1.460555 9.372544 6.617892 -1.28552
Hydrogen peroxide 1.161565 2.59995 1.444539 8.048212 6.591827 -2.32981
Hydrogen peroxide 1.247158 2.605825 1.433333 8.334537 7.493246 -1.69737
Hydrogen peroxide 1.202649 2.65799 1.430024 8.749024 7.336279 -2.62536
Hydrogen peroxide 1.406545 2.604326 1.426408 8.815034 8.654625 -0.13979
Hydrogen peroxide 1.313312 2.624207 1.428027 8.732311 8.055769 -1.24238
Hydrogen peroxide 1.194607 2.690205 1.424677 9.050307 7.473393 -3.06044
Hydrogen peroxide 1.271207 2.612001 1.43927 8.522581 7.402212 -1.36613
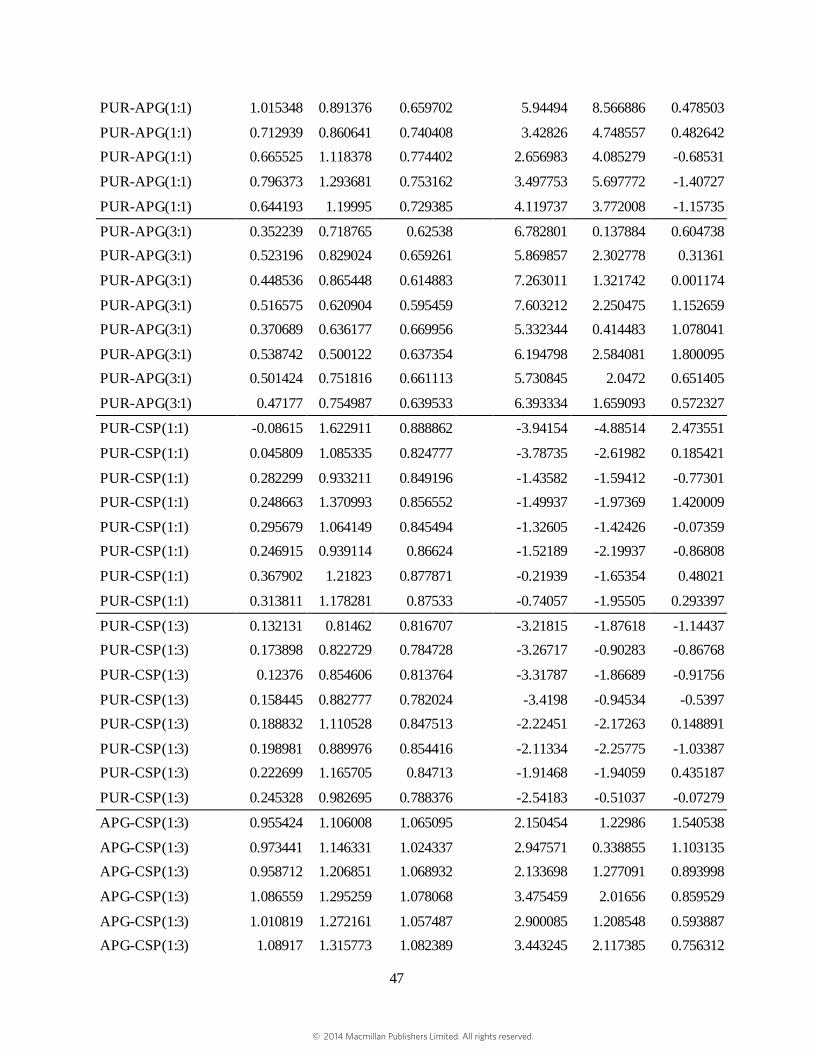
Supplementary Table 13. Fluorescence response data from drug candidates and their
combinations using BT549 cells. Score (1), score (2), and score (3) are generated along the first,
second, and third discriminants, respectively (corresponding to Fig. 4b,c,d).
Drug name log2(I / I0) LDA output
EBFP2 EGFP tdTomato Score (1) Score (2) Score (3)
PUR-APG(1:1) 0.729879 0.973113 0.675937 5.520782 4.907233 -0.12995
PUR-APG(1:1) 0.812728 1.22745 0.674566 5.83439 5.893113 -1.22432
PUR-APG(1:1) 0.591799 0.892395 0.703146 4.596559 3.178478 0.161429
© 2014 Macmillan Publishers Limited. All rights reserved.
47
PUR-APG(1:1) 1.015348 0.891376 0.659702 5.94494 8.566886 0.478503
PUR-APG(1:1) 0.712939 0.860641 0.740408 3.42826 4.748557 0.482642
PUR-APG(1:1) 0.665525 1.118378 0.774402 2.656983 4.085279 -0.68531
PUR-APG(1:1) 0.796373 1.293681 0.753162 3.497753 5.697772 -1.40727
PUR-APG(1:1) 0.644193 1.19995 0.729385 4.119737 3.772008 -1.15735
PUR-APG(3:1) 0.352239 0.718765 0.62538 6.782801 0.137884 0.604738
PUR-APG(3:1) 0.523196 0.829024 0.659261 5.869857 2.302778 0.31361
PUR-APG(3:1) 0.448536 0.865448 0.614883 7.263011 1.321742 0.001174
PUR-APG(3:1) 0.516575 0.620904 0.595459 7.603212 2.250475 1.152659
PUR-APG(3:1) 0.370689 0.636177 0.669956 5.332344 0.414483 1.078041
PUR-APG(3:1) 0.538742 0.500122 0.637354 6.194798 2.584081 1.800095
PUR-APG(3:1) 0.501424 0.751816 0.661113 5.730845 2.0472 0.651405
PUR-APG(3:1) 0.47177 0.754987 0.639533 6.393334 1.659093 0.572327
PUR-CSP(1:1) -0.08615 1.622911 0.888862 -3.94154 -4.88514 2.473551
PUR-CSP(1:1) 0.045809 1.085335 0.824777 -3.78735 -2.61982 0.185421
PUR-CSP(1:1) 0.282299 0.933211 0.849196 -1.43582 -1.59412 -0.77301
PUR-CSP(1:1) 0.248663 1.370993 0.856552 -1.49937 -1.97369 1.420009
PUR-CSP(1:1) 0.295679 1.064149 0.845494 -1.32605 -1.42426 -0.07359
PUR-CSP(1:1) 0.246915 0.939114 0.86624 -1.52189 -2.19937 -0.86808
PUR-CSP(1:1) 0.367902 1.21823 0.877871 -0.21939 -1.65354 0.48021
PUR-CSP(1:1) 0.313811 1.178281 0.87533 -0.74057 -1.95505 0.293397
PUR-CSP(1:3) 0.132131 0.81462 0.816707 -3.21815 -1.87618 -1.14437
PUR-CSP(1:3) 0.173898 0.822729 0.784728 -3.26717 -0.90283 -0.86768
PUR-CSP(1:3) 0.12376 0.854606 0.813764 -3.31787 -1.86689 -0.91756
PUR-CSP(1:3) 0.158445 0.882777 0.782024 -3.4198 -0.94534 -0.5397
PUR-CSP(1:3) 0.188832 1.110528 0.847513 -2.22451 -2.17263 0.148891
PUR-CSP(1:3) 0.198981 0.889976 0.854416 -2.11334 -2.25775 -1.03387
PUR-CSP(1:3) 0.222699 1.165705 0.84713 -1.91468 -1.94059 0.435187
PUR-CSP(1:3) 0.245328 0.982695 0.788376 -2.54183 -0.51037 -0.07279
APG-CSP(1:3) 0.955424 1.106008 1.065095 2.150454 1.22986 1.540538
APG-CSP(1:3) 0.973441 1.146331 1.024337 2.947571 0.338855 1.103135
APG-CSP(1:3) 0.958712 1.206851 1.068932 2.133698 1.277091 0.893998
APG-CSP(1:3) 1.086559 1.295259 1.078068 3.475459 2.01656 0.859529
APG-CSP(1:3) 1.010819 1.272161 1.057487 2.900085 1.208548 0.593887
APG-CSP(1:3) 1.08917 1.315773 1.082389 3.443245 2.117385 0.756312
© 2014 Macmillan Publishers Limited. All rights reserved.
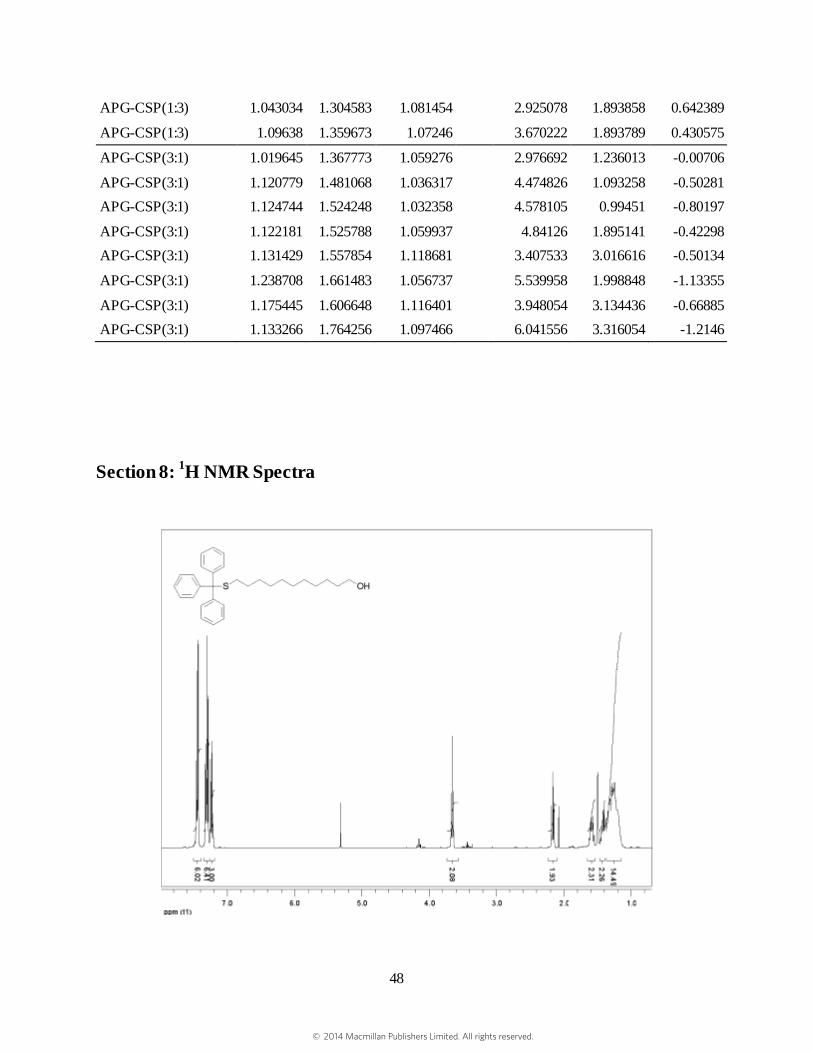
48
APG-CSP(1:3) 1.043034 1.304583 1.081454 2.925078 1.893858 0.642389
APG-CSP(1:3) 1.09638 1.359673 1.07246 3.670222 1.893789 0.430575
APG-CSP(3:1) 1.019645 1.367773 1.059276 2.976692 1.236013 -0.00706
APG-CSP(3:1) 1.120779 1.481068 1.036317 4.474826 1.093258 -0.50281
APG-CSP(3:1) 1.124744 1.524248 1.032358 4.578105 0.99451 -0.80197
APG-CSP(3:1) 1.122181 1.525788 1.059937 4.84126 1.895141 -0.42298
APG-CSP(3:1) 1.131429 1.557854 1.118681 3.407533 3.016616 -0.50134
APG-CSP(3:1) 1.238708 1.661483 1.056737 5.539958 1.998848 -1.13355
APG-CSP(3:1) 1.175445 1.606648 1.116401 3.948054 3.134436 -0.66885
APG-CSP(3:1) 1.133266 1.764256 1.097466 6.041556 3.316054 -1.2146
Section 8:
1H NMR Spectra
© 2014 Macmillan Publishers Limited. All rights reserved.
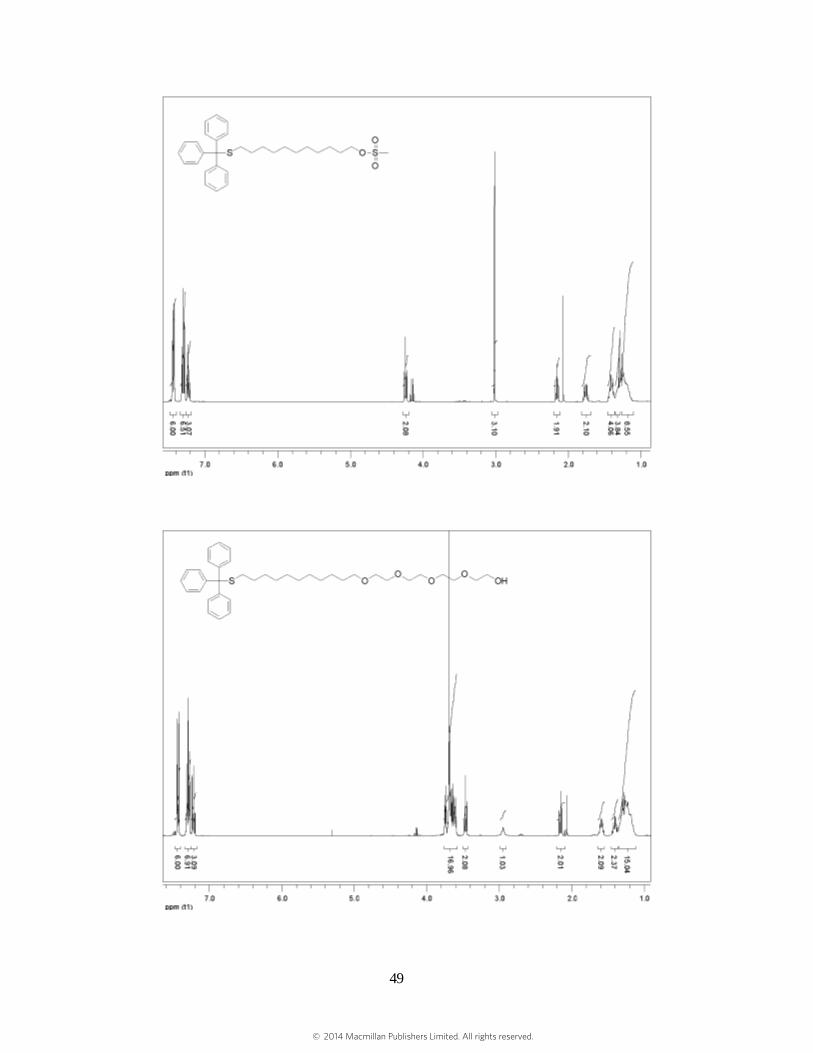
49
© 2014 Macmillan Publishers Limited. All rights reserved.
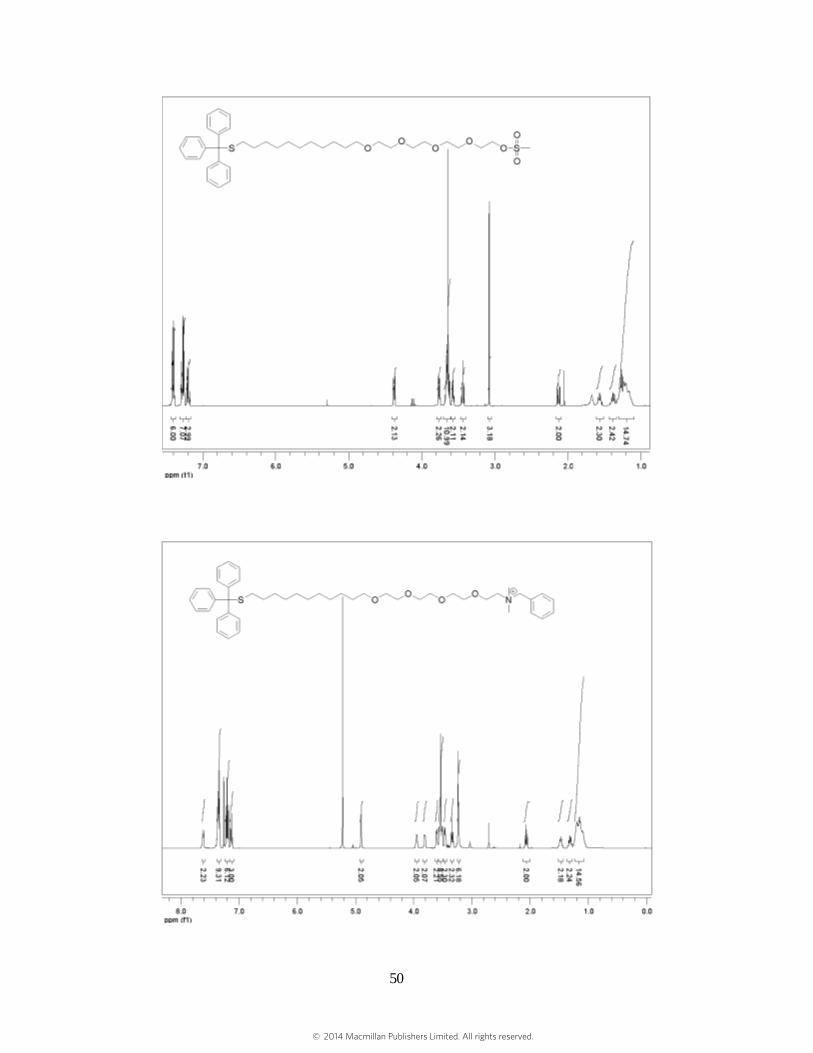
50
© 2014 Macmillan Publishers Limited. All rights reserved.

51
© 2014 Macmillan Publishers Limited. All rights reserved.
52
Supplementary References
1. Ai, H. W. et al., Exploration of new chromophore structures leads to the identification of
improved blue fluorescent proteins. Biochemistry 46, 5904-5910 (2007).
2. Carroll, P. et al, Sensitive detection of gene expression in mycobacteria under replicating
and non-replicating conditions using optimized far-red reporters. PLoS One. 5, e9823
(2010).
3. Nandwana, V. et al., Patterning of protein/quantum dot hybrid bionanostructures. J. Inorg.
Organomet. Polym. Mater. 23, 227-232 (2013).
4. De, M., Rana, S. & Rotello, V. M. Nickel‐ion‐mediated control of the stoichiometry of
His‐tagged protein/nanoparticle interactions. Macromol. Biosci. 9, 174-178 (2009).
5. Miranda, A. et al., Enzyme-amplified array sensing of proteins in solution and in biofluids.
J. Am. Chem. Soc. 132, 5285-5289 (2010).
6. Bajaj, A. et al., Detection and differentiation of normal, cancerous, and metastatic cells
using nanoparticle-polymer sensor arrays. Proc. Natl. Acad. Sci. U.S.A. 106, 10912-10916
(2009).
7. Kanaras, A. G., Kamounah, F. S., Schaumburg, K., Kiely, C. J. & Brust, M. Thioalkylated
tetraethylene glycol: a new ligand for water soluble monolayer protected gold clusters.
Chem. Commun. 2294-2295 (2002).
8. Brust, M., Walker, M., Bethell, D., Schiffrin, D. J. & Whyman, R. Synthesis of thiol-
derivatised gold nanoparticles in a two-phase liquid–liquid system. J. Chem. Soc. Chem.
Commun. 801-802 (1994).
9. Templeton, A. C., Wuelfing, M. P. & Murray, R. W. Monolayer-protected cluster
molecules. Acc. Chem. Res. 33, 27-36 (2000).
10. You, C. C., De, M., Han, G. & Rotello, V. M. Tunable Inhibition and Denaturation of
Alpha-Chymotrypsin with Amino Acid-Functionalized Gold Nanoparticles. J. Am. Chem.
Soc. 127, 12873-12881 (2005).
11. Phillips, R. L. et al., Gold Nanoparticle-PPE Constructs as Biomolecular Material Mimics:
Understanding the Electrostatic and Hydrophobic Interactions” Soft Matter 5, 607-612
(2009).
© 2014 Macmillan Publishers Limited. All rights reserved.
53
12. Dunphy, K. A. et al. Oncogenic transformation of mammary epithelial cells by transforming
growth factor beta independent of mammary stem cell regulation. Cancer Cell Int. 13, 74
(2013).
13. Nandakumar, D. N., Nagaraj, V. A., Vathsala, P. G., Rangarajan, P. & Padmanaban, G.
Curcumin-artemisinin combination therapy for malaria. Antimicrob. Agents Chemother. 50,
1859-1860 (2006).
14. Loewe, S. The problem of synergism and antagonism of combined drugs.
Arzneimittelforschung 3, 285-290 (1953).
15. Greco, W. R., Bravo, G. & Parsons, J. C. The search for synergy: a critical review from a
response surface perspective. Pharmacol. Rev. 47, 331-385 (1995).
16. R Development Core Team (2010). R: A language and environment for statistical
computing. R Foundation for Statistical Computing, Vienna, Austria. ISBN 3-900051-07-0,
URL http://www.R-project.org.
17. Venables, W. N. & Ripley, B. D. (2002). Modern Applied Statistics with S. Fourth Edition.
Springer, New York. ISBN 0-387-95457-0.
18. Hardin, J. & Rocke, D. M. The distribution of robust distances. J. Comput. Graph. Stat. 14,
928-946 (2005).
© 2014 Macmillan Publishers Limited. All rights reserved.


![visit or whatsapp at 8905629969 Carbon and Its … · 2020. 7. 27. · Ans : [CBSE 2017] (1) CH 2 =CH—CH 3 Propene (2) CH 2 =CH—CH 2 —CH 3 1-Butene NO NEED TO PURCHASE ANY BOOKS](https://img.pdfslide.us/doc/110x75/603a428e343a142355601733/visit-or-whatsapp-at-8905629969-carbon-and-its-2020-7-27-ans-cbse-2017.jpg)


![[ Ru (H)(H 2 )(PPh 2 CH 2 CH 2 PPh 2 ) 2 ] +](https://img.pdfslide.us/doc/110x75/5681503b550346895dbe37ad/-ru-hh-2-pph-2-ch-2-ch-2-pph-2-2-.jpg)