Embed Size (px)
Citation preview

A multi-site approach to risk assessment for the insurance industry
Linda Speight
Supervisors: Jim Hall, Chris Kilsby, Paul Kershaw
[email protected] HydroPredict, Prague 2010

Outline
• Introduction
• Methodology
– Modelling extreme events
– Flood defences
• Calculating Risk
• Conclusions

Catastrophe Models
Premium = AAL + Risk Load + Expense Load
AIR model output

Aims and Objectives
To develop a method for multi-site concurrent damages due to weather related extremes
FLOODsite 2007 Flood (BBC News)
Spatial dependencies
at multiple scales

Methodology
Statistical modelling of
extreme events
Statistical modelling of
flood defence failure
Process based
modelling of water level &
floodplain inundation
Multiple sites nested in national framework
Deterministic calculation of
damage

Sum damage across all sites
For each site
Damage per site conditional on event
For each event
Repeat until
P(breach sequence)
→ 0
Sample breach widths
Simulate crest height and defence
reliability
Sample breach
failure state
Sample sequence of defence failure.
Hydraulic modelling of water level and
flow through breach
Estimate peak flows and
hydrographs
Simulate extreme event across network
Hydraulic modelling for breach sequence
Calculate
damage
Floodplain inundation modelling Estimate probability of
breach sequences
Hydraulic modelling of water level assuming
no breaching

Modelling extreme events
• Aim – Spatial dependency
between events
– Large scale model for UK
– Good representation of extremes
• Method – Conditional dependence
model of Heffernan and Tawn (2004) applied by Keef et al (2009)
Y|X, x > ux
a = strength of dependences
b = changing dependence
Z = residuals
Y = a(x) + b(x)Z
Y = set of gauges
X = conditional gauge
x = daily mean flow
ux = threshold

Example application
· = observed
below threshold
o = observed
o = simulated
55026
55023
5500854022
54019
54002
54001
28046
28018

Sum damage across all sites
For each site
Damage per site conditional on event
For each event
Repeat until
P(breach sequence)
→ 0
Sample breach widths
Simulate crest height and defence
reliability
Sample breach
failure state
Sample sequence of defence failure.
Hydraulic modelling of water level and
flow through breach
Estimate peak flows and
hydrographs
Simulate extreme event across network
Hydraulic modelling for breach sequence
Calculate
damage
Floodplain inundation modelling Estimate probability of
breach sequences
Hydraulic modelling of water level assuming
no breaching

Estimating peak flows at site
Peak flow conversion methods
• Shape of hydrograph
• Catchment characteristics
0
5
10
15
20
25
30
35
40
0 2 4 6 8 10 12 14 16 18 20 22 24
Flo
w(m
3/s
)
Time (h)
Daily mean flow Hydrograph Flood Peak
Ungauged site transfer methods
• Analogue sites
• Weighted by distance and catchment characteristics

For each site
Damage per site conditional on event
For each event
Repeat until
P(breach sequence)
→ 0
Sample breach widths
Simulate crest height and defence
reliability
Sample breach
failure state
Sample sequence of defence failure.
Hydraulic modelling of water level and
flow through breach
Estimate peak flows and
hydrographs
Simulate extreme event across network
Hydraulic modelling for breach sequence
Calculate
damage
Floodplain inundation modelling Estimate probability of
breach sequences
Hydraulic modelling of water level assuming
no breaching

Flood defence system
Characterised by
• Design standard
• Construction type
Defence wall SOP = 100 years
Embankment SOP = 25 years
Embankment SOP = 5 years
d1 d2 d3
High ground
Floodplain
Novel aspects
• No restriction on length
• Consideration of upstream breaches

Sampling crest heights
Autocorrelation function for crest height =
f (defence type, age, condition, data quality)
6
6,1
6,2
6,3
6,4
6,5
6,6
6,7
6,8
6,9
7
0 10 20 30 40 50 60 70 80 90 100
Cre
st h
eig
ht
(m)
Chainage (m)
design crest level defence A - old embankment Defence B - sea wall
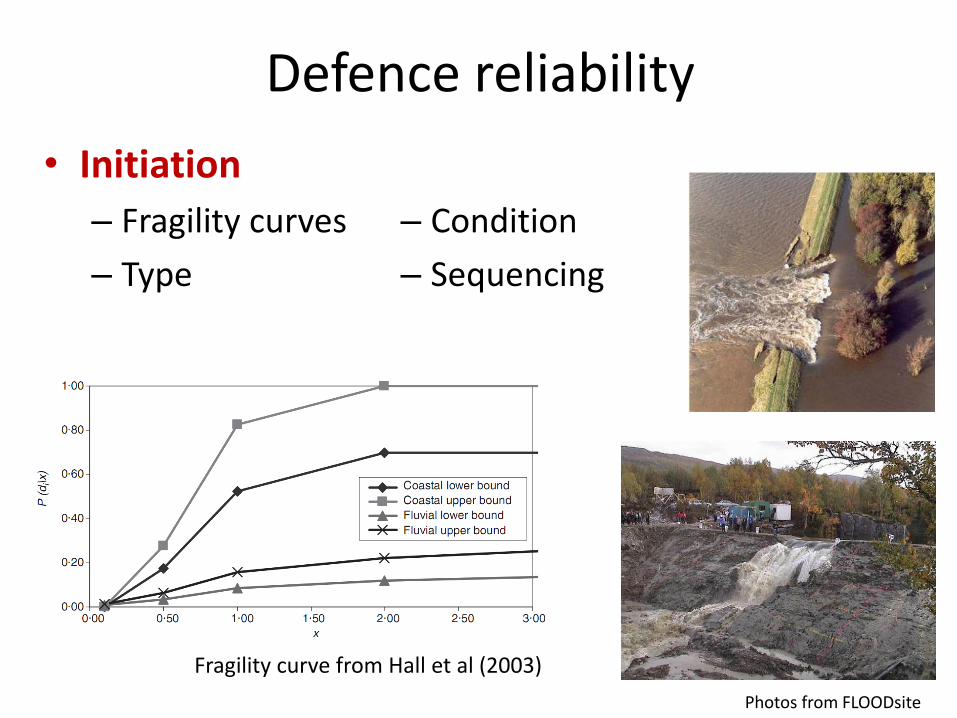
Defence reliability
• Initiation
– Fragility curves
– Type
Photos from FLOODsite
Fragility curve from Hall et al (2003)
– Condition
– Sequencing

Sampling breaches
0
0,1
0,2
0,3
0,4
0,5
0,6
0,7
0,8
0,9
1
6
6,1
6,2
6,3
6,4
6,5
6,6
6,7
6,8
6,9
7
0 20 40 60 80 100
P(f
ailu
re)
Elev
atio
n (
m)
Chainage (m)
P(varying failure) crest height water level breaches
Autocorrelation function for strength =
f (defence type, age, condition)

Breach widths
FLOODsite
• Growth Rate
– Materials
– Floodplain type
– Amount of water
– Sequencing
• Max width
Case study Observed
values
Assumed
values Source
Elbe 20m to 200m
Median 20m
Log normal
width mean of
64m
De Kok and
Grossmann
2010
Lower Rhine Width 100 –
400m
Apel et al
2004
Lower Rhine Width 50 -
150m
Kamrath et al
2006
UK RASP
method
Function of load
and defence
length
Hall et all
2003
Netherlands Largest 520m
wide and 36m
deep
Muir-Wood
and Bateman
2005
River Po Normal Width:
100m - 300m
Depth:
0.5m - 4m
Govi and
Turitto 2000

For each site
Damage per site conditional on event
For each event
Repeat until
P(breach sequence)
→ 0
Sample breach widths
Simulate crest height and defence
reliability
Sample breach
failure state
Sample sequence of defence failure.
Hydraulic modelling of water level and
flow through breach
Estimate peak flows and
hydrographs
Simulate extreme event across network
Hydraulic modelling for breach sequence
Calculate
damage
Floodplain inundation modelling Estimate probability of
breach sequences
Hydraulic modelling of water level assuming
no breaching

Damage
• Raster based floodplain inundation model depths
• Depth-damage curves
damage
-1
-0,75
-0,5
-0,25
0
0,25
0,5
0,75
1
1,25
1,5
1,75
2
2,25
2,5
2,75
3
0 50 100 150 200 250 300 350 400 450 500
Dep
th M
etr
es
Damage £/m2
Penning-Roswell et al (2006) BBC News

Risk
Risk = Probability x Consequence
P(Imax,i,j|Fi,j|OTi,j ,Bi,j , BWi,j|Lj,i,Ci,j,Ri,j |Qi,j | Xi )
Imax,i,j = maximum inundation depth across site j for event i

Risk
Risk = Probability x Consequence
P(OTi,j) = f(Ci,j, Li,j)
P(Bi,j) = f(Ci,j, Li,j , Ri,j , OTi,j)
P(BWi,j) = f(type, material, Li,j)
Fi,j = Flow over or through defence
P(Imax,i,j|Fi,j|OTi,j ,Bi,j , BWi,j|Lj,i,Ci,j,Ri,j |Qi,j | Xi )

Risk
Risk = Probability x Consequence
Xi = Large scale spatial event
P(Li) = f(upstream breaches, Qi,j)
Ci, Ri = f(type, age, condition) Qi,j = Inflow to hydraulic model
P(Imax,i,j|Fi,j|OTi,j ,Bi,j , BWi,j|Lj,i,Ci,j,Ri,j |Qi,j | Xi )

Conclusions
• Integrated system model
• Detail nested in national scale
• Consider risk load
– If modelling of flood defences is poor how much impact does this have?
– Which areas could flood at the same time / where are we over exposed?
• Future...
– Sensitivity testing
– Resilience measurers
Informed decision!

Thank you
Linda Speight
Civil Engineering & Geosciences
Newcastle University, UK

1. Extreme data at conditional gauge
2. Extreme dependence between gauges
Fit Generalised
Pareto
• Shape (β)
• Scale (ε)
• threshold
Modelling extreme events (2)
Solid lines: parametric
Dashed lines:
nonparametric (residuals)
Fit dependence model

References
Hall, J. W., R. Dawson, et al. (2003). A methodology for national-scale flood risk assessment. Proceedings of the Institution of Civil Engineers-Water and Maritime Engineering, 156: 235-247
Heffernan and Tawn (2004) A conditional approach to modelling multivariate extreme values. Journal of the Royal Statistical Society Series B, 66(3), 497-547
Keef, C., Lamb, R., et al. (2009a) Spatial coherence of flood risk – Methodology report. Science Report – SC060088/SR., Environment Agency
Keef, C., Svensson, C., et al. (2009b) Spatial dependence in extreme river flows and precipitation for Great Britain. J. Hydrology, 378, 240-252.
Keef, C., Tawn, J., et al. (2009c) Spatial risk assessment for extreme river flows. Journal of the Royal Statistical Society Series C- Applied Statistics 58(5), 601-618.
Penning-Roswell et al (2006) The benefits of flood and coastal risk management: a manual of assessment techniques, Middlesex University FHRC