Embed Size (px)
Citation preview

A multi-scaled, transdisciplinary study on the impacts and
management of Prosopis, one of the world’s worst woody
invasive plant taxa
Ross Taylor Shackleton
Dissertation presented for the degree of Doctor of Philosophy in Botany
Department of Botany & Zoology
Faculty of Science
Stellenbosch University
Supervisor: Prof D.M. Richardson;
Co-supervisors: Dr D.C. Le Maitre and Prof B.W. van Wilgen
March 2016
i
Declaration
By submitting this dissertation electronically, I declare that the entirety of the
work contained within is my own, original work, that I am the owner of the
copyright thereof (unless to the extent explicitly otherwise stated) and that I
have not previously in its entirety or in part submitted this work for obtaining
any qualification.
Ross Shackleton – March 2016
Copyright © 2016 Stellenbosch UniversityAll rights reserved
Stellenbosch University https://scholar.sun.ac.za
ii
Abstract
Biological invasions are a growing threat to humans and the environment globally and are a
substantial problem in South Africa. The tree genus Prosopis is a prominent invasive in South
Africa and globally. This study explores the global biogeography, costs and benefits of the
genus, the conflicts of interest regarding its management and use, and the options available
for management. The ecological costs of the genus, as well as social costs and benefits, are
explored further using South African case studies. Perceptions of the tree and its relative use
compared to native trees were also assessed across multiple stakeholder groups. This provided
evidence that is needed to formulate integrated management plans. Different barriers to
effective management of Prosopis in South Africa perceived by multiple stakeholders were
assessed, and strategic and prioritisation plans were developed to guide improved
management. The methods included literature reviews, vegetation surveys, questionnaires and
workshops.
Various Prosopis taxa have been introduced into over 100 countries, and areas that are
currently not invaded but which have a high risk of being invaded were identified using
bioclimatic modelling. Numerous detrimental effects on biodiversity, ecosystem services,
human health and livelihoods and economies were identified. Vegetation surveys showed that
Prosopis is having a major impact on native plant biodiversity across South Africa. Increased
density of Prosopis invasions leads to decreased native tree species richness and abundance
and reduced cover of perennial shrubs and grasses. Prosopis is also reducing population
stability through reduced recruitment and increased mortality of native trees. Reductions in
the supply of water and natural grazing, roots breaking infrastructure and reductions in
property value were costs identified in social surveys. Prosopis also provides benefits
including fodder, shade and fuelwood, however, the majority of all stakeholders viewed it to
have higher costs. In addition, the household use of Prosopis is lower than that of native trees,
suggesting that native trees (which are displaced by Prosopis), are still more important for
households.
More than 90 % of respondents would like to see a decrease in Prosopis population densities.
However, many barriers relating to the control of Prosopis exist – including: lack of
knowledge, lack of funding, conflicts of interest, and institutional issues such as poor
communication and cooperation, mismanagement, and poor prioritisation and strategic
planning. Farmers and Working for Water managers raised markedly different barriers
showing differences in world views.
A management strategy for Prosopis was developed. It outlines different control options and
details an approach for the co-ordination and monitoring of projects. It was stressed that
improved biological control is needed, as is improved management on private land. The
controversial “control through utilisation” approach needs further research to assess its
feasibility. Management approaches (prevention, eradication, containment and asset
protection) were assigned to individual municipalities go guide management. Multi-criteria
decision making analysis (using Analytic Hierarchy Process) was used to identify and
prioritise assets for protection at various scales. An integrated managed approach, in
Stellenbosch University https://scholar.sun.ac.za

iii
particular the use of biological control along with other methods was identified as key for
successful managed in the future.
Using transdisciplinary approaches, this thesis provided insights on the effects of Prosopis
invasions in South Africa, and provided objective support for improved management.
Drawing on case studies conducted in the thesis and other published material, a framework
for a national strategy to guide the management of this problematic invasive tree in South
Africa was produced.
Stellenbosch University https://scholar.sun.ac.za
iv
Opsomming
Die teenwoordigheid van biologiese indringers is 'n groeiende bedreiging vir die mens en die
omgewing wêreldwyd en is 'n beduidende probleem in Suid-Afrika. Die boom genus Prosopis
is 'n prominente indringer in Suid-Afrika en in die wêreld. Hierdie studie ondersoek die
globale biogeografie, koste en voordele van die genus, die botsende belange met betrekking
tot die bestuur en gebruike, en die opsies wat beskikbaar is vir die bestuur daarvan. Die
ekologiese koste van die genus, sowel as die sosiale impakte en voordele, word ondersoek
met behulp van Suid-Afrikaanse gevallestudies. Persepsies van die boom en sy relatiewe
gebruike, in vergelyking met inheemse bome, is deur verskeie belangegroepe geassesseer. Dit
verskaf bewyse vir die formulering van geïntegreerde bestuursplanne. Verskillende
hindernisse tot effektiewe bestuur van Prosopis is in Suid-Afrika deur verskeie
belanghebbendesgeïdentifiseer en geprioritiseer. Strategiese planne vir verbeterde bestuur is
ontwikkel. Die studie metodes sluit literatuurstudie, plantegroei opnames, vraelyste en
werkswinkels in.
Verskeie Prosopis spesies is in meer as 100 lande ingevoer. Gebiede waar Prosopis nie tans
as indringer geïdentifiseer is nie, maar waar 'n hoë risiko bestaan, is met behulp van
bioklimatiese modellering geïdentifiseer. Talle nadelige impakte op biodiversiteit,
ekosistemiese dienste, menslike gesondheid en voortbestaan asook ekonomieë is
geïdentifiseer. Plantegroei opnames het getoon dat Prosopis 'n grootskaalse impak op
inheemse plant biodiversiteit in Suid-Afrika het. Verhoogde digtheid van indringende
Prosopis bome lei tot ʼn afname van inheemse boomspesies, meerjarige struike en grasse.
Prosopis beïnvloed ook ekosisteem stabiliteit as gevolg van verhoogde mortaliteit van
belangrike inheemse bome. Sosiale opnames het aangedui dat verminderde water voorsiening,
afnames van natuurlike weiding, wortels wat infrastrukture beskadig en verlaging in die
waarde van eiendomme teweeg gebring word. Prosopis bied ook voordele soos voer,
skaduwee en brandhout, maar die meerderheid van belanghebbendes beskou die nadelige
impakte as belangriker as die voordele. Daarbenewens is die huishoudelike gebruik van
Prosopis minder prominent as die van inheemse bome, en is inheemse bome belangriker vir
huishoudings.
Meer as 90% van die respondente wil graag 'n afname in die Prosopis bevolkingsdigthede
sien. Daar is verskeie hindernisse vir die beheer van Prosopis, insluitende: 'n gebrek aan
kennis, gebrekkige befondsing, ʼn konflik van belange, institusionele kwessies soos swak
kommunikasie en samewerking, wanbestuur, swak prioritisering en gebrek aan strategiese
beplanning. Boere en bestuurders van Werk-vir-Water, identifiseer onderskeidelik
verskillende hindernisse wat dui opverskillende wêreldbeskouings.
ʼn Bestuurstrategie vir Prosopis is ontwikkel. Die strategie stel verskillende kontrole-opsies
voor en 'n benadering vir die koördinering en monitering van projekte. Dit beklemtoon dat
verbeterde biologiese beheer en bestuur van private grond benodig word. Die omstrede
"beheer deur gebruik" benadering moet verder nagevors word om die haalbaarheid daarvan te
bepaal. Bestuursbenaderings (voorkoming, uitwissing, beheer en bate beskerming) is aan
individuele munisipaliteite gegee om leiding aan bestuur te gee. Multi-kriteria besluitnemings
analises (met behulp van “Analytical Hierarchy Process”) is gebruik om bates te identifiseer
Stellenbosch University https://scholar.sun.ac.za
v
en te prioritiseer vir bestuur op verskillende vlakke. 'n Geïntegreerde bestuursbenadering, wat
in die besonder die gebruik van biologiese beheer saam met ander metodes voorstel, is
geïdentifiseer as die sleutel tot suksesvolle bestuur in die toekoms.
Hierdie tesis verskaf insigte oor die gevolge van Prosopis indringing in Suid-Afrika, deur
middel van transdissiplinêre benaderings, en verskaf objektiewe ondersteuning van die
bestuursbehoefte. Danksy gevallestudies in die proefskrif en ander gepubliseerde materiaal, is
'n raamwerk vir 'n nasionale bestuurstrategie van hierdie problematiese indringer boom in
Suid-Afrika daargestel.
Stellenbosch University https://scholar.sun.ac.za
vi
Acknowledgements
I would like to thank the following people and institutions, without whom this project would
not have been made possible:
My supervisor Prof Dave Richardson and co-supervisors Dr David Le Maitre and Prof Brian
van Wilgen for their patience, invaluable support and guidance. I have learned a lot from all
of you which will be invaluable in the future.
The DST-NRF Centre of Excellence for Invasion Biology (CIB), the Working for Water
Programme, National Research Foundation and the Oppenheimer Memorial trust for funding
this research.
All the academics, farmers, working for water staff, and communities who were so happy to
take time to answer my questions, fill in questionnaires and participate in workshops, and all
the farmers that let me work on their land, and more often than not gave me snacks, coffee
and a bed for the night.
In particular I would like to thank:
Andrew Wannenburgh, Louwrens Ferrera, Nico Byleveldt, Morne de Wee and Ntsieni
Manngo at Working for Water.
Frikkie and Alta Lock (Pietersfontain), Merwe and Nakkie van Wyk (Gannabos)
Vollie Visage (Katkop), the Stein family (Driekop), the van der Merwe family
(Tierhoek), Donald and Cathleen Torr (Jagersberg) and Willem Louw (Rietkolk) - the
lovely farmers who provided a lot of help, along with many others.
Jana van de Merwe, Gerhardus Louw, Thomas Arendse and Suzette Hinene who
helped me in the field as translators and Elana Mostert for helping with my
workshops.
The CIB assistant staff (Anel, Carla, Christy, Mathilda, Rhoda and Suzaan) for their help over
the years.
My family and friends who gave me support during the course of the project.
Stellenbosch University https://scholar.sun.ac.za

vii
Table of contents
Declaration i
Abstract ii
Opsomming iv
Acknowledgements vi
List of figures xii
List of tables xvii
General introduction 1
Motivation 1
Aims and objectives of the study 2
Chapter synopsis 5
Chapter 1: Prosopis: A global assessment of the biogeography, benefits, impacts
and management of one of the world’s worst woody invasive plant taxa 8
1.1 Introduction 8
1.2 Benefits and costs 10
1.2.1 Benefits, costs and invasiveness of different species 10
1.2.2 Uses/benefits 12
1.2.3 Negative impacts/costs 12
1.2.4 Benefits vs. costs and the dimensions of contentious issues 14
1.3 Introductions, current and potential distributions of Prosopis 15
1.3.1 Introductions 15
1.3.2 Distribution 17
1.3.3 Potential Distribution 18
1.4 Management of Prosopis 18
1.4.1 Contentious issues surrounding invasive Prosopis taxa and their management 21
1.4.2 Case studies comparing different management approaches 22
1.4.3 Research and management needs 25
Stellenbosch University https://scholar.sun.ac.za
viii
1.5 Conclusions 29
Supplementary information 29
Acknowledgements 29
Chapter 2: The impact of invasive alien Prosopis species (mesquite) on native plants
in different environments in South Africa 30
2.1 Introduction 30
2.2 Methods 32
2.2.1 Scope of investigation and study sites 32
2.2.2 Data collection 32
2.2.3 Data analysis 33
2.2.3.1 Prosopis density and basal area across different environments 33
2.2.3.2 Impacts of Prosopis invasions on native species 33
2.3 Results 33
2.3.1 Effects of biome and habitat type on Prosopis basal area 33
3.3.2 Effects of invasion by Prosopis on native woody plants 36
2.3.3 Effects of Prosopis invasion on native herbaceous plant and abiotic ground cover 37
2.4 Discussion 38
2.4.1 International comparisons 38
2.4.2 Implications of findings 39
Acknowledgements 41
Chapter 3: Prosopis invasions in South Africa: Populations structures and
impacts on native tree population stability 42
3.1 Introduction 42
3.2 Aims and objectives 44
3.3 Study site 44
3.4 Methods 44
3.4.1 Data collection 44
3.4.2 Data analysis 45
3.5 Results 46
Stellenbosch University https://scholar.sun.ac.za

ix
3.5.1. Prosopis populations 46
3.5.2 Tree population trends under Prosopis invasion 48
5.3. Effects of Prosopis invasion tree species mortality 51
3.6 Discussion 52
3.6.1 Prosopis population structures 52
3.6.2 The impacts of Prosopis on native tree populations 53
3.6.3 Prosopis management 54
3.7 Conclusions and priorities for future research 55
Acknowledgments 54
Chapter 4: Stakeholder perceptions and practices regarding Prosopis (mesquite)
invasions and management in South Africa 56
4.1 Introduction 56
4.2 Study sites 58
4.3 Methods 61
4.4 Results 62
4.4.1 Knowledge and perceptions on Prosopis invasions 62
4.4.2 Benefits and costs of Prosopis 63
4.4.3 Prosopis management 67
4.4.5 Factors relating to the knowledge of Prosopis 78
4.5 Discussion 69
4.5.1 Factors shaping knowledge, perceptions and practices of Prosopis invasions 69
4.5.2 Knowledge, perceptions and practices relating to Prosopis invasions in
South Africa 70
4.5.3 Implications for management 71
4.6 Conclusions 72
Acknowledgments 73
Chapter 5: Use of non-timber forest products from invasive alien Prosopis species
(mesquite) and native trees in South Africa: Implications for management 74
5.1 Introduction 74
Stellenbosch University https://scholar.sun.ac.za
x
5.1.1 Mesquite in South Africa 78
5.2 Methods 78
5.2.1 Study site 79
5.2.2 Interviews 79
5.2.3 Field measurements 80
5.2.4 Statistics 80
5.3 Results 81
5.3.1 Uses of mesquite and native trees 81
5.3.2 Perceptions and trends over time 82
5.4 Discussion 85
5.4.1 Findings in relation to hypotheses 85
5.4.2 Use patterns and perceptions 86
5.4.3 Benefits vs. costs 87
5.4.4 Recommendations: Policy and management options 87
Acknowledgements 87
Chapter 6: Identifying barriers to effective management of widespread invasive
alien trees: Prosopis species (mesquite) in South Africa as a case study 89
6.1 Introduction 89
6.1.1 Global change and barriers to adaption 89
6.1.2 Tree invasions 90
6.1.3 Study species and system (Prosopis in South Africa) 91
5.1.4 Working for Water programme 92
6.2 Methods 93
6.2.1 Study area 93
6.2.2 Questionnaires and workshops 993
6.3 Results 94
6.3.1 Perceptions of Prosopis 94
6.3.2 Barriers to management 97
Stellenbosch University https://scholar.sun.ac.za

xi
6.3.3 Human and informational barriers 99
6.3.4 Natural barriers 100
6.3.5 Social barriers 101
6.3.6 Adaptation responses 102
6.4 Discussion 105
6.4.1 The value of including both workshops and questionnaires 105
6.4.2 Challenges presented by barriers 106
6.4.3 The need for research 106
6.4.4 The role of legislation 107
6.4.5 Adaptive management 107
6.5 Conclusion 107
Acknowledgements 107
Chapter 7: Towards a national strategy for the management of a widespread
invasive tree (Prosopis: mesquite) in South Africa 108
7.1 Introduction 108
7.1.1 General introduction 108
7.1.2 Prosopis in South Africa 110
7.1.2.1 History, distribution and impacts 110
7.1.2.2 Legislation and management 111
7.2 Developing the strategy 113
7.3 Elements of the strategy 115
7.3.1 Goal 116
7.3.2 Co-ordination of programs and stakeholders involved 118
7.3.3 Mandates of programs and legislation 118
7.3.4 Control options and approaches 119
7.3.5 Spatial planning of management areas 123
7.3.6 Prioritisation of assets to protection areas of widespread invasion 124
7.3.7 Monitoring, evaluation and indicators 126
Stellenbosch University https://scholar.sun.ac.za
xii
7.4 Conclusion 127
Acknowledgements 127
Additional outcomes: Stakeholder involvement: making strategies workable:
future science and society 128
8.1 Introduction 128
8.1.2 Costs, benefits and conflicts of interest 128
8.2 Cacti 130
8.2.1 The problem 130
8.2.2 The solution 130
8.3 Mesquite 132
8.3.1 The problem 132
8.3.2 The solution 132
8.4 What did we learn from Prosopis and Cactaceae? 133
Thesis conclusion 134
References 139
Thesis supplementary material 159
Stellenbosch University https://scholar.sun.ac.za
xiii
List of figures
Figure i: The broad aims of each chapter and how they link together with in the thesis. (Pg. 4)
Figure 1.1: Costs and benefits of introduced Prosopis species: (a) Invasive Prosopis stand
altering hydrology in Loeriesfontein, South Africa; (b) Cleared Prosopis in the foreground
and uncleared in the background illustrating impenetrable thickets, loss of land, loss of
grazing potential and the effort needed for its control in Kenhardt, South Africa; (c) Loss of
access to a barn and encroachment of fields in Calvinia, South Africa; (d) The death of a
native tree (Searsia lancea) due to competition from Prosopis in Kenhardt, South Africa; (e)
The effects of Prosopis pods on a goat’s teeth in Kenya; (f) Prosopis thorns that cause tyre
damage and injure humans and livestock; (g) Prosopis causing loss of topsoil and erosion in
Prieska, South Africa; (h) ‘Manna’ – a blood sugar medicine made from Prosopis in South
Africa (www.mannaplus.co.za); (i) Food products made from Prosopis in Peru; (j) Timber
from Prosopis used to make furniture in Kenya; (k) Young boy collecting Prosopis pods to
feed livestock in Askham, South Africa; (l) Prosopis used for shade and ornamentation in
Askham, South Africa; (m) Prosopis used fuel in Kenhardt, South Africa; (n) A bee hive
placed in an invasive Prosopis stand Calvinia, South Africa. Photos: S. Choge (j); G. Cruz (i);
P. Manudu (e, f); R. Shackleton (a, b,c, d, g, k, l, m, n). (Pg. 11)
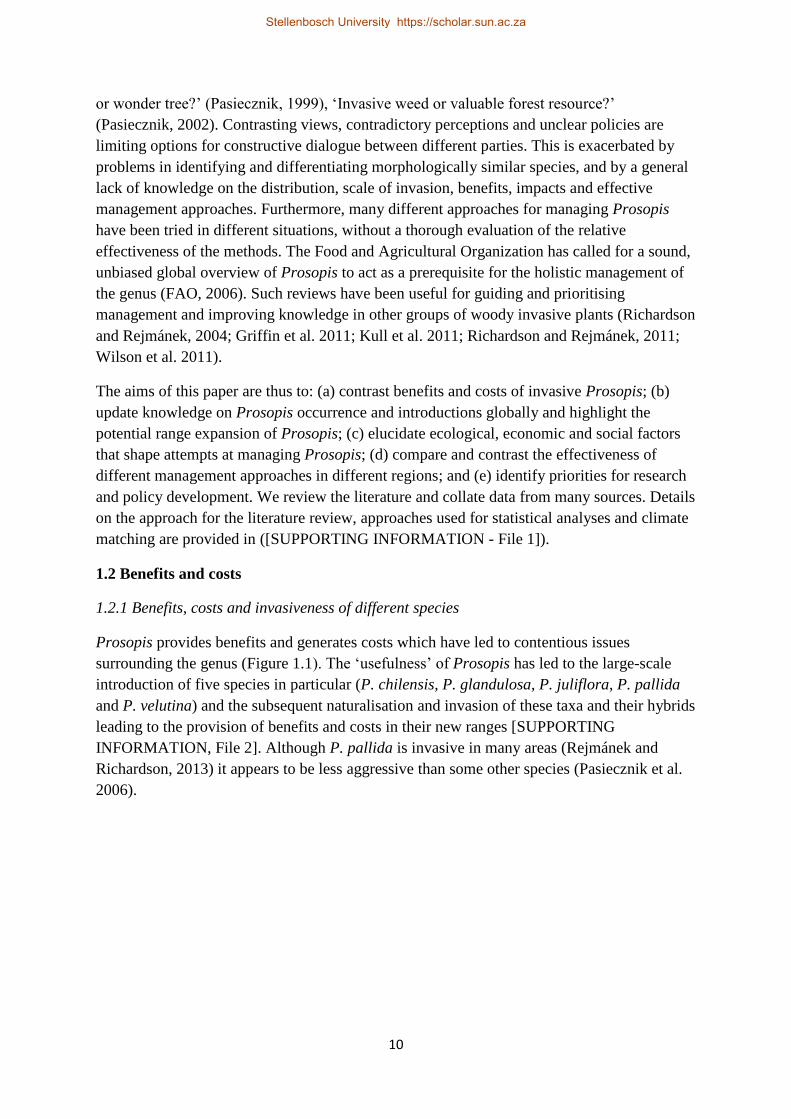
Figure 1.2: Cause-and-effect network diagram showing the negative effects of Prosopis
invasions and management options that can be used to target each stage of invasion. (Pg. 13)
Figure 1.3: Time scale of all Prosopis introductions globally (n = 82 known species-country
introduction dates). (Pg. 15)
Figure 1.4: Classification of all records of introduced Prosopis species (236 introductions in
103 countries); classification of “naturalised” and “invasive” follow the criteria of Pyšek et al.
(2004). (Pg. 16)
Figure 1.5: The global distribution of Prosopis species: a) species diversity in countries with
native taxa; b) species diversity of taxa recognized as being weedy within their native ranges;
c) species richness of naturalised and invasive Prosopis taxa (following the criteria of Pyšek
et al. 2004) and (d) potential Prosopis species richness based on climatic suitability. (Pg. 17)
Figure 1.6: A classification and regression tree model using social, ecological and social
variables to explore the drivers of different types of Prosopis management globally. (Pg. 20)
Figure 1.7: Requirements for research and management needs regarding Prosopis and factors
limiting success to date. (Pg. 26)
Figure 2.1: Study area showing biomes, mean annual precipitation and data collection sites
across South Africa: (1) Calvinia; (2) Loeriesfontein; (3) Brandvlei; (4) Kenhardt; (5)
Upington; (6); Mier (7) Seven; (8) Kimberley; (9) Prieska; (10) Carnavon (11) Beaufort West.
(Pg. 32)
Stellenbosch University https://scholar.sun.ac.za
xiv
Figure 2.2: Images of Prosopis and native vegetation in South Africa: Panel 1 - (a) Non-
invaded riverine forest; (b) Low Prosopis invasion; (c) Dense Prosopis invasion; Panel 2 – (a)
Non-invaded Savanna vegetation; (b) sparse Prosopis invasion; (c) Landscape scale, dense
Prosopis invasion; Panel 3 – (a) Grass cover 5 years after clearing Prosopis; (b) Ground cover
under native Acacia karroo riverine forest; (c) Ground cover under a Prosopis invasion.
Photos: R T. Shackleton. (Pg. 34)
Figure 2.3: A comparison of Prosopis basal area across: (a) three river size classes; and (b)
three biomes. Data points are for individual plots ranked from low to high in terms of basal
area. As the number of plots differed between river classes and biomes, the horizontal axis
was scaled to facilitate comparison. (Pg. 35)
Figure 2.4: Scatter plots and regression analyses showing the effects of Prosopis basal area
on: (a) native woody species density; (b) basal area; (c) species richness; and (d) Shannon-
Wiener species diversity index. (Pg. 37)
Figure 2.5: Scatter plots and regression analysis assessing the effect of Prosopis basal area on
non-woody plant cover: (a) perennial grass cover; (b) annual grass cover; (c) perennial
herbaceous plant cover (100m²); and (d) annual herbaceous plant cover. (Pg. 38)
Figure 2.6: Scatter plots and regression analyses showing the effect of Prosopis basal area on
(a) organic litter cover; and (b) bare ground cover. (Pg. 38)
Figure 3.1: The study area, showing biomes, mean annual precipitation and data collection
points across South Africa: (1) Calvinia; (2) Loeriesfontein; (3) Brandvlei; (4) Kenhardt; (5)
Upington; (6); Mier (7) Seven; (8) Kimberley; (9) Prieska; (10) Carnavon (11) Beaufort West.
(Pg. 44)
Figure 3.2: Population structure of Prosopis spp. in South Africa: (a) Size-class distributions
(diameter at 30 cm above ground) and (b) quotients (ratios) of the numbers in different size
classes. (Pg. 46)
Figure 3.3: Size-class distributions of Prosopis (diameter at 30 cm above ground) in different
biomes (a) and river types (b). (Pg. 47)
Figure 3.4: Quotients indicating population stability between successive size-classes for
Prosopis populations in different biomes and river types. (Pg. 48)
Figure 3.5: Population structures of native and alien invasive trees found in areas with zero-
low (ZL) and moderate to high (MH) levels of Prosopis invasion based on stem diameters 30
cm above the ground. (Pg. 49)
Figure 3.6: Quotients comparing native tree population stability between successive size-
classes in areas of zero-low (ZL) and moderate to high (MH) levels of Prosopis invasion. (Pg.
51)
Figure 3.7: Scatter plot and regression analysis showing the effect (a) Prosopis basal area on
dead tree basal area (b) Prosopis basal area and number of dead trees (c) mean number of
dead species at different Prosopis basal areas. (Pg. 52)
Stellenbosch University https://scholar.sun.ac.za
xv
Figure 4.1: Towns in the Northern Cape province, South Africa, where surveys were
conducted to determine human perceptions relating to Prosopis invasions. The dots represent
the distribution of Prosopis in South Africa (Source of Map – Henderson, SAPIA database,
ARC-Plant Protection Research Institute, Pretoria). (Pg. 59)
Figure 4.2: Invasive Prosopis species in South Africa: costs, benefits and management
options. Panel 1 shows costs: (1a) Prosopis encroachment on livestock rangelands; (1b)
Prosopis thorns that injure humans and animals and damage tyres; (1c) Prosopis encroaching
on urban infrastructure. Panel two shows benefits: (2a) Workers making fuelwood from
Prosopis; (2b) Prosopis being used as a shade and ornamental tree in a rural village; (2c)
Prosopis pods collected to be milled and fed to livestock. Panel three shows management
options: (3a) Mechanical and chemical clearing of Prosopis invasions; (3b) Algarobius
prosopis (Bruchidae; a seed-attacking insect introduced for biological control); (3c) Fence-
line contrast of a farmer who clears annually and one who does not manage Prosopis. Photos:
R.T. Shackleton and J.H. Hoffmann (3b). (Pg. 60)
Figure 4.3: Stakeholder views of the benefits and costs of Prosopis in South Africa (χ² =
205.1; df = 12; p < 0.001). (Pg. 64)
Figure 4.4: Different views of stakeholder groups on whether costs associated with Prosopis
are greater than the benefits? (χ² = 135.8; df = 6; p < 0.001). (Pg. 64)
Figure 5.1: Locations of the 10 towns in South Africa where interviews were conducted on
the use of non-timber forest products from Prosopis species (mesquite) and native trees use.
Dots represent the occurrence of invasive mesquite stands (Source of Map - Henderson,
SAPIA database, ARC-Plant Protection Institute, Pretoria). (Pg. 78)
Figure 5.2: Methods of securing non-timber forest products from (a) mesquite – (χ² = 255.8;
p < 0.0005) and (b) native species (χ² = 235.2; p < 0.0005) for four stakeholder groups in
South Africa. (Pg. 83)
Figure 5.3: Perceptions on the usefulness of non-timber forest products supplied by mesquite
compared to native tree species in South Africa (χ² = 189.3; p < 0.0005). (Pg. 83)
Figure 5.4: A comparison of the use of (a) mesquite (χ² = 130.0; p < 0.0005) and (b) native
species (χ² = 111.5; p < 0.0005) since the year 2000 in South Africa. (Pg. 85)
Figure 6.1: Word cloud of words that different stakeholder groups associated with Prosopis
(a) Managers; (b) Farmers; (c) Workers; (d) Academics. Each participant was asked to list 3-5
words at the beginning of the survey with no background information. (Pg. 95)
Figure 6.2: Human and informational barriers to management of Prosopis species (categories
follow Jones, 2010) identified by different stakeholders during workshops. A new sub-
component (“Indirect economic” barriers) was added. (Pg. 103)
Figure 6.3: Natural barriers to management (Jones, 2010) identified by different stakeholders
in workshops. (Pg. 101)
Stellenbosch University https://scholar.sun.ac.za
xvi
Figure 6.4: Social barriers to management of Prosopis species (listed under categories
defined by Jones, 2010) identified by different stakeholder groups during workshops.
(Pg.103)
Figure 7.1: Figure 1: (a) Distribution of Prosopis spp. in South Africa (Sources: SAPIA
database – L. Henderson; Van den Berg, 2010; Shackleton 2015a and 2015b); (b)
Climatically suitable areas for Prosopis spp. in South Africa based on Mgidi (2004). (Pg. 111)
Figure 7.2: Framework and sources used to develop a national strategy for Prosopis in South
Africa. (Pg. 115)
Figure 7.3: Scenarios of the extent of Prosopis invasion and associated costs over time based
on different control options, combinations of options, and their potential effects on invasion
extent. (Pg. 120)
Figure 7.4: Spatial differentiation of approaches for managing invasive Prosopis species in
South Africa to be applied to each municipality in the country using the decision-tree
framework of Grice et al. (2010). This spatial differentiation is based on current and potential
population sizes. The management approaches include: Prevention (active and passive
surveillance in areas with no Prosopis); Eradication (in areas with small, isolated
populations): Containment (along the boundaries of areas with numerous populations); and
Asset protection (in areas with widespread and dense populations). (Pg. 124)
Figure 7.5: Spatial prioritisation of management for invasive Prosopis species in South
Africa using criteria identified and ranked by means of analytic hierarchy process (AHP)
illustrated in in Table 7.3 (a) shows spatial prioritization of municipalities within the asset
protection category in South Africa highlighted in Figure 7.3. (b) gives an example of fine-
scale prioritization of quaternary catchments in the Hantam municipality (the rectangle in (a);
this municipality was ranked as highest priority in Figure 5a). (Pg. 126)
Figure 8.1: American Giant one of the spineless cultivars of Opuntia ficus-indica (cactus
pear). Image A. Novoa. (Pg. 129)
Figure 8.2: Open discussion between stakeholders who benefit from cactus species in South
Africa and stakeholders who want to reduce their negative impacts. Image A. Novoa. (Pg.
129)
Figure 8.3: The fruit of the prickly pear. Image Wikimedia Commons. (Pg. 131)
Figure 8.4: Dense stands of Prosopis species (mesquite) fringe water courses in many parts
of the arid interior of South Africa. Image R. Shackleton. (Pg. 132)
Figure 8.5: A survey was done across the invasive range of mesquite in South Africa to
determine the perceptions of stakeholders regarding the benefits and costs associated with the
species. Image R. Shackleton. (Pg. 133)
Stellenbosch University https://scholar.sun.ac.za
xvii
List of tables
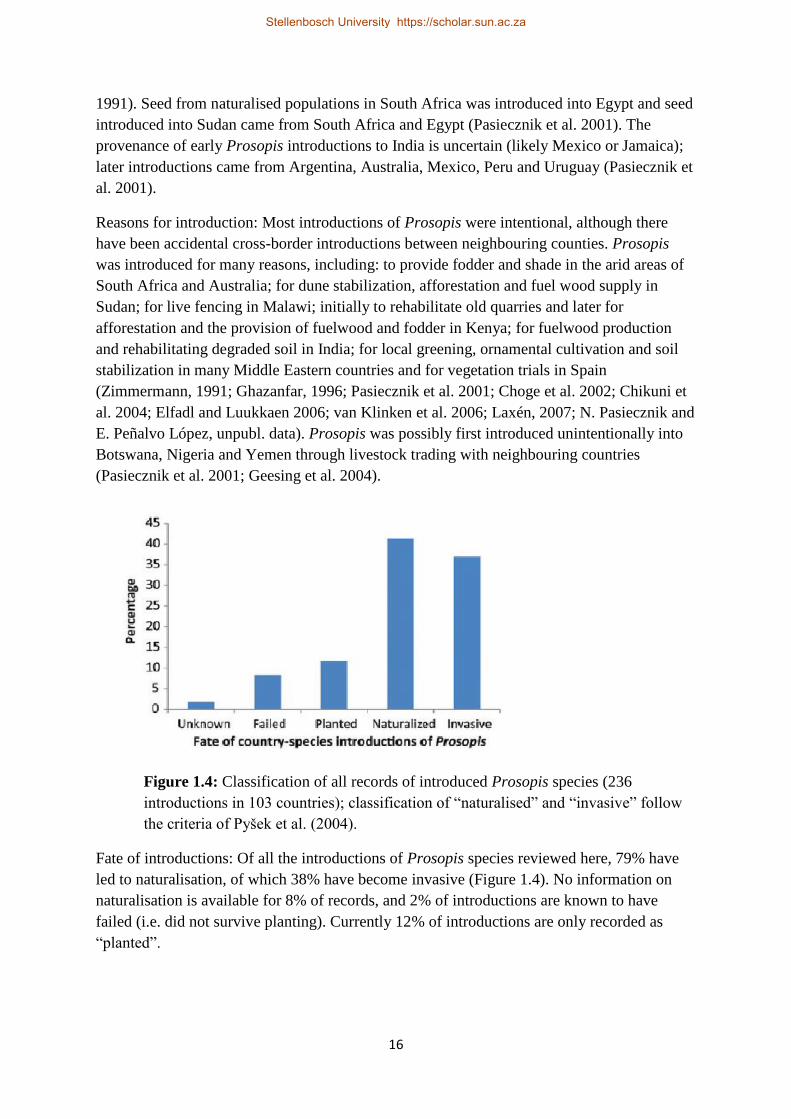
Table 1.1: Logistic regression highlighting the importance of different ecological, economic
and social factors in determining management of Prosopis within a country. (Pg. 18)
Table 1.2: A comparison of techniques for managing Prosopis and their advantages and
disadvantages. (Pg. 21)
Table 2.1: Mean (± standard error) basal area (m²/ha) of invasive Prosopis species in three
habitat types (river categories). Basal area values were ranked and divided into three data sets
of equal size representing low, moderate and high basal areas respectively. Basal area
estimates with different superscript letters are significantly different across river categories
(Games-Howell Post-Hoc tests). (Pg. 35)
Table 2.2: Mean (± standard error) basal area (m²/ha) of invasive Prosopis species in three
biomes. Basal area values were ranked and divided into three data sets of equal size
representing low, moderate and high basal areas respectively. Basal area estimates with
different superscript letters are significantly different across river categories (Games-Howell
Post-Hoc tests). (Pg. 36)
Table 3.1: A comparison between the overall population structure of Prosopis spp. at the 11
sites across three different biomes and river types. (Pg. 47)
Table 3.2: Results of Kolmogorov-Smirnov tests comparing the size class distributions of
Prosopis populations in different biomes and river types. (Pg. 47)
Table 3.3: Population parameters for native trees and the alien Tamarix ramosissima at sites
with (zero to low) ZL and (moderate to high) MH levels of Prosopis invasion. (Pg. 50)
Table 4.1: Demographics of sample population of the different stakeholders interviewed [n =
(farmers – 133; urban informal – 236; urban affluent – 130; rural 100). Hh = household. (Pg.
61)
Table 4.2: Stakeholder responses to questions relating to knowledge and perceptions of
Prosopis in South Africa. (Pg. 62)
Table 4.3: Stakeholder views of benefits provided by Prosopis (5% and above) (χ² = 221.5; df
= 15; p < 0.001). (Pg. 65)
Table 4.4: Stakeholder views of the costs/harm caused by Prosopis (5% and above) (χ²=
575.4; df = 45; p < 0.001). (Pg. 66)
Table 4.5: Stakeholder perceptions, views and practices relation to the management of
Prosopis invasions in South Africa. (Pg. 67)
Table 4.6: Where people gained their knowledge on the benefits and costs of Prosopis
(Benefits; χ² = 306.1; df, = 14; p < 0.001) (Costs; χ² = 203.2; df = 18; p < 0.001). (Pg. 69)
Table 5.1: Demographics of the sample populations (mean ± standard deviation) of the
different stakeholder groups interviewed across the study sites. hh = household. (Pg. 79)
Stellenbosch University https://scholar.sun.ac.za
xviii
Table 5.2: A comparison of fuelwood use of mesquite and native tree species (mean ±
standard deviation) for different stakeholders. Superscript letters = significant differences
between different stakeholder groups - Tukeys post hoc test. hh = household. (Pg. 81)
Table 5.3: Usage metrics (mean ± standard deviation) for less commonly used non-timber
forest products harvested from mesquite and native trees in South Africa. hh = household.
(Pg. 82)
Table 5.4: Views of different stakeholders on the negative (χ² = 4.05; p = 0.29) and positive
(χ² = 11.5; p = 0.0006) aspects of mesquite non-timber forest product provision as compared
to those supplied by native trees. (% of respondents). (Pg. 84)
Table 6.1: Perceptions of the costs, benefits and management of invasive Prosopis species
among the four stakeholder groups. Numbers in the table indicate the percentage of
affirmative answers to the questions, except for “barriers listed” where values indicate the
numbers of barriers (mean ± sd). (Pg. 96)
Table 6.2: Mean ranking of different costs and benefits of Prosopis invasions for four
stakeholder groups (importance ranking: 1 = low; 5 = high). (Pg. 96)
Table 6.3: Barriers to effective management mentioned by four different stakeholder groups
involved in the management of Prosopis. Numbers are the percentage of respondents
mentioning that barrier; importance rankings are given in brackets (1 lowest; 5 highest). (Pg.
98)
Table 6.4: Management and adaptation responses to improve the management of Prosopis
suggested by four stakeholder groups. Numbers in the table indicate the percentage of each
group that suggested particular responses. (Pg. 104)
Table 7.1: Strategic planning needs to achieve the goal of improving the effectiveness of
managing invasive Prosopis in South Africa as determined through workshops and
consultation with multiple stakeholders. (Pg. 116)
Table 7.2: A comparison of control options in terms of their benefits and costs, mean
operation costs, time frames and employment opportunities. (Pg. 122)
Table 7.3: Criteria and sub-criteria and their relative weightings used in prioritisation of
assets to be protected in areas with dense Prosopis invasions. These criteria and weightings
were identified and weighted by multiple stakeholders in facilitated workshops. (Pg. 125)
Stellenbosch University https://scholar.sun.ac.za

1
General introduction
Motivation
The increasing mobility of humans over the past few centuries has facilitated the movement
of species into new areas far away from their origins. This has been done purposefully for the
introduction of new crops, horticultural and forestry species as well as accidentally in ballast
water and attached to exported and imported materials (Mack, 2003). The movement of
organisms out of their natural habitats is one of the key drivers of human-induced global
change (Vitousek et al., 1997) and is causing negative impacts on the environment and
livelihoods worldwide. Invasions are a major cause of extinctions (Clavero, and García-
Berthou, 2005), reduce the supply of ecosystem services such as water (Le Maitre et al,
1996), and cost the global economy over US$ 1.4 trillion per annum (Pimentel et al. 2000).
However, many of these species are still used commercially and/or are important for
livelihood subsistence (Moran et al., 2000; Shackleton et al. 2007: Wise et al., 2012). Species
that provide both benefits and costs have often led to conflicts of interest around their use and
management (van Wilgen and Richardson 2014).
Due to these conflicts of interest is it very important to better understand the benefits, costs,
ecology and perceptions of invasive taxa such as Prosopis and Australian Acacia species to
inform best practice management strategies to ensure negative impacts are minimized and
potential benefits are maximised where this is feasible. When dealing with complex issues,
such as invasive species that are both useful and harmful, leading to conflicts of interest,
transdisciplinarity is important (Kueffer, 2010). Transdisciplinarity approaches research in a
holistic manner applying and incorporating approaches from a variety of disciplines and
incorporates various levels of knowledge from different stakeholders to address common but
often complex problems (Max-Neef, 2005; Angelstam et al. 2013). Research on invasive
species has primarily been ecological in nature, and management decisions are based on
ecological factors (García-Llorente et al. 2009). However, the impacts and management also
flow into the domains of economics and society (Kull et al. 2011). To understand and manage
invasive species, insights are required from various disciplines (including economics, social
and ecological studies) and all stakeholders need to be involved. This is essential for gaining
a holistic understanding of the problem and potential solutions (Kueffer, 2010).
With respect to South Africa, understanding the impacts and benefits of invasions is crucial
to guide management as there are complex social- ecological interactions. This is because
large parts of South Africa fall within some of the most biodiverse regions of the world, and
much of the country is semi-arid and invasive trees have a major impact on ecosystem
services in these regions, notably water supply (Dzikiti et al. 2013). Such impacts are
detrimental to biodiversity and to human livelihoods. However, at the same time there many
communities that are benefiting from the utilisation of invasive species (Shackleton et al.
2007; Kull et al. 2011). Communities using invasive species are often some of the most
marginalised people in the country due the historic injustice of colonialism and apartheid.
This makes in-depth studies involving a range of stakeholders and disciplines important to
get a holistic view of the benefits vs. the costs of these invasions and how best to manage
Stellenbosch University https://scholar.sun.ac.za
2
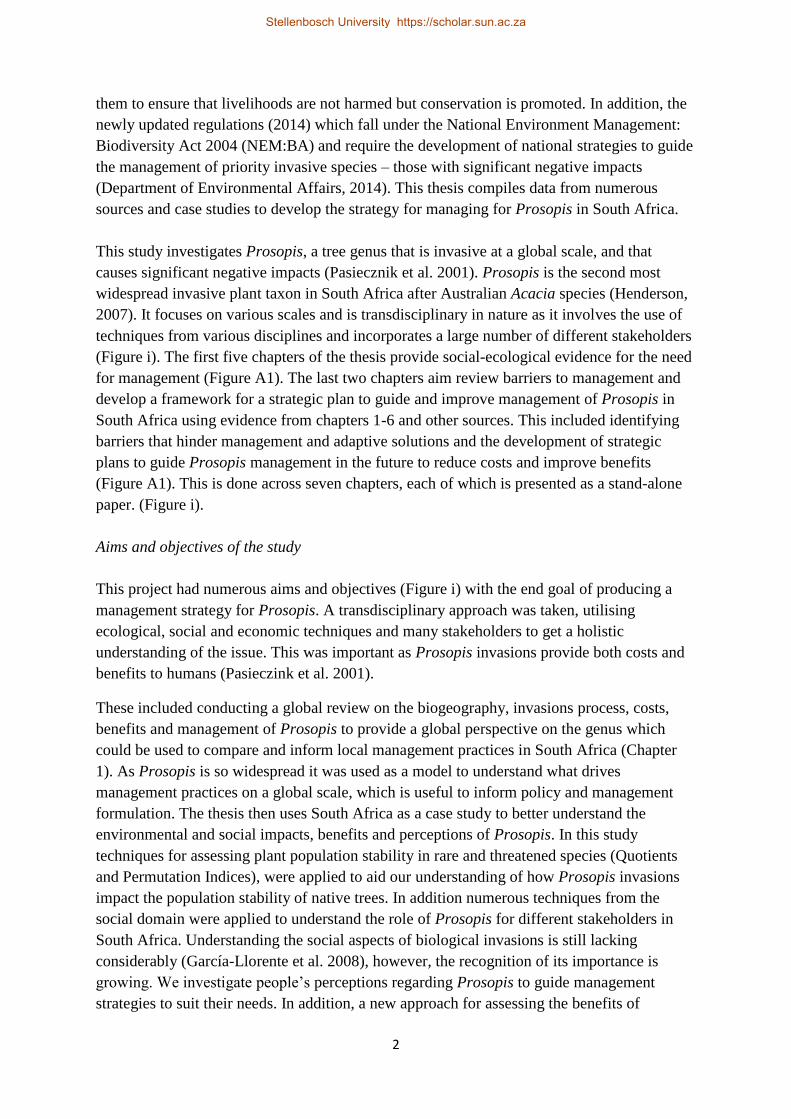
them to ensure that livelihoods are not harmed but conservation is promoted. In addition, the
newly updated regulations (2014) which fall under the National Environment Management:
Biodiversity Act 2004 (NEM:BA) and require the development of national strategies to guide
the management of priority invasive species – those with significant negative impacts
(Department of Environmental Affairs, 2014). This thesis compiles data from numerous
sources and case studies to develop the strategy for managing for Prosopis in South Africa.
This study investigates Prosopis, a tree genus that is invasive at a global scale, and that
causes significant negative impacts (Pasiecznik et al. 2001). Prosopis is the second most
widespread invasive plant taxon in South Africa after Australian Acacia species (Henderson,
2007). It focuses on various scales and is transdisciplinary in nature as it involves the use of
techniques from various disciplines and incorporates a large number of different stakeholders
(Figure i). The first five chapters of the thesis provide social-ecological evidence for the need
for management (Figure A1). The last two chapters aim review barriers to management and
develop a framework for a strategic plan to guide and improve management of Prosopis in
South Africa using evidence from chapters 1-6 and other sources. This included identifying
barriers that hinder management and adaptive solutions and the development of strategic
plans to guide Prosopis management in the future to reduce costs and improve benefits
(Figure A1). This is done across seven chapters, each of which is presented as a stand-alone
paper. (Figure i).
Aims and objectives of the study
This project had numerous aims and objectives (Figure i) with the end goal of producing a
management strategy for Prosopis. A transdisciplinary approach was taken, utilising
ecological, social and economic techniques and many stakeholders to get a holistic
understanding of the issue. This was important as Prosopis invasions provide both costs and
benefits to humans (Pasieczink et al. 2001).
These included conducting a global review on the biogeography, invasions process, costs,
benefits and management of Prosopis to provide a global perspective on the genus which
could be used to compare and inform local management practices in South Africa (Chapter
1). As Prosopis is so widespread it was used as a model to understand what drives
management practices on a global scale, which is useful to inform policy and management
formulation. The thesis then uses South Africa as a case study to better understand the
environmental and social impacts, benefits and perceptions of Prosopis. In this study
techniques for assessing plant population stability in rare and threatened species (Quotients
and Permutation Indices), were applied to aid our understanding of how Prosopis invasions
impact the population stability of native trees. In addition numerous techniques from the
social domain were applied to understand the role of Prosopis for different stakeholders in
South Africa. Understanding the social aspects of biological invasions is still lacking
considerably (García-Llorente et al. 2008), however, the recognition of its importance is
growing. We investigate people’s perceptions regarding Prosopis to guide management
strategies to suit their needs. In addition, a new approach for assessing the benefits of
Stellenbosch University https://scholar.sun.ac.za
3
invasive species was applied; this involved a comparative study which allowed for the
calculation of the relative value of Prosopis compared to substitutes (native tree species).
The aims and objectives of the above studies were to provide evidence to guide management
of Prosopis in South Africa along with other published studies. In the last two chapters the
focus is on improving control of Prosopis through understanding barriers to management and
developing a national strategy. Systematic identification and understanding of barriers
hindering effective management and potential adaption and strategic responses is common in
other fields such as climate change and medicine (Spires et al. 2014), but lacking in the
domain of natural resource management and conservation. We therefore adopted techniques
used in climate change and applied to aid understanding barriers to management for Prosopis.
The last goal of the thesis was to produce a national strategy to improve the management of
Prosopis in South Africa incorporating case studies from the PhD and many other sources
and planning techniques. This project collated insights from multiple stakeholders to give a
better and holistic understanding of Prosopis invasions, thereby seeking to minimize conflicts
of interest which is discussed further in an additional article published in Quest (Figure A1).
Further details are presented in the chapter synopses below.
Stellenbosch University https://scholar.sun.ac.za

4
Figure i: The broad aims of each chapter and how they link together within the thesis.
Stellenbosch University https://scholar.sun.ac.za
5
Chapter synopses
The following section provides a short synopsis on the focus of each chapter and where it was
published or submitted.
Chapter 1: Prosopis: A global assessment of the biogeography, benefits, impacts and
management of one of the world’s worst woody invasive plant taxa
Reference: Shackleton R.T., Le Maitre, D.C., Pasiecznik. N.M. and Richardson, D.M. 2014.
Prosopis: A global assessment of the biogeography, benefits, impacts and management of
one of the world’s worst woody invasive plant taxa. AoB Plants 6:plu027 doi:
10.1093/aobpla/plu027.
Chapter 1 presents a global review of the genus Prosopis. It looks at its biogeography,
introduction history, wide-scale benefits and costs, drivers of management in different
countries and possible management options. It then highlights what is still needed to improve
knowledge and management of this genus worldwide. This chapter provides an overview of
the broad-scale trends of Prosopis invasions, and provides evidence for the need to manage
Prosopis using numerous case studies from around the globe and discusses possible
management options.
Chapter 2: The impact of invasive alien Prosopis species (mesquite) on native plants in
different environments in South Africa
Reference: Shackleton, R.T., Le Maitre, D.C., van Wilgen, B.W. and Richardson, D.M. 2015.
The impact of invasive alien Prosopis species (mesquite) on native plants in different
environments in South Africa. South African Journal of Botany 97: 25-31.
Chapter 2 provides evidence of the negative impacts of Prosopis invasions on native plant
species over large parts of South Africa. The results show that as Prosopis density increases,
the cover, density and species richness of native trees, shrubs and grasses decreases. It also
describes the ecology of Prosopis in areas with different levels of water availability. This
chapter provides evidence for the need to manage Prosopis to reduce impacts on biodiversity
and ecosystem services related to plants.
Chapter 3: Prosopis invasions in South Africa: Population structures and impacts on
native tree population stability
Reference: Shackleton, R.T., Le Maitre, D.C. and Richardson, D.M. 2015. Prosopis invasions
in South Africa: Populations structures and impacts on native tree population stability.
Journal of Arid Environments 144: 70-78.
Chapter 3 provides further information on the ecology of Prosopis and its impacts on the
population structure and stability of native tree species. It highlights how, by causing
decreased recruitment and increased mortality, Prosopis is having a negative effect on
various native tree populations where they coexist. It gives further support for the need to
Stellenbosch University https://scholar.sun.ac.za

6
manage Prosopis to protect native biodiversity and the services that natural ecosystems
provide.
Chapter 4: Stakeholder perceptions and practices regarding Prosopis (mesquite)
invasions and management in South Africa
Reference: Shackleton, R.T., Le Maitre, D.C. and Richardson, D.M. 2015. Stakeholder
perceptions and practices regarding Prosopis (mesquite) invasions and management in South
Africa. Ambio 44: 529-536.
Chapter 4 looks at local knowledge, perceptions and practices regarding Prosopis across
multiple stakeholder groups. It identifies the benefits and costs of Prosopis, and assesses the
knowledge and willingness of people to manage the species. It also delves into the level of
understanding of current management practices and the factors that shape the knowledge,
perceptions and actions of different stakeholders. Results from this chapter highlight that
there is currently wide-scale private management of Prosopis, however, further management
is needed based on large social and economic costs arising from these invasions.
Chapter 5: Use of non-timber forest products from invasive alien Prosopis species
(mesquite) and native trees in South Africa: Implications for management
Reference: Shackleton, R.T., Le Maitre, D.C., van Wilgen, B.W. and Richardson, D.M. 2015.
Use of non-timber forest products from invasive alien Prosopis species (mesquite) and native
trees in South Africa: Implications for management. Forest Ecosystems 2:16 DOI
10.1186/s40663-015-0040-9.
This chapter examines the relative use, at a household level, of raw materials from Prosopis
compared to those provided by co-occurring native tree species. It highlights that the relative
importance of Prosopis is low and that use is declining, suggesting that control measures to
reduce the extent of Prosopis would be acceptable.
Chapter 6: Identifying barriers to effective management of widespread invasive alien
trees: Prosopis species (mesquite) in South Africa as a case study
This chapter was submitted to Global Environmental Change on 7 September 2015
Chapter 6 explores the barriers that affect the management of Prosopis in South Africa, and
the responses that could be used to improve management. Over 100 barriers were identified,
including social, ecological and economic factors. It also contrasts the differences between
barriers identified by different stakeholders, highlighting the fact that different stakeholders
have very different views on the goals of management. These barriers were used to guide the
development of the national strategy and prioritisation plans that are described in Chapter 7.
Chapter 7: Strategic planning and prioritisation for the management of a widespread
invasive tree (Prosopis: mesquite) in South Africa
This chapter is intended for submission to Ecosystem Services
Stellenbosch University https://scholar.sun.ac.za
7
Chapter 7 produces strategic management and prioritisation plans for Prosopis in South
Africa. It combines information and insights from the preceding chapters and draws
additional insights from workshops and questionnaires. Decision trees were used to spatially
assign management approaches (prevention, eradication, containment and asset protection) to
particular areas, and multi-criteria decision making analysis was used to prioritise assets that
need to be protected. These assets were, in order of importance, water, and biodiversity and
to maintain agricultural and rangeland potential. The chapter presents a strategy to guide the
management of Prosopis in South Africa and highlights needs and outcomes for
management.
Additional outcomes: Stakeholder involvement: making strategies workable: future-
science and society
An article in the popular science magazine Quest also emerged from the research conducted
for this thesis. This popular article, co-authored with Dr Ana Novoa, looked at the importance
of involving stakeholders in invasive species research and management using studies on
Prosopis and cacti as case studies. This article is included as an appendix to the thesis.
Novoa, A. and Shackleton, R.T. 2015. Stakeholder involvement: making strategies workable:
future-science and society. Quest 11: 54-56.
Stellenbosch University https://scholar.sun.ac.za
8
Chapter 1: Prosopis: A global assessment of the biogeography, benefits,
impacts and management of one of the world’s worst woody invasive plant
taxa
This chapter was published in AoB Plants
Reference: Shackleton R.T., Le Maitre, D.C., Pasiecznik. N.M. and Richardson, D.M. 2014.
Prosopis: A global assessment of the biogeography, benefits, impacts and management of
one of the world’s worst woody invasive plant taxa. AoB Plants 6:plu027 doi:
10.1093/aobpla/plu027.
(Please use the following link http://aobpla.oxfordjournals.org/content/6/plu027.full to access
appendices)
Abstract
Invasive species cause ecological, economic and social impacts and are key driver of global
change. This is the case for the genus Prosopis (mesquite; Fabaceae) where several taxa are
among the world’s most damaging invasive species. Many contentious issues (“conflicts of
interest”) surround these taxa, and management interventions have not yet sustainably
reduced the negative impacts. There is an urgent need to better understand the factors that
drive invasions and shape management actions, and to compare the effectiveness of different
management approaches. This paper presents a global review of Prosopis, focussing on its
distribution, impacts, benefits and approaches to management. Prosopis has been introduced
to 129 countries globally and many more countries are climatically suitable. All areas with
naturalised or invasive Prosopis species at present are potentially suitable for more taxa and
many Asian and Mediterranean countries with no records of Prosopis are bioclimatically
suitable. Several Prosopis species have substantial impacts on biodiversity, ecosystem
services, and on local and regional economies in their native and even more so in their
invasive ranges; others provide multiple benefits to local communities. Management efforts
are underway in only a small part of the invaded range. Countries where more research has
been done are more likely to implement formal management than those where little published
research is available. Management strategies differ among countries; developed nations use
mainly mechanical and chemical control whereas developing nations tend to apply control
through utilisation approaches. A range of countries are also using biological control. Key
gaps in knowledge and promising options for management are highlighted.
1.1 Introduction
The increased movement of humans around the world has facilitated transportation of many
species to environments far from their native ranges. This has been done purposefully – to
introduce new crops, horticultural and forestry species – and accidentally, for example as
weed seed in grain shipments (Mack, 2003). These introductions have led to the rise of
biological invasions which cause substantial ecological, social and economic impacts, and are
one of the key drivers of global change (Vitousek et al. 1997; Pimentel et al. 2000). However,
many alien species have been embraced by humans and are crucial for local livelihoods and
Stellenbosch University https://scholar.sun.ac.za

9
national economies through the goods and services they provide (Shackleton et al. 2007; Kull
et al. 2011; van Wilgen et al. 2011).
It is important to understand the dynamics of invasive species to reduce their negative
impacts and maximize their benefits, but frameworks linking theory and management for
biological invasions are lacking (Hulme, 2003; Wilson et al. 2014). Management is
inefficient in many areas due to lack of knowledge on key aspects of the invasive species. It
is crucial to understand the reasons for introductions, uses (benefits), costs, ecology and
scales of invasions and to elucidate perceptions and potential contentious issues when
creating sustainable management plans (Kull et al. 2011; van Wilgen and Richardson, 2014;
Wilson et al. 2014). This is true for invasive species in the genus Prosopis.
Taxa of Prosopis (mesquite; Fabaceae) occur in most of the world’s hot arid and semi-arid as
native or introduced species (Pasiecznik et al. 2001). The genus Prosopis as described by
Burkart (1976) consists of 44 species. They have been introduced globally and have become
naturalised or invasive in many places (Rejmánek and Richardson, 2013). Several Prosopis
species are also ‘weedy’ in parts their native ranges (Pasiecznik et al. 2001). In this paper we
define native species as those whose presence in an area is not attributable to introduction by
humans (this includes species that have spread into areas without assistance from humans by
overcoming biogeographic barriers). Alien taxa are those whose presence in an area is
attributable to introduction by humans. Naturalised taxa are alien taxa that are self-sustaining.
Invasive taxa are naturalized taxa that have spread substantially from introduction sites
(further details in Pyšek et al. 2004). We define ‘weedy’ taxa as native taxa that have
increased in abundance and/or geographic range in their native ranges.
Numerous Prosopis taxa are recognised as major invaders across large parts of the world
(Pasiecznik et. 2001; Brown et al. 2004). “Prosopis” is listed as one the 20 weeds of national
significance in Australia and taxa in the genus are declared as major invasive species in
Ethiopia, India, Kenya and South Africa, and Sudan is advocating for its eradication
(Australian Weeds Committee, 2012; FAO, 2006; Low, 2012; van Wilgen et al. 2012).
Factors that make many Prosopis species successful invaders include the production of large
numbers of seeds that remain viable for decades; rapid growth rates; an ability to coppice
after damage (Felker, 1979; Shiferaw et al. 2004); root systems which allow them to
efficiently utilise both surface and ground water (to depths of more than 50m) (Nilsen et al.
1983; Dzikiti et al. 2013); and allelopathic and allelochemical effects on other plant species
(Elfadl and Lukkanen, 2006). Many Prosopis species can also withstand climatic extremes
such as very high temperatures and low rainfall, and they are not limited by alkaline, saline or
unfertile soils (Pasiecznik et al. 2001; Shiferaw et al. 2004). Interspecific hybridization also
enhances invasiveness in many introduced regions (Zimmermann, 1991).
Prosopis invasions generate environmental, social and economic benefits and as well as harm
(Chikuni et al. 2004; Geesing et al. 2004; Wise et al. 2012). This has led to contentious issues
surrounding the genus (Richardson, 1998b; van Wilgen and Richardson, 2014). Some
advocates promote it as a ‘wonder plant’ while others call for its eradication, or contrast its
positive and negative aspects, e.g. ‘Boon or bane’ (Tiwari, 1999), ‘Pest or providence, weed
Stellenbosch University https://scholar.sun.ac.za
10
or wonder tree?’ (Pasiecznik, 1999), ‘Invasive weed or valuable forest resource?’
(Pasiecznik, 2002). Contrasting views, contradictory perceptions and unclear policies are
limiting options for constructive dialogue between different parties. This is exacerbated by
problems in identifying and differentiating morphologically similar species, and by a general
lack of knowledge on the distribution, scale of invasion, benefits, impacts and effective
management approaches. Furthermore, many different approaches for managing Prosopis
have been tried in different situations, without a thorough evaluation of the relative
effectiveness of the methods. The Food and Agricultural Organization has called for a sound,
unbiased global overview of Prosopis to act as a prerequisite for the holistic management of
the genus (FAO, 2006). Such reviews have been useful for guiding and prioritising
management and improving knowledge in other groups of woody invasive plants (Richardson
and Rejmánek, 2004; Griffin et al. 2011; Kull et al. 2011; Richardson and Rejmánek, 2011;
Wilson et al. 2011).
The aims of this paper are thus to: (a) contrast benefits and costs of invasive Prosopis; (b)
update knowledge on Prosopis occurrence and introductions globally and highlight the
potential range expansion of Prosopis; (c) elucidate ecological, economic and social factors
that shape attempts at managing Prosopis; (d) compare and contrast the effectiveness of
different management approaches in different regions; and (e) identify priorities for research
and policy development. We review the literature and collate data from many sources. Details
on the approach for the literature review, approaches used for statistical analyses and climate
matching are provided in ([SUPPORTING INFORMATION - File 1]).
1.2 Benefits and costs
1.2.1 Benefits, costs and invasiveness of different species
Prosopis provides benefits and generates costs which have led to contentious issues
surrounding the genus (Figure 1.1). The ‘usefulness’ of Prosopis has led to the large-scale
introduction of five species in particular (P. chilensis, P. glandulosa, P. juliflora, P. pallida
and P. velutina) and the subsequent naturalisation and invasion of these taxa and their hybrids
leading to the provision of benefits and costs in their new ranges [SUPPORTING
INFORMATION, File 2]. Although P. pallida is invasive in many areas (Rejmánek and
Richardson, 2013) it appears to be less aggressive than some other species (Pasiecznik et al.
2006).
Stellenbosch University https://scholar.sun.ac.za

11
Figure 1.1: Costs and benefits of introduced Prosopis species: (a) Invasive Prosopis
stand altering hydrology in Loeriesfontein, South Africa; (b) Cleared Prosopis in the
foreground and uncleared in the background illustrating impenetrable thickets, loss of
land, loss of grazing potential and the effort needed for its control in Kenhardt, South
Africa; (c) Loss of access to a barn and encroachment of fields in Calvinia, South
Africa; (d) The death of a native tree (Searsia lancea) due to competition from
Prosopis in Kenhardt, South Africa; (e) The effects of Prosopis pods on a goat’s teeth
in Kenya; (f) Prosopis thorns that cause tyre damage and injure humans and livestock;
(g) Prosopis causing loss of topsoil and erosion in Prieska, South Africa; (h) ‘Manna’
– a blood sugar medicine made from Prosopis in South Africa
(www.mannaplus.co.za); (i) Food products made from Prosopis in Peru; (j) Timber
from Prosopis used to make furniture in Kenya; (k) Young boy collecting Prosopis
pods to feed livestock in Askham, South Africa; (l) Prosopis used for shade and
ornamentation in Askham, South Africa; (m) Prosopis used fuel in Kenhardt, South
Africa; (n) A bee hive placed in an invasive Prosopis stand Calvinia, South Africa.
Photos: S. Choge (j); G. Cruz (i); P. Manudu (e, f); R. Shackleton (a, b,c, d, g, k, l, m,
n).
Several species are also weedy and thus provide both benefits and costs in their native ranges
(P. affinis, P. caldenia, P. campestris, P. chilensis, P. cineraria, P. farcta, P. glandulosa P.
hassleri, P. humilis, P. juliflora P. kuntzei, P. nigra, P. pubescens, P. ruscifolia, P.
Stellenbosch University https://scholar.sun.ac.za

12
strombulifera P. tamarugo, P. velutina) [SUPPORTING INFORMATION, File 2]. At least
19 (invasive and weedy) of the 44 species in the genus are known to generate benefits and
costs with the rest being only beneficial. The invasiveness and potential negative impacts of
many Prosopis species is still unknown, as only a handful have been introduced.
1.2.2 Uses/benefits
Prosopis species have been used for a variety of products for more than 5000 years in their
native ranges (Pasiecznik et al. 2001). The numerous goods and services provided by
Prosopis have led to global introductions and have made some species important for local
communities. Prosopis is commonly used for fuel, fodder, windbreaks, shade, construction
materials and soil stabilisation through its invasive ranges in Africa and Asia (Pasiecznik et
al. 2001; Wise et al. 2011). In some areas the benefits from Prosopis are, or were, regarded as
a key income source for many households. In one village in Malawi, 44% of people relied on
Prosopis products as a primary or supplementary source of income (Chikuni et al. 2004).
Communities in Kenya have benefited greatly from the sale charcoal and Prosopis pods for
fodder, boosting the local economy in some areas by US$ 1.5 million per year (Choge et al.
2012). In India, Prosopis provides up to 70% of fuelwood needs for local households in
some dry region villages (Pasiecznik et al. 2001).
Although utilisation is most common in rural settings to sustain local livelihoods, Prosopis
products are also exploited on a large scale by private companies. In South Africa, pods are
collected to produce organic medicines (“manna”) which are said to have properties that
stabilise blood sugar levels in humans. This company is making profits of US$100,000 per
annum and potential increase profits ten-fold if the product is marketed internationally (Wise
et al. 2012). A company in Brazil, Riocon, has an annual turnover of US$6 million a year
from the sale of Prosopis pod flour for animal feeds (A. Davi, Ricocon, pers. comm.).
1.2.3 Negative impacts/costs
Prosopis invasions also have a variety of negative social, ecological and economic impacts
(Figure 1.1 and 1.2). They alter ecosystem services such as water supply, hydrological
functioning, grazing potential and soil quality (DeLoach, 1984; Bedunah and Sosebee, 1986;
Archer, 1989; Le Maitre et al. 2000; van Klinken et al. 2006; Ndhlovu et al. 2011; Nie et al.
2012; Dzikiti et al. 2013;). Native biodiversity in many parts of the world has also been
negatively impacted by invasive Prosopis species (Steenkamp and Chown, 1996; Dean et al.
2002; El-Keblawy and Al-Rawi, 2007; Belton, 2008; Kaur et al. 2012).
Stellenbosch University https://scholar.sun.ac.za
13
Figure 1.2: Cause-and-effect network diagram showing the negative effects of
Prosopis invasions and management options that can be used to target each stage of
invasion.
Local communities in Kenya, Sudan, Eritrea, Malawi and Pakistan noted a range of negative
consequences arising from invasive Prosopis (Choge et al. 2002; Chikuni et al. 2004;
Mwangi and Swallow, 2005; Laxén, 2007; Bokrezion, 2008; Kazmi et al. 2009). These
included, effects on livestock health, Prosopis thorns causing tyre punctures and flesh
wounds, dense thickets reducing access to water points, roads, infrastructure and agricultural
and range lands, drying up of water sources, reducing natural forest cover and the services
from these forests, as well as providing refuge for thieves.
In many parts of Africa Prosopis invasions are a leading cause of detrimental impacts on
local community structure and functioning, leading to an increase in their vulnerability. This
Stellenbosch University https://scholar.sun.ac.za

14
includes the potential loss of land rights for local livestock herders in Mali and violent
conflict over limited natural resources between neighbouring communities in Ethiopia and
Kenya (Centre for Sustainable Development Initiatives, 2009; Djoudi et al. 2011; Stark et al.
2011). One Kenyan community has even taken the FAO and the Kenyan government to court
over the harm created by the introduction of Prosopis (Pasiecznik et al. 2006a). Native weedy
Prosopis taxa are also estimated to cause a loss of US$ 200-500 million per annum to the
livestock industry in the USA (DeLoach, 1984). In South Africa costs of managing Prosopis
invasions are substantial averaging $ 35.5 million per annum (van Wilgen et al. 2012).
1.2.4 Benefits vs. costs and the dimensions of contentious issues
Perceptions and benefits and costs of invasive alien species are strongly influenced by
invasion abundance (Binggeli, 2001; Shackleton et al. 2007). As abundance increase
associated costs rise and benefits fall due to issues such as resource accessibility (Wise et al.
2012). In India, Prosopis was initially seen as beneficial, but over time the negative
consequences became more apparent, leading to increasingly negative perceptions of the
plant from some quarters (Pasiecznik et al. 2001). A similar situation arose in Kenya where,
as Prosopis became invasive, it was described as a ‘bad omen’ by some local people (Choge
and Chikamai, 2004) and more than 65 % of people in three villages mentioned that their
lives would have been better off if Prosopis was never introduced (Maundu et al. 2009). In
Sudan, over 90 % of livestock farmers viewed Prosopis as a problem as it became more
widespread (Elsidig et al. 1998).
In many areas, invasive Prosopis trees do not sustain their full use potential due to
intraspecific competition in dense stands which, generally, form over time. In such cases
relatively few pods are produced for fodder and human consumption and dense invasive
stands become impenetrable for humans and livestock making utilisation of resources
difficult (Chikuni et al. 2004; Mwangi and Swallow, 2005). Wise et al. (2012) show that net
economic benefits decrease as invasion densities increase in South Africa. They predict that
the net cost of having Prosopis in the country will become negative in 4-20 years depending
on future rates of spread. A framework by Shackleton et al. (2007) also shows that useful
invasive aliens initially have high benefits, but as invasion densities increase, costs rise which
lead to an increase in human vulnerability. This raises questions about the introduction of
‘miracle’ species in the past such as Acacia, Leucaena and Prosopis because the adverse
impacts tend to exceed the benefits as the invasions progress, if left unmanaged (Pasiecznik,
2004, de Wit et al. 2001; Wise et al. 2011; Low, 2012). As well as and the continued
promotion of invasive alien species like Prosopis for biofuels today (Witt, 2010; Naseeruddin
et al. 2013).
The fact that the detrimental effects emerge only after invasions have reached unmanageable
levels exacerbates contentious issues surrounding invasive species and may delay
management decisions, in many cases restricting the implementation of effective
management. There have also been conflicts of interest regarding which form of management
to implement – how best to preserve, exploit and even enhance benefits while reducing
negative impacts of Prosopis invasions (Zimmermann 1991).
Stellenbosch University https://scholar.sun.ac.za

15
1.3 Introductions, current and potential distributions of Prosopis
1.3.1 Introductions
Dates and sources of introduction: Intercontinental introductions of Prosopis species have
occurred over several centuries (Figure 1.3). The first reports were of the introduction of
Prosopis species from the Americas to Senegal in 1822, and to Australia, Hawaii, India,
Philippines, South Africa, Sri Lanka and Sudan in the late 1800s and early 1900s (Pasiecznik
et al. 2001). However, most of the widespread introductions were made into Africa and Asia
between the 1970s and 1990s (Figure 1.3) as part of reforestation programmes after major
droughts in Sahel. Many areas, notably India, South Africa and Sudan, have had multiple
introductions over many decades. There is no evidence of new introductions post 1990 with
the last recorded introductions being in Malawi and Burkina Faso in 1986 (Ræbild et al.
2003; Chikuni et al., 2004). There have, however, been recent calls for the introduction of
known invasive Prosopis species to new locations. Hasan and Alam (2006) recommend that
the planting of Prosopis would be beneficial to combat degradation in Bangladesh. Pravesh
(2011) proposed using Prosopis to stabilise dunes to protect important biologically diverse
wetlands and mangrove forests in Iran. The promotion of biofuels could also lead to the
spread of invasive woody species such as Prosopis (Witt, 2010). There has also been
extensive natural spread (commonly by means of flood water) and human assisted spread
(livestock trade) into new areas within countries where it is already naturalised and invasive
(Van den Berg, 2010).
Figure 1.3: Time scale of all Prosopis introductions globally (n = 82 known species-
country introduction dates)
Seed introductions have come from both native populations and from naturalised and
invasive populations in countries where Prosopis was introduced previously. However, the
original sources of seed and dates for introductions to many countries are poorly documented.
Seed introduced to Hawaii came from a tree in France with a speculated provenance in Brazil
(Pasiecznik et al. 2001) and P. pallida introduced to Australia came from Hawaii (Pasiecznik
et al. 2001). South Africa had multiple introductions of many species and seed was most
likely introduced from native ranges in Chile, Honduras, Mexico and USA (Zimmerman,
Stellenbosch University https://scholar.sun.ac.za
16
1991). Seed from naturalised populations in South Africa was introduced into Egypt and seed
introduced into Sudan came from South Africa and Egypt (Pasiecznik et al. 2001). The
provenance of early Prosopis introductions to India is uncertain (likely Mexico or Jamaica);
later introductions came from Argentina, Australia, Mexico, Peru and Uruguay (Pasiecznik et
al. 2001).
Reasons for introduction: Most introductions of Prosopis were intentional, although there
have been accidental cross-border introductions between neighbouring counties. Prosopis
was introduced for many reasons, including: to provide fodder and shade in the arid areas of
South Africa and Australia; for dune stabilization, afforestation and fuel wood supply in
Sudan; for live fencing in Malawi; initially to rehabilitate old quarries and later for
afforestation and the provision of fuelwood and fodder in Kenya; for fuelwood production
and rehabilitating degraded soil in India; for local greening, ornamental cultivation and soil
stabilization in many Middle Eastern countries and for vegetation trials in Spain
(Zimmermann, 1991; Ghazanfar, 1996; Pasiecznik et al. 2001; Choge et al. 2002; Chikuni et
al. 2004; Elfadl and Luukkaen 2006; van Klinken et al. 2006; Laxén, 2007; N. Pasiecznik and
E. Peñalvo López, unpubl. data). Prosopis was possibly first introduced unintentionally into
Botswana, Nigeria and Yemen through livestock trading with neighbouring countries
(Pasiecznik et al. 2001; Geesing et al. 2004).
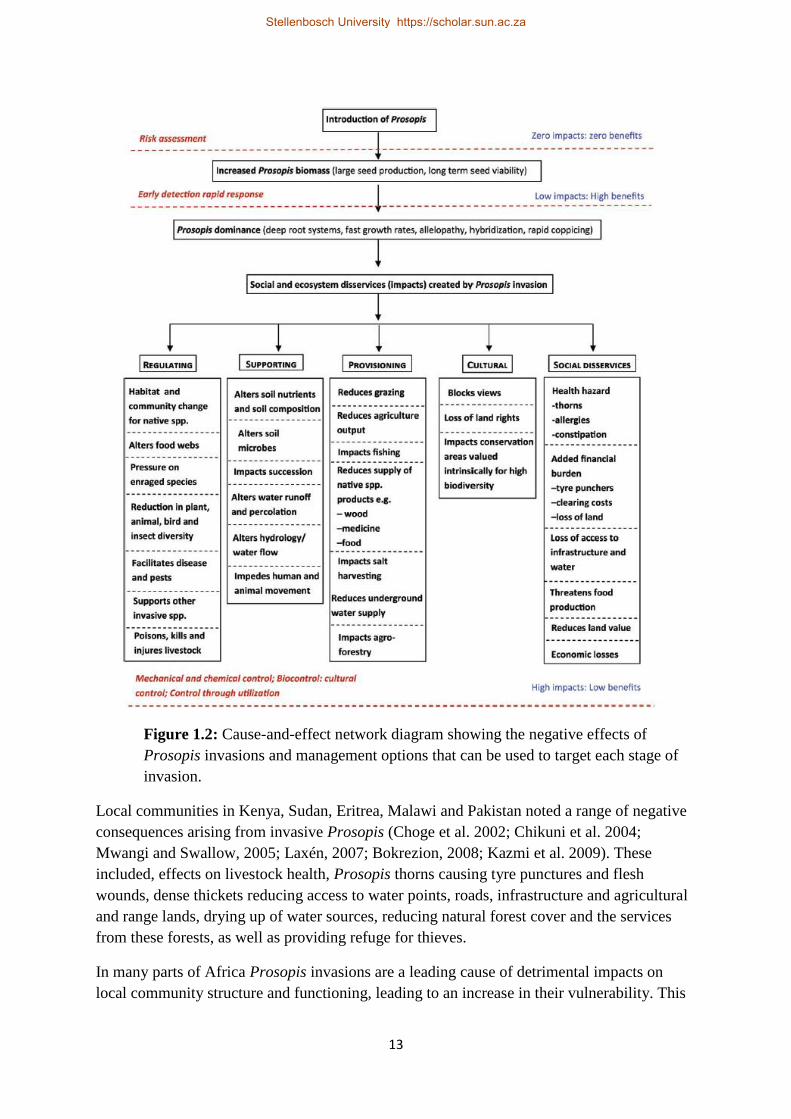
Figure 1.4: Classification of all records of introduced Prosopis species (236
introductions in 103 countries); classification of “naturalised” and “invasive” follow
the criteria of Pyšek et al. (2004).
Fate of introductions: Of all the introductions of Prosopis species reviewed here, 79% have
led to naturalisation, of which 38% have become invasive (Figure 1.4). No information on
naturalisation is available for 8% of records, and 2% of introductions are known to have
failed (i.e. did not survive planting). Currently 12% of introductions are only recorded as
“planted”.
Stellenbosch University https://scholar.sun.ac.za

17
1.3.2 Distribution
Prosopis currently occurs naturally or as an introduced species in at least 129 mainland and
island countries and territories (Figure 1.5; [SUPPORTING INFORMATION - File 2]). This
includes the Caribbean islands (18) and mainland counties (19) in the Americas (excluding
Canada, Suriname and Guyana), 40 countries in Africa, 26 in Asia, 4 in Europe, 24
island/atolls countries in the Pacific, Atlantic and Indian Oceans and Australia.
Figure 1.5: The global distribution of Prosopis species: a) species diversity in
countries with native taxa; b) species diversity of taxa recognized as being weedy
within their native ranges; c) species richness of naturalised and invasive Prosopis
taxa (following the criteria of Pyšek et al. 2004) and (d) potential Prosopis species
richness based on climatic suitability.
The last comprehensive global review of Prosopis distribution listed the presence of taxa in
93 mainland and island/atoll countries (Pasiecznik et al. 2001). It is unlikely that Prosopis has
been potentially introduced into more places in the 13 years since that review was
undertaken, but rather that data availability has increased in the intervening period or that
there has been unintentional spread e.g. into Tanzania. Of the 129 countries, 26 have only
native species, 64 have only introduced Prosopis species, and 39 have both native and
introduced species. Prosopis is weedy in 38% of countries where it occurs naturally and 38%
of species in the genus are currently categorised as weedy in their native ranges. The
distribution and scale of invasions in countries with invasive Prosopis are not well known,
with only 13 % of countries having detailed distribution or percentage cover data and not just
records of occurrence.
Stellenbosch University https://scholar.sun.ac.za
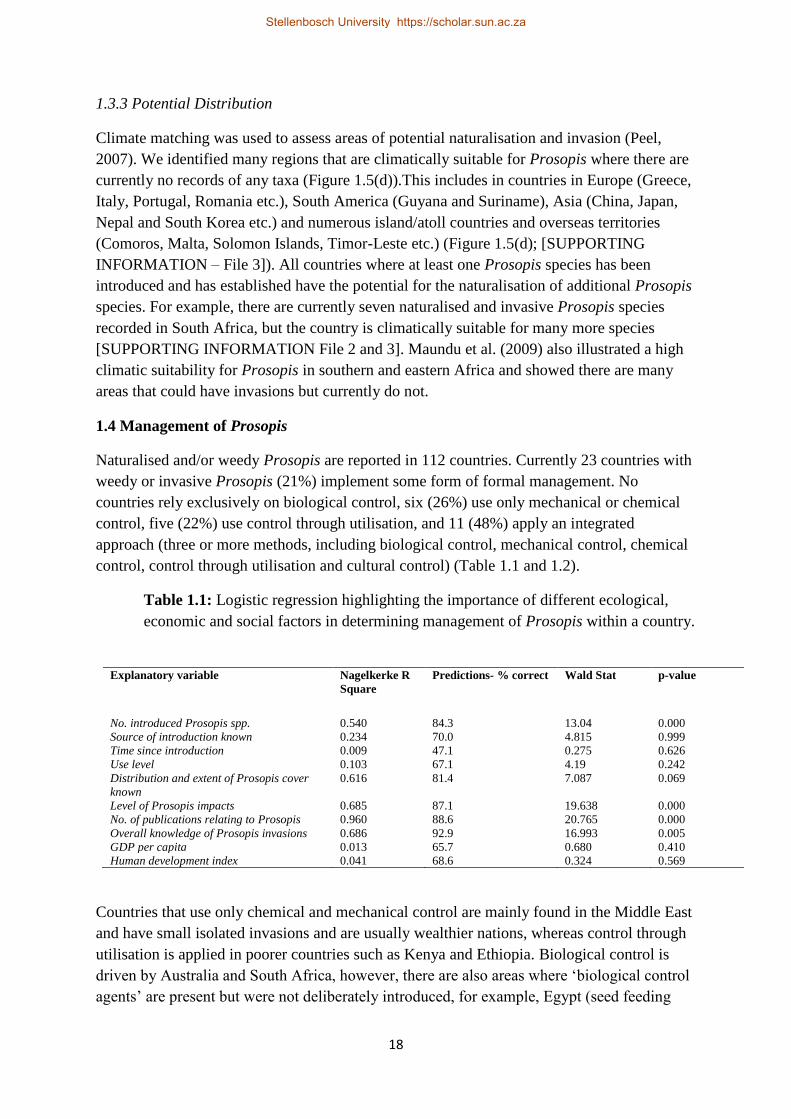
18
1.3.3 Potential Distribution
Climate matching was used to assess areas of potential naturalisation and invasion (Peel,
2007). We identified many regions that are climatically suitable for Prosopis where there are
currently no records of any taxa (Figure 1.5(d)).This includes in countries in Europe (Greece,
Italy, Portugal, Romania etc.), South America (Guyana and Suriname), Asia (China, Japan,
Nepal and South Korea etc.) and numerous island/atoll countries and overseas territories
(Comoros, Malta, Solomon Islands, Timor-Leste etc.) (Figure 1.5(d); [SUPPORTING
INFORMATION – File 3]). All countries where at least one Prosopis species has been
introduced and has established have the potential for the naturalisation of additional Prosopis
species. For example, there are currently seven naturalised and invasive Prosopis species
recorded in South Africa, but the country is climatically suitable for many more species
[SUPPORTING INFORMATION File 2 and 3]. Maundu et al. (2009) also illustrated a high
climatic suitability for Prosopis in southern and eastern Africa and showed there are many
areas that could have invasions but currently do not.
1.4 Management of Prosopis
Naturalised and/or weedy Prosopis are reported in 112 countries. Currently 23 countries with
weedy or invasive Prosopis (21%) implement some form of formal management. No
countries rely exclusively on biological control, six (26%) use only mechanical or chemical
control, five (22%) use control through utilisation, and 11 (48%) apply an integrated
approach (three or more methods, including biological control, mechanical control, chemical
control, control through utilisation and cultural control) (Table 1.1 and 1.2).
Table 1.1: Logistic regression highlighting the importance of different ecological,
economic and social factors in determining management of Prosopis within a country.
Explanatory variable Nagelkerke R
Square
Predictions- % correct Wald Stat p-value
No. introduced Prosopis spp. 0.540 84.3 13.04 0.000
Source of introduction known 0.234 70.0 4.815 0.999
Time since introduction 0.009 47.1 0.275 0.626
Use level 0.103 67.1 4.19 0.242
Distribution and extent of Prosopis cover
known
0.616 81.4 7.087 0.069
Level of Prosopis impacts 0.685 87.1 19.638 0.000
No. of publications relating to Prosopis 0.960 88.6 20.765 0.000
Overall knowledge of Prosopis invasions 0.686 92.9 16.993 0.005
GDP per capita 0.013 65.7 0.680 0.410
Human development index 0.041 68.6 0.324 0.569
Countries that use only chemical and mechanical control are mainly found in the Middle East
and have small isolated invasions and are usually wealthier nations, whereas control through
utilisation is applied in poorer countries such as Kenya and Ethiopia. Biological control is
driven by Australia and South Africa, however, there are also areas where ‘biological control
agents’ are present but were not deliberately introduced, for example, Egypt (seed feeding
Stellenbosch University https://scholar.sun.ac.za

19
beetles -Coleoptera and Burchidae), Sudan and Yemen (Algarobis prosopis) (Delobel and
Fediere, 2002; Al-shurai and Labrada, 2006; Babiker, 2006). In Yemen there is no evidence
that the non-native A. prosopis feeds on the native Prosopis cineraria (Al-shurai and Labrada,
2006). There are concerns, however, that introduced insects could affect less invasive P.
pallida populations in these areas which are utilised by local communities (Pasiecznik et al.
2006). Another view is that any effect of such insects could improve the usefulness of less
invasive taxa by reducing seed production and therefore potential invasiveness and could lead
to less dense stands with larger trees and greater pod production (Zachariades et al. 2011).
Logistic regressions were run to determine what factors underpin whether a country has
formal management of Prosopis taking place or not. The degree of understanding of Prosopis
invasions impacts and ecology (besides residence time - the time since introduction) is a
better determinant of whether or not a country will manage Prosopis, than the socio-
economic conditions of the country (Table 1.1). The stepwise regression reviled that level of
impacts and overall knowledge on Prosopis invasions are key determinates of the presence of
management within a country or not. Having knowledge on invasion potential/risk either
allows countries to act timeously or to develop protocols to guide management based on an
overall understanding of impacts, ecology, uses and special scales. Having a good
understanding surrounding Prosopis invasions also helps to highlight the need for
management, and subsequent management also stimulates the accumulation of further
knowledge on invasions. Residence time might not be a significant predictor, because in
wetter areas invasions tend to establish much faster than in drier areas (Table 1.1). Also, all
countries have had Prosopis long enough to have naturalised and invasive populations
(Zimmermann et al. 2006).Simple socio-economic variables are poor predictors of the
existence of management strategies as there is evidence of management in countries at all
levels development (Table 1.1). Many of the poorer countries receive foreign aid to
implement and run management programs, at least at the outset.
Stellenbosch University https://scholar.sun.ac.za
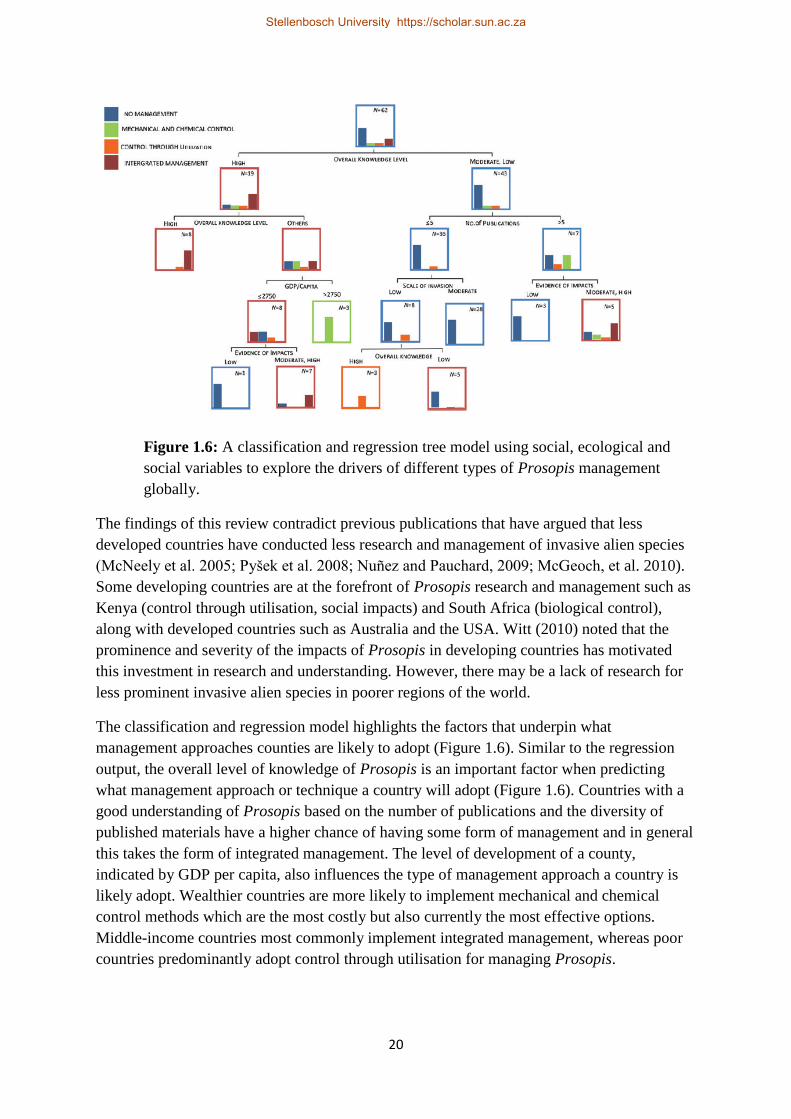
20
Figure 1.6: A classification and regression tree model using social, ecological and
social variables to explore the drivers of different types of Prosopis management
globally.
The findings of this review contradict previous publications that have argued that less
developed countries have conducted less research and management of invasive alien species
(McNeely et al. 2005; Pyšek et al. 2008; Nuñez and Pauchard, 2009; McGeoch, et al. 2010).
Some developing countries are at the forefront of Prosopis research and management such as
Kenya (control through utilisation, social impacts) and South Africa (biological control),
along with developed countries such as Australia and the USA. Witt (2010) noted that the
prominence and severity of the impacts of Prosopis in developing countries has motivated
this investment in research and understanding. However, there may be a lack of research for
less prominent invasive alien species in poorer regions of the world.
The classification and regression model highlights the factors that underpin what
management approaches counties are likely to adopt (Figure 1.6). Similar to the regression
output, the overall level of knowledge of Prosopis is an important factor when predicting
what management approach or technique a country will adopt (Figure 1.6). Countries with a
good understanding of Prosopis based on the number of publications and the diversity of
published materials have a higher chance of having some form of management and in general
this takes the form of integrated management. The level of development of a county,
indicated by GDP per capita, also influences the type of management approach a country is
likely adopt. Wealthier countries are more likely to implement mechanical and chemical
control methods which are the most costly but also currently the most effective options.
Middle-income countries most commonly implement integrated management, whereas poor
countries predominantly adopt control through utilisation for managing Prosopis.
Stellenbosch University https://scholar.sun.ac.za
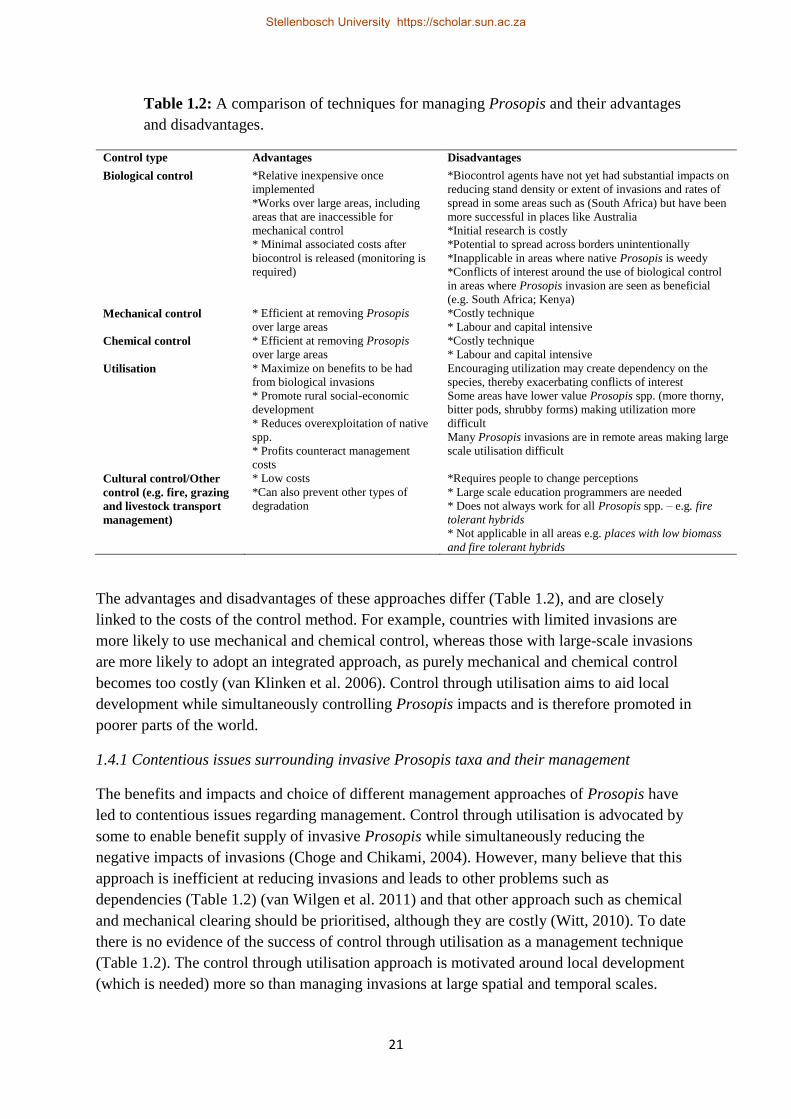
21
Table 1.2: A comparison of techniques for managing Prosopis and their advantages
and disadvantages.
Control type Advantages Disadvantages
Biological control *Relative inexpensive once
implemented
*Works over large areas, including
areas that are inaccessible for
mechanical control
* Minimal associated costs after
biocontrol is released (monitoring is
required)
*Biocontrol agents have not yet had substantial impacts on
reducing stand density or extent of invasions and rates of
spread in some areas such as (South Africa) but have been
more successful in places like Australia
*Initial research is costly
*Potential to spread across borders unintentionally
*Inapplicable in areas where native Prosopis is weedy
*Conflicts of interest around the use of biological control
in areas where Prosopis invasion are seen as beneficial
(e.g. South Africa; Kenya)
Mechanical control * Efficient at removing Prosopis
over large areas
*Costly technique
* Labour and capital intensive
Chemical control * Efficient at removing Prosopis
over large areas
*Costly technique
* Labour and capital intensive
Utilisation * Maximize on benefits to be had
from biological invasions
* Promote rural social-economic
development
* Reduces overexploitation of native
spp.
* Profits counteract management
costs
Encouraging utilization may create dependency on the
species, thereby exacerbating conflicts of interest
Some areas have lower value Prosopis spp. (more thorny,
bitter pods, shrubby forms) making utilization more
difficult
Many Prosopis invasions are in remote areas making large
scale utilisation difficult
Cultural control/Other
control (e.g. fire, grazing
and livestock transport
management)
* Low costs
*Can also prevent other types of
degradation
*Requires people to change perceptions
* Large scale education programmers are needed
* Does not always work for all Prosopis spp. – e.g. fire
tolerant hybrids
* Not applicable in all areas e.g. places with low biomass
and fire tolerant hybrids
The advantages and disadvantages of these approaches differ (Table 1.2), and are closely
linked to the costs of the control method. For example, countries with limited invasions are
more likely to use mechanical and chemical control, whereas those with large-scale invasions
are more likely to adopt an integrated approach, as purely mechanical and chemical control
becomes too costly (van Klinken et al. 2006). Control through utilisation aims to aid local
development while simultaneously controlling Prosopis impacts and is therefore promoted in
poorer parts of the world.
1.4.1 Contentious issues surrounding invasive Prosopis taxa and their management
The benefits and impacts and choice of different management approaches of Prosopis have
led to contentious issues regarding management. Control through utilisation is advocated by
some to enable benefit supply of invasive Prosopis while simultaneously reducing the
negative impacts of invasions (Choge and Chikami, 2004). However, many believe that this
approach is inefficient at reducing invasions and leads to other problems such as
dependencies (Table 1.2) (van Wilgen et al. 2011) and that other approach such as chemical
and mechanical clearing should be prioritised, although they are costly (Witt, 2010). To date
there is no evidence of the success of control through utilisation as a management technique
(Table 1.2). The control through utilisation approach is motivated around local development
(which is needed) more so than managing invasions at large spatial and temporal scales.
Stellenbosch University https://scholar.sun.ac.za

22
There are conflicting views on best management approaches (eradication vs. control through
utilisation) in different villages in Kenya (Mwangi and Swallow, 2005; Njoroge et al. 2012).
Similar cases of contentious issues and conflicts of interest have been seen for other
management approaches such as biological control. In South Africa only seed-feeding beetles
were introduced so that neither the Prosopis trees themselves nor the production of pods
would be harmed (Richardson 1998a) - even though better biological control agents have
been identified that would harm trees and be more effective in reducing invasions
(Zachariades et al. 2011).
1.4.2 Case studies comparing different management approaches
Despite the growing body of research on management options for weedy and invasive
Prosopis stands (van Klinken et al. 2006), there is an ongoing debate about how to effectively
manage large-scale invasions. Different approaches are currently being used to manage
Prosopis, each with their own set of advantages and disadvantages (Table 1.2). The following
case studies were selected as being representative of different management strategies and also
encompass the approaches most commonly employed in countries with different levels of
socio-economic development (developed - Australia; emerging economies - South Africa;
developing - Kenya). The case studies are also characteristic of management strategies driven
and implemented by different stakeholders, e.g. government driven with mainly private
implementation (Australia), mainly government driven and implemented (South Africa) and
government driven with some NGO and international support (Kenya).
Australia: Prosopis has invaded over one million hectares and could potentially spread over
70% of Australia’s land area (Osmond, 2003). Prosopis taxa are considered as one of the 20
worst invasives in Australia, and in accordance with the Weeds Management Act 2001, a
strategic plan has been developed to guide management (Australian Weeds Committee,
2012). Prosopis is a declared weed in all the mainland states and 1 territory in Australia and
have been categorised in accordance to the threats they pose and the corresponding
management responses that need to be implemented (van Klinken and Campbell, 2009). This
includes preventing introductions, trade, sale or movements of Prosopis taxa and the
eradication of small populations and control of large populations (Australian Weeds
Committee, 2012). In general, most landowners use mechanical and chemical control
measures to manage Prosopis. Although control and eradication programmes are primarily
funded by the state, many private land owners also fund management operations. For
example, in Queensland $A 4 million was allocated for Prosopis management by the
government which was supplemented further by over $A 600 000 by landholders between
1995 and 1999 and over $A 2 million was spent on clearing between 2001 and 2005 (Martin
and van Klinken, 2006).
Control of Prosopis first started in 1954 at Mardie Station, Western Australia, and by 1962 a
major reduction in Prosopis density had been achieved. Populations increased again when
funding diminished but in the mid-1970s the allocation of government funding led to
substantial progress with clearing (van Klinken and Campbell, 2009). In other areas of
Western Australia control was improving but after funding lapsed many infestations returned
Stellenbosch University https://scholar.sun.ac.za
23
in 1990s with exceptions of some areas such as Yeeda Station where control has been
successful due to annual monitoring and clearing (van Klinken and Campbell, 2009). In
Queensland substantial funding was invested for clearing in the area around Comongin
Station and by 2005 over 4 000 ha of dense Prosopis stands had been removed (van Klinken
and Campbell, 2009). In northern Queensland research concluded that eradication was
feasible in the region and significant steps have been made towards this goal (van Klinken
and Campbell, 2009). New South Wales and South Australia have similar examples of good
control efforts and others that have had limited success due to a laps in control and
monitoring (van Klinken and Campbell, 2009).
Four biological control agents have been released in Australia: Algarobius bottimeri and A.
prosopis (seed-feeding bruchids), Evippe species (a leaf-tying moth) and Prosopidopsylla
flava (a sap sucker) (van Klinken et al. 2003; van Klinken, 2012). Two have established
widely (A. Prosopis, Evippe species) and the latter has had noticeable impacts on Prosopis
populations through reducing long-term growth rates (van Klinken, 2012). Biological control
in Australia has been more successful than other places like South Africa and the benefit to
cost ratios are positive (0.5), with expectations to increases in the future (Page and Lacy,
2006). The release of more agents is recommended to further improve control (van Klinken et
al. 2003; van Klinken, 2012).
Experiments have shown that some species are highly fire tolerant (especially the hybrids)
which reduces the potential for using fire as a control method in many areas (van Klinken,
2006). Grazing control has also been advised to help prevent establishment and further spread
of Prosopis (Csurhes, 1996), although this approach has had limited success in Argentina and
the USA (Brown and Archer, 1989; Dussart et al. 1998). There are also regulations on the
transport of livestock in areas infested with Prosopis to prevent its spread and accidental
introduction elsewhere in Australia (Australian Weeds committee, 2012). Management policy
is backed up by good legislation; Australia is one of two countries with a national
management strategy. The government has also published many easily accessible documents
on Prosopis management methods to inform landowners regarding control measures, and the
Prosopis strategic plan places a lot of emphasis on educating and making stakeholders aware
of Prosopis invasions and how to manage them (Australian Weeds Committee, 2012). There
have been rewarding examples of control success (van Klinken and Campbell 2009);
although Prosopis populations continue to spread and in many areas and further management
is needed.
South Africa: Prosopis invasions in South Africa cover an estimated 1.8 million ha, are
increasing at 8% per annum (Versfeld et al. 1998; Van den Berg, 2010). They have the
potential to invade between 5 and 32 million ha of South Africa based on climatic suitability -
about a third of the area of the country (Rouget et al. 2004). Prosopis is declared as a
category 3 invasive alien species because it provides benefits and causes harm; this status
means that it is legal to grow Prosopis in demarcated areas once a permit has been issued. A
combination of mechanical, chemical and biological control methods are used to control
Prosopis, mainly by the government-managed Working for Water programme. Three seed-
feeding beetles (Algarobius Prosopis, A. bottimeri and Neltumius arizonensis) were
Stellenbosch University https://scholar.sun.ac.za
24
introduced as biological control agents to try and reduce spread while maintaining its benefits
– with A. bottimeri failing to establish (Zimmermann, 1991; Coetzer and Hoffmann, 1997;
Zachariades et al. 2011). Although biological control is considered the most cost effective
way of managing large-scale invasions of many species, there are many cases where the
agents fail to make a significant impact and Prosopis is one of them (van Wilgen et al. 2012).
The overall return on investment is low compared to biological control programmes for
Opuntia species and Australian acacia species in South Africa (van Wilgen et al. 2012). There
is potential to release more agents, such as the Evippe species which is already successful in
Australia (see above), should the contentious issues surrounding the benefits and costs of
Prosopis be resolved (Zachariades et al. 2011). Prosopis cover increased by approximately
35% between 1996 and 2008, despite the expenditure of R 435.5 million (US$ 42.7 million)
on control over this period. Only 15,100 ha were cleared using mechanical and chemical
control with this substantial budget (van Wilgen et al. 2012), which makes the cost/ha very
expensive (US$ 2,828). The limited success to date may be due to lack of a management
strategy and of prioritisation of management projects (Forsyth et al. 2012). There is need for
researchers, managers and policy makers to agree on new strategies for prioritising areas for
interventions to curb the spread of Prosopis and to ensure that the limited resources are used
effectively (Forsyth et al. 2012). There have been some attempts at controlling Prosopis
through utilisation, but they had no noticeable impacts on invasions, and these initiatives
failed as input and transport costs were too high and financial returns were low (Zimmermann
et al. 2006). South Africa also has many particularly aggressive hybrids that form dense
shrub-dominated stands, which makes the utilisation approach difficult (Zimmermann et al.
2006).
Kenya: Prosopis is estimated to have invaded one million hectares and has the potential to
invade nearly half of Kenya’s surface (Maundu et al. 2009; Witt, 2010). It was declared a
noxious weed in 2008 (Low, 2012). Biological and mechanical control were initially
proposed as the management approach to combat Prosopis invasions, but the government
later opted for a control-by-utilisation approach (Pasiecznik and Felker, 2006b; FAO, 2006).
The Food and Agricultural Organization (FAO), with support from several NGOs, initiated
programmes to manage Prosopis through utilisation. These efforts were continued by the
government’s forestry department and forestry research organisation (KEFRI) following the
end of these projects. Considerable time and effort was taken to build capacity, formulate
good policies, and educate communities to utilise the goods and services from Prosopis
(Pasiecznik et al. 2006a). For example, small-scale utilisation projects were established and a
cookbook using Prosopis flour was created and supplied to communities to promote its use
(Choge et al. 2006; Pasiecznik et al. 2006a). Although there are initial costs for training and
purchasing appropriate small-scale processing machinery are high, they are considered to be
lower than other control approaches (Pasiecznik et al. 2006a). In 2002, trade in Prosopis
goods and services was worth US$ 2,122 per household per year in some villages (Choge et
al. 2002). Ten years later, trade in Prosopis products in four selected areas was estimated to
exceed US1.5 million (Choge et al. 2012). Each tonne of pods that are collected and milled
into flour is estimated to remove approximately two million viable seeds (Pasiecznik et al.
2006a). Changes in legislation, and the promotion of Prosopis use, helped drive the
Stellenbosch University https://scholar.sun.ac.za
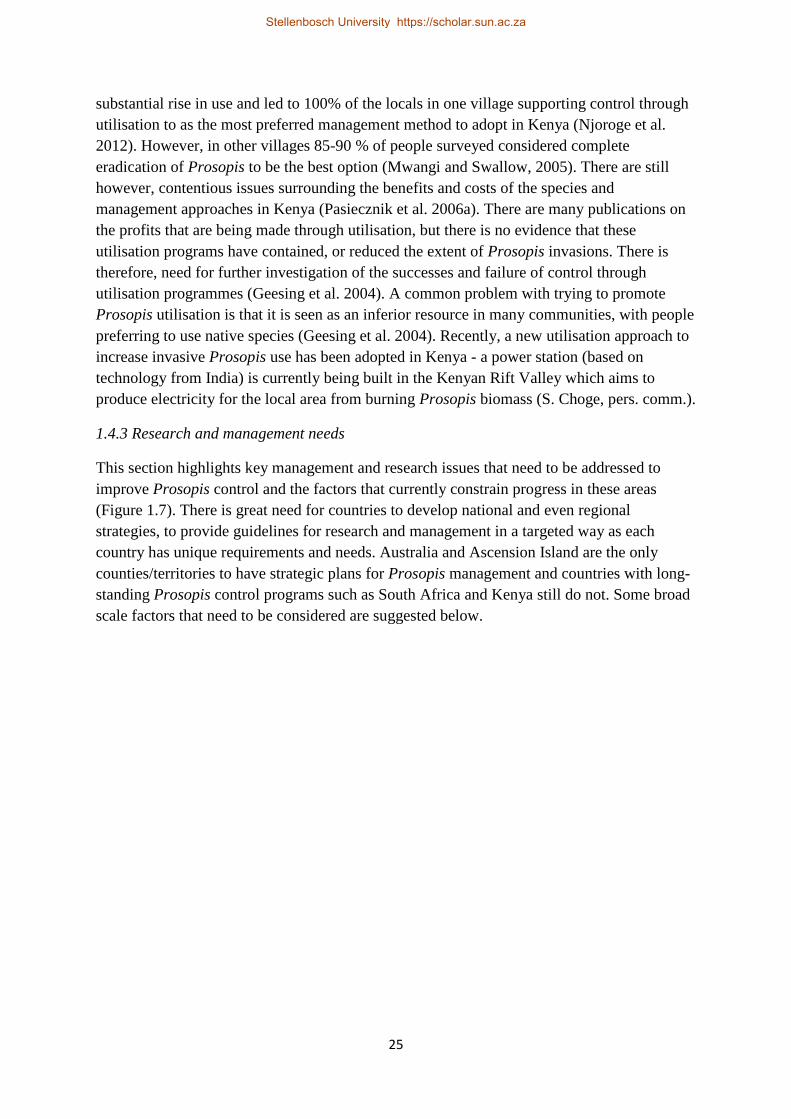
25
substantial rise in use and led to 100% of the locals in one village supporting control through
utilisation to as the most preferred management method to adopt in Kenya (Njoroge et al.
2012). However, in other villages 85-90 % of people surveyed considered complete
eradication of Prosopis to be the best option (Mwangi and Swallow, 2005). There are still
however, contentious issues surrounding the benefits and costs of the species and
management approaches in Kenya (Pasiecznik et al. 2006a). There are many publications on
the profits that are being made through utilisation, but there is no evidence that these
utilisation programs have contained, or reduced the extent of Prosopis invasions. There is
therefore, need for further investigation of the successes and failure of control through
utilisation programmes (Geesing et al. 2004). A common problem with trying to promote
Prosopis utilisation is that it is seen as an inferior resource in many communities, with people
preferring to use native species (Geesing et al. 2004). Recently, a new utilisation approach to
increase invasive Prosopis use has been adopted in Kenya - a power station (based on
technology from India) is currently being built in the Kenyan Rift Valley which aims to
produce electricity for the local area from burning Prosopis biomass (S. Choge, pers. comm.).
1.4.3 Research and management needs
This section highlights key management and research issues that need to be addressed to
improve Prosopis control and the factors that currently constrain progress in these areas
(Figure 1.7). There is great need for countries to develop national and even regional
strategies, to provide guidelines for research and management in a targeted way as each
country has unique requirements and needs. Australia and Ascension Island are the only
counties/territories to have strategic plans for Prosopis management and countries with long-
standing Prosopis control programs such as South Africa and Kenya still do not. Some broad
scale factors that need to be considered are suggested below.
Stellenbosch University https://scholar.sun.ac.za
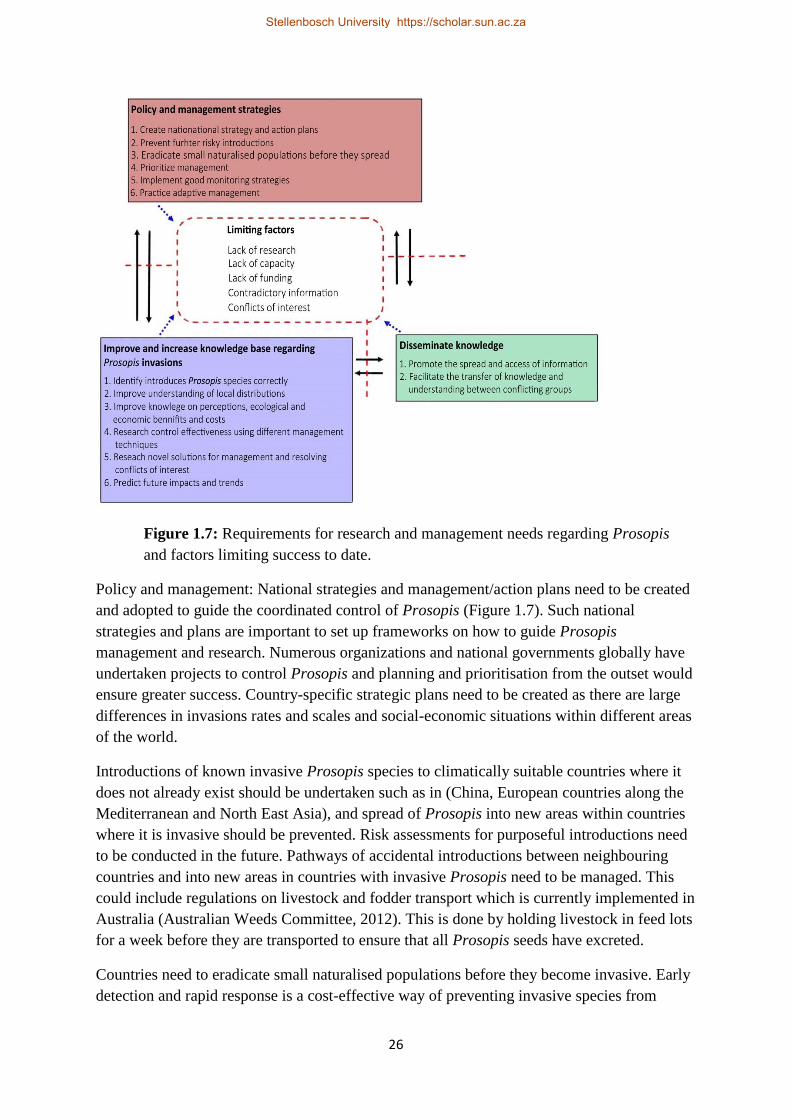
26
Figure 1.7: Requirements for research and management needs regarding Prosopis
and factors limiting success to date.
Policy and management: National strategies and management/action plans need to be created
and adopted to guide the coordinated control of Prosopis (Figure 1.7). Such national
strategies and plans are important to set up frameworks on how to guide Prosopis
management and research. Numerous organizations and national governments globally have
undertaken projects to control Prosopis and planning and prioritisation from the outset would
ensure greater success. Country-specific strategic plans need to be created as there are large
differences in invasions rates and scales and social-economic situations within different areas
of the world.
Introductions of known invasive Prosopis species to climatically suitable countries where it
does not already exist should be undertaken such as in (China, European countries along the
Mediterranean and North East Asia), and spread of Prosopis into new areas within countries
where it is invasive should be prevented. Risk assessments for purposeful introductions need
to be conducted in the future. Pathways of accidental introductions between neighbouring
countries and into new areas in countries with invasive Prosopis need to be managed. This
could include regulations on livestock and fodder transport which is currently implemented in
Australia (Australian Weeds Committee, 2012). This is done by holding livestock in feed lots
for a week before they are transported to ensure that all Prosopis seeds have excreted.
Countries need to eradicate small naturalised populations before they become invasive. Early
detection and rapid response is a cost-effective way of preventing invasive species from
Stellenbosch University https://scholar.sun.ac.za
27
getting out of hand and causing devastating, irreversible impacts in the future. For example,
in Spain, Prosopis has started to show signs of naturalisation at a single location where it was
planted for experiments and eradication attempts now would be most cost effective in the
long run (N. Pasiecznik and E. Peñalvo López, unpubl. data).
There is also an urgent need for managers and researchers to monitor the effectiveness of
control measures. Adaptive management needs to be promoted and applied for controlling
Prosopis invasions where operational success is so far limited, so that the causes of the
failures can be identified and addressed to improve overall control. Managers and researchers
need to collaborate in research to design from the outset successful adaptive management
strategies to be implemented.
Improve knowledge: There are many research questions regarding Prosopis invasions in
many parts of the world that need to be answered to improve management (Figure 1.7). These
include correctly identifying Prosopis species present and gaining consensus on the status of
introduced and weedy species (e.g. following the criteria proposed by Pyšek et al. 2013).
There have been numerous misidentifications of introduced Prosopis species, especially in
Africa. This has caused much taxonomic confusion and contradictions between different
sources of information that are only starting to be clarified. There are also hybridised
populations in many areas where Prosopis been introduced further hindering identification
(Zimmermann, 1991; Pasiecznik et al. 2004). It was recently recognised that P. pallida,
which was seen as not being as invasive as other species, is more widespread than originally
thought as it was misidentified as P. juliflora in Africa (Pasiecznik et al. 2006c). Most species
introduced to Africa were described as P. chilensis, but this is not the case, and accurate
species lists are not available for many African countries like Angola (Pasiecznik et al.,
2004). Molecular methods are useful for clarifying taxonomic issues, especially in areas
where hybridization has taken place. It is important to know what taxa are present for
management, e.g. when looking for biological control agents and understanding ecology and
rates of spread (Pyšek et al. 2013).
There is a need to improve the understanding of Prosopis distribution and population sizes in
introduced ranges to guide management planning (Wilson et al. 2014). As indicated earlier,
only 13% of countries with naturalised and invasive Prosopis have maps or detailed records
of occurrence and scale of invasion. No information is available on the scale of Prosopis
invasions on any of the Pacific (besides Hawaii), Indian Ocean or Caribbean Islands. Only a
few African countries have a good understanding of the scale of invasions and, in Asia,
information on the distribution of invasive Prosopis are only available for India and Pakistan.
Such knowledge is essential for planning and implementing management. Bioclimatic
mapping at board local scales is useful for understanding potential spread and occurrence of
invasive species. However, bioclimatic models can be of limited value at very local scales as
other biotic and abiotic factors come into play (Robinson et al. 2011). On a global scale,
bioclimatic modelling is useful for highlighting which countries and species need risk
assessments for purposeful introductions, and where introduction pathways need to be
monitored to prevent unintentional introductions e.g. between India and China or Iran and
Turkmenistan.
Stellenbosch University https://scholar.sun.ac.za
28
Further knowledge on the ecology, local perceptions, and the ecological, economic and social
benefits and impacts of Prosopis are needed to guide management (Wilson et al. 2014). Our
study has highlighted that knowledge on Prosopis invasions is essential for management
(Table 1.1; Figure 1.6). Most of the literature comes from a handful of countries (Australia,
India, Kenya, South Africa, USA), and research in other areas is needed since each region has
its own set of factors that drive invasions and complicate management. There is also need for
research to better predict trends such as future densities, extent and impacts which is
particularly important when it comes down to developing strategic responses. Drivers of
weediness in areas where it is native - such as Argentina, Mexico, Middle East, and the USA
- require further study to improve understanding of what drives native plants to become
invasive and provide insight in how to manage them.
The issue of the lack of knowledge is also present for research on the effectiveness of
controlling populations using different methods. Utilisation as a control method is becoming
popular in many areas such as Djibouti, Ethiopia, and Kenya. However, despite many reports
showing how much monetary benefit Prosopis has provided, there is no information on how
successful this approach is for controlling Prosopis invasions. There are also conflicting ideas
on the role and success of biological control in Australia and South Africa and further work is
needed (Zachariades et al. 2011). There is scope for identifying and potentially releasing
additional biological control agents to improve control success in areas where this has been
limited until now, such as in South Africa (Zachariades et al. 2011).Research is needed to
identify novel solutions to aid the dilemma of management and contentious issues regarding
invasive Prosopis globally. These include methods that retain the benefits, but reduce the
impacts substantially. Risk assessments need to be run for Prosopis species that have not
been introduced yet to determine whether they might be better candidates for introduction, by
providing benefits with fewer costs associated with invasiveness.
Dissemination of knowledge: Organisations involved in addressing land degradation and
invasions should promote the dissemination of knowledge and awareness of both the impacts
and benefits of Prosopis to prevent unwise introductions and promote management (Figure
1.7) Some people still advocate the introduction of Prosopis species long after the severe
impacts caused by invasions of these species were widely publicised; this has been described
as ‘dangerous aid’ (Low, 2012). Having regular multidisciplinary international meetings or
workshops on Prosopis invasions may help to spread knowledge and create dialog between
parties which could help to reduce contentious issues surrounding many invasive Prosopis
species. The creation of management strategies using transdisciplinary approaches would also
help to provide solutions acceptable to all stakeholders in situations where conflicting goals
exist.
Stellenbosch University https://scholar.sun.ac.za

29
1.5 Conclusions
Prosopis species are among the most widespread and damaging invasive woody plants in
semi-arid and arid regions of the world and there is much potential for taxa to spread further.
The detrimental effects on the environment and human livelihoods are escalating rapidly and
there is an urgent need to devise more effective management approaches to drastically reduce
adverse impacts and enhance benefits. However, there are still critical gaps in our knowledge
of its ecology, impacts and how to retain benefits and reduce costs, and a lack of management
capacity in many countries. Clearly focussed research and strategic planning is needed to
improve management reduce costs and improve benefit flows.
Supporting information (Appendices)
File 1: Methods for literature review, climate matching, regression analysis, classification
and regression tree.
File 2. Global distribution of Prosopis species. Status codes (sensu Pyšek et al. 2004) are
given in brackets: N = naturalised; I = invasive; NA = native; W = weedy; U = unknown.
Countries partaking in management of Prosopis species are marked with an asterisk.
File 3. Climate matching output – list of climatically suitable countries and the associated
species (excluding known native species).
File 4. Underlying information on Prosopis invasions worldwide.
Acknowledgements
We thank the many researchers and managers that were consulted about the occurrence and
management of Prosopis and the DST-NRF Centre of Excellence for Invasion Biology and
Working for Water Programme through their collaborative research project on “Integrated
management of invasive alien species in South Africa” – National Research Foundation
(grant 85417) for funding.
Stellenbosch University https://scholar.sun.ac.za

30
Chapter 2: The impact of invasive alien Prosopis species (mesquite) on
native plants in different environments in South Africa
This chapter was published in the South African Journal of Botany
Reference: Shackleton, R.T., Le Maitre, D.C., van Wilgen, B.W. and Richardson. B.W. 2015.
The impact of invasive alien Prosopis species (mesquite) on native plants in different
environments in South Africa. South African Journal of Botany 97: 25-31.
Abstract
Many Prosopis species have been introduced to South Africa; some taxa and their hybrids
have naturalised and become widespread invasive trees. These invasions have detrimental
effects on biodiversity, ecosystem services and human livelihoods. Although several studies
have documented these impacts, the studies have been limited to single sites or restricted
areas. This study assessed the Prosopis population across the full invasive range of the genus
in South Africa, and quantified the effects of invasions on native woody and herbaceous
species. Basal areas of invasive Prosopis stands reached 9 m2/ha, and were on average higher
along perennial rivers than along ephemeral rivers (mean basal areas of 3.2 vs. 1.4 m2/ha).
Native woody species density, basal area, richness and diversity all decreased significantly as
the basal area of Prosopis stands increased. For example, up to eight native woody species
occurred at basal area < 2 m²/ha, this decreased to three native species or fewer at basal areas
> 4 m²/ha. The cover of native perennial grasses and herbaceous plants declined from 15 –
20% where the basal area of Prosopis was < 2 m2/ha to zero where the basal area of Prosopis
was > 4.5 m2/ha. The results highlight the widespread nature of the impacts across all
invaded biomes. Current control of Prosopis has had limited success, and alternative,
potentially more effective, options are controversial. In the light of the widespread impacts,
we recommend that a thorough assessment of the problem be undertaken to inform policy.
2.1 Introduction
Many ‘multi-purpose’ trees have been transported around the world and several have
subsequently become naturalised and invasive (Rejmánek and Richardson, 2013). Tree
invasions have become much more widespread in recent decades in many parts of the world
and several invasive alien trees are key drivers of biodiversity loss and disruption of
ecosystem functioning (Richardson et al. 2014). Prosopis (mesquite) taxa are widespread
invaders in semi-arid and arid areas across the world (Pasiecznik et al. 2001). These invasions
have detrimental impacts on the environment, society and local economies (Shackleton et al.
2014). Negative impacts of Prosopis invasions on a wide range of native organisms have
been documented in many parts of the world. These include reductions in plant species
richness, density and diversity in Hawaii, India, Kenya and the United Arab Emirates (El-
Keblawy and Al-Rawai, 2007; Kaur et al. 2012; Muturi et al. 2013), increased native tree
mortality in Brazil and South Africa (Schachtschneider and February, 2013; de Souza
Nascimento et al. 2014; Shackleton et al. 2015), negative impacts on bird and insect
community composition in South Africa (Steenkamp and Chown 1996; Dean et al. 2002) and
Stellenbosch University https://scholar.sun.ac.za

31
reductions in turtle and bird recruitment on Atlantic islands (Belton, 2008). Ecosystem
services such as soil quality, grazing and water supply are affected by Prosopis invasions,
leading to a range of negative consequences for local human communities (Geesing et al.
2004; Mwangi and Swallow, 2005; Ndhlovu et al 2011; Wise et al. 2012; Dzikiti et al. 2013;
Ayanu et al. 2014; Shackleton et al. 2014).
Prosopis species were introduced to South Africa in the late 1800s and were widely
distributed and planted up to the 1960s for shade and fodder during a time of severe drought
(Harding and Bate, 1991; Zimmermann, 1991; Poynton, 2009). Invasive Prosopis stands
(comprising several species and their hybrids) now cover very large areas of arid and
semiarid parts of the country, with extensive invasions in the Northern Cape and Western
Cape provinces (Poynton, 2009). Prosopis is estimated to have invaded 1.8 million ha (1.5
%) of South Africa and has been estimated to spread between 3.5 and 8 % per annum
(Voster, 1977; Coetsee, 1993; Harding and Bate, 1991; Versfeld et al. 1998). This implies
that invaded areas can double every 5-8 years. In the Northern Cape province Prosopis
invasions increased by almost 1 million ha between 2002 and 2007, which is equivalent to
27.5 % per year (Van Den Berg, 2010). In terms of land area invaded, Prosopis is ranked as
the second worst invasive alien plant taxon in South Africa after Australian acacia species
(Henderson, 2007). The genus also ranks highly for its negative impacts on biodiversity and
ecosystem services (Le Maitre et al. 2000). Invasive Prosopis species are being managed by
the Working for Water programme in South Africa, using mechanical and chemical and
biological control (three seed-feeding beetle species) but with limited success in reducing the
overall extent of invasions and their impacts (Zachariades et al. 2011; van Wilgen et al.
2012).
Ecosystem services such as water supply and grazing potential are clearly affected by
Prosopis invasions in South Africa (Ndhlovu et al. 2011; Wise et al. 2012; Dzikiti et al.
2013). Further negative effects are noted on bird and insect species richness and composition
in the Kalahari (Steenkamp and Chown, 1996; Dean et al. 2002). Prosopis also increases the
mortality of a keystone tree species (Acacia erioloba) in the Kalahari Desert
(Schachtschneider and February, 2013). All of these studies have been limited to small areas
or single sites, and there is a need for more extensive surveys to establish both the nature of
the invasions, and the degree of impact that they are having in different biomes and habitats.
Such information would be necessary for estimating the impacts of Prosopis over large
spatial areas, and for informing large-scale management strategies.
This study aimed (1) to quantify the basal areas of Prosopis invasions in different biomes and
river types across South Africa; and (2) to assess the impacts of Prosopis invasion on native
plant species richness, diversity, basal area, density and cover over a wide area representative
of the invasive range of the genus in South Africa.
Stellenbosch University https://scholar.sun.ac.za
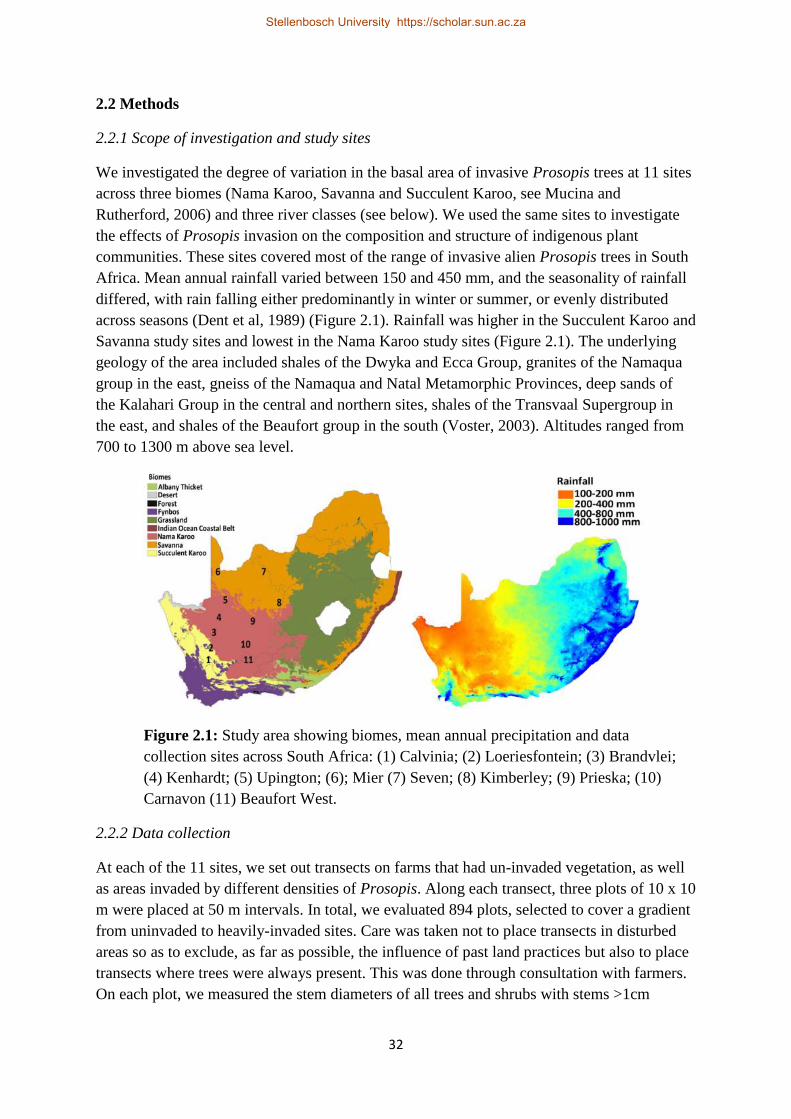
32
2.2 Methods
2.2.1 Scope of investigation and study sites
We investigated the degree of variation in the basal area of invasive Prosopis trees at 11 sites
across three biomes (Nama Karoo, Savanna and Succulent Karoo, see Mucina and
Rutherford, 2006) and three river classes (see below). We used the same sites to investigate
the effects of Prosopis invasion on the composition and structure of indigenous plant
communities. These sites covered most of the range of invasive alien Prosopis trees in South
Africa. Mean annual rainfall varied between 150 and 450 mm, and the seasonality of rainfall
differed, with rain falling either predominantly in winter or summer, or evenly distributed
across seasons (Dent et al, 1989) (Figure 2.1). Rainfall was higher in the Succulent Karoo and
Savanna study sites and lowest in the Nama Karoo study sites (Figure 2.1). The underlying
geology of the area included shales of the Dwyka and Ecca Group, granites of the Namaqua
group in the east, gneiss of the Namaqua and Natal Metamorphic Provinces, deep sands of
the Kalahari Group in the central and northern sites, shales of the Transvaal Supergroup in
the east, and shales of the Beaufort group in the south (Voster, 2003). Altitudes ranged from
700 to 1300 m above sea level.
Figure 2.1: Study area showing biomes, mean annual precipitation and data
collection sites across South Africa: (1) Calvinia; (2) Loeriesfontein; (3) Brandvlei;
(4) Kenhardt; (5) Upington; (6); Mier (7) Seven; (8) Kimberley; (9) Prieska; (10)
Carnavon (11) Beaufort West.
2.2.2 Data collection
At each of the 11 sites, we set out transects on farms that had un-invaded vegetation, as well
as areas invaded by different densities of Prosopis. Along each transect, three plots of 10 x 10
m were placed at 50 m intervals. In total, we evaluated 894 plots, selected to cover a gradient
from uninvaded to heavily-invaded sites. Care was taken not to place transects in disturbed
areas so as to exclude, as far as possible, the influence of past land practices but also to place
transects where trees were always present. This was done through consultation with farmers.
On each plot, we measured the stem diameters of all trees and shrubs with stems >1cm
Stellenbosch University https://scholar.sun.ac.za
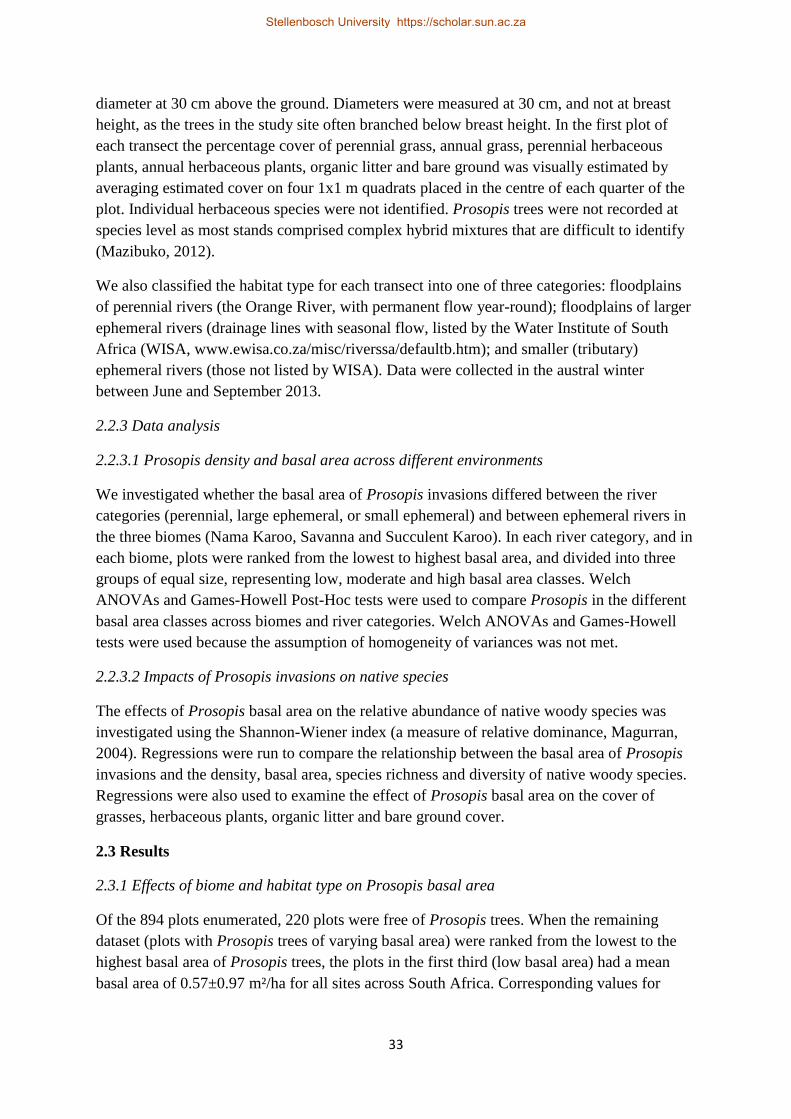
33
diameter at 30 cm above the ground. Diameters were measured at 30 cm, and not at breast
height, as the trees in the study site often branched below breast height. In the first plot of
each transect the percentage cover of perennial grass, annual grass, perennial herbaceous
plants, annual herbaceous plants, organic litter and bare ground was visually estimated by
averaging estimated cover on four 1x1 m quadrats placed in the centre of each quarter of the
plot. Individual herbaceous species were not identified. Prosopis trees were not recorded at
species level as most stands comprised complex hybrid mixtures that are difficult to identify
(Mazibuko, 2012).
We also classified the habitat type for each transect into one of three categories: floodplains
of perennial rivers (the Orange River, with permanent flow year-round); floodplains of larger
ephemeral rivers (drainage lines with seasonal flow, listed by the Water Institute of South
Africa (WISA, www.ewisa.co.za/misc/riverssa/defaultb.htm); and smaller (tributary)
ephemeral rivers (those not listed by WISA). Data were collected in the austral winter
between June and September 2013.
2.2.3 Data analysis
2.2.3.1 Prosopis density and basal area across different environments
We investigated whether the basal area of Prosopis invasions differed between the river
categories (perennial, large ephemeral, or small ephemeral) and between ephemeral rivers in
the three biomes (Nama Karoo, Savanna and Succulent Karoo). In each river category, and in
each biome, plots were ranked from the lowest to highest basal area, and divided into three
groups of equal size, representing low, moderate and high basal area classes. Welch
ANOVAs and Games-Howell Post-Hoc tests were used to compare Prosopis in the different
basal area classes across biomes and river categories. Welch ANOVAs and Games-Howell
tests were used because the assumption of homogeneity of variances was not met.
2.2.3.2 Impacts of Prosopis invasions on native species
The effects of Prosopis basal area on the relative abundance of native woody species was
investigated using the Shannon-Wiener index (a measure of relative dominance, Magurran,
2004). Regressions were run to compare the relationship between the basal area of Prosopis
invasions and the density, basal area, species richness and diversity of native woody species.
Regressions were also used to examine the effect of Prosopis basal area on the cover of
grasses, herbaceous plants, organic litter and bare ground cover.
2.3 Results
2.3.1 Effects of biome and habitat type on Prosopis basal area
Of the 894 plots enumerated, 220 plots were free of Prosopis trees. When the remaining
dataset (plots with Prosopis trees of varying basal area) were ranked from the lowest to the
highest basal area of Prosopis trees, the plots in the first third (low basal area) had a mean
basal area of 0.57±0.97 m²/ha for all sites across South Africa. Corresponding values for
Stellenbosch University https://scholar.sun.ac.za

34
moderate and high basal area plots were, 1.14±1.12 m²/ha in the middle range and 2.17±1.31
m²/ha in the high range (Figure 2.2).
Figure 2.2: Images of Prosopis and native vegetation in South Africa: Panel 1 - (a)
Non- invaded riverine forest; (b) Low Prosopis invasion; (c) Dense Prosopis
invasion; Panel 2 – (a) Non-invaded Savanna vegetation; (b) sparse Prosopis
invasion; (c) Landscape scale, dense Prosopis invasion; Panel 3 – (a) Grass cover 5
years after clearing Prosopis; (b) Ground cover under native Acacia karroo riverine
forest; (c) Ground cover under a Prosopis invasion. Photos: R T. Shackleton.
Habitat type (river categories) had significant effects on the basal area of Prosopis stands.
(Figure 2.3a, Table 2.1). On average, the plots in the high-range class had more than double
the basal area along perennial rivers than along both categories of ephemeral rivers (3.2 vs.
1.43 m2/ha). Small ephemeral rivers also tended to have lower mean basal areas in the
medium and low ranges, compared to large ephemeral or perennial rivers.
Stellenbosch University https://scholar.sun.ac.za
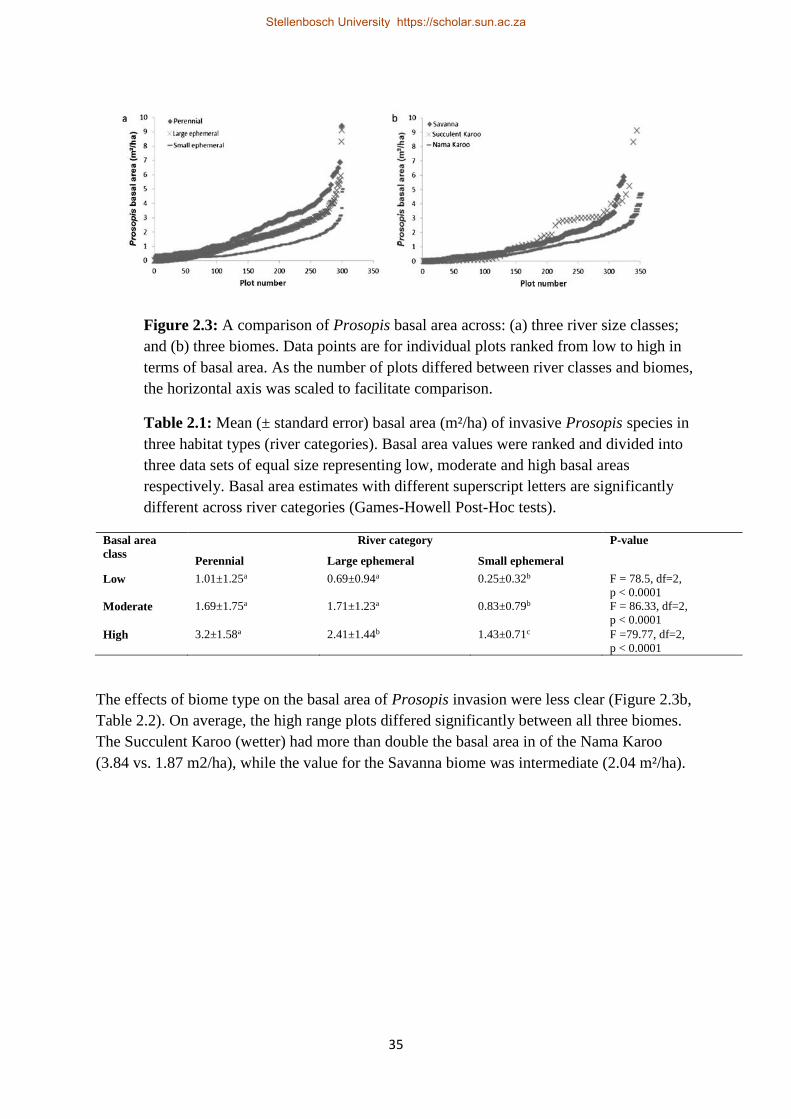
35
Figure 2.3: A comparison of Prosopis basal area across: (a) three river size classes;
and (b) three biomes. Data points are for individual plots ranked from low to high in
terms of basal area. As the number of plots differed between river classes and biomes,
the horizontal axis was scaled to facilitate comparison.
Table 2.1: Mean (± standard error) basal area (m²/ha) of invasive Prosopis species in
three habitat types (river categories). Basal area values were ranked and divided into
three data sets of equal size representing low, moderate and high basal areas
respectively. Basal area estimates with different superscript letters are significantly
different across river categories (Games-Howell Post-Hoc tests).
Basal area
class
River category P-value
Perennial Large ephemeral Small ephemeral
Low 1.01±1.25a 0.69±0.94a 0.25±0.32b F = 78.5, df=2,
p < 0.0001
Moderate 1.69±1.75a 1.71±1.23a 0.83±0.79b F = 86.33, df=2,
p < 0.0001
High 3.2±1.58a 2.41±1.44b 1.43±0.71c F =79.77, df=2,
p < 0.0001
The effects of biome type on the basal area of Prosopis invasion were less clear (Figure 2.3b,
Table 2.2). On average, the high range plots differed significantly between all three biomes.
The Succulent Karoo (wetter) had more than double the basal area in of the Nama Karoo
(3.84 vs. 1.87 m2/ha), while the value for the Savanna biome was intermediate (2.04 m²/ha).
Stellenbosch University https://scholar.sun.ac.za
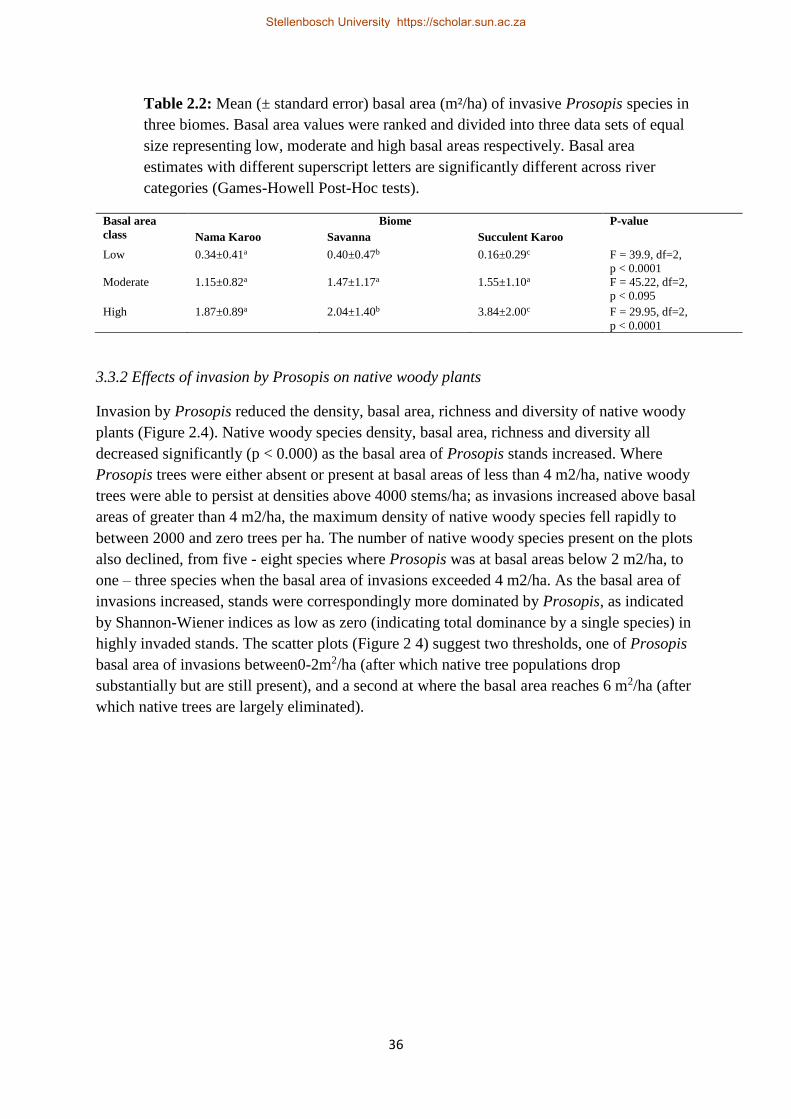
36
Table 2.2: Mean (± standard error) basal area (m²/ha) of invasive Prosopis species in
three biomes. Basal area values were ranked and divided into three data sets of equal
size representing low, moderate and high basal areas respectively. Basal area
estimates with different superscript letters are significantly different across river
categories (Games-Howell Post-Hoc tests).
Basal area
class
Biome P-value
Nama Karoo Savanna Succulent Karoo
Low 0.34±0.41a 0.40±0.47b 0.16±0.29c F = 39.9, df=2,
p < 0.0001
Moderate 1.15±0.82a 1.47±1.17a 1.55±1.10a F = 45.22, df=2,
p < 0.095
High 1.87±0.89a 2.04±1.40b 3.84±2.00c F = 29.95, df=2,
p < 0.0001
3.3.2 Effects of invasion by Prosopis on native woody plants
Invasion by Prosopis reduced the density, basal area, richness and diversity of native woody
plants (Figure 2.4). Native woody species density, basal area, richness and diversity all
decreased significantly (p < 0.000) as the basal area of Prosopis stands increased. Where
Prosopis trees were either absent or present at basal areas of less than 4 m2/ha, native woody
trees were able to persist at densities above 4000 stems/ha; as invasions increased above basal
areas of greater than 4 m2/ha, the maximum density of native woody species fell rapidly to
between 2000 and zero trees per ha. The number of native woody species present on the plots
also declined, from five - eight species where Prosopis was at basal areas below 2 m2/ha, to
one – three species when the basal area of invasions exceeded 4 m2/ha. As the basal area of
invasions increased, stands were correspondingly more dominated by Prosopis, as indicated
by Shannon-Wiener indices as low as zero (indicating total dominance by a single species) in
highly invaded stands. The scatter plots (Figure 2 4) suggest two thresholds, one of Prosopis
basal area of invasions between0-2m2/ha (after which native tree populations drop
substantially but are still present), and a second at where the basal area reaches 6 m2/ha (after
which native trees are largely eliminated).
Stellenbosch University https://scholar.sun.ac.za
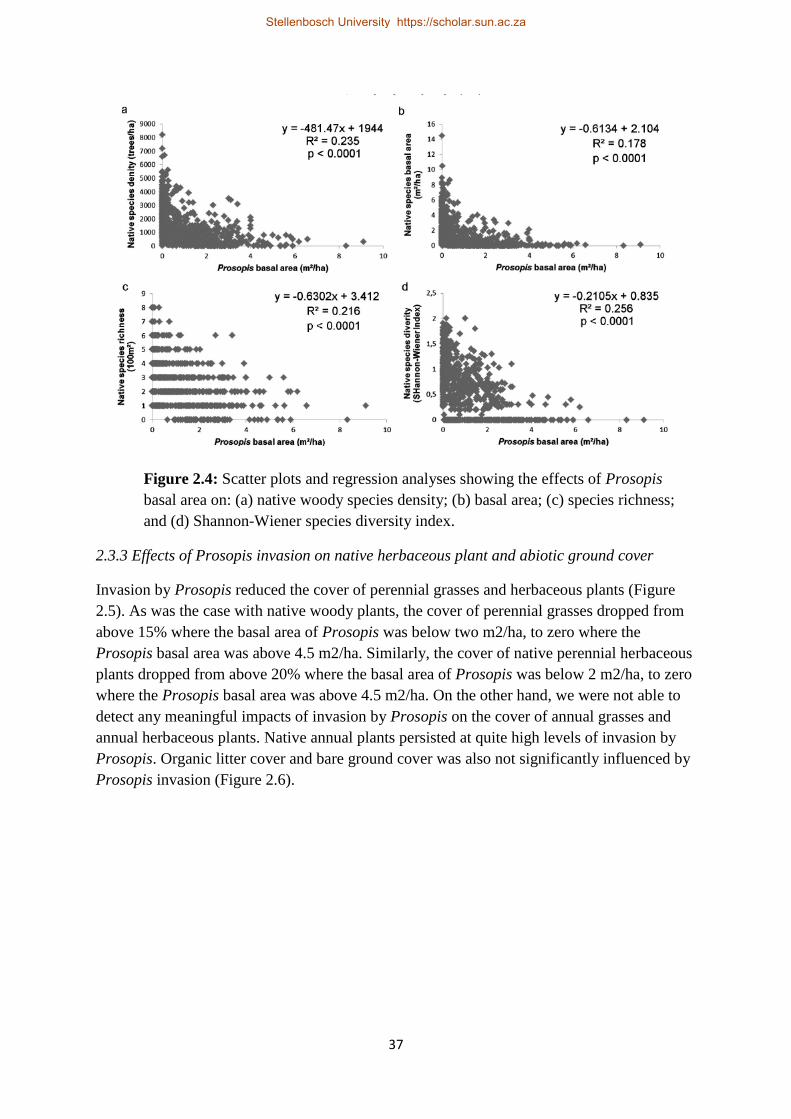
37
Figure 2.4: Scatter plots and regression analyses showing the effects of Prosopis
basal area on: (a) native woody species density; (b) basal area; (c) species richness;
and (d) Shannon-Wiener species diversity index.
2.3.3 Effects of Prosopis invasion on native herbaceous plant and abiotic ground cover
Invasion by Prosopis reduced the cover of perennial grasses and herbaceous plants (Figure
2.5). As was the case with native woody plants, the cover of perennial grasses dropped from
above 15% where the basal area of Prosopis was below two m2/ha, to zero where the
Prosopis basal area was above 4.5 m2/ha. Similarly, the cover of native perennial herbaceous
plants dropped from above 20% where the basal area of Prosopis was below 2 m2/ha, to zero
where the Prosopis basal area was above 4.5 m2/ha. On the other hand, we were not able to
detect any meaningful impacts of invasion by Prosopis on the cover of annual grasses and
annual herbaceous plants. Native annual plants persisted at quite high levels of invasion by
Prosopis. Organic litter cover and bare ground cover was also not significantly influenced by
Prosopis invasion (Figure 2.6).
Stellenbosch University https://scholar.sun.ac.za

38
Figure 2.5: Scatter plots and regression analysis assessing the effect of Prosopis basal
area on non-woody plant cover: (a) perennial grass cover; (b) annual grass cover; (c)
perennial herbaceous plant cover (100m²); and (d) annual herbaceous plant cover.
Figure 2. 6: Scatter plots and regression analyses showing the effect of Prosopis
basal area on (a) organic litter cover; and (b) bare ground cover.
2.4 Discussion
2.4.1 International comparisons
The findings of our study are similar in many ways to those made for Prosopis invasions in
other parts of the world. Prosopis forms dense invasive thickets across much of South
Africa’s interior. These invasive thickets are influenced by abiotic factors, and areas with
higher water availability have higher invasions with higher basal areas (Figure 2.3).
Similarly, densities of invasive P. pallida were 5.3 times greater in relatively moist lowlands
in Hawaii, compared to drier upland plots (Dudley et al. 2014). Dudley et al. (2014) also
showed that greater water accessibility increased nitrogen fixation, which was linked to
increased growth and productivity of these Prosopis invasions. This trend is mirrored in
Stellenbosch University https://scholar.sun.ac.za
39
findings by Stromberg et al. (1993) who showed that weedy (native invasive) P. velutina
invasions in the Sonoran Desert have higher basal areas in perennial-riparian compared to
xero-riparian (ephemeral rivers) and upland areas. These findings show that Prosopis
responds in a similar way, whether as a weed in its native range or where it is an invasive
alien tree.
Our findings showing the negative impacts of Prosopis invasions on native plants (Figures
2.4 and 2.5) are supported by other studies internationally. Prosopis invasions also negatively
affected native species richness in Hawaii, India, Kenya and the United Arab Emirates (El-
Keblawy and Al-Rawai, 2007; Kaur et al. 2012; Muturi et al. 2013). In the United Arab
Emirates, native species richness and densities under Prosopis tree canopies were lower than
at canopy margins and away from Prosopis canopies (El-Keblawy and Al-Rawai, 2007). This
suggests that Prosopis was able to outcompete native plants for limited resources, such as
light and water (Garcia-Serrano et al. 2007; El-Keblawy and Al-Rawai, 2007). The
allelopathic effects of Prosopis have also been shown to reduce native tree germination and
survival (de Souza Nascimento et al. 2014; El-Keblawy and Abdelfetha, 2014). Our results
for woody plants differed from those in Australia where it was found that Prosopis invasions
had a positive effect on the density of native tree species but a negative effect on density of
native shrub species (van Klinken et al. 2006). The only trees found in areas with Prosopis
invasion in Australia (Eucalyptus spp.) showed higher densities in dense and moderate
Prosopis invasions than in areas with low-density invasions (van Klinken et al. 2006). A
similar trend of Prosopis presence increasing native species richness and diversity was also
found in India, however, the increase was in weedy, economically unimportant native species
and there were negative impacts on endangered Commiphora wightii and other important
climax native species (Kumar and Mathur, 2014). Percentage cover of native grass and
herbaceous plant species is also reduced by Prosopis invasions (Figure 2.5). Similar shifts
were seen in Australia, with far fewer shrubs and grasses found in densely invaded areas (van
Klinken et al. 2006). Denser Prosopis invasions tended to an increase in bare ground cover
(Figure 2.6). Loss of ground cover under Prosopis invasions has been seen to facilitate soil
erosion in some areas (Bedunah and Sosebee, 1986).
2.4.2 Implications of findings
Our study has added to the growing body of evidence (Steenkamp and Chown, 1996; Dean et
al 2002; Ndhlovu et al. 2011; Dzikiti et al. 2013; Schachtschneider and February, 2013) that
invasion by Prosopis has negative impacts on South Africa’s natural ecosystems and the
services that they deliver. We have further demonstrated that these impacts occur across a
wide area, in all biomes invaded by Prosopis trees. While Prosopis trees were originally
introduced to provide fodder, and for other benefits, recent studies suggest that these benefits
are rapidly being eroded by negative impacts (Wise et al. 2012). Loss of native plants due to
Prosopis invasions not only decreases biodiversity in the area, but also has negative
implications for local livelihoods. Many people in the rural areas of South Africa rely on
natural resources from plants for incomes and subsistence (Shackleton et al. 2007). Prosopis
reduces the densities of native species like Acacia erioloba and A. karroo which are highly
valued and commonly used for firewood and fodder in South Africa (Powell, 2001; Pote et al.
Stellenbosch University https://scholar.sun.ac.za

40
2006). This is of particular importance as many communities dislike Prosopis for fuelwood
(Geesing et al. 2004). The loss of native grass and herbaceous plant cover due to Prosopis
invasion is common across South Africa (Ndhlovu et al. 2011). This has serious
repercussions for the local economy of these arid and semiarid parts of the country,
considering that livestock agriculture is the primary land use and one of the key factors
driving the economy and employment in these areas.
Wise et al. (2012) noted that, while the estimated net economic value of mesquite was
substantial, this value was being eroded as invasions grow, with net negative values expected
within 4 – 22 years, depending on the rate of spread. In response to the growing threat, the
South African government has spent R 435 million (between 1996 and 2008) on mechanical
control operations aimed at clearing stands of invasive Prosopis trees in arid areas (van
Wilgen et al. 2012). In addition, biological control agents were released between 1983 and
1997 in attempts to control Prosopis (Zachariades et al. 2011). However, because of the
perceived value of Prosopis trees, biological control attempts were confined to seed-feeding
insects that would not damage the trees. As a result, the degree of control achieved by these
insects is currently inadequate to stem the spread. Other biological control agents that have
been deemed safe to release in South Africa have showed success in limiting Prosopis
invasions in Australia (van Klinken, 2012). The mechanical control programme has been
equally ineffective at a broad scale, as evidenced by the rapid population growth over the past
two decades (Van den Berg 2010). Despite substantial investment, mechanical control efforts
were only able to treat about 0.6% of the estimated invaded area each year (van Wilgen et al.
2012), which is way below the spread rate of the species.
It is clear that Prosopis invasions will continue to spread despite intensive attempts at control
and the impacts will grow accordingly, unless more effective ways can be found to control
the genus in South Africa. One obvious solution would be to explore the feasibility of
introducing more damaging biological control agents that would be more effective at
curtailing spread, such Evippe spp. (van Klinken, 2012). There is some resistance to this idea
(particularly further north in Africa), because there is a risk that biological control agents
could attack indigenous African species of Prosopis, or other alien Prosopis species that are
not invasive, and that are useful (Zachariades et al. 2011). Other proposals include the notion
of utilization as a control method (Pasiecznik et al. 2006; Shackleton et al., 2014). For
example, many people rely on Prosopis for their livelihoods in India, where it has been
suggested that increased use of products from Prosopis through proper silviculture would be
a feasible way of managing costs and improving benefits relating to these invasions (Walter
et al. 2014). However, use in South Africa is lower and the silviculture option would not be
feasible (Shackleton et al. in press). These suggestions are also controversial as their
effectiveness is disputed and they create a dependence on the resource which provides
justification for further distribution of the invasive species (Geesing et al. 2004; van Wilgen
and Richardson, 2014). The growing evidence, presented in this study and elsewhere, of the
widespread negative impacts of Prosopis invasions will continue to increase unless a solution
can be found. We recommend that a full assessment of the costs and benefits be carried out to
inform policy decisions. The creation of national strategic plans such as those in Australia
Stellenbosch University https://scholar.sun.ac.za

41
would also help to guide management and aid in efficiency in the future. Such an assessment
would have to be carried out with a political mandate (for legitimacy), involve all of the
stakeholders, and use experts and peer review to address all of the issues.
Acknowledgements
Funding for this work was provided by the DST-NRF Centre of Excellence for Invasion
Biology and the Working for Water Programme through their collaborative research project
on “Integrated management of invasive alien species in South Africa”. DMR acknowledges
additional support from the National Research Foundation (grant 85417) and the
Oppenheimer Memorial Trust. Thank you to the farmers who gave use access to their land
and were so helpful.
Stellenbosch University https://scholar.sun.ac.za
42
Chapter 3: Prosopis invasions in South Africa: Populations structures and
impacts on native tree population stability
This chapter was published in the Journal of Arid Environments
Reference: Shackleton, R.T., Le Maitre, D.C. and Richardson, D.M. 2015. Prosopis invasions
in South Africa: Populations structures and impacts on native tree population stability.
Journal of Arid Environments 144: 70-78.
Abstract
Several Prosopis taxa are widespread invaders that have negative impacts on biodiversity and
human livelihoods globally. Better knowledge of the impacts and ecology of invasive
Prosopis species is required to support and inform management interventions. Prosopis was
introduced to South Africa and has become the second most widespread invasive alien plant
taxon in the country. We compare population structures of invasive Prosopis populations in
different part of South Africa, and quantify the effects of Prosopis invasions on native tree
populations using size-class distribution (SCD) curves. Kolmogorov-Smirnov tests,
regressions, quotients, and Permutation Indices were used to compare size-class distributions
and assess population stability. Prosopis population structures differed across South Africa.
Those along perennial rivers and areas in the Succulent Karoo biome had fewer juvenile
plants. Prosopis in South Africa also has higher recruitment (% juvenile plants) than in other
areas like Australia. Prosopis invasions are having a negative effect on the stability of native
tree populations in South Africa, and are linked to increased mortality of native trees.
Improved management of Prosopis is needed.
3.1 Introduction
Invasive alien species are a key driver of biodiversity loss and ecosystem function disruption
globally (Wilcove et al., 1998). They are a major cause of mammal, bird and fish species
extinctions, and also threaten plant diversity in many regions (Gaertner et al., 2009).
Biological invasions lead to the suppression of native plants by competing for limited
resources (Richardson et al., 1989). The understanding of the impacts of invasive alien
species at a community levels is, however, rather limited and further research is needed
especially over large spatial and temporal scales (Tickner et al., 2001). Taxa in the genus
Prosopis (mesquite) have been introduced and become naturalized or invasive in many of the
world’s arid and semi-arid areas (Rejmánek and Richardson, 2013). Prosopis has been
highlighted as a serious invasive alien taxon globally and poses threats to biodiversity and
human activities, but further research on impacts and ecology is needed (Shackleton et al.,
2014). These Prosopis invasions have been shown to have a negative impact on native plant,
bird and turtle populations in many countries (Belton, 2008; Kaur et al. 2012; Muturi et al.,
2013).
Prosopis taxa were introduced to South Africa in the late 19th century and were actively
distributed and planted in the semi-arid and arid parts of the country, especially in the 1960s
and 1970s (Zimmermann, 1991). Several species and their hybrids are now major invaders
Stellenbosch University https://scholar.sun.ac.za

43
across large parts of the arid interior of South Africa. Common species include Prosopis
chilensis, P. glandulosa and P. velutina, and their many freely inter-breeding hybrids
(Zimmermann, 1991; Poynton, 2009; Mazibuko, 2012). There is also evidence that P. alba,
P. juliflora, P. laevigata P. pallida P. pubescens are also present but not as common
(Mazibuko, 2012). Prosopis invasions now cover at least 1.8 million ha of South Africa
(Versfeld et al., 1998) and are expanding at around 8 % per annum (Van den Berg, 2010).
Invasions have had severe negative impacts on ecosystem services such as water and grazing
supply (Ndhlovu et al., 2011; Dzikiti et al., 2013) and are adversely affecting native plant,
bird and insect species richness and diversity (Steenkamp and Chown, 1996; Dean et al.
2002, Ndhlovu et al., 2011; Shachtschneider and February, 2013).
An integrated approach to managing Prosopis is being implemented in South Africa to
reduce the impacts of invasions. This includes biological control using seed-feeding beetles
(Algarobius Prosopis, A. bottimeri and Neltumius arizonensis) (Zimmermann, 1991) and
mechanical and chemical control implemented mainly by the government-run Working for
Water programme, but also by private land owners. There is the potential for the release of
more biological control agents if the conflicts of interest surrounding Prosopis are resolved
(Zachariades et al., 2011). Between 1996 and 2008 Prosopis cover has increased by 35 %
despite R 435.5 million (US$ 42.7 million) being spent on controlling its spread (van Wilgen
et al., 2012). Approximately 15 100 ha were cleared with this budget (van Wilgen et al.,
2012). There is potential to look into other control mechanisms to improve management
further, such as the control-by-utilisation approach applied in Kenya (Pasiecznik and Felker
2006). These different methods each have advantages and disadvantages and management
approaches are often are based on the population structure of invasive populations, the level
of understanding of invasion, and development level of the country (van Wilgen et al., 2011;
Shackleton et al., 2014). Baseline data on the population structures and impacts of Prosopis
are needed to guide effective management in South Africa. This is particularly needed over
large spatial scales, since previous studies have been site specific (Steenkamp and Chown,
1996; Dean et al. 2002, Ndhlovu et al., 2011; Schachtschneider and February, 2013).
Little attention has been given to determining the effects of invasive species on the
recruitment, mortality and population stability of native plants across a representative range
of environments. The use of size-class distributions (SCDs) provides a convenient method for
assessing population trends in plants, and has been widely used in studies of rare, threatened
and heavily utilised plants to guide in their management (Shackleton, 1993; Botha et al.,
2004; Venter and Witkowski, 2010; Cousins et al., 2014). Few studies have used SCD curves
to investigate the population structure of invasive alien populations, and even fewer have
applied this method to assess impacts of invasive plants on native species – most studies that
have been done deal with Prosopis (van Klinken et al., 2006; de Oliveira et al., 2012; Muturi
et al., 2013). SCD curves have the potential to provide important insights into the effects of
invasive alien plants on native species population stability, and can inform management
strategies based on population structures, recruitment and impacts.
Stellenbosch University https://scholar.sun.ac.za

44
3.2 Aims and objectives
a) Compare size-class distributions and population stability of Prosopis populations within
different biomes in South Africa and with differing water availability. b) Determine whether
invasive Prosopis populations are having an impact on the stability, population structure and
mortality of native tree species.
3.3 Study site
The study was conducted at 11 sites in an area that covered three of South Africa’s terrestrial
biomes: the Succulent Karoo, the Nama Karoo and the Arid Savanna (Figure 3.1). Mean
annual rainfall across the study area ranges from 150-450 mm (increasing towards the west);
rainfall seasonality ranged from winter in the west to summer in the east with bimodal
rainfall where they overlap (Dent et al, 1989). Rainfall across these sites has been highly
variable over the last 10 years, but has tended to be close to the yearly average to slightly
higher in the past three years at most sites (Agricultural Research Council, unpublished data).
Altitudes range from 700 to 1300 m a.s.l. The most common land use in the area is livestock
ranching and game farming.
Figure 3.1: The study area, showing biomes, mean annual precipitation and data
collection points across South Africa: (1) Calvinia; (2) Loeriesfontein; (3) Brandvlei;
(4) Kenhardt; (5) Upington; (6); Mier (7) Seven; (8) Kimberley; (9) Prieska; (10)
Carnavon (11) Beaufort West
3.4 Methods
3.4.1 Data collection
Data were collected between June and September 2013. At each site transects were
established along rivers and alluvial plains where natural riverine forests were found in areas
with varying levels of Prosopis stand density. Transects comprised three plots (10 x 10 m)
placed every 50 m. Farmers were consulted on the past land practices on their farms to
Stellenbosch University https://scholar.sun.ac.za

45
prevent placing transects in areas that were previously disturbed e.g. old flood irrigation
fields or areas that were dammed or where no native trees were present. We also only worked
on farms that had both invaded and non-invaded areas to ensure that major differences in
land-use history did not confound our results.
In total 894 plots were surveyed across the 11 sites. In each plot all tree diameters were
measured 30 cm above the ground and all trees were identified to species level (except
Prosopis). This height was chosen because Prosopis and other native species often branch
below breast height. For trees with multiple stems, all stem diameters were measured and
summed to give a single tree diameter for the SCD analysis. Trees with diameters < 1 cm
were simply identified and counted. Diameters of all dead native tree species were measured
and identified to species level based mainly on bark textures. Prosopis species were not
identified to species level because most invasive stands in South Africa comprise hybrids that
can only be accurately identified using molecular methods (Mazibuko, 2012). Expert
taxonomic advice was sought for identification of some of the native species. The different
biomes and different river classes (Small Ephemeral, Large Ephemeral and Perennial) -
indicative of water availability - were included to assess abiotic effects on Prosopis invasion
structures.
3.4.2 Data analysis
Size-class distributions were constructed for Prosopis populations in different biomes and
river classes. SCDs were also constructed for native tree species, and invasive alien Tamarix
ramosissima, and were separated into two groups: (a) those with zero to low (ZL) Prosopis
invasion (basal areas of < 2 m²/ha); and (b) those with moderate to high (MH) Prosopis
invasion (basal areas of > 2 m²/ha). The value of 2 m²/ha was chosen because it formed a
thresholds beyond which native species densities, basal areas, species richness and diversity
decreased considerably (Shackleton et al., under review). 723 plots (220 with no Prosopis)
plots fell into the ZL class and 171 plots fell into the MH class. Only tree species with 10 or
more records were included in the analyses. Kolmogorov-Smirnov tests were used to
compare size-class distributions between trees found in the two Prosopis-density categories
and to compare Prosopis SCDs in different biomes and river classes (Botha et al., 2002 and
2004; Venter and Witkowski, 2010). Regressions were also run to assess the fit (R²) of the
SCD.
Prosopis and native tree population stability in areas with ZL invasion and MH Prosopis
invasion were investigated by calculating the quotients between the numbers in successive
size-classes (Harper, 1977). Quotients for the whole Prosopis population and populations in
different biomes and along different river types were also calculated. Constant quotients
indicate population stability and fluctuating quotients indicate unstable or episodically
recruiting populations (Botha et al., 2002; Venter and Witkowski, 2010).
Population structures and stability of native trees found in ZL, and MH density invasions, and
Prosopis populations in different biomes and on rivers in different types were further
investigated using the Permutation Index (P-index) (Wiegand et al., 2000; Botha et al., 2004;
Stellenbosch University https://scholar.sun.ac.za
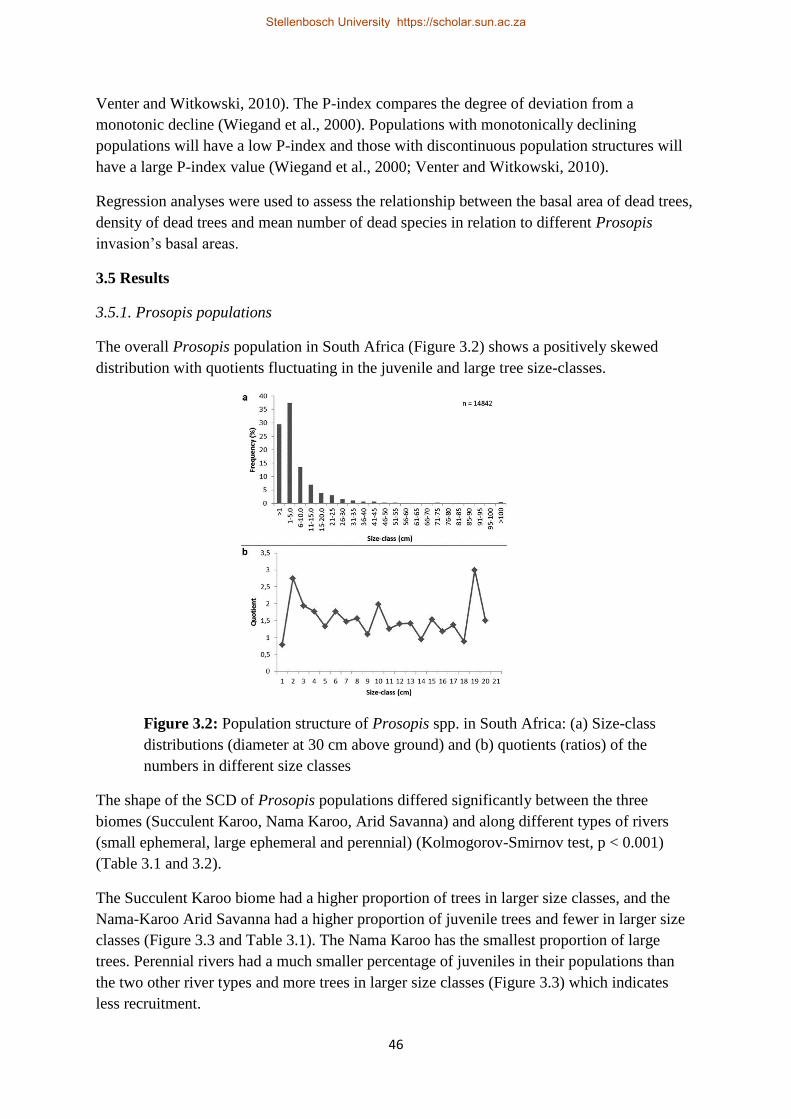
46
Venter and Witkowski, 2010). The P-index compares the degree of deviation from a
monotonic decline (Wiegand et al., 2000). Populations with monotonically declining
populations will have a low P-index and those with discontinuous population structures will
have a large P-index value (Wiegand et al., 2000; Venter and Witkowski, 2010).
Regression analyses were used to assess the relationship between the basal area of dead trees,
density of dead trees and mean number of dead species in relation to different Prosopis
invasion’s basal areas.
3.5 Results
3.5.1. Prosopis populations
The overall Prosopis population in South Africa (Figure 3.2) shows a positively skewed
distribution with quotients fluctuating in the juvenile and large tree size-classes.
Figure 3.2: Population structure of Prosopis spp. in South Africa: (a) Size-class
distributions (diameter at 30 cm above ground) and (b) quotients (ratios) of the
numbers in different size classes
The shape of the SCD of Prosopis populations differed significantly between the three
biomes (Succulent Karoo, Nama Karoo, Arid Savanna) and along different types of rivers
(small ephemeral, large ephemeral and perennial) (Kolmogorov-Smirnov test, p < 0.001)
(Table 3.1 and 3.2).
The Succulent Karoo biome had a higher proportion of trees in larger size classes, and the
Nama-Karoo Arid Savanna had a higher proportion of juvenile trees and fewer in larger size
classes (Figure 3.3 and Table 3.1). The Nama Karoo has the smallest proportion of large
trees. Perennial rivers had a much smaller percentage of juveniles in their populations than
the two other river types and more trees in larger size classes (Figure 3.3) which indicates
less recruitment.
Stellenbosch University https://scholar.sun.ac.za
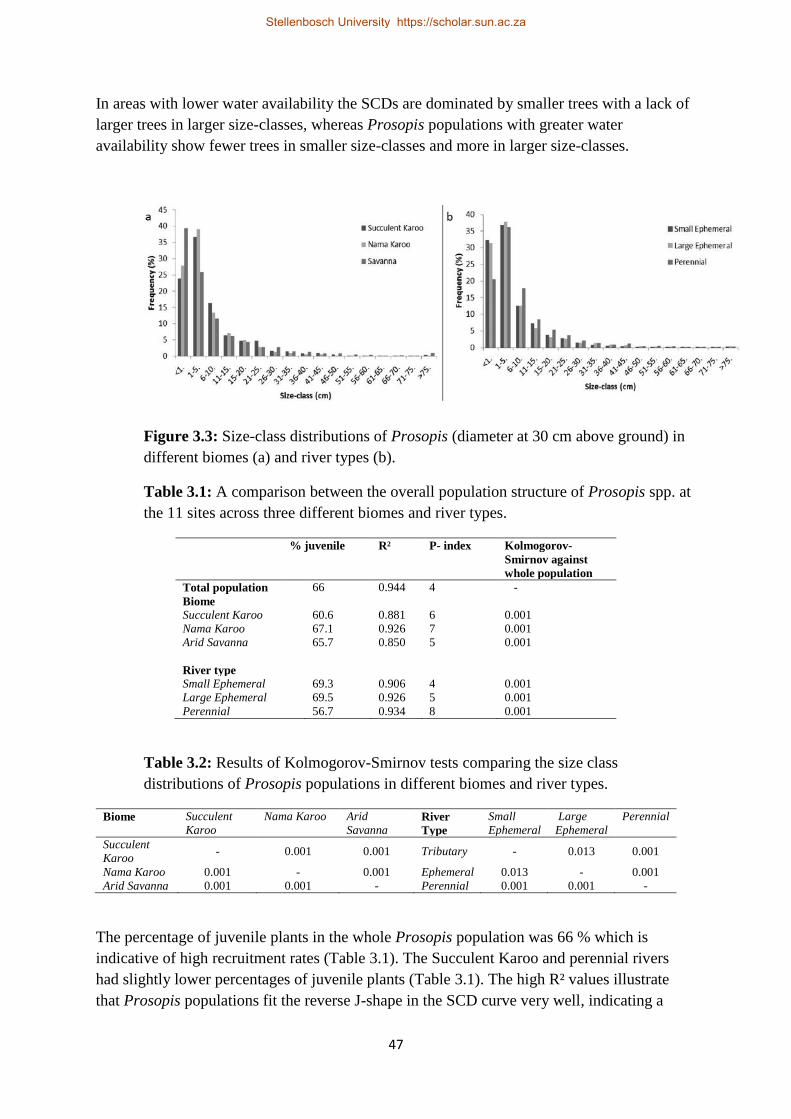
47
In areas with lower water availability the SCDs are dominated by smaller trees with a lack of
larger trees in larger size-classes, whereas Prosopis populations with greater water
availability show fewer trees in smaller size-classes and more in larger size-classes.
Figure 3.3: Size-class distributions of Prosopis (diameter at 30 cm above ground) in
different biomes (a) and river types (b).
Table 3.1: A comparison between the overall population structure of Prosopis spp. at
the 11 sites across three different biomes and river types.
% juvenile R² P- index Kolmogorov-
Smirnov against
whole population
Total population 66 0.944 4 -
Biome
Succulent Karoo 60.6 0.881 6 0.001
Nama Karoo 67.1 0.926 7 0.001
Arid Savanna 65.7 0.850 5 0.001
River type
Small Ephemeral 69.3 0.906 4 0.001
Large Ephemeral 69.5 0.926 5 0.001
Perennial 56.7 0.934 8 0.001
Table 3.2: Results of Kolmogorov-Smirnov tests comparing the size class
distributions of Prosopis populations in different biomes and river types.
Biome Succulent
Karoo
Nama Karoo Arid
Savanna River
Type
Small
Ephemeral
Large
Ephemeral
Perennial
Succulent
Karoo - 0.001 0.001 Tributary - 0.013 0.001
Nama Karoo 0.001 - 0.001 Ephemeral 0.013 - 0.001
Arid Savanna 0.001 0.001 - Perennial 0.001 0.001 -
The percentage of juvenile plants in the whole Prosopis population was 66 % which is
indicative of high recruitment rates (Table 3.1). The Succulent Karoo and perennial rivers
had slightly lower percentages of juvenile plants (Table 3.1). The high R² values illustrate
that Prosopis populations fit the reverse J-shape in the SCD curve very well, indicating a
Stellenbosch University https://scholar.sun.ac.za

48
stable populations with high recruitment (Table 3.1). Populations of Prosopis in the Nama
Karoo fitted the revers J-shape in the SCD curve better than populations in the other biomes.
Quotients between successive size-classes show an unevenly distributed population, with
high variation in small and large size-classes with more stability in the middle size-classes
(Figure 3.1 and 3.4). The Succulent Karoo and Nama Karoo showed low fluctuating
quotients, whereas Prosopis populations in the Arid-Savanna were stable except when it
came to the larger size-classes.
Figure 3.4: Quotients indicating population stability between successive size-classes
for Prosopis populations in different biomes and river types.
The P-index was fairly similar for the different biomes (Table 3.1). Populations in perennial
rivers (high water availability) showed the highest amount of discontinuity. This may be
because there were more large trees and fewer juveniles in these areas. Populations in small
ephemeral rivers had the lowest P-index, meaning that they had the most stable
monotonically declining population size structures. The fact that P-values in all areas are very
low suggests that these Prosopis populations are undergoing regular recruitment (i.e. SCD
monotonically declining) areas across their range in South Africa.
3.5.2 Tree population trends under Prosopis invasion
All populations had positively skewed SCD curves (Figure 3.5) with the native trees
populations in ZL invasions fitting the reverse J-shape in the SCD better than tree populations
in MH-density invasions highlighted by the R² values (Figure 3.5; Table 3.3). Native tree
populations under MH density invasions often had similar populations in the juvenile and
adult populations but had lower numbers of trees in the middle size-classes (Figure 3.5).
About 60 % of the native tree species found under ZL Prosopis invasion densities had
significantly different SCDs population shapes compared to those under MH invasions
(Kolmogorov-Smirnov p < 0.05) (Table 3.3). Prosopis is also having a negative impact on
the population stability of another alien invasive tree in South Africa, Tamarix ramosissima
(Table 3.3).
Stellenbosch University https://scholar.sun.ac.za

49
Figure 3.5: Population structures of native and alien invasive trees found in areas
with zero-low (ZL) and moderate to high (MH) levels of Prosopis invasion based on
stem diameters 30 cm above the ground.
Stellenbosch University https://scholar.sun.ac.za

50
Table 3.3: Population parameters for native trees and the alien Tamarix ramosissima
at sites with (zero to low) ZL and (moderate to high) MH levels of Prosopis invasion.
Species ZL invasion MH invasion Kolmogorov-
Smirnov
R² P-index R² P-index p-value
Acacia erioloba 0.780 40 0.006 138 0.01
Acacia karroo 0.886 18 0.856 23 0.007
Acacia mellifera 0.964 2 0.417 10 0.946
Diospyros lycioides 0.794 12 0.239 30 0.005
Ehretia rigida 0.723 12 0.181 12 0.640
Grewia flava 0.853 4 0.154 4 0.264
Olea europaea subsp. africana 0.735 32 0.139 66 0.01
Salix mucronata 0.217 50 0.231 54 0.9
Searsia lancea 0.831 37 0.596 58 0.002
Searsia pendulina 0.873 26 0.341 74 0.001
Searsia undulata 0.709 6 0.057 16 0.643
Tamarix ramosissima 0.898 10 0.786 28 0.001
Ziziphus mucronata 0.891 33 0.631 40 0.009
Quotients fluctuated for all species but were generally more stable for areas with ZL density
Prosopis invasion compared to MH density invasion (Figure 3.6). The higher P-index for all
species (except Ehretia rigida and Grewia Flava which were the same) in sites with MH
density invasions compared to ZL Prosopis invasion density indicates a higher level of
discontinuity within populations (Table 3.3) and, therefore, a less stable population structure.
Stellenbosch University https://scholar.sun.ac.za

51
Figure 3.6: Quotients comparing native tree population stability between successive
size-classes in areas of zero-low (ZL) and moderate to high (MH) levels of Prosopis
invasion.
5.3. Effects of Prosopis invasion tree species mortality
As Prosopis basal area increased the basal area of dead native trees increased significantly (p
< 0.001) (Figure 3.7). Approximately 36 % of the basal area mortality of woody plants is
explained by Prosopis invasion. Larger Prosopis basal areas were also related to a significant
increase in the number of dead trees/ha and the mean number of dead plant species per 100
m² at different Prosopis basal areas (P < 0.001).
Stellenbosch University https://scholar.sun.ac.za
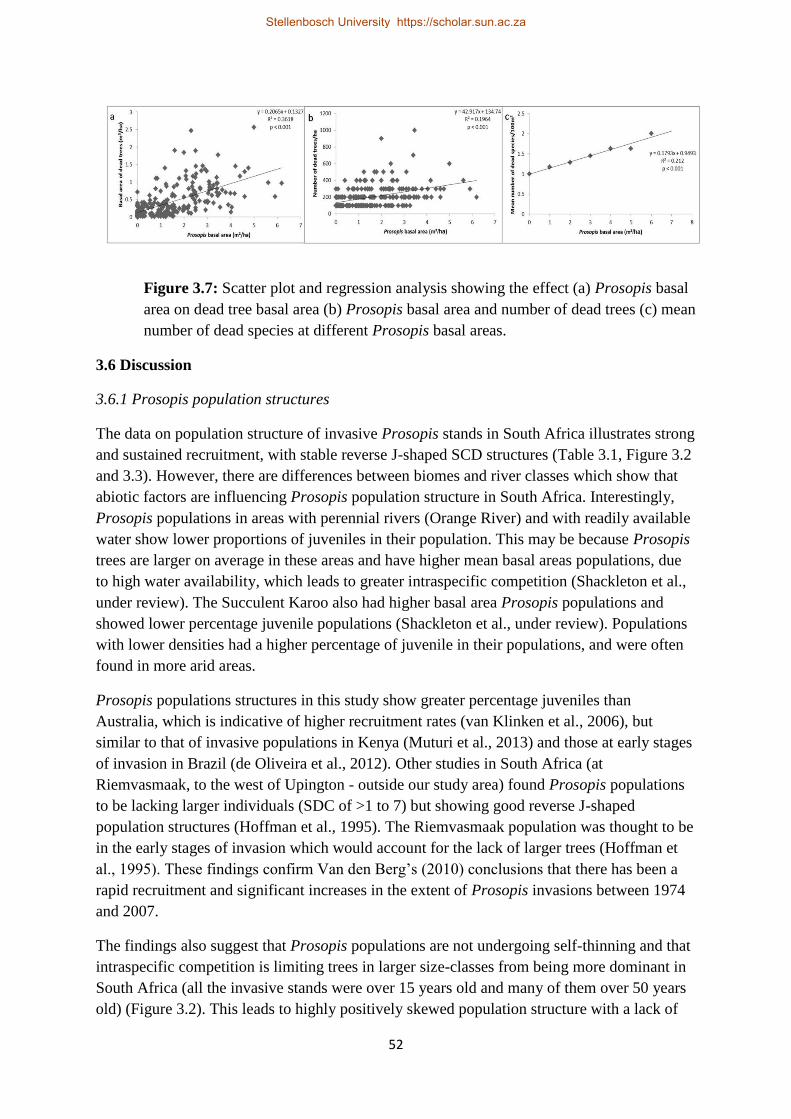
52
Figure 3.7: Scatter plot and regression analysis showing the effect (a) Prosopis basal
area on dead tree basal area (b) Prosopis basal area and number of dead trees (c) mean
number of dead species at different Prosopis basal areas.
3.6 Discussion
3.6.1 Prosopis population structures
The data on population structure of invasive Prosopis stands in South Africa illustrates strong
and sustained recruitment, with stable reverse J-shaped SCD structures (Table 3.1, Figure 3.2
and 3.3). However, there are differences between biomes and river classes which show that
abiotic factors are influencing Prosopis population structure in South Africa. Interestingly,
Prosopis populations in areas with perennial rivers (Orange River) and with readily available
water show lower proportions of juveniles in their population. This may be because Prosopis
trees are larger on average in these areas and have higher mean basal areas populations, due
to high water availability, which leads to greater intraspecific competition (Shackleton et al.,
under review). The Succulent Karoo also had higher basal area Prosopis populations and
showed lower percentage juvenile populations (Shackleton et al., under review). Populations
with lower densities had a higher percentage of juvenile in their populations, and were often
found in more arid areas.
Prosopis populations structures in this study show greater percentage juveniles than
Australia, which is indicative of higher recruitment rates (van Klinken et al., 2006), but
similar to that of invasive populations in Kenya (Muturi et al., 2013) and those at early stages
of invasion in Brazil (de Oliveira et al., 2012). Other studies in South Africa (at
Riemvasmaak, to the west of Upington - outside our study area) found Prosopis populations
to be lacking larger individuals (SDC of >1 to 7) but showing good reverse J-shaped
population structures (Hoffman et al., 1995). The Riemvasmaak population was thought to be
in the early stages of invasion which would account for the lack of larger trees (Hoffman et
al., 1995). These findings confirm Van den Berg’s (2010) conclusions that there has been a
rapid recruitment and significant increases in the extent of Prosopis invasions between 1974
and 2007.
The findings also suggest that Prosopis populations are not undergoing self-thinning and that
intraspecific competition is limiting trees in larger size-classes from being more dominant in
South Africa (all the invasive stands were over 15 years old and many of them over 50 years
old) (Figure 3.2). This leads to highly positively skewed population structure with a lack of
Stellenbosch University https://scholar.sun.ac.za

53
larger individuals. Muturi et al. (2013) also noted a lack of self-thinning in invasive Prosopis
stands in Kenya. However, in Australia, Prosopis population structures represent more of a
normal curve shape, illustrating slower recruitment with moderate sized trees being dominant
but continued population growth (van Klinken, 2006). The same thinning of native ‘weedy’
Prosopis has been found in populations in the USA and is also a common successional
phenomenon in other semi-arid native ‘weedy’ tree species (Archer, 1995; Shackleton et al.,
2013).
We do not understand the mechanism behind this self-regulation, and why it does not seem to
apply to places like South Africa. Our findings highlight the need for improved control
methods as Prosopis in South Africa shows high recruitment rates and rapid spread (Figure
3.2; Table 3.1; van den Berg 2010). There is also a need to understand the ecology of the
species by adding a temporal component to guide management decisions
3.6.2 The impacts of Prosopis on native tree populations
The analysis of population SCDs suggests that Prosopis invasions are having a negative
effect on native tree population structures and stability. In most cases native tree species
recruitment is higher in non-invaded areas and indicators of population stability (P-index and
quotients) were better in areas with low invasion densities relative to areas with moderate-
high invasion (Figure 3.5 and 3.6; Table 3.3). However, it must be noted that recruitment in
arid ecosystems is stochastic, and is highly dependent on above-average annual precipitation
over a few seasons (Chesson et al. 2004). In most of the Northern Cape rainfall has been
slightly above average in the three years preceding the study which may account for the high
number of Prosopis juveniles and high juvenile populations for many native species
(Agricultural Research Council, unpublished data). However, there has been high rainfall
variability over the last 10 years, which may be contributing to the stochastic population’s
structures. There is seedling establishment for most native species and the larger native trees
are present in invaded areas. However, the middle size classes for most native tree
populations were lower in MH density Prosopis invasions (Figure 3.5). Acacia erioloba,
Ehretia rigida and Olea europaea subsp. africana showed very little to no recruitment in
areas invaded with Prosopis but did juveniles in areas with lower invasion (Figure 3.5). Salix
mucronata was the only species with no juveniles in areas with both low and moderate to
high invasion. This suggests that most native tree seedlings can initially establish in invasive
Prosopis stands but are soon outcompeted. It also shows that large well-established trees can
compete with Prosopis, although they are likely to die back eventually (Figure 3.5 and Figure
3.7). Native tree seedlings were also found in invasive Prosopis stands in Kenya, with a lack
of native trees in the middle and large size-classes (Muturi et al., 2013). This illustrates the
negative impacts of Prosopis on native species population stability in South Africa and also
in other parts of Africa (Maturi et al., 2013). The results suggest that interspecific
competition for limited resources between Prosopis and native trees is causing increased
native tree mortality (Figure 3.7). Mascaro et al. (2008) also show many more dead stems in
areas with tree invasions as opposed to uninvaded areas, as well as an overall lower
recruitment in Hawai’i. In Brazil, P. juliflora invasions reduce native seedling growth rates
by half and cause increased seedling mortality of native woody plants (de Souza Nascimento
Stellenbosch University https://scholar.sun.ac.za

54
et al., 2014). The increased native tree mortality and negative impact on population structure
is of particular concern for protected and keystone species in South Africa like Acacia
erioloba (Milton and Dean, 1995; Seymour et al., 2003) (Figure 3.5). Prosopis invasions also
negatively impact A. erioloba populations due to increased competition for ground water, as
they have deeper root systems and are causing substantial dieback of this species
(Schachtschneider and February, 2013). Interestingly, Prosopis also seems to be slowly out-
competing another invasive alien tree species - Tamarix ramosissima.
The formation of these dense monospecific stands of Prosopis dominated by small to
moderate sized trees in invaded areas as seen in South Africa is particularly problematic
(Figure 3.2). This is because these Prosopis thickets reduce grazing potential, access to land,
and produce small shrubby trees that provide no little or no goods and services for human use
(Mwangi and Swallow, 2005; Shackleton et al., 2014). The loss of native trees due to
Prosopis invasion also has negative effects on other species like birds, due to reduction of
suitable nesting sites and food availability (Dean et al., 2002). Prosopis invasion also affects
local human communities who rely on many specific natural resources from native trees, for
example A. erioloba is extremely popular for fuelwood and fodder (Powell 2001; Stave et al.,
2007).
3.6.3 Prosopis management
Our findings illustrate the need for the management of Prosopis, as it is impacting native
biodiversity and recruiting rapidly. The insights on Prosopis population structures discussed
here will be useful for guiding management. Prosopis is often managed using a control-
through-utilisation approach in developing countries, as this provides valuable resources
(Pasiecznik and Felker, 2006; Kazmi, 2009; Choge et al., 2012). Having an understanding of
the SCD of Prosopis populations is essential when considering this approach as it can inform
managers how many trees can be harvested and allow for the calculation of potential profits.
One suggestion is to produce timber products such as furniture and flooring using invasive
Prosopis trees in Africa, which is commonly done with Prosopis in its native range.
However, trees need to be greater than 20 cm in diameter for this (Felker, 2002). The
Prosopis SCD (Figure 3.2) shows that trees of this size-class are uncommon in invasive
stands in South Africa. Areas in Kenya also lack larger trees (Muturi et al., 2013). This
suggests that management of Prosopis through timber extraction is not a viable option in
South Africa and possibly in other parts of Africa such as Kenya. However, there is potential
for the use and management of Prosopis to create charcoal, bio-char and ethanol, which can
be made from smaller trees (Kazmi, 2009). Localised small-scale power generation is also
viable for these smaller sized trees and power plants are currently being built in Kenya to aid
local development and try and reduce Prosopis invasion cover (Shackleton et al., 2014).
At a local level, having information of invasive species population structures can greatly aid
management. Currently, planning for clearing projects conducted by the Working for Water
programme is based on ad hoc estimates of population structure based on crude visual
estimation. Knowledge of the SCDs of populations and having this baseline data will enable
Working for Water to better calculate clearing costs. Information on invasive Prosopis
Stellenbosch University https://scholar.sun.ac.za
55
population structure is also needed for monitoring, to assess the effectiveness of management
strategies. This baseline information is also needed if adaptive management is going to be
implemented to track project success.
3.7 Conclusions and priorities for future research
Prosopis invasions in South Africa are impacting the population stability of many native tree
species. These trees provide important ecosystem services in the arid and semi-arid parts of
South Africa and therefore Prosopis invasions need to be managed to mitigate against the
loss of these services. This research can be taken further by adding a temporal component;
this will involve re-visiting sites to collect data to facilitate population growth modelling and
elasticity analysis which would allow for more detailed comparisons between different
populations and for the calculation of population growth rates (Golubov et al., 1999). There is
also a need for further research on the impacts of Prosopis invasions on species - especially,
rare, endemic and endangered species, such as the Riverine rabbit (Bunolagus monticularis).
A national strategy is needed to guide the management of invasive populations of Prosopis in
South Africa and in other regions where it is invasive, and an understanding Prosopis
population structure and the impacts of invasion on native tree species will help to facilitate
this.
Acknowledgments
We thank all the farmers who allowed access to their land and staff from Working for Water
who helped in locating study sites. Funding was provided by the DST-NRF Centre of
Excellence for Invasion Biology and Working for Water Programme through their
collaborative research project on “Integrated management of invasive alien species in South
Africa” and the National Research Foundation (grant 85417 to DMR).
Stellenbosch University https://scholar.sun.ac.za
56
Chapter 4: Stakeholder perceptions and practices regarding Prosopis
(mesquite) invasions and management in South Africa
This chapter was published in Ambio
Reference: Shackleton, R.T., Le Maitre, D.C. and Richardson, D.M. 2015. Stakeholder
perceptions and practices regarding Prosopis (mesquite) invasions and management in South
Africa. Ambio 44: 469-581.
Abstract
Invasive alien trees impact the environment and human livelihoods. The human dimensions
of such invasions are less well understood than the ecological aspects, and this is hindering
the development of effective management strategies. Semi-structured interviews were
undertaken to investigate the knowledge and perceptions Prosopis between different
stakeholder groups. Chi-squared tests, Welch ANOVAs and Principle Component Analyses
were run. Factors such as land tenure and proximity to invasions were especially important
for explaining differences in perceptions and practices relating to Prosopis among different
stakeholder groups. Most respondents were aware of Prosopis and considered it to be
invasive (i.e., spreading). Costs associated with Prosopis were perceived to exceed benefits,
and most stakeholders wanted to see a reduction in the abundance of Prosopis stands. The
mean total cost for the management of Prosopis was US$ 1 914 yr-1 per farm, where costs
ranged from under US$ 10 to over UD$ 500 per ha based on invasion densities and objectives
for control. The findings highlight the need for more effective management interventions.
4.1 Introduction
Biological invasions impact biodiversity, ecosystem services and human well-being globally
and further research on invasion dynamics, impacts and options for management is needed to
identify options for sustainable management (Pimentel, 2002; Pyšek and Richardson, 2010).
Research on invasive species is normally approached from the domain of ecology, and more
recently economics. Far less attention has been given to understanding the wider social
dimensions of invasions (McNeely, 2001; García-Llorente et al. 2008; 2011). Insights on the
human dimensions of invasive alien species are essential for effective decision making; in
many cases complex social issues delineate the full suite of benefits and costs associated with
invasions (García-Llorente et al. 2008). Research is needed to evaluate stakeholder
knowledge, perceptions, practices, awareness and wants and needs relating to biological
invasions (Shackleton et al. 2007; Eiswerth et al. 2011; Kull, 2011; Rai and Scarborough,
2014). This is particularly important for invasive species that were introduced for specific
purposes and where complex conflicts of interest now exist due to the provision of valuable
consumptive and non-consumptive services (Shackleton et al. 2007; Low, 2012a; Dickie et
al. 2014; van Wilgen and Richardson 2014).
Many invasive alien species such as Australian acacias, Opuntia ficus-indica and Prosopis
provide services such as fuelwood, medicine and edible products to local communities (de
Neergard et al. 2005; Pasiecznik et al. 2006; Shackleton et al. 2007; Shackleton et al. 2011).
Stellenbosch University https://scholar.sun.ac.za
57
In the semi-arid parts of Brazil the direct-use services provided by invasive species were seen
as more important for local communities than native species (Dos Santos et al. 2014). Pinus
spp., Prosopis and other invasive trees are also exploited commercially on a large scale by
private companies (Moran et al. 2002; Shackleton et al. 2014). Additionally, species like Acer
platanoides, Jacaranda mimosifolia and Pinus are valued for aesthetic and cultural reasons
by communities (Foster and Sandberg, 2004; Dickie et al. 2014). However, these species also
have negative impacts on biodiversity, ecosystem services and local livelihoods.
Prosopis taxa have been introduced to many parts of the world over past centuries to curb
desertification, stabilise soils and to provide services such as fuelwood, fodder and shade to
aid local communities (Pasiecznik et al. 2001; Low, 2012b; Shackleton et al. 2014). As with
most invasive alien woody plants around the world (Richardson et al. 2014), Prosopis
introductions were initially seen as only beneficial to most stakeholders. However, negative
perceptions of Prosopis grew as its abundance increased and adverse effects of invasions
emerged (Pasiecznik et al. 2001; Mwangi and Swallow, 2005; Maundu et al. 2009;
Shackleton et al. 2014).
There is growing evidence of the costs of Prosopis invasions on biodiversity, ecosystem
services and the economy in South Africa (Shackleton et al. 2014). This includes reductions
in bird and insect species richness and diversity (Steenkamp and Chown, 1996; Dean et al.
2002), Prosopis causing increased mortality of Acacia erioloba due to competition for
limited resources (Schachtschneider and February, 2013), loss of grazing potential (Ndhlovu
et al. 2011), impacts on water resources (Dzikiti et al. 2013) and negative impacts on the
South African economy (Wise et al. 2012). On the other hand it is still used for fodder and
fuelwood in its invasive range (Wise et al. 2012). However, understanding of the social
dimensions of Prosopis invasions is poor, and this is thwarting attempts to implement
effective management to reduce the costs while, where possible, maintaining some or all of
the benefits (Richardson, 1998). Key factors that influence human perceptions of invasive
alien species generally relate to the abundance of the invader, the services it provides, the
time since introduction, the mode of introduction and many socio-political features of human
societies (Binggeli, 2001; Donlan and Martin, 2004; Shackleton et al. 2007; Kull et al. 2011;
Rai and Scarborough, 2014).
Current management interventions for Prosopis in South Africa focus on an integrated
approach involving mechanical control and chemical control by the national Working for
Water Programme, and biological control (Zachariades et al. 2011; van Wilgen et al. 2012).
Although success has been achieved in reducing the density and impacts of invasive stands
on a small scale in some areas, the extent and magnitude of impacts is increasing rapidly
(Wise et al 2012). Between 1996 and 2008 the cover of Prosopis in South Africa increased
by 35%, despite the expenditure of R 435.5 million (US$ 42.7 million) on management (van
Wilgen et al. 2012). The release of further biological control agents may be the only cost
effective way of managing Prosopis invasions. However, further work in this area has been
put on hold due to the conflicts of interest surrounding Prosopis use (Zachariades et al. 2011;
Wise et al. 2012). A national strategy for tackling invasive Prosopis, along the lines of one
proposed for Australian acacia species in South Africa (van Wilgen et al. 2011), is urgently
Stellenbosch University https://scholar.sun.ac.za
58
needed. A key prerequisite for such a strategy is a much improved understanding of the social
dimensions of the problem.
In many cases management strategies have been implemented without due consultation with
stakeholders about their perceptions and needs. This has in some cases resulted in conflicts of
interest issues relating to livelihood vulnerability and has led to wastage of limited funding
(Davis et al. 2011; McNeely, 2011; Rai et al. 2012). Focussed social studies can provide
valuable insights that are helpful for developing shared goals for management and the means
for achieving such goals (Kreuter et al. 2005). However, some social studies on invasive
species have only focused on benefits (de Neergard et al. 2005; Shackleton et al. 2011).
Although this is clearly important, costs also need to be considered to provide comprehensive
guidelines to inform management interventions. Social studies can also build platforms for
improving communication between scientists, managers and the public (Dangles et al. 2010;
Heger et al. 2013). In the case of Prosopis invasions in South Africa, better knowledge of the
human dimensions could certainly help to highlight benefits vs. costs, explore new
opportunities for effective management, and justify contentious interventions.
The aims of this study are to: (1) elucidate the factors that determine the understanding and
perceptions of a woody invasive plant that has both benefits and costs, using Prosopis
invasions in South Africa as a case study; and (2) compare and contrast the knowledge,
perceptions and practices relating to Prosopis among different stakeholders (3) use the
information gained to suggest management interventions in the future.
4.2 Study sites
The study was conducted at 10 locations across the invasive range of Prosopis in South
Africa (Figure 4.1 and 4.2). The area covers the Succulent Karoo, Nama Karoo and Savanna
biomes in the Northern Cape province. The area included sites with private and communal
land tenure systems, and towns and villages of different sizes. Kimberly and Upington are the
two largest towns in the study area with populations of over 200 000 and 50 000 people
respectively. Calvinia, Prieska and Carnavon are small towns with populations of 10 000 to
20 000 people. The other towns and villages have fewer than 5000 people.
Stellenbosch University https://scholar.sun.ac.za

59
Figure 4.1: Towns in the Northern Cape province, South Africa, where surveys were
conducted to determine human perceptions relating to Prosopis invasions. The dots
represent the distribution of Prosopis in South Africa (Source of Map – Henderson,
SAPIA database, ARC-Plant Protection Research Institute, Pretoria).
Stellenbosch University https://scholar.sun.ac.za
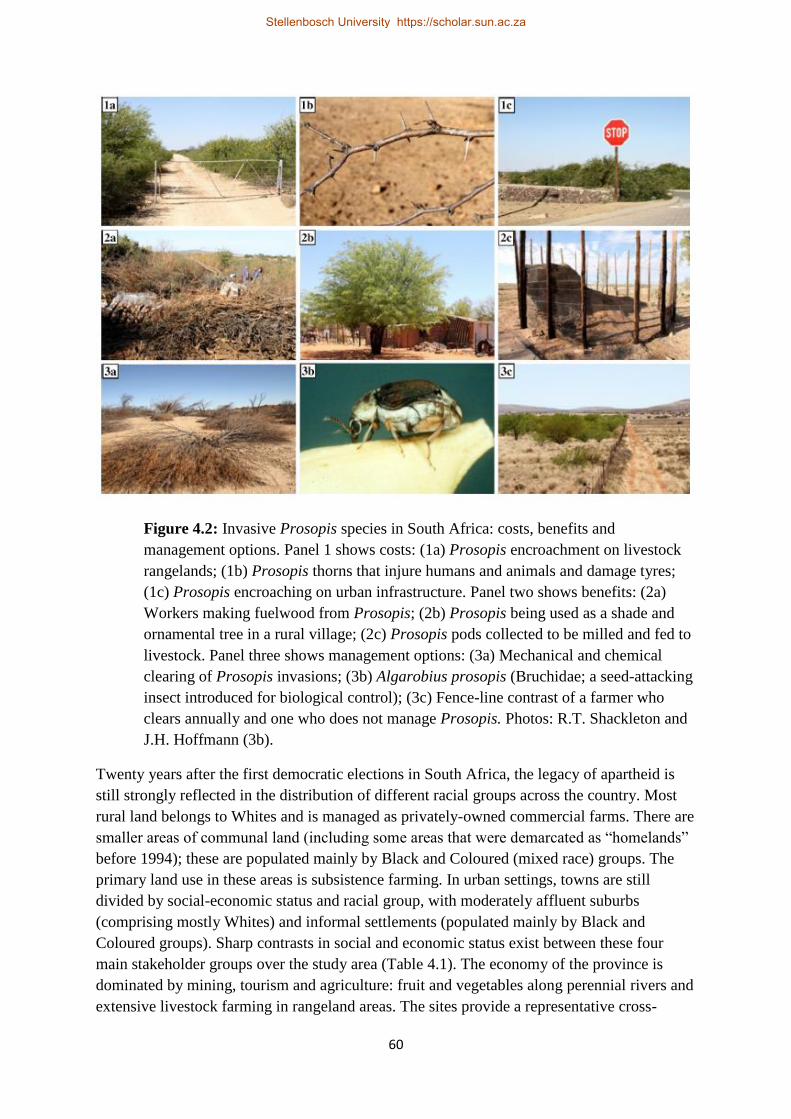
60
Figure 4.2: Invasive Prosopis species in South Africa: costs, benefits and
management options. Panel 1 shows costs: (1a) Prosopis encroachment on livestock
rangelands; (1b) Prosopis thorns that injure humans and animals and damage tyres;
(1c) Prosopis encroaching on urban infrastructure. Panel two shows benefits: (2a)
Workers making fuelwood from Prosopis; (2b) Prosopis being used as a shade and
ornamental tree in a rural village; (2c) Prosopis pods collected to be milled and fed to
livestock. Panel three shows management options: (3a) Mechanical and chemical
clearing of Prosopis invasions; (3b) Algarobius prosopis (Bruchidae; a seed-attacking
insect introduced for biological control); (3c) Fence-line contrast of a farmer who
clears annually and one who does not manage Prosopis. Photos: R.T. Shackleton and
J.H. Hoffmann (3b).
Twenty years after the first democratic elections in South Africa, the legacy of apartheid is
still strongly reflected in the distribution of different racial groups across the country. Most
rural land belongs to Whites and is managed as privately-owned commercial farms. There are
smaller areas of communal land (including some areas that were demarcated as “homelands”
before 1994); these are populated mainly by Black and Coloured (mixed race) groups. The
primary land use in these areas is subsistence farming. In urban settings, towns are still
divided by social-economic status and racial group, with moderately affluent suburbs
(comprising mostly Whites) and informal settlements (populated mainly by Black and
Coloured groups). Sharp contrasts in social and economic status exist between these four
main stakeholder groups over the study area (Table 4.1). The economy of the province is
dominated by mining, tourism and agriculture: fruit and vegetables along perennial rivers and
extensive livestock farming in rangeland areas. The sites provide a representative cross-
Stellenbosch University https://scholar.sun.ac.za
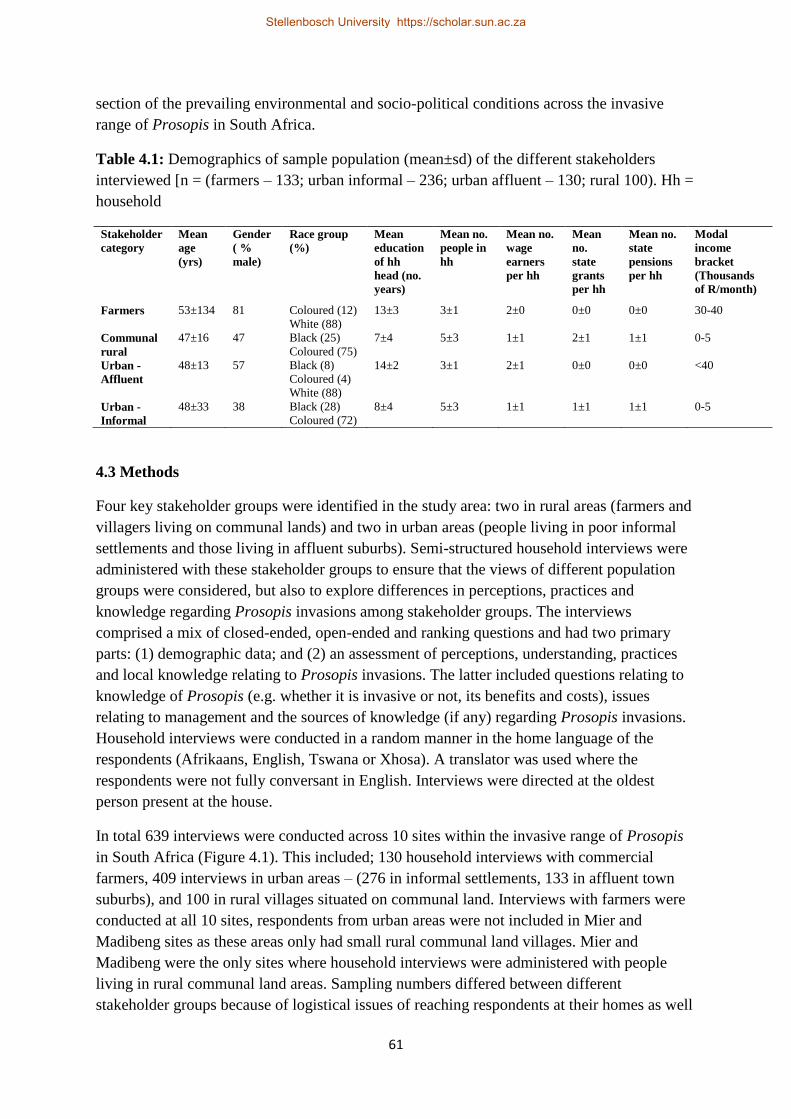
61
section of the prevailing environmental and socio-political conditions across the invasive
range of Prosopis in South Africa.
Table 4.1: Demographics of sample population (mean±sd) of the different stakeholders
interviewed [n = (farmers – 133; urban informal – 236; urban affluent – 130; rural 100). Hh =
household
Stakeholder
category
Mean
age
(yrs)
Gender
( %
male)
Race group
(%)
Mean
education
of hh
head (no.
years)
Mean no.
people in
hh
Mean no.
wage
earners
per hh
Mean
no.
state
grants
per hh
Mean no.
state
pensions
per hh
Modal
income
bracket
(Thousands
of R/month)
Farmers 53±134 81 Coloured (12)
White (88)
13±3 3±1 2±0 0±0 0±0 30-40
Communal
rural
47±16 47 Black (25)
Coloured (75)
7±4 5±3 1±1 2±1 1±1 0-5
Urban -
Affluent
48±13 57 Black (8)
Coloured (4)
White (88)
14±2 3±1 2±1 0±0 0±0 <40
Urban -
Informal
48±33 38 Black (28)
Coloured (72)
8±4 5±3 1±1 1±1 1±1 0-5
4.3 Methods
Four key stakeholder groups were identified in the study area: two in rural areas (farmers and
villagers living on communal lands) and two in urban areas (people living in poor informal
settlements and those living in affluent suburbs). Semi-structured household interviews were
administered with these stakeholder groups to ensure that the views of different population
groups were considered, but also to explore differences in perceptions, practices and
knowledge regarding Prosopis invasions among stakeholder groups. The interviews
comprised a mix of closed-ended, open-ended and ranking questions and had two primary
parts: (1) demographic data; and (2) an assessment of perceptions, understanding, practices
and local knowledge relating to Prosopis invasions. The latter included questions relating to
knowledge of Prosopis (e.g. whether it is invasive or not, its benefits and costs), issues
relating to management and the sources of knowledge (if any) regarding Prosopis invasions.
Household interviews were conducted in a random manner in the home language of the
respondents (Afrikaans, English, Tswana or Xhosa). A translator was used where the
respondents were not fully conversant in English. Interviews were directed at the oldest
person present at the house.
In total 639 interviews were conducted across 10 sites within the invasive range of Prosopis
in South Africa (Figure 4.1). This included; 130 household interviews with commercial
farmers, 409 interviews in urban areas – (276 in informal settlements, 133 in affluent town
suburbs), and 100 in rural villages situated on communal land. Interviews with farmers were
conducted at all 10 sites, respondents from urban areas were not included in Mier and
Madibeng sites as these areas only had small rural communal land villages. Mier and
Madibeng were the only sites where household interviews were administered with people
living in rural communal land areas. Sampling numbers differed between different
stakeholder groups because of logistical issues of reaching respondents at their homes as well
Stellenbosch University https://scholar.sun.ac.za

62
as being based on the population demographics of the different groups. For most areas there
were a very limited number of farmers in the area based on their large farm sizes. Villages
occurring in the communal rural land areas were very small, so sample sizes were very
limited. More interviews than were initially planned were conducted with people in urban
informal settlements as the interviews at these sites went faster than planned because
unemployment was high and most households had someone present throughout the day.
Interview times in these communities were therefore not restricted to early evenings.
Chi-squared tests (χ²) and Welch ANOVAs were used to compare responses between the four
different stakeholder groups. Principal Component Analyses were run to assess the
relationship between respondents’ demographic variables and understanding and perceptions
relating to Prosopis invasions in South Africa.
4.4 Results
4.4.1 Knowledge and perceptions on Prosopis invasions
The majority of the sample population were aware of Prosopis (Table 4.2). However, a
significantly poorer knowledge of Prosopis was found in urban suburbs where 35 % of
respondents did not know what Prosopis was (Table 4.2). Knowledge of Prosopis was related
to town size and proximity to invasions, with people in urban informal settlements and
affluent areas in large towns (Kimberly and Upington) having a significantly poorer
knowledge of Prosopis (informal settlements: 78.2 %; affluent areas: 33.7 % of people had
no knowledge) compared to a much lower percentage in smaller towns (informal settlements:
2.1 %; affluent areas: 6.0 % not knowing) (χ² 96.8; df = 1; p < 0.001).
Table 4.2: Stakeholder responses (mean) to questions relating to knowledge and
perceptions of Prosopis in South Africa.
Questions Farmers Urban -
Informal
Urban -
Affluent
Communal land χ², df, p-
value
Do you know what Prosopis is?
(also accepted and used local names
mentioned above) (% people
responding yes)
100 93.5 65.4 100 123.8; 3;
0.001
Do you have Prosopis on your
property? (% yes)
94 29.6 13.5 61 224.1; 3;
0.001
Did you plant the Prosopis on your
property? (% yes)
1.5 3.5 4.8 3.6 6.4; 3; 0.1
Is Prosopis spreading on your
property? (% yes)
96.7 78.2 83.5 98.4 14.1; 3; 0.003
Is Prosopis spreading in the
environment around you? (% yes)
100 87.3 74.4 100 149.7; 6;
0.001
If you don’t have Prosopis trees on
your property would you like to it?
(% yes)
0 9.8 0.9 2.1 42.4; 6; 0.001
Did you know Prosopis is an
invasive alien tree?
100 37.1 58.3 53 146.0; 3;
0.001
Prosopis invasions were much more prevalent on farms and rural communal areas compared
to urban properties. Ninety-four percent of farmers had Prosopis on their land, and on
average more people in rural communal areas (61 %) than people in urban areas (29.6 % in
Stellenbosch University https://scholar.sun.ac.za
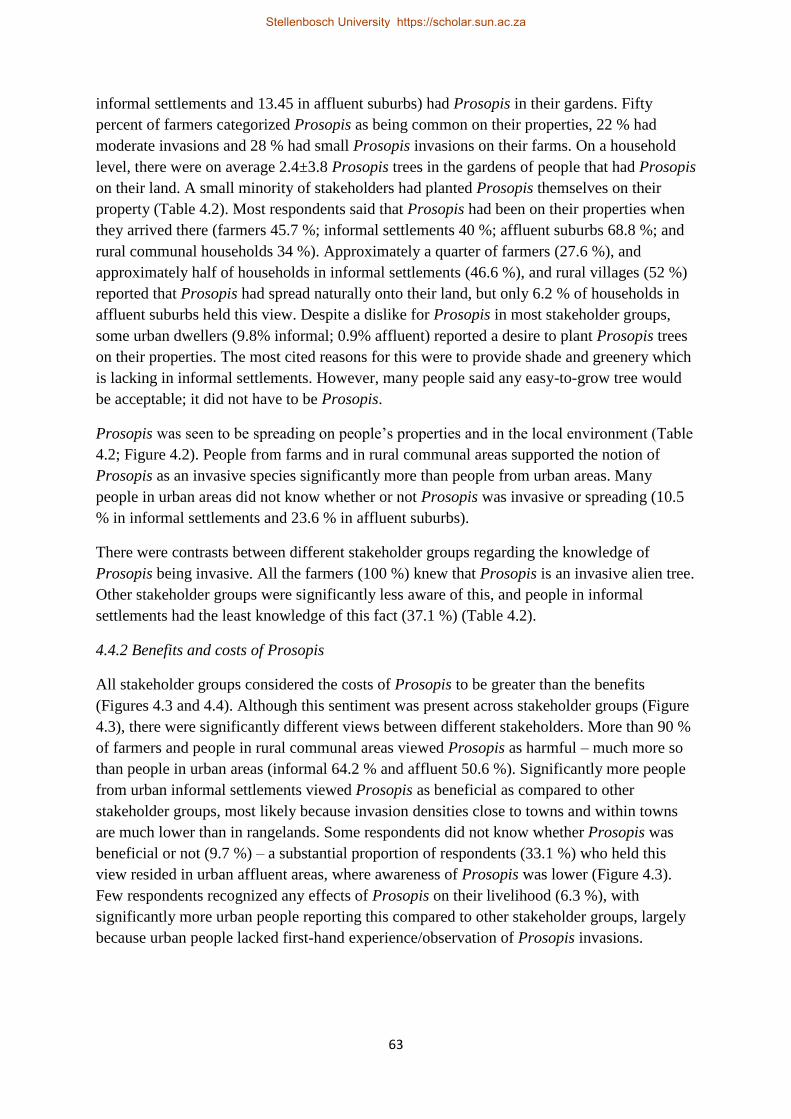
63
informal settlements and 13.45 in affluent suburbs) had Prosopis in their gardens. Fifty
percent of farmers categorized Prosopis as being common on their properties, 22 % had
moderate invasions and 28 % had small Prosopis invasions on their farms. On a household
level, there were on average 2.4±3.8 Prosopis trees in the gardens of people that had Prosopis
on their land. A small minority of stakeholders had planted Prosopis themselves on their
property (Table 4.2). Most respondents said that Prosopis had been on their properties when
they arrived there (farmers 45.7 %; informal settlements 40 %; affluent suburbs 68.8 %; and
rural communal households 34 %). Approximately a quarter of farmers (27.6 %), and
approximately half of households in informal settlements (46.6 %), and rural villages (52 %)
reported that Prosopis had spread naturally onto their land, but only 6.2 % of households in
affluent suburbs held this view. Despite a dislike for Prosopis in most stakeholder groups,
some urban dwellers (9.8% informal; 0.9% affluent) reported a desire to plant Prosopis trees
on their properties. The most cited reasons for this were to provide shade and greenery which
is lacking in informal settlements. However, many people said any easy-to-grow tree would
be acceptable; it did not have to be Prosopis.
Prosopis was seen to be spreading on people’s properties and in the local environment (Table
4.2; Figure 4.2). People from farms and in rural communal areas supported the notion of
Prosopis as an invasive species significantly more than people from urban areas. Many
people in urban areas did not know whether or not Prosopis was invasive or spreading (10.5
% in informal settlements and 23.6 % in affluent suburbs).
There were contrasts between different stakeholder groups regarding the knowledge of
Prosopis being invasive. All the farmers (100 %) knew that Prosopis is an invasive alien tree.
Other stakeholder groups were significantly less aware of this, and people in informal
settlements had the least knowledge of this fact (37.1 %) (Table 4.2).
4.4.2 Benefits and costs of Prosopis
All stakeholder groups considered the costs of Prosopis to be greater than the benefits
(Figures 4.3 and 4.4). Although this sentiment was present across stakeholder groups (Figure
4.3), there were significantly different views between different stakeholders. More than 90 %
of farmers and people in rural communal areas viewed Prosopis as harmful – much more so
than people in urban areas (informal 64.2 % and affluent 50.6 %). Significantly more people
from urban informal settlements viewed Prosopis as beneficial as compared to other
stakeholder groups, most likely because invasion densities close to towns and within towns
are much lower than in rangelands. Some respondents did not know whether Prosopis was
beneficial or not (9.7 %) – a substantial proportion of respondents (33.1 %) who held this
view resided in urban affluent areas, where awareness of Prosopis was lower (Figure 4.3).
Few respondents recognized any effects of Prosopis on their livelihood (6.3 %), with
significantly more urban people reporting this compared to other stakeholder groups, largely
because urban people lacked first-hand experience/observation of Prosopis invasions.
Stellenbosch University https://scholar.sun.ac.za

64
Figure 4.3: Stakeholder views of the benefits and costs of Prosopis in South Africa
(χ² = 205.1; df = 12; p < 0.001).
Prosopis was recognized as beneficial to some people in the study area (Figure 4.3). In total,
13 types of benefits were reported, the most common being fodder, fuelwood and shade
(Table 4.3). A small minority of respondents (< 5 %) also mentioned other direct and indirect
benefits of Prosopis, such as honey, local greenery, aesthetic value in towns and gardens,
acting as wind breaks, creating privacy for households, and as an ingredient for the brewing
of beer/alcohol.
Figure 4.4: Different views of stakeholder groups on whether costs associated with
Prosopis are greater than the benefits? (χ² = 135.8; df = 6; p < 0.001).
Many farmers mentioned that despite the use of Prosopis as a fodder source for livestock, the
consumption of pods by livestock facilitated the spread of Prosopis on their properties. Some
farmers (3.8 %) reported using an alternate feeding strategy that maximizes Prosopis fodder
benefits while reducing spread. This involved milling pods to powder (breaking up the seeds)
prior to providing them as a supplement to livestock (Figure 4.2). This is, however, labour
intensive and expensive. In the affluent suburbs Prosopis was seen as having medicinal
0
10
20
30
40
50
60
70
80
Beneficial Harmful No inflence Bothbeneficial
and harmful
Don't know
Pe
rce
nta
ge (
%)
Stakeholder response
Farmers
Urban- Informal
Urban- Affluent
Communal areas
0
10
20
30
40
50
60
70
80
90
100
Farmers Urban-Informal Urban-Affluent Communalareas
Pe
rce
nta
ge (
%)
Stakeholder groups
Yes Don'tknow
Stellenbosch University https://scholar.sun.ac.za

65
benefits. Many respondents reported its use for stabilizing blood-sugar levels in the form of a
South African product called “Manna”. This is manufactured from Prosopis pods and is
popular in affluent communities. Many people in informal settlements highlighted the use of
Prosopis pods for food, predominantly as snack eaten by children. Eating Prosopis pods as an
adult carries a negative stigma of being poor. Prosopis was seen as promoting local job
creation, particularly by respondents in urban informal and affluent suburbs. These jobs
included the collection of pods in the Prieska area for the company that produces ‘Manna’, as
well clearing Prosopis as part of the Working for Water programme. Although not
specifically mentioned by respondents as a form of job creation, there were people in most
communities who sold fuelwood made from Prosopis, and many farmers sold wood to try
and recover the costs of clearing – which also led to job creation.
Table 4.3: Stakeholder views of benefits (mean) provided by Prosopis (5% and
above) (χ² = 221.5; df = 15; p < 0.001).
Benefits Farmers Urban-Informal Urban-Affluent Communal areas
Fodder 63.1 21.7 23.3 25
Fuelwood 16.2 17 21.8 19
Medicine 1.5 1.1 7.5 0
Shade 16.9 29.3 12.9 26
Children eat pods 0 6.2 0.8 0
Provides jobs 0 6.2 3.8 0
The types and the average number of benefits listed differed significantly between the various
stakeholders groups. (p < 0.001) (Table 4.3). Only fuelwood and shade were commonly
mentioned across all stakeholder groups. Fodder was mentioned on average three times more
by farmers than other stakeholders, and the fact that Prosopis invasions led to job creation
and that Prosopis provides edible products was mentioned most by respondents from
informal settlements. The use of Prosopis to produce the blood sugar medicine was
mentioned mainly by people residing in urban affluent areas. The provision of jobs for
collectors selling pods to make Manna in Prieska and jobs provided by WfW are important in
these rural areas where other employment is low.
In total, 28 different costs associated with Prosopis were mentioned (Table 4.4; Figure 4.2
and 4.3). The most common costs mentioned were negative impacts on water supply and
grazing potential, loss of native species (including grass, shrubs and trees), problems with
encroachment, and transformation of land (Table 4.4). Further complaints (less than 5%)
relating to Prosopis included; death of livestock, increased livestock illness, allergies and
asthma, changing of the taste of water, a reduction in wool quality, flooding caused by it
blocking river systems, and damage to electrical lines. Prosopis was also seen as aesthetically
unpleasing, responsible for giving children stomach problems (after pod ingestion), providing
refuge for criminal activities, and killing of garden plants. The high costs associated with
managing invasions, and the difficulty of removing Prosopis trees (as they coppice profusely)
were also seen as problematic costs associated with the tree.
Stellenbosch University https://scholar.sun.ac.za
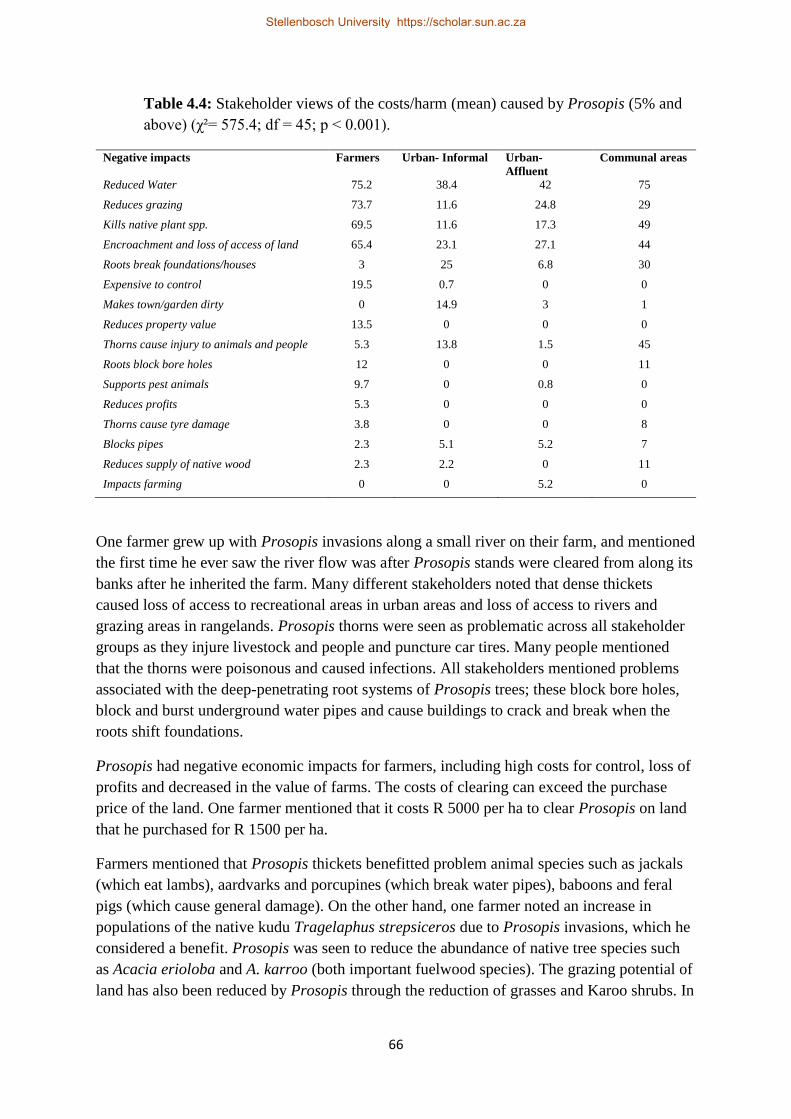
66
Table 4.4: Stakeholder views of the costs/harm (mean) caused by Prosopis (5% and
above) (χ²= 575.4; df = 45; p < 0.001).
Negative impacts Farmers Urban- Informal Urban-
Affluent
Communal areas
Reduced Water 75.2 38.4 42 75
Reduces grazing 73.7 11.6 24.8 29
Kills native plant spp. 69.5 11.6 17.3 49
Encroachment and loss of access of land 65.4 23.1 27.1 44
Roots break foundations/houses 3 25 6.8 30
Expensive to control 19.5 0.7 0 0
Makes town/garden dirty 0 14.9 3 1
Reduces property value 13.5 0 0 0
Thorns cause injury to animals and people 5.3 13.8 1.5 45
Roots block bore holes 12 0 0 11
Supports pest animals 9.7 0 0.8 0
Reduces profits 5.3 0 0 0
Thorns cause tyre damage 3.8 0 0 8
Blocks pipes 2.3 5.1 5.2 7
Reduces supply of native wood 2.3 2.2 0 11
Impacts farming 0 0 5.2 0
One farmer grew up with Prosopis invasions along a small river on their farm, and mentioned
the first time he ever saw the river flow was after Prosopis stands were cleared from along its
banks after he inherited the farm. Many different stakeholders noted that dense thickets
caused loss of access to recreational areas in urban areas and loss of access to rivers and
grazing areas in rangelands. Prosopis thorns were seen as problematic across all stakeholder
groups as they injure livestock and people and puncture car tires. Many people mentioned
that the thorns were poisonous and caused infections. All stakeholders mentioned problems
associated with the deep-penetrating root systems of Prosopis trees; these block bore holes,
block and burst underground water pipes and cause buildings to crack and break when the
roots shift foundations.
Prosopis had negative economic impacts for farmers, including high costs for control, loss of
profits and decreased in the value of farms. The costs of clearing can exceed the purchase
price of the land. One farmer mentioned that it costs R 5000 per ha to clear Prosopis on land
that he purchased for R 1500 per ha.
Farmers mentioned that Prosopis thickets benefitted problem animal species such as jackals
(which eat lambs), aardvarks and porcupines (which break water pipes), baboons and feral
pigs (which cause general damage). On the other hand, one farmer noted an increase in
populations of the native kudu Tragelaphus strepsiceros due to Prosopis invasions, which he
considered a benefit. Prosopis was seen to reduce the abundance of native tree species such
as Acacia erioloba and A. karroo (both important fuelwood species). The grazing potential of
land has also been reduced by Prosopis through the reduction of grasses and Karoo shrubs. In
Stellenbosch University https://scholar.sun.ac.za
67
urban areas Prosopis caused gardens and the city streets to become ‘dirty’ due to leaf and
podfall in the dry season.
The reported cost categories ranged from those associated with single trees causing problems
at a household level (blocking water pipes, cracking foundations, growing into electricity
liens, making gardens dirty) to those at a landscape level (biodiversity loss, encroachment of
land, loss of grazing, water uptake). Chi-squared tests revealed that the types of costs and
number of costs listed differed significantly between different stakeholder groups (p <0.001).
People in rural areas, farms and communal areas were able to identify more costs (3.8 and 3.3
per interviewee) compared with people in urban informal settlements (1.6) and people in
affluent urban areas (1.4).
4.4.3 Prosopis management
The majority of farmers (88 %) implemented some form of management to control invasions
(Table 4.5; Figure 4.2). The most common techniques included manual cutting and herbicide
application to stumps. However, some farmers rented earth-moving machinery to dig up
invasive Prosopis trees, while others applied only a foliar herbicide and burnt the bases of
large trees. Despite the presence of biological control agents (seed-feeding beetles), many
farmers regarded the control method as ineffective. No respondents purposefully used the
control-through-utilization approach, although many farmers did use the wood from felled
trees to partly cover the costs of clearing. Others collected pods to add to feed. Some
suggested that creating large-scale industries to produce paper or bio-energy could improve
control as it would introduce a large-scale demand for Prosopis. However, high transport
costs to and from remote areas was viewed as a potential problem for rolling out such
enterprises.
Table 4.5: Stakeholder perceptions, views and practices (mean ± sd) relation to the
management of Prosopis invasions in South Africa.
Questions Stakeholder groups
Farmers Urban-
Informal
Urban-
Affluent
Communal
areas
χ², df, p-
value
Do you control Prosopis on your
property? (% yes)
87.8 21.3 17.6 46.6 103,9; 3;
0.001
Average annual cost of control? (Rand) 20 667±12024 0 50±22 0 8.3; 3;
0.001
Would you like to see a decrease in
Prosopis population densities in your
area (environment)?
100 92.8 100 99 4.3; 3;
0.23
Would you be happy for the Working
for Water programme to clear Prosopis
on your property? (% yes)
73.4 73.9 67.4 94 90.7; 6;
0.001
Expenditure on the management of Prosopis was highly variable and was based on invasion
densities and goals of management. Expenditure to prevent establishment of invasions in
uninvaded camps was in some cases lower than R 100 per ha and for the removal of moderate
to dense invasions farmers estimated they were paying R 600-2500 per ha using manual
cutting and poisoning and over R 5000 per ha using excavators. The annual average costs of
Stellenbosch University https://scholar.sun.ac.za

68
control implemented by farmers was high with a mean of expenditure of R 20 667±12 024
(R1 = US$ 11.3 – November 2014) per farm per annum. Annual expenditure on the
management of Prosopis was also highly variable, ranging from R 750 – 2000 per farm per
annum, and was spent either on maintaining access roads and water points on densely
invaded farms, or doing annual clearing to prevent the establishment of Prosopis on farms
with sparse invasions. Attempts to achieve local eradication of moderate and dense Prosopis
invasions resulted in expenditure ranging from R 40 000 to R 180 000 per farm per annum.
One farmer mentioned that the South African National Roads Agency offered to clear
Prosopis on his farm in return for road-building material from his farm. They had spent
almost R 500 000 clearing approximately 20 ha of dense invasion using earth-moving
machinery (this figure was not included in the average cost of control calculation).
The proportion of respondents controlling Prosopis in other stakeholder groups was
significantly lower than for farmers. Respondents from the other stakeholder groups mainly
uprooted Prosopis seedlings and some trimmed or felled trees when they got too big. Most
people uprooted and trimmed trees themselves. People in the affluent group employed
gardeners to do this, with costs averaging R 50 per annum.
The majority of respondents from all stakeholder groups wanted to see a decrease in the
abundance of Prosopis in their area (Table 4.5). Most people wanted Working for Water to
clear their land; this view enjoyed significantly more support from people from rural
communal areas than other groups. Their main reasons being that this reduced the negative
impacts of Prosopis and helped reduce the personal costs of clearing. However, many
farmers objected to letting Working for Water teams on their land as they saw them as
ineffective. Examples included the late application of herbicides after cutting, over-dilution
of herbicides, and clearing outside the growing season which results in the herbicide not
being taken up by the Prosopis trees. These trees then coppiced which led to increased
density of invasions. Farmers also noted that the piecemeal clearing technique employed by
Working for Water often left patches of Prosopis between cleared areas and was ineffective
in the long term, as there was a source of seed to reinvade cleared areas. Furthermore, many
farmers expressed concerns about theft of stock and equipment, apparently by Working for
Water teams. The mistrust in the efficiency of the Working for Water program from farmers
has resulted in many landowners preferring to clear Prosopis invasions themselves. A
number of respondents in urban areas did not want Prosopis trees to be removed from their
properties, although they were happy to see them removed from rangelands. Many
respondents reported they would only be happy for Prosopis trees to be removed from urban
areas if these were replaced with other trees by the government.
4.4.5 Factors relating to the knowledge of Prosopis
The majority of respondents observed the benefits and costs of Prosopis first hand. However,
various other knowledge resources were reported by the respondents. Most people who did
not gain knowledge from personal experience, gained knowledge on Prosopis through
interacting with local farmers, and people employed by Working for Water. Others learned
about Prosopis at their places of work and at school. A small percentage of people also
Stellenbosch University https://scholar.sun.ac.za

69
mentioned that they have learned about Prosopis invasions via the media. Prominent sources
were a short documentary on the national environmental TV show “50:50” and adverts for
“Manna” as a blood-sugar stabilizing product. Farmers who do not have Prosopis on their
land said they have observed and heard about the benefits and costs at quarterly meetings of
farmers associations. The origin of the knowledge on the benefits and impacts of Prosopis
differs significantly between the stakeholder groups (P < 0.001) (Table 4.6). Generally,
farmers and people in rural communal areas experienced benefits and costs first hand,
whereas people in urban areas learned about the benefits and costs from other people (farmers
and Working for Water staff) and the media. Those who lived nearer to invasions also had a
better knowledge of the benefits and costs relating to the invasions.
Table 4.6: Where people gained their knowledge on the benefits and costs (mean) of
Prosopis (Benefits; χ² = 306.1; df, = 14; p < 0.001) (Costs; χ² = 203.2; df = 18; p <
0.001)
Stakeholder groups
How you gained
knowledge on
Prosopis
Farmers Urban -
Informal
Urban –
Affluent
Communal
areas
Benefits Observed 97 88.7 47.7 89.4
Farmers association 3 0 0 0
Farmers 0 11.4 45.3 10.6
Work place 0 0 4 0
Media 0 0 3 0
Costs Observed 93 59.4 49 70.8
Farmers 5.3 20.9 39 10
Farmers association 1 0 0 0
Media 0.8 2.4 10.2 0.8
Work place 0 0.8 3.8 0
Working for Water 0 16.5 0 17.5
School 0 0 2.8 0.8
The Principal Component Analysis revealed that there were no strong relationships between
demographic variables (age, education level and gender) and people’s knowledge and
perceptions of Prosopis. There are, however, strong relationships between knowing what
Prosopis is and knowing whether it is spreading, knowing that it causes impacts, and wanting
Prosopis to be managed better.
4.5 Discussion
4.5.1 Factors shaping knowledge, perceptions and practices of Prosopis invasions
There is still much to be learned about factors that influence knowledge, perceptions and
practices relating to biological invasions (García-Llorente et al. 2008). One framework
suggests that the abundance of invasions is the dominant factor influencing perceptions
(Shackleton et al. 2007). Other factors such as biophysical characteristics of the local
environment, potential uses, growth form of the plant, mode of introduction, social context of
the area (socio-economic status, local policies and land tenure), and familiarity with the
invasive species clearly also shape perceptions and use of invasive aliens (Kull et al. 2011;
Stellenbosch University https://scholar.sun.ac.za

70
Rai and Scarborough, 2014). Aesthetic values relating to invasive species have also been
found to influence the perceptions of invasions (Dickie et al 2014), and were highlighted to a
limited extent in our results. Using Prosopis invasions as a case study has highlighted that
there are substantial differences in knowledge, perceptions and attitudes towards Prosopis
between different stakeholders in South Africa
Knowledge of Prosopis is more superficial in urban areas where impacts of invasions do not
directly influence people’s livelihoods and where there is less first-hand experience of
invasions. Many people in urban areas only knew about Prosopis through engaging with
people who have first-hand experience (farmers and farm workers) and via the media (Table
4.6). This highlights that proximity to invasions played an important role, with people in
urban areas away from large scale invasion being less knowledgeable. Town size played a
role regarding knowledge of Prosopis invasions - individuals in smaller towns were more
knowledgeable. This is most likely due to these communities being closer knit, allowing
people to gain knowledge of Prosopis by interacting with farmers; such interactions are less
common in larger cities like Kimberly and Upington.
Population demographics had no clear influence on knowledge and perceptions of Prosopis.
However, other social-context factors such as land tenure led to differences in perceptions
and practices regarding the management of Prosopis. A significantly higher percentage of
private land owners actively managed Prosopis compared with respondents living in
communal areas (Table 4.5). Although 75 % of people in rural communal areas considered
Prosopis to be harmful, and 99 % of people would like to see populations controlled, no one
was involved in any form of management besides clearing seedlings from their gardens. This
may be because they are very poor and cannot afford to clear Prosopis themselves, but also
because people are not sufficiently strongly motivated to manage invasions as they feel that
such interventions should be undertaken by government. Tenure rights - where people did not
want to invest in clearing land they did not own – were also important. In Kenya many people
in communal areas cleared Prosopis in small agricultural fields that were considered their
“own” and most respondent’s viewed that it was their duty to do it, although many mentioned
government assistance would be appreciated (Mwangi and Swallow, 2005). The majority of
respondents in Kenya (60 %) believed that it was the government’s responsibility to remove
Prosopis from communal land (rangelands) but 40 % believed that it should be a combined
effort involving government, NGOs and local communities (Mwangi and Swallow, 2005).
4.5.2 Knowledge, perceptions and practices relating to Prosopis invasions in South Africa
All stakeholder groups felt that Prosopis had more negative impacts/costs than benefits in the
study area (Table 4.4). The key benefits of Prosopis that are recognized are its provision of
fodder, shade and fuelwood. Some benefits listed by respondents were not commonly
mentioned in the literature on Prosopis from other parts of the world, including: making beer,
job creation, medicinal value, and aesthetic beauty. On the other hand, communities in other
parts of the world highlighted uses of Prosopis that were not mentioned in our survey. These
included its use for construction poles, charcoal, fencing, improving soils, wood
carving/timber, bio-char and making ropes (Chikuni, 2004; Mwangi and Swallow, 2005;
Stellenbosch University https://scholar.sun.ac.za

71
Kazmi et al. 2009). Many noted that the benefits were less in dense invasions because the
trees in dense stands produce fewer pods and remain in a shrub form, making utilisation
difficult because people and livestock are unable to penetrate these thickets (Shackleton et al.
2014). Most of these benefits can be substituted by native species such as Acacia karroo,
Searsia spp. (used for fuelwood and shade), A. erioloba and A. mellifera (used for fuelwood,
shade and fodder). The production of the blood sugar pills is an exception to this, although a
decrease in tree densities could allow for greater pod yields. Job creation was also important
though trade of pods to make Manna and through WfW. For example, benefits from the sale
of fruits from the cactus Opuntia ficus-indica in the semi-arid thicket region of the Eastern
Cape provided a cash injection for local traders which accounted for 9.2 % of total household
yearly income (Shackleton et al., 2011). In Kenya the loss of native species due to
encroachment by Prosopis has led to the loss of many specific services provided by these
species such as palms that are used for thatching and weaving (Stave et al. 2007).
Some novel issues relating to costs/negative impacts were also raised. These included factors
such as Prosopis roots breaking infrastructure, the fact that the presence of Prosopis
invasions reduces the property values of farms, and that leaf and pod fall in the dry season
makes gardens and town streets untidy and “dirty”. Communities in other parts of the world
have mentioned that Prosopis invasions caused cracks in the ground, increased the
prevalence of malaria, and reduced crop yields (Mwangi and Swallow, 2005).
Most respondents believed Prosopis to be spreading. This is in agreement with other sources
that have shown that Prosopis invasions in the Northern Cape Province increased from
approximately 128 000 ha in 1974 to 1.5 million ha in 2007, and that the extent increased by
around 8 % per annum from 1974-2007 (Van den Berg 2010; van Wilgen et al. 2012). This
will increase costs and reduce benefits, thereby increasing human vulnerability in the future
(Shackleton et al., 2007; Wise et al., 2012). Most people (98 %) would like to see Prosopis
populations reduced in the study area (Table 4.5). This is slightly higher than in Kenya where
85-90 % of the respondents would like Prosopis to be eradicated (Mwangi and Swallow,
2005). Although, some people with Prosopis in their gardens did not want Prosopis removed.
There were also numerous issues raised regarding the efficiency and reliability of the
government run programme that co-ordinates invasive plant clearing – Working for Water.
Farmers are making substantial investments every year to manage Prosopis on their land
(Table 4.5). The average costs of manual cutting and poisoning when done by farmers were
generally lower than those of the Working for Water programme which range from R 130 per
ha in sparsely invaded areas to R 5 340 per ha under dense invasions (Wise et al. 2012).
4.5.3 Implications for management
The results have highlighted that there is demand for increased and improved control of
Prosopis in South Africa and that the conflicts of interest are not as pronounced as was
previously thought. Local respondents considered the costs of Prosopis to outweigh the
benefits. This is because of the obvious negative effects that the invasions have on
livelihoods, and because the benefits from utilisation are low when Prosopis forms dense
thickets (Shackleton et al. 2014).
Stellenbosch University https://scholar.sun.ac.za

72
Respondents identified the need to monitor Working for Water operations more closely and
to prioritise management interventions to improve management success and effectiveness in
the long term. Farmers suggested that tax subsidies or subsidies on herbicides would help
them to manage Prosopis better. This suggestion is being implemented in other areas of
South Africa (Gamtoos Water, 2013).
The results from our study shown that there is need for more cost effective methods to reduce
the costs of Prosopis invasions and to reduce the financial burden of control for farmers and
the Working for Water programme. This need could be met through the use of biological
control (Zachariades et al. 2011; van Wilgen et al. 2012; Wise et al. 2012). Research into
biological control was halted in the past due to conflicts of interest around the use of
Prosopis. However, the substantial rates of spread and high levels of costs from Prosopis
invasions warrant resumption of research on this topic (Zachariades et al. 2011). To date
biological control of Prosopis in South Africa has been poor, with one agent falling to
establish, and the other two having minimal effects on the rate of spread of Prosopis
(Zachariades et al. 2011).There are other biological control agents, such as an Evippe species,
that have reduced Prosopis invasion densities in Australia (van Klinken, 2012) which could
also be effective in South Africa (Zachariades et al. 2011). Effective biological control agents
could reduce stand densities (and the rate of spread), which would make utilisation easier and
thus raise the benefits of Prosopis in the long run (Zachariades et al. 2011).
Further research is also needed to explore the feasibility of promoting large-scale use of
Prosopis to utilise benefits from Prosopis and increase employment, while at the same time
reducing the costs and spread of invasions (Choge and Chikamai, 2004; Kazmi et al. 2009).
For example, Kenya is in the process of setting up regional power plants that will be fuelled
with Prosopis biomass and there is scope for large scale charcoal production (Shackleton et
al. 2014). Many respondents suggested Prosopis invasions are important for job creation.
Improving awareness and encouraging farmers with sparse Prosopis invasions to control
them before they become dense could also help these land owners to save money and prevent
the spread of Prosopis in the long term. There is also need for targeted awareness
programmes in urban areas, where knowledge about Prosopis is lacking. Information on local
invasive species should be incorporated in the school syllabus. A key requirement for
reducing the costs of Prosopis invasions and more effective and improve management is a
national strategy – similar to the one implemented in Australia or suggested for invasive
Australian acacia species in South Africa (van Wilgen et al. 2011; Australian Weeds
Committee, 2012). Using multiple-stakeholder participatory approaches to create this strategy
would help to reduce the conflicts and help to develop a holistic plan that considers all the
needs and concerns of all stakeholders.
4.6 Conclusions
Citizens in rural areas – living on commercial farms and in villages situated on rural
communal lands - had greater knowledge on aspects relating to Prosopis invasions than
people living in towns and cities. Perceptions, knowledge and practices relating to Prosopis
Stellenbosch University https://scholar.sun.ac.za

73
differed between stakeholders and were linked to the social context of the stakeholder groups
such as land tenure, economic status and town/city size. No clear link was found between
knowledge and perceptions of Prosopis and demographic variables such as age, gender and
education level. Most people believed that Prosopis invasions in South Africa were causing
more harm than benefit and numerous negative impacts were mentioned. Most stakeholders
viewed that Prosopis is spreading and that densities in South African need to decrease to
reduce costs. The costs of control are currently high for farmers and the Working for Water
programme, and there is need to look into new methods of management but also to make
current management more effective. Biological control or mass scale utilisation could help to
improve control in the future.
Acknowledgments
Funding was provided by the DST-NRF Centre of Excellence for Invasion Biology and
Working for Water Programme through their collaborative research project on “Integrated
management of invasive alien species in South Africa” and the National Research Foundation
(grant 85417 to DMR).
Stellenbosch University https://scholar.sun.ac.za
74
Chapter 5: Use of non-timber forest products from invasive alien Prosopis
species (mesquite) and native trees in South Africa: Implications for
management
This chapter was published in Forest Ecosystems
Reference: Shackleton, R.T., Le Maitre, D.C., van Wilgen, B.W. and Richardson, D.M. 2015.
Use of non-timber forest products from invasive alien Prosopis species (mesquite) and native
trees in South Africa: Implications for management. Forest Ecosystems 2:16 DOI
10.1186/s40663-015-0040-9.
Abstract
Prosopis species have been introduced to many areas outside their native range to provide
benefits to local communities. Several Prosopis species and their hybrids (hereafter
“mesquite”) have, however, become naturalised and invasive and now generate substantial
costs. Management options are limited because of the complex conflicts of interest regarding
benefits and costs. Management policies and strategies must take account of such conflicts,
but further insights are needed on the dimensions of uses and impacts before such
information can be usefully applied. Current policy in South Africa allows for the growth and
use of mesquite in one province, but not in others where its control is mandatory. We report
on a study to quantify the direct use and perceptions of non-timber forest products (NTFPs)
from mesquite and native trees in South Africa. Semi-structures household interviews were
conducted with various stakeholder groups to identify what tree products are used, to
ascertain amounts used as well as to gauge perceptions of natural resource use between
different tree species and use over time. The direct household use value of native trees was
higher than that of mesquite, and local stakeholders attached greater value to products from
native trees than from mesquite. Therefore, native trees are and will still be preferentially
harvested, and mesquite is unlikely to offer protection to native species by providing an
alternative source of products. Mesquite pods do, however, provide valuable additional
resources (fodder and medicinal products). The use of both native trees and mesquite is
decreasing as the incomes of poorer households rise and as alternative energy sources
become available. The benefits and reliance on mesquite are not as high as previously
assumed and the impacts from mesquite invasions create large problems for local
communities. This study provides further evidence that the impacts of mesquite exceed the
benefits, lending support for a policy to reduce negative impacts.
5.1 Introduction
Thousands of plant species have been introduced to new locations by humans, especially
during the last three centuries, to serve many purposes (Richardson, 2011). Many have
naturalised and some have become invasive (Rejmánek and Richardson, 2013). Invasive
plants often supply benefits to societies in their new ranges, but costs associated with these
invasions often increase as the plants spread (Shackleton et al., 2007a; Kull et al. 2011). This
typically results in the emergence of complex conflicts of interest, with some stakeholders
Stellenbosch University https://scholar.sun.ac.za
75
calling for eradication or control of the invaders, while others promote their continued use
(Shaanker et al. 2010; Kannan et al. 2014; Shackleton et al. 2014; van Wilgen and
Richardson, 2014). Some invasive plant taxa (e.g. Acacia and Pinus species) are
commercially important for forestry and agroforestry (Richardson, 2011), while many others
(e.g. Acacia mearnsii, Opuntia ficus-indica and Prosopis species) provide useful resources
such as fuelwood, fodder and fruit, and are important for local livelihoods (Pasiecznik et al.
2001; de Neergaard et al., 2005; Shackleton et al. 2007a, 2011; Richardson et al. 2015).
However, these same species also cause substantial costs to local livelihoods and the
environment (Shackleton et al. 2014; van Wilgen and Richardson, 2014).
Non-timber forest products (NTFPs) are all biological materials other than timber that are
harvested from trees for use and sale at the household level (De Beer and McDermott, 1989).
These include native and introduced species (Cunningham, 2001). NTFPs are utilised for
subsistence and commercial gain all over the world (Shackleton and Shackleton, 2004) and
account for 20 % of the incomes of rural poor communities on average and are used by more
than 85 % of households in urban areas of southern Africa (Shackleton et al., 2007b;
Davenport et al. 2012). Use and trade of NTFPs has potential to aid poverty alleviation and
provide social upliftment in developing countries in a sustainable way (Shackleton and
Shackleton, 2004); this includes various initiatives to promote the utilisation of invasive alien
species of Acacia and Prosopis (Choge and Chikami, 2004; Pasiecznik et al. 2006;
Shackleton et al. 2007). The introduction of invasive species can bring benefits by supplying
more NTFPs or novel NTFPs, but can simultaneously be detrimental to natural resources,
changing traditional patterns of resource use in a positive or negative way (Shackleton et al.
2007a). For example, in South Africa’s Eastern Cape province, 90 % of households used
invasive alien Acacia species (wattles) as their primary heat source, and 19 % of households
relied on wattles for cash incomes (de Neergaard et al., 2005). The sale of fruit from invasive
stands of Opuntia ficus-indica in the Eastern Cape amounted to 9 % of the yearly income of
collector’s households (Shackleton et al., 2011). In Malawi, Prosopis (thereafter “mesquite”)
provided 44 % of households with an income source (Chikuni et al., 2004), and in India
mesquite provided up to 70 % of fuelwood needs for households in arid regions (Pasiecznik
et al., 2001; Walter, 2011). NTFPs from mesquite such as medicine, fodder, flour alternatives
and charcoal, are sold commercially on a large scale worldwide (Shackleton et al., 2014).
However, mesquite also generates numerous costs in the same areas, which negatively affect
local biodiversity, ecosystem services, economies and local livelihoods (Shackleton et al.
2014).
The services that these invasive alien species provide and the costs that they generate have
resulted in conflicts regarding their use and management in many developing countries (Low
2012; van Wilgen and Richardson 2014). The introduction of new plants has been labelled as
“dangerous aid” as many of these invasive non-native species harm the same communities that
were targeted for assistance in the long term (Low 2012). The presumed benefits of these
species limit management options and lead to contradictory policies in many developing
countries, while costs associated with the invasions continue to rise. For example, in the
Northern Cape province, South Africa, mesquite is listed as a “Category 3” invasive “species”
Stellenbosch University https://scholar.sun.ac.za
76
which means that the genus may remain in the prescribed area/province, but further planting,
propagation or trade is prohibited – expect for the pods from mesquite which are exempted,
and may be used on private land. In other South African provinces, mesquite is a “Category 1”
invader which means that invasive populations must be controlled (although the regulations do
allow for ongoing use of pods) (NEM:BA, 2004; Act No. 10 of 2004: Alien and Invasive Lists
2014) (Department of Environmental Affairs, 2014). This means that any trading of products
derived from mesquite is illegal in South Africa. Similarly, policy in Kenya states that mesquite
should be managed though utilisation to reduce rates of spread and impacts while at the same
time benefitting local communities. This policy is controversial as it limits control options; for
example biological control is excluded (Shackleton et al. 2014). Such policies that seek to
reduce impacts while seeking to benefit communities are widespread in developing countries.
The situation is very different in developed countries, where social upliftment does not feature
in strategies for dealing with invasive species. In Australia, for example, mesquite is listed as
a weed of national significance and legislation does not allow for utilisation (Australian Weeds
Committee, 2012). Similarly, European regulations issued in 2015 do not make it easy to utilise
products from any invasive species (European Union, 2014). Utilisation of natural resources is
crucial for local livelihoods and social upliftment in developing countries (Shackleton and
Shackleton 2004). Sustainable strategies for dealing with “conflict of interest” invasive species
must address the relative value of useful invasive species, like mesquite.
The systematic study of the use and perceptions of invasive species relative to native species
has been limited (Kull et al. 2011). People use many invasive species simply because they are
there, and not to use them would be to forego an opportunity. This is exacerbated if the species
provides a resource that is not available from native species (Shackleton et al. 2007a).
However, the use and perceptions of conflict invasive species such as Australian acacias differ
considerably in different areas (Kull et al. 2011). People often use both native and alien species
for the same purposes, and it would be useful to understand the drivers and levels of such usage
to develop policies that will minimise harm and maximise benefit. Both native and alien species
must be considered when formulating broad conservation aims in rangelands (Milton et al.
2003). On the one hand the alien species could relieve pressure on native species, thus
benefiting conservation. On the other hand, however, on-going invasion by the alien species
could be very detrimental to native species and to ecosystem services. Furthermore, if the alien
species is perceived to be useful, then there would be resistance to the implementation of
control from those who benefit from the resource. A better understanding of the level of use,
value and dynamics of NTPF uses and perceptions of invasive species is clearly important for
formulating effective responses and to guide policy formation and management. The use of
NTFPs is usually assumed to be sustainable, allowing for biodiversity conservation and
economic development to co-exist (Negi et al. 2011), and this has been proposed for invasive
species (Choge and Chikamai, 2004). Sustainable outcomes are, however, rare. The situation
is dynamic, with the net benefits being high shortly after introduction but steadily reduce as the
species invades, resulting later in net harm (van Wilgen and Richardson 2014). One needs to
consider that even beneficial invasive species can also lead to negative externalities whereas
native species do not. Therefore, it is crucial to ensure that the use and perceptions on NTFPs
from native and invasive species are incorporated in strategies dealing with invasive species to
Stellenbosch University https://scholar.sun.ac.za
77
ensure that the needs of local communities are met while ensuring the conservation of
biodiversity and ecosystem services. Mesquite invasions in South Africa provide a good case
study for gaining further insights on these issues.
5.1.1 Mesquite in South Africa
Several Prosopis species were introduced to a few localities in South Africa in the late 1800s.
In the mid-1900s mesquite was widely promoted and planted by the Department of Agriculture
as a fodder, fuelwood and shade resource to aid farmers who were struggling with a two-decade
long drought in the arid parts of the country (Zimmermann, 1999; Poynton, 2009). Prosopis
has since become the second most widespread invasive plant genus in South Africa after
Australian acacias (van Wilgen et al. 2012). There is growing evidence that mesquite invasions
in South Africa are having profound negative impacts on biodiversity (Dean et al 2002;
Steenkamp and Chown 1996; Schachtschneider and February, 2013; Shackleton et al. 2015a,
2015b), ecosystem services (Ndhlovu et al. 2011; Dzikiti et al. 2013) and local livelihoods and
economies (Wise et al. 2012; Shackleton et al. 2015c). Wise et al. (2012) estimated that the
costs will soon exceed the benefits. Control efforts carried out to date have done little to arrest
the rapid spread of invasive populations (van Wilgen et al. 2012). Three seed-feeding biological
control agents (Algarobius Prosopis, A. bottimeri and Neltumius arizonensis) have been
released in South Africa, but have had limited effect. A. bottimeri failed to establish, and the
other two have not substantially slowed rates of mesquite spread (Zachariades et al. 2011).
Although almost 0.5 billion Rand (US$ 50 million) was spent on mechanical and chemical
control measures between 1996 and 2008 (van Wilgen et al. 2012) by the state-run Working
for Water programme, invasions continue to spread rapidly and the associated negative impacts
continue to rise (Wise et al. 2012). Additionally, South Africa’s policy for dealing with
mesquite highlights the extent to which complexities still exist relating to the use and
management of mesquite within South Africa with contradictory policy in different provinces.
There is clearly an urgent need for a national mesquite management strategy as there are still
conflicting ideas over the use and the benefit supply of the genus and the social and ecological
costs it generates within South Africa. However, before more effective management policies
can be developed, further insights would be required regarding the relative use, benefits and
perceptions of this invasive tree in South Africa as well as to assess if other options are
available if mesquite is better managed.
This study therefore compares (1) the use of NTFPs from native trees and mesquite by different
stakeholders within the invasive range of mesquite in South Africa; and (2) perceptions
surrounding mesquite and native tree NTFPs. It is hypothesised that; (1) mesquite is used more
than native species due to introduction history and the fact that is it highly invasive and so
widespread; (2) the introduction of mesquite has led to the prevision and use of novel resources
in the area; and (3) mesquite will be perceived to be more useful than native species by local
communities.
Stellenbosch University https://scholar.sun.ac.za

78
5.5 Methods
5.2.1 Study site
The study took place in 10 cities, towns and villages across South Africa’s Northern Cape
province (Figure 5.1 and 5.2). This area covers the core of the invasive range of mesquite
species in South Africa and represents a cross section of different environmental and socio-
political conditions. Invasive stands of mesquite in South Africa comprise a complex mixture
of several species and their hybrids (Mazibuko, 2012), and we will simply refer to as
“mesquite”. The study included rural and urban areas and areas with private and communal
land tenure. Sampled human settlements included large towns with over 50,000 people
(Kimberly and Upington), smaller towns with between 10,000 and 20,000 inhabitants
(Calvinia, Carnavon and Prieska), and towns and villages with fewer than 5,000 people
(Brandvlei, Loeriesfontein, Kenhardt, Mier and Madibeng).
Figure 5.1: Locations of the 10 towns in South Africa where interviews were
conducted on the use of non-timber forest products from Prosopis species (mesquite)
and native trees use. Dots represent the occurrence of invasive mesquite stands
(Source of Map - Henderson, SAPIA database, ARC-Plant Protection Institute,
Pretoria).
The legacy of apartheid is still clearly reflected in the wealth, education, and distribution of
different racial groups in the study area (Table 5.1) (Treiman, 2007). Rural land is primarily
owned by Whites and is run as game or livestock farms, although there are areas of
communal land populated by Black and Coloured (mix-race) communities that were
demarcated as “homelands” during the apartheid era. Stark contrasts are evident in urban
Stellenbosch University https://scholar.sun.ac.za

79
areas, with moderately affluent suburbs (populated mainly by Whites) and informal
settlements (“townships”) populated by primarily Black and Coloured residents (Table 5.1).
The economy of the region is based on mining, livestock, game and irrigated crop farming
and tourism. The study area is semi-arid to arid, with mean annual rainfall averaging between
150 and 450 mm at different sites and falls within three biomes: the Succulent Karoo, Nama
Karoo and Savanna (Mucina and Rutherford, 2006).
Table 5.1: Demographics of the sample populations (mean ±sd) of the different
stakeholder groups interviewed across the study sites. hh = household.
Stakeholder
category
Mean
age
(yrs)
Gender
( %
male)
Race group
(%)
Mean
education
of hh head
(no. years)
Mean
no.
people
in hh
Mean no.
wage
earners
per hh
Mean
no.
state
grants
per hh
Mean no.
state
pensions
per hh
Modal
income
bracket
(Thousands
of R/month)
Farmers 53±134 81 Coloured (12)
White (88)
13±3 3±1 2±0 0±0 0±0 30-40
Communal
rural
47±16 47 Black (25)
Coloured (75)
7±4 5±3 1±1 2±1 1±1 0-5
Urban -
Affluent
48±13 57 Black (8)
Coloured (4)
White (88)
14±2 3±1 2±1 0±0 0±0 <40
Urban -
Informal
48±33 38 Black (28)
Coloured (72)
8±4 5±3 1±1 1±1 1±1 0-5
5.2.2 Interviews
Semi-structured interviews were conducted with people from four main stakeholder groups -
two in rural areas (land-owning farmers, and people living on communal lands) and two in
urban areas (affluent suburbs and those living in poor informal settlements). Questionnaires
were used so that quantitative data could be collected to compare use and perceptions
between stakeholders. These stakeholders provided a cross section of various groups who
utilise natural resources and are influenced by mesquite. The interviews sought to uncover
what NTFP products households used, the quantity of used, but also to understand
perceptions and trends about the use of NTFPs from mesquite and native trees. Households
were selected at random by conducting interviews with all available households on randomly
selected streets - although some farmers were located through snowball sampling as many
lived in towns rather than on their farms. The head of the household and/or those responsible
for the collection of NTFPs were interviewed in their home language (Afrikaans, English,
SeTswana, or isiXhosa). A translator was used for interviews in households where
interviewees were not conversant in English.
A total of 639 household interviews were conducted across 10 sites between June and
September 2014. These included 130 interviews with commercial farmers, 100 in rural
communal land villages and 409 in urban areas – (276 in informal settlements, 133 in affluent
town suburbs). Farmers were interviewed at all 10 sites. Respondents from urban informal
settlements and urban affluent areas were not interviewed at Mier and Madibeng as these
areas only had rural villages on communal lands. Sample sizes varied across the stakeholder
groups and were based on the demographics of different groups and the availability and ease
Stellenbosch University https://scholar.sun.ac.za
80
of access for household interviews (Shackleton et al. 2015a). Farms in the area are widely
separated making it costly and time-consuming to do many interviews. Unemployment is
high in urban informal areas, so it was possible to conduct interviews throughout the day. In
most households in urban affluent areas all the adults in the household worked so interviews
could only be conducted for an hour a day in the early evenings and on weekends.
The interviews were semi-structured and comprised three main sections: (1) information
regarding the demographics of the respondent household; (2) questions relating to use of
mesquite and native trees; and (3) questions relating to perceptions of NTFPs supplied by
mesquite and native species, and changes in patterns of use over time. This allowed us to
gather information on the products and species utilised, amounts used, and local prices which
allowed for the calculation of direct use values.
5.2.3 Field measurements
The key resources obtained from trees included fuelwood, pods used for various products,
and fencing poles. For households that had NTFPs at their houses, daily quantities were
measured using a spring scale. Many households bought resources from local traders, and
indications of amounts bought per time frame were gathered. Local prices were obtained
from traders. Quantities that people bought were measured at the local traders. Many
households did not have NTFPs available for measurement, but respondents were able to
estimate their usage in common units such as donkey carts or bakkie (small truck/ utility
vehicle) loads per month or year. The contents of twelve bakkie loads and six donkey carts
were weighed. This included eight bakkie loads of mesquite, two of Acacia erioloba and two
of A. karroo wood and three donkey carts of mesquite, two of A. erioloba and one of A.
karroo wood. There were no significant differences in the mean weights of the different
species. We standardised the data for wet bakkie loads (which still had fresh bark and were
on average a third heavier) to that of dry bakkie loads by subtracting the mean difference
between the two. The mean weight of a bakkie load of wood was 422±119 kg. This is lower
than the mean of 532 kg for three bakkie loads measured by Twine et al. (2003) - there was
high variability based on the type of bakkie. The mean mass of a donkey cart load of wood
was 156±66 kg, marginally higher than the average of 132 kg per donkey cart found by
Shackleton et al. (2006). Market values for fuelwood, honey and pods used to produce
organic medicine were gathered from local traders at each of the study sites. Because there
was no market for fodder and fencing poles, a substitute for mesquite pods for fodder -
Lucerne pellets - was used (R 3.10 per kg) and the value of native tree fencing poles was
substituted for 3m-long Eucalyptus poles (R 40.00 per pole).
5.2.4 Statistics
T-tests were used to compare the total use and value (numerical data) of native tree species
relative to mesquite. One-Way ANOVAs and Tukey post-hoc tests were used to compare use
and value (numerical data) between different stakeholder groups. Chi-squared tests were used
to compare the differences between usage by stakeholder groups and perceptions of mesquite
and native species for variables with categorical data. All assumptions for each test were
Stellenbosch University https://scholar.sun.ac.za

81
examined before the tests were run. Some groups of products have very small sample sizes
precluding statistical analysis.
5.6 Results
5.3.1 Uses of mesquite and native trees
Fuelwood was the most common NTFP collected or bought for both mesquite and native
species (Table 5.2). The proportion of fuelwood from native species and mesquite varied
between stakeholder groups, and fuelwood from native species was used more amongst three
stakeholder groups but marginally less by those in Urban Informal settlements who use
mesquite slightly more often. Annual household use and the economic value of the use did
not differ between mesquite and native trees at a household level. However, total use and
value of native species was higher as more households use native species for fuelwood as
compared to mesquite. The mean price of fuelwood from native species (R 1.8/kg) was also
slightly higher than that of mesquite fuelwood (R 1.4/kg). The overall household direct use
value of native tree fuelwood across all stakeholders was 1.2 times higher than that of
mesquite. Acacia erioloba, A. karroo and A. mellifera made up the bulk of native species
used followed by Parkinsonia africana and Searsia lancea. The use of mesquite wood also
differed between stakeholder groups (Table 5.2). Farmers used more mesquite fuelwood than
other groups. There was no difference in use and value of mesquite between other groups.
Annual use of wood and annual value of fuelwood from native species also differed between
different stakeholders (Table 5.2). Farmers used the most, followed by residents in
Communal Rural villages and there were no differences between the urban stakeholder
groups who used substantially less than the rural stakeholders.
Table 5.2: A comparison of fuelwood use of mesquite and native tree species (mean
± sd) for different stakeholders. Superscript letters = significant differences between
different stakeholder groups - Tukey’s post hoc test. hh = household.
Mesquite fuelwood Native species fuelwood p-value (mesquite vs. native)
Stake-
holder
group
% of
hh
using
Mean use
(kg/hh/yr)
Mean value
(R/hh/yr)
% of hh
using
Mean use
(kg/hh/yr)
Mean
value
(R/hh/yr)
% hh of
using
Use
(kg/hh/y
r)
Value
(kg/hh/yr)
Farmers 54 1648±1650a 2060±2676a 85 1784±1892a 2230±252
3a
0.03 0.63 0.85
Communal
rural
48 795±1021b 930±1229b 69 860±1110b 1125±125
3b
0.04 0.17 0.48
Urban -
affluent
19 392±259b 586±343b 63 339±271c 641±553c 0.00 0.39 0.63
Urban -
informal
51 539±721b 979±1134b 48 528±626c 1155±121
4b
0.86 0.09 0.42
Mesquite provided more direct-use services than native trees (Table 5.3). This included the
collection of pods for fodder, beer and the manufacture of an organic blood sugar stabiliser
marketed as “Manna”. Pods were collected by farmers and milled to break the seed, so that
they could feed them to livestock while eliminating the risk of spreading the seeds in dung.
Stellenbosch University https://scholar.sun.ac.za

82
The collection of pods to produce Manna was restricted to one town (Prieska). Some farmers
also collected honey produced from mesquite flowers. Respondents also mentioned that
children opportunistically ate the pods from mesquite, but this was not included in the study
as children could not be included in the study for ethical reasons. In rural areas numerous
native tree species were used to make fencing poles. The value of NTFPs other than fuelwood
was approximately 9.4 times higher for mesquite than for native trees. However, fuelwood
use overshadowed this and, all together, the value of direct use NTFP products of native trees
averaged 1.1 times more than that of mesquite (Tables 5.2 and 5.3). Interestingly, no
households in Urban Affluent areas used other NTFPs from mesquite or native tree species
besides for fuelwood (Table 5.3).
Table 5.3: Usage metrics (mean ±sd) for less commonly used non-timber forest
products harvested from mesquite and native trees in South Africa. hh = household.
Farmers Communal rural Urban – informal
Resource % of
hh
using
Mean
use
(kg or
l/hh/yr)
Mean
value
(R/hh/yr)
% of
hh
using
Mean use
(kg or
number of
poles/hh/yr)
Mean
value
(R/hh/yr)
% of
hh
using
Mean use
(kg/hh/yr)
Mean
value
(R/hh/yr)
Mesquite
Fodder 3.8 1976±166
9
6125±5174 2 200±0 620±0 >1 960±0 2976
Beer - - - - - - >1 80±28 120±82
Manna - - - - - - 2.2 1013±193 1215±231
Honey >1 10 700 - - - - - -
Native trees
Fencing
poles
- - - 4 29±23 1170±912 - - -
Modes of obtaining NTFP products differed between stakeholder groups for both mesquite
and native tree species (Figure 5.2). Most farmers and people living in rural communal areas
collected products from mesquite and native species themselves, whereas in urban areas most
people purchased these products. The proportion of people selling NTFPs was very similar
across all stakeholder groups with 2-3 % of people selling mesquite and native tree products
in Rural Communal areas and Urban-Affluent areas and up to 7 % of respondents selling
mesquite products from the Urban-Informal stakeholder group and 7 % of farmers selling
native tree species products. Farmers and people from Urban Affluent areas normally had
larger-scale operations compared to the more informal trade within the Rural Communal
areas and Urban Informal areas and employed labourers to do the work, thus creating
valuable jobs.
5.3.2 Perceptions and trends over time
In general, most households viewed the products provided by mesquite as inferior to native
species – particularly in the case of fuelwood (Figure 5.3).
Stellenbosch University https://scholar.sun.ac.za

83
Figure 5.2: Methods of securing non-timber forest products from (a) mesquite – (χ² =
255.8; p < 0.0005) and (b) native species (χ² = 235.2; p < 0.0005) for four stakeholder
groups in South Africa.
There were several reasons for this, including that mesquite wood does not generate as much
heat or form coals as well as many native species; mesquite logs have smaller diameters than
those from native species; mesquite has thick thorns that some people consider poisonous,
making it relatively difficult to harvest and utilise; when the mesquite wood is slightly wet it
produces an unpleasant smoke, and the most commonly mentioned reason was that the wood
is rapidly powdered by a boring insect as it dries (which means that large quantities of wood
cannot be stored for long periods) (Table 5.4).
Figure 5.3: Perceptions on the usefulness of non-timber forest products supplied by
mesquite compared to native tree species in South Africa (χ² = 189.3; p < 0.0005).
A small percentage of respondents preferred mesquite to native species, because it produces a
highly nutritious fodder; invasive mesquite stands are often closer and more accessible to
towns (making wood collection cheaper and faster); and some households make beer out of
the pods (Table 5.4). Another reason for preferring to use mesquite was because the wood
could easily be collected from debris left by government-sponsored clearing projects. Many
b a
Stellenbosch University https://scholar.sun.ac.za
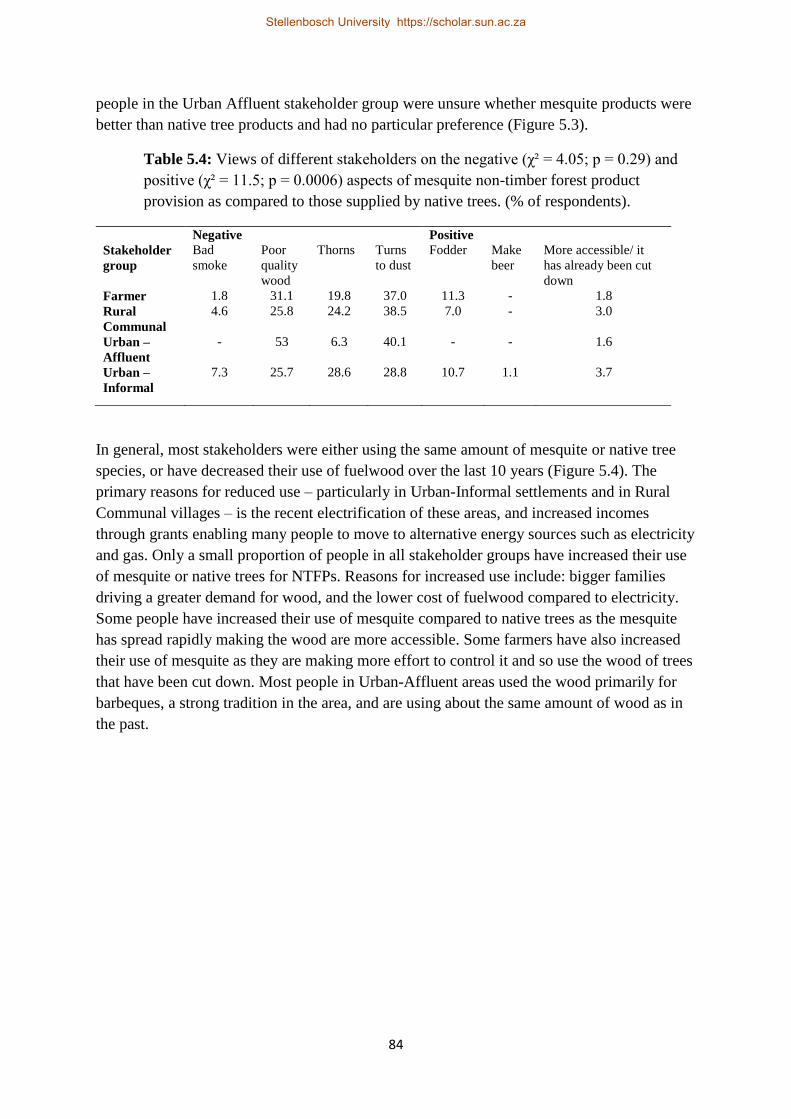
84
people in the Urban Affluent stakeholder group were unsure whether mesquite products were
better than native tree products and had no particular preference (Figure 5.3).
Table 5.4: Views of different stakeholders on the negative (χ² = 4.05; p = 0.29) and
positive (χ² = 11.5; p = 0.0006) aspects of mesquite non-timber forest product
provision as compared to those supplied by native trees. (% of respondents).
Negative Positive
Stakeholder
group
Bad
smoke
Poor
quality
wood
Thorns Turns
to dust
Fodder Make
beer
More accessible/ it
has already been cut
down
Farmer 1.8 31.1 19.8 37.0 11.3 - 1.8
Rural
Communal
4.6 25.8 24.2 38.5 7.0 - 3.0
Urban –
Affluent
- 53 6.3 40.1 - - 1.6
Urban –
Informal
7.3 25.7 28.6 28.8 10.7 1.1 3.7
In general, most stakeholders were either using the same amount of mesquite or native tree
species, or have decreased their use of fuelwood over the last 10 years (Figure 5.4). The
primary reasons for reduced use – particularly in Urban-Informal settlements and in Rural
Communal villages – is the recent electrification of these areas, and increased incomes
through grants enabling many people to move to alternative energy sources such as electricity
and gas. Only a small proportion of people in all stakeholder groups have increased their use
of mesquite or native trees for NTFPs. Reasons for increased use include: bigger families
driving a greater demand for wood, and the lower cost of fuelwood compared to electricity.
Some people have increased their use of mesquite compared to native trees as the mesquite
has spread rapidly making the wood are more accessible. Some farmers have also increased
their use of mesquite as they are making more effort to control it and so use the wood of trees
that have been cut down. Most people in Urban-Affluent areas used the wood primarily for
barbeques, a strong tradition in the area, and are using about the same amount of wood as in
the past.
Stellenbosch University https://scholar.sun.ac.za
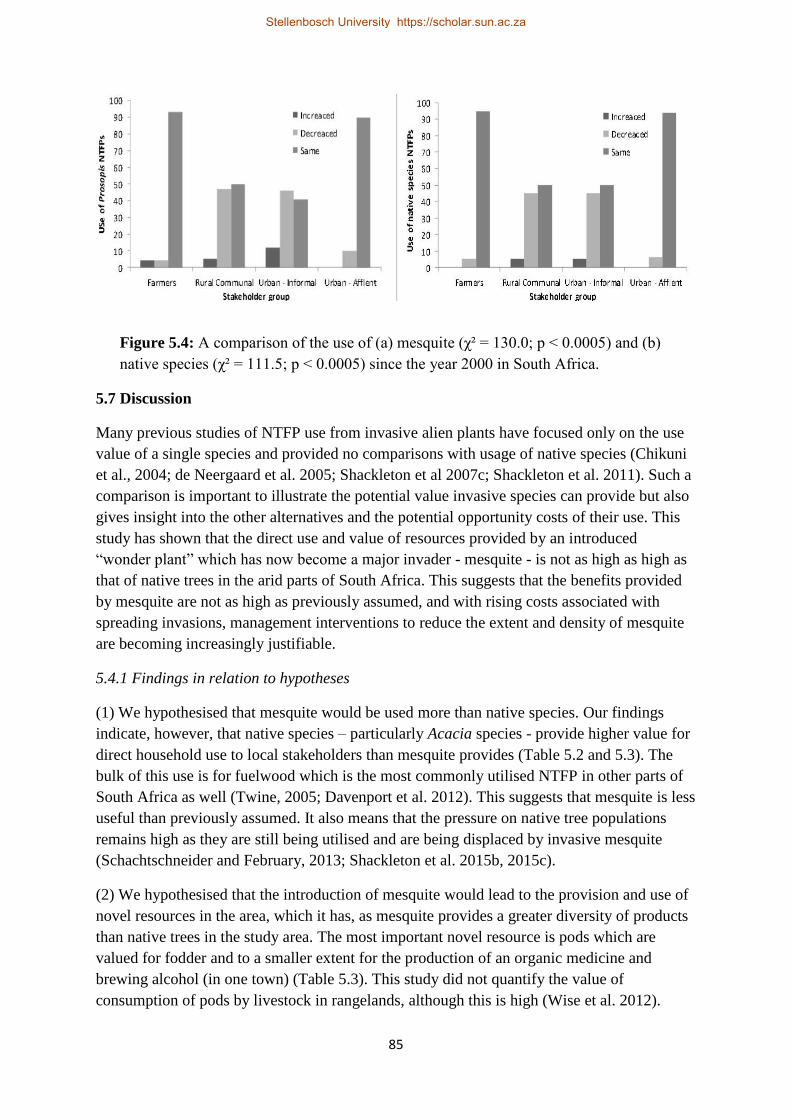
85
Figure 5.4: A comparison of the use of (a) mesquite (χ² = 130.0; p < 0.0005) and (b)
native species (χ² = 111.5; p < 0.0005) since the year 2000 in South Africa.
5.7 Discussion
Many previous studies of NTFP use from invasive alien plants have focused only on the use
value of a single species and provided no comparisons with usage of native species (Chikuni
et al., 2004; de Neergaard et al. 2005; Shackleton et al 2007c; Shackleton et al. 2011). Such a
comparison is important to illustrate the potential value invasive species can provide but also
gives insight into the other alternatives and the potential opportunity costs of their use. This
study has shown that the direct use and value of resources provided by an introduced
“wonder plant” which has now become a major invader - mesquite - is not as high as high as
that of native trees in the arid parts of South Africa. This suggests that the benefits provided
by mesquite are not as high as previously assumed, and with rising costs associated with
spreading invasions, management interventions to reduce the extent and density of mesquite
are becoming increasingly justifiable.
5.4.1 Findings in relation to hypotheses
(1) We hypothesised that mesquite would be used more than native species. Our findings
indicate, however, that native species – particularly Acacia species - provide higher value for
direct household use to local stakeholders than mesquite provides (Table 5.2 and 5.3). The
bulk of this use is for fuelwood which is the most commonly utilised NTFP in other parts of
South Africa as well (Twine, 2005; Davenport et al. 2012). This suggests that mesquite is less
useful than previously assumed. It also means that the pressure on native tree populations
remains high as they are still being utilised and are being displaced by invasive mesquite
(Schachtschneider and February, 2013; Shackleton et al. 2015b, 2015c).
(2) We hypothesised that the introduction of mesquite would lead to the provision and use of
novel resources in the area, which it has, as mesquite provides a greater diversity of products
than native trees in the study area. The most important novel resource is pods which are
valued for fodder and to a smaller extent for the production of an organic medicine and
brewing alcohol (in one town) (Table 5.3). This study did not quantify the value of
consumption of pods by livestock in rangelands, although this is high (Wise et al. 2012).
Stellenbosch University https://scholar.sun.ac.za

86
However, any assessment of the value of pods as fodder would have to factor in the loss of
grazing where mesquite invades (Ndhlovu et al. 2011), as well as the role of livestock in
spreading mesquite seeds in their dung (Shiferaw et al. 2004).
(3) We hypothesised that the natural resources provided by mesquite would be preferred to
those of native trees. However, our findings indicate that the majority of stakeholders prefer
native trees over mesquite and see products of native species as superior (Figure 5.3). This is
mainly because the wood quality of mesquite is perceived as poor for the reasons highlighted
in Table 5.4, and fuelwood is the most widely used NTFP in the area. In Ethiopia when
production of charcoal was legalised in an attempt to control mesquite through utilization,
locals substituted mesquite with native Acacia tortilis and A. nilotica because these native
species produced larger boles, had smaller spines and were easier to harvest, and because
there were perceptions that the smoke from mesquite was poisonous (A. Witt: unpublished
data). This provides another example illustrating that native species are favoured over
mesquite, and highlights that planting alien species is unlikely to replace the use of native
species, or to protect them. The supply of pods (a novel resource) from mesquite was the
main reason why a small percentage of respondents preferred mesquite over native trees.
Mesquite fuelwood was also favoured not because of its quality but because it could more
easily be accessed. This has been noted elsewhere; for example, wood from A. mearnsii was
perceived to be of lower quality than native species in the Eastern Cape of South Africa, but
because it was more abundant close to villages it was used more (Shackleton et al. 2007a).
Different perceptions relating to the use of natural resources of invasive species therefore
often relate to their abundance, proximity, novelty, social contexts, factors surrounding
introductions, cultural preferences and the opportunity costs of not using them (Shackleton et
al. 2007; Kull et al. 2011).
5.4.2 Use patterns and perceptions
Most previous studies have assessed patterns of use within defined socio-economic groups,
(Twine et al. 2003; Shackleton et al., 2007c; Paumgarten and Shackleton, 2009; Davenport et
al. 2012; Thondhlana et al. 2012), and not between groups. Our study revealed that use
patterns, methods of obtaining the resources, and use over time varied between stakeholders
within different social-economic and land tenure contexts (Table 5.2 and 5.3; Figures 5.2, 5.3
and 5.4). We found that those living closer to invasions (farmers and people in rural
communal land villages) mainly collected the NTFPs themselves, whereas people in urban
areas relied more on purchasing these resources. People living in more rural areas also used a
higher value of NTFPs compared to those in urban areas. Interestingly, the traditionally
poorer stakeholders are moving away from use of fuelwood (Figure 5.4) as they adopt
alternative energy sources such as electricity, gas and paraffin. The decreasing reliance on
natural products has also been highlighted in other parts of South Africa, and has been linked
to increased electrification and increased incomes especially through state grants and
pensions (Shackleton et al. 2013). However, other sources suggest that the use of NTFPs,
especially on a commercial scale, is increasing in some areas (Twine et al. 2005). Those in
wealthier stakeholder groups still use similar amounts of NTFPs as there is a strong culture of
using wood for barbequing.
Stellenbosch University https://scholar.sun.ac.za
87
5.4.3 Benefits vs. costs
Wise et al. (2012) estimated that mesquite invasions were providing a net benefit to local
communities in South Africa, but that a net loss will result shortly as mesquite trees continue
to spread. Although mesquite is providing about half of the farmers in the Northern Cape
with a mean direct-use value R 2 000 per annum, the mean expenditure of farmers to control
mesquite is over R 20 000 per farm per annum (Shackleton et al. 2015a). Mesquite invasions
have also led to numerous other social, ecological and economic costs such as negative
impacts on water, grazing potential, biodiversity and infrastructure that have not been fully
valued (Mwangi and Swallow, 2005; Ndhlovu et al. 2011; Dzikiti et al. 2013; Shackleton et
al. 2015a, 2015c). This suggests that mesquite invasions in South Africa generate more costs
than benefits. Some argue that mesquite invasions play a positive role in that they reduce the
use and pressure on native trees (FAO, 2004). However, mesquite invasions are having large-
scale negative impacts on native tree population stability, abundance, density and mortality in
South Africa (Schachtschneider and February, 2013; Shackleton et al. 2015b, 2015c) and
natives are still being harvested in preference to mesquite. Native trees will therefore decline
as mesquite stands become more widespread and dense, possibly more so than as a result of
direct harvesting. In Kenya, mesquite is negatively impacting populations of native species
that supply specialised NTFPs, e.g. a palm (Hyphaene compressa) used for weaving and
thatching (Stave et al. 2007).
5.4.4 Recommendations: Policy and management options
This study, focussing on invasive mesquite species, illustrates the benefit of understanding the
conflicts of interest caused by invasive species within the developing world, and how
understanding natural resource use is important for informing policy and management. We
suggest that similar studies in other parts of the world would help to highlight the relative
values of the resources provided by invasive species and to determine whether invasive alien
species provide any unique resources that may be affected by management. Our study has
shown that people preferentially use native species over mesquite and are decreasing their
reliance’s on natural resources from trees in general. It also highlights that alternative native
species are available, if mesquite was substantially reduced through more effective
management. Current policy in South Africa is attempting to simultaneously maximise benefits
and minimise harm, but this approach is likely to lead to growing negative impacts and
continued spread. It would be better to base policy direction on overall net benefit or loss. Wise
et al. (2012) predicted that a situation of net losses would arise soon, and that the magnitude of
the net loss would grow rapidly as mesquite continues to spread. It would therefore appear to
be better to adapt policy and treat mesquite as an undesirable invasive species everywhere
(category 1), and consider using more damaging biological control agents (not only seed-
attacking insects).
Stellenbosch University https://scholar.sun.ac.za
88
Acknowledgements
We thank all the participants who were interviewed and the translators for their hard work.
This research was supported by the DST-NRF Centre of Excellence for Invasion Biology and
Working for Water Programme through their collaborative research project on “Integrated
management of invasive alien species in South Africa” and the National Research Foundation
(grant 85417 to DMR).
Stellenbosch University https://scholar.sun.ac.za

89
Chapter 6: Identifying barriers to effective management of widespread
invasive alien trees: Prosopis species (mesquite) in South Africa as a case
study
This chapter was submitted to Global Environmental Change
Abstract
Biological invasions are a major driver of ecological and social change globally. The negative
effects of these invasions have led to the initiation of programs in many countries to manage
these invasions. Management aims to reduce impacts and in some cases improve the benefits
that some invasive species can provide. This study assesses the barriers that hinder the effective
management of widespread tree invasions, drawing insights from a case study of invasions of
Prosopis species (mesquite) in South Africa. We used questionnaire surveys and focussed
workshops to identify barriers and adaption responses in four key stakeholder groups involved
in various stages of management. More than 100 barriers were identified, most of them relating
to social issues. Key barriers related to limited knowledge, insufficient funds, conflicts of
interest, the ecology of the genus and the nature of the land it invades, as well as poor planning,
co-ordination and co-operation, and a lack of prioritisation. There were marked differences
between stakeholders regarding the importance of some barriers. Most Farmers (>80%) placed
high importance on a lack of planning, and poor management as important barriers, while few
Managers (<20%) regarded these as important, reflecting very different views about the context
in which management projects operate. Workshops identified more barriers and overall shed
greater insights on the dimensions of barriers. The questionnaires were, however, useful for
providing quantitative data which helped to rank the importance of barriers. Although many
adaptation responses were identified, not all barriers are conducive to simple solutions. Among
the most intractable barriers were the lack of adequate funds and factors relating to the ecology
of the genus. Problems such as adapting to new clearing methods and strategic planning need
to be overcome to improve the effectiveness of control with the available funds.
6.1 Introduction
6.1.1 Global change and barriers to adaption
Invasive alien species cause major disruptions to social-ecological systems and are a major
driver of global change (Vitousek et al. 1997; Pimentel et al. 2000). Many species introduced
accidently and intentionally over past centuries have had severe detrimental effects on
biodiversity, ecosystem services and local economies (Pyšek & Richardson 2010). The
escalation of negative impacts associated with invasions has led to an increase in the number
of management projects across the world that aim to reduce the negative effects of these
invasions. Many such projects have limited success (Wilson et al. 2011; van Wilgen et al.,
2012a; Shackleton et al., 2014), mainly because they face numerous barriers that hamper the
effective management of the problem. Investigating barriers to adaptation and management is
common in the fields of medicine (Flores and Vega, 1998; Gelland et al. 2011; Haung et al.
2011), psychology (Waller and Gilbody, 2009; Jansen van Vuuren and Learmonth, 2012) and
Stellenbosch University https://scholar.sun.ac.za
90
climate change (Haung et al. 2011; Spires et al. 2014), but such thinking has not yet been
systematically incorporated into conservation biology or invasion science (but see UNEP,
2004; Roura-Pascual et al. 2009). We suggest that improving our understanding of the
barriers that potentially hamper the effective management of invasive species could improve
management and help to guide adaptive responses for combatting this major driver of global
change.
Barriers are factors that create obstacles or conditions that delay, hinder or divert the
effectiveness of management, adaptation and transformation strategies (Moser and Ekstrom,
2010). Barriers range from those faced by individuals or households to those that operate at
larger scales and that influence cities, institutions, municipalities and governments (Robinson
and Gore, 2005; Lorenzoni et al., 2007; Jantrasami et al., 2010; Lehmann et al., 2014). Many
different types of barriers exist, including biophysical (ecological, infrastructural),
institutional (political, managerial) informational, economic and social barriers (cognitive,
cultural, institutional, psychological) (Agrawal, 2008, Adger et al. 2009; Jones 2010; Gifford,
2011; Antwi-Agyei et al., 2013). Many barriers are contextual and relate to historical
processes and include multiple stressors (Jansen van Vuuren and Learmonth, 2012;
Shackleton et al. 2013). Identifying and recognising barriers to management is an important
early step in overcoming them. Numerous methods and frameworks have been used to
identify and categorise barriers to adaptation and management (Jones, 2010; Moser and
Ekstrom, 2010; Nielsen and Reenberg, 2010; Antwi-Agyei et al., 2013). The concept of
barriers has also been incorporated into other frameworks such as the Drivers, Pressures,
States, Impacts and Responses (DPSIR) framework (Roura-Pascual et al. 2009). Many
studies focus on single barriers and do not consider those that affect all stakeholders. We
suggest that it is important to investigate these issues from multiple viewpoints as different
stakeholders face different problems and all have unique perspectives. Overcoming such
barriers requires concerted efforts by all stakeholders to make changes; there is need for
adaptive management, new ways of thinking, effective legislation, prioritisation of goals and
sound strategic planning (Moser and Ekstrom, 2010). Therefore, the timely identification of
barriers can facilitate more efficient planning of adaptation and management strategies by
considering and implementing appropriate solutions (Moser and Ekstrom, 2010). The lack of
research on barriers facing managers of invasive species may be hindering effective
management, especially for large-scale operations such as the ambitious Working for Water
programme in South Africa (van Wilgen and Wannenburgh, 2015). The process of
highlighting barriers is also useful for bringing different stakeholders together and allowing
them to suggest ways of overcoming barriers.
6.1.2 Tree invasions
Until recently invasive alien trees were not widely recognised as a major threat to
biodiversity and ecosystem productivity – but trees are now considered among the most
widespread and damaging of invasive species in many parts of the world (Richardson and
Rejmánek, 2011). The list of invasive trees and shrubs now contains more than 750 species,
most of them having been introduced for horticulture, forestry and agroforestry (Rejmánek
and Richardson, 2013). More than 40 species are widespread, and are invasive in six or more
Stellenbosch University https://scholar.sun.ac.za

91
regions of the world (Richardson and Rejmánek, 2011). Invasive trees are now a major
contributor to global change and negatively affect biodiversity, ecosystem services and
human livelihoods (Shackleton et al. 2014). However, many species of invasive trees provide
benefits as well as costs, leading to conflicts of interests surrounding their use management
(Dickie et al. 2014; van Wilgen and Richardson, 2014). Management efforts range from ad
hoc local-scale efforts by private land owners to large-scale national programs driven by
national and international policy (Richardson and Rejmánek, 2011). There are many cases
where management has reduced problems associated with tree invasions, but also many case
studies where projects have failed to achieve effective management (van Wilgen et al.
2012a). Further investigation to better identify the most important barriers to the management
of tree invasions is warranted, especially in developing countries. This is particularly
important when developing strategic plans under international regulations such as the
Convention on Biodiversity and to comply with national policies that are in place in
numerous countries across the world, including Australia, South Africa and the United States.
Our study focusses on invasive Prosopis species in South Africa as a case study species to
identify barriers to management.
6.1.3 Study species and system (Prosopis in South Africa)
We used the genus Prosopis species (mesquite), widely recognised as one of the worst and
most widespread invasive tree taxa in the world (Shackleton et al. 2015b), as a case study.
Prosopis species have been moved around the globe during the past century to provide local
communities with additional resources, notably fodder and wood. Several species and their
hybrids have naturalised and/or become invasive in over 100 countries, leading to negative
impacts and substantial conflicts of interest around use and management (Shackleton et al.
2014).
Prosopis species were first introduced into South Africa in the late 1800s, and then in the
mid-1900s they were distributed to farmers in large numbers across the arid central parts of
South Africa to provide fodder and shade for livestock, as well as extra fuelwood
(Zimmermann, 1991; Poynton, 2009). Prosopis species have now invaded at least 1.8 million
ha of South Africa, are still spreading at rates between 3.5 and 8 % per annum, and have the
potential to invade a further 58 million ha of the country (Versfeld et al. 1998; Rouget et al.,
2004; Van den Berg 2013). Prosopis was ranked as the second most widespread invasive
plant taxon in South Africa after Australian Acacia species (Henderson, 2007) and Prosopis
is also ranked highly for its impacts on biodiversity and ecosystem services (Le Maitre et al.
2000). Prosopis invasions in South Africa reduce bird, insect and tree abundance and
diversity (Steenkamp and Chown, 1996; Dean et al. 2002; Shackleton et al. 2015a),
destabilise tree populations and increase native tree mortality (Schachtschneider and
February, 2013; Shackleton et al. 2015b), and reduce grazing potential and water reserves
(Ndhlovu et al. 2011; Dzikiti et al. 2013). All of these impacts affect local livelihoods and
economies negatively (Wise et al 2012; Shackleton et al. 2015c). The benefits from Prosopis
have been found to be less important than was previously thought, and most stakeholders
were in favour of more aggressive management interventions (Shackleton et al. 2015d).
Stellenbosch University https://scholar.sun.ac.za

92
Due to the costs associated with Prosopis invasions, there has been active management to
reduce impacts by the state-run Working for Water programme as well as by private land
owners (Shackleton et al. 2015c). Current approaches include mechanical, chemical and
biological control methods (Richardson 1998; van Wilgen et al. 2012). Biological control has
been largely been ineffective; one agent (Neltumius arizonensis) failed to establish and the
others (Algarobius bottimeri and A. prosopis) have not substantially slowed rates of spread
(Zachariades et al. 2011). There have been some localised successes using chemical and
mechanical control, but on a larger scale management success has been limited and the
impacts and costs of Prosopis invasions are rising rapidly (Wise et al. 2012 van Wilgen et
al.2012a). Although the Working for Water (WfW) programme spent R 435.5 million (US$
42.7 million) between 1996 and 2008 on managing Prosopis invasions, mesquite continues to
increase its range and density rapidly across the county (van Wilgen et al. 2012a). This
suggests that there may be substantial barriers to the effective management of Prosopis (as is
the case with other well-established invasive tree species in South Africa; e.g. Holmes et al.
2008). A previous study in the fynbos biome (Roura-Pascual et al. 2009) identified important
barriers that hamper effective management of invasive trees in this region. The systematic
investigation of these barriers, drawing on perspectives of key stakeholder groups involved in
management, has the potential to improve the efficiency of management.
5.1.4 Working for Water programme
The legacies of South Africa’s apartheid past include unemployment, inequality and poverty
which need to be addressed by providing people with meaningful work and skills while
ensuring sustainability. The Working for Water programme (WfW, a state public-works
program), which falls under the national Department of Environmental Affairs, therefore has
multiple agendas. The key ones are (1) to provide jobs and skills development to previously
disadvantaged communities and (2) to manage and remove invasive alien species to reduce
their negative impacts on the environment and restore the supply of ecosystem services (van
Wilgen et al. 2012b). There are numerous tiers of management and implementation in the
programme. WfW’s activities are managed at national and provincial levels through
implementing agents (government departments, municipalities and national parks and
conservation authorities, and forestry and agricultural authorities). These agents tender
projects out to local contractors, mainly from previously disadvantaged backgrounds (van
Wilgen and Wannenburgh, 2015). These tenders (2-3 month projects) include contractors,
with teams of 10 unskilled workers who are paid an agreed sum to clear demarcated areas
based on norms and standards agreed on for different species, terrains and density classes
(van Wilgen and Wannenburgh, 2015). These tendered projects are supervised by regional
managers employed by the implementing agents (see above) on a more secure long-term
basis. WfW clearing projects are conducted on both state and private land which therefore
involves working with and in close proximity to additional stakeholders such as farmers. This
programme is well-funded compared to other environmental programmes in Africa and
receives a budget of approximately R 1.8 billion annually to control invasions across the
country (van Wilgen et al. 2012b). The different agendas and the incorporation of multiple
Stellenbosch University https://scholar.sun.ac.za

93
tiers of stakeholders has led to major complexity and the creation of unique barriers to each
group.
This paper reports the results of a study that sought to identify barriers to Prosopis
management as perceived by multiple stakeholders, and to highlight the key adaptation
responses that would be needed to overcome these barriers.
6.6 Methods
6.2.1 Study area
Prosopis invasions are found in the semi-arid and arid interior of South Africa, with the
majority of invasive populations occurring in the Northern Cape Province (Richardson et al.
2000; Shackleton et al. 2015b). Invasions occur in three major South African biomes: the
Savanna, the Nama Karoo and Succulent Karoo (Shackleton et al. 2015b). Rainfall in invaded
areas ranges from 150-450 mm/yr and includes winter, summer and bimodal rainfall regimes.
Altitudes range from 700-1300 m above sea level. The economy of the area is driven by
livestock agriculture, cropping along rivers, mining and tourism. More than twenty years
after the dismantling of apartheid, the legacy of this social system is still evident in the
distribution of different racial groups across the area within which Prosopis occurs. The most
common land use is rangeland farming, which is dominated by White landowners. There are
also large areas of communal land that are populated by Black and Coloured people. Stark
social-economic divides exist between different communities (a legacy of apartheid),
resulting in areas of high unemployment, poverty and inequality (Treiman, 2007; Shackleton
et al. 2015c). This reality and the need for social transformation compounds the challenge of
achieving sustainable management and conservation strategies.
6.2.2 Questionnaires and workshops
Interviews using semi-structured questionnaires were conducted and focussed workshops
were held with four key stakeholder groups involved with different stages in the management
of Prosopis. These four groups were:
1. Academics - who undertake research on many aspects relating to invasions - including
their benefits, costs, ecology and management - which are used to inform managers
and policy makers. (Academics that were included were people who had published
peer-reviewed papers on Prosopis and/or management of invasive trees in South
Africa)
2. Farmers - living on private land who manage invasions themselves (using their own
labour and funding) but also in many cases in conjunction with the state-run WfW
programme.
3. Managers employed by WfW- who are involved in planning and overseeing invasive
clearing projects in the WfW programme; and
4. Workers - who are people from previously disadvantaged communities (often with
low education and living in poverty) who are involved in manually clearing invasive
Stellenbosch University https://scholar.sun.ac.za
94
species in return for payment (around the minimum wage (± R 100/US$ 7 per day))
from the WfW programme.
Ninety-five questionnaires were administered to the four groups: 11 to Academics, 34 to
Farmers, 17 to Managers and 33 to Workers. Most of the managers on Prosopis-related
projects run by WfW, and the academics in South Africa were sampled, and sub-sets of
farmers and workers were done at numerous points in the Northern Cape. The questionnaire
included questions relating to perceptions of Prosopis, identification (free listing) and ranking
barriers to management, possible adaptation responses and to highlight research needs (free
listing). Interviews were conducted in English and Afrikaans depending on the preference of
the interviewee. Qualitative methods (focus groups) were also conducted using methods and
for reasons highlighted in Jones and Boyd (2011). Focussed workshops were held with each
of the stakeholder groups with between 10 and 20 participants to identify barriers relating to
the effective management of Prosopis in South Africa. Each workshop lasted 1 to 1.5 hours.
Proceedings were recorded to allow us to refer back to clarify issues and to identify
underlying themes. Each of the barriers listed in the questionnaire and the workshop were
added separately and not pooled into pre-defined groups as done in other studies (e.g.,
Jantrasami et al. 2010).
The information from the questionnaires and workshops was summarised into the framework
presented in Jones (2010) which categorises barriers into: (1) human and information factors
(knowledge, economic and technological); (2) Natural factors (ecological and physical) and
(3) social factors (cognitive, institutional and normative).
6.7 Results
6.3.1 Perceptions of Prosopis
When listing words associated with Prosopis, the words: “water”, “problem”, “invasive” and
“alien”, and other words associated with impacts and management were commonly
mentioned by all stakeholder groups (Figure 6.1). However, there were also major differences
between groups. Workers commonly mentioned words relating to work and job creation and
well as verbs relating to the removal of Prosopis. Farmers also listed many adjectives with
negative connotations relating to the tree such as “plague”, “thief”, “evil” and “nightmare”.
Managers and academics listed similar words which were less emotive than Farmers and
Workers.
Stellenbosch University https://scholar.sun.ac.za

95
Figure 6.1: The use of words to describe Prosopis species by different stakeholder
groups in South Africa: (a) Managers; (b) Farmers; (c) Workers; (d) Academics. Each
participant was asked to list 3-5 words they associate with Prosopis in South Africa at
the beginning of the survey (no background information was provided). The size of
words in each word cloud denotes the number of times that word was used.
All stakeholders involved in the management of Prosopis perceived it to have negative
impacts and/or costs (Table 6.1). Most stakeholders also perceived Prosopis to have benefits,
with three stakeholders groups mentioning this more than 90 % of the time; Academics
portrayed this view slightly less often (73 %). All stakeholders considered the costs to be
greater than the benefits, with Workers and Farmers mentioning this 94 % and 96 % of the
time respectively, and 100 % of respondents in other groups expressing this view. Ratings of
different negative impacts varied between stakeholders, but costs that were rated as greatest
by all stakeholder groups were reductions in water supply and reduced grazing capacity in
natural rangelands (Table 6.2). The rating of benefits also differed between stakeholder
groups (Table 6.2). Interestingly, Workers rated the benefits more highly than other groups.
The provision of fodder, fuelwood and shade were rated as being among the most important
benefits by all stakeholder groups.
Stellenbosch University https://scholar.sun.ac.za
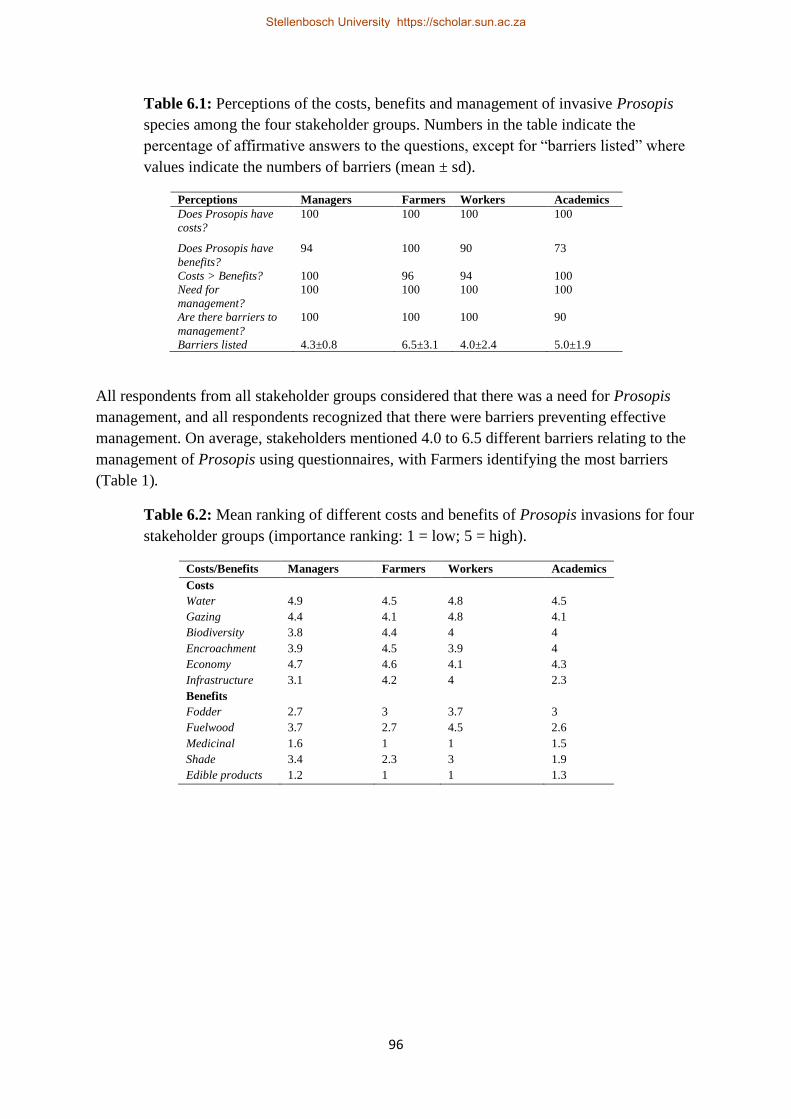
96
Table 6.1: Perceptions of the costs, benefits and management of invasive Prosopis
species among the four stakeholder groups. Numbers in the table indicate the
percentage of affirmative answers to the questions, except for “barriers listed” where
values indicate the numbers of barriers (mean ± sd).
Perceptions Managers Farmers Workers Academics
Does Prosopis have
costs?
100 100 100 100
Does Prosopis have
benefits?
94 100 90 73
Costs > Benefits? 100 96 94 100
Need for
management?
100 100 100 100
Are there barriers to
management?
100 100 100 90
Barriers listed 4.3±0.8 6.5±3.1 4.0±2.4 5.0±1.9
All respondents from all stakeholder groups considered that there was a need for Prosopis
management, and all respondents recognized that there were barriers preventing effective
management. On average, stakeholders mentioned 4.0 to 6.5 different barriers relating to the
management of Prosopis using questionnaires, with Farmers identifying the most barriers
(Table 1).
Table 6.2: Mean ranking of different costs and benefits of Prosopis invasions for four
stakeholder groups (importance ranking: 1 = low; 5 = high).
Costs/Benefits Managers Farmers Workers Academics
Costs
Water 4.9 4.5 4.8 4.5
Gazing 4.4 4.1 4.8 4.1
Biodiversity 3.8 4.4 4 4
Encroachment 3.9 4.5 3.9 4
Economy 4.7 4.6 4.1 4.3
Infrastructure 3.1 4.2 4 2.3
Benefits
Fodder 2.7 3 3.7 3
Fuelwood 3.7 2.7 4.5 2.6
Medicinal 1.6 1 1 1.5
Shade 3.4 2.3 3 1.9
Edible products 1.2 1 1 1.3
Stellenbosch University https://scholar.sun.ac.za
97
6.3.2 Barriers to management
The results were categorised according to the framework used by Jones (2010) (Figures
6.2,3,4 and Table 6.3). Most barriers fell into the social node, followed by the human and
information node and lastly the natural node, although the barriers found within different
nodes interlink with each other. The involvement of different stakeholder groups resulted in a
more comprehensive understanding of impediments to management, as different groups
clearly perceived different combinations of barriers (Figure 6.2,3,4 and Table 6.3). Over 100
barriers were identified across the four stakeholder groups. Thirty-nine more or less discrete
barriers affecting the management of Prosopis were listed by four stakeholder groups in the
questionnaires (Table 6.3). Farmers mentioned the most barriers (26), followed closely by
Academics (24), and Managers and Workers who mentioned 19 and 15 respectively. In the
workshops the four stakeholder groups identified 100 more or less discrete barriers with
Academics identifying (56), managers identifying (50), Farmers identifying 38 and Workers
identifying (19) (Figure 6.2,3,4).
Stellenbosch University https://scholar.sun.ac.za
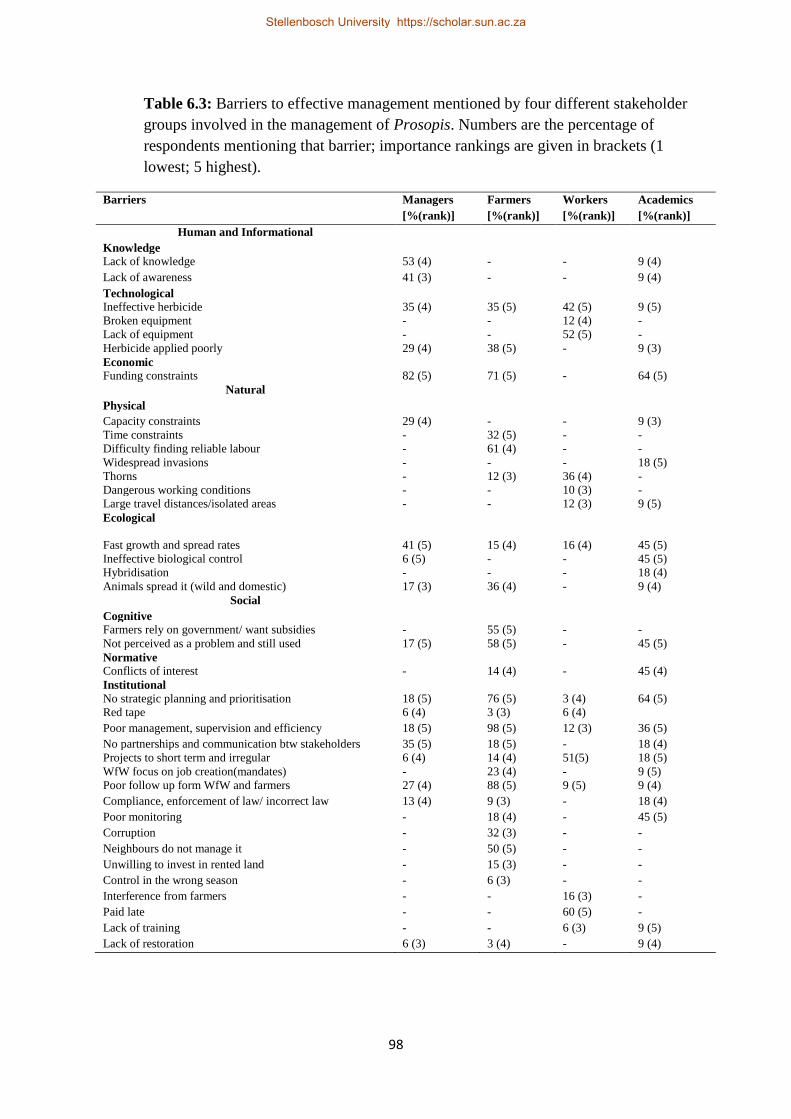
98
Table 6.3: Barriers to effective management mentioned by four different stakeholder
groups involved in the management of Prosopis. Numbers are the percentage of
respondents mentioning that barrier; importance rankings are given in brackets (1
lowest; 5 highest).
Barriers Managers
[%(rank)]
Farmers
[%(rank)]
Workers
[%(rank)]
Academics
[%(rank)]
Human and Informational
Knowledge
Lack of knowledge 53 (4) - - 9 (4)
Lack of awareness 41 (3) - - 9 (4)
Technological
Ineffective herbicide 35 (4) 35 (5) 42 (5) 9 (5)
Broken equipment - - 12 (4) -
Lack of equipment - - 52 (5) -
Herbicide applied poorly 29 (4) 38 (5) - 9 (3)
Economic
Funding constraints 82 (5) 71 (5) - 64 (5)
Natural
Physical
Capacity constraints 29 (4) - - 9 (3)
Time constraints - 32 (5) - -
Difficulty finding reliable labour - 61 (4) - -
Widespread invasions - - - 18 (5)
Thorns - 12 (3) 36 (4) -
Dangerous working conditions - - 10 (3) -
Large travel distances/isolated areas - - 12 (3) 9 (5)
Ecological
Fast growth and spread rates 41 (5) 15 (4) 16 (4) 45 (5)
Ineffective biological control 6 (5) - - 45 (5)
Hybridisation - - - 18 (4)
Animals spread it (wild and domestic) 17 (3) 36 (4) - 9 (4)
Social
Cognitive
Farmers rely on government/ want subsidies - 55 (5) - -
Not perceived as a problem and still used 17 (5) 58 (5) - 45 (5)
Normative
Conflicts of interest - 14 (4) - 45 (4)
Institutional
No strategic planning and prioritisation 18 (5) 76 (5) 3 (4) 64 (5)
Red tape 6 (4) 3 (3) 6 (4)
Poor management, supervision and efficiency 18 (5) 98 (5) 12 (3) 36 (5)
No partnerships and communication btw stakeholders 35 (5) 18 (5) - 18 (4)
Projects to short term and irregular 6 (4) 14 (4) 51(5) 18 (5)
WfW focus on job creation(mandates) - 23 (4) - 9 (5)
Poor follow up form WfW and farmers 27 (4) 88 (5) 9 (5) 9 (4)
Compliance, enforcement of law/ incorrect law 13 (4) 9 (3) - 18 (4)
Poor monitoring - 18 (4) - 45 (5)
Corruption - 32 (3) - -
Neighbours do not manage it - 50 (5) - -
Unwilling to invest in rented land - 15 (3) - -
Control in the wrong season - 6 (3) - -
Interference from farmers - - 16 (3) -
Paid late - - 60 (5) -
Lack of training - - 6 (3) 9 (5)
Lack of restoration 6 (3) 3 (4) - 9 (4)
Stellenbosch University https://scholar.sun.ac.za
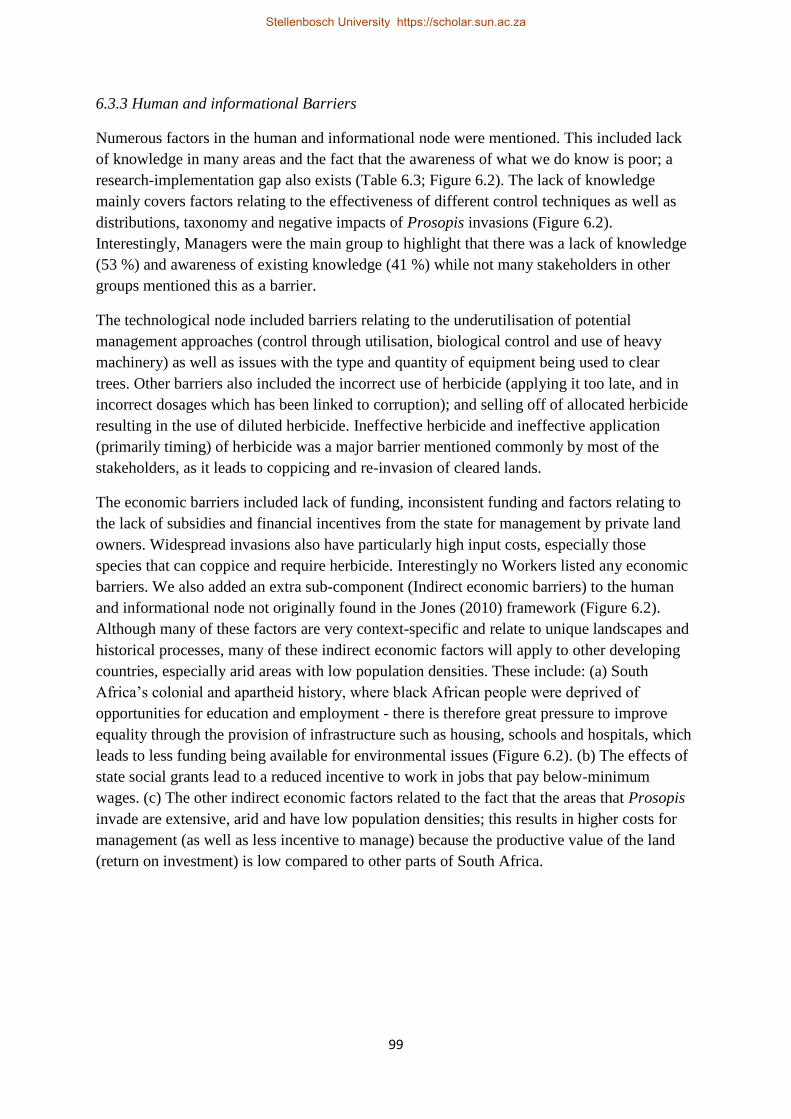
99
6.3.3 Human and informational Barriers
Numerous factors in the human and informational node were mentioned. This included lack
of knowledge in many areas and the fact that the awareness of what we do know is poor; a
research-implementation gap also exists (Table 6.3; Figure 6.2). The lack of knowledge
mainly covers factors relating to the effectiveness of different control techniques as well as
distributions, taxonomy and negative impacts of Prosopis invasions (Figure 6.2).
Interestingly, Managers were the main group to highlight that there was a lack of knowledge
(53 %) and awareness of existing knowledge (41 %) while not many stakeholders in other
groups mentioned this as a barrier.
The technological node included barriers relating to the underutilisation of potential
management approaches (control through utilisation, biological control and use of heavy
machinery) as well as issues with the type and quantity of equipment being used to clear
trees. Other barriers also included the incorrect use of herbicide (applying it too late, and in
incorrect dosages which has been linked to corruption); and selling off of allocated herbicide
resulting in the use of diluted herbicide. Ineffective herbicide and ineffective application
(primarily timing) of herbicide was a major barrier mentioned commonly by most of the
stakeholders, as it leads to coppicing and re-invasion of cleared lands.
The economic barriers included lack of funding, inconsistent funding and factors relating to
the lack of subsidies and financial incentives from the state for management by private land
owners. Widespread invasions also have particularly high input costs, especially those
species that can coppice and require herbicide. Interestingly no Workers listed any economic
barriers. We also added an extra sub-component (Indirect economic barriers) to the human
and informational node not originally found in the Jones (2010) framework (Figure 6.2).
Although many of these factors are very context-specific and relate to unique landscapes and
historical processes, many of these indirect economic factors will apply to other developing
countries, especially arid areas with low population densities. These include: (a) South
Africa’s colonial and apartheid history, where black African people were deprived of
opportunities for education and employment - there is therefore great pressure to improve
equality through the provision of infrastructure such as housing, schools and hospitals, which
leads to less funding being available for environmental issues (Figure 6.2). (b) The effects of
state social grants lead to a reduced incentive to work in jobs that pay below-minimum
wages. (c) The other indirect economic factors related to the fact that the areas that Prosopis
invade are extensive, arid and have low population densities; this results in higher costs for
management (as well as less incentive to manage) because the productive value of the land
(return on investment) is low compared to other parts of South Africa.
Stellenbosch University https://scholar.sun.ac.za
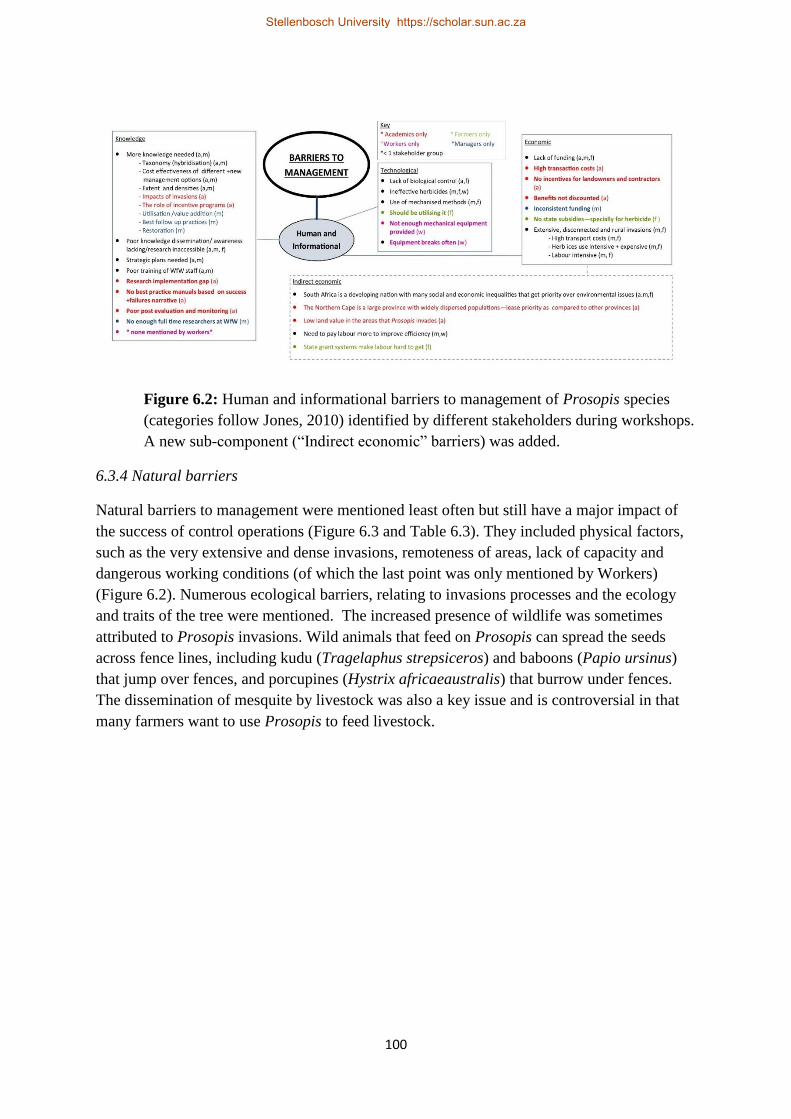
100
Figure 6.2: Human and informational barriers to management of Prosopis species
(categories follow Jones, 2010) identified by different stakeholders during workshops.
A new sub-component (“Indirect economic” barriers) was added.
6.3.4 Natural barriers
Natural barriers to management were mentioned least often but still have a major impact of
the success of control operations (Figure 6.3 and Table 6.3). They included physical factors,
such as the very extensive and dense invasions, remoteness of areas, lack of capacity and
dangerous working conditions (of which the last point was only mentioned by Workers)
(Figure 6.2). Numerous ecological barriers, relating to invasions processes and the ecology
and traits of the tree were mentioned. The increased presence of wildlife was sometimes
attributed to Prosopis invasions. Wild animals that feed on Prosopis can spread the seeds
across fence lines, including kudu (Tragelaphus strepsiceros) and baboons (Papio ursinus)
that jump over fences, and porcupines (Hystrix africaeaustralis) that burrow under fences.
The dissemination of mesquite by livestock was also a key issue and is controversial in that
many farmers want to use Prosopis to feed livestock.
Stellenbosch University https://scholar.sun.ac.za
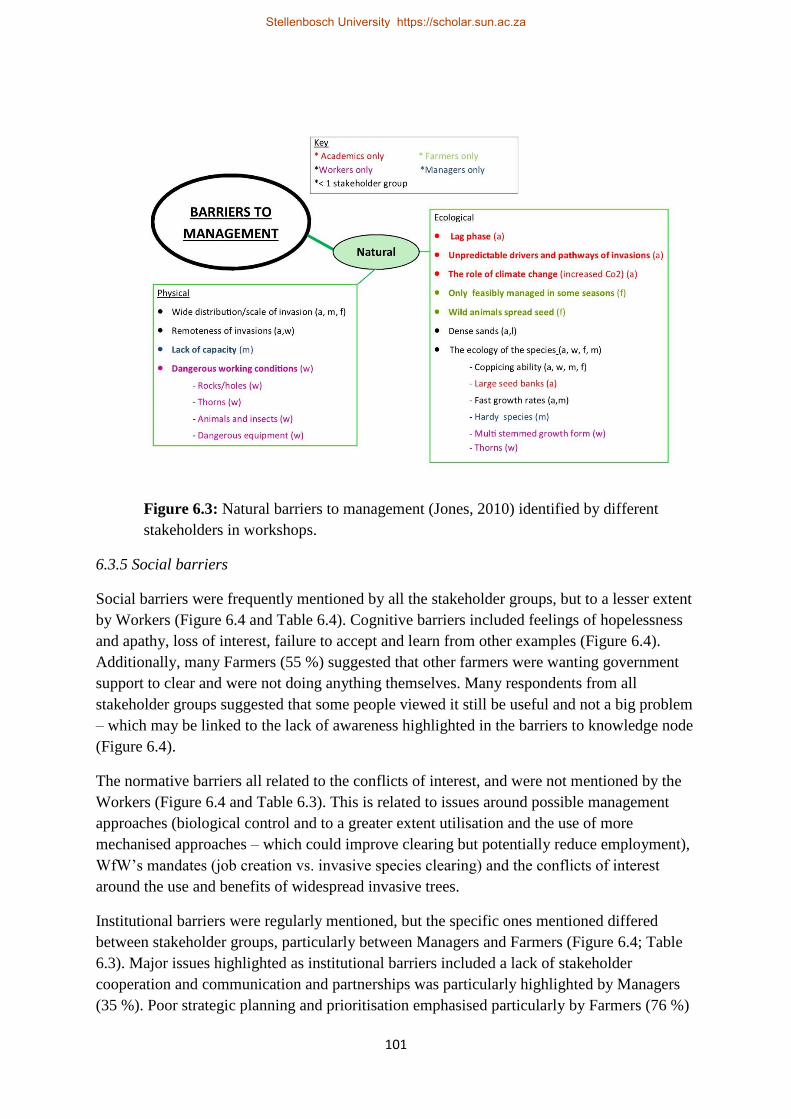
101
Figure 6.3: Natural barriers to management (Jones, 2010) identified by different
stakeholders in workshops.
6.3.5 Social barriers
Social barriers were frequently mentioned by all the stakeholder groups, but to a lesser extent
by Workers (Figure 6.4 and Table 6.4). Cognitive barriers included feelings of hopelessness
and apathy, loss of interest, failure to accept and learn from other examples (Figure 6.4).
Additionally, many Farmers (55 %) suggested that other farmers were wanting government
support to clear and were not doing anything themselves. Many respondents from all
stakeholder groups suggested that some people viewed it still be useful and not a big problem
– which may be linked to the lack of awareness highlighted in the barriers to knowledge node
(Figure 6.4).
The normative barriers all related to the conflicts of interest, and were not mentioned by the
Workers (Figure 6.4 and Table 6.3). This is related to issues around possible management
approaches (biological control and to a greater extent utilisation and the use of more
mechanised approaches – which could improve clearing but potentially reduce employment),
WfW’s mandates (job creation vs. invasive species clearing) and the conflicts of interest
around the use and benefits of widespread invasive trees.
Institutional barriers were regularly mentioned, but the specific ones mentioned differed
between stakeholder groups, particularly between Managers and Farmers (Figure 6.4; Table
6.3). Major issues highlighted as institutional barriers included a lack of stakeholder
cooperation and communication and partnerships was particularly highlighted by Managers
(35 %). Poor strategic planning and prioritisation emphasised particularly by Farmers (76 %)
Stellenbosch University https://scholar.sun.ac.za
102
and Academics (64 %) and to a lesser extent by Managers (18 %), and issues regarding
legislation. Farmers also emphasised poor management, supervision and quality control as
problems (95 %), poor follow-up clearing (88 %) corruption within the state-run WfW
program (32 %) and the lack of cooperation between landowners (where one clears and the
other does not) as major issues affecting successful management (Table 6.3). Many narratives
of corruption were discussed in the workshop – including Managers and contractors giving
Farmers herbicide in return for sheep (bribes), WfW projects sites being selected using bribes
and contractors claiming to have cleared land which was done by farmers and receiving
money for this. Many of the institutional issues raised by Farmers were not of as much
concern to Managers (Table 6.3). These discrepancies point to very different world views
among the most important stakeholders involved in management. Academics raised poor
monitoring (45 %), and issues relating to institutional arrangements and mandates as major
barriers as well as a lack of a champion and accountability in the WfW programme (Table
6.3). The short-term and irregular nature of projects were also raised as an issue by all
stakeholders, but particularly by Workers who found that this made it difficult for them to
plan financially and lead to them taking up full time jobs in other sectors if and when they
arose and leaving the WfW program. Workers suggested that they were not being paid on
time, which linked closely to the cognitive barriers of a loss of interest in employment in the
WfW programme.
Stellenbosch University https://scholar.sun.ac.za

103
Figure 6.4: Social barriers to management of Prosopis species (listed under
categories defined by Jones, 2010) identified by different stakeholder groups during
workshops.
6.3.6 Adaptation responses
Just under 30 adaptation responses were mentioned by the four stakeholder groups; each
group mentioned 11-16 different responses (Table 6.4). There was considerable overlap
between the responses listed by stakeholder groups with the most common adaptation
responses mentioned being: researching and using different approaches to management - this
included, using biological control, utilisation approaches, different herbicides (a sub-point
mentioned by all stakeholders), as well as using more mechanised approaches to improve
control. Linked to this is a point mentioned by Workers: that receiving more mechanical
equipment would help speed up control. Farmers mentioned that it would be important to
focus more on effective clearing methods than on job creation, and to change person working
days as a metric for success to another metric, such as the area of land cleared or potentially
an indicator of improvement in ecosystem services. Improved awareness and research, better
strategic planning and prioritisation, better stakeholder engagement and cooperation as well
as changing the legislation on Prosopis and better enforcement of legislation and contracts
were also highlighted as important among all stakeholder groups, except Workers. Improved
follow-up clearing and targeting of coppicing and re-invasion were highlighted by both
Stellenbosch University https://scholar.sun.ac.za

104
Managers and Farmers. Farmers also mentioned that improving the quality of, and having
more access to WfW area managers would help. They also emphasised that receiving
subsidies would encourage control; this aspect is linked to the other comments regarding the
provision of incentive and disincentive schemes to encourage and stimulate control. Workers
mentioned that getting paid at appropriate times would be beneficial to help reduce barriers of
feeling apathetic, unhappy and losing motivation about the project tenders. Academics
specifically suggested that understanding and overcoming conflicts of interest would help to
reduce certain barriers, as would an improved understanding of the taxonomy of the trees
present in South Africa which links closely to the release of potentially more effective
biological control agents and understanding the invasiveness of different species.
Table 6.4: Management and adaptation responses to improve the management of
Prosopis suggested by four stakeholder groups. Numbers in the table indicate the
percentage of each group that suggested particular responses.
Management/adaptation responses Managers Farmers Workers Academics
Awareness and research programs 35 38 - 18
Use and research diff. management approaches 58 100 9 81
More localised managers 17 3 3 -
Better stakeholder engagement 58 24 - 18
Use stronger herbicide 12 23 40 9
Increase budgets - - - 18
Less focus on job creation/change indicators of
success
- 24 - 9
Change and enforce legislation and contracts 47 21 - 18
More access to managers - 21 - -
Employ more teams 6 - 15 -
Make projects more long term/ more follow-ups 35 38 3 9
Understand and solve conflicts of interest - - - 27
Provide subsidies to farmers 6 - - -
Restore cleared areas 12 - - -
Disincentivize its use 12 - - -
Give teams more mechanical equipment - 55 -
Strategic planning and prioritisation 6 48 3 63
Improve monitoring - - - 18
Get paid on time - - 21 -
Improve training - - 3 9
Understand taxonomy - - - 27
Provide more training - - 3 -
Give farmers labour and herbicide subsidies - 32 - -
Incentive and disincentive schemes for farmers - 58 - -
Clamp down on corruption - 15 - -
Breed sterile cultivars/ id safe taxa to use - 6 - 9
Work in the correct seasons 6 9 - -
Change WfW operating system - 9 - -
Nothing or don’t know - - 9 -
Stellenbosch University https://scholar.sun.ac.za

105
6.8 Discussion
6.4.1 The value of including both workshops and questionnaires
Widespread invasive species such as Prosopis that transform landscapes and ecosystems have
major impacts on people and the environment (Table 6.2 and 6.4) and therefore require
management to minimize impacts and potentially improve benefits. However, there are many
barriers which hamper effective management of tree invasions (Table 6.2). Only eight
barriers relating to the management of invasive tree species had been highlighted in previous
studies in South Africa. These included: poor data on the distribution of the invasions, lack of
coordination between stakeholders, budgetary limitations and unpredictable environmental
drivers (Roura-Pascual et al. 2009) as well as weak policy and institutional environments,
lack of critical information, inadequate implementation and lack of capacity (UNEP, 2004),
all of which were identified in this study as well. Many of the barriers identified in this study
are fairly fundamental and have been mentioned in similar studies of other globally important
environmental changes, such as climate change (Jantarasami et al. 2010; Lehmann et al.
2014; Spires et al. 2014).
Using two approaches (each with advantages and disadvantages), over a hundred barriers to
management of widespread invasions were identified (Table 6.3, Figure 6.2 and 6.3). More
barriers to management were raised during workshops (100 (62 main-criteria and 38 sub-
criteria)) than in the questionnaires (just under 40) (Table 6.3; Figure 6.2,3). The
questionnaires were nonetheless useful for quantifying the frequency and the importance of
different barriers (Table 6.3). The questionnaires had the additional benefit in that data
gathering was inexpensive. The workshops clearly provide a more comprehensive
understanding of the dimensions and causes of barriers and how they are linked. Three
barriers were mentioned in questionnaires that were not raised in the workshops. These
included the sentiments of Farmers who were unwilling to invest money to clear on land they
were renting; the fact that Farmers interfered with the jobs that Workers were doing; and
Farmers highlighting that time constraints were a major factor hindering the effective
management of these invasive trees (Table 6.3).
There were differences in perception of barriers between different stakeholders (Figure,
6.2,3,4 and Table 6.3) which highlights the importance of including the full range of
stakeholders in such assessments. A comparison of the views between Farmers and Managers
regarding the listing of three particular barriers is particularly interesting (Table 6.3). First,
very few Managers identified the need for strategic planning and prioritization, whereas the
vast majority of Farmers think it is a big barrier. Secondly, poor management, supervision
and efficiency is regarded as very important by almost all Farmers, but very few Managers
mentioned this. Thirdly, almost all Farmers were concerned about poor follow-up treatments,
while only a quarter of Managers considered this important. These discrepancies point to very
different world views among the most important stakeholders involved in management.
Clearly, Farmers are concerned about poor planning and management efficiency, and
managers are not. This is probably because farmers have a genuine interest in a favourable
ecological outcome, while the second goal of WfW - job creation - is given precedence by
Stellenbosch University https://scholar.sun.ac.za
106
managers. Similar views have been noted by van Wilgen and Wannenburgh (2015) who
discuss why more emphasis is being placed on job creation than natural resource
management by the state and WfW programme, a barrier identified in this study as well. This
has led to the lack of prioritisation as the ecological conservation has taken a back seat –“job
creation in the short term has been traded off against natural resource protection that, in the
longer that would arguably protect many more jobs – a case of the tail that has come to wag
the dog” (van Wilgen and Wannenburgh, 2015).
6.4.2 Challenges presented by barriers
Many barriers that were highlighted in this study may be difficult to overcome (Figures
6.2,3,4 and Table 6.3). These include many aspects of the biology of the species: mass
seeding, coppicing, and fast growth rates and the factors that mediate invasions and their
persistence. However, other ecologically related factors can be addressed, there should be a
focus on adaptive responses that address factors such as management of drivers and pathways
of invasion, (Wilson et al. 2009) and improved methods of herbicide application (quality
control) to minimise coppicing and persistence. The improved management of livestock, by
putting them in holding camps before they are moved could minimise the spread of invasions
and could be a potential adaption response. Also, if control measures were prioritized in
space and time, such as beginning at the top of catchments, this would prevent re-invasions of
cleared areas in lower parts of catchments. Others barriers that would be difficult to adapt to
include: limited and inconsistent funding, and the lack of state subsidies and capacity
constraints, particularly hindered by contextual issues relating to the socio-economic history
of the county (Figure 6.4) (Shackleton et al. 2013). South Africa cannot provide WfW with
the money and capacity to cover all invaded lands (van Wilgen et al. 2012b), making it
imperative to use an adaptive management responses that would improve efficiency.
Prioritisation and strategic planning through space and time could help maximise the returns
on the available resources (van Wilgen et al. 2012b). This could be done using decision trees
(e.g. see Grice et al. 2010) or through multi-criteria decision making analysis (e.g. Forsyth et
al. 2012). Additionally, better partnerships and communication between stakeholders could
improve control with available budgets. Improved site management and quality control and a
clamp down on corruption may also help improve the effectiveness of management projects
and prevent wastage of money – a factor that could be easily addressed. Additionally,
alternative – more cost effective - methods of control could be sought such as biological
control and utilisation ((which are controversial approaches (Shackleton et al. 2014)) as well
as taking a more mechanised control methods (earth movers and application of herbicide
using planes) and having longer term projects in one area to target re-growth (van Wilgen et
al. 2012a). However, these other approaches are often hindered by conflicts of interest which
need to be addressed first (Shackleton et al. 2014; van Wilgen and Richardson, 2014).
6.4.3 The need for research
Research into the impacts of invasions and the benefits of control and the cost effectiveness
of these different approaches may help to resolve some of these conflicts of interest. Research
findings need to be interpreted and circulated in appropriate ways to different stakeholders to
Stellenbosch University https://scholar.sun.ac.za
107
improve awareness. Recent studies have shown that Prosopis substantially reduces grazing
potential and water supply, arguably the two most important resources in the areas (Ndhlovu
et al. 2011; Dzikiti et al. 2013). The majority of people view Prosopis to be more harmful
than beneficial and the benefits supplied to households are not as great as previously thought
relative to native trees (Shackleton et al. 2015c,d). These facts need to be publicized though
awareness-raising programmes; this should reduce conflicts of interest and encourage private
land owners to manage invasions. Previous studies have shown that good public awareness is
strongly correlated with implementation of climate-change adaptation responses and support
for initiatives for managing invasive species (Semenza et al. 2008; Garcia-Llorente et al.
2011, Verbrugge et al. 2013).
6.4.4 The role of legislation
Addressing and enforcing legislation is another barrier that could be overcome and could
greatly improve the control of Prosopis. Within the Northern Cape Province, Prosopis is
listed as a “Category 3” invasive species. This means that the genus may remain in the
province, but that further propagation or trade is prohibited (Department of Environmental
Affairs, 2014). Changing legislation to make Prosopis a “Category 1” genus everywhere
might help to improve private land owner control in an area where the spread and impacts are
the worst. In addition, enforcing the legislation more systematically would improve
management from a private land owner’s perspective to ensure that they do not get penalised
with fines.
6.4.5 Adaptive management
Adaptive management is also needed to better overcome these barriers and improve effective
management of Prosopis. This is due to the fact that the invasions are dynamic in different
areas, growing pressure from other drivers of change and changing social-economics
perceptions (Wise et al. 2012; Shackleton et al. 2015a,b). However, key to underpinning this
is also a need for improved monitoring to inform how management needs to be adapted
(Lyone et al. 2008).
6.5 Conclusion
This case study has provided useful insights on the barriers faced when managing large-scale
tree invasions. There is a need to extend these insights for other invasive plant and non-plant
taxa, and to address barriers hindering the management of emerging invasive species. There
will obviously be overlap, but these different taxa will have their own suite of unique
barriers. A better understanding of these could help improve management effectiveness and
reduce the negative impacts of biological invasions globally.
Acknowledgements
We thank all the participants that were involved in the study for their time and insight.
Funding was provided by the DST-NRF Centre of Excellence for Invasion Biology, the
Working for Water Programme and the National Research Foundation (grant 85417 to
DMR).
Stellenbosch University https://scholar.sun.ac.za
108
Towards a national strategy for the management of a widespread invasive
tree (Prosopis: mesquite) in South Africa
This chapter is intended for submission to Environmental Management.
Abstract
Biological invasions are a major component of human-induced global change and lead to
many negative impacts for humans and the environment. Effective management is required to
reduce negative impacts and, in some cases, to improve the supply of benefits. Invasive
stands of Prosopis (several species and their hybrids; collectively termed “mesquite”) now
cover over 6 million ha of South Africa and could invade over 56 million ha. These stands
have major impacts on biodiversity, local economies and ecosystem services such as the
supply of grazing and water. We applied several methods (decision trees, workshops and
questionnaires) to develop an objective basis for a national strategy to prioritise and guide the
management of invasive mesquite in South Africa.
Decision trees were used for assigning different control objectives (prevention of spread to
unoccupied areas, local eradication, containment and asset protection) to each of the 234
municipalities (lowest level of government) in the country. Priority assets that require
protection in densely invaded areas were identified, ranked and mapped (in order of
importance: water source areas, biodiversity hotspots, and areas with high agricultural and
rangeland potential). Available control methods (biological control, control through
utilisation, and different combinations of chemical and mechanical control) were compared in
terms of costs, effectiveness, and potential to create employment. Biological control and
more mechanised approaches were identified as important and the role of control through
utilisation requires urgent research. Scenario development suggests that integrated control
using various methods in optimal combinations would be most effective. Strategic guidelines
for improving the management of Prosopis were produced. These included key needs and
objectives, targets, time frames and indicators such as establishing coordination teams,
research agendas, monitoring programs, and specific goals for categorised management areas.
7.1 Introduction
7.1.1 General introduction
A small proportion of species moved by humans to new regions become naturalised, and
some of these become invasive and are increasingly leading to negative impacts on
biodiversity, ecosystem services, local economies and human health in many parts of the
world (Pimentel 2011; Jeschke et al. 2014). Biological invasions play an important role in
human-induced global change along with other factors such as habitat transformation and
climate change (Vitousek et al. 1997). Managing invasive species is often complicated and
challenging as many invaders can simultaneously provide benefits and cause negative
impacts within a given area, resulting in conflicts of interest regarding their use and
management (Shackleton et al. 2007; van Wilgen and Richardson, 2014). This makes
understanding the various social, ecological and economic aspects of invasions and the
Stellenbosch University https://scholar.sun.ac.za
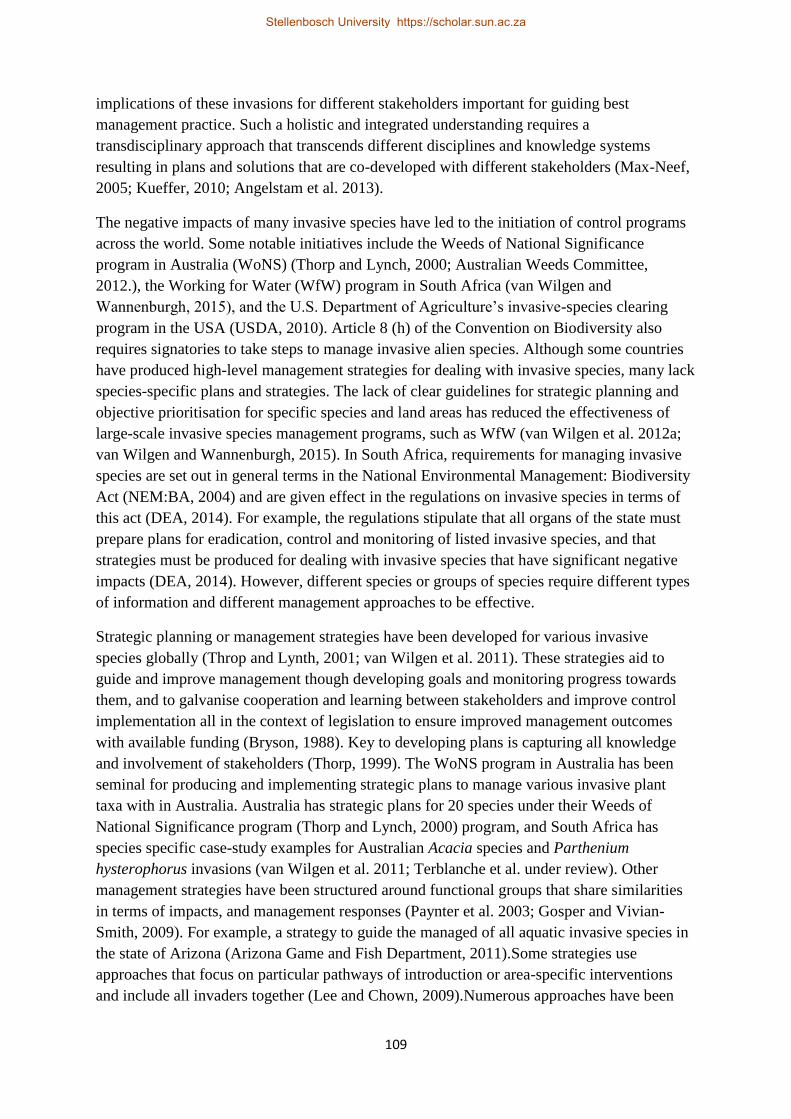
109
implications of these invasions for different stakeholders important for guiding best
management practice. Such a holistic and integrated understanding requires a
transdisciplinary approach that transcends different disciplines and knowledge systems
resulting in plans and solutions that are co-developed with different stakeholders (Max-Neef,
2005; Kueffer, 2010; Angelstam et al. 2013).
The negative impacts of many invasive species have led to the initiation of control programs
across the world. Some notable initiatives include the Weeds of National Significance
program in Australia (WoNS) (Thorp and Lynch, 2000; Australian Weeds Committee,
2012.), the Working for Water (WfW) program in South Africa (van Wilgen and
Wannenburgh, 2015), and the U.S. Department of Agriculture’s invasive-species clearing
program in the USA (USDA, 2010). Article 8 (h) of the Convention on Biodiversity also
requires signatories to take steps to manage invasive alien species. Although some countries
have produced high-level management strategies for dealing with invasive species, many lack
species-specific plans and strategies. The lack of clear guidelines for strategic planning and
objective prioritisation for specific species and land areas has reduced the effectiveness of
large-scale invasive species management programs, such as WfW (van Wilgen et al. 2012a;
van Wilgen and Wannenburgh, 2015). In South Africa, requirements for managing invasive
species are set out in general terms in the National Environmental Management: Biodiversity
Act (NEM:BA, 2004) and are given effect in the regulations on invasive species in terms of
this act (DEA, 2014). For example, the regulations stipulate that all organs of the state must
prepare plans for eradication, control and monitoring of listed invasive species, and that
strategies must be produced for dealing with invasive species that have significant negative
impacts (DEA, 2014). However, different species or groups of species require different types
of information and different management approaches to be effective.
Strategic planning or management strategies have been developed for various invasive
species globally (Throp and Lynth, 2001; van Wilgen et al. 2011). These strategies aid to
guide and improve management though developing goals and monitoring progress towards
them, and to galvanise cooperation and learning between stakeholders and improve control
implementation all in the context of legislation to ensure improved management outcomes
with available funding (Bryson, 1988). Key to developing plans is capturing all knowledge
and involvement of stakeholders (Thorp, 1999). The WoNS program in Australia has been
seminal for producing and implementing strategic plans to manage various invasive plant
taxa with in Australia. Australia has strategic plans for 20 species under their Weeds of
National Significance program (Thorp and Lynch, 2000) program, and South Africa has
species specific case-study examples for Australian Acacia species and Parthenium
hysterophorus invasions (van Wilgen et al. 2011; Terblanche et al. under review). Other
management strategies have been structured around functional groups that share similarities
in terms of impacts, and management responses (Paynter et al. 2003; Gosper and Vivian-
Smith, 2009). For example, a strategy to guide the managed of all aquatic invasive species in
the state of Arizona (Arizona Game and Fish Department, 2011).Some strategies use
approaches that focus on particular pathways of introduction or area-specific interventions
and include all invaders together (Lee and Chown, 2009).Numerous approaches have been
Stellenbosch University https://scholar.sun.ac.za

110
used for developing strategies to guide the management of invasive species including area-
and pathway-based approaches, risk assessments, impact assessments and spatial planning
and prioritisation (Downey et al. 2010; van Wilgen et al. 2011). Prioritisation of the risks and
impacts of invasive species is widely recognized as being crucial for effective large-scale
planning of interventions (Pheloung et al. 1999; Robertson et al. 2003; Downey 2010;
Downey et al. 2010). Despite this recognition, such approaches have rarely been used (Roura-
Pascual et al. 2009, 2010; Grice et al. 2011; Forsyth et al 2012; Le Maitre et al. 2015).
Objective spatial prioritisation (ranking the importance of land areas by importance) must be
done to guide management and to optimize the allocation of limited funds (Raw et al. 2010;
van Wilgen et al. 2012a). Various methods have been used for spatial planning; these include
decision trees and multi-criteria decision-making analysis (MCDA) methods such as Analytic
Hierarchy Process (AHP) (Grice et al. 2011; Forsyth et al 2012; Le Maitre et al. 2015;
Nielsen and Fei, 2015). Decision trees have been used to assign management approaches to
different areas (e.g., prevention of spread to unoccupied areas, local eradication, containment,
asset protection) would be most appropriate (see Grice et al. 2010; Le Maitre et al. 2015). A
range of options usually exists for containment and asset protection, including different
combinations of mechanical and chemical control, control through utilisation, biological
control and cultural control. Each option has its advantages and disadvantages, making
stakeholder engagement to assess wants and needs important (van Wilgen et al. 2011;
Shackleton et al. 2014). Multi-criteria decision analysis (MCDA) provides tools for
prioritising areas for control when there are multiple objectives and divergence and
contestation in stakeholder agendas relating to management (Saaty, 1990; Forsyth et al.
2012). AHP is useful for reaching consensus regarding management options among different
stakeholders and facilitates transdisciplinarity (Angelstam et al. 2013) - this is crucial in cases
where invasive species generate conflicts of interest (Saaty, 1990; Forsyth et al. 2012).
7.1.2 Prosopis in South Africa
7.1.21. History, distribution and impacts
Prosopis species were introduced to many parts of the world over the past two centuries and
are now naturalised or invasive in over 100 countries and islands (Shackleton et al. 2014).
Numerous Prosopis species were introduced into South Africa in the late 1800s and were
widely distributed to farms in the arid interior of the country in the mid-1900s to provide
fodder, fuelwood and shade (Poynton, 2009). Prosopis became naturalised and later invasive
and a hybrid swarm of numerous species (Mazibuko, 2012) is now the second most
widespread invasive plant genus in South Africa after Acacia (Henderson, 2007). It occurs
through the interior at varying levels of abundance (Figure 1a). Prosopis occurs within the
boundaries of 61 of the 234 municipalities in South Africa and occurs across almost half the
country (Figure 7.1a). Past research estimated that Prosopis covers 1.8 million ha of South
Africa (83% in the Northern Cape) (Versfeld et al. 1998; Van den Berg 2010). Using
compounded annual spread rates of 8 % pa (Van den Berg, 2010) and the latest distribution
records, we estimate that invasions currently cover over 6.5 million ha of South Africa (43%
in the Northern Cape). Additionally, Prosopis could potentially invade up to 56 million ha
Stellenbosch University https://scholar.sun.ac.za

111
(63% in the Northern Cape) in the future, indicated by climatic suitability models (Mgidi,
2004; Rouget et al. 2004) (Figure 7.1b).
There is growing evidence of negative impacts due to Prosopis invasions in the country.
These include negative impacts on ecosystem services (notably water and grazing; Ndhlovu
et al. 2011; Dzikiti et al. 2013), biodiversity (Shackleton et al. 2015a,b and references
therein) and local livelihoods and economies (Wise et al. 2012; Shackleton et al. 2015c).
These negative impacts are expected to increase, and the benefits from Prosopis to decrease,
as invasions become more widespread and increase in density, and as the reliance on natural
resources from Prosopis declines simultaneously (Wise et al 2012; Shackleton et al.
2015d).The key challenge for managing Prosopis is therefore to reduce the negative impacts,
while maintaining certain benefits where feasible.
Figure 7.1: (a) Distribution of Prosopis spp. in South Africa (Sources: SAPIA
database – L. Henderson; Van den Berg, 2010; Shackleton 2015a and 2015b); (b)
Climatically suitable areas for Prosopis spp. in South Africa based on Mgidi (2004).
7.2.3 Legislation and management
As required by the regulations under the (NEM:BA, 2004; Act No. 10 of 2004: Alien and
Invasive Lists, 2014), South African legislation divides invasive species into three categories
based on their use and impact – similar to categories used in Australia (Australian Weeds
Committee, 2012; Department of Environmental Affairs, 2014;). In the Northern Cape
province, Prosopis is listed as a Category-3 invasive taxon, which means that existing plants
may be retained, while propagation, use or trade is prohibited. However, the utilisation of
Prosopis pods on private land for fodder is specifically exempted from the prohibitions,
allowing farmers to use this resource, despite the fact that this clearly promotes spread. In
other South African provinces mesquite is a Category-1 invader which means that invasive
populations must be controlled wherever they occur. The NEM:BA regulations stipulate that
the Department of Environmental Affairs must coordinate and produce strategies to prevent
new introductions, and control or eradicate current invasive species. Organs of state (national
Stellenbosch University https://scholar.sun.ac.za

112
and provincial departments and municipalities) need to produce area-based management
plans for those invasive species listed in the regulations. In addition, species with significant
impacts require national-scale management strategies and programs. The current NEM:BA
regulations are ambitious and are widely considered to be unrealistic for many taxa
(including Prosopis) that are extremely widespread, especially where the success of
management hinges on effective cooperation of multiple stakeholders. The regulations
provide direction and a level of institutional support for certain activities, but will be
reviewed, updated and improved in the future. The consideration of requirements for the
effective management of Prosopis discussed in this paper accommodate key aspects of the
existing legislation and provide additional considerations that will hopefully guide the
revision of the legislation in the future.
The management of Prosopis invasions in South Africa has been primarily funded and co-
ordinated by the WfW programme over the past two decades, although many private land
owners have also managed invasions on their land at their own expense (Shackleton et al.
2015c). Working for Water spent approximately R 1 billion (US $ 74 million) [estimated
from data in van Wilgen et al. (2012b) and van Wilgen and Wannenburgh, 2015)] between
1996 and 2015 on attempts to control Prosopis populations. Despite this substantial
investment, the prevailing strategy has failed to prevent the rapid and accelerating spread and
densification of Prosopis in the country, and invasive stands continue to spread rapidly (8 %
per annum; van den Berg, 2010; van Wilgen et al. 2012). The ineffectiveness of control
efforts to date has been attributed to, among other things, the lack of effective prioritisation
and strategic planning, the primary focus on job creation rather than on ecological outcomes,
and poor on-the-ground management practices (Forsyth et al. 2012; van Wilgen et al. 2012a;
Shackleton et al. 2014 and under review; van Wilgen and Wannenburgh, 2015). Although
biological control was initiated in the late 1980s, the insect agents have shown a limited
ability to reduce rates of spread (Zachariades et al. 2011). Further research to find more
effective biological control agents has been delayed because of perceived conflicts of interest
about the relative benefits of the tree, although now improved biological control is widely
considered a crucial facet of improved management for Prosopis in South Africa
(Zachariades et al. 2011; Wise et al. 2012; Shackleton et al. 2015c).
Working for Water is a government-funded public-works program which has dual goals. It
aims to: (1) provide employment to and develop skills of disadvantaged communities; and (2)
manage invasive species to reduce their negative impacts on the environment and restore the
delivery of ecosystem services (van Wilgen et al. 2012a; van Wilgen and Wannenburgh,
2015). These dual goals exist because of the high levels of inequality in South Africa as a
society arising from colonialist and apartheid policies that marginalised a large proportion of
the population. Providing employment and developing skills in historically marginalised
communities is an overriding political imperative. Projects under WfW control are managed
on behalf of the Department of Environmental Affairs by implementing agents (including
government departments, municipalities, national and provincial conservation authorities, and
forestry, agricultural and water management organizations). The projects are contracted out
to local service providers, most of them from previously disadvantaged backgrounds, and are
Stellenbosch University https://scholar.sun.ac.za

113
supervised by regional managers employed by the implementing agents (van Wilgen and
Wannenburgh, 2015). Contracts typically consist of projects lasting 2-3 months. Field teams
include a contractor with teams, usually comprising about 10 unskilled workers, who are paid
to clear demarcated areas based on norms and standards set for different species, terrain
categories and density classes (van Wilgen and Wannenburgh, 2015). WfW receives an
annual budget of about R 1.8 billion to manage invasions nationally, and is extremely well
funded compared to other natural resource management projects in South Africa (van Wilgen
et al. 2012b).
The extent of Prosopis invasions, their rapid spread, and the major negative impacts they
have on human livelihoods and the environment make it important to manage them
effectively to reduce costs and improve benefits. This paper describes the development of a
national strategy to prioritize and manage invasive Prosopis in South Africa, where emphasis
has been placed on a developing a holistic and more nuanced understanding of the status quo
and future management options drawing on the literature and views of multiple stakeholders.
7.2 Developing the strategy
Insights from several approaches and sources were synthesised to develop the foundation for
a strategy to guide the management of invasive Prosopis in South Africa using the framework
shown in Figure 7.2. This involved five main steps. The first two steps involved collating
background information on the positive and negative impacts, distribution and ecology of
Prosopis using the literature and specific case studies we conducted (many of which include
different stakeholders) which have now been published. This was used as justification for the
need to control Prosopis and to guide the development of the strategy for Prosopis
management in South Africa (Figure 7.2). Step three reviewed current and past management
of Prosopis (Figure 7.2). This included the literature and the use of workshops and surveys to
identify key barriers that impede effective management and identified strategic and adaptive
approaches that need to be applied to improve control of Prosopis (Shackleton et al. under
review). Step four used various approaches to define components of a national strategy for
Prosopis (Figure 7.2). This included drawing on published literature, in particular, examples
from the WONS programme in Australia and strategies developed for other invasive plant
taxa in South Africa (van Wilgen et al. 2011; Australian Weeds Committee, 2012;
Terblanche et al. under review), to assess different control options and to identify needs for
developing strategies and associated implementation plans. Multi-stakeholder workshops that
included farmers, academics and private and public managers were used to develop and
overarching goal for the strategy. These workshops were also used to identify crucial needs
and outcomes for the strategy as well as for scenario planning as seen in Table 7.1, and
Figure 7.3. The effectiveness and role of different control options and approaches were
discussed in these workshops and through interviews with key informants (Table 7.2).
Decision-tree models (Grice et al. 2010) were used to assign appropriate control objectives to
different parts of South Africa (Figure 7.4). Using the current and potential distribution
(Figure 7.1), the Grice et al. (2010) decision-tree framework was used to allocate
management priorities to each of the 234 municipalities in South Africa (Figure 7.4). The
decision tree allocated each municipality to one of five zones: Prevention which included: (1)
Stellenbosch University https://scholar.sun.ac.za

114
passive surveillance for areas with no Prosopis records and that are not climatically suitable;
(2) active surveillance for areas with no records of Prosopis which are climatically suitable
for its growth; (3) local eradication where Prosopis is localised at low densities and
eradication is feasible; (4) containment for populations that cannot be eradicated and that fall
on the border of heavily and uninvaded areas; and (5) asset protection for areas with
widespread dense invasion, where containment is not feasible. Questionnaires were sent to
farmers and managers to collect information on perceptions of these different control
objectives. Multi-criteria decision making analysis (using AHP, Saaty et al. 1990) was used
to achieve an objective, spatially-explicit, prioritisation of assets for protection in areas with
widespread Prosopis invasions (Forsyth et al. 2012) (Figure 7.5; Table 7.3) and involved
multi-stakeholder workshops and the use of questionnaires. Step five focused on the
monitoring and evaluation as part of the strategy, and options to follow based on the
outcomes of monitoring. This was developed using the literature and through input at multi-
stakeholder workshops and interviews with key informants. See Appendix 1 for a more in-
depth description of the approaches used in the development of the strategy for Prosopis.
Stellenbosch University https://scholar.sun.ac.za
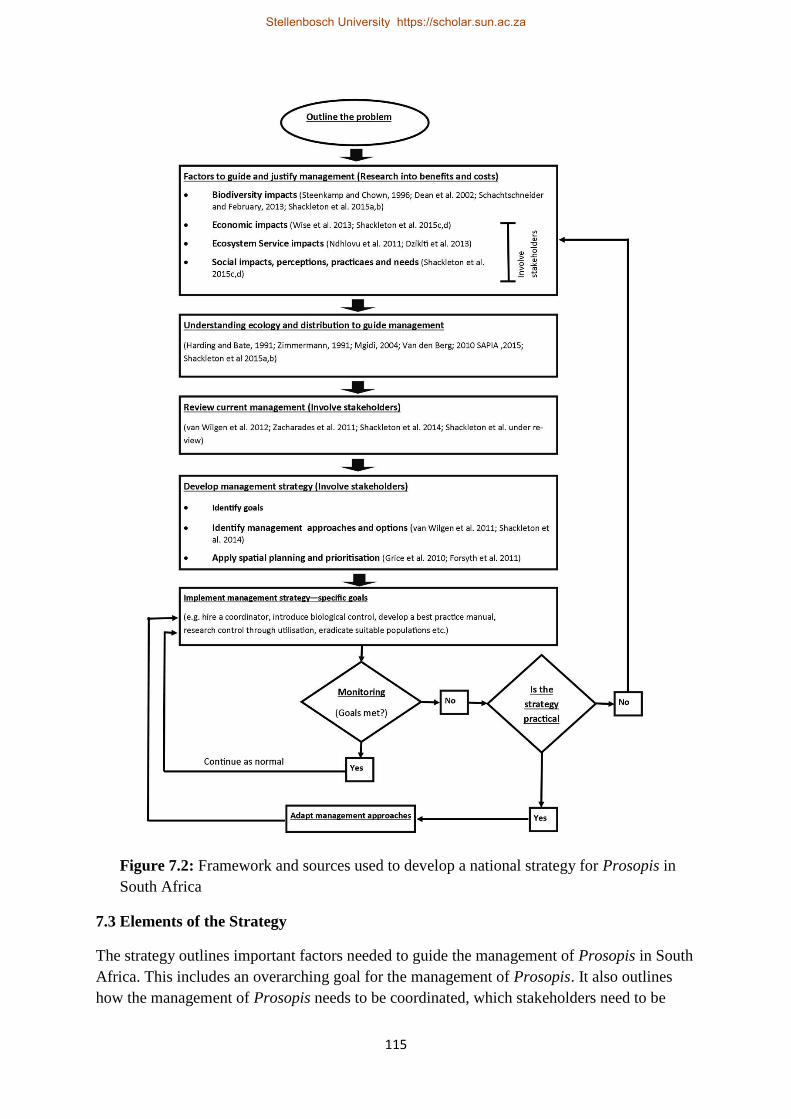
115
Figure 7.2: Framework and sources used to develop a national strategy for Prosopis in
South Africa
7.3 Elements of the Strategy
The strategy outlines important factors needed to guide the management of Prosopis in South
Africa. This includes an overarching goal for the management of Prosopis. It also outlines
how the management of Prosopis needs to be coordinated, which stakeholders need to be
Stellenbosch University https://scholar.sun.ac.za
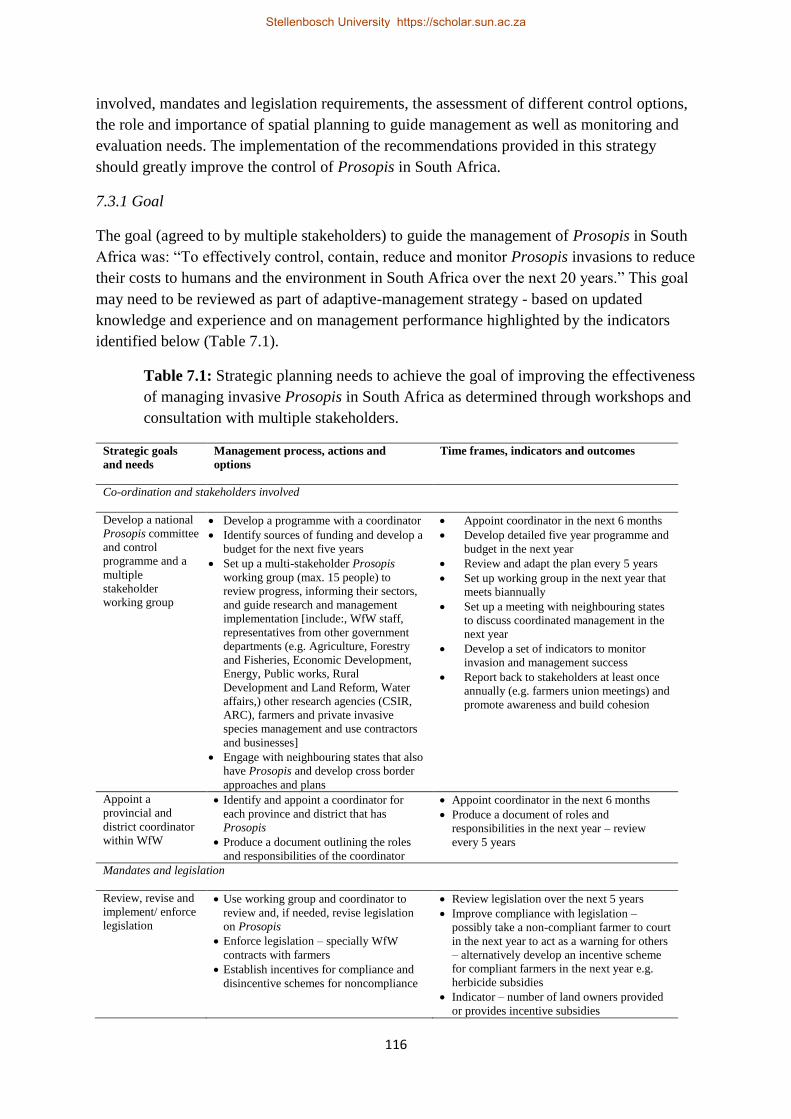
116
involved, mandates and legislation requirements, the assessment of different control options,
the role and importance of spatial planning to guide management as well as monitoring and
evaluation needs. The implementation of the recommendations provided in this strategy
should greatly improve the control of Prosopis in South Africa.
7.3.1 Goal
The goal (agreed to by multiple stakeholders) to guide the management of Prosopis in South
Africa was: “To effectively control, contain, reduce and monitor Prosopis invasions to reduce
their costs to humans and the environment in South Africa over the next 20 years.” This goal
may need to be reviewed as part of adaptive-management strategy - based on updated
knowledge and experience and on management performance highlighted by the indicators
identified below (Table 7.1).
Table 7.1: Strategic planning needs to achieve the goal of improving the effectiveness
of managing invasive Prosopis in South Africa as determined through workshops and
consultation with multiple stakeholders.
Strategic goals
and needs
Management process, actions and
options
Time frames, indicators and outcomes
Co-ordination and stakeholders involved
Develop a national
Prosopis committee
and control
programme and a
multiple
stakeholder
working group
Develop a programme with a coordinator
Identify sources of funding and develop a
budget for the next five years
Set up a multi-stakeholder Prosopis
working group (max. 15 people) to
review progress, informing their sectors,
and guide research and management
implementation [include:, WfW staff,
representatives from other government
departments (e.g. Agriculture, Forestry
and Fisheries, Economic Development,
Energy, Public works, Rural
Development and Land Reform, Water
affairs,) other research agencies (CSIR,
ARC), farmers and private invasive
species management and use contractors
and businesses]
Engage with neighbouring states that also
have Prosopis and develop cross border
approaches and plans
Appoint coordinator in the next 6 months
Develop detailed five year programme and
budget in the next year
Review and adapt the plan every 5 years
Set up working group in the next year that
meets biannually
Set up a meeting with neighbouring states
to discuss coordinated management in the
next year
Develop a set of indicators to monitor
invasion and management success
Report back to stakeholders at least once
annually (e.g. farmers union meetings) and
promote awareness and build cohesion
Appoint a
provincial and
district coordinator
within WfW
Identify and appoint a coordinator for
each province and district that has
Prosopis
Produce a document outlining the roles
and responsibilities of the coordinator
Appoint coordinator in the next 6 months
Produce a document of roles and
responsibilities in the next year – review
every 5 years
Mandates and legislation
Review, revise and
implement/ enforce
legislation
Use working group and coordinator to
review and, if needed, revise legislation
on Prosopis
Enforce legislation – specially WfW
contracts with farmers
Establish incentives for compliance and
disincentive schemes for noncompliance
Review legislation over the next 5 years
Improve compliance with legislation –
possibly take a non-compliant farmer to court
in the next year to act as a warning for others
– alternatively develop an incentive scheme
for compliant farmers in the next year e.g.
herbicide subsidies
Indicator – number of land owners provided
or provides incentive subsidies
Stellenbosch University https://scholar.sun.ac.za

117
Develop a research
agenda Identify priority research areas to be
addressed – particularly biological
control, control through utilisation, and
monitoring
Produce a 5-year research plan (driven by
working group and coordinators) in the next
2 years
Develop a best
practice manual for
private land owners
Producer a booklet and/or online
document to distribute to farmers with the
aim to build awareness, improve
monitoring and guide management of
Prosopis on private land
Produce manual in the next year – update
every 5 years as new research becomes
available
Develop a
standardised
monitoring plan
Produce a report identifying key
indicators of management success and
invasion spread and standardise
monitoring across different organs of
state
Produce annual monitoring reports
Develop a set of monitoring guidelines in the
next year (with a detailed set of standardised
indicators)
Produce annual reports
Revise after guidelines after 5 years
Strategic objectives based on spatial differentiation planning
Strategic objective
1a) Prevention
(passive
surveillance)
Passive surveillance
Annual occurrence maps and reports –
eradicate any new populations
Set up citizen spotter network for Prosopis in
the next year it could be linked into an
accessible reporting platform based on
SAPIA and or iSpot
Indicator – number of new populations
identified
Strategic objective
1b) Prevention
(active
surveillance)
Active surveillance (partially along
pathways of spread – riparian areas and
livestock transport routes)
Targeted awareness and education
programs amongst the public
Annual occurrence maps and reports –
eradicate any new populations
Incorporate engaging with farmers unions at
their quarterly meetings into the mandate of
area managers/coordinators to provide and
get feedback, get reports of new occurrence
as well as raise awareness
Set up citizen spotter network for Prosopis in
the next year (see above)
Indicator – number of new populations
identified and management costs
Strategic objective
2) Local eradication Identify populations for eradication
Provide specialised funding for
populations targeted of local eradication
Employ a national eradication coordinator
for Prosopis if not then for all plant
species
Monitor and control populations
earmarked for eradication every year
months for at least 5 years
In the next year produce a report with a
budget earmarking populations for
eradication
Reports every 6 months on progress of all
populations targeted for eradication
Enforce legislation and contract compliance
in these areas
Incentivise farmers to prevent further
invasion
Build awareness in areas targeted for
eradication
Report back to stakeholders at least annually
(e.g. at farmers union meetings) and promote
awareness and build cohesion
Indicator - number of populations eradicated
and management costs
Strategic objective
3) Containment Use multiple control approaches to
maximise control
Enforce legislation
Report back annually
Map changes in containment zones annually
Report back to stakeholders at least once
annually (e.g. farmers union meetings) and
promote awareness and build cohesion
Indicator - the reductions of outward
spreading invasions and management costs
Strategic objective
4) Asset protection Each district municipality must produce a
spatial prioritisation plan using the
criteria in this paper or similar ones
(Table 1)
Report back annually
Map changes in asset protection zones
annually
Stellenbosch University https://scholar.sun.ac.za

118
Use multiple control approaches to
maximise control and be adaptable
Engage with stakeholders (farmers union
meetings other departments)
Report back to stakeholders at least once
annually (e.g. farmers union meetings) and
promote awareness and build cohesion
Research and release an effective biological
control agent in the next 5 years.
Produce a report on feasibility of the control
through utilisation option in the next 3 years.
Enforce legislation
Indicator - number of ha cleared and the
improvements in supply or health/quality of
assets earmarked to be protected and
management costs
7.3.2 Co-ordination of programs and stakeholders involved
Better coordination, as identified in the workshops, was seen as important for the strategy
(Shackleton et al. under review). Participants also highlighted that coordination and
cooperation at different levels (international to local) is crucial for alignment with South
African legislation and for overall control success (Table 7.1). It was also identified that
cross-border coordination and cooperation will help to ensure successful management (Table
7.1).
We therefore propose that national and regional coordinators and a multiple-stakeholder
working group consisting of WfW managers, representatives from different government
departments and research institutions was well as private stakeholders (farmers, private
utilisation and control companies) needs to be appointed in the next year to guide
management (Table 7.1). The coordinators and working group should direct Prosopis
management implementation and other matters, such as the formulation of a research agenda
and best-practice manual for private land owners and oversee stakeholder engagement,
monitoring and performance evaluations (Table 7.1).
Report-backs should be conducted at least annually and plans need to be reviewed and
revised if necessary at least every 5 years - a process driven by the coordinators Annual
feedback to interested and affected stakeholders, primarily farmers unions (Table 7.1) will
help to build cohesion, cooperation, awareness and accountability. The state is unable to
manage Prosopis alone; this makes bringing private landowners on board an important part
of the strategy. We highlighted the need to set up and promote the use of citizen spotter
networks, and the need for regional managers to engage and report to farmers at union
meetings (Table 7.1). The production of a best-practice manual that can be widely distributed
to promote awareness among private land owners and management by non-governmental
stakeholders is needed. Incentive/disincentive schemes for non-compliance with legislation
and contracts by private land owners need to be implemented as soon as possible to improve
buy-in and overall management participation by different stakeholders (see section 3.3).
7.3.3 Mandates of programs and legislation
Mandates for the strategic programme must be adopted by WfW operations and apply to the
latest NEM:BA regulations which should be reviewed based on the outcomes of the strategy
(Table 7.1). ). We also suggest that a case should be made to move Prosopis from a category
Stellenbosch University https://scholar.sun.ac.za

119
3 species in the Northern Cape to a category 1 species which would ensure improved
management. This is based on the growing body of evidence that shows that at current and
future invasion rates the costs are higher than the benefits (Wise et al. 2012; Shackleton et al.,
2015a,b,c). Compliance with contracts between WFW and farmers as well as NEM:BA
regulations is currently low; this is a major barrier hindering effective management of
Prosopis (Shackleton et al. under review). Therefore, efforts to raise awareness of legislation
among stakeholders are required. Getting mass buy-in and cooperation of private land owners
is important if control is to be successful. Enforcement of legislation to improve compliance,
in particular contracts between farmers and WfW, will improved efficiency and reduce
wattage of resources. (Table 7.1). Incentive and disincentive schemes could help improve
compliance (Shackleton et al. under review) and need to be initiated as soon as possible. It is
also suggested that the regulations need to be reviewed soon and possibly amended to
improve options for management in the long run (Table 7.1).
7.3.4 Control options and approaches
Various control options exist for Prosopis, each with their own benefits and costs, as
identified in the literature and through stakeholder workshops and interviews (Shackleton et
al. 2014; Table 7.2). At the current rates of control using the cut-stump method applied by
WfW, Prosopis is spreading fast enough to annul the attempts of management to reduce
extent and density (van Wilgen et al. 2012a). Furthermore, the current “shot-gun” approach
(involving the random implementation of control measures, without spatial prioritisation or
evaluation of control effectiveness) has led to small gains in isolated areas, but has not
resulted in a reduction in the overall extent of the problem (van Wilgen and Wannenburgh,
2015; Shackleton et al. under review). This is largely because WfW focusses primarily on job
creation and gives less attention to optimizing clearing methods to reduce the extent of
invasions (van Wilgen and Wannenburgh, 2015; Shackleton et al, under review).
Stellenbosch University https://scholar.sun.ac.za
120
Figure 7.3: Scenarios of the extent of Prosopis invasion and associated costs over
time based on different control options, combinations of options, and their potential
effects on invasion extent.
This strategy outlines that an integrated management approach needs to be applied if
Prosopis is to be controlled effectively (Figure 7.3). Integrated management includes the
combination of two or more different control approaches (Figure 7.3; Table 7.2) (van Wilgen
et al. 2001). We suggest that in particular three important control options need to be
researched and implemented. This includes; (1) the release of more lethal biological control
agents as the most important factor (Figure 7.3; Table7. 4). If the correct agents are found
biological control will be the most cost effective approach to controlling invasions (Appendix
2). We also suggest that; (2) less labour-intensive methods such as aerial spraying or use of
heavy machinery methods, which can clear areas at greater rates, will be needed if Prosopis
is to be managed effectively in areas where important assets needs to be protected (Table
7.2). This will ensure rapid control in important areas, cut stump can be used for eradication
and containment programs and maintain high employment in the WfW program (Figure 7.4).
We also identified that, (3) the role of large scale control through utilisation as a potential
control approach needs further research (Figure 7.3; Table 7.1 and 7.2). This approach could
allow for faster control and rural economic development, however, there are still
controversial issues around this approach such as creating a dependency on a resource that is
expected to decrease and issues around potentially promoting spread of invasive species
(Table7.2). One senior WfW manager said at one of the workshops “There is more than
enough Prosopis for everybody (different control techniques) and still more to go around.”
Additionally, the strategy suggests that a best-practice manual containing information on
Stellenbosch University https://scholar.sun.ac.za

121
impacts of Prosopis and management options would be useful for improving awareness and
for achieving large-scale buy in among landowners and for improving the effectiveness of
control (Table 7.1). The use of spatial planning and prioritisation (Figure 7.4 and 7.5) to
direct and prioritise control approaches is needed to improve control effectiveness in the long
run especially in light limited funding and capacity (see Figure 7.4; Figure7.5; Table 7.3)
(Shackleton et al. under review). In addition, improving coordination, and enforcement of
legislation will also improve the effectiveness of mechanical control. See Appendix 2 for
more details on the different control options highlighted above and in Table 7.2.
Stellenbosch University https://scholar.sun.ac.za

122
Table 7.2: A comparison of control options in terms of their benefits and costs, mean
operation costs, time frames and employment opportunities.
Control
approach
Options for
different
approaches
a Cost to clear/contain dense
invasion b Time to clear a ha; c Number of people
employed/ha
Considerations
Biological
control
Seed feeding
beetles A. prosopis, A. bottimeri and N.
arizonensis – to
reduce rates of spread
a Marginal (a few R million for
research thereafter minor funding for monitoring) b Only reduces rates of spread and
decreases densities due to lower recruitment c Low – a few researchers and lab
assistants
Has not worked very well as colder winters in South
Africa cause population crashes. Was initially used as benefits were higher in the past and the aim was to reduce
rates or spread and not mortality to allow for continued
use.
Lethal control:
Evippe spp.
released in
Australia (further potential agents
exist for increasing
tree mortality or to contain rates of
spread)
a See above b Unknown – Evidence in Australia
suggests that biological control has
made vast impacts on containing and reducing rates of spread but
not leading to mass mortality yet
(Decreased canopy cover by two thirds in some areas) c Low – a few researchers
Will be the most cost-effective method if correct agent is
discovered. There is increasing support for the positive
role of biological control in Australia (van Klinken and
Pichancourt, 2015; van Klinken, 2012) and further agents that will cause mortality need to be released into South
Africa.
Mechanical
& chemical
control
Cut stump (standard WfW
approach)
a± R 5 000- 7 000 for (wages and herbicide) b± 3 days/ha c High -11 people
It is the slowest Prosopis clearing method, but it best meets the duel goal of high employment and invasive
species clearing under WfW’s mandate. This approach is
appropriate for eradication programs, however, for widespread populations it needs to be applied with more
mechanical approaches.
Mechanised approach – heavy
machinery (back-
actors & bulldozers)
a± R 6000 – 8000 (wages and machinery running costs) b ± 1 -2 ha/day c Low ± 1-2 people
Is approach is destructive to the environment – but very effective for clearing areas that will be used for agriculture
as stumps are removed. If agriculture is to be sustained, no
follow up is required which makes it more cost effective. The use of this approach needs to be prioritised in areas
with high agricultural potential using the approach in
highlighted in Table 7.3 and Figure 7.4
Mechanised
approach –
herbicide spraying with aircraft
a ± R 1000 b < 1 000 ha/day c Low ± 1-2 people
Will control populations fastest – and ground teams will
be needed for follow-up control – will therefore not
impact employment significantly. The potential impact of herbicides on the environment and restoration needs to be
investigated further.
Control
through
utilisation
Example used is for
making pellets for bio-energy to be
exported to Europe
*(production of 20 000 tons per
annum). There are
numbers other utilisation
possibilities.
a*Labour intensive methods
(R9000/ ha) -Machinery intensive (R10000/ha) b Labour intensive ± 3 days/ha –
Machinery intensive ± 1-3 ha/day c High ± 20 people for both
methods
This is still a controversial approach and needs further
research. Programs need to be fairly large scale to have an impact on invasions (e.g. making flour and medicine
touted as a utilisation success will not be adequate). Net
profit margin is estimated at 10 % per of capital and operational costs which is ± R 3 million/annum and could
be reinvested into control. Privatisation of control could
be implemented with this approach taking pressure of the state. Investigation into the feasibility of approach is
required urgently. Other utilisation possibilities include
charcoal, paper and mulching etc.
Other
approaches
Livestock
management
a No clearing – prevents spread
*Fencing could be expensive if
needed b Prevents spread c Low
Has other rangeland benefits as well. If fencing needed
costs will rise, but will also aid employment
Transport managed a No clearing – prevents spread c Prevents spread c Low
Not clearing per se, but essential for managing a pathway
of spread
Fire a,b,c Low
Largely unfeasible in the arid conditions where most
invasive stands occur and for fire-resistant hybrids. That said as invasions move into the high rainfall grassland
areas of South Africa this approach may be appropriate.
Small concentrated fires at the base of large trees have been used effectively for killing single isolated trees.
Stellenbosch University https://scholar.sun.ac.za

123
7.3.5 Spatial planning of management areas
Spatial planning is useful as it breaks down large areas into smaller, more manageable, units
and identifies control actions needed for each and helps to guide funding allocation for each
municipality (Grice et al. 2010). Numerous stakeholders considered this as important for
improving management success of Prosopis (Shackleton et al. under review). Using current
and potential distribution (Figure 7.1), municipalities were divided into five different
management areas (prevention: (passive and active surveillance); eradication, containment
and asset protection) (See appendix 1 for further details on the methods used). Fifty-seven
municipalities fell into the active prevention (surveillance) category and half (116) fell into
the passive prevention (surveillance) category (where climatic suitability was poor) (Figure
7.3). Active surveillance should focus on the main pathways and vectors of spread, including
riparian areas and major livestock-transport routes. Awareness and reporting programs need
to be established to allow citizens (particularly farmers) to submit new reports of invasion,
making surveillance easier and more cost effective; these need to be facilitated by the local
coordinators (Table 7.1). Monitoring of these land units for new invasions will be the least
costly management approach, but good coordination and planning will improve success
considerably (Table 7.1). Of the municipalities requiring active control, 16 fell within the
eradication category, and 8 within the containment category. A large number of
municipalities (37) fell within the asset-protection category, including all of the 15 largest
municipal districts in South Africa.
Their large size means that further prioritisation, focusing on the assets that need to be
protected, is required. To this end, we applied AHP to identify and spatially prioritise land
areas (see section 3.5 below) with important assets requiring protection. Farmers and
managers consider local eradication and containment of further spread to be the most cost
effective and most important management approach for reducing the overall impacts of
Prosopis on humans and the environment across South Africa (Appendix 3). Prevention
(active and passive surveillance) was ranked as the lowest priority as it was seen as the least
costly operation and easiest if well-coordinated (Appendix 3). The labour-intensive cut-stump
approach (used by WfW) will work best for eradication zones and provides the much needed
employment. However, a combination of approaches will be needed if containment and asset
protection management is to work (Figure 7.3). It is also recommended that progress with
management in each municipality should be reviewed every year. These reviews should be
based on the indicators mentioned in the second half of Table 7.1 (changes in population
density, cost, etc.). Additionally, each province or municipality should spatially differentiate
management zones at finer scales using individual farms or catchments to facilitate effective
management and to provide the means for more effective funding allocation (Table 7.1).
Stellenbosch University https://scholar.sun.ac.za
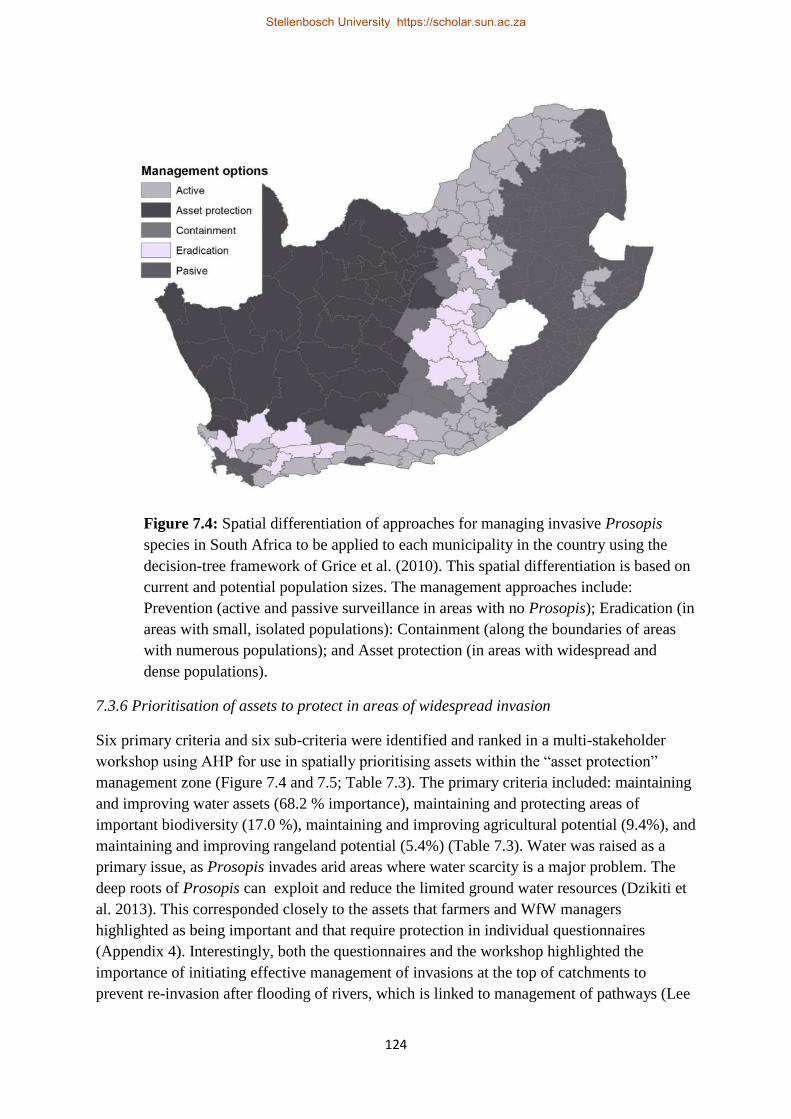
124
Figure 7.4: Spatial differentiation of approaches for managing invasive Prosopis
species in South Africa to be applied to each municipality in the country using the
decision-tree framework of Grice et al. (2010). This spatial differentiation is based on
current and potential population sizes. The management approaches include:
Prevention (active and passive surveillance in areas with no Prosopis); Eradication (in
areas with small, isolated populations): Containment (along the boundaries of areas
with numerous populations); and Asset protection (in areas with widespread and
dense populations).
7.3.6 Prioritisation of assets to protect in areas of widespread invasion
Six primary criteria and six sub-criteria were identified and ranked in a multi-stakeholder
workshop using AHP for use in spatially prioritising assets within the “asset protection”
management zone (Figure 7.4 and 7.5; Table 7.3). The primary criteria included: maintaining
and improving water assets (68.2 % importance), maintaining and protecting areas of
important biodiversity (17.0 %), maintaining and improving agricultural potential (9.4%), and
maintaining and improving rangeland potential (5.4%) (Table 7.3). Water was raised as a
primary issue, as Prosopis invades arid areas where water scarcity is a major problem. The
deep roots of Prosopis can exploit and reduce the limited ground water resources (Dzikiti et
al. 2013). This corresponded closely to the assets that farmers and WfW managers
highlighted as being important and that require protection in individual questionnaires
(Appendix 4). Interestingly, both the questionnaires and the workshop highlighted the
importance of initiating effective management of invasions at the top of catchments to
prevent re-invasion after flooding of rivers, which is linked to management of pathways (Lee
Stellenbosch University https://scholar.sun.ac.za
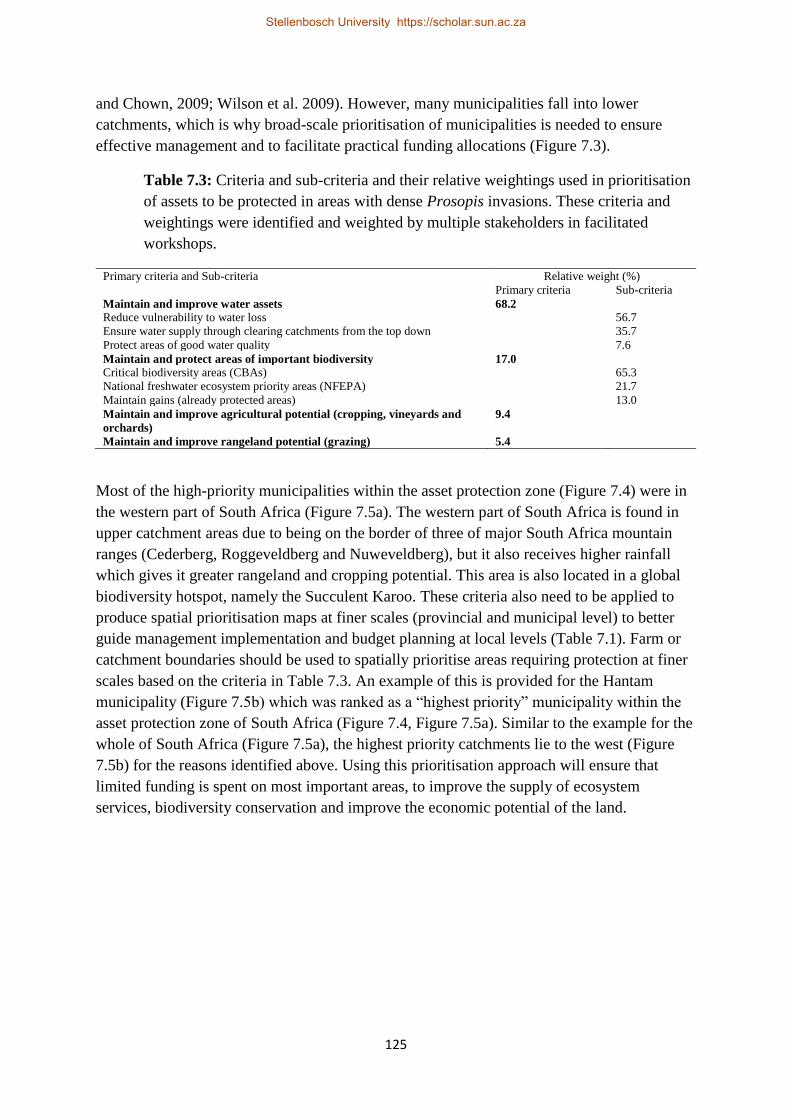
125
and Chown, 2009; Wilson et al. 2009). However, many municipalities fall into lower
catchments, which is why broad-scale prioritisation of municipalities is needed to ensure
effective management and to facilitate practical funding allocations (Figure 7.3).
Table 7.3: Criteria and sub-criteria and their relative weightings used in prioritisation
of assets to be protected in areas with dense Prosopis invasions. These criteria and
weightings were identified and weighted by multiple stakeholders in facilitated
workshops.
Primary criteria and Sub-criteria Relative weight (%)
Primary criteria Sub-criteria
Maintain and improve water assets 68.2
Reduce vulnerability to water loss 56.7
Ensure water supply through clearing catchments from the top down 35.7
Protect areas of good water quality 7.6
Maintain and protect areas of important biodiversity 17.0
Critical biodiversity areas (CBAs) 65.3
National freshwater ecosystem priority areas (NFEPA) 21.7
Maintain gains (already protected areas) 13.0
Maintain and improve agricultural potential (cropping, vineyards and
orchards)
9.4
Maintain and improve rangeland potential (grazing) 5.4
Most of the high-priority municipalities within the asset protection zone (Figure 7.4) were in
the western part of South Africa (Figure 7.5a). The western part of South Africa is found in
upper catchment areas due to being on the border of three of major South Africa mountain
ranges (Cederberg, Roggeveldberg and Nuweveldberg), but it also receives higher rainfall
which gives it greater rangeland and cropping potential. This area is also located in a global
biodiversity hotspot, namely the Succulent Karoo. These criteria also need to be applied to
produce spatial prioritisation maps at finer scales (provincial and municipal level) to better
guide management implementation and budget planning at local levels (Table 7.1). Farm or
catchment boundaries should be used to spatially prioritise areas requiring protection at finer
scales based on the criteria in Table 7.3. An example of this is provided for the Hantam
municipality (Figure 7.5b) which was ranked as a “highest priority” municipality within the
asset protection zone of South Africa (Figure 7.4, Figure 7.5a). Similar to the example for the
whole of South Africa (Figure 7.5a), the highest priority catchments lie to the west (Figure
7.5b) for the reasons identified above. Using this prioritisation approach will ensure that
limited funding is spent on most important areas, to improve the supply of ecosystem
services, biodiversity conservation and improve the economic potential of the land.
Stellenbosch University https://scholar.sun.ac.za
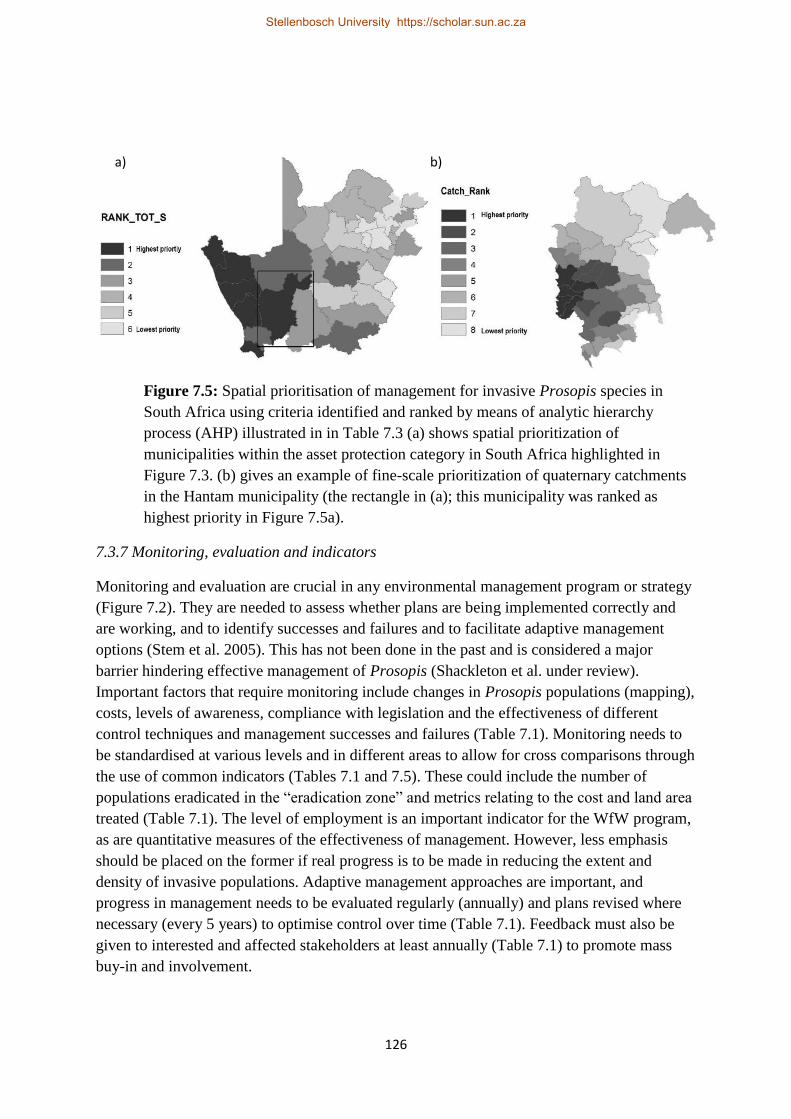
126
Figure 7.5: Spatial prioritisation of management for invasive Prosopis species in
South Africa using criteria identified and ranked by means of analytic hierarchy
process (AHP) illustrated in in Table 7.3 (a) shows spatial prioritization of
municipalities within the asset protection category in South Africa highlighted in
Figure 7.3. (b) gives an example of fine-scale prioritization of quaternary catchments
in the Hantam municipality (the rectangle in (a); this municipality was ranked as
highest priority in Figure 7.5a).
7.3.7 Monitoring, evaluation and indicators
Monitoring and evaluation are crucial in any environmental management program or strategy
(Figure 7.2). They are needed to assess whether plans are being implemented correctly and
are working, and to identify successes and failures and to facilitate adaptive management
options (Stem et al. 2005). This has not been done in the past and is considered a major
barrier hindering effective management of Prosopis (Shackleton et al. under review).
Important factors that require monitoring include changes in Prosopis populations (mapping),
costs, levels of awareness, compliance with legislation and the effectiveness of different
control techniques and management successes and failures (Table 7.1). Monitoring needs to
be standardised at various levels and in different areas to allow for cross comparisons through
the use of common indicators (Tables 7.1 and 7.5). These could include the number of
populations eradicated in the “eradication zone” and metrics relating to the cost and land area
treated (Table 7.1). The level of employment is an important indicator for the WfW program,
as are quantitative measures of the effectiveness of management. However, less emphasis
should be placed on the former if real progress is to be made in reducing the extent and
density of invasive populations. Adaptive management approaches are important, and
progress in management needs to be evaluated regularly (annually) and plans revised where
necessary (every 5 years) to optimise control over time (Table 7.1). Feedback must also be
given to interested and affected stakeholders at least annually (Table 7.1) to promote mass
buy-in and involvement.
a) b)
Stellenbosch University https://scholar.sun.ac.za
127
7.4 Conclusions
This study has explored and provided support for the aspects that need to be considered in
producing strategic and prioritisation plans for a widespread invasive tree genus in South
Africa for which control to date has been largely ineffective (van Wilgen et al. 2012a,b;
Shackleton et al. under review). The strategy for Prosopis produced here should help to
improve management success; and it is hoped that the approach followed in this paper will be
useful to guide the production of similar plans for other invasive species, as required in the
recent introduced NEM:BA regulations (DEA, 2014).
Current approaches are not effectively controlling populations, and are expensive (van
Wilgen et al. 2012b; Shackleton et al. under review). We therefore suggest key elements to
improve the management of Prosopis in South Africa outlined in the strategy. This includes
the more effective use of an integrated managed approach to reduce the spread and impacts of
Prosopis invasions (Table 7.1; Figure 7.2). Key elements of such an approach include the
implementation of more damaging biological control (Zachariades et al. 2011; van Klinken,
2012) as well as research on the feasibility of mass-scale utilisation as a control approach.
Spatial differentiation (Grice et al. 2010), involving the splitting South Africa into smaller
management units, is crucial for planning and implementing management and needs to be
done at finer scales. Additionally, important assets that need to be prioritised for control were
identified, ranked and spatially prioritised, to further aid budget allocations and focus control
operations in key areas to maximise the benefits of control. This also needs to be applied at
finer scales as part of the strategy. Improving compliance and participation of private land
owners is vital for effective management. Employing coordinators and setting up a research
and monitoring program are also key to improve, review and adapt the management of
Prosopis. Implementation of this strategic plan should greatly improve the control success of
this problematic invasive tree within South Africa in the future, and reduce negative effects
and raise benefits.
7.5 Acknowledgements
We thank all the participants that were involved in the study for their time and insights.
Funding was provided by the DST-NRF Centre of Excellence for Invasion Biology and the
Working for Water Programme through their collaborative research project on “Integrated
Management of invasive alien species in South Africa” and the National Research
Foundation (grant 85417 to DMR).
Stellenbosch University https://scholar.sun.ac.za
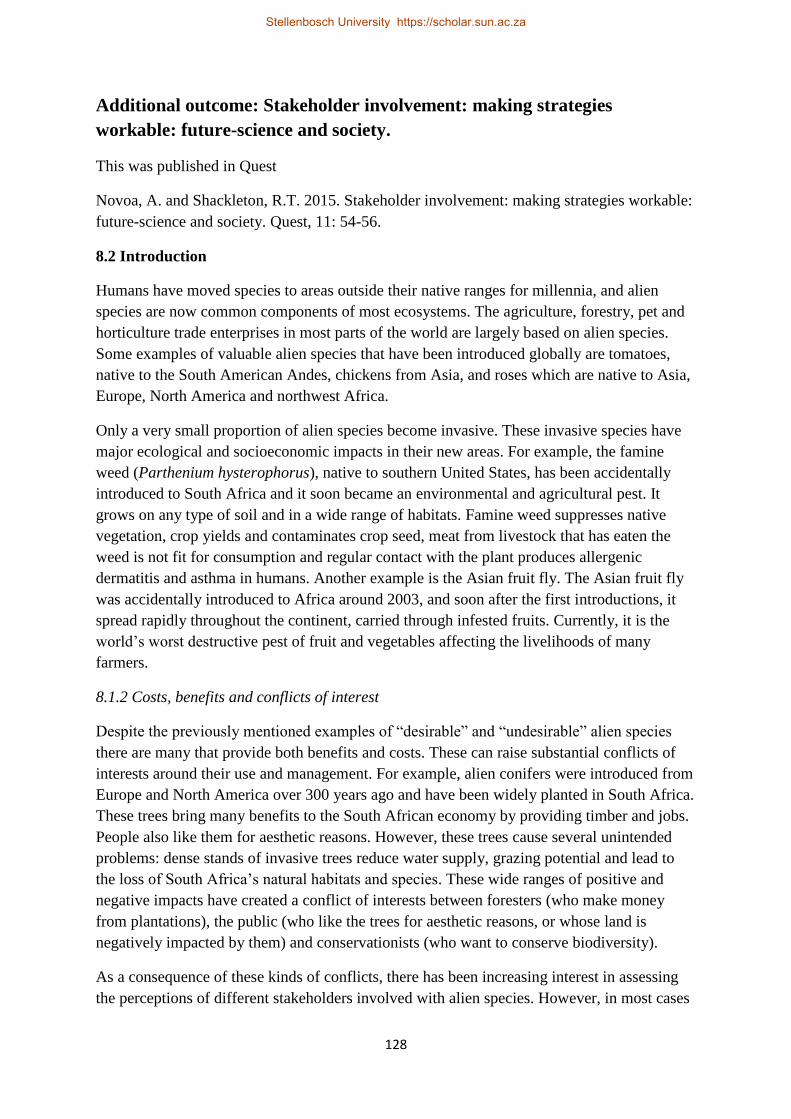
128
Additional outcome: Stakeholder involvement: making strategies
workable: future-science and society.
This was published in Quest
Novoa, A. and Shackleton, R.T. 2015. Stakeholder involvement: making strategies workable:
future-science and society. Quest, 11: 54-56.
8.2 Introduction
Humans have moved species to areas outside their native ranges for millennia, and alien
species are now common components of most ecosystems. The agriculture, forestry, pet and
horticulture trade enterprises in most parts of the world are largely based on alien species.
Some examples of valuable alien species that have been introduced globally are tomatoes,
native to the South American Andes, chickens from Asia, and roses which are native to Asia,
Europe, North America and northwest Africa.
Only a very small proportion of alien species become invasive. These invasive species have
major ecological and socioeconomic impacts in their new areas. For example, the famine
weed (Parthenium hysterophorus), native to southern United States, has been accidentally
introduced to South Africa and it soon became an environmental and agricultural pest. It
grows on any type of soil and in a wide range of habitats. Famine weed suppresses native
vegetation, crop yields and contaminates crop seed, meat from livestock that has eaten the
weed is not fit for consumption and regular contact with the plant produces allergenic
dermatitis and asthma in humans. Another example is the Asian fruit fly. The Asian fruit fly
was accidentally introduced to Africa around 2003, and soon after the first introductions, it
spread rapidly throughout the continent, carried through infested fruits. Currently, it is the
world’s worst destructive pest of fruit and vegetables affecting the livelihoods of many
farmers.
8.1.2 Costs, benefits and conflicts of interest
Despite the previously mentioned examples of “desirable” and “undesirable” alien species
there are many that provide both benefits and costs. These can raise substantial conflicts of
interests around their use and management. For example, alien conifers were introduced from
Europe and North America over 300 years ago and have been widely planted in South Africa.
These trees bring many benefits to the South African economy by providing timber and jobs.
People also like them for aesthetic reasons. However, these trees cause several unintended
problems: dense stands of invasive trees reduce water supply, grazing potential and lead to
the loss of South Africa’s natural habitats and species. These wide ranges of positive and
negative impacts have created a conflict of interests between foresters (who make money
from plantations), the public (who like the trees for aesthetic reasons, or whose land is
negatively impacted by them) and conservationists (who want to conserve biodiversity).
As a consequence of these kinds of conflicts, there has been increasing interest in assessing
the perceptions of different stakeholders involved with alien species. However, in most cases
Stellenbosch University https://scholar.sun.ac.za

129
there is still a lack of collaboration between different parties, such as scientific researchers,
the commercial sector (e.g. nurseries, pet shops, landscapers, and farmers), invasive species
managers, policy makers and the public. This can result in the failure to develop and
implement sustainable management strategies for invasive species.
Figure 8.1: American Giant one of the spineless cultivars of Opuntia ficus-indica
(cactus pear). Image A. Novoa
In this article we explore approaches for facilitating interactions between stakeholders
involved with alien species. We use the family Cactaceae (“cacti”) and the genus Prosopis
(“mesquite”) in South Africa as cases to find solutions for this problem.
Figure 8.2: Open discussion between stakeholders who benefit from cactus species in
South Africa and stakeholders who want to reduce their negative impacts. Image A.
Novoa
Stellenbosch University https://scholar.sun.ac.za

130
8.2 Cacti
8.2.1 The problem
Cactaceae is a family of 1919 plant species that are almost all native to the Americas. The
first alien cactus species arrived in South Africa early in the 18th century. Over the following
two centuries many species were introduced to produce fruit for human consumption and
fodder for livestock and are still being used for this today. Over the last 60 years, hundreds of
new species were introduced to South Africa, almost exclusively for ornamental purposes.
Food-science researchers (specializing in a wide range of crops) are also looking to develop
the agro-industry around cactus in South Africa: fruit can be processed into jams,
marmalades, juices, syrups and cladodes (the fleshy leaf-like structures) can be consumed as
vegetables, pickles and flour.
However, many of the introduced species have become naturalized and 35 cactus species are
currently listed by the government as invasive in South Africa. The negative impacts of
invasive cacti on South African biodiversity, ecosystem functioning, resource availability,
national economy and human health have been recognized for well over a century. These
benefits and costs have resulted in numerous conflicts.
8.2.2 The solution
To address the conflicts of interests surrounding cacti in South Africa, we identified relevant
stakeholders (nursery owners, farmers, land managers, scientists) and assessed their
perceptions through questionnaires. We found that those stakeholders who were positively
affected by cactus species were not aware of some of the negative environmental and socio-
economic impacts of cactus invasions, while those stakeholders who wanted to reduce the
negative impacts of cactus species in South Africa were not fully aware of their positive
impacts.
We then tried to enhance the interaction between stakeholder’s groups through open
dialogues and discussions in a one-day workshop organized by the Centre for Invasion
Biology. Surprisingly, one session of interaction and dialogue between stakeholders was
enough to increase their “cactus knowledge” and improve the willingness of all stakeholders
to collaborate on cactus management actions.
After this first interaction, we arranged open discussions to help in identifying key barriers
for cactus management in South Africa. Some of the identified barriers (e.g. “Lack of funding
“or “Lack of prioritization of control efforts”) are common to all invasive species
management. However, other barriers came from particular parties’ interest, such as “some
invaded areas are not easy to access” identified by managers from South African National
Park (SANParks). It was only by involving all parties in the workshop that we could identify
all the barriers to successful management. These discussions also allowed us to openly
discuss potential solutions for each barrier and develop regulations to guide the management
of harmful invasive cacti. As a result, management objectives were broadly supported by all
stakeholders.
Stellenbosch University https://scholar.sun.ac.za

131
Cactus pear vs. prickly pear
Figure 8.3: The fruit of the prickly pear. Image Wikimedia Commons
The Prickly pear (Opuntia ficus-indica) was introduced from Mexico to South Africa early in
the 18th century. Since then, many stakeholders benefited from the species: households sell
prickly pear jam in local markets, traditional medicines are used both domestically and sold,
fruits are a source of income and nutrition for many local communities, and it is used as an
important agro-forestry species for fruit consumption and animal fodder. However in the 1980s
Prickly pear become invasive, displacing native vegetation and crops, negatively affecting
livestock and humans (injured by its spines), and creating a conflict of interests between
positively affected stakeholders and those stakeholders who wanted to reduce its negative
impacts. This conflict of interests was soon addressed, thanks to the existence of a non-invasive
alternative: the Cactus pear. In the 20th century, an American nursery owner (Luther Burbank)
developed spineless cultivars of Opuntia ficus-indica. Due to their lack of spines, these
cultivars (known as Cactus pear) are not invasive. Therefore, stakeholders positively affected
by the prickly pear, could use a non-invasive alternative, the cactus pear. Nowadays, cactus
pear is being widely used in South Africa and all over the world as an important agro-industrial
crop. However, more awareness and transfer of knowledge is needed to stop the use of spiny
Opuntia species in South Africa.
Stellenbosch University https://scholar.sun.ac.za

132
8.3 Mesquite
8.3.1 The problem
Prosopis species (mesquite) were introduced to South Africa from the Americas to provide
fire wood, fodder and shade to farmers and communities in arid parts of the country. These
trees still provides these benefits, but with time and increased invasion in the mid-1900s,
numerous negative impacts on humans and the environment were observed. These include:
reduced water supply and impacts to natural grazing lands, loss of biodiversity, decreased
property values, and breakage of infrastructure due to strong roots. The wide range of
positive and negative effects of mesquite stands had led to conflicts of interest between those
who want to use and promote the usefulness of mesquite trees (e.g. some farmers and NGOs)
and those who want to reduce the negative impacts of mesquite (some farmers and
conservation managers). But before alternative management approaches can be adopted
(biological control) it was important to get a better understanding of stakeholder perceptions,
wants and needs.
Figure 8.4: Dense stands of Prosopis species (mesquite) fringe water courses in many
parts of the arid interior of South Africa. Image R. Shackleton
8.3.2 The solution
As explained in the previous example, we assessed the perceptions of stakeholders to get a
better understanding of the issues regarding mesquite in South Africa. We found that some
stakeholder groups use and benefit from mesquite (farmers use the trees to provide fodder
while poor communities harvest trees for fuel wood). However, other groups are
predominantly negatively impacted by it (e.g. urban dwellers). People from urban areas
(suffering impacts on their infrastructure and aesthetics) face different impacts as a result of
mesquite invasions to people in rural areas (who experience loss of land). We also found that
for all stakeholders the costs of mesquite were greater than the benefits, warranting the need
for improved management.
Stellenbosch University https://scholar.sun.ac.za
133
Through workshops with different stakeholders, we are getting a better understanding of the
factors that prevent effective management of mesquite. This work has highlighted that
different groups are facing different problems and have different perspectives on what is
needed relating to manage mesquite. For example, Working for Water Programme managers
highlighted high expenses and the fact that government departments are not working together
as the biggest barriers to effective management, whereas researchers suggested that
contrasting interests, lack of knowledge and poor prioritisation are the major issues.
Figure 8.5: A survey was done across the invasive range of mesquite in South Africa
to determine the perceptions of stakeholders regarding the benefits and costs
associated with the species. Image R. Shackleton
8.4 What did we learn from Prosopis and Cactaceae?
Invasive species are a major driver of global change, affecting numerous groups of people in
positive and negative ways. This situation can make understanding the roles of invasions
difficult for society. Moreover, it can complicate the choice and/or application different
policy decisions and management options.
The case studies described above (and others) have shown that we need to consult all
interested parties to understand all dimensions of the problem, to identify misconceptions and
gaps in knowledge, to understand how this knowledge can be transferred to the population, to
solve conflicts of interests around alien species, and to build consensus and integrate different
perspectives to arrive at sustainable strategies for managing invasive species.
Stellenbosch University https://scholar.sun.ac.za
134
Thesis conclusion
This thesis had multiple aims, with its end-goal being to provide, through the application of a
novel combination of ecological and sociological studies, key information required for the
formulation of an objective strategy to guide the management of Prosopis in South Africa.
The thesis was conducted in transdisciplinary manner, and the chapters apply a range of
economic, ecological and sociological approaches involving multiple stakeholders, to gain a
holistic understanding of the role of Prosopis in social-ecological systems and to identify
fundamental requirements for the effective management of this major invasive species that
has negative impacts but also provides clear benefits.
The chapters of the thesis contribute much new information on many aspects of the emerging
problem of tree invasions, and in particular the role of Prosopis invasions in South Africa.
Most of the chapters build on existing literature, but the thesis charts a new course for
understanding the role of tree invasions and how they affect people and the environment.
Despite the advances made through this work, much remains to be done to improve our
knowledge and control of invasive species, especially regarding the management of those that
are beneficial in some ways, and harmful in others.
Prosopis has become extremely widespread globally, and several species and their hybrids
have naturalised or become invasive in more than 100 countries, where they lead to
substantial negative impacts on people and the environment. Insights from the global review
in Chapter 1 helped to conceptualize the complex interplay of factors that determine
responses to invasions by “conflict” invaders such as Prosopis species. They provides
insights into what drives interventions (or the lack of interventions) in different socio-
political contexts. One of the main messages is that the level of available knowledge about
the distributions, ecology and impacts of the invader influences the level of management
intervention. This suggests that understanding the role of invasions is crucial to justify,
promote and guide management initiatives. It was also found that national GDP was a good
indicator of the management approach that would be adopted. Countries with low GDP were
more likely to use “utilisation” approaches to manage Prosopis whereas countries with high
GDP primarily applied chemical and mechanical control, with intermediate-GDP countries
most often applying a variety of control techniques. This knowledge also helps to guide the
strategic management planning of for countries based on their situations.
The next chapters (Chapters 2 and 3) delved into the large-scale ecological processes and the
impacts of Prosopis across South Africa. This information helped to inform the management
of Prosopis in South Africa from an ecological standpoint, and knowledge of widespread
impacts (particularly the impacts of Prosopis on native plant biodiversity) was needed to
improve the management. First of all, it identified that Prosopis is having impacts, therefore
justifying the need for management on an ecological bases, and also identified some key
species that are at threat that need to be protected (e.g. Acacia erioloba). This work was novel
in that it applied techniques commonly used to assess population trends in rare and threatened
plants (Botha et al., 2004; Venter and Witkowski, 2010; Cousins et al., 2014) but which have
not yet been used in invasion science (analysis of size-class distributions using Quotients and
Stellenbosch University https://scholar.sun.ac.za

135
the Permutation Index to assess Prosopis and native tree population trends and stability).
These methods were applied to gain better understanding of the ecology of Prosopis and the
mechanisms that drive its negative impacts on native populations (including decreased native
tree recruitment, and increased juvenile and adult native tree mortality through competition
for limited resources).The impact that Prosopis has on native tree recruitment and mortality is
serious and threatens to cause marked declines in populations of Acacia erioloba, a protected
indigenous tree that also provides important natural resources. Prosopis also reduces native
grass and herbaceous species that are important for grazing. This, therefore, helps to highlight
the need to manage Prosopis to protect our native biodiversity and the important ecosystem
services and natural resources provided by plant native species.
Chapters 4 and 5 applied sociological approaches to further elucidate the perceived and real
impacts of Prosopis invasions on humans and the environment within South Africa. The use
of social approaches and stakeholder engagement when investigating invasive species is still
in its infancy, but recognition of the importance of understanding the “human dimensions of
invasions” is growing rapidly - in particular for species that generate conflict (Shackleton et
al. 2007; García-Llorente et al. 2008 and 2011; Kull et al. 2011). These studies helped to
elucidate the perceptions and practices of different stakeholders living or working in areas
with Prosopis invasions. Results showed that the net value of costs and benefits of Prosopis
were negative for all stakeholder groups. This provides much-needed justification for
management of Prosopis – until now the view that mesquite has substantial benefits has
prevented the adoption of a clear policy on its management (Wise et al. 2013). Findings of
this work also revealed that many private land owners are actively trying to control the spread
of invasive Prosopis. Also, engaging different stakeholders helped to identify underlying
factors that influence the awareness and perceptions of invasive species, the primary one
being people’s orientation towards the land (e.g. living in rural versus urban settings). In
addition, unique negative impacts, such as the damage caused by the roots of Prosopis to
infrastructure such as house foundations, walls and water pipes were also raised through
including urban stakeholders groups in the study, where previously the focus has only been
on rural communities. Chapter 5 applied the non-timber forest product (NFTP) valuation
method, but added to the theory, by including a comparative study on the use of invasive
Prosopis and native tree substitutes. This facilitated the calculation of the relative value of
Prosopis compared to native trees (substitutes for Prosopis) for households in South Africa.
This case study provided further evidence for the need to improve management, as the
relative use of Prosopis was lower than that of native trees which are utilised more and
preferred by local communities. This suggests that despite Prosopis being readily available,
people still prefer natives, so retaining Prosopis will not take much pressure of the use of
native species. This is important especially in light of the findings in Chapter 2 and 3 which
demonstrated that Prosopis invasions are displacing native trees which provide more valuable
resources for local communities. It was also found that reliance on Prosopis is declining
rapidly, which provides objective justification for allocating resources to improved
management of Prosopis to safeguard the supply of ecosystem services.
The above case studies provided ecological and social evidence of the need to control
Prosopis due to negative impacts for people and the environment along with other
Stellenbosch University https://scholar.sun.ac.za

136
publications highlighted in the review chapter (e.g. Ndhlovu et al. 2011; Dzikiti et al. 2013).
A key contribution of this work was to involve the full spectrum of stakeholders in
systematically identifying the dimensions of barriers that are hindering current control and
potential adaptation responses. The systematic elucidation barriers to adaption and
management is common in medical and psychological research, and has been applied
recently in the climate-change literature (Spires et al. 2014), but remains to be widely used in
the biological conservation and natural resource management domains. This work resulted in
the identification of more than 100 unique barriers and important adaption responses that are
needed to improve the management of Prosopis. This study was also interesting in that it
showed that different groups perceived different factors to be hindering management, with
stark contrasts existing between the views of farmers and Working for Water managers.
Farmers identified the lack of strategic planning, prioritisation and quality control, but not as
a major barrier, and managers raised, in particular, that lack of partnerships and cooperation
between different stakeholders – notably farmers - to be a major barrier. One of the key
messages of this study is that stakeholder interaction in matters relating to Prosopis as an
environmental issue is inadequate and that urgent attention needs to be given to facilitating
improved interactions to pave the way for more effective and transparent management of
Prosopis. In addition, the need for better strategic planning and spatial prioritisation was
identified as important to improve management effectiveness and efficiency, which is
addressed in the final chapter of this thesis.
All of the above case studies (which provide, for the first time, a holistic picture of Prosopis
invasions in South Africa) which, together with other publications on Prosopis in South
Africa (in particular, Van den Burg 2010; Ndhlovu et al. 2010; Wise et al. 2012; Dzikiti et al.
2013), were used to develop a strategy to guide the management of Prosopis in South Africa.
Chapter 7 partly fulfils a key requirement of the regulations published under NEM:BA, Act
of 2004 (DEA, 2014) which stipulates that species with substantial negative impacts need
national management strategies and management programmes). The strategy for Prosopis is
one of the first to be produced.
Using a social-ecological study process this thesis has provided a case study example of what
is needed to understand and develop national strategies for the management of biological
invasions (Figure 7.2). This process can be used as a model system for understanding and
managing other widespread, conflict-of-interest invasive trees, for example species in the
genera Acacia, Eucalyptus and Pinus (van Wilgen and Richardson, 2014). The approach used
in this thesis was useful to get a holistic understanding of the issues pertaining to widespread
tree invasions; key to the success of the approach was the engagement of different
stakeholder groups. This helped to understand the trade-offs between the costs and benefits
that must be achieved to reach practical management solutions. It is recommended that this
process could be profitably applied for other invasive trees in South Africa. However, many
invasive species, particularly those introduced accidently, have mainly costs and very few
benefits (e.g. Parthenium hysterophorus). Applying the rigorous process followed in this
thesis would be unnecessary for such species, and some steps of the process (Figure 7.2)
could be left out.
Stellenbosch University https://scholar.sun.ac.za

137
There are still large gaps in our knowledge of Prosopis and invasive species management in
general in South Africa and internationally, and better understanding of these gaps could
improve the management of Prosopis. Some key issues that require further research are listed
below.
Globally and within South Africa there are still major issues relating to the taxonomy
of the genus. This relates to misidentification and incorrect labelling of initial
introductions as well as widespread hybridisation between numerous introduced
species (Pasiecznik et al. 2004; Mazibuko, 2013). Improving identification will be
important for finding effective biological control agents, and this requires further
research. Linked to this, the role of hybridisation of Prosopis in mediating
invasiveness needs to be further examined.
Research and testing of further biological control agents is needed. There is evidence
that the costs of Prosopis outweigh the benefits, and that the costs will continue to
increase as invasions spread (Chapter 4 and 5; Wise et al. 2013). The costs of
mechanical and chemical of control within South Africa are high, and Prosopis is
spreading faster than the capacity available to contain it (van Wilgen et al. 2012). If
more effective biological control agents can be found, the benefits of Prosopis could
rise and the cost will be reduced through decreased densities of invasion (Zachariades
et al. 2011). There is growing support for the positive role of biological control in
Australia, and South Africa needs to learn from this experience (van Klinken, 2012).
The role of control through utilisation needs to be researched further. There are case
studies of small-scale utilisation projects (making Prosopis flour in Kenya) which are
touted as successful, but these have probably had very little, if any, effect on reducing
Prosopis densities and rates of spread (Choge et al. 2006). The knowledge of role of
intensive national or international-scale utilisation projects as a control method is
lacking, and this approach may be successful, although it is still highly controversial
(van Wilgen et al. 2012). Large scale and intensive utilisation could be a useful
management approach in that it reduces rates of spread and densities and thus
impacts, at the same time providing employment and local economic development.
However, utilisation could create dependency on problematic species and benefit
some stakeholders at the cost of others. It could potentially encourage the spread of
invasive species to new areas once people perceive it to have economic potential thus
spreading negative impacts to new areas as well (van Wilgen et al. 2012). However,
provided that invasions could be contained and all their impacts were confined to their
immediate environment, then consideration could be given to sustainable utilisation.
Identifying ways of reducing conflicts of interest and building cohesion between
stakeholders with regards to the management of invasive species that induce both
benefits and costs is an urgent priority. Addressing this could aid in developing more
efficient management strategies in the future. This problem deserves a thorough,
participative, scientific assessment - as done when the South African government
Stellenbosch University https://scholar.sun.ac.za

138
decided to develop a widely accepted policy for managing elephants (Scholes and
Mennel, 2008). Such assessments are the product of processes that translate existing
scientific information into a form usable by policy makers. Assessments of conflicts
of interest have three critical success factors: (1) legitimacy (the stakeholders have to
accept that the process is well founded), (2) saliency (it must be relevant to an
expressed need), and (3) credibility (it must be conducted in a transdisciplinary and
transparent manner, to the highest standards) (Cash et al. 2002; Scholes and Mennel,
2008). Assessments are characterised by an extensive, transparent review process by
both experts and stakeholders. An assessment requires the authors to provide their
own expert judgements when the data are sparse or equivocal (as long as these
judgements are clearly identified as opinions), but puts checks and balances in place
to ensure that all reasonable viewpoints are fairly reflected. Assessments include an
explicit evaluation of the uncertainties on key issues, either quantitatively in terms of
probability ranges (e.g. ‘near certain’ is >95% confidence of being true), or
qualitatively (such as ‘established’, ‘established but incomplete’, ‘competing
explanations’ or ‘speculative’).
Stellenbosch University https://scholar.sun.ac.za
139
References
Adger, W.N., Dessai, S., Goulden, M., Hulme, M., Nelson, D.R., Naess, L.O., Wolf, J. and
Wreford, A. 2009. Are there social limits to adaptation to climate change? Climatic Change,
93: 335-354.
Agrawal, A. 2008. The role of local institutions in adaptation to climate change, Washington
DC: World Bank.
Al-shurai, A. and Labrada, R. 2006. Problems posed by Prosopis in Yemen. In: FAO, eds.
Problems posed by the introduction of Prosopis in selected countries. Rome, Italy: FAO.
Arizona Game and Fisheries Department, 2011. State of Arizona aquatic invasive species
management plan. Arizona Game and Fisheries Department: Phoenix.
Angelstam, P. Anderson, K., Annerstedt, M., Axelsson, R., Elbkidze, M., Garrido, P., Grahn,
P., Ingemar Jönsson, K., Pedersen, S., Schlyter, P., Skärbäk, E., Smith, M and Stjernquist.
2013. Solving problems in social-ecological systems: Definition, practice and barriers of
transdisciplinary research. Ambio, 42: 254-265.
Antwi-Agyei, P., Dougill, A.J. and Stringer, L.C. 2013. Barriers to climate change adaptation
in sub-Saharan Africa: evidence from northeast Ghana and systematic literature review.
Centre for Climate Change Economics and Policy, Working Paper NO. 154. Sustainability
Research Institute Paper No. 52.
Archer, S. 1989. Have southern Texas savannas been converted to woodlands in recent
history? American Naturalist 134:545-561.
Archer, S. 1995. Tree-grass dynamics in a Prosopis-thornscrub savannah parkland:
Reconstructing the past and predicting the future. EcoScience 2: 83-99.
Australian Weeds Committee. 2012. Mesquite (Prosopis spp.) strategic plan 2012-17.
Canberra: Weeds of National Significance, Australian Governmental Department of
Agriculture, Fisheries and Forestry.
Ayanu, Y., Jentsch, A., Müller-Mahn, D., Rettberg, S., Romankiewicz, C. and Koellner, T.
2014. Ecosystem engineer unleashed: Prosopis juliflora threatening ecosystem services?
Regional Environmental Change DOI 10.1007/s10113-014-0616-x.
Babiker, A.G.T. 2006. Mesquite (Prosopis spp.) in Sudan: history, distribution and control.
In: FAO, eds. Problems posed by the introduction of Prosopis in selected countries. Rome,
Italy: FAO.
Bedunah, D. J. and Sosebee, R.E. 1986. Influence of mesquite control on soil erosion on a
depleted range site. Journal of Soil and Water Conservation 41:131-135.
Stellenbosch University https://scholar.sun.ac.za
140
Belton, T. 2008. Management Strategy for Mexican thorn (Prosopis juliflora) on Ascension
Island: An assessment of this species, and recommendations for management. Bedfordshire:
RSPB.
Binggeli, P. 2001. The human dimensions of invasive woody plants. In: McNeely JA, ed. The
great reshuffling: Human dimensions of invasive alien species. Gland and Cambridge: IUCN.
Bokrezion, H. 2008. The ecological and socio-economic role of Prosopis juliflora in Eritrea:
An analytical assessment within the context of rural development in the Horn of Africa. PhD
Thesis, Johannes Gutenberg University, Mainz.
Botha, J., Witkowski, E.F.T. and Shackleton, C.M. 2002. A comparison of anthropogenic and
elephant disturbance on Acacia xanthophloea (fever tree) populations in the Lowveld, South
Africa. Koedoe 45:9-18.
Botha, J. Witkowski, E.F.T. and Shackleton, C.M. 2004. Impact of communal harvesting of
Warburgia salutaris (‘pepper-bark tree’) in Mpumalanga, South Africa. Biodiversity and
Conservation 13:1675-1698.
Brown, J.R. and Archer, S. 1989. Woody plant invasion grassland: establishment of honey
mesquite (Prosopis glandulosa var. glandulosa) on sites differing in herbaceous biomass and
grazing history. Oecologia 80:19-26.
Bryson, J. 1988. Strategic planning for public and non-profit organisations. Jossey-Bass: San
Francisco.
Burkart, A. 1976. A monograph of the genus Prosopis (Leguminosae subfam. Mimosoideae).
Part 1 and 2). Catalogue of the recognised species of Prosopis. Journal of the Arnold
Arboretum 57:219-249;450-526.
Cach, D., Clark, W., Alcock, F., Dickson, N., Eckley, N and Jäger, J. 2002. Salience,
credibility, legitimacy and boundaries: Linking research, assessment and decision making.
John F. Kennedy School of Government, Harvard University: Faculty research Working
Paper Series. RWP02-045.
Centre for Sustainable Development Initiatives. 2009. Working paper on Prosopis: The case
for local-level initiatives in Prosopis management. Centre for Sustainable Development
Initiatives.
Chesson, P., Gebauer, L.E., Schwinning, S., Huntly, N., Wiegand, K., Ernest, M.S.K., Sher,
A., Novoplansky, A. and Weltzen, J.F. 2004. Resource pulses, species interactions and
diversity maintenance in arid and semi-arid environments. Oecologica 141:236-253.
Chikuni, M.F., Dudley, C.O., Sambo and E.Y. 2004. Prosopis glandulosa Torry
(Leguminosae-Mimosoidae) at Swang’oma, Lake Chilwa plain: A blessing in disguise.
Malawi Journal of Science and Technology 7:10-16.
Stellenbosch University https://scholar.sun.ac.za
141
Choge, S.K. Ngujiri, F.D., Kuria, M.N., Busaka, E.A. and Muthondeki J.K. 2002. The status
and impact of Prosopis spp. in Kenya. Nairobi: KEFRI.
Choge, S.K. and Chikami, B.N. 2004. Experiences of Prosopis utilization and management
from outside Kenya. Proceedings of the Workshop on Integrated Management of Prosopis
Species in Kenya. Nairobi, Kenya: KEFRI.
Choge, S.K., Harvey, M., Chesang, S. and Pasiecznik, N.M. 2006. Cooking with Prosopis
flour. Recipes tried and tested in Bango District, Kenya. Nairobi and Coventry: KEFRI and
HDRA.
Choge, S.K., Clement, N., Gitonga, M. and Okuye, J. 2012. Status report on
commercialization of Prosopis tree resources in Kenya, Technical report for the KEFRI/KFS
Technical Forest Management and Research Liaison Committee. Nairobi: KEFRI.
Clavero, M. and García-Berthou, E. 2005. Invasive Species are a leading cause of animal
extinctions. Trends in Ecology and Evolution, 20: 110.
Coetsee, J. 1993. Prosopis vervuil Karoo. Landbouweekblad, South Africa.
Coetzer, W. and Hoffmann, J.H. 1997. Establishment of Neltumius arizonensis (Coleoptera:
Burchidae) on Prosopis (Prosopis Species: Mimosaceae) in South Africa. Biological Control
10:187-192.
Cousins, S.R., Witkowski, E.T.F. and Pfab, MF. 2014. Elucidating patterns in the population
size structure and density of Aloe plicatilis, a tree aloe endemic to the Cape fynbos, South
Africa. South African Journal of Botany 90:20-36.
Csurhes S. ed. 1996. Mesquite (Prosopis spp) in Queensland. Australia: Department of
Natural Resources and Mines.
Cunningham, A.B. 2001. Applied Ethnobotany. Earthscan: London.
Dangles, O., Carpio, F.C., Villares, M. and Yumisaca F. 2010. Community-based
participatory research helps farmers and scientists to manage invasive pests in the Ecuadorian
Andes. Ambio 39:325-335.
Davenport, N.A. Shackleton, C.M. and Gambiza, J. 2012. The direct use value of municipal
commonage goods and services to urban households in the Eastern Cape, South Africa. Land
Use Policy 29:548-557.
Davis, M.A., Chew, M.K., Hobbs, R.J., Lugo, A.E., Ewell, J.J., Vermeij, G.J., Brown, J.H.
and Rosenzweig, M.L. 2011. Don’t judge species on their origins. Nature 474:135-154.
Daze, A., Ambrose, K. and Ehrhart, C. 2009. Climate vulnerability and capacity analysis.
Care International. Available at: http://www.careclimatechange.org/cvca/CARE_
CVCAHandbook.pdf.
Stellenbosch University https://scholar.sun.ac.za

142
de Neergaard, A., Saarnak, C., Hill, T., Khanyile, M., Berzosa, A.M, and Birch-Thomsen, T.
2005. Australian wattle species in the Drakensberg region of South Africa – and invasive
alien or a natural resource? Agricultural Systems 85:216-233.
de Oliveira, L.S.B., de Andrade, L.A. Fabricante, J.R. and Gonçalves, G.S. 2012. Structure of
a Prosopis juliflora (Sw.) DC. Population established in a temporary riverbed in the
Microregion of Cariri in the State of Paraiba. Estrutura de uma populaçãde Prosopis juliflora
(SW.) DC. Estabelecida no leito de um rio temporário na Microrregião do Cariri Paraibano.
Semina Ciências Agrárias. Londrina 33:1769-1778.
de Souza Nascimento, C.E., Tabarelli, M., da Silva C.A.D., Leal I.R., de Souza Tavares, W.,
Serrãno, JE. And Zanuncio, JC. 2014. The introduced tree Prosopis juliflora is a serious
threat to native species of the Brazilian Caatinga vegetation. Science of the Total
Environment 481:108-113.
de Wit, M.P., Crookes, D.J. and van Wilgen, B.W. 2001. Conflicts of interest in
environmental management: estimating the costs and benefits of a tree invasion. Biological
invasions 3:167-178.
Dean, W.R.J., Anderson, M.D., Milton, S.J. and Anderson, T.A. 2002. Avian assemblages in
native Acacia and alien Prosopis drainage line woodland in the Kalahari, South Africa.
Journal of Arid Environments 51:1-19.
DeLoach, C.J. 1984. Conflicts of interest over beneficial and undesirable aspects of Prosopis
(Prosopis spp.) in the United States as related to biological control. Vancouver, Canada: 6th
International Symposium on Biological Control, 19–25 August 1984, pp. 301–340.
Delobel, A. and Fediere, G. 2002. First report in Egypt of two seed-beetles (Coleoptera:
Burchidae) noxious to Prosopis spp. Bulletin of the Faculty of Agriculture, Cairo University
53:129-140.
Dent, M.C., Lynch, S.D. and Schulze, R.E. 1989. Mapping mean annual and other rainfall
statistics over Southern Africa. Water Research Commission, Pretoria. WRC Report
109/1/89.
Department of Environmental Affairs. 2014. National environmental management:
Biodiversity act 2004 (Act no. 10 of 2004): Alien and invasive species lists, 2014.
Department of Environmental Affairs: Pretoria.
Dickie, I. A., Bennett, B. M., Burrows, L.E., Nuñez, M. A., Peltzer, D. A., Porté, A.,
Richardson, D.M., Rejmánek, M, M., Rundel, P.W. and van Wilgen, B.W. 2014. Conflicting
values: ecosystem services and invasive tree management. Biological Invasions 16:705-719.
Djoudi, H., Brockhaus, M. and Locatelli, B. 2011. Once there was a lake: vulnerability to
environmental changes in northern Mali. Regional Environmental Change DOI
10.1007/s10113-011-0262-5.
Stellenbosch University https://scholar.sun.ac.za
143
Dos Santos, L.L., Do Nascimento, F.A.L.B.,. Vieira, J., Da Silva, V.A., Voeks, R. and
Albuquerque, U.P. 2014. The cultural value of invasive species: A case study from semi-arid
northeastern Brazil. Economic Botany 68:283-300.
Downey, P.O. 2010. Managing widespread, alien plant species to ensure biodiversity conservation: A
case study using an 11-step planning process. Invasive Plant Science and Management 3: 451-461.
Downey, P.O., Scanlon, T.J. and Hosking, J.R. 2010. Prioritizing weed species based on their threat
and ability to impact on biodiversity: a case study from New South Wales. Plant Protection Quarterly
25: 111-126.
Downey, P.O. 2011. Changing of the guard: moving from a war on weeds to an outcome-orientated
weed management system. Plant Protection Quarterly 26: 86-91.
Dudley, B.D., Hughes, R.F. and Ostertag, R. 2014. Groundwater availability mediates the
ecosystem effects of an invasion of Prosopis pallida. Ecological Applications (in press)
http://dx.doi.org/10.1890/13-1262.1
Dussart, E., Lerner, P. and Peinetti, R. 1988. Long-term dynamics of 2 populations of
Prosopis caldenia Burkart. Journal of Rangeland Management 51:985-991.
Dzikiti, S., Schachtschneider, K., Naiken, V., Gush, M., Moses, G. and Le Maitre, D.C. 2013.
Water relations and the effects of clearing invasive Prosopis trees on groundwater in an arid
environment in the Northern Cape, South Africa. Journal of Arid Environments 90:103-113.
Eiswerth, M.E., Yen, S.T. and van Kooten, G.C. 2011. Factors determining awareness and
knowledge of aquatic invasive species. Ecological Economics 70:1672-1679.
Elfadl, M.A. and Luukkanen, O. 2006. Field studies on ecological strategies of Prosopis
juliflora in a dry land ecosystem. Journal of Arid Environments 66:1-15.
El-Keblawy, A. and Abdelfatah, M.A. 2014. Impacts of native and invasive exotic Prosopis
congeners on soil properties and associated flora in the arid United Arab Emirates. Journal of
Arid Environments 100:1-8.
El-Keblawy, A. and Al-Rawai, A. 2007. Impacts of the invasive exotic Prosopis juliflora
(Sw.) D.C. on the native flora and soils of the UAE. Plant Ecology 190:23-35.
Elsidig, N.A., Abdelsalam, A.H. and Abdelmagid, T.D. 1998. Socio-economic,
environmental and management aspects of mesquite in Kassala State (Sudan). Sudan:
Sudanese Social Forestry Society.
European Union. 2014. Regulation (EU) No 1143/2014 of the European Parliament and the
Council of the 22 October 2014: On the prevention and management of the introduction and
spread of invasive species. Official Journal of the European Union.
FAO. 2006. Problems posed by the introduction of Prosopis spp. in selected countries. Rome:
Plant Production and Protection Division, Food and Agricultural Organization of the United
Nations.
Stellenbosch University https://scholar.sun.ac.za

144
Felker, P. 1979. Mesquite: an all-purpose leguminous arid land tree. In: Eitchie GA, ed. New
agricultural crops, American Association for the Advancement of Science Symposium
Proceedings (vol. 38). Boulder: Westview Press.
Felker, P. 2002. Ethiopia-national plan for Prosopis. FAO.
Flores, G and Vega, L.R. 1998. Barriers to health care access for Latino children: A review.
Family Medicine, 30: 196-205.
Forsyth, G.G., Le Maitre, D.C. O’Farrell, P.J. and van Wilgen, B.W. 2012. The prioritization
of invasive alien plant control projects using multi-criteria decision model informed by
stakeholder impute and special data. Journal of Environmental Management 103:51-57.
Foster, J. and Sandberg, L.A. 2004. Friends or foe? Invasive species and public green space
in Toronto. Geographical Review 94:178-198.
Gaertner, M., Den Breeÿen, A., Hui, C. and Richardson D.M. 2009. Impacts of alien plant
invasions on species richness in Mediterranean-type ecosystems: a meta-analysis. Progress in
Physical Geography 33:319–338.
Gelland, W.F., Grenad, J.L. and Marcum, Z.A. 2011. A systematic review of barriers to
medication adherence in the elderly: looking beyond cost and regimen complexity. American
Journal Geriatric Pharmacotherapy 9; 11-23.
Gamtoos Water. 2013. Expression of Interest: Calling all farmers/land users interested in
government-assistance with alien invasive clearing in St. Francis Bay and surrounding areas.
http://www.gamtooswater.co.za/eoi/eoi_4_2013.pdf.
García-Llorente, M., Martín-López, B., González J.A., Alcorlo, P. and Montes, C. 2008.
Social perceptions of the impacts and benefits of invasive alien species: Implications for
management. Biological Conservation 141:2969-2983.
García-Llorente, M., Martín-Lopes, B., Nunes, P.A.L.D J. González, A., Alcorlo P. and
Montes, C. 2011. Analyzing the social factors that influence willingness to pay for invasive
species management under two different strategies: eradication and prevention.
Environmental Management Doi: 10.1007/s00267-011-9646-z.
Garcia-Serrano, H., Sans, F.X. and Escarré, J. 2007. Interspecific competition between alien
and native congeneric species. Acta Oecologica 31:69-78.
Geesing, D., Al-Khawlani, M. and Abba, M.L. 2004. Management of introduced Prosopis
species: Can economic exploitation control and invasive species? Unasylva 217:36-44.
Ghazanfar, S.A. 1996. Invasive Prosopis in Sultanate of Oman. Aliens 3:10.
Goluboc, J. Mandujano, M.C., Franco, M., Montana, C., Eguiarte, L.E. and Lopez-Portillo, J.
1999. Demography of the invasive woody perennial Prosopis glandulosa (Honey Mesquite).
Journal of Ecology 87:955-962.
Stellenbosch University https://scholar.sun.ac.za

145
Gosper, C.R. and Vivian-Smith, G. 2009. The role of fruit traits of bird-dispersed plants in invasiveness
and weed risk assessment. Diversity and Distributions 15: 1037-1046.
Grice, A.C. Clackson, J.R. and Calver, M. 2011. Geographic differentiation of management
objectives for invasive species: a case study of Hymenachne amplexixaulis in Australia.
Environmental Science and Policy 14:986-997.
Gifford, R. 2011. The dragons of inaction: Psychological barriers that limit climate change
mitigation and adaptation. American Psychologist 66: 290-302.
Harding, G.B. and Bate, G.C. 1991. The occurrence of invasive Prosopis species in the north-
western Cape, South Africa. South African Journal of Science 87:188-192.
Harper, J.L. 1977. Population biology of plants. Academic Press, San Diego.
Hasan, M.K., Alam and A.K.M.A. 2006. Land degradation situation in Bangladesh and the
role of agroforestry. Journal of Agriculture and Rural Development 4:19-25.
Heger, T., Pahl, A.T., Botta-Dukát, Z., Gherardi, F., Hoppe, C., Hoste, I., Jax, K., Lindström,
L., Boets, P., Haider, S., Kollmann, J., Wittmann, M,J. and Jeschke, J.M. 2013 Conceptual
frameworks and methods for advancing invasion ecology. Ambio 42:527-540.
Henderson, L. 2007. Invasive, naturalized and casual alien plants in southern Africa: a
summary based on the Southern African Plant Invaders Atlas (SAPIA). Bothalia 37:215-248.
Hoffman, M.T. Sonnenberg, D., Hurford, J.L and Jagger, B.W. 1995. Ecology and
management of Riemvasmaak’s natural resources. National Botanical Institute, Cape Town.
Holmes, P.M., Esler, K.J., Richardson, D.M. and Witkowski, E.T.F. 2008. Guidelines for
improved management of riparian zones invaded by alien plants in South Africa. South
African Journal of Botany 74: 538-552.
Huang, C., Veneckova, P., Wang, X., FitzGerald, G., Guo, Y and Tong, S. 2011. Constraints
and barriers to public health adaption to climate change. American Journal of Preventative
Medicine 40: 183-190.
Hulme, P.E. 2003. Biological invasions: winning the science battles but losing the
conservation war? Oryx 37:178-193.
Jansen van Vuuren, A. and Learmonth, D. 2013. Spirit(ed) away: preventing foetal alcohol
syndrome with motivational interviewing and cognitive behavioural therapy. South African
Family Practice 55: 59-64.
Jantrasami, L.C., Lawler, J.J. and Thomas, C.W. 2010. Institutional barriers to climate
change adaptation in the U.S. national parks and forests. Ecology and Society 15: 33. (online)
http://www.ecologyandsociety.org/vol15/iss4/art33/
Jeschke, J.M., Bacher, S., Blackburn, T.M., Dick, J.T.A., Essl, F., Evans, T., Gaertner, M.,
Hulme, P.E., Kühn, I., Mrugala, A., Pergl, J., Pyšek, P., Rabitsch, W., Ricciardi, A.,
Stellenbosch University https://scholar.sun.ac.za

146
Richardson, D.M., Sendek, A., Vilá, M., Winter, M and Kumschick, S. 2014. Defining the
impact of non-native species. Conservation Biology 28: 1188-1194.
Jones, L. 2010. Overcoming social barriers to adaptation. Overseas Development Institute,
London.
Jones, L. and Boyd. E. 2011. Exploring social barriers to adaptation: Insights from Western
Nepal. Global Environmental Change 21: 1262-1274.
Kannan, R., Shackleton, C.M. and Shaanker, R.U. 2014. Invasive alien species as drivers of
socio-ecological systems: local adaptions towards the use of Lantana in Southern India.
Environmental Development and Sustainability 16:649-669.
Kaur, R., Gonzales, W.L., Llambi. L.D., Soriano, P.J., Callaway, R.M., Rout, M.E., Gallaher,
J.T. and Inderjit. 2012. Community impacts of Prosopis juliflora invasion: Biogeographic
and congeneric comparisons. PLoS One 7:e44966.
Kazmi, S.J.H., Shaikh, S., Zamir, U.B., Zafar, H., Rasool, A., Tariq, F., Afzal, A. and Arif, T.
2009. Ecological and socio-economic evaluation of the use of Prosopis juliflora for bio-char
production in Pakistan. Pakistan: Drynet.
Kreuter, U.P., Amestoy, H.E., Kothmann, M.M., Ueckert, D.N., McGinty, A. and Cummings,
S.R. 2005. The use of brush management methods: A Texas landowner survey. Rangeland
Ecology and Management 58:284-291.
Kueffer, C. 2010. Transdisciplinarity research is needed to predict plant invasion in an era of
global change. Trends in Ecology and Evolution, 25: 310-318.
Kull, C.A., Shackleton, C.M., Cunningham, P.J., Ducatillon, C., Dufour-Dror, J., Esler, K.J.,
Friday, J.B., Gouveia, A.C., Griffin, A.R., Marchante, E., Midgley, S.J., Pauchard, A.,
Rangan, H., Richardson, D.M., Rinaudo, T., Tassin, J., Urgenson, L.S., von Maltitz, G.P.,
Zenni, R.D. and Zylstra, M.J. 2011. Adoption, use and perception of Australian acacias
around the world. Diversity and Distributions 17:822-836.
Kumar, S. and Mathur, M. 2014. Impact of invasion by Prosopis juliflora on plant
communities in arid grazing lands. Tropical Ecology 55:233-46.
Laxén J. 2007. Is Prosopis a curse or a blessing? An ecological and economic analysis of an
invasive alien tree species in Sudan. In: Lukkanan O, ed. Tropical forestry reports. Finland:
VITRI, University of Helsinki.
Lee, J.E. and Chown, S.L. 2009. Breaching the dispersal barrier to invasion: quantification and
management. Ecological Application 19: 1944-1959.
Lehmann, P., Brenck, M., Gebhardt, O., Schaller, S., Süßbauer, E. 2014. Barriers and
Opportunities for Urban Adaptation Planning: Analytical Framework and Evidence from
Cities in Latin America and Germany. Mitigation and Adaptation Strategies for Global
Change 20: 75-97
Stellenbosch University https://scholar.sun.ac.za
147
Le Maitre, D.C., van Wilgen, B.W. Chapman, R.A. and McKelly, D.H. 1996. Invasive plants
and water resources in the Western Cape Province, South Africa: modelling consequences of
a lack of management. Journal of Applied Ecology 33: 161-172.
Le Maitre, D.C. Versfeld, D.B. and Chapman, R.A. 2000. The impact of invading alien plants
on surface water resources in South Africa: a preliminary assessment. Water SA 26:397-408.
Le Maitre, D.C., Forsyth, G. and Wilson, J. 2015. Guidelines for the development of species-
based invasive alien management programmes using geographic differentiation. Department
of Environmental Affairs, Cape Town South Africa.
Lorenzoni, I., Nicholson-Cole, S and Whitmarsh, L. 2007. Barriers perceived to engaging
with climate change among the UK public and their policy implications. Global
Environmental Change 17:445–59.
Low, T. 2012a. In Denial about dangerous aid. Biological Invasions 14:22235-2236.
Low, T. 2012b. Australian acacias: weeds or useful trees? Biological Invasions 14:2217-
2227.
Lyons, J.E., Runge, M.C., Laskowski, H.P., Kendall, W.L. 2008. Monitoring in the context of
structured decision-making and adaptive management. Journal of Wildlife Management, 72:
1683-1692.
Mack, R.N. 2003. Global plant dispersal, naturalization, and invasion: Pathways, modes and
circumstances: In: Ruiz, G.M. and Carlton, J.T., eds. Invasive species: vectors and
management strategies. Washington D.C.: Island Press.
Magurran, A.E. 2004. Measuring biological diversity. Blackwell, Oxford.
Martin, T. and van Klinken, R.D. 2006. Value for money? Investment in weed management
in Australian rangelands. Rangeland Journal 28:63-75.
Mascaro, J., Becklund, K.K., Hughes, R.F. and Schnitzer, S.A. 2008. Limited native plant
regeneration in novel, exotic-dominated forests on Hawai’i. Forest Ecology and Management
256:593-606.
Maundu, P., Kibet, S., Morimoto, Y., Imbumi, M. and Adeka R. 2009. Impacts of Prosopis
juliflora on Kenya’s semi-arid and arid ecosystems and local livelihoods. Biodiversity 10:33-
50.
Max-Neef, M.A. 2005. Foundations of transdisciplinarity. Ecological Economics, 53: 5-16.
Mazibuko, D.M. 2012. Phylogenetic relationship of Prosopis in South Africa: An assessment
of the extent of hybridization, and the role of genome size and seed size in the invasion
dynamics. Masters of Science. Stellenbosch University. Stellenbosch.
Stellenbosch University https://scholar.sun.ac.za
148
McGeoch, M.A., Butchart, S.H.M., Spear, D., Marais, E., Kleynhans, E.J., Symes, A.,
Chanson, J. and Hoffmann, M. 2010. Global indicators of biological invasion: species
numbers, biodiversity impact and policy responses. Diversity and Distributions 16:95-108.
McNeely, JA (ed.) 2001. Human dimensions of invasive alien species. IUCN, Gland
Switzerland and Cambridge, UK.
McNeely, J.A., Mooney, H.A., Neville, L.E., Schei, P.J. and Waage, J.K. 2005. A global
strategy on invasive alien species: synthesis and ten strategic elements. In: Mooney, A.H.,
Mack, R.N., McNeely, A.J., Neville, L.E., Schei, P.J. and Waage JK, eds. Invasive Alien
Species: A New Synthesis. Washington, DC: Island Press.
McNeely, J.A. 2011. Xenophobia or conservation: some human dimensions. In Invasive and
introduced plants and animals – Human perceptions, attitudes and approaches to management
ed. I.D. Rotherham and R.A. Lambert. London: Earthscan.
Mgidi, T.N. (compiler) 2004. An assessment of invasion potential of invasive alien plant
species in South Africa. Final report. Report prepared for the Working for Water Programme
by Environmentek, CSIR, Stellenbosch.
Milton, S.J. and Dean, W.R.J. 1995. How useful is the keystone species concept, and can it
be applied to Acacia erioloba in the Kalahari Desert? Zeitschrift fur Okologie und
Naturschutz 4:147-156.
Milton, S.J., Dean, W.R.J. and Richardson, D.M. 2003. Economic incentives for restoring
natural capital in southern African rangelands. Frontiers in Ecology and Evolution 1:246-
254.
Moran, V.C. Hoffmann, J.H., Donnelly, D., van Wilgen B.W. and Zimmermann, H.G. 2000.
Biological control of alien, invasive pine trees (Pinus species) in South Africa. International
Symposium on Biological Control of Weeds. Montana State University, Montana.
Moser, S.C. and Ekstrom, J.A. 2010. A framework to diagnose barriers to climate change
adaptation. PNAS 107: 22026-31.
Mucina, L. and Rutherford, M.C. 2006. The vegetation of South Africa, Lesotho and
Swaziland. Strelitzia 19. South African National Biodiversity Institute, Pretoria.
Muturi, G.M., Poorter, L., Mohren, G.M.J. and Kigomo, B.N. 2013. Ecological impacts of
Prosopis species invasion in Turkwel riverine forest, Kenya. Journal of Arid Environments
92:89-97.
Mwangi, M. and Swallow, B. 2005. Invasion of Prosopis juliflora and local livelihoods: Case
study from the Lake Baringo area of Kenya. ICRAF Working Paper – no. 3. World
Agroforestry Centre, Nairobi.
Stellenbosch University https://scholar.sun.ac.za

149
Naseeruddin, S., Yadav, K.S., Sateesh, L., Manikyam, A., Sesai, S. and Rao, L.V. 2013.
Selection of the best chemical pretreatment for lignocellulosic substrate Prosopis juliflora.
Bioresource Technology 136:542-549.
Ndhlovu, T., Milton-Dean, S.J. and Esler, K.J. 2011. Impact of Prosopis (mesquite) invasion
and clearing on the grazing capacity of semiarid Nama Karoo rangeland, South Africa.
African Journal of Range and Forage Science 28:129-137.
Negi, V.S., Maikhuri, R.K. and Rawat, L.S. 2011. Non-timber forest products (NTFPs): a
viable option for biodiversity conservation and livelihood enhancement in central Himalaya.
Biodiversity Conservation 20:545-559.
Nie, W., Yuan, Y., Kepner, W., Erickson, C. and Jackson M. 2012. Hydrological impacts of
mesquite encroachment in the upper San Pedro watershed. Journal of Arid Environments
82:147-155.
Nielsen, A.M. and Fei, S. 2015. Assessing the flexibility of the Analytic Hiercahy Process for
prioritization of invasive plant management. NeoBiota 27: 25-36.
Nilsen, E.T., Sharifi, M.R., Rundel, P.W., Jarrell, W.M. and Virginia, R.A. 1983. Diurnal and
seasonal water relations of the desert phreatophyte Prosopis glandulosa (honey mesquite) in
the Sonoran Desert of California. Ecology 64:1381-1393.
Nielsen, J.Ø. and Reenberg, A. 2010. Cultural barriers to climate change adaptation: A case
study from Northern Burkina Faso. Global Environmental Change 20: 142-152.
Njoroge, E., Sirmah, P., Mburu, F., Koech, E., Mware, M. and Chepkwony J. 2012.
Preference and adoption of farmer field school (FFS) Prosopis juliflora management
practices: Experiences in Baringo District, Kenya. Forestry Studies in China 14(4):283-290.
Nuñez, M.A. and Pauchard, A. 2009. Biological invasions in developing and developed
countries: does one model fit all? Biological Invasions 12:707-714.
Osmond, R. 2003. Best practice manual, mesquite: Control and management options for
mesquite (Prosopis spp.) in Australia. Queensland: National Weeds Programme and
Queensland Department of Natural Resources and Mines.
Page, A.R. and Lacey, K.L. 2006. Economic impact assessment of Australia weed biological
control. CRC for Australian Weed Management. Australia.
Pasiecznik, N.M. 1990. Prosopis and provenance research in Cape Verde. In: Tewari, J.C.,
Pasiecznik, N.M., Harsh, L.N. and Harris, P.J.C, eds. Prosopis species in the arid and semi-
arid zones of India. Proceedings of a conference, 21-23 November 1993. Jodhpur, India:
Prosopis Society of India and the Henry Doubleday Research Association.
Pasiecznik, N.M. 1999. Prosopis - Pest or providence, weed or wonder tree? Wageningen:
ETFRN News 28:12-14.
Stellenbosch University https://scholar.sun.ac.za

150
Pasiecznik, N.M., Felker, P. Harris, P.J.C., Harsh, L.N., Cruz, G., Tewari, J.C., Cadoret, K.
and Maldonado, L.J. 2001. The Prosopis juliflora-Prosopis pallida complex: A monograph.
HDRA. Coventry, UK.
Pasiecznik, N.M. 2002. Prosopis (mesquite, algarrobo): Invasive weed or valuable forest
resource? Policy brief. Coventry, UK: HDRA.
Pasiecznik, N.M. 2004. Cinderella species and what happens after midnight? Aliens 19/20:20.
Pasiecznik, N.M. and Felker, P. 2006a. Safeguarding valued old world native Prosopis
species from biocontrol introductions. Biocontrol News and Information 27:1-26.
Pasiecznik, N.M., Harris, P.J.C., Trenchard, E.J. and Smith, S.J. 2006b. Implications of
uncertain Prosopis taxonomy for biocontrol. Biocontrol News and Information 27(1):1-26.
Pasiecznik, N.M., Choge, S.K., Muthike, G.M., Chesang, S., Fehr, C., Bakewell-Stone, P.,
Wright, J. and Harris, P.J.C. 2006c. Putting Knowledge on Prosopis into Use in Kenya.
Pioneering Advances in 2006. Nairobi and Coventry, UK: KEFRI and HDRA.
Pasiecznik, N.M. and Peñalvo López, E. Unpublished. 25 year results from an arid zone tree
species elimination trial in Almeria, Spain, and an invasive risk assessment of the exotic
species introduced. Biodiversity and Conservation
Paumgarten, F. and Shackleton, C.M. 2009. Wealth differences in household use and trade in
non-timber forest products in South Africa. Ecological Economics 68:2950-2959.
Paynter, Q., Csurhes, S.M., Heard, T.A., Ireson, J., Julien, M.H., Lloyd, J., Lonsdale, W.M.,
Palmer, W.A., Sheppard, A.W. and van Klinken, R.D. 2003. Worth the risk? Introduction of
legumes can cause more harm than good; an Australian perspective. Australian Systematic
Botany 16: 81-88.
Peel, M.C., Finlayson, B.L. and McMahon, T.A. 2007. Updated world map of the Köppen-
Geiger climate classification. Hydrology and Earth System Science 11:1633-1644.
Pheloung, P.C., Williams, P.A. and Halloy, S.A. 1999. A weed risk assessment for the use as
a biosecurity tool evaluating plant introductions. Journal of Environmental Management 57:
239-251.
Pimentel, D., McNair, S., Janecka, J., Wightman, J., Simmonds, C., O’Connell, C., Wong, E.,
Russel, L., Zern, J., Aquino, T. and Tsomondo, T. 2000. Economics and environmental
threats of alien plant, animal and microbe invasions. Agriculture, Ecosystems and
Environment, 84: 1-20.
Pimentel, D. 2002. Biological Invasions: Economic and Environmental Costs of Alien Plant,
Animal and Microbe Species. New York: CRC.
Pimentel, D. 2011. Biological invasion: Economics and environmental costs of alien plant,
animal and microbe species. CRP Press: Boca Raton.
Stellenbosch University https://scholar.sun.ac.za

151
Pimentel, D., McNair, S., Janecka, J., Wightman, J., Simmonds, C., O’Connell, C., Wong, E.
and Pravesh, H. 2011. Identification of threats on mangrove forests in Gabrik International
Wetland for sustainable management. 2011 International Conference on Biology,
Environment and Chemistry IPCBEE vol 24. Singapore: IACSIT Press.
Pote, J., Shackleton, C., Cocks, M. and Lubke, R. 2006. Fuelwood harvesting and selection in
valley thicket, South Africa. Journal of Arid Environments 67, 270-287.
Powell, J. 2001. Utilization of the camelthorn tree, in the Kalahari region. University of
Stellenbosch, Conservation Ecology Department, Report for BIOTA, Stellenbosch.
Poynton, R.J. 2009. Tree planting in southern Africa, volume 3: Other genera. Department of
Agriculture, Forestry and Fisheries. Pretoria. South Africa.
Pyšek, P, Richardson, D.M., Rejmánek, M., Webster, G.L., Williamson, M. and Kirschner, J.
2004. Alien plants in checklists and floras: towards better communication between
taxonomists and ecologists. Taxon 53:131-143.
Pyšek, P., Richardson, D.M., Pergl, J., Jarošík, V., Sixtova, Z. and Weber, E. 2008.
Geographical and taxonomic biases in invasion ecology. Trends in Ecology and Evolution
23:237-244.
Pyšek, P. and Richardson, D.M. 2010. Invasive species, environmental change and
management, and ecosystem health. Annual Review of Environment and Resources 35: 25-55
Pyšek, P., Hulme, P.E., Meyerson, L.A., Smith, G.F., Boatwright, J.S., Crouch, N.R.,
Figueiredo, E., Foxcroft, L.C., Jarošík, V., Richardson, D.M., Suda, J. and Wilson, J.R.U.
2013. Hitting the right target: taxonomic challenges for, and of, plant invasions. AoB Plants
5:plt042; doi:10.1093/aobpla/plt042.
Ræbild, A., Diallo, B.O., Graudal, L., Dao, M. and Sanou, J. 2003. Evaluation of a species
and provenance trial of Prosopis at Gonsé, Burkina Faso. Trial no. 14 in the arid zone series.
Results and Documentation No. 11. Humlebaek, Denmark: Danida Forest Seed Centre.
Rai, R.K., Scarborough, H., Subedi, N. and Lamichane, B. 2012. Invasive plants- Do they
devastate or diversify rural livelihoods? Rural farmers’ perception of three invasive plants in
Nepal. Journal for Nature Conservation 20:170-176.
Rai, R.K. and Scarborough, H. 2014. Understanding the effects of invasive plants on rural
forest-dependent communities. Small Scale Forestry DOI 10.007/s1184201492737
Ramanthan, R. 2001. A note on the use of analytic hierarchy process for environmental
impact assessment. Journal of Environmental Management 80: 167-176.
Rejmánek, M. and Richardson, D.M. 2013. Trees and shrubs as invasive alien species – 2013
update of the global database. Diversity and Distributions 19:1093-1094.
Stellenbosch University https://scholar.sun.ac.za

152
Richardson, D.M. 1998a. Commercial forestry and agroforestry as sources of invasive alien
trees and shrubs. In Invasive Species and Biodiversity Management, ed. O.T. Sandlund, P.J.
Schei, and A. Viken, pp. 237-257. Dordrecht: Kluwer Academic Publishers.
Richardson, D.M. 1998b. Forestry trees as invasive aliens. Conservation Biology 12: 18-26.
Richardson, D.M., Macdonald, I.A.W. and Forsyth, G.G. 1989. Reduction in plant species
richness under stands of lain trees and shrubs in fynbos biome. South African Forestry
Journal 149, 1-8.
Richardson, D.M. and Rejmánek, M. 2004. Conifers as invasive aliens: a global survey and
predictive framework. Diversity and Distributions 10:321-331.
Richardson, D.M. 2011. Forestry and agroforestry. In: Simberloff, D. and Rejmánek, M.
(eds). Encyclopedia of biological invasions, pp. 241-248. University of California Press,
Berkeley.
Richardson, D.M. and Rejmánek, M. 2011. Trees and shrubs as invasive alien species – a
global review. Diversity and Distributions 17:788-809.
Richardson, D.M., Hui, C., Nunez, M. and Pauchard, A. 2014. Tree invasions – patterns and
processes, challenges and opportunities. Biological Invasions 16:473-481.
Richardson, D.M., Le Roux, J.J. and Wilson, J.R.U. 2015. Australian acacias as invasive
species: Lessons to be learned from regions with long planting histories. Southern Forests
77:31-248.
Robinson, P.J. and Gore. C.D. 2005. Barriers to Canadian municipal response to climate
change. Canadian Journal of Urban Research 14: 102-120.
Robinson, T.P., van Klinken, R.D. and Metternicht, G. 2011. Comparison of alternative
strategies for invasive species distribution modelling. Ecological Modelling 221, 2261-2269.
Robertson, M.P., Villet, M.H., Fairbanks, D.H.K., Henderson, L., Higgins, S.I., Hoffmann,
J.H., Le Maitre, D.C., Palmer, A.R., Riggs, I., Shackleton, C.M. and Zimmermann, H.G.
2003. A proposed prioritization system for the management of invasive alien plants in South
Africa. South African Journal of Science 99: 37-43.
Rouget, M., Richardson, D.M., Nel, J., Le Maitre, D.C., Egoh, B. and Mgidi T. 2004.
Mapping potential ranges of major plant invaders in South Africa, Lesotho and Swaziland
using climatic suitability. Diversity and Distributions 10: 475-484.
Roura-Pascual, N., Richardson, D.M., Krug, R.M., Brown, A., Chapman, R.A., Forsyth,
G.G., Le Maitre, D.C., Robertson, M.P., Stafford, L., van Wilgen, B.W., Wannenburgh, A.
and Wessels, N. 2009. Ecology and management of alien plant invasions in South African
fynbos: Accommodating key complexities in objective decision making. Biological
Conservation 142: 1595-1604.
Stellenbosch University https://scholar.sun.ac.za
153
Roura-Pascual, N., Krug, R.M., Richardson, D.M. and Hui, C. 2010. Spatially-explicit
sensitivity analysis for conservation management: exploring the influence of decisions in
invasive alien plant management. Diversity and Distributions 16: 426–438.
Saaty, T.L. 1990. How to make a decision: the analytic hierarchy process. European Journal
of Operational Researc 48: 9-26.
Schachtschneider, K. and February, E.C. 2013. Impact of Prosopis invasion on a keystone
tree species in the Kalahari Desert. Plant Ecology 214:597-605.
Scholes, R.J and Mennel, K.G. 2008. Elephant management: A scientific assessment for
South Africa. Johannesburg: Wits Univerity Press.
Semenza, J.C., Hall, D.E., Wilson, D.J., Bontempo, B.D., Sailor, D.J. and George, L.A. 2008.
Public perception of climate change: Voluntary mitigation and barriers to behaviour change.
American Journal of Preventative Medicine 35: 479-487
Seymour, C., Milton, S., Alias, D. and Herrmann, E. 2003. A collection and overview of
research information on Acacia erioloba (camel thorn) and identification of relevant research
gaps to inform protection of the species. Department of Water Affairs and Forestry: Contract
NO. 2003/089. Pretoria, South Africa.
Shackleton, C.M. 1993. Demography and dynamics of the dominant tree species in
communal and protected areas of the eastern Transvaal Lowveld. South African Journal of
Botany 59:569-574.
Shackleton, C. and Shackleton, S. 2004. The importance of non-timber forest products in
rural livelihood security and as safety nets: a review of evidence from South Africa. South
African Journal of Science 100:658-664.
Shackleton, C.M. McConnachie, M., Chauke, M.I. Mentz, J., Sutherland, F., Gambiza, J. and
Jones, R. 2006. Urban fuelwood demand and markets in a small town in South Africa:
Livelihood vulnerability and alien plant control. International Journal of Sustainable
Development and World Ecology 13:481-409.
Shackleton, C.M., McGarry, D., Fourie, S., Gambiza, J., Shackleton, S.E. and Fabricius, C.
2007a. Assessing the effects of invasive alien species on rural livelihoods: Case examples and
a framework from South Africa. Human Ecology 35:113-127.
Shackleton, C.M., Shackleton S.E., Buiten, E. and Bird. N. 2007b. The importance of
drywoodlands and forests in rural livelihoods and poverty alleviation in South Africa. Forest
Policy and Economics 9:558-577.
Shackleton, C.M., Gambiza, J. and Jones, R. 2007c. Household fuelwood use in small
electrified towns of the Makana District, Eastern Cape, South Africa. Journal of Energy in
South Africa 18 4-10.
Stellenbosch University https://scholar.sun.ac.za

154
Shackleton, S.E., Kirby, D. and Gambiza J. 2011. Invasive plants – friends or foes?
Contribution of prickly pear (Opuntia ficus-indica) to livelihoods in Makana Municipality,
Eastern Cape, South Africa. Development Southern Africa 28:177-193.
Shackleton, R., Shackleton, C., Shackleton, S. and Gambiza, J. 2013a. Deagrarianisation and
forest revegetation in a biodiversity hotspot on the Wild Coast, South Africa. PLoS One 8:
e76939. doi:10.1371/journal.pone.0076939.
Shackleton, S., Luckert, M., Cundill, G., Cobban, L., Clarke, C., Shackleton, R. and Ndlovu,
P. 2013b.Transformation and barriers in the context of multiple stressors: Understandings
from two rural sites in the Eastern Cape, South Africa. Proceedings: Transformation in a
changing climate: International Conference in Oslo, Norway 19-21 June 2013. University of
Oslo. Pages 136-148.
Shackleton, R.T, Le Maitre, D.C, Pasiecznik, N.M. and Richardson D.M. 2014. Prosopis: A
global assessment of the biogeography, benefits, impacts and management of one of the
world’s worst woody invasive plant taxa. AoB Plants 6, plu027; doi:10.1093/aobpla/plu027.
Shackelton, R.T., Le Maitre, D.C. and Richardson, D.M. 2015a. Prosopis invasions in South
Africa: Population structures and impacts on native tree population stability. Journal of Arid
Environments 114:70-78.
Shackelton, R.T., Le Maitre, D.C. and Richardson, D.M. 2015b. Stakeholder perceptions and
practices regarding Prosopis (mesquite) invasions and management in South Africa. Ambio
44: 569-581.
Shackleton, R.T., Le Maitre, D.C., Richardson, D.M. and van Wilgen, B.W. 2015c. The
impacts of invasive Prosopis species (mesquite) on native plants in different environments in
South Africa. South African Journal of Botany 97:25-31.
Shackleton, R.T., Le Maitre, D.C., Richardson, D.M. and van Wilgen, B.W. 2015d. Use of
non-timber forest products from invasive alien Prosopis species (mesquite) and native trees
in South Africa: implications for management. Forest Ecosystmes 2:16: doi 10.1186/s40663-
015-0040-9.
Shannker, R.U., Joseph, G., Aravind, N.A., Kannan, R. and Ganeshaiah, K.N. 2010. Invasive
plants in tropical human-dominated landscapes: need for an inclusive management strategy.
In: Perrings, C., Mooney, H. and Williamson, M. (eds). Biodiversity and globalisation:
ecology, economics, management and policy. Oxford University Press: Oxford, pp 202-219.
Shiferaw, H., Teketay, D., Nemomissa, S. and Assefa, F. 2004. Some biological
characteristics that foster the invasion of Prosopis juliflora (Sw.) DC. at Middle Awash Rift
Valley Area, north-eastern Ethiopia. Journal of Arid Environments 58:135-154.
Spires, M., Shackleton, S.E. and Cundill, G. 2014. Barriers to implementing planned
community-based adaption in developing countries: a systematic literature review. Climate
and Development 6: 227-287.
Stellenbosch University https://scholar.sun.ac.za
155
Stark, J., Terasawa, K. and Ejigu, M. 2011. Climate change and conflict in pastoralist regions
of Ethiopia: Mounting challenges, emerging responses. CMM Discussion Paper No. 4.
United States Agency for International Development.
Stave, J., Oba, G., Nordal, I. and Stenseth, N.C. 2007. Traditional ecological knowledge of a
riverine forest in Turkana, Kenya: implications for research and management. Biodiversity
Conservation 16:1471-1489.
Steenkamp, H.E. and Chown, S.L. 1996. Influence of dense stands of an exotic tree Prosopis
glandulosa Benson, on a savanna dung beetle (Coleoptera: Scarabeidae) assemblage in
southern Africa. Biological Conservation 78:305–311.
Stem, C., Margoluis, R., Slafsky, N. and Brown, M. 2005. Monitoring and evaluation in
conservation: A review of trends and approaches. Conservation Biology 19: 295-309.
Stromberg, J.C., Wilkins, S.D. and Tress, J.A. 1993. Vegetation-hydrology models:
implications for management of Prosopis velutina (velvet mesquite) riparian ecosystems.
Ecological Applications 3:307-314.
Terblanche, C., Nanni, I., Kaplan, H., Strathie, L.W.., McConnachie, A.J., Goodall, J., van
Wilgen, B.W. under review. Challenges to the development of national strategies for
controlling invasive alien plant species: The case of Parthenium hysterophorus in South
Africa. Environmental Management.
Thondhlana, G., Vedeld, P. and Shackleton, S.E. 2012. Natural resource use, income and
dependence among San and Mier communities bordering the Kgalagadi Transfontier Park,
southern Kalahari, South Africa. International Journal of Sustainable Development & World
Ecology 19:460-720.
Thorp, J.R. 1999. Weeds of National Significance: Guidelines for developing strategies.
National Weeds Strategy, Executive Committee: Launceston.
Thorp J.R. and Lynch, R. 2000. The determination of Weeds of National Significance.
National Weeds Strategy Executive Council: Launceston.
Tickner, D.P., Angold, P.C., Gurnell, A.M. and Mountford, J.O. 2001. Riparian plant
invasions: hydrogeomorphological control and ecological impacts. Progress in Physical
Geography 25:22-52.
Tiwari, J.W.K. 1999. Exotic weed Prosopis juliflora in Gujarat and Rajasthan, India –boon or
bane? Tigerpaper 26(3):21-25.
Treiman, D.J. 2007. The legacy of apartheid: Racial inequalities in the new South Africa. In:
Heath, F.S. and Cheung S.Y. (Eds). Unequal chances: Ethnic minorities in western labour
markets. Oxford: Oxford University Press.
Stellenbosch University https://scholar.sun.ac.za
156
Twine, W., Moshe, D., Netshiluvhl, T. and Siphuga, V. 2003. Consumption and direct use
values of savanna bio-resources used by rural households in Mametja, a semi-arid area of
Limpopo province, South Africa. South African Journal of Science 99:467-473.
Twine, W. 2005. Socio-economic transitions influence vegetation change in the communal
rangelands of South African lowveld. African Journal of Range & Forage Science 22:93-99.
UNEP. 2004. Removing barriers to invasive plant management in Africa. UNEP, Nairobi,
Kenya.
U.S. Department of Agriculture. 2010. Forest Service: Invasive species program. U.S.
Department of Agriculture. Office of Inspector General 20250: Washington, D.C.
Van den Berg, E.C. 2010. Detection, quantification and monitoring Prosopis spp. in the
Northern Cape Province of South Africa using Remote Sensing and GIS. MSc Thesis, North-
West University, Potchefstroom.
van Klinken, R.D., Fichera, G. and Cordo, H. 2003. Targeting biological control across
diverse landscapes: the release, establishment and early success of two insects on mesquite
(Prosopis spp.) insects in Australian rangelands. Biological Control 26:8-20.
van Klinken, R.D., Graham, J. and Flack, L.K. 2006. Population ecology of hybrid mesquite
(Prosopis species) in Western Australia: how does it differ from native range invasions and
what are the implications for impacts and management? Biological Invasions 8:727-741.
van Klinken, R.D. and Campbell, S. 2009. Australian weeds series: Prosopis species. In:
Panetta FD, ed. The Biology of Australian Weed, Volume 3, pp. 238-273. Melbourne: R.G.
van Klinken, R. 2012. Prosopis spp. – mesquite. In: Julien, M., McFadyen, R. and Cullen, J.
eds. Biological control of weeds in Australia. Melbourne, Australia: CSIRO.
van Klinken, R.D. and Pichancourt, J.B. 2015. Population-level consequences of herbivory,
climate change and source-sink dynamics of a long-lived invasive Shrub. Ecological
Applications 25: 2255-2270.
van Wilgen, B., Richardson, D. and Higgins, S. 2001. Integrated control of invasive alien
plants in terrestrial ecosystems. Land Use and Water Resources Research 1: 1-6.
van Wilgen, B.W., Dyer, C., Hofmann, J.H., Ivey, P., Le Maitre, D.C., Moore, J.L.,
Richardson, D.M., Roget, M., Wannenburgh, A. and Wilson JRU. 2011. National-scale
strategic approaches for managing introduced plants: insights from Australian acacias in
South Africa. Diversity and Distributions 17:1060-1075.
van Wilgen, B.W., Forsyth, G.G., Le Maitre, D.C., Wannenburgh, A., Kotze, D.F., van den
Berg, E. and Henderson, L. 2012a. An assessment of the effectiveness of a large, national-
scale invasive alien plant control strategy in South Africa. Biological Conservation 148:28-
38.
Stellenbosch University https://scholar.sun.ac.za

157
van Wilgen, B.W., Cowling, R.M., Marais, C., Esler, K.J., McConnachie, M. and Sharp, D. 2012b.
Challenges in invasive alien plant control in South Africa. South African Journal of Science, 108: 1-3.
van Wilgen, B.W. and Richardson, D.M. 2014. Challenges and trade-offs in the management
of invasive alien trees. Biological Invasions 16:721-734.
van Wilgen, B.W. and Wannenburgh, A. 2015. Co-facilitating invasive species control, water
conservation and poverty relief: Achievements and challenges in South Africa’s Working for
Water programme. Current Opinion in Environmental Sustainability doi -
10.1016/j.cosust.2015.08.012.
Venter, S.M. and Witkowski, E.F.T. 2010. Baobab (Adansonia digitata L.) density, size class
distribution and population trends between four land-use types in northern Venda, South
Africa. Forest Ecology and Management 259:294-300.
Verbrugge, L.N.H., Van den Born, R.J.G. and Lenders, H.J.R. 2013. Exploring public
perception of non-native species from a visions of nature perspective. Environmental
Management 52: 1562-1573.
Versfeld, D.B., Le Maitre, D.C. and Chapman, R.A. 1998. Alien invading plants and water
resources in South Africa. Report no. TT 99/98. Pretoria: Water Research Commission.
Vitousek, P.M., Mooney, H.A., Lubchenco, J. and Melillo, J.M. 1997. Human Domination of
Earth’s Ecosystems. Science 277:494-499.
Voster, M. 1977. n Opname van Prosopis verspreiding in die Karoostreek, Pretoria, RSA.
Voster, C.J. 2003. Simplified geology, South Africa, Lesotho and Swaziland. Council for
Geoscience. South Africa.
Waller, R and Gilbody, S. 2009. Barriers to the uptake of computerized cognitive behavioural
therapy: a systematic review of the quantitative and qualitative evidence. Psychological
Medicine 39: 705-712.
Walter, K.J. and Armstrong, K.V. 2014. Benefits, threats and potential of Prosopis in South
India. Forests, Trees and Livelihoods 23:232-247.
Wiegand, K., Ward, D., Thulke, H. and Jeltsch, F. 2000. From snapshot information to long-
term population dynamics of Acacia by a simulation model. Plant Ecology 150:97-114.
Wilcove, D.S., Rothstein, D., Dubow, J., Phillips, A. and Losos, E. 1998. Quantifying threats
to imperilled species in the United States. BioScience 48: 607-615.
Wilson, J.R.U., Dormontt, E.E., Prentis, P.J., Low, A.J. and Richardson, D.M. 2009.
Something in the way you move: dispersal pathways affect invasion success. Trends in
Ecology and Evolution 24: 136-144.
Wilson, J.R.U., Gairifo, C., Gibson, M.R., Arianoutsou, M., Baker, B.B., Baret, S.B., Celesti-
Grapow, L., DiTomaso, J.M., Dufour-Dror, J., Kueffer, C., Kull, C.A., Hoffmann, J.H.,
Stellenbosch University https://scholar.sun.ac.za

158
Impson, F.A.C, Loope, L.L., Marchant, E., Marchante, H., Moore, J.L., Murphy, D.J., Tassin,
J., Witt, A., Zenni, R.D. and Richardson, D.M. 2011. Risk assessment, eradication, and
biological control: global efforts to limit Australian acacia invasions. Diversity and
Distributions 17:1030-1046.
Wilson, J.R.U., Caplat, P., Dickie, I.A., Hui, C., Maxwell, B.D., Nuñez, M.A., Pauchard, A.,
Rejmánek, M., Richardson, D.M., Robertson, M.P., Spear, D., Webber, B.L., van Wilgen,
B.W. and Zenni, R.D. 2014. A standardized set of metrics to assess and monitor tree
invasions. Biological invasions 16:535–551.
Wise, R.M., van Wilgen, B.W. and Le Maitre, D.C. 2012. Costs, benefits and management
options for an invasive alien tree species: The case of mesquite in the Northern Cape, South
Africa. Journal of Arid Environments 84:80-90.
Witt, A.B.R. 2010. Biofuels and invasive species from an African perspective – a review.
GCB Bioenergy 2:321-329.
Zachariades, C., Hofmann, J.H. and Roberts, A. 2011. Biological control of mesquite
(Prosopis species) (Fabaceae) in South Africa. African Entomology 19:402-415.
Zimmermann, H.G. 1991. Biological control of Prosopis, Prosopis spp. (Fabaceae), in South
Africa. Agriculture, Ecosystems and Environment 37:175-186.
Zimmermann, H.G., Hoffmann, J.H. and Witt ABR. 2006. A South African perspective on
Prosopis. Biocontrol News and Information 27(1):1-26.
Stellenbosch University https://scholar.sun.ac.za

159
Thesis supplementary material
(To access the appendices for Chapter 1 please use the following link
http://aobpla.oxfordjournals.org/content/6/plu027.full - the appendices for Chapter 7 are
included below (not published))
Chapter Appendix
number
Caption
Chapter 1 Appendix 1 Methods for literature review, climate matching, regression analysis, classification and
regression tree.
Appendix 2 Global distribution of Prosopis species. Status codes (sensu Pyšek et al. 2004 with additional
category weedy to describe native species that are invasive in their native rages) are given in
brackets: N = naturalised; I = invasive; NA = native; W = weedy; U = unknown. Countries
partaking in management of Prosopis species are marked with an asterisk.
Appendix 3 Bioclimatic modelling output – list of climatically suitable countries and the associated species
(excluding known native species)
Appendix 4 Underlying information of Prosopis invasions woldwide
Chapter 7 Appendix 1 Detailed methods for the development of a strategic and prioritisation plans for the
management of Prosopis in South Africa.
Appendix 2 Detailed discussion of different control options available for the management of Prosopis
within South Africa
Appendix 3 Mean rank (scale of 1-5; 1 being low and 5 being high) of importance of different option for
controlling invasive Prosopis in South Africa and the mean number of people supporting the
introduction of biological control as a form of management.
Appendix 4
Criteria for prioritisation identified through online surveys with farmers and Working for
Water managers involved with the management of invasive Prosopis in South Africa [mean
and (modal rank of importance from 1-5; 1 = low, 5 = high)].
Stellenbosch University https://scholar.sun.ac.za
160
Appendix 1: Detailed methods for the development of a strategic and prioritisation plans for
the management of Prosopis in South Africa.
Methods
Various methods were integrated to develop the strategic and prioritisation plans for
Prosopis. This included building on past work, drawing on published case studies, and the
use of decision trees, workshops, surveys and spatial planning. This appendix gives more
detail about the steps followed.
Decision-tree models for spatial differentiation of control actions
Grice et al. (2010) proposed a decision tree model for the differentiation of spatially-explicit
management objectives for invasive plants using Hymenachne amplexicaulis invasions in
Australia as a case study. This approach has been proposed as being well suited to guiding
management of invasive species with major impacts in South Africa (Le Maitre et al. 2015)
and has been applied to P. hysterophorus invasions in South Africa (Terblanche et al. under
review). Under NEM:BA species with major impacts (like Prosopis) need holistic
management strategies of which spatially differentiated planning is important (Le Maitre et
al. 2015).
Current and potential distributions of Prosopis
The decision tree model allows for spatial units to be placed into five management categories,
based on current and potential invasion extent illustrated in Figure 7.1 (Grice et al. 2010).
Various sources of information were used to gather information on the distribution and
abundance of Prosopis in South Africa (South African Plant Invaders Atlas (SAPIA)
database; van den Berg 2010; Shackleton et al. 2015a,b). A potential distribution map was
produced for Prosopis in South Africa using climatic variables (Mgidi, 2004; Roget et al.
2004). Only areas with a climatic suitability probability of 50 % and greater were considered
as areas fully suitable for Prosopis invasion. Based on current distribution and extent and
potential distribution, each municipality was assigned to one of the above mentioned
management action categories using the Grice et al. (2010) decision tree.
Application of decision-tree model
Management areas were zoned within municipal boundaries across South Africa to guide the
management practices needed in each municipality (Le Maitre et al 2015; Terblanche et al.
under review). This was to fall in line with NEM:BA regulations requiring each organ of state
to produce plans. Potential management actions included: Prevention ((1) passive
surveillance or (2) active surveillance) for areas with no Prosopis; (3) Local eradication
where possible; (4) Containment for areas at the edges of large invasions; (5) Asset protection
for areas with large and widespread invasions (Grice et al. 2012; Le Maitre et al. 2015). In the
prevention category, passive surveillance was allocated for municipalities where there are no
records of Prosopis and where it is incompatible climatically, while those municipalities with
no occurrence records that fell into climatically suitable areas were assigned to active
surveillance management approach (Figure 7.1). Areas with low populations (< 1 ha or 100
Stellenbosch University https://scholar.sun.ac.za

161
individuals and at least 50 km from a large population), isolated to a small number of
properties or one catchment were assigned to the local eradication category. Municipalities
with moderate populations on the borders of those with major invasions were assigned to the
containment category, and municipalities with widespread and high density invasions were
assigned to the asset protection category. Within the containment and asset protection
management approaches there are various control methods available including biological
control, various forms of chemical and mechanical control and control through utilisation -
each with their benefits and costs (van Wilgen et al. 2011; Shackleton et al. 2014). Online
(using Surveymonkey) and telephone surveys were also conducted with 19 farmers and 11
WfW managers to rank the importance of the different management options highlighted in
the Grice model. Questions were also asked about preferences and views on different control
techniques, and specifically whether respondents would support the introduction of additional
biological control agents as containment and asset-protection strategy. Since Prosopis is so
widespread, the asset protection management category is extremely large, making it
important to identify assets needing protection and to spatially prioritise them using AHP (see
below).
Multi-criteria decision making (Analytic Hierarchy Process) for asset protection
prioritisation
Multi-criteria decision making, using AHP, was applied to identify, rank and spatially
prioritise assets for management within asset protection management categories (Figure 7.2
and 3). This step was important, as unlike other species the Grice model has been applied to
Prosopis is extremely widespread, therefore has a large asset protection zone (Grice et al.
2011; Le Maitre et al 2015; Terblanche et al. under review). This approach has been used to
spatially prioritise invasive species management in other areas of South Africa (Forsyth et al.
2012).
AHP is a decision-making tool that facilitates inputs from multiple stakeholders, where
parties negotiate to ensure that each is adequately represented, allowing for a single
comparison that accommodates all viewpoints (Saaty, 1990; Ramanthan, 2001; Regan et al.
2006). A survey was used to arrive at a preliminary goal for the management of Prosopis and
to identify criteria for asset prioritisation. Online and telephonic surveys with 19 farmers and
11 managers in the Northern Cape were conducted. The survey included sections on defining
a goal, identifying criteria and sub-criteria (free listing) to prioritise areas for control and
ranking these criteria on a scale of 1-5 (1 = low priority; 5 = high priority). Data from the
survey were presented at the workshop (see below) to guide participants and speed up the
workshop process as well as to allow for broader participation in the AHP process.
A one-day multiple-stakeholder workshop was run with 18 participants (six academics, seven
government managers and policy makers, three farmers and two from companies involved in
invasive plant utilization and management). During the workshop a goal for management was
determined and assets requiring protection were identified and ranked. The identified assets
were used as criteria and sub-criteria for spatial prioritisation within the asset-protection
management area. AHP was run using the Super Decision software which allowed for
Stellenbosch University https://scholar.sun.ac.za

162
pairwise comparisons to be made between the identified criteria to rank them in order of
importance. The final criteria were sent out to all stakeholders who gave initial input for
approval. Once the model was approved (consensus from all stakeholders) we collected
relevant spatial data sets to allow for the objective comparison and prioritisation of each
catchment within the asset protection zone in South Africa (Forsyth et al. 2012). Spatial data
sets used for the analysis included; utilisable groundwater exploitation potential (Water
Resources of South Africa, 2005), sum of the length NFEPA river classes (CSIR, 2011),
water quality (Total dissolved solids) (Water Resources of South Africa, 2005), NBA
ecosystem threat status (SANBI, 2012), NFEPA river FEPAs (CSIR, 2011), protected areas
of South Africa (SANBI, 2005), land capability (ARC-LNR, 2004), and grazing potential
(CSIR, 1998). Analysis was conducted using Arc Map 10.3 and spread sheets in Excel.
Strategic planning guidelines and options
Within the MCDA workshops, time was allocated to discuss options for strategic
management planning and participants in the telephonic and online surveys (see above)
provided important feedback on control options and management needs. In a previous study
workshops were also held with four stakeholder groups (Academics, Farmers and Working
for Water Managers and Workers) to identify barriers to management and adaption responses
which were important to feed into the strategic management plan (Shackleton et al. under
review). Key informants were also approached for information on costs and aspects relating
to the efficiency of different management options and for input to the plan - these included
WfW managers, consultants working on invasive species control and utilisation, academics
and farmers. The draft plan was sent to all stakeholder groups involved in the workshops for
comment. Examples from the literature, particularly from the Australian WONS programme,
were also used to guide the development of the Prosopis national strategy for South Africa.
Stellenbosch University https://scholar.sun.ac.za
163
Appendix 2: Detailed discussion of different control options available for the management of
Prosopis within South Africa
The different control options identified in table 7.2 are discussed further in this appendix
Biological control
To date the benefits of biological control have been limited. Only seed feeding beetles were
introduced to reduce rates of spread but allow for continued used of Prosopis. However, one
failed to establish and the other two have had limited affects and populations crash in the
winter as in South Africa they are colder than in the agents native range (Zachariades, et al.
2011; Shackleton et al. 2014). There is growing evidence that conflicts of interest regarding
Prosopis in South Africa are not as severe as has been previously suggested, that the costs far
outweigh the benefits (Zachariades et al., 2011; Wise et al. 2012; Shackleton et al 2015c,d).
Use is lower than previously perceived and there is large scale demand for improve
management in south Africa (Shackleton et al. 2015c,d) suggesting more damaging agents
should be sought out. If a suitable biological control agent can be found, this approach will be
the most cost effective and efficient. We suggest in the strategy that additional biological
control agents which are showing success in Australia (Evippe spp.) (van Klinken, 2012; van
Klinken and Pichancourt, 2015) should be researched and released in South Africa as soon as
possible to improve the efficiency of integrated management (Figure 7.3). More successful
biological control could considerably improve benefits by decreasing densities, thereby
allowing for the production of larger stemmed trees (more suitable for harvesting) and
improved fodder production and access for livestock (Zachariades et al., 2011). A review of
all biological control programs (successes and failures) in Australia yielded a benefit to cost
ratio of 23.1:1 (Page and Lacey, 2006). The benefit ratio for Prosopis was low (+ 0.5) but it
has likely grown considerably in light of more recent findings (van Klinken, 2012; van
Klinken and Pichancourt, 2015). A review of success achieved between 1996 and 2008 in
managing woody invasive plant species by WfW in South Africa showed that only species
under successful biological control (e.g. Acacia cyclops, A. saligna, Hakea spp. and Opuntia
ficus-indica) have decreased in extent, whereas species with relatively ineffective biological
control (e.g. Lantana camara and Prosopis spp.) continue to increase in extent and density
despite large expenditure on various other control options (van Wilgen et al. 2012b).
This suggests that further work on biological control is warranted. Successful biological
control could considerably improve benefits, by decreasing densities thereby allowing for the
production of larger stem (more suitable for harvesting) and improving fodder production and
access for livestock (Zachariades et al., 2011). All managers believed it to be a good
approach and 90 % of farmers supported biological control (Appendix 3). Those that did not
support biological control were not against it because of a potential loss of benefits from
Prosopis, but rather were unaware of the rigorous pre-release testing, and were worried about
host switching.
Stellenbosch University https://scholar.sun.ac.za

164
Chemical and mechanical control
Numerous options exist for chemical and mechanical control (Table 7.2). Current approaches
used by Working for Water teams (cut stump) are beneficial in that they provide extensive
employment. However, the rate of clearing is too slow to have substantial impacts on the
density and rates of spread of Prosopis in South Africa (Figure 7.3). Concerns have also been
raised regarding quality control, corruption around clearing and the misuse of herbicides,
leading to coppicing and reinvasion (van Wilgen and Wannenburgh, 2015; Shackleton et al.
under review). Approximately 150 000 ha of Prosopis invasions were cleared between 1996
and 2008, but over that same period, increases in extent of between 200 000 and 500 000 ha
per year were recorded (van Wilgen et al. 2012b). Therefore this method is simply not
resulting in the treatment of enough of the current invasions to result in the containment, let
alone the reduction of Prosopis invasions. It must be noted that for eradication programs, the
current cut-stump methods are appropriate and will create large scale employment and aid in
significantly reducing the potential costs of Prosopis before they arise in new areas, but the
method is too slow to achieve effective management of widespread and dense invasions.
Other mechanical approaches that carry out clearing at a greater rate, using bulldozers and
backactors, are useful for clearing areas that will be used for cropping as roots are removed
(Table 2). This approach is, however, very destructive in rangelands (Table 4). Machinery
used to harvest forestry trees would be less destructive than bulldozers and backactors and
exponentially faster than the cut stump approach. This would involve large capital
investment, and lead to much faster rates of clearing, and would not substantially reduce
opportunities for employment, as cut trees could still be utilised for biomass and labour
would be needed to apply herbicide to stumps. By far the most cost effective and rapid
approach is to apply herbicide using aerial spraying (Table 2). Labour teams can then be
employed a year later to do manual follow-ups which would be easier and faster as invasions
would be much less dense. Aerial spraying should be considered for managing Prosopis in
priority areas defined on the basis of environmental and economic assets (Figure
7.4).However, it will be important to assess the potential negative effects of herbicide on the
environment.
Control through utilisation
As highlighted above, the current labour intensive cut stump approach is unfeasible for
controlling Prosopis spread although it is attractive because it requires a large labour force
(Table 2). This suggests that other options, such as control through utilisation, which could
provide substantial job creation and possibly an increase rate of treatment, needs to be
researched further, although scepticism has been expressed about the effectiveness of this
method in reducing the extent of the problem (van Wilgen et al. 2011; Shackleton et al.
2014). Encouraging utilization potentially exacerbates conflicts of interests in that it promotes
dependencies on the invasive species (van Wilgen et al. 2011; Shackleton et al. 2014).This
could be ok, as long as the populations are contained and the other environmental and social
impacts costs are minimal, and some areas could potentially be managed for suitable
agroforestry. Although this is a problem, control through utilisation has many potential
Stellenbosch University https://scholar.sun.ac.za
165
benefits. For example, it could lead to the establishment of private companies, thereby
reducing the burden on the government to fund and manage control. If undertaken within a
program such as WfW, profits realized through utilisation could be re-invested to fund other
options for Prosopis management. Also, this approach is potentially faster than the cut stump
approach and could employ more labour (Table 4). Various utilisation options exist. For
example, in Kenya the making of flour from Prosopis (which is touted as an utilisation
success story) is unlikely to have a major impact in reducing invasion. Similarly, the
utilisation of pods to produce organic medicine “Manna” in South Africa is unlikely to have
any effect of reducing impacts and rates of spread (Wise et al. 2012). However, the power
stations that are being built in Kenya to utilise Prosopis biomass on a large scale could have a
major impact on reducing the extent of Prosopis (Shackleton et al. 2014). Other utilisation
approaches in South Africa, such as the use of fuelwood at localised scales (Kull et al. 2011;
van Wilgen et al. 2012b; Shackleton et al. 2015c), and the production of biopellets which are
exported to Europe for energy production using Australian acacias and offcuts from the pine
and Eucalyptus industry (J. Cloete (SA Wood Pellets), pers. comm.) could aid in reducing
impacts and rates of invasion. Many other options also need to be investigated urgently, such
as the production of bioenergy for local use, potentially making some of the small towns in
the arid interior of South Africa self-sufficient. Other options exist as well and require
research such as charcoal production, making of mulch for restoration, paper and many others
(Shackleton et al. 2014). These projects however need to be done on a large scale to be cost
effective and successful in reducing Prosopis populations. The main issue with this approach
is the high transport costs – as Prosopis invasions are restricted to arid areas which have
human low population’s densities and very widely dispersed commercial centres (Shackleton
et al. under review). An example for bio pellet production for export to Europe for energy
production is shown in Table 4. If a manual approach is taken, control time could be similar
to the cut-stump approach used by WfW. The use of machinery will yield much faster
clearing with the same amount of labour and similar costs (Table 2). The benefit of this
approach is that for the production of 20 000 tonnes of bio pellets, approximately R 3 million
profit could be made and would result in substantial clearing. To get round high transport
costs it would be more feasible to set up numerous moderate sized plants (e.g. 4 X 20 000
tonnes per years) than one 80 000 ton plant (J. Cloete; SA Wood Pellets, pers. comm.).
Having numerous moderate sized plants will also increase labour requirements, clear
invasions at different localities, and reduce transport costs. Not enough is known about this
approach and the guidelines suggest that in-depth research on this approach needs to be
conducted within the next 5 years (Table 1).
Other approaches
The use of fire as a tool for controlling Prosopis previously lacked widespread applicability
in the invaded range in South Africa where low fuel loads in the arid conditions mean that
fires are rare. Also, hybrid-swarms of Prosopis have shown substantial resistance to fire in
other parts of the world (Shackleton et al. 2014). However, Prosopis is moving rapidly into
wetter grassland areas of the country where fires are common, and this approach needs to be
considered in this areas. Although the use of fire on a large scale is not feasible in most areas
Stellenbosch University https://scholar.sun.ac.za

166
(low biomass in arid areas and fire-resistant hybrids) – some farmers have effectively used
concentrated burning using old tyres at the base of large, widely dispersed trees to
successfully kill them. These factors need to be highlighted and incorporated into the best-
practice manual and given to private land owners as they are not widely known (Table 1).
Other approaches that also need to be considered are livestock camp management and
transport practices which will act on one of the major pathways and vectors of spread (Lee
and Chown, 2009; (van Klinken and Pichancourt, 2015). Fencing off major invasions and
establishing holding camps to allow for seeds to be passed before livestock are moved from
invaded to non-invaded camps. Another approach could be to not allow livestock into
invaded areas to eat pods, but rather employ people to collect pods. These pods could then be
milled down – breaking the seed – and fed to livestock – which would allow for the benefits
of the utilisation of pods for fodder but reduce dispersal and spread. Preventing overgrazing
and overuse of land could also reduce rates of invasion (van Klinken and Pichancourt, 2015).
Appendix 3: Mean rank (scale of 1-5; 1 being low and 5 being high) of importance of
different option for controlling invasive Prosopis in South Africa and the mean number of
people supporting the introduction of biological control as a form of management.
Ranking of the importance of different management approaches Farmers mean
rank and %
Managers mean
rank and %
Prevention: Active surveys for new invasions combined with rapid
application of control measures for any plants that are found
3.1 3.4
Eradication of small and isolated populations 4.1 4.5
Containment by clearing along the edges of major invasions to prevent
them from spreading outwards
4.1 4.9
Asset protection: Allocating resources to clear well established invasions
in areas where they are having a negative impact (e.g. aquifers used for
town or farm water supplies) (Asset protection)
3.9 3.1
Additional question: Would you be happy with the introduction of
further biological control agents to act as a method to contain and protect
assets from Prosopis invasions, knowing it will never kill all trees in
South Africa?
89.5 100
Appendix 4: Criteria for prioritisation identified through online surveys with farmers and
Working for Water managers involved with the management of invasive Prosopis in South
Africa [mean and (modal rank of importance from 1-5; 1 = low, 5 = high)].
Criteria Farmers % and
(weighting)
Managers % and(weighting)
Water 68 (5) 88 (5)
Biodiversity 21 (3) 50 (4)
Agricultural/irrigation lands 42 (5) 25 (4)
Grazing land 16 (5) 13 (5)
Tourism - 13 (3)
Maintain gains 37 (5) -
Poverty alleviation 5 (2) 25 (3)
Top of catchment 63 (5) 63 (5)
Stellenbosch University https://scholar.sun.ac.za