Embed Size (px)
Citation preview
A multi-objective optimization framework for designingclimate-resilient building forms in urban areas
Downloaded from: https://research.chalmers.se, 2021-10-26 14:36 UTC
Citation for the original published paper (version of record):Javanroodi, K., Nik, V., Adl-Zarrabi, B. (2020)A multi-objective optimization framework for designing climate-resilient building forms inurban areasIOP Conference Series: Earth and Environmental Science, 588(3)http://dx.doi.org/10.1088/1755-1315/588/3/032036
N.B. When citing this work, cite the original published paper.
research.chalmers.se offers the possibility of retrieving research publications produced at Chalmers University of Technology.It covers all kind of research output: articles, dissertations, conference papers, reports etc. since 2004.research.chalmers.se is administrated and maintained by Chalmers Library
(article starts on next page)
Content from this work may be used under the terms of the Creative Commons Attribution 3.0 licence. Any further distributionof this work must maintain attribution to the author(s) and the title of the work, journal citation and DOI.
Published under licence by IOP Publishing Ltd
BEYOND 2020 – World Sustainable Built Environment conference
IOP Conf. Series: Earth and Environmental Science 588 (2020) 032036
IOP Publishing
doi:10.1088/1755-1315/588/3/032036
1
A multi-objective optimization framework for designing
climate-resilient building forms in urban areas
K Javanroodi1, V M Nik
1.2.3, B Adl-Zarrabi
1
1Division of Building Technology, Department of Civil and Environmental Engineering,
Chalmers University of Technology, Sweden.
2Division of Building Physics, Department of Building and Environmental Technology, Lund
University, Sweden
3Institute for Future Environments, Queensland University of Technology, Garden Point
Campus, Australia.
Abstract. With the increasing global awareness about the impacts of climate change on the built environments, the need for improving the climate resilience of buildings is being more
acknowledged. Despite the high number of relevant studies, there is a lack of frameworks to
assess the resiliency of buildings and urban areas. This study presents a multi-objective
framework to optimize the form of buildings against its energy performance and thermal comfort
considering its resiliency to the uncertainties of climate change during three thirty-years periods
(2010-2099) of a warm region. Three performance sections related to building’s form are
identified and categorized for the impact assessment including (1) urban form, (2) orientation,
and (3) transparency with ten influencing parameters. The analysis of non-dominated solutions
out of the optimization process showed that the annual energy performance (cooling and heating
demand) of the urban areas can improve about 34% in both typical and extreme weather conditions whilst maintaining thermal comfort by optimizing the overall form of the buildings
with similar built density and heights. Moreover, Buildings with 15 to 30-degree rotations and
33% glazing ratio showed the highest energy performance. Finally, the top 20 resilient building
forms with the highest energy performance and climate resiliency were selected out of the
database of results to derive design suggestions.
1. Introduction
Urban areas are responsible for over 70% of world final energy consumption [1], and with the current
rapid urbanization rate, this number is expected to increase due to the demand from the building sector
[2]. According to several studies, the energy demand from the building sector will increase with a higher rate in non-residential buildings in the next two decades [3]. Globally, about 23% of this category are
office buildings, which are accounted for over 48% of supplied energy for heating and cooling to achieve
indoor thermal comfort during working hours [4]. There have been several attempts to reduce this share
and demands from office buildings in the two recent decades with a focus on designers. The most recent approach is attempting to develop and use new computational power and associated tools to design the
energy performance of buildings. In this approach, a common and well-acknowledged technique in the
building design process is adopting an optimization algorithm in line with numerical simulation methods [5]. Considering several influencing parameters and constraints in the building design process, multi-

BEYOND 2020 – World Sustainable Built Environment conference
IOP Conf. Series: Earth and Environmental Science 588 (2020) 032036
IOP Publishing
doi:10.1088/1755-1315/588/3/032036
2
objective optimization to solve complex design problems. Thus, dozens of optimization algorithms have
been developed for multi-objective problems based on evolutionary algorithms [6]. These optimization
algorithms have been adopted for the building design process in the early stages. In addition to regular
programming platforms and tools such as Matlab [7]. The most common tools adopted and used by /for designers with more design-based interfaces are Grasshopper in Rhinoceros and Dynamo in Autodesk
Revit with several practical plugins based on different simulation engines such as EnergyPlus,
TRANSYS, and DOE-2. Adopting these tools, different features, and components of building such as building facade [8] or materials characteristics [9], glazing and shading [10] have been studied. Several
other studies have focused on developing optimization frameworks to optimize the energy performance
of buildings [11,12]. However, a comprehensive optimization framework with a back and forth process
to finding optimal forms is still missing in the available literature. On the other hand, the majority of the studies in the literature are only developed for the current climate
conditions by adopting widely-available climatic data such as Epw weather files in regular Energy
Performance Simulation (EPS) studies. These weather files are usually based on locally recorded weather data for typical years, such as different versions of Typical Meteorological Year (TMY) to
represent long-term average climate conditions of a location [13]. These weather datasets mostly fail to
consider different weather conditions such as typical and extreme which can introduce large peak loads and cause higher total energy demand on average [16]. Moreover, these weather datasets cannot
represent the uncertainties and the impacts of climate change. The climate change impact can introduce
a huge impact on the local climate and consequently energy performance of buildings and urban areas
by higher average air temperature and more frequent and stronger extreme conditions [14]. For example, the average air temperature in Europe has increased by about 1.7°C compared to the pre-industrial level
and expected to increase 1 to 2°C by 2050 [15]. Another example of the climate change impacts on the
built environments is several blackouts, power outages, and grid failures due to massive heat waves in recent decades [16].
This means that buildings as a complex system can be no longer designed or optimized for the current
climate conditions [17]. This can lead us to the concept of resiliency in system design which is ‘an ability
of the system to withstand a major disruption within acceptable degradation parameters and to recover within an acceptable time’[18]. Different components from smart air conditioning systems in a building
[19] or material design [20] to a larger scale such as urban energy system in a district or city level [21]
can be redefined in the general concept. However, it is not feasible or even practical to design the overall form of a building with such a responsive manner considering the current limitations and restrictions.
The overall form of a building in an urban area should be designed based on the local microscale [22],
current, and future weather conditions [23]. This process can be started in the early stages of design and regardless of its associated component in the future.
A climate-resilient form should have an optimized performance in both typical and extreme conditions.
Moreover, it should have a relevantly optimized performance during uncertain weather conditions. In
other words, a climate-resilient building form should be time-dependent and have a robust performance during its occupancy and function. This paper aims to define this concept by optimizing the building
form against typical and extreme weather conditions in current and future scenarios using optimization
functions. This concept has been described in detail in the Methods section as well as the adopted optimization approach, influencing parameters, and applied inputs for the whole process. The Pareto
front plot of the developed optimization algorithm along with the geometrical characteristics of the top
20 best design options is presented in the Results section. Moreover, the energy performance of the five best solutions, as well as the design-based characteristics of the best solutions, are also presented to
assess the impacts of the introduced framework.
2. Methods
A multi-objective framework with a replicable process is developed based on an earlier work of the authors [24] based on consists of four main comprehensive steps including (1) Form-generation, (2)
BEYOND 2020 – World Sustainable Built Environment conference
IOP Conf. Series: Earth and Environmental Science 588 (2020) 032036
IOP Publishing
doi:10.1088/1755-1315/588/3/032036
3
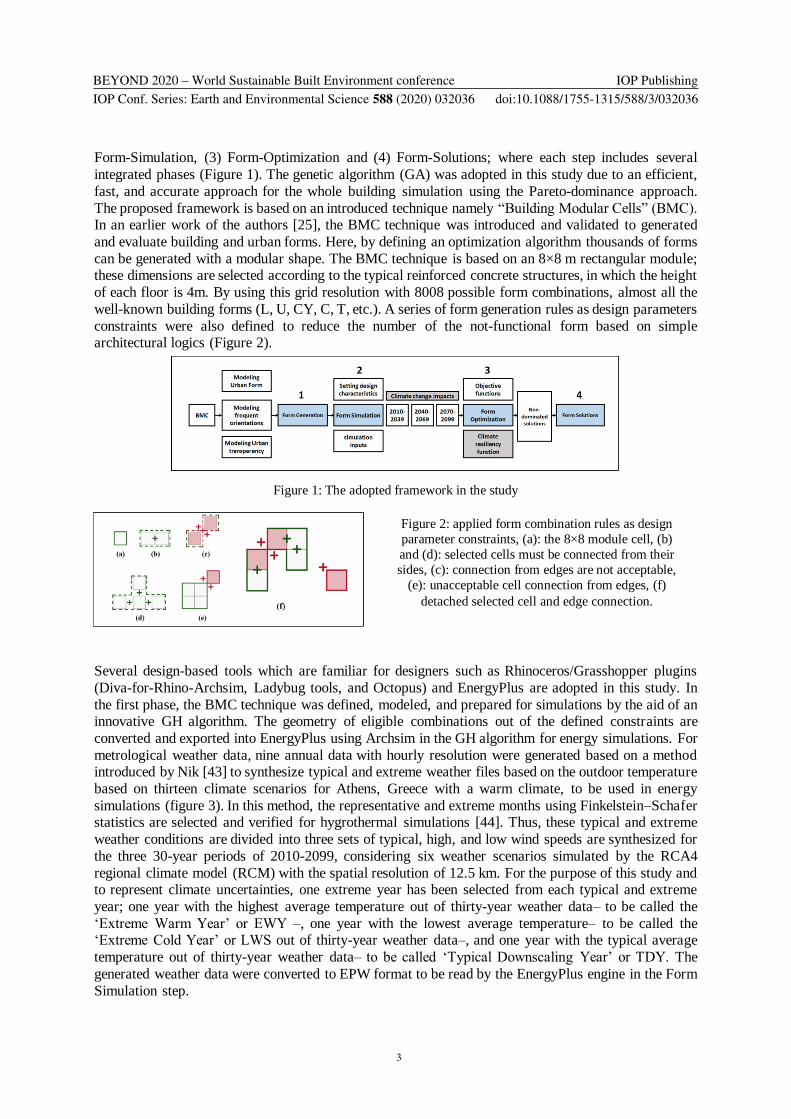
Form-Simulation, (3) Form-Optimization and (4) Form-Solutions; where each step includes several
integrated phases (Figure 1). The genetic algorithm (GA) was adopted in this study due to an efficient,
fast, and accurate approach for the whole building simulation using the Pareto-dominance approach.
The proposed framework is based on an introduced technique namely “Building Modular Cells” (BMC). In an earlier work of the authors [25], the BMC technique was introduced and validated to generated
and evaluate building and urban forms. Here, by defining an optimization algorithm thousands of forms
can be generated with a modular shape. The BMC technique is based on an 8×8 m rectangular module; these dimensions are selected according to the typical reinforced concrete structures, in which the height
of each floor is 4m. By using this grid resolution with 8008 possible form combinations, almost all the
well-known building forms (L, U, CY, C, T, etc.). A series of form generation rules as design parameters
constraints were also defined to reduce the number of the not-functional form based on simple architectural logics (Figure 2).
Figure 1: The adopted framework in the study
Several design-based tools which are familiar for designers such as Rhinoceros/Grasshopper plugins
(Diva-for-Rhino-Archsim, Ladybug tools, and Octopus) and EnergyPlus are adopted in this study. In
the first phase, the BMC technique was defined, modeled, and prepared for simulations by the aid of an innovative GH algorithm. The geometry of eligible combinations out of the defined constraints are
converted and exported into EnergyPlus using Archsim in the GH algorithm for energy simulations. For
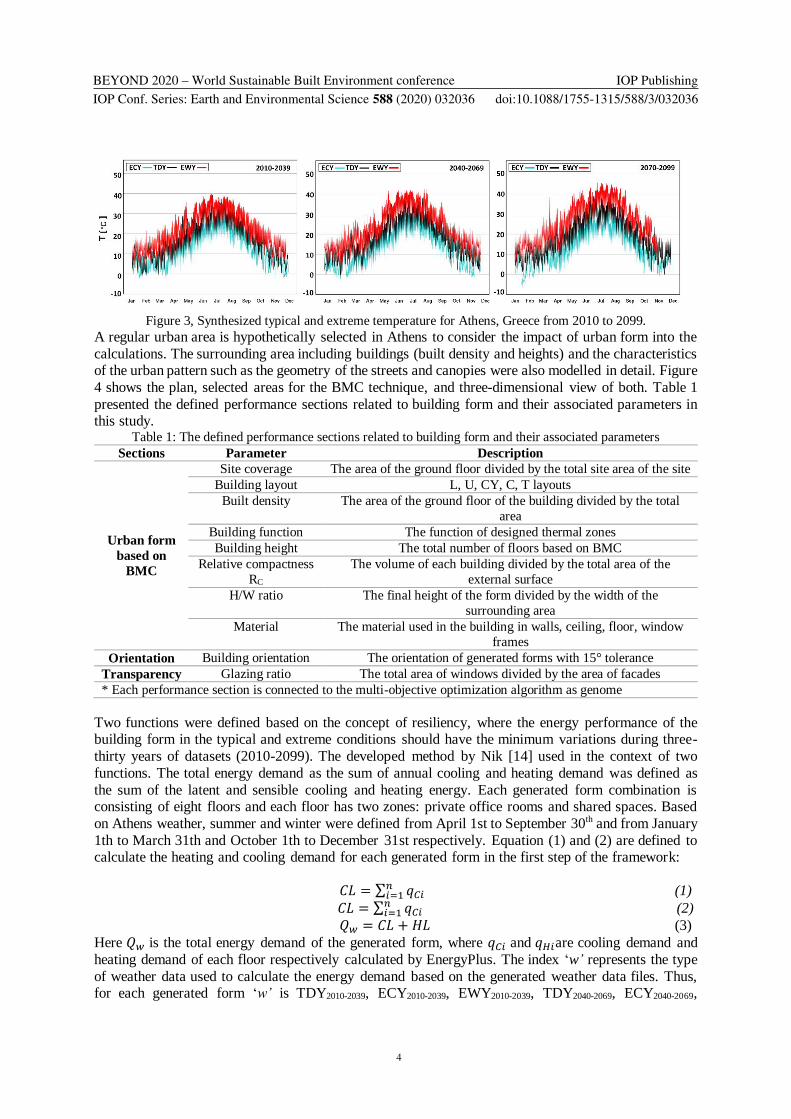
metrological weather data, nine annual data with hourly resolution were generated based on a method introduced by Nik [43] to synthesize typical and extreme weather files based on the outdoor temperature
based on thirteen climate scenarios for Athens, Greece with a warm climate, to be used in energy
simulations (figure 3). In this method, the representative and extreme months using Finkelstein–Schafer statistics are selected and verified for hygrothermal simulations [44]. Thus, these typical and extreme
weather conditions are divided into three sets of typical, high, and low wind speeds are synthesized for
the three 30-year periods of 2010-2099, considering six weather scenarios simulated by the RCA4
regional climate model (RCM) with the spatial resolution of 12.5 km. For the purpose of this study and to represent climate uncertainties, one extreme year has been selected from each typical and extreme
year; one year with the highest average temperature out of thirty-year weather data– to be called the
‘Extreme Warm Year’ or EWY –, one year with the lowest average temperature– to be called the ‘Extreme Cold Year’ or LWS out of thirty-year weather data–, and one year with the typical average
temperature out of thirty-year weather data– to be called ‘Typical Downscaling Year’ or TDY. The
generated weather data were converted to EPW format to be read by the EnergyPlus engine in the Form
Simulation step.
Figure 2: applied form combination rules as design
parameter constraints, (a): the 8×8 module cell, (b)
and (d): selected cells must be connected from their
sides, (c): connection from edges are not acceptable,
(e): unacceptable cell connection from edges, (f)
detached selected cell and edge connection.
BEYOND 2020 – World Sustainable Built Environment conference
IOP Conf. Series: Earth and Environmental Science 588 (2020) 032036
IOP Publishing
doi:10.1088/1755-1315/588/3/032036
4
Figure 3, Synthesized typical and extreme temperature for Athens, Greece from 2010 to 2099.
A regular urban area is hypothetically selected in Athens to consider the impact of urban form into the
calculations. The surrounding area including buildings (built density and heights) and the characteristics of the urban pattern such as the geometry of the streets and canopies were also modelled in detail. Figure
4 shows the plan, selected areas for the BMC technique, and three-dimensional view of both. Table 1
presented the defined performance sections related to building form and their associated parameters in this study.
Table 1: The defined performance sections related to building form and their associated parameters
Sections Parameter Description
Urban form
based on
BMC
Site coverage The area of the ground floor divided by the total site area of the site
Building layout L, U, CY, C, T layouts
Built density The area of the ground floor of the building divided by the total
area
Building function The function of designed thermal zones
Building height The total number of floors based on BMC
Relative compactness
RC
The volume of each building divided by the total area of the
external surface
H/W ratio The final height of the form divided by the width of the
surrounding area
Material The material used in the building in walls, ceiling, floor, window
frames
Orientation Building orientation The orientation of generated forms with 15° tolerance
Transparency Glazing ratio The total area of windows divided by the area of facades
* Each performance section is connected to the multi-objective optimization algorithm as genome
Two functions were defined based on the concept of resiliency, where the energy performance of the building form in the typical and extreme conditions should have the minimum variations during three-
thirty years of datasets (2010-2099). The developed method by Nik [14] used in the context of two
functions. The total energy demand as the sum of annual cooling and heating demand was defined as
the sum of the latent and sensible cooling and heating energy. Each generated form combination is consisting of eight floors and each floor has two zones: private office rooms and shared spaces. Based
on Athens weather, summer and winter were defined from April 1st to September 30th and from January
1th to March 31th and October 1th to December 31st respectively. Equation (1) and (2) are defined to calculate the heating and cooling demand for each generated form in the first step of the framework:
𝐶𝐿 = ∑ 𝑞𝐶𝑖𝑛𝑖=1 (1)
𝐶𝐿 = ∑ 𝑞𝐶𝑖𝑛𝑖=1 (2)
𝑄𝑤 = 𝐶𝐿 + 𝐻𝐿 (3)
Here 𝑄𝑤 is the total energy demand of the generated form, where 𝑞𝐶𝑖 and 𝑞𝐻𝑖are cooling demand and
heating demand of each floor respectively calculated by EnergyPlus. The index ‘w’ represents the type
of weather data used to calculate the energy demand based on the generated weather data files. Thus, for each generated form ‘w’ is TDY2010-2039, ECY2010-2039, EWY2010-2039, TDY2040-2069, ECY2040-2069,
BEYOND 2020 – World Sustainable Built Environment conference
IOP Conf. Series: Earth and Environmental Science 588 (2020) 032036
IOP Publishing
doi:10.1088/1755-1315/588/3/032036
5
EWY2040-2069, TDY2070-2099, ECY2070-2099, EWY2070-2099. Two main constraints were imposed on the
performance of the scheduled ventilation system during working hours to control the operative
temperature. The maximum load limit of 100 w/m2 with the temperature setpoint boundary of 18 in
winter and 27 in summer were considered in the calculations. Using a Python script in the defined algorithm, the average value of each dataset is calculated and results in three final energy demand
equations including: 𝑄𝑇𝐷𝑌, 𝑄𝐸𝐶𝑌 and 𝑄𝐸𝑊𝑌. To achieve resiliency in the energy performance of each
form, the variations between 𝑄𝐸𝐶𝑌 and 𝑄𝐸𝑊𝑌 should be squeezed towards 𝑄𝑇𝐷𝑌. For this purpose, the first objective function is defined as equation (4):
fx=1
2𝑝∑ [(𝑄𝐸𝐶𝑌(𝑢1).𝑖
− 𝑄𝑇𝐷𝑌(𝑢1).𝑖)
2
+ (𝑄𝐸𝑊𝑌(𝑢1).𝑖− 𝑄𝑇𝐷𝑌(𝑢1).𝑖
)2
]𝑝𝑖=1 (4)
To minimize the energy performance of the building during typical weather conditions, objective
function two is defined (equation (5)):
𝑓𝑦=∑ 𝑄𝑇𝐷𝑌(𝑢𝑖).𝑖
𝑝𝑖
(5)
Using two functions, first, the generated forms will have an optimized performance during the typical conditions. Second, their energy performances in extreme conditions will remain as much as possible
close to their performance in the optimized typical conditions. Such a form will have a similar thermal
behavior during all weather conditions based on a time-dependent process (adopted future weather data). Finally, the optimization problem in the study can be defined using equation (6):
𝑚𝑖𝑛{𝑓𝑥 . 𝑓𝑦}; 𝑥𝜖𝑅𝑛 (6)
To solve this optimization, function the following settings were used: population: 200, Max generation:
50, crossover rate: 0.8, mutation rate: 0.5. The average runtime for each iteration was about 180s which
can be considered as fast considering the high amount of calculation defined for each generated form.
3. Results
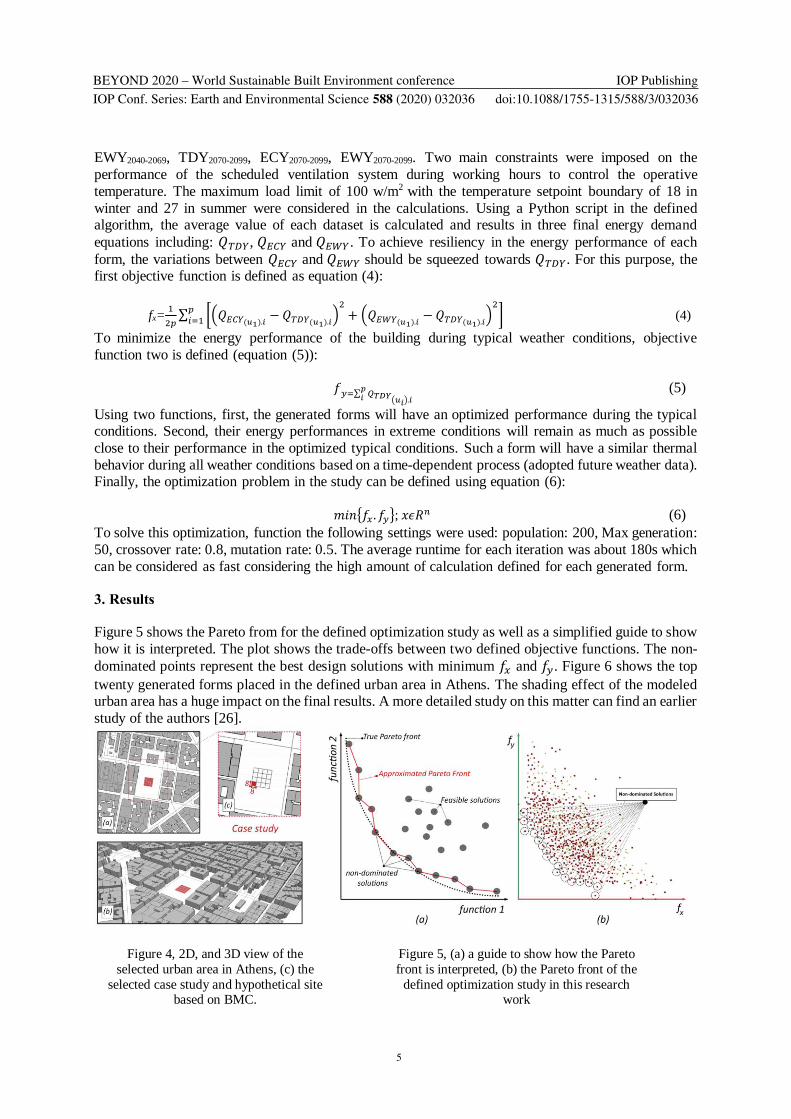
Figure 5 shows the Pareto from for the defined optimization study as well as a simplified guide to show
how it is interpreted. The plot shows the trade-offs between two defined objective functions. The non-
dominated points represent the best design solutions with minimum 𝑓𝑥 and 𝑓𝑦. Figure 6 shows the top
twenty generated forms placed in the defined urban area in Athens. The shading effect of the modeled urban area has a huge impact on the final results. A more detailed study on this matter can find an earlier
study of the authors [26].
Figure 4, 2D, and 3D view of the
selected urban area in Athens, (c) the
selected case study and hypothetical site based on BMC.
Figure 5, (a) a guide to show how the Pareto
front is interpreted, (b) the Pareto front of the
defined optimization study in this research work
BEYOND 2020 – World Sustainable Built Environment conference
IOP Conf. Series: Earth and Environmental Science 588 (2020) 032036
IOP Publishing
doi:10.1088/1755-1315/588/3/032036
6
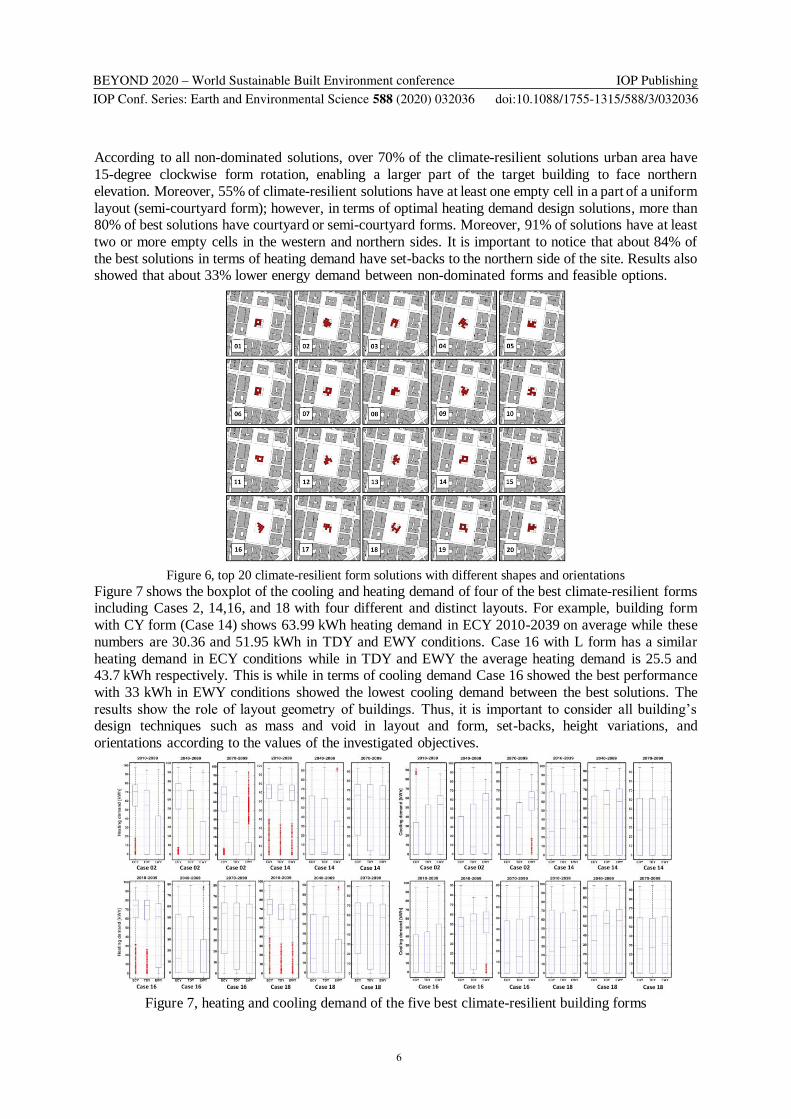
According to all non-dominated solutions, over 70% of the climate-resilient solutions urban area have
15-degree clockwise form rotation, enabling a larger part of the target building to face northern
elevation. Moreover, 55% of climate-resilient solutions have at least one empty cell in a part of a uniform
layout (semi-courtyard form); however, in terms of optimal heating demand design solutions, more than 80% of best solutions have courtyard or semi-courtyard forms. Moreover, 91% of solutions have at least
two or more empty cells in the western and northern sides. It is important to notice that about 84% of
the best solutions in terms of heating demand have set-backs to the northern side of the site. Results also showed that about 33% lower energy demand between non-dominated forms and feasible options.
Figure 6, top 20 climate-resilient form solutions with different shapes and orientations
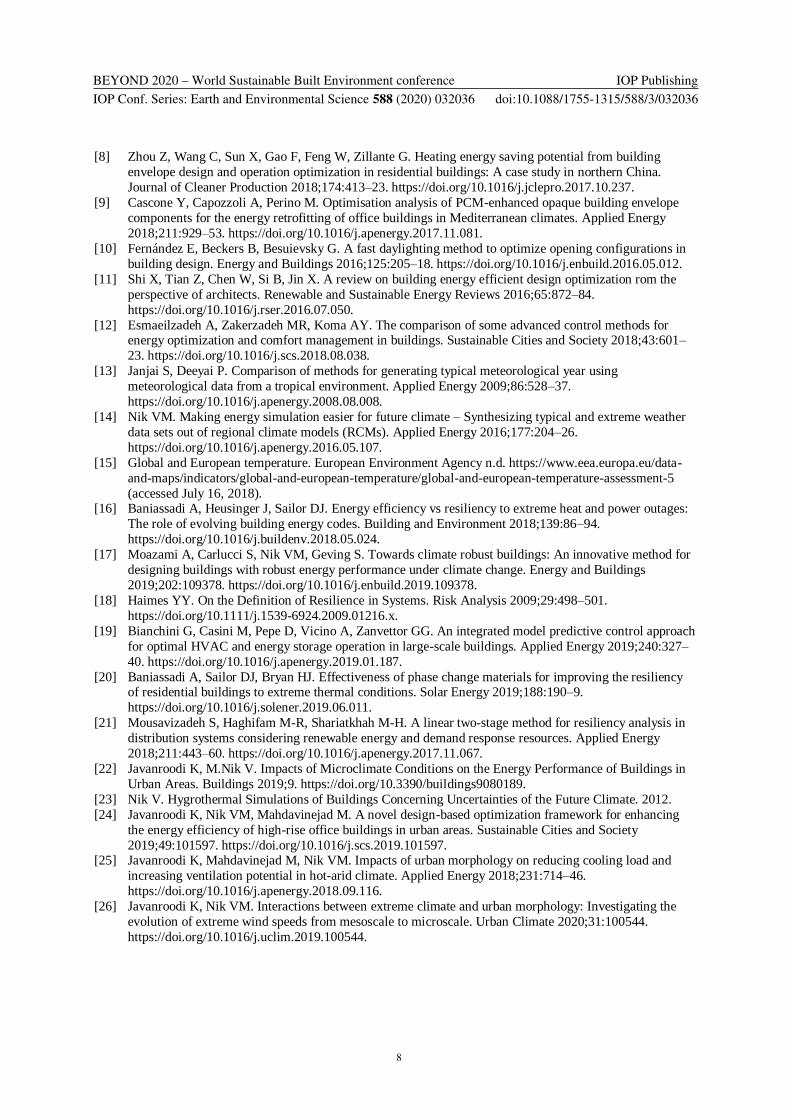
Figure 7 shows the boxplot of the cooling and heating demand of four of the best climate-resilient forms including Cases 2, 14,16, and 18 with four different and distinct layouts. For example, building form
with CY form (Case 14) shows 63.99 kWh heating demand in ECY 2010-2039 on average while these
numbers are 30.36 and 51.95 kWh in TDY and EWY conditions. Case 16 with L form has a similar
heating demand in ECY conditions while in TDY and EWY the average heating demand is 25.5 and 43.7 kWh respectively. This is while in terms of cooling demand Case 16 showed the best performance
with 33 kWh in EWY conditions showed the lowest cooling demand between the best solutions. The
results show the role of layout geometry of buildings. Thus, it is important to consider all building’s design techniques such as mass and void in layout and form, set-backs, height variations, and
orientations according to the values of the investigated objectives.
Figure 7, heating and cooling demand of the five best climate-resilient building forms

BEYOND 2020 – World Sustainable Built Environment conference
IOP Conf. Series: Earth and Environmental Science 588 (2020) 032036
IOP Publishing
doi:10.1088/1755-1315/588/3/032036
7
4. Conclusions
This study presented a multi-objective optimization framework to generate climate-resilient building
forms in urban areas. Nine weather data based on typical and extreme weather conditions were generated
for the case study, Athens. These weather datasets are Typical Downscaling Year (TDY), Extreme Cold Year (ECY) and Extreme Warm Year (EWY) generated for three thirsty-year statistical data, one year
for each from 2010 to 2099. Two objective functions were defined to solve an optimization problem to
find climate-resilient forms. The first function aimed to reduce the difference between the form’s performance in typical and extreme conditions while the second function attempted to find optimal
forms in typical conditions. The trade-offs between these two functions resulted in 67 non-dominated
building forms with the most resilient performance. The main findings of this study can be summarized
as: Forms with up to 15-degree clock-wise on the northern-southern axis (placing the form on
NW/SE axis) showed the nest energy performance during studied weather conditions.
While the best design solution in this study was L-form building, forms with semi-CY and semi-L layout with Rc between 0.85 to 0.98 (forms close to cuboid shape-Rc of a cube is 1) have the best
resiliency in the studied urban area.
Forms with set-backs toward the northern boundaries of the site by gaining more solar radiation through openings showed the best energy performance.
Forms with step-like shapes by Split the western side of the building’s form and consider mass
pull and push in the layout showed a better energy performance by reducing surfaces with
openings facing west. Forms with small open spaces in the southern and eastern boundaries of the site showed higher
energy demand on average.
Forms with high angles of rotation did not show a positive performance in terms of energy demand.
This paper provided further evidence on the importance of considering future weather conditions in the
design process of the building forms. Moreover, by taking low-cost decisions in the early design stages
by designers, the energy performance of the buildings can be dramatically reduced. The developed framework and resiliency functions in this work can enhance the quality of the form-finding process in
the early design stages. It can also allow designers to take more well-informed decisions to address
sustainable cities and communities (sustainable development goals, SDG 11). Finally, the database of results is applicable for developing new building codes and regulations in Athens or any other dense
city with similar climate conditions.
References [1] Fifth Assessment Report - Mitigation of Climate Change. Cambridge University Press; n.d.
[2] World Urbanization Prospects - Population Division - United Nations n.d. https://esa.un.org/unpd/wup/
(accessed May 18, 2018).
[3] Ruparathna R, Hewage K, Sadiq R. Improving the energy efficiency of the existing building stock: A
critical review of commercial and institutional buildings. Renewable and Sustainable Energy Reviews
2016;53:1032–45. https://doi.org/10.1016/j.rser.2015.09.084.
[4] Antoniadou P, Papadopoulos AM. Occupants’ thermal comfort: State of the art and the prospects of
personalized assessment in office buildings. Energy and Buildings 2017;153:136–49.
https://doi.org/10.1016/j.enbuild.2017.08.001.
[5] Nguyen A-T, Reiter S, Rigo P. A review on simulation-based optimization methods applied to building
performance analysis. Applied Energy 2014;113:1043–58. https://doi.org/10.1016/j.apenergy.2013.08.061. [6] Bamdad K, Cholette ME, Guan L, Bell J. Ant colony algorithm for building energy optimisation problems
and comparison with benchmark algorithms. Energy and Buildings 2017;154:404–14.
https://doi.org/10.1016/j.enbuild.2017.08.071.
[7] Perera DWU, Winkler D, Skeie N-O. Multi-floor building heating models in MATLAB and Modelica
environments. Applied Energy 2016;171:46–57. https://doi.org/10.1016/j.apenergy.2016.02.143.
BEYOND 2020 – World Sustainable Built Environment conference
IOP Conf. Series: Earth and Environmental Science 588 (2020) 032036
IOP Publishing
doi:10.1088/1755-1315/588/3/032036
8
[8] Zhou Z, Wang C, Sun X, Gao F, Feng W, Zillante G. Heating energy saving potential from building
envelope design and operation optimization in residential buildings: A case study in northern China.
Journal of Cleaner Production 2018;174:413–23. https://doi.org/10.1016/j.jclepro.2017.10.237.
[9] Cascone Y, Capozzoli A, Perino M. Optimisation analysis of PCM-enhanced opaque building envelope
components for the energy retrofitting of office buildings in Mediterranean climates. Applied Energy
2018;211:929–53. https://doi.org/10.1016/j.apenergy.2017.11.081.
[10] Fernández E, Beckers B, Besuievsky G. A fast daylighting method to optimize opening configurations in
building design. Energy and Buildings 2016;125:205–18. https://doi.org/10.1016/j.enbuild.2016.05.012.
[11] Shi X, Tian Z, Chen W, Si B, Jin X. A review on building energy efficient design optimization rom the
perspective of architects. Renewable and Sustainable Energy Reviews 2016;65:872–84.
https://doi.org/10.1016/j.rser.2016.07.050.
[12] Esmaeilzadeh A, Zakerzadeh MR, Koma AY. The comparison of some advanced control methods for energy optimization and comfort management in buildings. Sustainable Cities and Society 2018;43:601–
23. https://doi.org/10.1016/j.scs.2018.08.038.
[13] Janjai S, Deeyai P. Comparison of methods for generating typical meteorological year using
meteorological data from a tropical environment. Applied Energy 2009;86:528–37.
https://doi.org/10.1016/j.apenergy.2008.08.008.
[14] Nik VM. Making energy simulation easier for future climate – Synthesizing typical and extreme weather
data sets out of regional climate models (RCMs). Applied Energy 2016;177:204–26.
https://doi.org/10.1016/j.apenergy.2016.05.107.
[15] Global and European temperature. European Environment Agency n.d. https://www.eea.europa.eu/data-
and-maps/indicators/global-and-european-temperature/global-and-european-temperature-assessment-5
(accessed July 16, 2018). [16] Baniassadi A, Heusinger J, Sailor DJ. Energy efficiency vs resiliency to extreme heat and power outages:
The role of evolving building energy codes. Building and Environment 2018;139:86–94.
https://doi.org/10.1016/j.buildenv.2018.05.024.
[17] Moazami A, Carlucci S, Nik VM, Geving S. Towards climate robust buildings: An innovative method for
designing buildings with robust energy performance under climate change. Energy and Buildings
2019;202:109378. https://doi.org/10.1016/j.enbuild.2019.109378.
[18] Haimes YY. On the Definition of Resilience in Systems. Risk Analysis 2009;29:498–501.
https://doi.org/10.1111/j.1539-6924.2009.01216.x.
[19] Bianchini G, Casini M, Pepe D, Vicino A, Zanvettor GG. An integrated model predictive control approach
for optimal HVAC and energy storage operation in large-scale buildings. Applied Energy 2019;240:327–
40. https://doi.org/10.1016/j.apenergy.2019.01.187.
[20] Baniassadi A, Sailor DJ, Bryan HJ. Effectiveness of phase change materials for improving the resiliency of residential buildings to extreme thermal conditions. Solar Energy 2019;188:190–9.
https://doi.org/10.1016/j.solener.2019.06.011.
[21] Mousavizadeh S, Haghifam M-R, Shariatkhah M-H. A linear two-stage method for resiliency analysis in
distribution systems considering renewable energy and demand response resources. Applied Energy
2018;211:443–60. https://doi.org/10.1016/j.apenergy.2017.11.067.
[22] Javanroodi K, M.Nik V. Impacts of Microclimate Conditions on the Energy Performance of Buildings in
Urban Areas. Buildings 2019;9. https://doi.org/10.3390/buildings9080189.
[23] Nik V. Hygrothermal Simulations of Buildings Concerning Uncertainties of the Future Climate. 2012.
[24] Javanroodi K, Nik VM, Mahdavinejad M. A novel design-based optimization framework for enhancing
the energy efficiency of high-rise office buildings in urban areas. Sustainable Cities and Society
2019;49:101597. https://doi.org/10.1016/j.scs.2019.101597. [25] Javanroodi K, Mahdavinejad M, Nik VM. Impacts of urban morphology on reducing cooling load and
increasing ventilation potential in hot-arid climate. Applied Energy 2018;231:714–46.
https://doi.org/10.1016/j.apenergy.2018.09.116.
[26] Javanroodi K, Nik VM. Interactions between extreme climate and urban morphology: Investigating the
evolution of extreme wind speeds from mesoscale to microscale. Urban Climate 2020;31:100544.
https://doi.org/10.1016/j.uclim.2019.100544.