Embed Size (px)
Citation preview
A Multi-Method Exploration on Coffee Shop Atmospherics
Li Shang Ly
A Thesis
in
John Molson School of Business
Presented in Partial Fulfillment of the Requirements
for the Degree of Master of Science in Administration (Marketing) at
Concordia University
Montreal, Quebec, Canada
May 2011
©Li Shang Ly, 2011

CONCORDIA UNIVERSITY
School of Graduate Studies
This is to certify that the thesis prepared
By: Li Shang Ly
Entitled: A Multi-Method Exploration on Coffee Shop Atmospherics
and submitted in partial fulfillment of the requirements for the degree of
Master of Science in Administration (Marketing)
complies with the regulations of the University and meets the accepted standards with
respect to originality and quality.
Signed by the final examining committee:
______________Dr Fassil Nebebe___________Chair
______________Dr. Christopher Ross________Examiner
______________Dr. Onur Bodur____________Examiner
______________Dr. Bianca Grohman________Supervisor
Approved by ____________Dr. Harjeet Bhabra______________
Chair of Department or Graduate Program Director
May2011 ________________________________
Dean of Faculty
iii
Abstract
A Multi-Method Exploration on Coffee Shop Atmospherics
Li Shang Ly
This thesis examines the simultaneous use of multiple atmospheric elements (e.g.
lighting, scent, music, color) in the context of coffee shops. It explores the effects of
ambient and design elements from both a managerial and consumer perspective in a
series of field interviews, a field study, and a lab experiment.
Field interviews with ten coffee shop managers explored managers’ perception of
and concerns about the use of multiple atmospheric cues in small independent as well as
franchise coffee shops. A field study then explored consumers’ perceptions of
atmospheric cues as well as their emotional and behavioral responses in an existing
coffee shop. A lab experiment then contrasted two virtual coffee shop designs that
included multiple atmospheric cues to validate and extend field study findings. One of the
virtual coffee shop models was intended to be more contemporary while the other model
reflected a more traditional design. In addition, consumers’ perceptions of whether the
coffee shop represented a franchise or was independently owned had an impact on
perceived competence of the coffee shop. A comparison of field and lab studies suggests
that consumer experiences change when human variables are considered. The field study
reflects different perceptions compared to the lab experiment, and yielded higher means
for arousal, environment quality, store image, sophistication and sincerity. The findings
can help managers optimize design decisions, and direct spending on design and
renovations by providing insight into consumer perceptions of multi-cue store
environments.
iv
Acknowledgments
First and foremost, I would like to thank Dr. Bianca Grohmann whose generosity,
sincerity and encouragement I will never forget. She is an amazing supervisor, professor
and mentor who has been very supportive and attentive during my thesis project as well
as my career path.
My mother Judy Lam and my brother Ka Vinh Ly, for their creative input and
encouragements.
Dr Fassil Nebebe, for his mentorship, his consistent encouragement and support
in my career path.
Ms Uchenna Mgbemena, for her generous involvement and support through out
my masters program.
My dear friends, Xiao Jie Shen, Allan Lim, Sarah Winton, Rosslon Ollivierre,
Tatiana Hakim and many many more, for their help and cheers through out each phase of
my research.
My MSc classmates and colleagues who I have become very close to, to name a
few, Tatiana Hakim, Emile Kinuma, Kimberly Donato, Erika Higa Morales, Alessandra
Boezio, Parastoo Irani, Amanda Nicholson, Landry Ahouansou, for their support and
feedback.

v
Table of Contents
Introduction 1 Motivation 2 Nature of this Research 3
Conceptual Background 4 Atmospheric Elements 4 Consumer Responses 5
Emotional Responses – Pleasure-Arousal, Spatial Dimensions of Crowding 5 Behavioral Influence 6 Brand Personality and Brand Experience 7 Perception of the Store 8
Phase I - Interviews 11 Research Methodology 11
Sample 11 Questionnaire 11 Study Procedure 12
Results and Discussion 12 Summary 15
Research Objectives 16 Building on Interviews and Literature 16 Analysis Guidelines 16
Phase II - Field Study 17 Research Methodology 17
Sample 17 Questionnaire 17 Study Procedure 17 Measures 17
Results and Discussion 20 Demographics 20 Effects of General Interior Elements 20 Effects of Gender 23 Additional Analyses 23 Summary 24
Phase III - Laboratory Experiment 25 Research Methodology 25
Sample 25 Questionnaire 25 Study Procedure 26 Measures 27
Results and Discussion 29 Demographics 29 Impact of Coffee Shop Model Names 30 Impact of Design Color 32 Competence of Franchise or Independently Owned Coffee Shops 32 Coffee Shop Models and Competence of the Store 32
vi
Store Image and Competence of the Store 33 Summary 33
General Discussion 34 Differences between Field and Lab Studies 35 Differences between Virtual Coffee Shops 35 Competence 36 Demographics 36
Contribution 38 Managerial Implications 38
Formalized Decisions 38 Independent Stores and Franchises 38 Reactions of Customers 39 Potential of Coffee Shops Today and in the Future 40 Validity of the Models 40 Using the Program 40 Tolerance of Customers and Feeling at Home 41 Monotone Environment 41
Theoretical Implications 42 Store Exteriors 42 Confirmation of the Findings 42 Generalization 42 Multi-Model Comparisons 43 Experimental Control: Methodology Contribution 43
Limitations 45
Future Research 46
Conclusion 47
APPENDICES 49 Appendix A- Field Study 49 Appendix B- Laboratory Experiment 52
Model James and Model Samantha 53 Appendix C- Measurement Scales 56
Field Survey Items and Scales used 56 Lab experiment measurement scales 59
Appendix D -Nominal Data Coding 61 Appendix E – Future Research 62 Appendix F - Interview Questions 64
References 65
vii
List of Tables
Table 1-Summary of Interview Findings - Most Common Trends ___________________________________________ 12 Table 2-Reliability tests of measurement scales used in Field Survey _______________________________________ 19 Table 3 - Summary Table of General Interior Elements (IV) on Dependent Variables (DV) _______________ 21 Table 4-ANOVA tested for Service Quality, Satisfaction (IV) towards Purchase Loyalty (DV) _____________ 22 Table 5- Coefficients table for Service Quality, Satisfaction (IV) towards Purchase Loyalty (DV) _________ 22 Table 6-T-test conducted on the Effect of Lighting (IV) on Pleasure-Arousal (DV) _________________________ 24 Table 7-Pearson correlations between purchase loyalty, attitudinal loyalty, pleasure and arousal ________ 24 Table 8-Reliability of Measurement Scales used in Laboratory Experiment ________________________________ 27 Table 9- Summary of correlations in the attempt to reduce Color and Lighting items ______________________ 29 Table 10- Summary Table of Regression Tests on General Interior Elements (IV) and Dependent Variables
________________________________________________________________________________________________________________ 31 Table 11- Summary of Model James (1), Samantha (0) and Pekarna (2) and Dependent Variables _______ 37
List of Figures
Figure 1- Model Samantha (to the left) and Model James (to the right) comparison _______________________ 53 Figure 2- Pekarna renovated- scene 1 _______________________________________________________________________ 62 Figure 3- Pekarna renovated - scene 2: bright _______________________________________________________________ 62 Figure 4- Pekarna renovated - scene 2: dim _________________________________________________________________ 63
1
Introduction
Atmospherics is a research topic that has obtained much attention in academia.
Research topics range from retail crowding (Pons, Laroche, & Mourali, 2006),
background music (Vida, 2008) ambient scent (Spangenberg, Crowley, & Henderson,
1996) to influence of in-store lighting (Areni & Kim, 1994). Retail atmospheric variables
have been studied individually, as well as in terms of interactions between two variables,
such as ambient scent and music (Spangenberg, Grohmann, & Sprott, 2005).
Furthermore, Mattila and Wirtz (2006) attempted to evaluate customer arousal
expectations with a combination of three types of environmental stimuli including music,
lighting, and crowding. Grayson and McNeill (2009) studied an integrative format on
atmospherics element as a whole by interviewing managers and evaluated how managers
use atmospherics to control consumer behavior in a bar environment.
This thesis builds on the literature on multiple atmospheric cues. From a
theoretical perspective, this thesis will advance knowledge regarding the effects of
multiple atmospheric elements. Most research on retail environments has focused on
single elements considered in isolation. Research on the interactive effect of multiple
atmospheric elements is only now emerging. From a managerial perspective, this thesis
will reference coffee shop managers’ opinions about the importance of atmospherics, and
their motivation to use atmospherics as a marketing tool specifically in the coffee shop
industry characterized by increasing competition. This thesis will also generate insights
into consumers’ perceptions and behaviors, which will help managers better manage
atmospheric designs. Moreover, this research will compare independent coffee shops and
2
large corporations to question whether the most influential aspects of coffee shop
atmospherics are the same for both small businesses and large corporations. In fact, it is
possible that independent coffee shops imitate corporate chains or differentiate
themselves from corporate chains in terms of atmospheric elements in order to influence
consumer perceptions.
Motivation
The U.S. industry earned $12.27 billion in 2006 by selling coffee at
approximately 15,500 coffee shops, 3600 kiosks, 2,900 carts and 1,900 retailer locations
(Friedrick, 2007). It is hard to ignore the importance of coffee shop retailers in our
society today. Coffee shops like Starbucks have conquered the world. In 2008, when
Starbucks’s chairman Howard Schultz announced difficulties in their growth, he
mentioned ― We have to get back to what has made this company great‖ referring to the
in-store customer experience (Stuart, 2008).
The coffee shop industry is one that perfectly fits the four propositions stated by
Kotler (1978) on the importance of atmospherics - the ―conscious design of space to
create certain effects in buyers‖ (p. 50). Atmospherics are most relevant in situations
where the product is consumed and where the seller has design options (Kotler, 1978).
Atmospherics are most relevant in situations where the number of competitive outlets
increases, where product and price differences are small, and where product entries are
aimed at distinct social classes (Kotler, 1978).
The base product offered by coffee shops has small variations in terms of prices
and quality. Kopi Luwak—the most expensive coffee in the world (Indonesian) —,
alongside with Blue Mountain of Jamaica are rarities in coffee shops. The average price
3
of an espresso-based drink is US$2.45, and US$1.38 for brewed coffee according to E-
Imports (2010). Since the product itself is rather ordinary, managers gain a competitive
edge by combining their product with retail atmospherics (Kotler, 1973-1974).
―Starbucks revolution transformed gourmet coffee from a yuppie status symbol into a
mainstream consumer good‖ (Thompson & Arsel, 2004, p. 631). Atmospherics influence
consumer responses. Similar to coffee shops, there has been an increase in the number of
atmosphere restaurants in recent years. Some restaurants are coming to the opinion that
atmosphere is the primary factor to success. As owner of Pier Four said ― If it weren’t for
the atmosphere, I couldn’t do nearly the business I do.‖ (Kotler, 1973-1974) ―Customers
seek a dining experience totally different from home, and the atmosphere probably does
more to attract them than the food itself‖ (Kotler, 1973-1974, p.59).
Nature of this Research
This thesis consists of a series of exploratory studies. Literature on the joint
effects of multiple atmospheric elements is very limited. Rather than testing hypotheses
based on prior literature, this thesis thus seeks to contribute to the knowledge on multiple
atmospheric elements by exploring how managers conceive of the design and
implementation of multiple atmospheric elements and how consumers respond to retail
environments that deliver multiple atmospheric cues. An investigation of the managerial
and consumer perceptions of multi-atmospheric cue retail environments is relatively rare
in the marketing literature on atmospheric cues, which has often focused on consumer
responses. The exploratory approach taken in this thesis is aimed at raising research
questions and avenues that can be examined further in future research.
4
Conceptual Background
Atmospheric Elements
In a competitive market, beyond merchandise, price, promotion and location,
store environments play a big role influencing consumers’ store choice decisions and
should be considered carefully (Kotler, 1973-1974). One customer may feel differently
about a store environment compared to another (Gardner, 2001; Turley & Milliman,
2000; Yalch & Spangenberg, 1993). Grayson and McNeil (2009) believe it is possible to
find a general trend and understanding of what the majority of consumers enjoy in
hedonic environments such as bars and coffee shops. While managers evaluate a coffee
shop environment in a utilitarian and functional way, customers judge often by hedonic
value, which is more subjective and personal. Arbitrary combination of elements may or
may not be well received by consumers. Atmospheric elements can be categorized into
store ambient factor (background conditions, such as temperature, lighting, music, scent),
aesthetic design factors (store environment elements that are more visual, such as layout,
comfort, privacy) and store social factor (physical presence of other people, such as
crowding), and all three influence store image (Baker, Grewal, & Parasuraman, 1994).
Measurement scales used in marketing literature will help understand to what
extent specific coffee shop atmospheric elements influence consumer behavior, emotions
and perception of the store. The scales used are a combination of general interior
variables consisting of flooring, lighting, scent, music, temperature, cleanliness, wall
texture and color usage (Turley & Milliman, 2000), and store layout measure – floor
space allocation, product groupings, seating arrangement, traffic flow, decoration (Turley
& Milliman, 2000).
5
Consumer Responses
Gentile, Spiller, and Noci (2007) mention that customer experience is strictly
personal and implies the customer’s involvement at different levels (rational, emotional,
sensorial, physical, and spiritual). Emotional responses, behavioral influence and brand
experience, brand personality and store image theory are discussed.
Emotional Responses – Pleasure-Arousal, Spatial Dimensions of Crowding
Turley and Milliman (2000) asked whether distinctive types of situational (time
pressure, routine of buying task) and atmospheric (e.g., bright lights, loud music,
crowded aisles) qualities of a particular retail setting can enhance or inhibit different
emotional experiences. In addition, managers should find an interest in understanding
these issues because the emotional impact of store environment influences patronage
frequency, shopping duration and purchase outcomes. Especially when managers can
control these factors, it is important to understand the relationship between emotions and
functional characteristics of a retail setting. The Mehrabian and Russell pleasure-arousal
scale is used for the aforementioned purpose (Machleit & Eroglu, 2000). This scale helps
managers calibrate their in-store environments to elicit desired emotional responses, and
consequently a desired behavioral coffee shop experience.
Machleit and Eroglu (2000) mention shoppers perceive important differences in
affective qualities of different stores (Darden & Babin, 1994). They examined different
retail environments and mention that more than half of all emotions vary significantly
based on store type. Interestingly, coffee shops were not included as one of the store type
in their study. In order to increase the accuracy of their conclusion that different results
are expected from more functional and task-oriented environments (such as grocery
6
stores and discount stores) where a lower level of pleasure and arousal is found in
emotional effects, coffee shops will be tested as a store type with hedonic shopping value.
Potential entertainment, emotional worth, increased arousal, heightened involvement,
perceived freedom, fantasy fulfillment and escapism all may indicate a hedonically
valuable shopping experience (Aaker, 1997; Bellenger, Steinberg, & Staton, 1976; Bloch
& Richin, 1983b; Bloch, Brunel, & Arnold, 2003; Hirshman, 1983; Holbrook &
Hirschman, 1986).
Similar to other hedonic shopping experiences, coffee shops have a fun side
(Bloch & Bruce 1984). Coffee shop experiences are not evaluated exclusively on the
merit of goods or services acquired; many intangible and emotional costs and benefits
must be examined as well (Holbrook, 1986). ―A distinction between performing an act‖
to get something‖ as opposed to doing because ―you love it‖‖ (Triandis, 1977; Babin,
Darden, & Griffin, 1994, p.645) occurs to coffee shop customers, who have the option of
staying in offices, at home, or purchase coffee to go, but choose to experience a coffee
shop environment because they want to and gain a more intrinsic, personal and emotional
reward and pleasure (Deci et al.,1981).
Behavioral Influence
Atmospherics’ influence acts as a significant predictor of emotional responses
and future behaviors (Fishbein & Ajzen, 1975; Kivela, Inbakaran, & Reece, 1999).
Mehrabian and Russell’s (1974) pleasure and arousal measures are positively related to
willingness to buy (Baker et al. 1992; Hui, Dube, & Chebat, 1997), therefore we will
evaluate both emotional and behavioral outcome accordingly. Customers may have
approach behavior, which involves a desire to stay and explore the environment (Booms
7
& Bitner, 1980) or they may express avoidance behavior, which includes escaping from
the environment (Donovan & Rossiter, 1982). In this thesis, we evaluate customer
behavior by the time spent and the amount of money spent during each visit. Wakefield
and Baker (1998) found that retail atmospherics play an important role in determining the
length of time customers wish to stay in a retail area. Warshaw & Davis (1985) define
behavioral intention as ―the degree to which a person has formulated conscious plans to
perform or not perform some specified future behavior‖ (p. 214). Donovan and Rossiter
(1982) were interested in understanding patronage intentions, such as willingness to
return to the store and deliver good word of mouth to fellow customers, because of the
need to forecast customer-buying behavior. More specifically, studies have found
methods to influence consumer’s attention and manipulate customer behavior: Milliman
(1986) found that the use of music tempo gives managers control over consumption
durations, while ―specialty stores, such as bakeries, coffee shops, tobacco shops, pop
corn, and nut shops (e.g., Borowsky, 1987; Shappro, 1986; Simmons, 1988) rely on the
scent of their products to draw customers‖ (Bone & Ellen, 1992; Spangenberg, Crowley,
& Henderson,1996, p. 67). In addition, satisfaction, purchase loyalty, attitudinal loyalty
and word of mouth also account for customer behavioral reactions that will be evaluated
in this thesis.
Brand Personality and Brand Experience
One of the most studied constructs of brand associations is brand personality
(Aaker, 1997). Consumers tend to endow brands with human characteristics that result in
a brand personality, which consists of five dimensions—sincerity, excitement,
8
competence, sophistication, and ruggedness (Aaker, 1997). In this research sincerity,
excitement and sophistication measurements will be used.
Researchers suggest that brand personality increases consumer preference and
usage (Sirgy, 1982), evokes emotions in consumer (Biel, 1993) and increases levels of
trust and loyalty (Fournier, 1994). ―Brand personality is based on inferential processes‖
(Gita, Sengupta, & Aaker, 2005; Brakus, Schmitt, & Zarantonello, 2009, p. 54). ―That is,
consumers are not sincere or excited about the brand; they merely project these traits onto
brands‖ (Brakus, Schmitt, & Zarantonello, 2009, p. 54). In contrast, brand experiences
are actual sensations, feelings, cognitions and behavioral responses. ―Thus, because brand
experience differs from brand evaluations, involvement, attachment, and customer
delight, brand experience is also conceptually and empirically distinct from brand
personality‖ (Brakus, Schmitt, & Zarantonello, 2009, p.54) In particular, brand
experience differs from evaluative, affective, and associative constructs, such as brand
attitudes, brand involvement, brand attachment, customer delight, and brand personality‖
(Brakus, Schmitt, & Zarantonello, 2009, p.53). Thus, brand experience are
conceptualized as ― subjective, internal consumer responses (sensations, feelings, and
cognitions) and behavioral responses evoked by brand-related stimuli that are part of a
brand’s design and identity, packaging, communications and environments‖ (Brakus,
Schmitt, & Zarantonello, 2009, p.53). This thesis examines the impact of atmospheric
elements on both brand experience and brand personality.
Perception of the Store
Retail store environments have a major influence on consumer’s inference about
merchandise quality (Baker et al, 1994; Darden & Schwinghammer, 1985; Olshavsky,
9
1985), service quality (Gardner & Siomkos, 1985; Olson, 1977; Zeithaml, 1988) and the
consumer’s global store image, or overall attitude toward the store (Darden, Erdem, &
Darden, 1983; Lindquist, 1974; Zimmer & Golden, 1988).
In-store elements such as color, lighting, style, or music may have more
immediate effects on decision making than other marketing inputs that are not present at
the point of purchase (e.g., advertising). Furthermore, store image is an important part of
the store choice decision (Malhotra, 1983; Nevin & Houston, 1980; Stanley & Sewall,
1976). Darden, Ordem, and Darden (1983) found that consumers’ beliefs about physical
attractiveness of a store had a higher correlation with patronage intentions than did
merchandise quality. Literature suggests there are linkages between store environment,
merchandise, service quality, and store image. Rather than having a direct influence on
store image, store environment indirectly influences store image through merchandise
and service quality inferences (Baker, Grewal & Parasuraman, 1994).
Different atmospheric elements are used such that the color used within a store
was found to affect consumer evaluations of the store and the merchandise it carried
(Bellizzi, Crowley, & Hasty 1983). Milliman (1982) found that background music is
thought to improve store image and stimulate customer purchasing. Research on the
effects of color in retail environments has shown that participants inferred ―merchandise
in warm-colored environments to be more up-to date than merchandise in cool-colored
environment‖ (Baker et al., 1994 p.329; Bellizzi, Crowley, & Hasty, 1983; Crowley,
1993). In another study on color effects, Baumgarten & Hensel (1987) show that patients
who did not have prior knowledge of a physician’s reputation appeared to depend on the
physician’s office to evaluate the physician’s competence. We therefore explore the
10
possibility that customers evaluate a coffee shop’s competence based on their perception
of the store.
11
Phase I - Interviews
The objective of the field interview is to provide a qualitative review of the most
up-to-date descriptions of the manager’s point of view on the coffee shop industry. In
addition, we would like to understand how managers use atmospheric cues to reach their
managerial goals such as store traffic, store experience and increase sales.
Research Methodology
Sample
A sample of ten coffee shops was selected for the interview phase. They ranged
from small independent stores to large corporations and franchises. A database of coffee
shops was created using google.com. Managers were sent an invitation letter to
participate in an interview. Over 100 letters were sent and the response rate was 5%. In
the meantime, the researcher called each coffee shop and asked to contact the
manager/owner. Managers were also approached directly in person and follow-ups were
made using both phone and personal contact at coffee shops. Upon agreement, interviews
were scheduled and took place in the coffee shop. The initial sample was selected from
coffee shops in the center of Montreal and later expanded to other areas of Montreal in
order to obtain a sample of ten interviews.
Questionnaire
The questionnaire consisted of 15 open-ended questions (Appendix F). The first
questions were icebreakers. Follow-up questions pertained to when the coffee shop was
created. The questions further asked manager about their use of atmospheric elements to
create an overall environment, in general and by specific elements (e.g., layout, colors,
lighting, music and scent). Additional topics consisted of the coffee shop’s philosophy
12
and business goals, distinctiveness, and what atmospheric element changes managers
would consider. The interview concluded with a few questions on customer behavior and
the average amount spent by customers.
Study Procedure
Participant’s informed consent was obtained. Semi-formal interviews lasted
between 35 minutes to 1 hour and 35 minutes. Questions were asked in an order that was
comfortable for the manager and allowed all questions to be answered appropriately.
Interviews were recorded when permitted by the manager/owner.
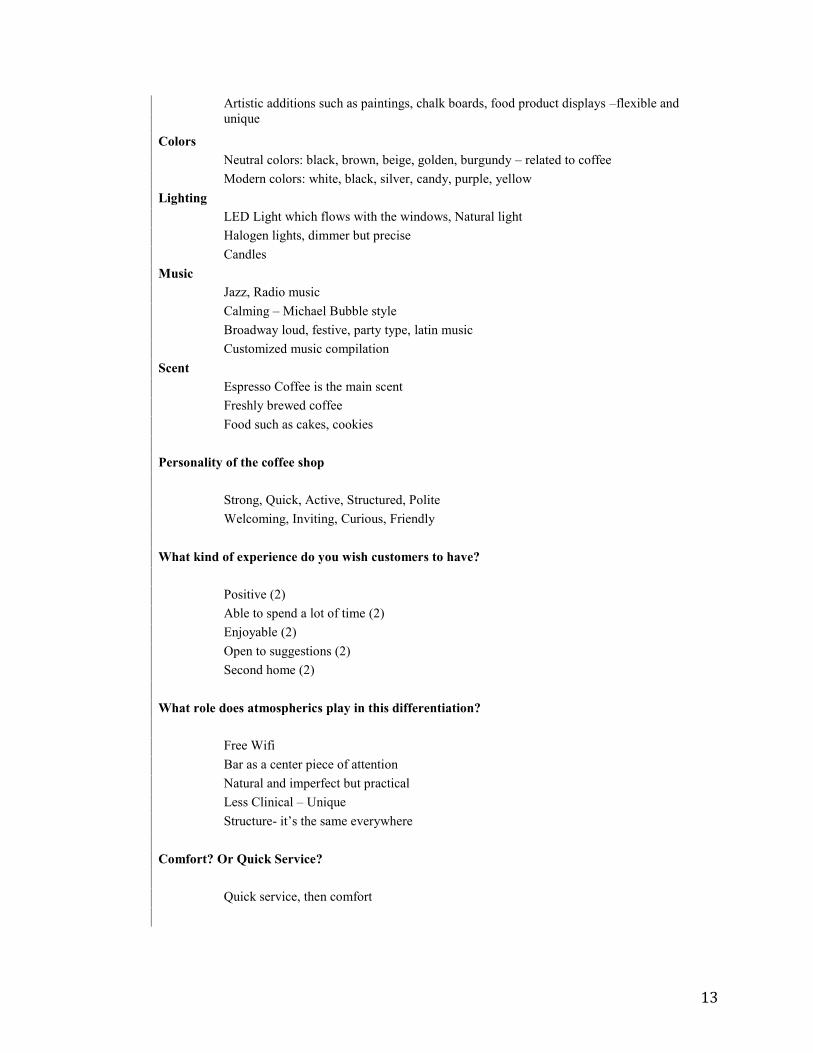
Results and Discussion
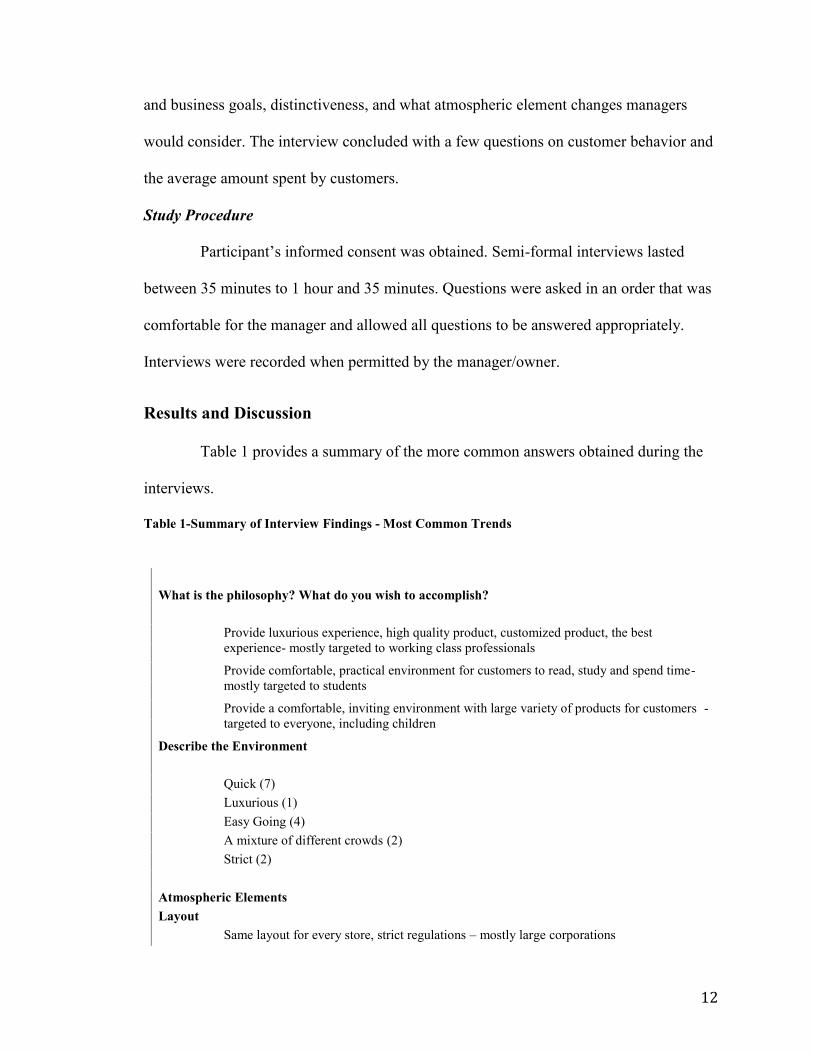
Table 1 provides a summary of the more common answers obtained during the
interviews.
Table 1-Summary of Interview Findings - Most Common Trends
What is the philosophy? What do you wish to accomplish?
Provide luxurious experience, high quality product, customized product, the best
experience- mostly targeted to working class professionals
Provide comfortable, practical environment for customers to read, study and spend time-
mostly targeted to students
Provide a comfortable, inviting environment with large variety of products for customers -
targeted to everyone, including children
Describe the Environment
Quick (7)
Luxurious (1)
Easy Going (4)
A mixture of different crowds (2)
Strict (2)
Atmospheric Elements
Layout
Same layout for every store, strict regulations – mostly large corporations
13
Artistic additions such as paintings, chalk boards, food product displays –flexible and
unique
Colors
Neutral colors: black, brown, beige, golden, burgundy – related to coffee
Modern colors: white, black, silver, candy, purple, yellow
Lighting
LED Light which flows with the windows, Natural light
Halogen lights, dimmer but precise
Candles
Music
Jazz, Radio music
Calming – Michael Bubble style
Broadway loud, festive, party type, latin music
Customized music compilation
Scent
Espresso Coffee is the main scent
Freshly brewed coffee
Food such as cakes, cookies
Personality of the coffee shop
Strong, Quick, Active, Structured, Polite
Welcoming, Inviting, Curious, Friendly
What kind of experience do you wish customers to have?
Positive (2)
Able to spend a lot of time (2)
Enjoyable (2)
Open to suggestions (2)
Second home (2)
What role does atmospherics play in this differentiation?
Free Wifi
Bar as a center piece of attention
Natural and imperfect but practical
Less Clinical – Unique
Structure- it’s the same everywhere
Comfort? Or Quick Service?
Quick service, then comfort
14
In addition, managers also raised some interesting additional points on the use of
atmospherics: Coffee Shop # 1(the names were disguised due to competitive concerns)
manager said: ―The lighting is the most important element, the use of halogen lights gives
comfort to customers as they are reading books. It also gives a European and Swedish
feel to the atmosphere.‖ Coffee Shop # 2 manager gave an opposite opinion. He uses
windows to bring light to customers, therefore operates with Fluorescent LED lights that
blend well with natural sunlight. Coffee Shop # 3 manager gave a lot of emphasis on the
importance of an imperfect environment, which is interpreted as more welcoming and
open to customers. She receives regular customers who share opinion and feel at home.
Coffee Shop # 4 manager is confident that the coffee shop works because she is blending
it with a bakery. The scent of cookies and cakes play a large role in the success of her
store. Coffee Shop # 2 manager also emphasized the importance of keeping the scent of
coffee as natural as possible, where employees are not allowed to use soap or perfume
because it contaminates the coffee scent. Coffee Shop # 5 manager put an emphasis on
the layout, tall tables for students to study, and comfortable sofas for customers to relax
and enjoy. She said it was important to diversify. Coffee Shop # 6 manager revamped the
walls of the coffee shop with many pictures of food; it was his way of branding and
attracting customers. He did not find paintings to be useful. On the contrary, Coffee Shop
# 7 manager wished to change the painting of his coffee shop more often by asking
students in Art major to provide their pieces and make the place an exhibition in order to
attract younger professionals and new segment of customers. Coffee Shop # 8 manager
dislikes putting promotional material and advertisement inside his coffee shop. He said it
distracts customers and feels that it does not make his clients comfortable. Coffee Shop #
15
9 manager likes to create booths for customers to be more isolated and adapts the music
to the crowd present at different times and different days. Finally, Coffee Shop # 10
manager uses modern colored furniture to attract customers, since it is a student oriented
environment, he provides all material necessary to tailor it to its clientele (e.g. menu,
layout, music).
Summary
After our discussions with different coffee shop managers, it was possible to
create a collection of atmospheric techniques judged by managers to be appropriate in
running a coffee shop business. Managers use these ideas to attract more customers,
increase traffic in their store, and to increase sales. From these point of views on
atmospherics, we can better understand general trends on environmental designs in
downtown Montreal coffee shops.
16
Research Objectives
Building on Interviews and Literature
In the design of the field study and the lab experiment, both the marketing
literature scales and managerial perspective are taken into account. To help define the
most relevant atmospheric elements, six general interior variables such as lighting, scent,
music, cleanliness, cash register placement and color usage were selected as general
interior variables (Turley & Milliman, 2000). Measurement scales that are important in
marketing literature will help understand to what extent, specific coffee shop models
influence consumers.
Analysis Guidelines
Given the exploratory nature of this research, the following guideline will serve
in the analysis of the results obtained in both field survey and lab experiment. First, the
six general interior elements will serve as independent variables (IV) tested against
measurement scales chosen from the marketing literature as dependent variables (DV) by
conducting a regression analysis. Afterwards, the same set of general interior elements
will be tested with gender in an ANOVA analysis. For laboratory experiment only,
general interior elements will be tested with both virtual models (James and Samantha) as
dependent variables (DV) in a regression analysis. And also, a regression analysis will be
conducted to compare three models (James, Samantha and Pekarna) by combining
common results from field survey and laboratory experiment. Finally, interesting
managerial and theoretical hypotheses will be examined. The next chapter describes
the field study conducted to follow up on the interview findings.
17
Phase II - Field Study
The field study is the first of two studies that looks at the customer perspective.
The objective of this study is to evaluate customers’ emotions, behaviors and perception
of the store in a real coffee shop setting through surveys.
Research Methodology
Sample
A sample of 63 coffee shop customers completed the questionnaire. These
participants were clients of the Pekarna coffee shop who provided informed consent and
were asked to rate the store environment and answer questions concerning their
experience in the coffee shop.
Questionnaire
The questionnaire was first written in English, and then translated into French. A
translator (and Pekarna customer) volunteered to review the French version of the survey
Study Procedure
Pekarna coffee shop, a relatively successful café with a bakery was chosen for
the field study because the manager expressed interest in renovating the store and
updating its design. The results obtained in this study are pre-renovation findings. See
Appendix 2 for photos of Pekarna coffee shop. Customers received the questionnaire
while sitting in the coffee shop. They were rewarded with a 2 for 1 coffee card to be used
at Pekarna upon completion of the questionnaire.
Measures
Seven-item likert scales and semantic differential scales were used to measure
perceptions of general interior elements (Baker, Grewal, & Parasuraman, 1994; Turley &
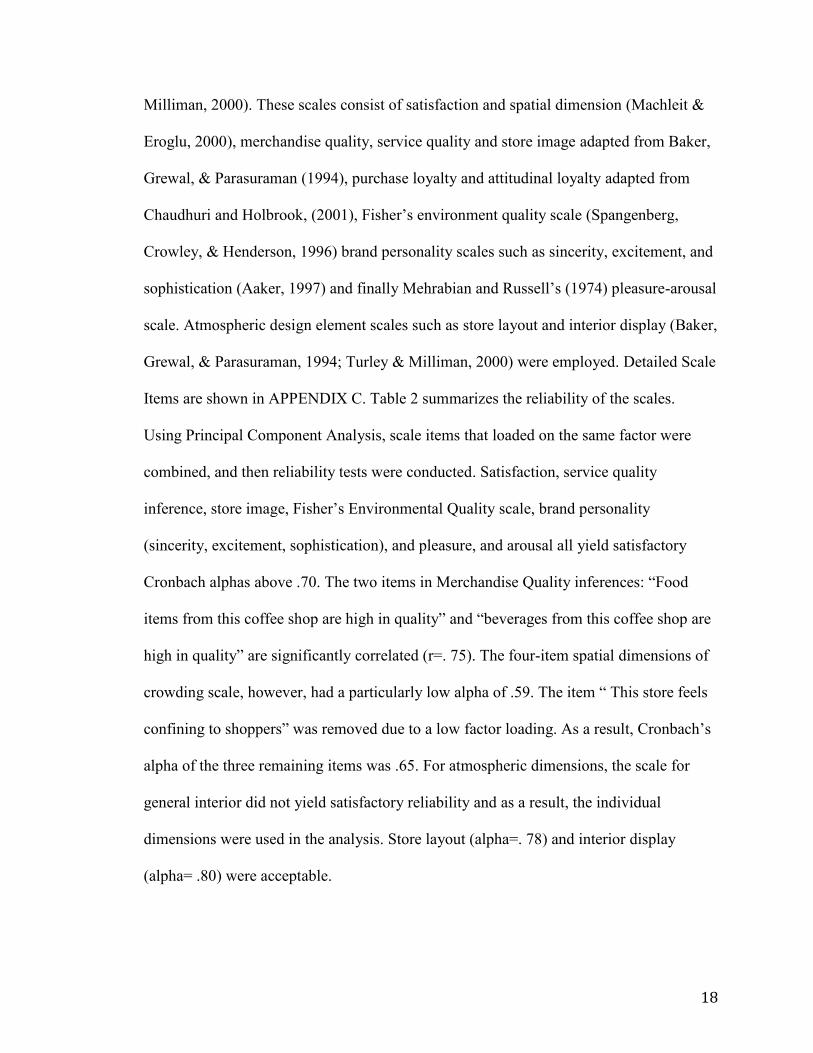
18
Milliman, 2000). These scales consist of satisfaction and spatial dimension (Machleit &
Eroglu, 2000), merchandise quality, service quality and store image adapted from Baker,
Grewal, & Parasuraman (1994), purchase loyalty and attitudinal loyalty adapted from
Chaudhuri and Holbrook, (2001), Fisher’s environment quality scale (Spangenberg,
Crowley, & Henderson, 1996) brand personality scales such as sincerity, excitement, and
sophistication (Aaker, 1997) and finally Mehrabian and Russell’s (1974) pleasure-arousal
scale. Atmospheric design element scales such as store layout and interior display (Baker,
Grewal, & Parasuraman, 1994; Turley & Milliman, 2000) were employed. Detailed Scale
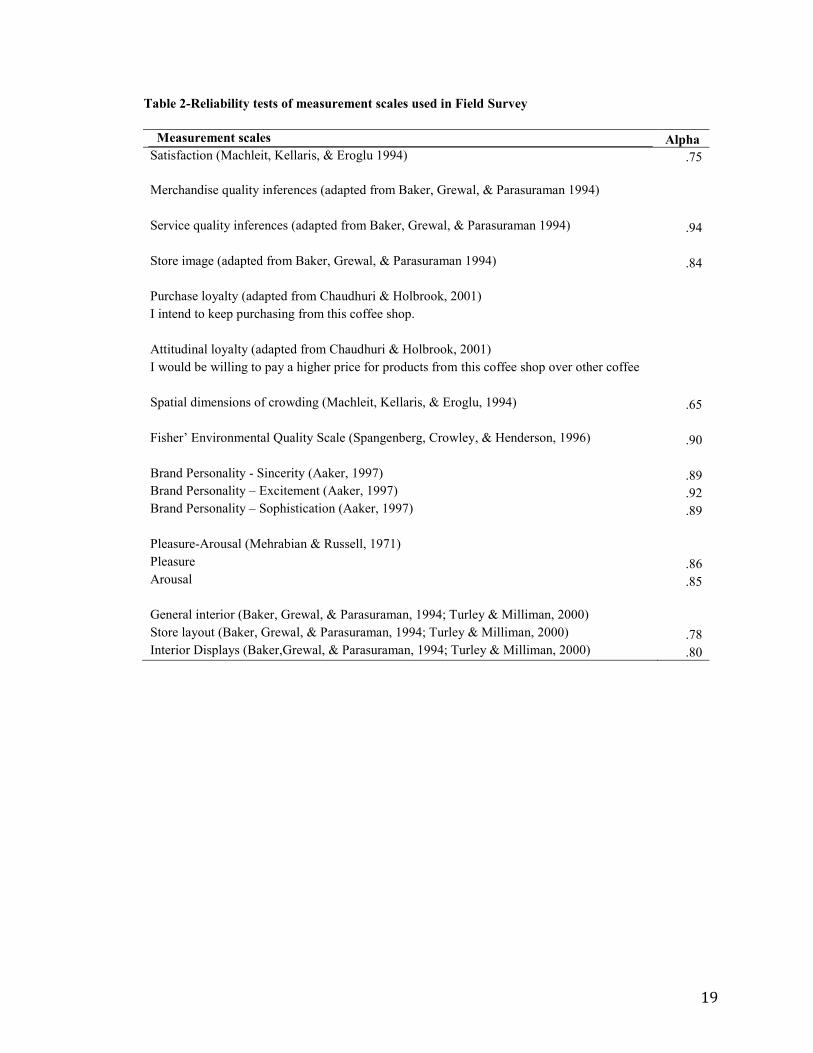
Items are shown in APPENDIX C. Table 2 summarizes the reliability of the scales.
Using Principal Component Analysis, scale items that loaded on the same factor were
combined, and then reliability tests were conducted. Satisfaction, service quality
inference, store image, Fisher’s Environmental Quality scale, brand personality
(sincerity, excitement, sophistication), and pleasure, and arousal all yield satisfactory
Cronbach alphas above .70. The two items in Merchandise Quality inferences: ―Food
items from this coffee shop are high in quality‖ and ―beverages from this coffee shop are
high in quality‖ are significantly correlated (r=. 75). The four-item spatial dimensions of
crowding scale, however, had a particularly low alpha of .59. The item ― This store feels
confining to shoppers‖ was removed due to a low factor loading. As a result, Cronbach’s
alpha of the three remaining items was .65. For atmospheric dimensions, the scale for
general interior did not yield satisfactory reliability and as a result, the individual
dimensions were used in the analysis. Store layout (alpha=. 78) and interior display
(alpha= .80) were acceptable.
19
Table 2-Reliability tests of measurement scales used in Field Survey
Measurement scales
Alpha
Satisfaction (Machleit, Kellaris, & Eroglu 1994)
.75
Merchandise quality inferences (adapted from Baker, Grewal, & Parasuraman 1994)
Service quality inferences (adapted from Baker, Grewal, & Parasuraman 1994)
.94
Store image (adapted from Baker, Grewal, & Parasuraman 1994)
.84
Purchase loyalty (adapted from Chaudhuri & Holbrook, 2001)
I intend to keep purchasing from this coffee shop.
Attitudinal loyalty (adapted from Chaudhuri & Holbrook, 2001)
I would be willing to pay a higher price for products from this coffee shop over other coffee
shops.
Spatial dimensions of crowding (Machleit, Kellaris, & Eroglu, 1994)
.65
Fisher’ Environmental Quality Scale (Spangenberg, Crowley, & Henderson, 1996)
.90
Brand Personality - Sincerity (Aaker, 1997)
.89
Brand Personality – Excitement (Aaker, 1997)
.92
Brand Personality – Sophistication (Aaker, 1997)
.89
Pleasure-Arousal (Mehrabian & Russell, 1971)
Pleasure
.86
Arousal
.85
General interior (Baker, Grewal, & Parasuraman, 1994; Turley & Milliman, 2000)
Store layout (Baker, Grewal, & Parasuraman, 1994; Turley & Milliman, 2000)
.78
Interior Displays (Baker,Grewal, & Parasuraman, 1994; Turley & Milliman, 2000)
.80

20
Results and Discussion
Demographics
The average customer stays about 39.89 minutes at Pekarna (M=39.89 (28.43)
and spends 7.27$ (5.78) up to a maximum of 24$ per visit. Customers usually order one
beverage (M=1.02 (.79)) and very often a food item (M=. 89 (.93)). The average
customer is 26-35 year old with a mixture of up to 65+ years old. Their education level is
at the bachelor level. Generally, consumers visit coffee shops 9.71 times a month. While
the sample surveyed visit Pekarna 3 times a month. See Appendix A.1 for descriptive
statistics.
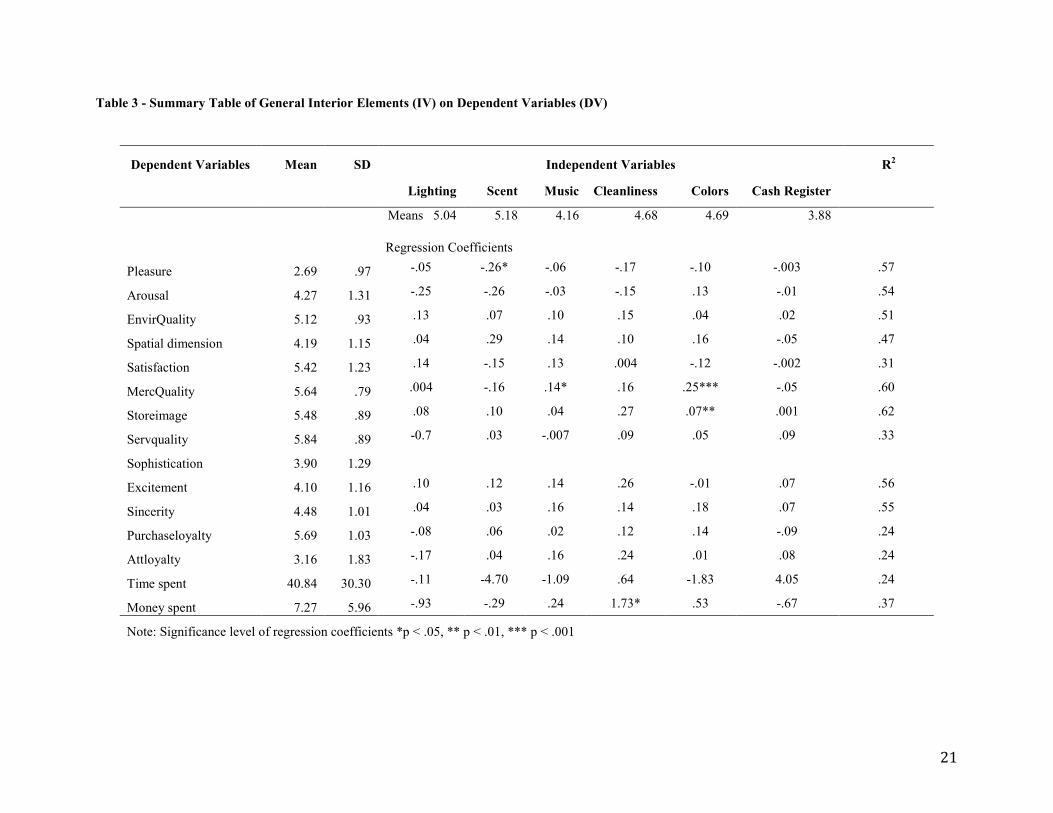
Effects of General Interior Elements
As shown in Table 3, lighting, music, scent, color, layout, cleanliness do have an
effect on pleasure (F (6,44) =3.57, p= .006), arousal (F (6,44) =2.96, p= .016),
environmental quality (F (6,44) =2.593, p= .03), merchandise quality (F (6,44) =4.264,
p= .002), store image (F (6,44) =4.60, p= .001), brand personality sincerity (F (6,44)
=3.13, p= .01), brand personality excitement (F (6,44) =3.32, p= .009), and brand
personality sophistication (F (6,44) =2.50, p= .04). Spatial dimension of crowding’s lack
of significance (F (6,44) =2.058, p= .08) can be explained by low reliability.
The pleasure dependent variable (Mehrabian & Russell,1974) yields a mean of
M=2.69(.97), t (61) = -9.932, p= .00). This value is below scale mid-point (4), this means
that the atmospheric elements at Pekarna influence customers pleasure negatively.
21
Table 3 - Summary Table of General Interior Elements (IV) on Dependent Variables (DV)
Dependent Variables Mean SD Independent Variables R2
Lighting Scent Music Cleanliness Colors Cash Register
Means 5.04 5.18 4.16 4.68 4.69 3.88
Regression Coefficients
Pleasure 2.69 .97 -.05 -.26* -.06 -.17 -.10 -.003 .57
Arousal 4.27 1.31 -.25 -.26 -.03 -.15 .13 -.01 .54
EnvirQuality 5.12 .93 .13 .07 .10 .15 .04 .02 .51
Spatial dimension 4.19 1.15 .04 .29 .14 .10 .16 -.05 .47
Satisfaction 5.42 1.23 .14 -.15 .13 .004 -.12 -.002 .31
MercQuality 5.64 .79 .004 -.16 .14* .16 .25*** -.05 .60
Storeimage 5.48 .89 .08 .10 .04 .27 .07** .001 .62
Servquality 5.84 .89 -0.7 .03 -.007 .09 .05 .09 .33
Sophistication 3.90 1.29
Excitement 4.10 1.16 .10 .12 .14 .26 -.01 .07 .56
Sincerity 4.48 1.01 .04 .03 .16 .14 .18 .07 .55
Purchaseloyalty 5.69 1.03 -.08 .06 .02 .12 .14 -.09 .24
Attloyalty 3.16 1.83 -.17 .04 .16 .24 .01 .08 .24
Time spent 40.84 30.30 -.11 -4.70 -1.09 .64 -1.83 4.05 .24
Money spent 7.27 5.96 -.93 -.29 .24 1.73* .53 -.67 .37
Note: Significance level of regression coefficients *p < .05, ** p < .01, *** p < .001
22
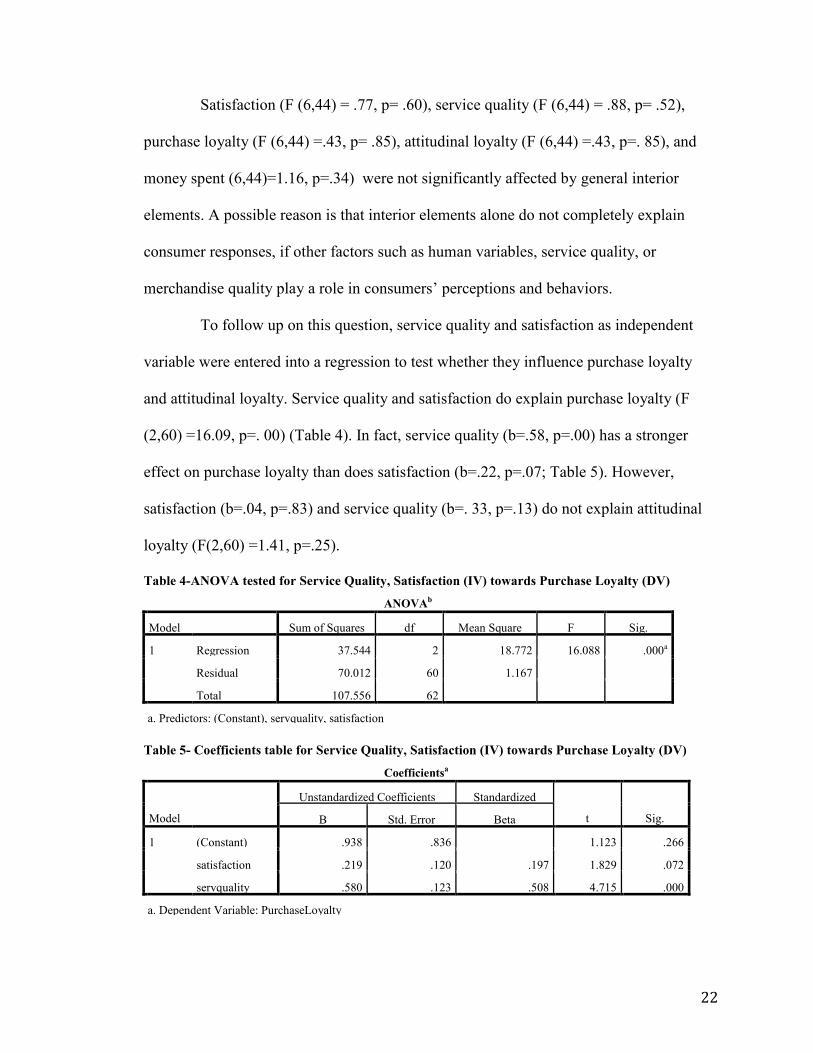
Satisfaction (F (6,44) = .77, p= .60), service quality (F (6,44) = .88, p= .52),
purchase loyalty (F (6,44) =.43, p= .85), attitudinal loyalty (F (6,44) =.43, p=. 85), and
money spent (6,44)=1.16, p=.34) were not significantly affected by general interior
elements. A possible reason is that interior elements alone do not completely explain
consumer responses, if other factors such as human variables, service quality, or
merchandise quality play a role in consumers’ perceptions and behaviors.
To follow up on this question, service quality and satisfaction as independent
variable were entered into a regression to test whether they influence purchase loyalty
and attitudinal loyalty. Service quality and satisfaction do explain purchase loyalty (F
(2,60) =16.09, p=. 00) (Table 4). In fact, service quality (b=.58, p=.00) has a stronger
effect on purchase loyalty than does satisfaction (b=.22, p=.07; Table 5). However,
satisfaction (b=.04, p=.83) and service quality (b=. 33, p=.13) do not explain attitudinal
loyalty (F(2,60) =1.41, p=.25).
Table 4-ANOVA tested for Service Quality, Satisfaction (IV) towards Purchase Loyalty (DV)
ANOVAb
Model Sum of Squares df Mean Square F Sig.
1 Regression 37.544 2 18.772 16.088 .000a
Residual 70.012 60 1.167
Total 107.556 62
a. Predictors: (Constant), servquality, satisfaction
b. Dependent Variable: PurchaseLoyalty
Table 5- Coefficients table for Service Quality, Satisfaction (IV) towards Purchase Loyalty (DV)
Coefficientsa
Model
Unstandardized Coefficients Standardized
Coefficients t Sig. B Std. Error Beta
1 (Constant) .938 .836 1.123 .266
satisfaction .219 .120 .197 1.829 .072
servquality .580 .123 .508 4.715 .000
a. Dependent Variable: PurchaseLoyalty
23
Effects of Gender
In an ANOVA test with gender (independent variables) and measurement scales
(dependent variable), there were no significant effects (p >.06), which confirms that
perceptions of and behaviors toward coffee shop environments are not influenced by
gender.
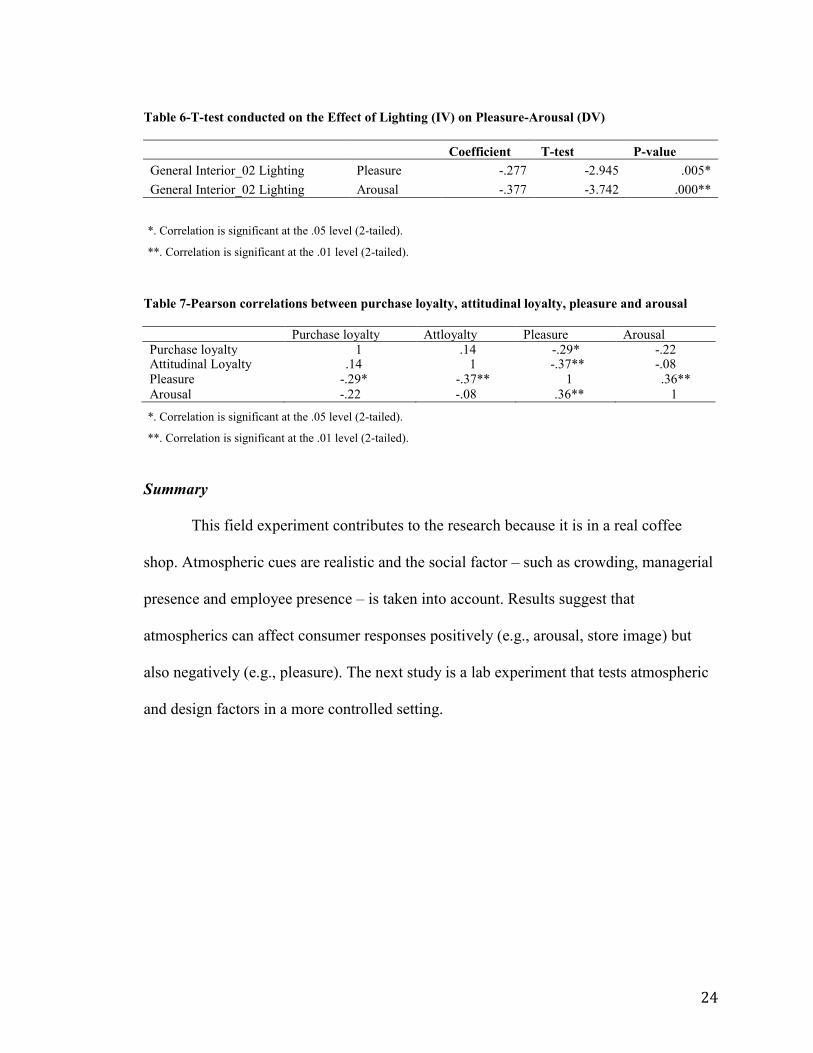
Additional Analyses
Developing in-store lighting as part of the store’s atmospherics aids in attracting
and retaining consumer patronage (Summers and Hebert 2001). Since lighting affects
people’s behavior in particular environments, lighting effects on pleasure and arousal
were examined. Summers and Hebert (2001) state, ― brightly lit rooms are more arousing
than dimly lit ones‖ (p.146). In the context of this research, t-tests confirm that pleasure
and arousal are affected by lighting. Pleasure and Arousal are negatively affected by
lighting. When consumers dislike the lighting, this decreases their pleasure (b=-.28) and
arousal (b=-.38; Table 6). When pleasure and arousal are affected, they in turn influence
purchase loyalty and attitudinal loyalty decisions: Pleasure is negatively correlated with
both purchase loyalty and attitudinal loyalty, but arousal is not (Table 7).
24
Table 6-T-test conducted on the Effect of Lighting (IV) on Pleasure-Arousal (DV)
Coefficient T-test P-value
General Interior_02 Lighting Pleasure -.277 -2.945 .005*
General Interior_02 Lighting Arousal -.377 -3.742 .000**
*. Correlation is significant at the .05 level (2-tailed).
**. Correlation is significant at the .01 level (2-tailed).
Table 7-Pearson correlations between purchase loyalty, attitudinal loyalty, pleasure and arousal
Purchase loyalty Attloyalty Pleasure Arousal Purchase loyalty 1 .14 -.29* -.22 Attitudinal Loyalty .14 1 -.37** -.08 Pleasure -.29* -.37** 1 .36**
Arousal -.22 -.08 .36** 1
*. Correlation is significant at the .05 level (2-tailed).
**. Correlation is significant at the .01 level (2-tailed).
Summary
This field experiment contributes to the research because it is in a real coffee
shop. Atmospheric cues are realistic and the social factor – such as crowding, managerial
presence and employee presence – is taken into account. Results suggest that
atmospherics can affect consumer responses positively (e.g., arousal, store image) but
also negatively (e.g., pleasure). The next study is a lab experiment that tests atmospheric
and design factors in a more controlled setting.
25
Phase III - Laboratory Experiment
The laboratory experiment seeks to evaluate customers’ emotions and
perceptions of the store under controlled conditions. For this purpose, virtual coffee shops
were designed that allowed consumers to navigate through one of two coffee shop
models that differed in terms of atmospheric cues.
Research Methodology
Sample
This experiment was a one-factor (virtual coffee shop design model: Samantha,
James) between-participants computer-based design. A sample of 123 participants
(68.3% students and 30.1% full-time workers) completed the questionnaire online. The
participants were recruited by email and classroom announcements. Emails were
recorded into a database and then distributed evenly across the two coffee shop design
models James and Samantha through website links (www.modeljames.cjb.net and
www.modelsamantha.cjb.net). Both websites were isolated and could not be found by
random Internet search. Participants were asked to view a short video, and to then answer
the questionnaire about their experience in the respective virtual coffee shop.
Questionnaire
The questionnaire was created in English and implemented as an online survey
using the Limesurvey survey software. The survey was administered through a server
located at the John Molson School of Business.
26
Study Procedure
The study was created in a format of virtual animation using an interior design
program. It integrated atmospherics elements used by the ten coffee shops visited in the
interview phase into both models. The design also took into account changes that
managers wish to make. Design items such as furniture selection and colors (tall or low
tables, yellow sofas), store layout (bar upfront, sofas in the back), wall colors, lighting
choices, decorations, music integration, and window displays, were all concerns brought
up by managers in the interviews. Model James and Model Samantha both show
similarities but also obvious differences, as shown in APPENDIX B. Overall, Model
Samantha reflected a more traditional design inspired by the pre-renovation Pekarna
setup, while Model James appeared more contemporary and was designed taking some of
the planned Pekarna renovations into consideration.
Music was replaced by recorded noise at a real coffee shop to increase realism of
the experimental manipulations. Background noise was then edited to fit with character
navigation. For example, when the character passes by the bar, a customer ordering
coffee can be heard. When the character leaves the coffee shop, the sound of a closing
door is present. Likewise, the volume was adjusted during the visit to the bathroom, and
the opening and closing of the doors.
In the virtual coffee shop clip, the navigation walks participants through the
coffee shop at four different times of the day, early morning (9:00-9:30), mid day (12:30-
12:00), late afternoon (18:00) and evening (22:00). The lighting is therefore adjusted with
the sun position. The virtual coffee shop customers, foods, and beverages were also
dynamic in order to create a realistic environment.
27
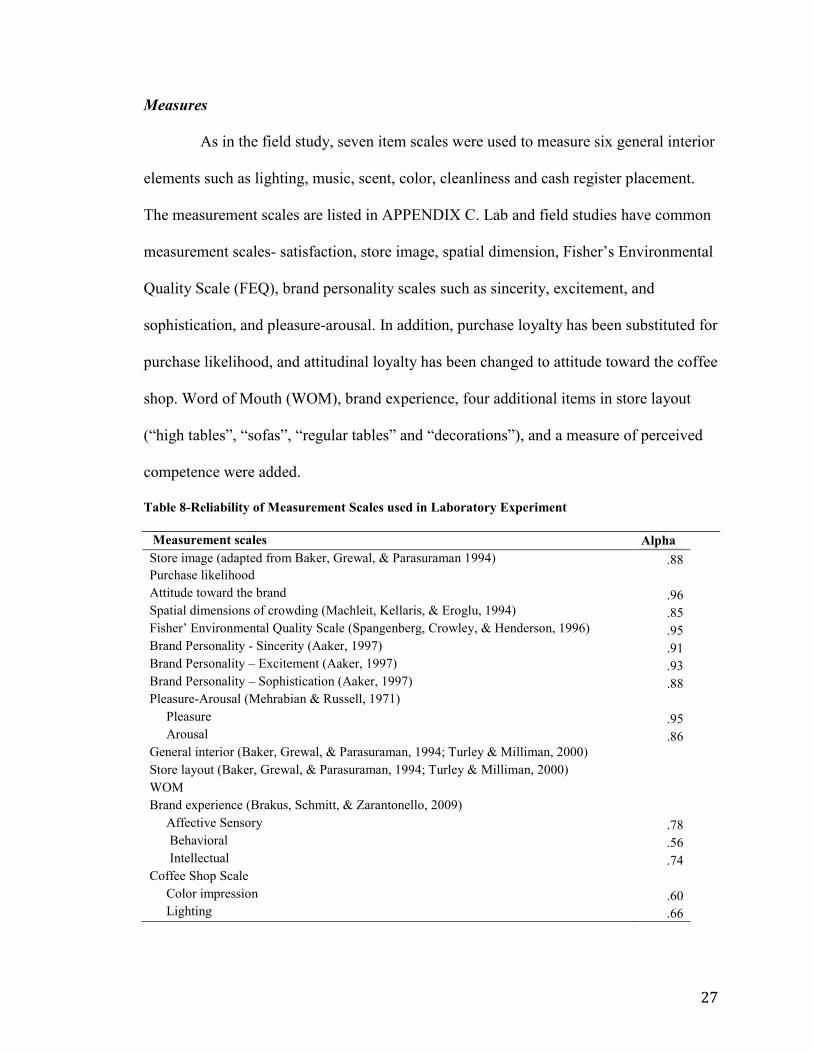
Measures
As in the field study, seven item scales were used to measure six general interior
elements such as lighting, music, scent, color, cleanliness and cash register placement.
The measurement scales are listed in APPENDIX C. Lab and field studies have common
measurement scales- satisfaction, store image, spatial dimension, Fisher’s Environmental
Quality Scale (FEQ), brand personality scales such as sincerity, excitement, and
sophistication, and pleasure-arousal. In addition, purchase loyalty has been substituted for
purchase likelihood, and attitudinal loyalty has been changed to attitude toward the coffee
shop. Word of Mouth (WOM), brand experience, four additional items in store layout
(―high tables‖, ―sofas‖, ―regular tables‖ and ―decorations‖), and a measure of perceived
competence were added.
Table 8-Reliability of Measurement Scales used in Laboratory Experiment
Measurement scales
Alpha
Store image (adapted from Baker, Grewal, & Parasuraman 1994)
.88
Purchase likelihood
Attitude toward the brand
.96
Spatial dimensions of crowding (Machleit, Kellaris, & Eroglu, 1994)
.85
Fisher’ Environmental Quality Scale (Spangenberg, Crowley, & Henderson, 1996)
.95
Brand Personality - Sincerity (Aaker, 1997)
.91
Brand Personality – Excitement (Aaker, 1997)
.93
Brand Personality – Sophistication (Aaker, 1997)
.88
Pleasure-Arousal (Mehrabian & Russell, 1971)
Pleasure
.95
Arousal
.86
General interior (Baker, Grewal, & Parasuraman, 1994; Turley & Milliman, 2000)
Store layout (Baker, Grewal, & Parasuraman, 1994; Turley & Milliman, 2000)
WOM
Brand experience (Brakus, Schmitt, & Zarantonello, 2009)
Affective Sensory
.78
Behavioral
.56
Intellectual
.74
Coffee Shop Scale
Color impression
.60
Lighting
.66
28
All measurements taken from the literature are reliable (alpha > .70) (Table 8),
with the exception of brand experience behavioral alpha=.56.
Besides the scales used from the literature, four sets of measurement items were
created to adapt to the coffee shop scenario. These consisted of 7 point descriptive
adjective scale (1=not descriptive at all and 7=extremely descriptive) including eleven
items (i.e., imperfect, clinical, clean, inviting, calming, ordered, unified, coordinated,
diverse, intricate and complex) to understand coffee shop experiences better. This set of
questions was followed by an eight-question set of importance ratings of promotions,
prices, consistency in store, novelty, consistency in menu, novelty in menu. Willingness
to pay for a small size filtered coffee and for a small size specialty coffee was also
measured to assess consumers’ price expectations as a function of atmospheric cues.
Finally, consumers’ perceptions of lighting and color were measured on a seven-point
eight-item Likert scale (e.g., ―the colors are modern‖, ―the colors seem light‖).
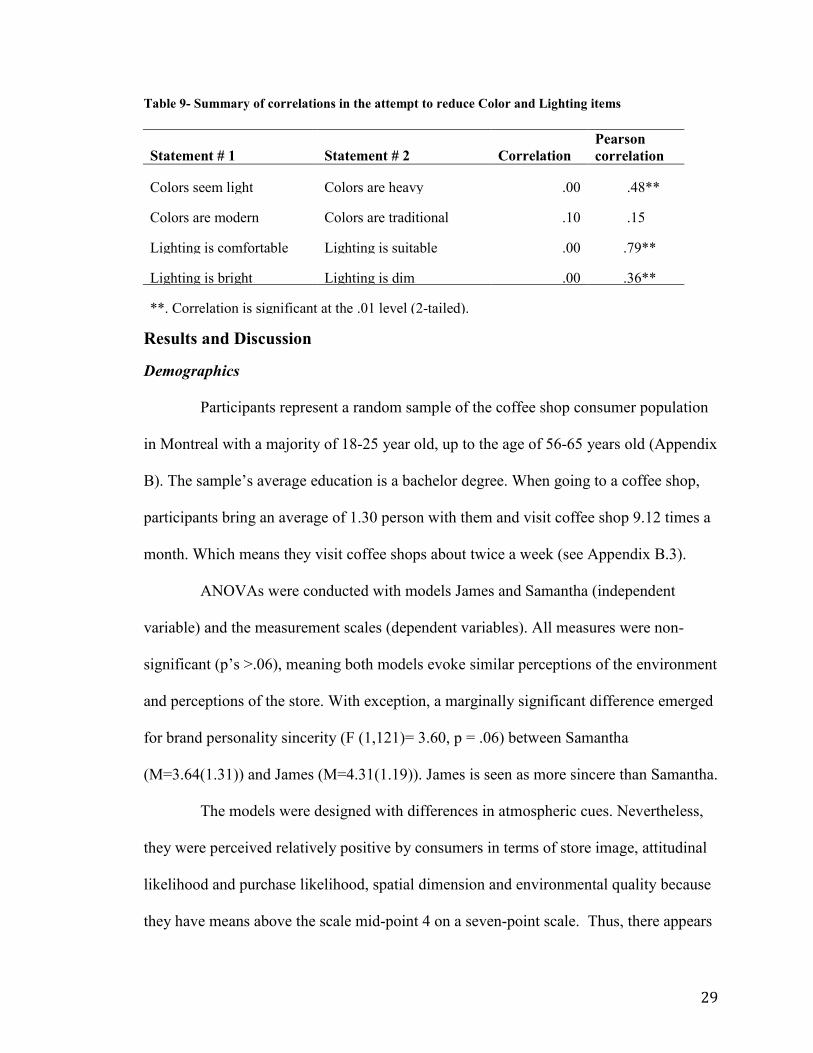
After recoding ―the colors are heavy‖ and ―the colors are traditional‖, we
related the colors that are heavy (recoded) with the colors that seem light. A correlation
between the 2 statements was significant. The colors are modern and the colors are
traditional (recoded) did not however yield a correlation with each other. Similarly, ―the
lighting is comfortable‖ and ―the lighting is suitable to what I want to do in the coffee
shop‖ as well as ―the lighting is dim‖ (recoded) and ―the lighting is bright‖ are combined.
Both yield correlation between items. Table 9 shows a summary of the correlations
obtained.
29
Table 9- Summary of correlations in the attempt to reduce Color and Lighting items
Statement # 1 Statement # 2 Correlation
Pearson
correlation
Colors seem light Colors are heavy .00 .48** Colors are modern Colors are traditional .10 .15 Lighting is comfortable Lighting is suitable .00 .79** Lighting is bright Lighting is dim .00 .36** **. Correlation is significant at the .01 level (2-tailed).
Results and Discussion
Demographics
Participants represent a random sample of the coffee shop consumer population
in Montreal with a majority of 18-25 year old, up to the age of 56-65 years old (Appendix
B). The sample’s average education is a bachelor degree. When going to a coffee shop,
participants bring an average of 1.30 person with them and visit coffee shop 9.12 times a
month. Which means they visit coffee shops about twice a week (see Appendix B.3).
ANOVAs were conducted with models James and Samantha (independent
variable) and the measurement scales (dependent variables). All measures were non-
significant (p’s >.06), meaning both models evoke similar perceptions of the environment
and perceptions of the store. With exception, a marginally significant difference emerged
for brand personality sincerity (F (1,121)= 3.60, p = .06) between Samantha
(M=3.64(1.31)) and James (M=4.31(1.19)). James is seen as more sincere than Samantha.
The models were designed with differences in atmospheric cues. Nevertheless,
they were perceived relatively positive by consumers in terms of store image, attitudinal
likelihood and purchase likelihood, spatial dimension and environmental quality because
they have means above the scale mid-point 4 on a seven-point scale. Thus, there appears
30
to be a certain range of atmospheric elements that can result in high levels of positive
emotions and store image perceptions.
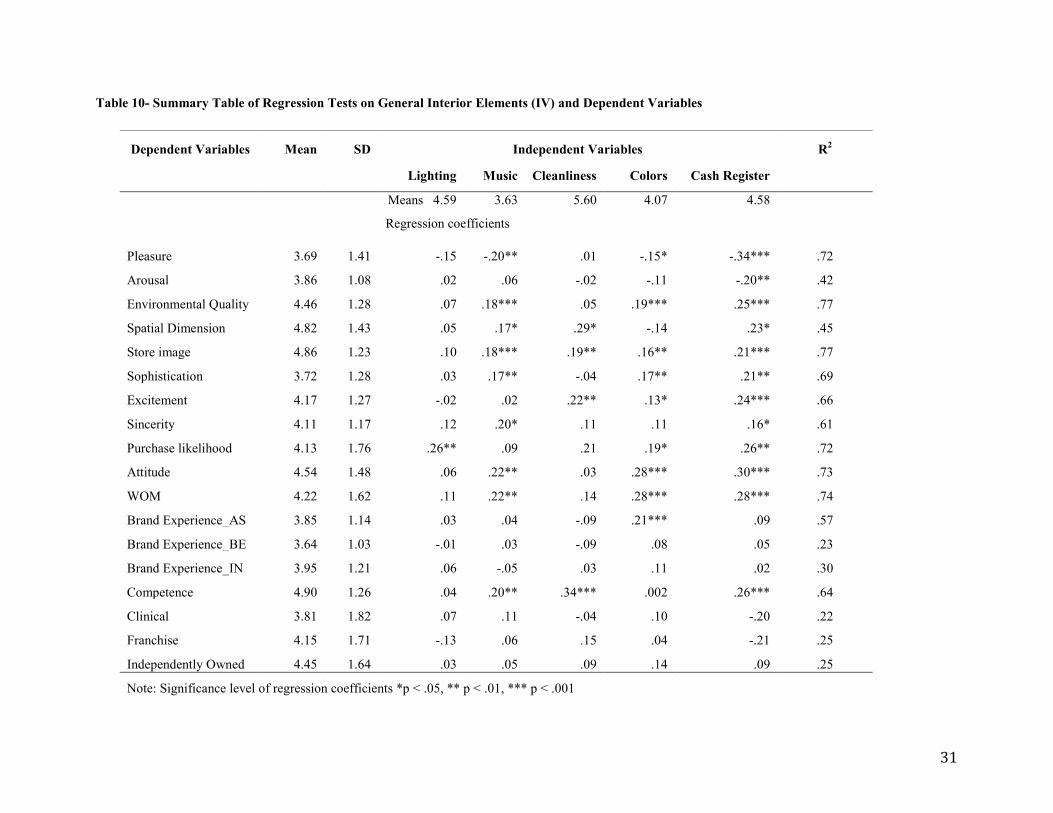
In a second phase of the analysis, regressions were run across both models with
general interior items serving as the independent variables, and emotions, attitudes, and
perceptions as the dependent variables. Means and regression results are summarized in
Table 10. Perceptions of interior elements significantly influenced most dependent
variables, with the exception of brand experience behavioral and brand experience
intellectual. The six interior elements were tested with perceived competence, customers’
perception of the store being clinical, franchise, and independently owned for managerial
relevance. Accordingly, interior elements affect the perceived competence of the coffee
shop (F(1,121)=16.12, p =.00). Although, based on atmospheric cues, customers do not
evaluate a certain model as a franchise (F (1,121)=1.30, p =.26) or an independently
owned shop (F(1,121)=1.28, p =.27) solely based on general interior components.
Impact of Coffee Shop Model Names
One of the issues observed was that identifying model James and model Samantha
with gender oriented names may have influenced the perceptions of the store among male
and female participants. To rule out this possibility, a MANOVA was conducted to see
whether there is an interaction between the dependent variables and model and gender.
The results state no name × gender interaction (p = .66).
31
Table 10- Summary Table of Regression Tests on General Interior Elements (IV) and Dependent Variables
Dependent Variables Mean SD Independent Variables R
2
Lighting Music Cleanliness Colors Cash Register
Means 4.59 3.63 5.60 4.07 4.58
Regression coefficients
Pleasure 3.69 1.41 -.15 -.20** .01 -.15* -.34*** .72
Arousal 3.86 1.08 .02 .06 -.02 -.11 -.20** .42
Environmental Quality 4.46 1.28 .07 .18*** .05 .19*** .25*** .77
Spatial Dimension 4.82 1.43 .05 .17* .29* -.14 .23* .45
Store image 4.86 1.23 .10 .18*** .19** .16** .21*** .77
Sophistication 3.72 1.28 .03 .17** -.04 .17** .21** .69
Excitement 4.17 1.27 -.02 .02 .22** .13* .24*** .66
Sincerity 4.11 1.17 .12 .20* .11 .11 .16* .61
Purchase likelihood 4.13 1.76 .26** .09 .21 .19* .26** .72
Attitude 4.54 1.48 .06 .22** .03 .28*** .30*** .73
WOM 4.22 1.62 .11 .22** .14 .28*** .28*** .74
Brand Experience_AS 3.85 1.14 .03 .04 -.09 .21*** .09 .57
Brand Experience_BE 3.64 1.03 -.01 .03 -.09 .08 .05 .23
Brand Experience_IN 3.95 1.21 .06 -.05 .03 .11 .02 .30
Competence 4.90 1.26 .04 .20** .34*** .002 .26*** .64
Clinical 3.81 1.82 .07 .11 -.04 .10 -.20 .22
Franchise 4.15 1.71 -.13 .06 .15 .04 -.21 .25
Independently Owned 4.45 1.64 .03 .05 .09 .14 .09 .25
Note: Significance level of regression coefficients *p < .05, ** p < .01, *** p < .001
32
Impact of Design Color
A test was also conducted to see whether there was a difference in color
perceptions between the two models. As expected, the models differed in terms of color
perceptions; James is considered to be more modern than Samantha (F (1, 121) = 10.62, p
< .001).
Competence of Franchise or Independently Owned Coffee Shops
When a customer believes the coffee shop is a franchise or independently
owned based on interior elements, how does this affect their competence
perceptions? A median split was used for franchise perception (Median = 4.00, Mlow
=2.74, Mhigh = 5.77, t(121) = -21.050, p=.00 ) and the independently owned shop
perceptions (Median = 5.00, Mlow = 3.52 , Mhigh = 6.11 , t(121) = -12.82 , p=.00). The
results showed that coffee shops perceived to be independently owned are
perceived as more competent (Mstrong perceptions of independent ownership = 5.27 (1.04), Mweak
perceptions of independent ownership = 4.70 (1.32); t (121)= -2.489,p =.014). Consumer’s belief
that the coffee shop is a franchise does not affect their perception of the coffee
shop’s competence (t (121)= -1.234,p =.22).
Coffee Shop Models and Competence of the Store
The two models (James and Samantha) were compared with regard to beliefs of
the coffee shop as an independently owned (F (1,121)=.19, p = .66) or franchise
(F(1,121)=1.39, p = .24). No significant difference emerged. General interior design does
not determine whether a store is perceived as independently owned or a franchise.
33
Store Image and Competence of the Store
Baumgarten and Hensel (1987) conducted a study where patients who did not
have prior knowledge of a physician’s reputation appeared to depend on tangible
attributes (the physician’s office) to evaluate the physician’s competence. This thesis
therefore explored whether consumers’ perceptions of store image increases their
perception of the coffee shop’s competence. A linear regression showed a positive
association between store image and the perceived competency of the store (b = .68, t
(121) = 9.84, p =. 00; R2 = .44).
Pricing expectations might change when a customer perceives a store to be
independently owned or a franchise. Participants indicate that they are willing to buy a
regular small size coffee for the cost of 1.85$ and an espresso based drink for 3.26$. No
significant differences in prices were found for customers who perceived the models to
be independently owned or a franchise.
Summary
The lab experiment tests the effects of atmospheric factors in a controlled context,
using virtual coffee shop models. This approach allows for a change in different
atmospheric cues (e.g., lighting, wall colors, music) across experimental conditions. This
experiment showed that the selected atmospherics cues influence consumer responses
relatively positively. This experiment also allowed researchers to demonstrate that
consumers perceive coffee shops as more competent if they believe they are
independently owned.
34
General Discussion
This thesis contributes to the emerging literature on the effects of multiple
atmospheric cues by considering multi-sensory atmospheric effects in a coffee shop
context, using a multi-method approach (interviews, field study, and lab experiment).
The interviews with coffee shop managers generated many pertinent ideas and
concerns about the use of multiple atmospheric cues. The interview sample consisted of
five independent and five-franchise/large corporations. Interestingly, both independently
owned and large corporation seek customers with an experience that is luxurious,
comfortable or inviting. Large corporations have access to customized promotional
material and financial support. Although they are restricted by strict protocols that
support standardization, franchises and large corporations managers are provided with
guidelines to make profit oriented changes. On the other hand, independent coffee shops
have the flexibility to change music choices, lighting, colors, and scent according to their
customers. However, they may increase their risks of failing by making modifications
that are not carefully researched. Although independently owned coffee shops wish to
become larger, they do not feel the need to mimic existing larger corporations.
Both field and lab experiments have yield significant results in common
measurement scales (e.g., pleasure, arousal, environmental quality, satisfaction, store
image, sophistication, excitement and sincerity) used in the questionnaires. Therefore
Pekarna coffee shop, James and Samantha have similar coffee shop environment
exposure.
35
Differences between Field and Lab Studies
The field study conducted at Pekarna coffee shop indicates that pleasure,
arousal, environment quality, merchandise quality, store image, brand personality
sophistication, excitement and sincerity are influenced by general interior elements
provided. While spatial dimension did not have a significant effect on consumer
responses in the field study, it did in the laboratory experiment. In addition, purchase
likelihood, attitudinal likelihood, word of mouth, brand experience affective and sensory
are also influenced by general interior design elements in the lab experiment (but not in
the field survey).
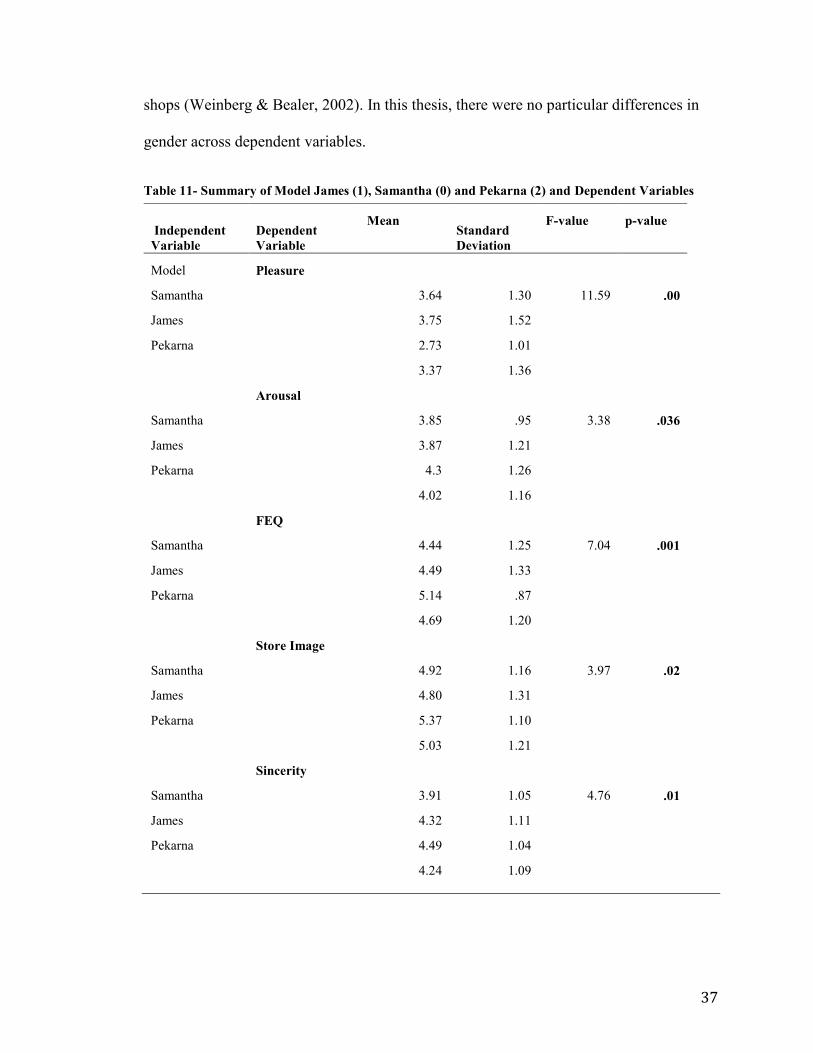
Moreover, customers’ experience change when human variables are considered
as part of coffee shop atmospherics. The field study reflects different perceptions
compared to the lab experiment. When comparing the two virtual and the real coffee shop
(Model James, Model Samantha, and Pekarna), Pekarna yields a higher mean for arousal,
environmental quality, store image, sophistication, and sincerity. These measurements are
therefore more important when customers are exposed in a real setting and consequently
tests for internal and external validity of the project (Table 11).
Differences between Virtual Coffee Shops
Although both models had similarities and influenced customers equally, certain
key differences were shown. Through color manipulation James is perceived as more
modern than Samantha. Overall, general interior elements of James created a difference
in the perceived sincerity of both models. James is seen as more sincere than Samantha.
Although both are acceptable designs, they also have controllable components that can
alter the perception of customers towards the store.
36
Researchers as well as managers can use the six general interior elements
(lighting, music, scent, color, cash register placement and cleanliness) to modify the level
of pleasure, arousal, environment quality, store image and sincerity in a coffee shop.
Other variables are also relevant but may be better influenced with additional
atmospheric variables. No differences emerged with regard to perceptions of a store
being clinical, franchise, or independently owned based on its atmospheric design.
Competence
Furthermore, when customers rate the environment as having a good store
image, it positively influences the perceive competence of the store. When a customer
believes the store is independently owned, they expect a higher level of competency.
Although when they believe the store is a large corporation, it does not affect their
perceived competence of the shop.
In 2010, E-imports reports an espresso based drink is US$2.45 and for a brewed
coffee is US$1.38. In this project, different expected price ranges are found for
downtown Montreal in the year 2011. On average, customers wish to pay $1.85 for
filtered coffee and $3.26 for espresso-based drinks (E-imports, 2010). Using such
information can help managers adjust prices to maximize profit without overcharging
which may cause customers to leave.
Demographics
Similar in lab and field studies, the average times consumers visited a coffee
shop is 9.71 (field) and 9.12 (lab). Also, more women participated in both studies,
because women metabolize caffeine quicker, it may explain greater attendance in coffee
37
shops (Weinberg & Bealer, 2002). In this thesis, there were no particular differences in
gender across dependent variables.
Table 11- Summary of Model James (1), Samantha (0) and Pekarna (2) and Dependent Variables
Independent
Variable
Dependent
Variable
Mean Standard
Deviation
F-value p-value
Model Pleasure
Samantha 3.64 1.30 11.59 .00
James 3.75 1.52
Pekarna 2.73 1.01
3.37 1.36
Arousal
Samantha 3.85 .95 3.38 .036
James 3.87 1.21
Pekarna 4.3 1.26
4.02 1.16
FEQ
Samantha 4.44 1.25 7.04 .001
James 4.49 1.33
Pekarna 5.14 .87
4.69 1.20
Store Image
Samantha 4.92 1.16 3.97 .02
James 4.80 1.31
Pekarna 5.37 1.10
5.03 1.21
Sincerity
Samantha 3.91 1.05 4.76 .01
James 4.32 1.11
Pekarna 4.49 1.04
4.24 1.09
38
Contribution
Managerial Implications
This project’s most important contribution is to provide an examination of the
joint effects of multiple atmospheric elements. Also, this research concentrates on one
type of retail store (coffee shops) and takes into account both managerial and consumer
perspectives, both in laboratory and field settings. Retail management can create
atmospheres to induce consumers to behave in certain manners (Smith & Curnow, 1966).
Formalized Decisions
As stated by Turley and Milliman (2000), retailers still make arbitrary decisions
about the environments they create. These authors feel a need for managers to become
more formalized in their decision making especially medium and smaller retailers. This
project contributes in interviewing a sample of managers both independently owned and
large corporations. Previous research has not explicitly examined the views and
constraints of managers in these two types of retail stores, even though supermarkets,
specialty stores are studied (Vida, 2008). Sharing their thoughts with other managers is
the start of providing more generalized ideas about coffee shop atmospherics guiding
them in decisions making.
Independent Stores and Franchises
Independent store managers feel they cannot establish a desired atmosphere
similar to chain and large corporations because of financial restrictions. Consequently,
independently owned coffee shops are forced to develop economical atmospheric design
techniques. For example, managers use black boards and liquid chalk as menu displays,
they use ipods to create music compilations and customize their brand products by
39
stamping their logo onto regular white cups, while others use student paintings to create
an exhibition style coffee shop. As a result, independently owned coffee shops become
more artistic and unique. Additionally, large corporations who have access to a better
budget use similar techniques. For example, one of the most successful corporations also
uses black board as menu displays. However, this research shows that general interior
elements do not tell whether a coffee shop is a franchise or an independently owned
coffee shop. However, when customers believe the coffee shop is independently owned,
they perceive a higher level of competence. Managers who wish to highlight that their
coffee shop is independently owned need to use additional cues (other than
atmospherics), such as logos, signage, or the statement ―independently owned‖ to
communication materials.
Reactions of Customers
As seen in lab and field studies, customers do not always analyze the details of
each atmospheric element, but they incorporate multiple atmospheric cues into their
perceptions. Although much detail was put into both models in the virtual simulation,
participants may not have noticed small differences (explained by the lack of significant
findings when comparing responses to both models), yet some perceptions of the coffee
shops were influenced (e.g., sincerity perceptions). Managers therefore gain a
competitive edge in improving customer’s coffee shop experience by choosing designs
carefully like the use of fluorescent lights near the bar and halogen lights at the tables
present in lab models. Sometimes, understated and subtle changes to the retail
environment are all that is required to change how shoppers behave inside a store (Turley
and Milliman 2000).
40
Potential of Coffee Shops Today and in the Future
Another managerial motivation is the future business potential of coffee shops.
Because consumer behavior has evolved, marketers have responded by integrating
restaurants and cafes into the retail mix (Sternquist, 2007). Developing an understanding
of coffee shop integration into different retail environments can be an extension to this
project. There is a consistent growth in combining different types of retail stores together,
and often consist of a coffee shops and other retail outlets. For example, Starbucks coffee
shops are present in Chapters bookstores, or Café Depot is often located next to a Couche
Tard convenience store. Therefore, coffee shops not only have their clientele to consider,
but can become part of other retail environments’ atmosphere creation.
Validity of the Models
When models James and Samantha were tested with consumers, both yielded
non-significant behavioral and emotional effects but were perceived relatively positively
by consumers. This finding provides managers with a repertoire of different but similarly
effective atmospheric models. In addition, given the difference in sincerity perceptions,
results suggest that altering atmospheric elements in a certain way can influence
consumers’ perceptions of the store.
Using the Program
The protocol of virtual simulations used in this project can be beneficial to
managers to lower their renovation risks by constructing a model with the changes they
wish to make and survey their customers. Doing so, will help coffee shops manager better
understand the needs of their customers, therefore increase customers satisfaction and
41
save time, effort and money by predicting what works and what does not before
attempting the real changes.
Tolerance of Customers and Feeling at Home
Customers feel at home when they are comfortable with the atmosphere of a
coffee shop. In the field experiment, it was obvious that customers notice wall defects,
lack of cleanliness, messy tables which are part of the atmosphere, but are willing to
tolerate imperfections to a certain extent. While many coffee shops focus on serving a
perfect, clean environment, it does sometimes lessen the communication between clients
and managers, making the environment less approachable. Customers are willing to offer
their opinion and contribute to making a coffee shop better when they are regulars. The
closer to home the customer feels about the environment, the more likely they will return.
A key suggestion to managers is to not only implement quick service, but also a
welcoming and honest environment.
Monotone Environment
It is important that managers create an exciting environment. Certain customers
tend to sit at the same place every time they visit; others like to experience different
locations of the coffee shop atmosphere. Increasingly, coffee shops create multi area
environments with tall tables to work, comfortable sofas to relax while offering
newspapers, and the coffee bar. Customers travel within the coffee shop depending their
mood on a particular day. Therefore, many atmospheric elements (lighting, music, scent,
layout) have to be designed to fit the purpose of clients. Some customers prefer open
spaces for friendly encounters, others like isolated areas to read books. The environment
needs to be accessible and comfortable for customers to move around.
42
Theoretical Implications
This project’s most important contribution is to provide an examination of the
interactive effects of multiple atmospheric elements. Also, to concentrate on one type of
retail store and take into account both managerial point of view through field interviews
and marketing literature in its experimental designs in controlled environment and
applied settings. In this section, theoretical implications regarding the contribution in
marketing literature and research methods will be discussed.
Store Exteriors
The laboratory study takes into account the exterior variable of the coffee shop.
This study was conducted in downtown Montreal for both field interview and field
survey. Therefore it is important to create a simulated downtown exterior for the
laboratory study. It fills the gap in considering exterior variable, which may influence
customer’s perception of the store (Turley & Milliman, 2000).
Confirmation of the Findings
The models James and Samantha took into account a combination of real coffee
shop layout for the purpose of validating the design choices. There is consistency
between field survey and lab experiment in demographics and common scales used. In
addition to Models James and Samantha, Pekarna was considered as a third model to the
research and were compared by ANOVA. Additional findings were therefore available
across lab and field studies.
Generalization
This research contributes by confirming marketing literature questions while
discovering the specific use of atmospheric elements in the coffee shop industry. For
43
example, general interior elements alone alter the perception of customers towards certain
aspects, like store image but less on others like pleasure and arousal.
With a focus in one particular store type, it brings direction to multi-sensory
atmospheric cues to be researched further. Certain aspect can be generalized towards all
retail contexts (e.g. color usage, music), while others are tailored specifically to coffee
shop industry (e.g., scent, layout, lighting) and cannot be applied to other retail settings
(e.g., scent of coffee).
Multi-Model Comparisons
Although little significance between the 2 models was found, its implication can
be debated. The models were similar enough to result in common and positively affecting
customer behavior, emotion and perception of the store. On the other hand, we have not
conducted a model different enough to alter the taste of customers, which is sometimes
subjective.
Experimental Control: Methodology Contribution
The laboratory experiment design was in the format of a virtual navigation
through a coffee shop. Within the video created, six atmospheric elements (e.g., music,
lighting, color, layout, time of the day as well as exterior variable) were controlled for.
Using an intuitive and economical interior design program such as Live interior 3D pro
can give researchers a control over many variables that is not seen with video and
photography. A simulated navigation can help marketing researchers develop imaginary
settings and change the lighting, colors, and layout very easily. In addition, this particular
program controls for the time of the day. Moreover, music was considered carefully by
recording noise, which added to the realism of the experiment. By editing the music with
44
Garage Band software gave researchers the ability to control for the shift of frequency of
the sound waves produced towards the character inside the coffee shop, which is not
considered when playing direct music.
A combination of different softwares can help create more realistic settings in
the context of a laboratory experiment. This method contributes in generating more
controlled environments for sensory research. In addition, the videos let participants
navigate the entire environment in the span of 2:30 minutes, therefore making laboratory
research more efficient and less tiring for participants. The goal of this research was to
concentrate on one specific context (i.e., coffee shops) to understand joint effects of
atmospheric cues through multiple research methods.
45
Limitations
Realism
Using virtual simulation does help with realism, however it still has many
limitations. Better software can create better graphics with more details. Three-
dimensional customer avatars were placed in the coffee shop environment, but they
stayed static throughout the character navigation. Animated customers with realistic faces
can affect results while adding a human variable to the simulation.
Scent
Scent was not tested in the lab experiment. While there is a lot of work that can
be done with olfactory cues in coffee shops (e.g., scent of freshly brewed coffee and
pastries), monitoring the level of coffee scent as low, medium, high and none in a
laboratory while participants are viewing the simulation should be done as a future
project. Scent can help in drawing customers into the store (Bone and Ellen, 1994) and
increase lingering time in stores (Lipman, 1990).
Sample
The recruited sample of the lab experiment was created by word of mouth,
which explains that the majority of participants was in the age category of 18-25.
However it can be argued that word of mouth is a realistic way of marketing for a coffee
shop.
46
Merchandise Quality
Merchandise quality was not tested in the laboratory setting. In future research,
more realistic simulations can be done such that customers will approach and evaluate a
virtual product.
Future Research Across Industry, across Countries
The same procedure can be developed for specific atmospheric models in
particular industries. This project focused on coffee shop industry because retails stores
are smaller, easier to control. Although, the same protocol can be used to access other
types of retail stores such as bakeries, yogurt shops, and other small size retail stores to
later expand towards larger retail stores in a virtual shopping experience. Future research
can be conducted in a different area of Montreal to be compared with downtown area of
Montreal.
A general limitation in this project is the presence of culture and geographic
position. As stated by managers, chain coffee shop adapt to different cultures in different
countries. Such that in America, the size of a coffee is particularly larger than the size of
a coffee served in Australia. In Asia, coffee shops sells full cakes, whereas in America,
coffee shops sell cake slices.
Store Layout
Layout was taken into account in the lab experiment, the layout was chosen
based on visited coffee shops and most common coffee shops designs such as having the
bar up front, comfortable couches in isolated areas, and tall tables in the front area of the

47
store. Future research can test for a change of layout by using simulation, and then
execute the changes in the field.
Pekarna Renovated
Due to time constraints, post- renovation phase of the field survey at Pekarna did
not occur. Future research has yet to evaluate the Pekarna coffee shop after renovation as
the manager have expressed the wish to change her burgundy, brown, Broadway styled
coffee shop into a purple, silver and white store. See APPENDIX E for the potential post-
renovation design.
Crowding
One of the main variables we did not take into account is the crowding as well as
the attire of employees. Future research, using an animated 3 dimensional moving avatars
to control for crowding and employees appearance can be possible. Details can be
adjusted even further, with the crowding level during each time of the day, the opening
and closing hours, and even show replicas of real life coffee shop employees.
Conclusion
This research has contributed both in managerial and theoretical fields. With the
application of different measurement scales used in marketing literature, multi-sensory
atmospheric elements selected in this project do affect customer behaviors, emotions and
perception of the store. The combination of multi-research methods with an exploratory
purpose creates a platform for managers to become more informed in their decision-
making when designing their coffee shops. This should lower business risks, where they
48
can mock desired atmospheric changes, survey customers, and understand the general
coffee shop trends in today’s society.
The comparison of both field and lab has come up with interesting results. While
the laboratory experiment often gave satisfactory and neutral results, the field survey has
heightened senses that push customer’s opinion more accurately. Although both virtual
models are different, it also showed that using atmospheric designs could alter customer
perception, in this research, the brand personality of a coffee shop. Yet, varying different
combinations of atmospheric cues can results in other effects.
This project contributes in advancing marketing literature by focusing on one
store type and therefore realizing certain measurements are better tailored to specific
types of store. Despite the fact that certain notions of scent, colors, music, layout, and
lighting can be generalized in different retail environments, certain uses of these
atmospherics elements are tailored specifically to the coffee shop industry (e.g., scent of
coffee and cookies). It also gives a lot of potential to expand in the field of multi-sensory
atmospheric cues, across countries in the same industry, across industry starting with
small and medium stores. Research methodology can also improve by using more
advance software, adding human crowding and scent variables. With consistent results
across field and lab experiments, this research is solid in manipulation, provides space to
expand and have results that are applicable in both industry and literature.
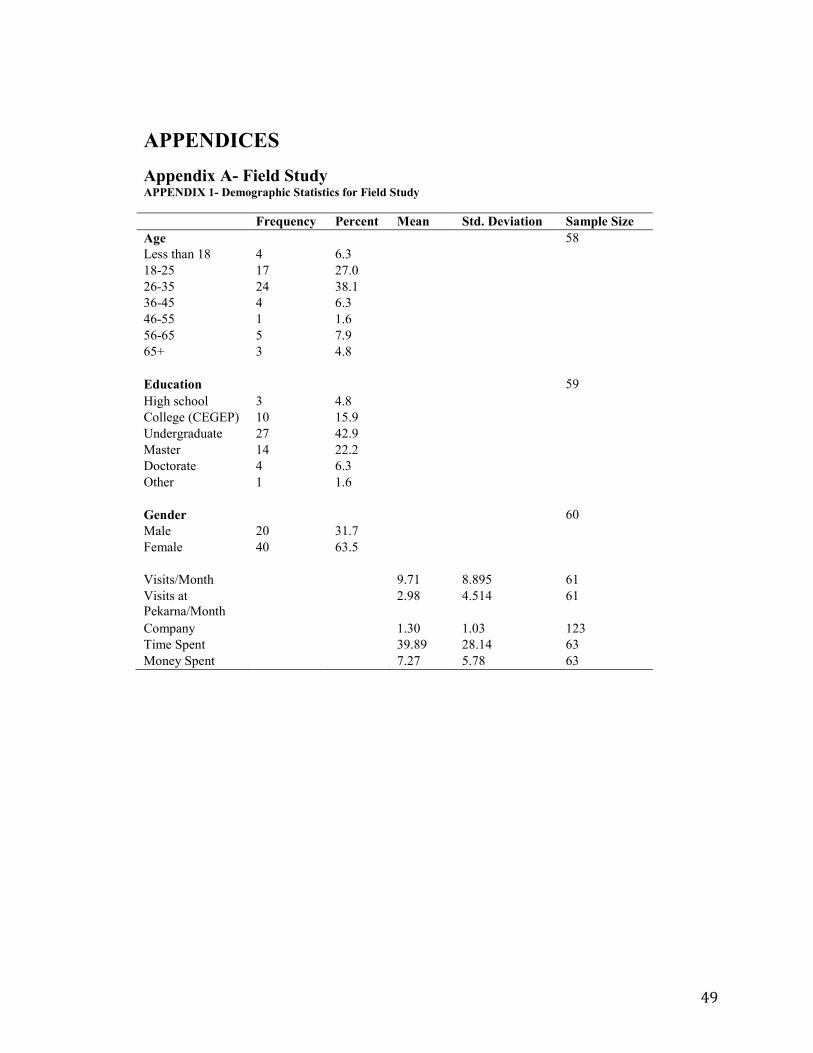
49
APPENDICES
Appendix A- Field Study APPENDIX 1- Demographic Statistics for Field Study
Frequency Percent Mean Std. Deviation Sample Size
Age 58
Less than 18 4 6.3
18-25 17 27.0
26-35 24 38.1
36-45 4 6.3
46-55 1 1.6
56-65 5 7.9
65+ 3 4.8
Education 59
High school 3 4.8
College (CEGEP) 10 15.9
Undergraduate 27 42.9
Master 14 22.2
Doctorate 4 6.3
Other 1 1.6
Gender 60
Male 20 31.7
Female 40 63.5
Visits/Month 9.71 8.895 61
Visits at
Pekarna/Month
2.98 4.514 61
Company 1.30 1.03 123
Time Spent 39.89 28.14 63
Money Spent 7.27 5.78 63
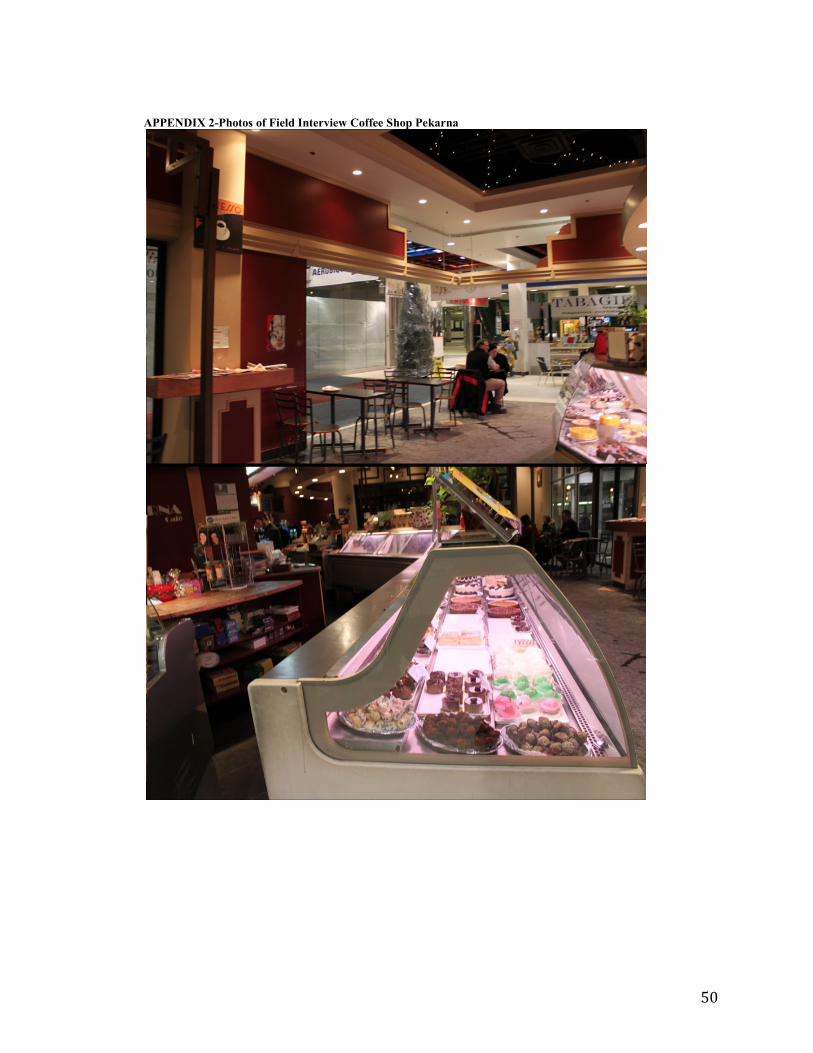
50
APPENDIX 2-Photos of Field Interview Coffee Shop Pekarna
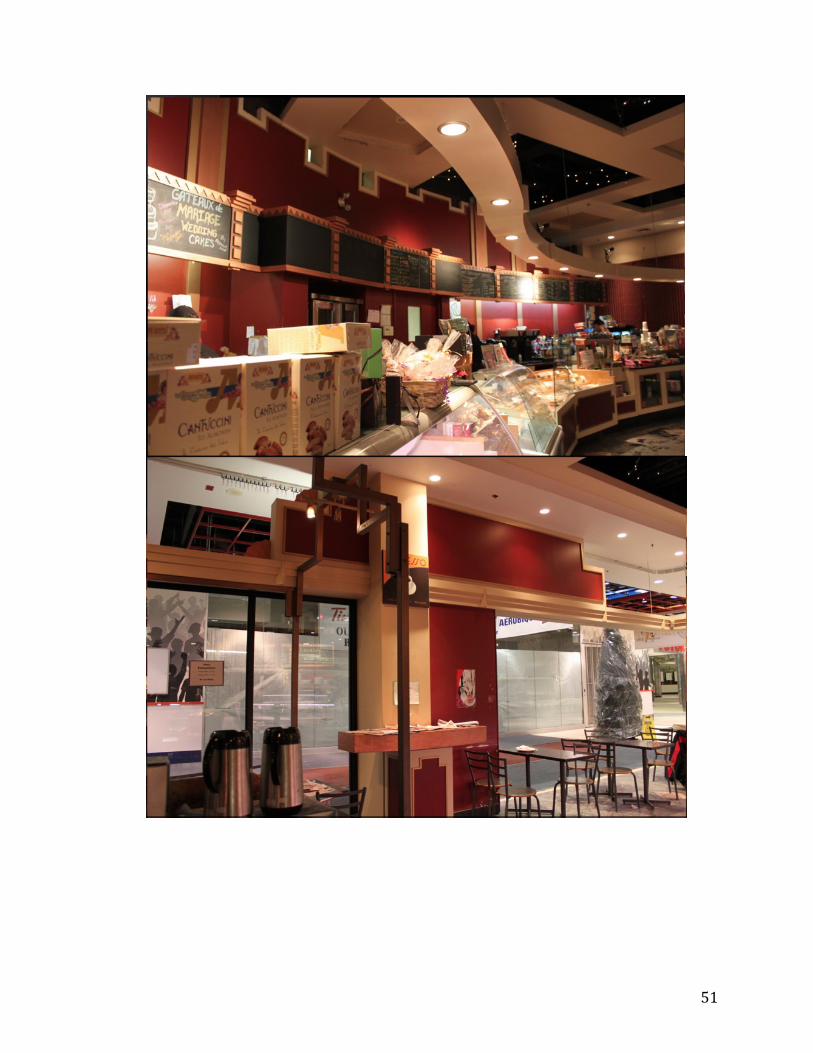
51
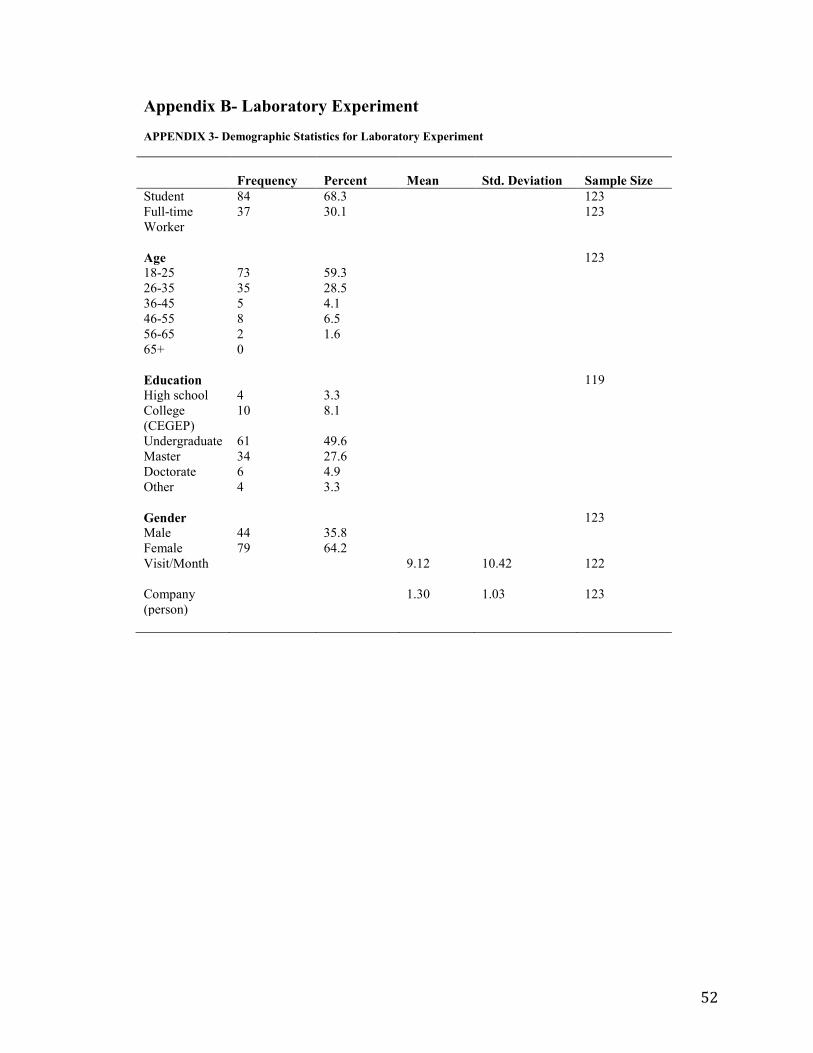
52
Appendix B- Laboratory Experiment
APPENDIX 3- Demographic Statistics for Laboratory Experiment
Frequency Percent Mean Std. Deviation Sample Size
Student 84 68.3 123
Full-time
Worker
37 30.1 123
Age 123
18-25 73 59.3
26-35 35 28.5
36-45 5 4.1
46-55 8 6.5
56-65 2 1.6
65+ 0
Education 119
High school 4 3.3
College
(CEGEP)
10 8.1
Undergraduate 61 49.6
Master 34 27.6
Doctorate 6 4.9
Other 4 3.3
Gender 123
Male 44 35.8
Female 79 64.2
Visit/Month 9.12 10.42 122
Company
(person)
1.30 1.03 123
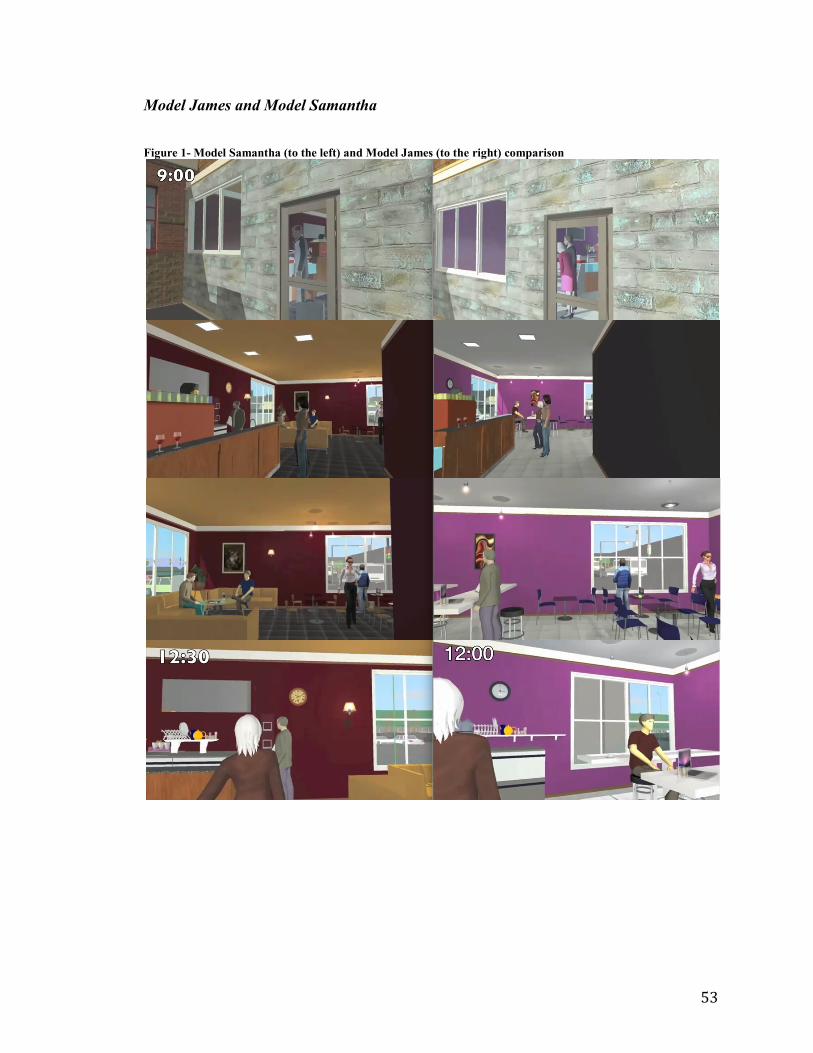
53
Model James and Model Samantha
Figure 1- Model Samantha (to the left) and Model James (to the right) comparison
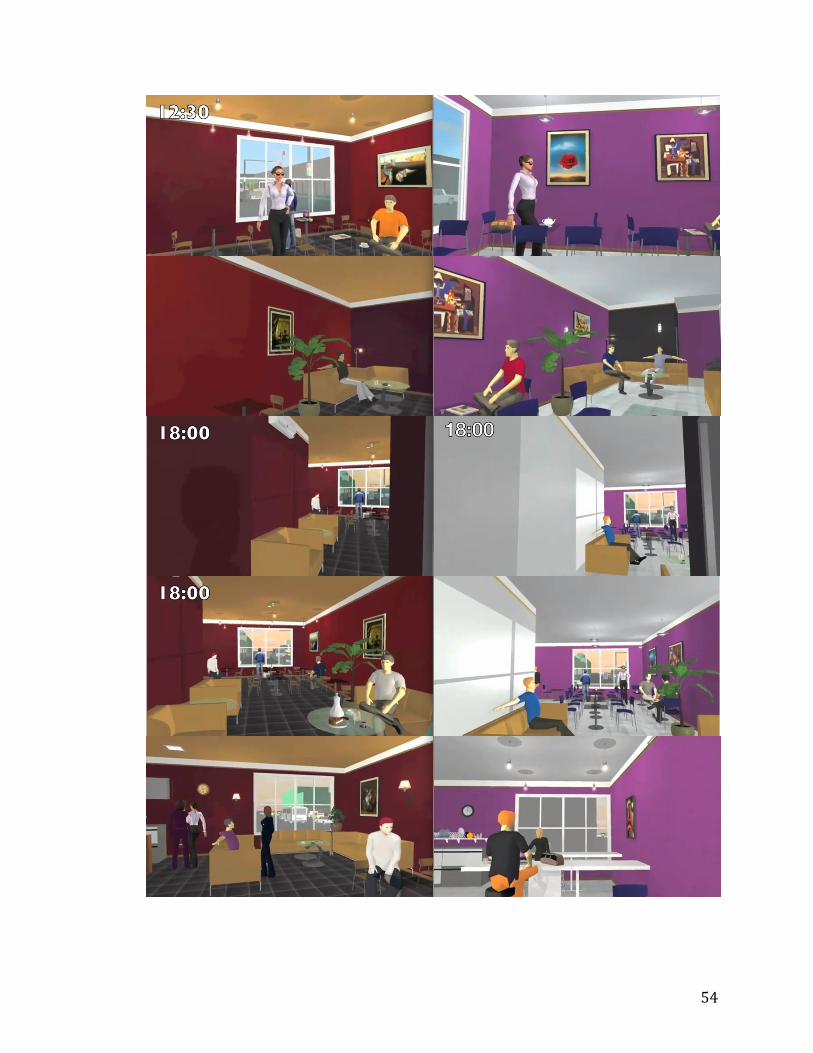
54
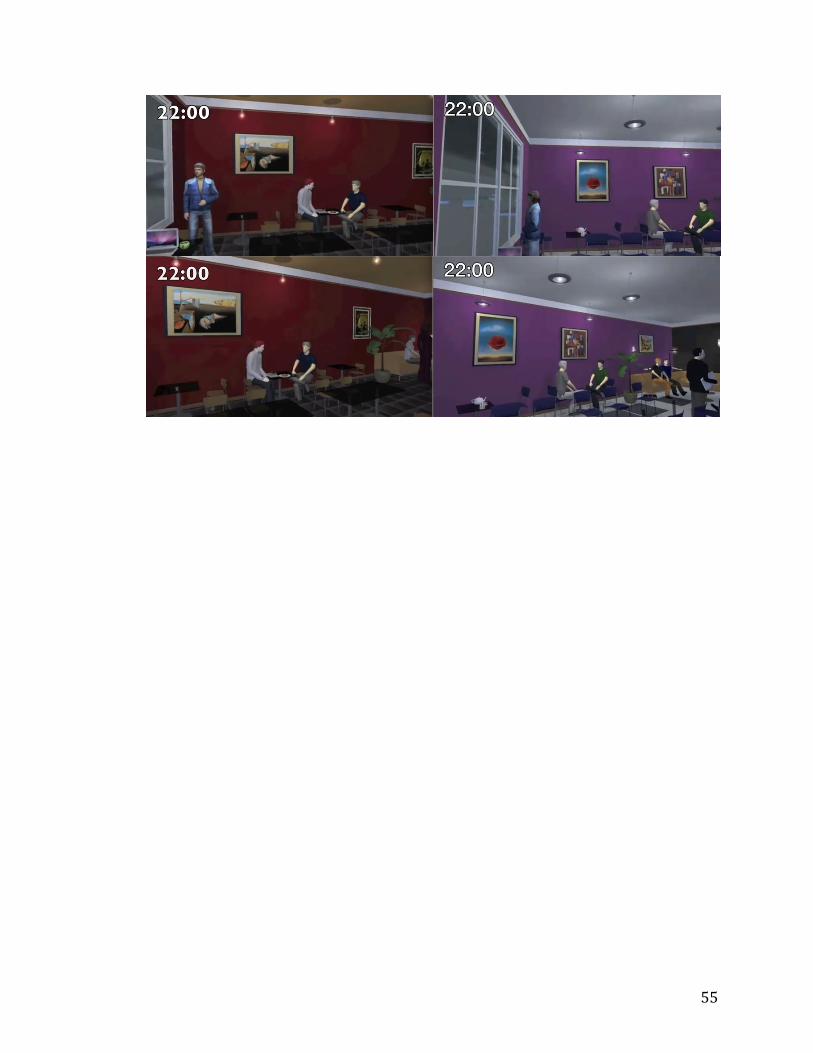
55
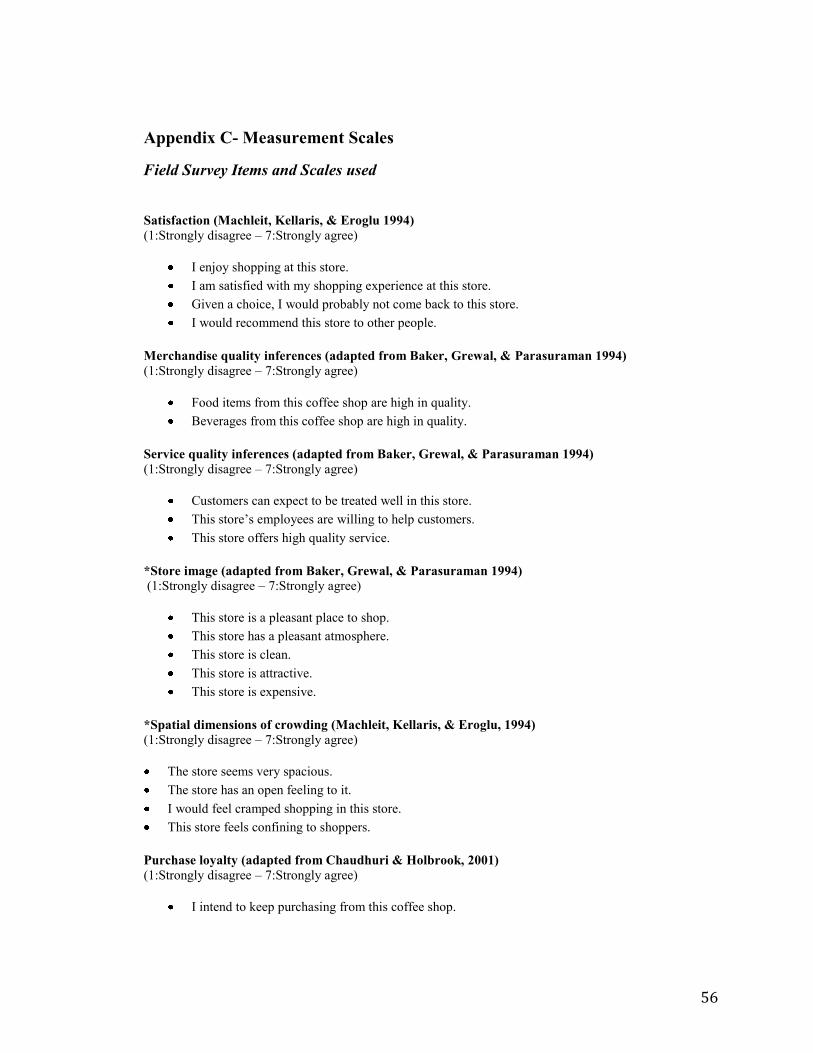
56
Appendix C- Measurement Scales
Field Survey Items and Scales used
Satisfaction (Machleit, Kellaris, & Eroglu 1994)
(1:Strongly disagree – 7:Strongly agree)
I enjoy shopping at this store.
I am satisfied with my shopping experience at this store.
Given a choice, I would probably not come back to this store.
I would recommend this store to other people.
Merchandise quality inferences (adapted from Baker, Grewal, & Parasuraman 1994)
(1:Strongly disagree – 7:Strongly agree)
Food items from this coffee shop are high in quality.
Beverages from this coffee shop are high in quality.
Service quality inferences (adapted from Baker, Grewal, & Parasuraman 1994)
(1:Strongly disagree – 7:Strongly agree)
Customers can expect to be treated well in this store.
This store’s employees are willing to help customers.
This store offers high quality service.
*Store image (adapted from Baker, Grewal, & Parasuraman 1994)
(1:Strongly disagree – 7:Strongly agree)
This store is a pleasant place to shop.
This store has a pleasant atmosphere.
This store is clean.
This store is attractive.
This store is expensive.
*Spatial dimensions of crowding (Machleit, Kellaris, & Eroglu, 1994)
(1:Strongly disagree – 7:Strongly agree)
The store seems very spacious.
The store has an open feeling to it.
I would feel cramped shopping in this store.
This store feels confining to shoppers.
Purchase loyalty (adapted from Chaudhuri & Holbrook, 2001)
(1:Strongly disagree – 7:Strongly agree)
I intend to keep purchasing from this coffee shop.
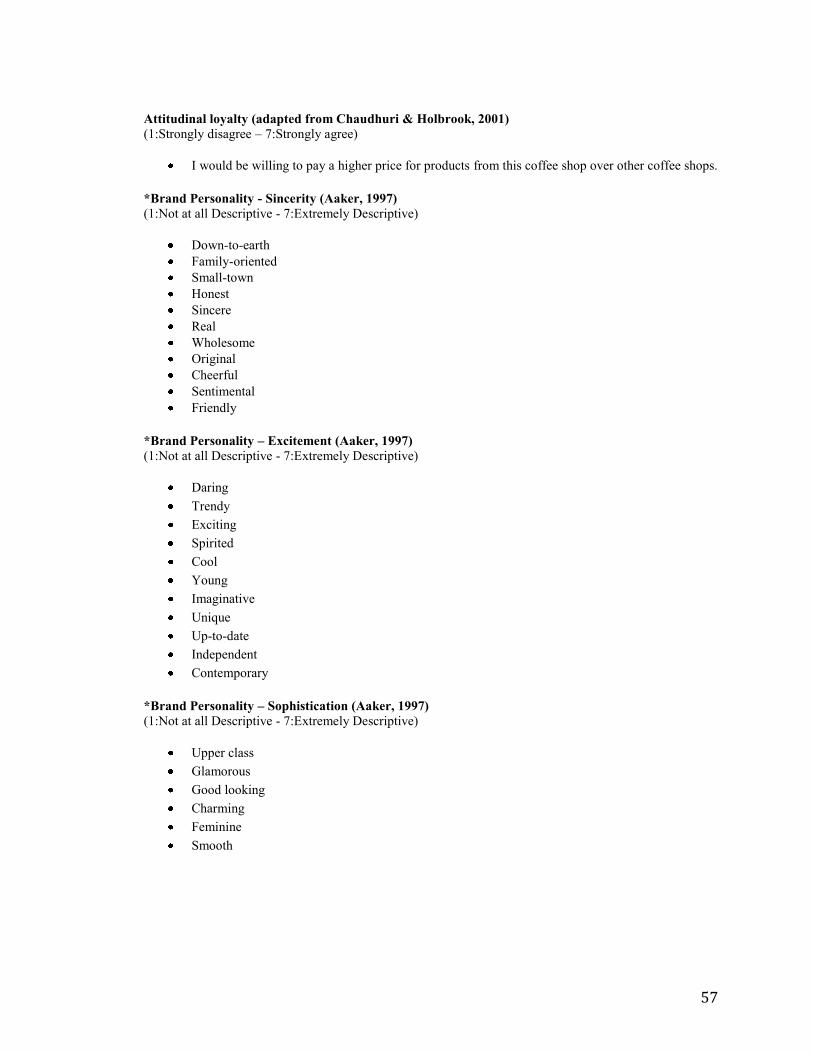
57
Attitudinal loyalty (adapted from Chaudhuri & Holbrook, 2001)
(1:Strongly disagree – 7:Strongly agree)
I would be willing to pay a higher price for products from this coffee shop over other coffee shops.
*Brand Personality - Sincerity (Aaker, 1997)
(1:Not at all Descriptive - 7:Extremely Descriptive)
Down-to-earth
Family-oriented
Small-town
Honest
Sincere
Real
Wholesome
Original
Cheerful
Sentimental
Friendly
*Brand Personality – Excitement (Aaker, 1997)
(1:Not at all Descriptive - 7:Extremely Descriptive)
Daring
Trendy
Exciting
Spirited
Cool
Young
Imaginative
Unique
Up-to-date
Independent
Contemporary
*Brand Personality – Sophistication (Aaker, 1997)
(1:Not at all Descriptive - 7:Extremely Descriptive)
Upper class
Glamorous
Good looking
Charming
Feminine
Smooth
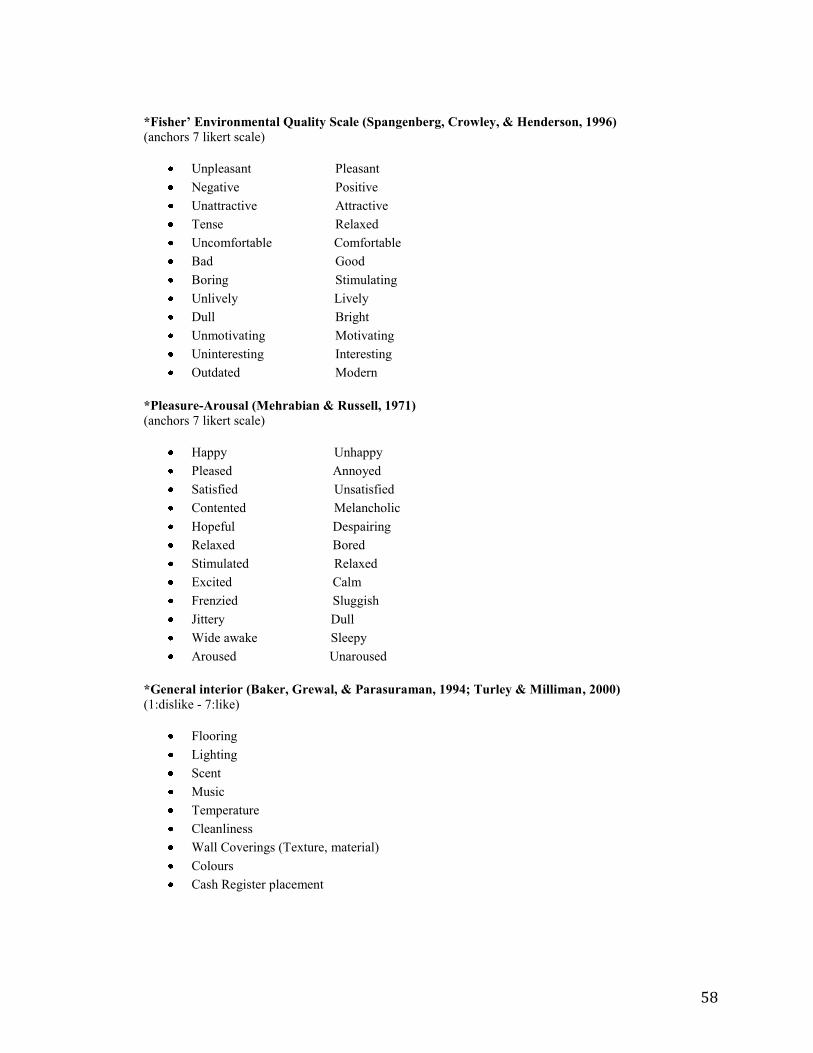
58
*Fisher’ Environmental Quality Scale (Spangenberg, Crowley, & Henderson, 1996)
(anchors 7 likert scale)
Unpleasant Pleasant
Negative Positive
Unattractive Attractive
Tense Relaxed
Uncomfortable Comfortable
Bad Good
Boring Stimulating
Unlively Lively
Dull Bright
Unmotivating Motivating
Uninteresting Interesting
Outdated Modern
*Pleasure-Arousal (Mehrabian & Russell, 1971)
(anchors 7 likert scale)
Happy Unhappy
Pleased Annoyed
Satisfied Unsatisfied
Contented Melancholic
Hopeful Despairing
Relaxed Bored
Stimulated Relaxed
Excited Calm
Frenzied Sluggish
Jittery Dull
Wide awake Sleepy
Aroused Unaroused
*General interior (Baker, Grewal, & Parasuraman, 1994; Turley & Milliman, 2000)
(1:dislike - 7:like)
Flooring
Lighting
Scent
Music
Temperature
Cleanliness
Wall Coverings (Texture, material)
Colours
Cash Register placement
59
Store layout (Baker, Grewal, & Parasuraman, 1994; Turley & Milliman, 2000)
(1:dislike - 7:like)
Floor space allocation
Product groupings
Seating arrangements
Traffic flow
Interior displays (Baker, Grewal, & Parasuraman, 1994; Turley & Milliman, 2000)
(1:dislike - 7:like)
Product displays
Posters
Signs
Wall decorations
Lab experiment measurement scales
Purchase likelihood
(7 likert scale- anchors)
How likely are you to purchase from this coffee shop in the near future?
unlikely likely
improbable probable
Attitude toward the brand
(7 likert scale- anchors)
How do you evaluate this coffee shop?
negative positive
dislike like
favorable unfavorable
WOM
How likely are you to recommend this coffee shop to others?
unlikely likely
improbable probable
Brand experience (Brakus, Schmitt, & Zarantonello, 2009)
(1:Strongly disagree – 7:Strongly agree)
This coffee shop makes a strong impression on my visual sense and other senses.
I find this brand interesting in a sensory way.
This brand does not appeal to my senses.
This brand induces feelings and sentiments.
I do not have strong emotions for this brand.
This brand is an emotional brand.
I engage in physical actions and behaviors when I use this brand.
This brand results in bodily experiences.
This brand is not action oriented.
I engage in a lot of thinking when I encounter this brand.
This brand does not make me think.
60
This brand stimulates my curiosity and problem solving.
Independent ownership, franchise, competence.
(1:Strongly disagree – 7:Strongly agree)
This coffee shop seems efficient, I will get my order quickly.
This coffee shop looks like a franchise/large corporation.
This coffee shop looks independently owned.
This coffee shop seems competent.
How descriptive are the following adjectives?
(1:Not at all Descriptive - 7:Extremely Descriptive)
Imperfect
Clinical
Clean
Inviting
Calming
Ordered
Unified
Coordinated
Diverse
Intricate
Complex
How important are the following to you?
(1:Not at all Important - 7:Extremely Important)
Promotions
Prices
Consistency in store
Novelty in Store
Consistency in Menu
Novelty in Menu
How much are you willing to pay for a regular small size filtered coffee? _____$
How much are you willing to pay for a specialty small size coffee? (latte, mocha, cappuccino)
______$
More details on specific managerial aspects.
(1:Strongly disagree – 7:Strongly agree)
The colors are modern
The colors seem light
The colors are traditional
The colors are heavy
The lighting is comfortable
The lighting is bright
The lighting is dim
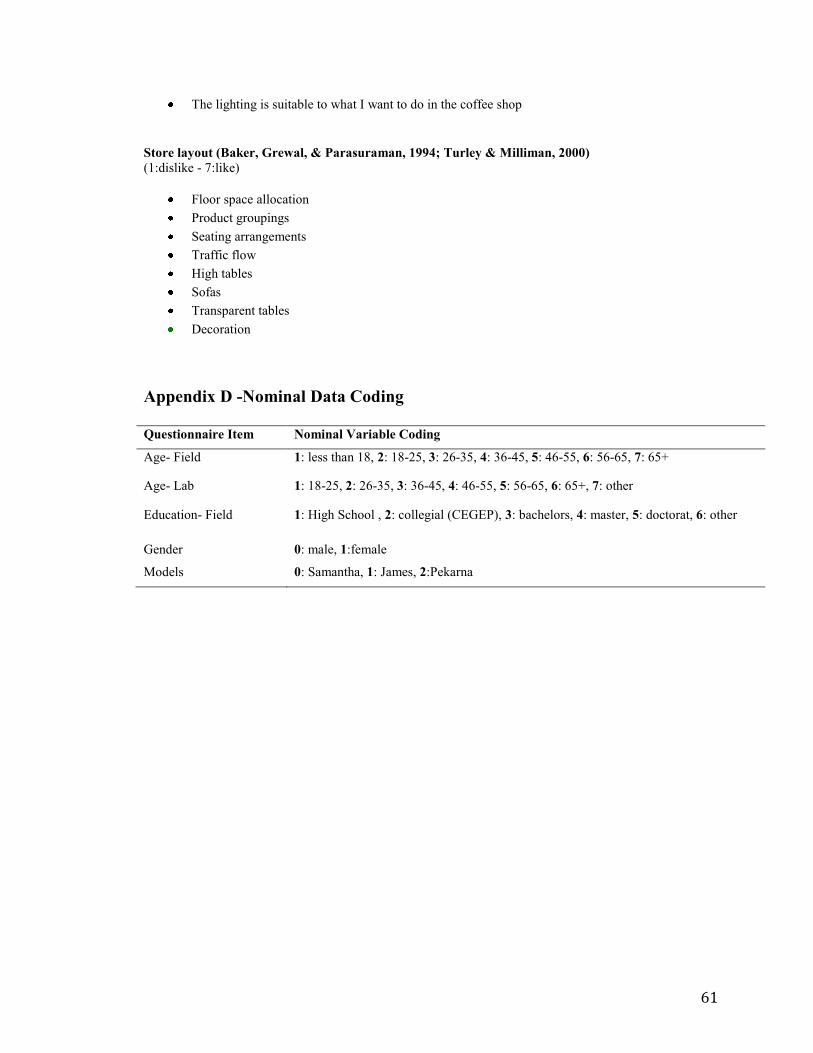
61
The lighting is suitable to what I want to do in the coffee shop
Store layout (Baker, Grewal, & Parasuraman, 1994; Turley & Milliman, 2000)
(1:dislike - 7:like)
Floor space allocation
Product groupings
Seating arrangements
Traffic flow
High tables
Sofas
Transparent tables
Decoration
Appendix D -Nominal Data Coding
Questionnaire Item Nominal Variable Coding
Age- Field 1: less than 18, 2: 18-25, 3: 26-35, 4: 36-45, 5: 46-55, 6: 56-65, 7: 65+
Age- Lab 1: 18-25, 2: 26-35, 3: 36-45, 4: 46-55, 5: 56-65, 6: 65+, 7: other
Education- Field 1: High School , 2: collegial (CEGEP), 3: bachelors, 4: master, 5: doctorat, 6: other
Gender 0: male, 1:female
Models 0: Samantha, 1: James, 2:Pekarna
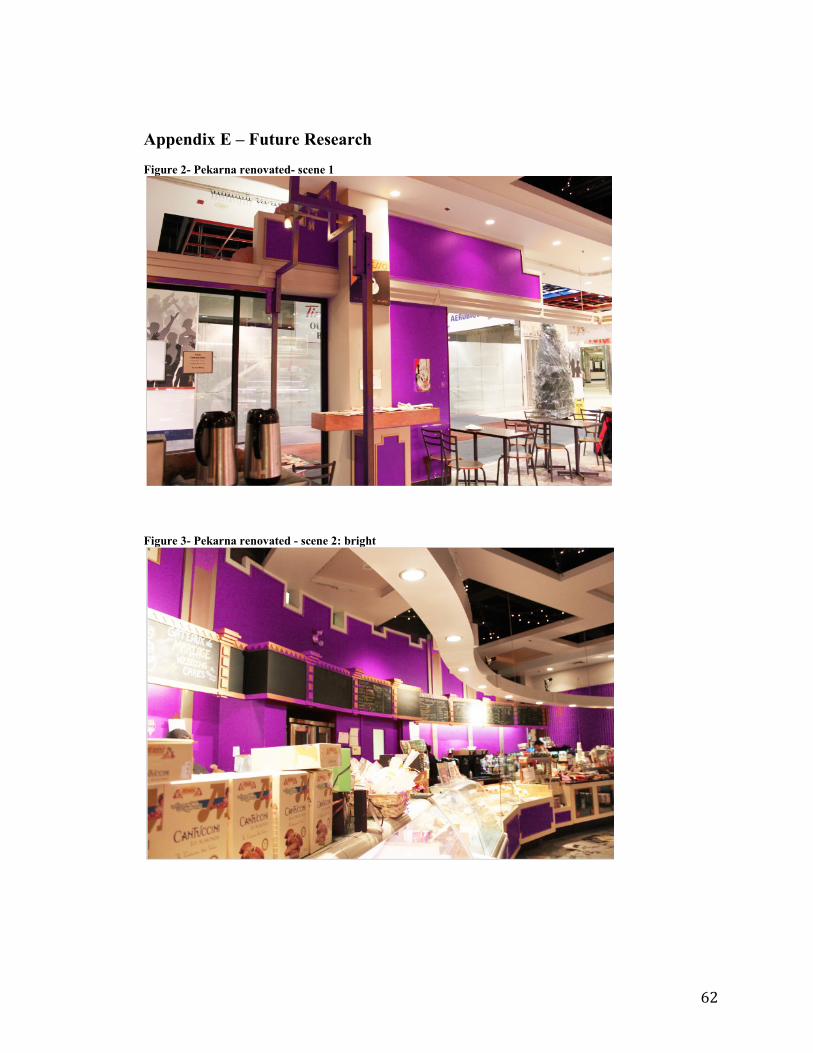
62
Appendix E – Future Research
Figure 2- Pekarna renovated- scene 1
Figure 3- Pekarna renovated - scene 2: bright
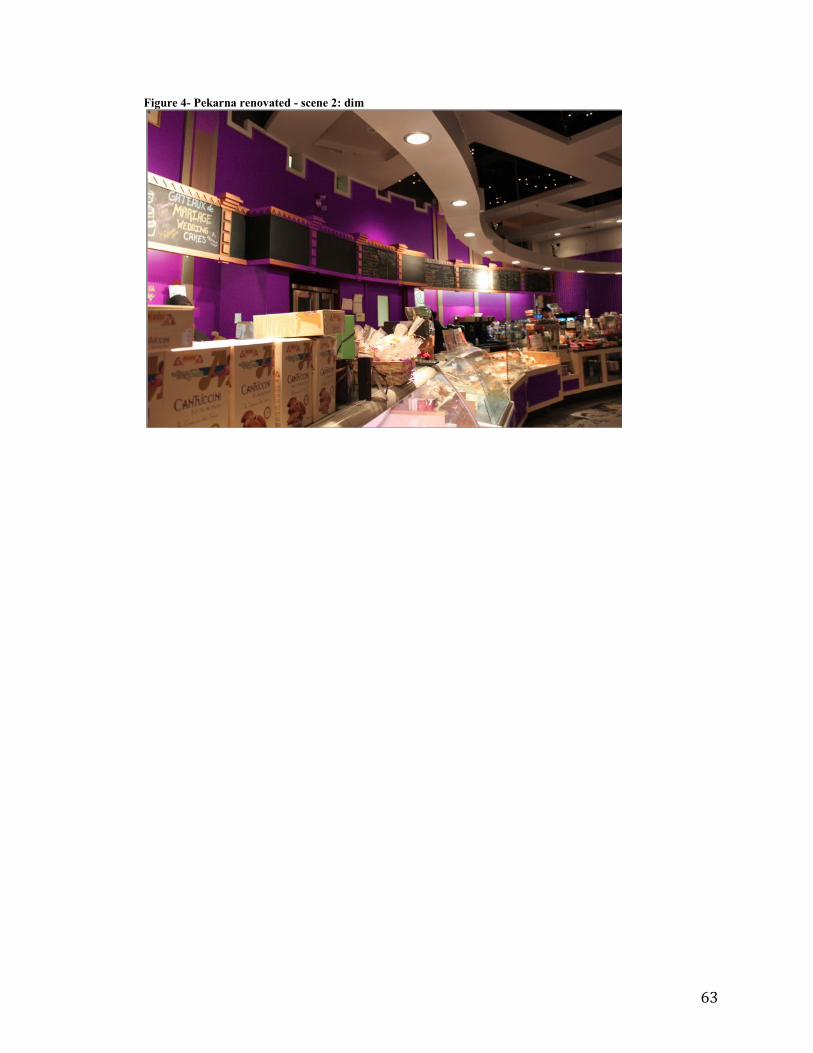
63
Figure 4- Pekarna renovated - scene 2: dim
64
Appendix F - Interview Questions
1. When was this coffee shop created?
2. When you created it, what was the philosophy, what did you wish to accomplish.
3. Describe the environment of your coffee shop.
4. As a manager, are you satisfied with the environment (ambiance)
a. The overall package of lighting, music, scents, design in this coffee shop?
b. Please describe
i. Layout
ii. Colors
iii. Lighting
iv. Music
v. Scent
5. In a few words, could you describe the personality of your coffee shop?
6. What kind of experience do you wish your customers to have?
7. What are the goals you wish to accomplish as a manager in this coffee shop?
(Store Traffic, profit)
8. How do you differentiate your coffee shop from others?
9. What role does atmospheric design/environment play in this differentiation?
10. If you were to make changes to your coffee shop design, what would you change?
11. After these changes, which aspects of your coffee shop performance do you
believe will be enhanced? (Store traffic, money spent per visit)
12. What elements would you trade off from your profit to satisfy your customers?
(Spend money on wifi, hire a band)
13. Is it your priority to provide your customer with comfort? Or it is more important
to provide them with quick service?
14. How long do you expect your customers to stay?
15. How much do you believe customers spend per visit? (Maybe breakdown by
food/beverage)

65
References
Aaker, J. L. (1997). Dimensions of Brand Personality. Journal of Marketing Research ,
34 (3), 347-356.
Areni, C. S., & Kim, D. (1994). The influence of in-store lighting on consumers'
examination of merchandise in a wine store. International Journal of Research in
Marketing , 11, 117-125.
Babin, B. J., Darden, W. R., & Griffin, M. (1994). Work and/or Fun: Measuring
Hedonic and Utilitarian Shopping Value. Journal of Consumer Research , 20, 644-656.
Baker, J., Grewal, D., & Parasuraman, A. (1994). The Influence of Store Environment
on Qualify Inferences and Store Image. Journal of the Academy of Marketing Science ,
22 (4), 328-339.
Baumgarten, S. A., & Hensel, J. S. (1987). Enhancing the Perceived Quality of Medical
Service Delivery Systems. In C. Suprenant (Ed.), Add Value to Your Service (pp. 105-
110). Chicago, IL: American Marketing Association.
Bellenger, D. N., Steinberg, E., & Staton, W. W. (1976). The congruence of Store
Image and Self Image. Journal of Retailing , 52, 17-32.
Bellizzi, J. A., Crowley, A. E., & Hasty, R. W. (1983). The Effects of Color in Store
Design. Journal of Retailing , 59, 21-45.
Biel, A. (1993). Converting Image into Equity. In D. A. Aaker, & A. Biel, Brand Equity
and Advertising. Hillsdale, NJ: Lawrence Erlbaum Associates.
66
Bloch, P. H., Brunel, F. F., & Arnold, T. J. (2003). Individual Differences in the
Centrality of Visual Product Aesthetics: Concept and Measurement. Journal of
Consumer Research , 29, 551-565.
Bone, P. F., & Ellen, P. S. (1992). Olfaction as a Cue for Product Quality. Marketing
Letters , 3, 289-296.
Booms, B. H., & Bitner, M. J. (1980). Marketing Services by Managing the
Environment. Cornell Hotel and Restaurant Management Quarterly , 23, 35-39.
Brakus, J. J., Schmitt, B. H., & Zarantonello, L. (2009). Brand Experience: What is it?
How is it Measured? Does it Affect Loyalty? . Journal of Marketing , 73, 52-68.
Crowley, A. E. (1993). The Two Dimensional Impact of Color on Shopping .
Marketing Letters , 4, 59-69.
Darden, W. R., & Babin, J. B. (1994). Exploring the Concept of Affective Qulity:
Expanding the Concept of Retail Personality. Journal of Business Research , 29, 101-
109.
Darden, W. R., & Schwinghammer, J. K. (1985). Effects of Price, Brand and Store
Information on Buyers' Product Evaluations. In J. Jacoby, & J. Olson, Perceived
Quality: How Consumers View Stores and Merchandise (pp. 161-172). Lexington, MA:
Lexington Books.
Darden, W. R., Erdem, O., & Darden, D. K. (1983). A comparison and Test of Three
Causal Models of Patronage Intentions. In W. R. Darden, & R. F. Lusch (Eds.),
Patronage Behavior and Retail Management (pp. 29-43). New York, North-Holland.
67
Deci, E. L., Betley, G., Kahle, J., Abrams, L., & Porac, J. (1981). When Trying to Win:
Competition and Intrinsic Motivation. Personality and Social Psychology Bulletin , 7,
79-83.
Donovan, R. J., & Rossiter, J. R. (1982). Store Atmosphere: An Environmental
Psychology Approach. Journal of Retailing , 58, 34-57.
E-Imports. (2010). Espresso Business Solutions. Retrieved March 8, 2010, from Coffee
Statistics: http://www.e-importz.com/Support/specialty_coffee.htm
Fishbein, M., & Ajzen, I. (1975). Belief, Attitude, Intention, and Behavior: An
introduction to theory and research. MA: Addison-Wesley.
Fournier, S. (1994). A Consumer-Brand Relationshiop Framework for Strategy
Brand Management.
Friedrick, J. (2007). Building a successful coffee program, one cup at a time. Gourmet
news , 72 (5), S3-S4,S10.
Gardner, M. (2001). Mood states and consumer behaviour: a critical view. Journal of
Consumer Research , 12, 281-300.
Gardner, M. P., & Siomkos, G. J. (1985). Toward a Methodology for Assessing Effects of
In-Store Atmosphere. (R. Lutz, Ed.) Chicago, IL: Association for Consumer Research .
Gentile, C., Spiller, N., & Noci, G. (2007). How to sustain the Customer Experience: An
Overview of Experience Components that Co-create Value with the Customer.
European Management Journal , 25 (5), 395-410.
Gita, J., Sengupta, J., & Aaker, J. (2005). Two Roads to Updating Brand Personality
Impressions: Trait Versus Evaluative Inferencing. Journal of Marketing Research , 42,
458-469.
68
Grayson, R. A., & McNeill, L. S. (2009). Using atmopsheric elements in service
retailing: understanding the bar environment. Journal of Services Marketing , 23 (7),
517-527.
Holbrook, M. B., & Hirschman, E. C. (1986). The Experiential Aspects of
Consumption: Consumer Fantasies, Feelings, and Fun. Journal of Consumer Research,
9, 132-140.
Hui, M., Dube, L., & Chebat, J. (1997). The impact of music on consumers' reactions to
waiting for services. Journal of Retailing , 73 (1), 87-104.
Kivela, J., Inbakaran, R., & Reece, J. (1999). Consumer Research in the restaurant
enironment, part 1: a conceptual model of dining satisfaction and return patronage.
International Journal Contemporary Hospitality Management , 11 (5), 205-222.
Kotler, P. (1973-1974). Atmospherics as a Marketing Tool. Journal of Retailing , 49
(4), 48-64.
Lindquist, J. D. (1974). Meaning of Image. Journal of Retailing , 50, 29-38.
Machleit, K. A., & Eroglu, S. A. (2000). Describing and Measuring Emotional
Response to Shopping Experience. Elsevier Science Inc , 49, 101-111.
Malhotra, N. K. (1983). A Threshold Model of Store Choices. Journal of Retailing , 59,
3-21.
Mattila, A. S., & Wirtz, J. (2006). Arousal expectations and service evaluations. .
International Journal of Service Industry Management , 17 (3), 229.
Mehrabian, A., & Russel, J. A. (1974). An Approach to Environmental Psychology.
Massachusetts Institute of Technology, Cambridge, MA.
69
Milliman, R. E. (1986). The Influence of Background Music on the Behavior of
Restaurant Patrons. Journal of Consumer Research , 13, 286-289.
Nevin, J. R., & Houston, M. (1980). Images as a Component of Attractiveness to Intra-
Urban Shopping Areas. Journal of Retailing , 56, 77-93.
Olshavsky, R. (1985). Perceived Quality in Consumer Decision-Making: An
Intergrated Theoretical Perspective. In J. Jacoby, & J. Olson, Perceived Quality: How
Consumers View Stores and Merchandise (pp. 3-29). Lexington, MA: Lexington Books.
Olson, J. (1977). Price as an Informational Cue: Effects on Product Evaluations. In A.
G. Woodside (Ed.), Consumer and Industrial Buyer Behavior (pp. 267-296). New
York, North-Holland.
Pons, F., Laroche, M., & Mourali, M. (2006). Consumer reactions to crowded retail
settings: Cross-cultural differences between North America and the Middle East.
Psychology & Marketing , 23 (7), 555-572.
Shim, S., Eastlick, M. A., Lotz, S. L., & Warrington, P. (2001). An online prepurchase
intentions model: The role of intention to search. Journal of Retailing , 77 (3), 397.
Sirgy, J. (1982). A Self-Concept in Consumer Behavior: A Critical Review. Journal of
Consumer Research , 9, 287-300.
Spangenberg, E. R., Crowley, A. E., & Henderson, P. W. (1996). Improving the store
environment: Do olfactory cues affect evaluations and behaviors? Journal of
Marketing , 60 (2), 67.
Spangenberg, E. R., Grohmann, B., & Sprott, D. E. (2005). It's beginning to smell (and
sound) a lot like Christmas: the interactive effects of ambiant scent and music in a
retail setting. Journal of Business Research , 58 (11), 1583-1589.
70
Stanley, T., & Sewall, M. (1976). Image Inputs to a Probabilistic Model: Predicting
Retail Potential. Journal of Marketing , 39, 48-53.
Stuart, J. E. (2008). Making growth make sense for retail and franchise businesses.
The Journal of Business Strategy , 29 (3), 48-50.
Thompson, C. J., & Arsel, Z. (2004). The Starbucks Brandscape and Consumers'
(Anticorporate) Experience of Glocalization. Journal of Consumer Research , 31 (3),
631-642.
Triandis, H. C. (1977). Interpersonal Behavior. CA, Monterey: Brooks/Cole.
Turley, L. W., & Milliman, E. R. (2000). Atmospheric Effects on Shopping Behavior: A
Review of the Experimental Evidence. Journal of Business Research , 49, 193-211.
Vida, I. (2008). The impact of atmospherics on consumer behaviour: the case of the
music fit in retail stores. Economic and Business Review for Central and South , 10 (1),
21-35,70.
Wakefield, K., & Baker, J. (1998). Excitement at the Mall: Determinants and Effects
on Shopping Response. Journal of Retailing , 74 (4), 515-539.
Warshaw, P. R., & Davis, F. D. (1985). Disentangling behavioral intetion and
behavioral expectation. Journal of Experimental Social Psychology , 21, 213-218.
Weinberg, B. A., & Bealer, B. K. (2002). The world of caffeine: The science and culture
of the world's more popular drug. London: Routledge.
Yalch, R., & Spanenberg, E. (1993). Using store music for retail zoning; a field
experiment. Advances in Consumer Research , 20, 632-636.
Zeithaml, V. (1988). Consumer Perceptions of Price, Quality and Value: A Means-End
Model and Synthesis of Evidence. Journal of Marketing , 64, 265-293.
71
Zimmer, M. R., & Golden, L. L. (1988). Impressions of Retail Stores: A Content
Analysis of Consumer Images. Journal of Retailing , 64, 265-293.