Embed Size (px)
Citation preview

Inter-American Development Bank
Banco Interamericano de Desarrollo (BID) Research Department
Departamento de Investigación Working Paper #667
A Moving Target: Universal Access to Healthcare Services in Latin America and the Caribbean
by
William D. Savedoff
Social Insight
January 2009

2
Cataloging-in-Publication data provided by the Inter-American Development Bank Felipe Herrera Library Savedoff, William D.
A moving target : universal access to healthcare services in Latin America and the Caribbean / by William D. Savedoff.
p. cm. (Research Department Working Papers ; 667) Includes bibliographical references.
1. Medical care—Latin America. 2. Health services accessibility—Latin America. 3. Medical care—Needs assessment. 4. Medical care—Utilization. I. Inter-American Development Bank. Research Dept. II. Title. III. Series. RA418.3.L29 .S384 2009 362.1098 S384----dc22 ©2009 Inter-American Development Bank 1300 New York Avenue, N.W. Washington, DC 20577 The views and interpretations in this document are those of the authors and should not be attributed to the Inter-American Development Bank, or to any individual acting on its behalf. This paper may be freely reproduced provided credit is given to the Research Department, Inter-American Development Bank. The Research Department (RES) produces a quarterly newsletter, IDEA (Ideas for Development in the Americas), as well as working papers and books on diverse economic issues. To obtain a complete list of RES publications, and read or download them please visit our web site at: http://www.iadb.org/res.

3
Abstract*
Healthcare services are more widespread in Latin America and the Caribbean today than 50 years ago, yet this availability is not necessarily reflected in popular perceptions. This study documents the expansion of healthcare services in the Region in terms of medically-trained professionals, service utilization, and insurance eligibility. It finds that people in countries with more doctors have a more positive view of access to healthcare and greater confidence in the healthcare system. However, other factors intervene in this relationship between perceptions and objective indicators, such as the strength of local social networks and wealth. As a consequence of rising expectations, differential access and continuing discontent, public policy can be driven by factors that are least likely to improve the population's health. Keywords: Health Care, Health Financing, Access, Happiness, Health Policy, Latin America, Caribbean. JEL Classification: I18, I11, N96
* The author is a Senior Partner at Social Insight (www.socialinsight.org). This paper was undertaken as background research for the 2008 Development in the Americas Report Beyond Facts: Understanding Quality of Life. The author wishes to thank Suzanne Duryea, Mariana Alfonso, María Victoria Rodríguez Pombo and Israel Osorio Rodarte for providing ideas, information, data, feedback and encouragement. All errors in this document are the author’s sole responsibility.

4
1. Introduction Good health is so essential to a good life that people demand access to services that will maintain
it. More than a dozen countries in Latin America and the Caribbean have responded to the
political manifestation of this desire by guaranteeing access to healthcare services in their
Constitutions. However, the definitions of access are often vague and the State’s ability to
comply with this requirement is frequently limited (Penchansky and Thomas, 1981).
Access to healthcare services can be defined in many ways. Some definitions focus on
whether people are actually using services—utilization serving as a proxy for access. Others
focus on health insurance coverage or eligibility to receive health care services if a person were
to fall ill. Still others focus on the probability that someone can get a health care service when
they need it; and others focus on the individual’s perception of whether or not they can get the
services they want. In general, access to health care services in terms of utilization, eligibility
and the probability of getting a needed services have all improved in the Region over the last 50
years. While the expansion of access in numerical terms is itself remarkable, it may be even
more remarkable to note that this increased access today includes an enormous range of new and
highly effective services that were not even conceivable in the 1950s.
The one way in which access may not have increased is with regard to people’s
perceptions of access. Perceptions are affected by increasing numbers of health care services in
two contradictory ways. Other things being equal, when a larger number of services are available
to people, they will tend to think that their access has improved. However, one of those “other
things” is the perception of what services ought to be available. So, for example, in a particular
country coverage of childhood vaccines might have increased from 20 percent to 100 percent
over a particular time period during which a new service, such as kidney dialysis, was also
introduced. If the new service is only available to a small share of the population, people may
think they have less access to care than before—even though the services that were rationed in
the earlier period are not universal—because their standard of what ought to be available has
changed.
This paper explores the tension between the improvements in utilization, eligibility and
the probability of getting needed services on the one hand, and the perception of access to health
care on the other.
5
2. Defining Access While the term “access” is used ubiquitously in health policy literature, it is often left undefined.
Typically, an article that aims to discuss access will quickly move toward an indicator without
even defining what is meant by “access.”
One of the most common proxies used to measure access to healthcare services is
utilization. Utilization may be measured by such indicators as the average number of
consultations or hospital admissions. Alternatively, it may be measured by the share of the
relevant population receiving particular services; for example, the share of pregnant women who
get prenatal care, of children who are fully immunized, or of people with diabetes who are
receiving necessary chronic care. While utilization is helpful for measuring access, it must be
used with two important qualifications.
First, more utilization of health care services is not always better. In an ideal world, many
health care services would be unnecessary because the conditions that require them would be
prevented. In addition, when health care services improve in effectiveness, they may require
fewer visits, admissions or other contacts with health professionals. Finally, health care providers
may actually provide too many services or the wrong kinds—in such a case, rising utilization
may suggest that “access” is improving when in fact access to necessary and appropriate services
may have stagnated or declined.
The second qualification is that “access” applies not only to people who need and get
services but also to the experience of people who are currently healthy and are assured they will
get necessary treatment in the event of an illness or injury. Thus, utilization measures could be
quite low in a particular community when people are healthy, but in a situation where illnesses or
injuries increase (e.g., an epidemic or natural disaster) a well-functioning health system would
respond with the appropriate services.
A second way to define and measure access to healthcare services is by considering
whether people have insurance coverage or eligibility that allows them to obtain services when
they need them. Thus, in countries where social security institutions enroll formal sector workers
or directly provide health care services to their members, rising enrollment might be taken as a
measure of increasing access.
As a measure of access, enrollment in health insurance schemes is not without its
problems. Health insurance plans may have limited impact on reducing financial barriers to
6
getting needed healthcare services if the plan includes very few healthcare services, reimburses
only a small portion of the total cost, or only covers services provided by poor quality health care
providers. Having health insurance is also of little benefit to someone who lives in an area that
has no medical facilities or in which facilities cannot provide care because they lack supplies or
are overcrowded.
Enrollment in health insurance is also a poor measure of access because many countries
have opted for health systems in which eligibility for free or subsidized care is not framed in
terms of affiliation with a health plan. Many health care systems in the Caribbean have been
structured as national health services. To the extent that these services have effectively provided
health care, the individuals who could get access to them have been no less “covered” than
someone with a social security card in some other country. Brazil explicitly adopted this
approach when it created the Unified Health System in the late 1980s. For these countries,
measuring “coverage” would require a more detailed analysis of which public health services
were actually effective and available to the population.
The most compelling definition of access to health care is the probability that someone
will receive an effective and appropriate healthcare service if necessary. If this probability is 100
percent, then access is 100 percent. The lower this probability, the less access the healthcare
system provides, until reaching situations in which people have no access and this probability
falls to zero.
One of the more precise definitions of access or coverage that has been proposed is to use
this concept of probability and link it to the expected health gain from an intervention (Shengelia
et al., 2003). Effective coverage is then defined as “the expected health gain from intervention j
relative to the potential gain possible with the optimal performance of providers in a given health
system.” It is affected both by the probability that an individual who needs a service will get it
and that the service will be as effective as possible in light of current medical knowledge.
Shengelia et al. (2003) argue that the gap between effective coverage and full potential
coverage can be decomposed into seven different components:
- Resource availability gap
- Physical availability gap
- Affordability gap
- Cultural acceptability gap

7
- Provider-related quality gap
- Strategic choice gap, and
- Adherence gap.
Effective coverage may be low if a country lacks the trained health care professionals,
facilities, equipment or medications necessary to address a particular condition (Resource
availability gap). Even if resources are available, people may not have access if these resources
are not located in sufficient proximity to the people who need them (Physical availability gap).
Similarly, access can be limited if the individual who needs the service has to pay for it, whether
through enrollment in a health insurance plan or out of pocket, and lacks the means to do so
(Affordability gap). Access may be limited when health care services are provided in a way that
conflicts with popular beliefs, religion, or social norms (Cultural acceptability Gap). Access to
healthcare services may also be limited if the quality of services provided by health care
professionals is inadequate (Provider-related quality gap) or health care professionals provide
the wrong treatment (Strategic choice gap). Finally, this framework includes what the authors
call an Adherence gap to reflect the ways in which individual behaviors limit the effectiveness of
an intervention, a common problem for illnesses that require taking medication for long periods
of time (e.g., tuberculosis) or changing behaviors (e.g., exercising, quitting smoking). These
different gaps vary in terms of how much they can be controlled by factors on the supply side.
For example, cultural acceptability and adherence are both strongly influenced by individual
demand behaviors even if they can be addressed to varying degrees by modifying the kinds of
services supplied.
Penchansky and Thomas (1981) present a similar model, but one that makes fewer
distinctions. Their model is similar in its attention to factors that affect the probability of getting
a needed service but it lends itself more easily to measurement and does not subsume demand
behaviors within supply. Specifically, their model proposes four dimensions of access:
availability, accessibility, affordability and acceptability. Availability considers the supply of
health care services, in terms of the amount and quality relative to the population’s needs.
Accessibility addresses the spatial distribution of services relative to the population and its needs.
Affordability addresses the financial factors that can facilitate or obstruct getting necessary

8
healthcare services. Finally, acceptability addresses whether available health care services are
appropriate to the norms, expectations and cultural behaviors of the population.
This paper will focus on three of these factors. It will explore the availability and
accessibility of services by examining data on the physical supply of health services in proximity
to individuals and the affordability of healthcare services by analyzing financial resources that
permit an individual to get necessary healthcare services. Though the quality of healthcare
services and their acceptability are very important dimensions of healthcare service access, they
will not be addressed in this paper for lack of data.
Also, it is important to note that this paper addresses health care services that are mostly
“personal” services, mainly preventive and curative treatments. A similar analysis of “public
health services”—those that address population health with collective services, such as reducing
air pollution, controlling disease vectors, or monitoring epidemics—would have to be modified
to address the different meaning of “access” when the intervention is collective in nature.
Defining access as the probability that an individual with a particular condition will
receive an effective treatment for that condition does not address an individual’s perception of
their access to health care. For example, people with health insurance may think they have access
to health care services but find, when they need treatment, that the service is not included in the
benefits package. Similarly, an individual may think they have access to a free health facility but
find that the required service cannot be provided due to missing supplies, overcrowding or absent
personnel; or that the quality of services is so poor that they cannot receive effective treatment.
Perceived access to health care services is quite complex. It is influenced by the range of
health concerns experienced by the population (whether real or imagined) and whether these
health conditions are amenable to treatments that are visibly available in the local community. It
is also influenced by the visibility of formal access programs—whether an insurance plan or
eligibility for free or subsidized care—and the cost of healthcare services. Perceived access is
further affected by expectations regarding the kind of care that is effective and available—often
influenced by the kinds of services utilized by a country’s elite.
In sum, access to health care is best conceived as the probability that an individual with a
given condition will receive an appropriate and effective treatment for that condition. This
probability will be higher to the extent that relevant healthcare services are physically available
in proximity to the population, are financially affordable, and are provided with the quality

9
required to be effective. Perceptions of access to health care, however, are only partially related
to access since they are also influenced by the profile of the population’s health concerns and
expectations regarding effective treatment, which may not match the actual profile of health
problems or the actual availability of effective treatments.
3. Access to Health Care Services since the 1950s In general, access to healthcare services has improved dramatically in Latin America and the
Caribbean since the 1950s, both in terms of the number and share of the population who can get
treated for their health problems and the number and effectiveness of health services for treating
those problems.
The improvement in access can be seen indirectly through the Region’s changing
epidemiology and rising health status. Vaccine-preventable illnesses have declined tremendously
since 1950 due largely to increasing coverage of immunization services. Deaths from conditions
which were fatal 50 years ago have declined; for example, kidney failure would have been fatal
in the 1950s throughout Latin America, while today the possibility of kidney transplants and
dialysis allows many individuals to live longer healthier lives.
3.1 More Health Professionals and Facilities The increasing access to health care services is remarkable when contrasted with the pace at
which the demand for health services grew. The Region’s population grew three-fold over the
last 50 years, from about 180 million to 569 million today, yet the physical resources available to
provide health care have expanded even more rapidly.
The growing number of health professionals can be documented in five Latin American
countries for which comparable data is available from the censuses of 1960 and 2000: Brazil,
Chile, Costa Rica, Ecuador, and Mexico. In these countries, the ratio of doctors per 1,000 people
increased from 0.33 to 0.90 over that period, suggesting an annual increase in the number of
doctors by more than 5 percent. The number of medical schools, hospitals and health facilities
has also grown dramatically through most of the region over the course of the last century (see
Box 1). The expansion has continued in recent years. For example, between 1990 and 2005 in
Mexico’s public sector alone, the number of hospital beds has increased from 63,122 to 78,643

10
(SSS, 2008). Since 1995, the share of the Costa Rican population living farther than 25 km from
a hospital has declined from 30 percent to 22 percent (Rosero-Bixby 2004).
BOX 1. Expansion of Health facilities in Tapachula Tapachula is the second-largest city in Mexico’s southernmost state, Chiapas, with a population of approximately 270,000. It has been distant from the main centers of the country’s economic and political life for its entire existence. Yet, despite its relatively marginal circumstances, the town’s history is fairly typical of Latin America as a whole in terms of how the supply of health facilities expanded over the last century.
The first health care facility in Tapachula was a medical office built as part of the first train station and intended primarily to serve the national train company’s employees. Around the same time, the first hospital, the Hospital Civil, was also built. By 1908, it was serving a population of about 17,000 people. In the 1920s, a Casa de Salud was built to serve the town’s elite, who objected to being treated in the same institution as the poorer and indigenous population. In 1948, the original hospital was replaced by a new and larger facility, now known as the Hospital General. And in 1956, the Instituto Mexicana de Seguridad Social (IMSS) started its first health center in the town to serve its affiliated members, employees of formal sector firms.
At least one major health care facility has been started in the city in each of the last four decades. In the 1960s, the Red Cross built a hospital and the government added a health center and long-term care facility to complement the Hospital General (now considered a Regional Hospital). The federal government employee’s union, ISSSTE, built its own facility in 1976. Two private hospitals were built in the 1980s, and the state employee’s union, ISSTECH, started its own combination hospital and clinic in 1992. Source: Fajardo-Ortiz 2005.
This rapid expansion of health service resources does not necessarily mean that more
services were available to everyone, since the increase could have been highly concentrated in
major metropolitan regions. The census data from Brazil, Chile, Costa Rica, Ecuador and
Mexico show that the opposite is in fact the case. For example, of the fifteen states for which
there is comparable census data between 1960 and 2000 in Brazil, the number of doctors per
person grew slowest in São Paolo and fastest in Rio Grande do Norte. By 2000, São Paolo still
had the highest ratio of doctors to 1,000 people (1.58), about double the rate in 1960 (0.76); but
the ratio in many poorer more rural states tripled or quadrupled. For example, the ratio in Ceará
almost tripled, growing from 0.19 to 0.56.

11
This pattern can be confirmed for the other countries by disaggregating the ratio of
doctors and nurses to population and calculating a measure of dispersion across states or
municipalities. Table 1 shows that the dispersion across subnational units declined for doctors in
every case for which the author was able to find comparable census data.
Table 1. Geographic Distribution Measures for Health Professionals in Selected Countries,
1960-2000
Coefficient of Variation - Doctors per Population by State or Province 1960s 1970s 1980s 1990s 2000s N Brazil 0.81 1.08 0.67 0.64 0.54 29 Chile 0.83 0.86 0.69 0.49 26 Costa Rica 1.10 0.62 7 Ecuador 1.53 1.39 0.68 0.54 24 Mexico 0.85 0.36 0.33 0.33 31 Coefficient of Variation - Nurses per Population by State or Province 1960s 1970s 1980s 1990s 2000s N Brazil 2.17 0.63 1.40 0.31 0.54 29 Chile 0.76 0.45 0.24 0.21 26 Costa Rica 0.64 0.33 7 Ecuador 2.71 1.09 0.81 0.49 24 Mexico 0.76 0.34 0.27 0.27 31 Note: N is the number of states or provinces, which may vary from year to year based on availability of data. The fluctuating ratio for nurses in Brazil may reflect policy changes that reclassified workers as nurses or changing occupational definitions in the census.
Even if the number of resources increased across the entire country, the number of
services may not have grown proportionally. People who train to be doctors and nurses, for
instance, may not be employed in healthcare services. In addition, if productivity fell over the
period, then the number of doctors, nurses and hospitals would overstate the increased
availability of healthcare services, while the opposite would hold if productivity had increased.
Reasons could be given for either argument. A key determinant of productivity is the
organization of the healthcare system itself, and it is not clear whether the organization of health
services has increased productivity or not. By contrast, advances in medical technology have
almost certainly increased the productivity of health care professionals. It is reasonable to believe
that the rapid expansion of the healthcare workforce, above the rate of population growth,
12
reflects greater availability of health care services in most of the region. However, more refined
data would be necessary to be certain.
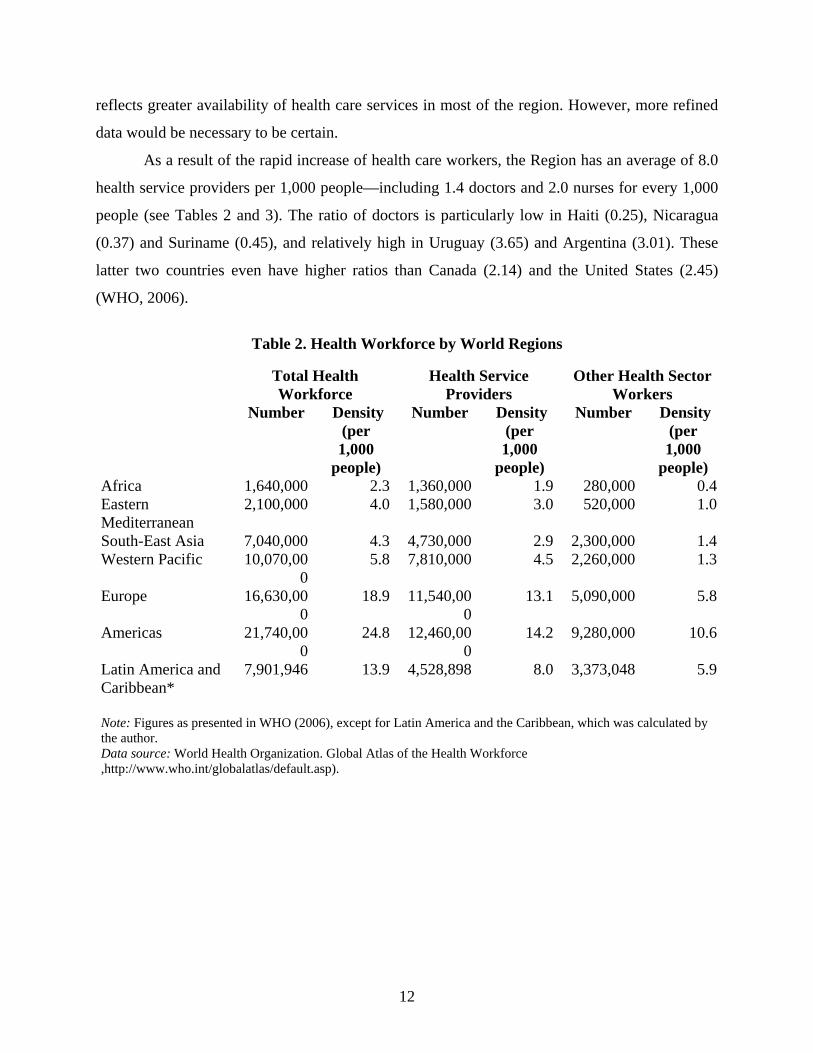
As a result of the rapid increase of health care workers, the Region has an average of 8.0
health service providers per 1,000 people—including 1.4 doctors and 2.0 nurses for every 1,000
people (see Tables 2 and 3). The ratio of doctors is particularly low in Haiti (0.25), Nicaragua
(0.37) and Suriname (0.45), and relatively high in Uruguay (3.65) and Argentina (3.01). These
latter two countries even have higher ratios than Canada (2.14) and the United States (2.45)
(WHO, 2006).
Table 2. Health Workforce by World Regions
Total Health
Workforce Health Service
Providers Other Health Sector
Workers Number Density
(per 1,000
people)
Number Density (per 1,000
people)
Number Density (per 1,000
people) Africa 1,640,000 2.3 1,360,000 1.9 280,000 0.4Eastern Mediterranean
2,100,000 4.0 1,580,000 3.0 520,000 1.0
South-East Asia 7,040,000 4.3 4,730,000 2.9 2,300,000 1.4Western Pacific 10,070,00
0 5.8 7,810,000 4.5 2,260,000 1.3
Europe 16,630,000
18.9 11,540,000
13.1 5,090,000 5.8
Americas 21,740,000
24.8 12,460,000
14.2 9,280,000 10.6
Latin America and Caribbean*
7,901,946 13.9 4,528,898 8.0 3,373,048 5.9
Note: Figures as presented in WHO (2006), except for Latin America and the Caribbean, which was calculated by the author. Data source: World Health Organization. Global Atlas of the Health Workforce ,http://www.who.int/globalatlas/default.asp).

13
Table 3. Density and Number of Doctors and Nurses in Latin America and the Caribbean
Doctors Nurses
Country Number Density per
1,000 Year Number Density per
1,000 Year Argentina 108,800 3.01 1998 29,000 0.8 1998 Bahamas 312 1.05 1998 1,323 4.47 1998 Barbados 322 1.21 1999 988 3.7 1999 Belize 251 1.05 2000 303 1.26 2000 Bolivia 10,329 1.22 2001 27,063 3.19 2001 Brazil 198,153 1.15 2000 659,111 3.84 2000 Chile 17,250 1.09 2003 10,000 0.63 2003 Colombia 58,761 1.35 2002 23,940 0.55 2002 Costa Rica 5,204 1.32 2000 3,631 0.92 2000 Cuba 66,567 5.91 2002 83,880 7.44 2002 Dominican Republic 15,670 1.88 2000 15,352 1.84 2000 Ecuador 18,335 1.48 2000 19,549 1.57 2000 El Salvador 7,938 1.24 2002 5,103 0.8 2002 Guatemala 9,965 0.9 1999 44,986 4.05 1999 Guyana 366 0.48 2000 1,738 2.29 2000 Haiti 1,949 0.25 1998 834 0.11 1998 Honduras 3,676 0.57 2000 8,333 1.29 2000 Jamaica 2,253 0.85 2003 4,374 1.65 2003 Mexico 195,897 1.98 2000 88,678 0.9 2000 Nicaragua 2,045 0.37 2003 5,862 1.07 2003 Panama 4,431 1.5 2000 4,545 1.54 2000 Paraguay 6,355 1.11 2002 9,727 1.69 2002 Peru 29,799 1.17 1999 17,108 0.67 1999 Suriname 191 0.45 2000 688 1.62 2000 Trinidad and Tobago 1,004 0.79 1997 3,653 2.87 1997 Uruguay 12,384 3.65 2002 2,880 0.85 2002 Venezuela, Bolivarian Republic 48,000 1.94 2001 - - -
Source: WHO 2006. 3.2 Financial Factors Affecting Healthcare Access Access to healthcare services also appears to have increased when measured by enrollment in
public insurance. For example, Chile and Costa Rica have effectively reached universal health
insurance enrollment. When they created Social Security Institutes, in 1924 and 1941,
respectively, very few people were covered. Yet today, almost 100 percent of the populations
have health insurance coverage, whether through public insurance in Costa Rica, or through

14
mandatory health insurance in Chile, where a little more than 80 percent of the population is
enrolled with public insurance and the remainder with private insurers.
Other countries in the region have tried to follow a similar strategy but with less success.
For example, Ecuador’s Instituto Nacional de Previsión (INS)—which began as a pension
program for public employees, formal sector workers and military personnel—started a medical
service for its affiliates in 1935. Today, 70 years later, the INS’s successor, the Instituto
Ecuatoriano de Seguridad Social, only covers 20 percent of the population.
Of course, social security is only one form of public financial support for the use of
healthcare services. Governments also directly subsidize services for particular populations,
either through payments to providers or through direct provision by government facilities. Some
people also purchase their own private health insurance. In Latin America, this share of the
population is generally small, with the exception of a few countries such as Brazil, Chile, and
Uruguay, where private health insurance covers 21 percent, 24 percent and 38 percent of the
population, respectively (Sekhri and Savedoff, 2005).
Given that public provision of health care services was relatively limited in the 1950s, it
is likely that a greater share of the population is enrolled in programs to pay for or subsidize their
use of health care services. In a recent poll, only 8.7 percent of Uruguayans responded that they
would have to pay for hospitalization out of pocket; more than 91 percent said they were
financially covered, whether by public programs, private health insurance, or the social security
system. More than 80 percent of those polled in Brazil and Costa Rica also reported that they had
some form of financial protection against hospital costs for an accident or illness. By contrast,
fewer than 30 percent of those surveyed in Ecuador, Bolivia and Honduras felt that they had
recourse to some form of financial coverage (see Table 4).

15
Table 4. Responses to the Question “If you had to go to a hospital because of an accident or illness, who would take care of the cost of your assistance?”
(Share of respondents by country, %)
Country Out-of-Pocket expenditures
Government and social security
Private insurance Total
Ecuador 80.8 14.8 4.5 100 Bolivia 80.7 13.3 6.0 100 Honduras 76.5 21.4 2.1 100 Peru 73.9 21.6 4.6 100 Paraguay 72.3 20.3 7.5 100 Guatemala 69.9 28.9 1.2 100 Nicaragua 66.0 32.0 2.0 100 El Salvador 65.9 32.8 1.3 100 Dominican Republic 62.6 21.6 15.8 100 Mexico 45.9 48.3 5.8 100 Panama 45.7 50.2 4.1 100 Belize 44.0 51.3 4.8 100 Guyana 38.7 51.6 9.8 100 Chile 26.6 63.6 9.7 100 Colombia 24.2 49.2 26.7 100 Argentina 22.4 58.9 18.7 100 Costa Rica 18.8 77.3 3.9 100 Brazil 17.2 64.3 18.5 100 Uruguay 8.8 53.7 37.5 100 Total 50.0 40.2 9.9 100
Source: Authors’ calculations using Gallup World Poll (2007).
Access to many healthcare services is easier today than it was 50 years ago because their
costs have actually declined in real terms. Just considering pharmaceuticals, the cost of
childhood vaccines, aspirin, and off-patent antibiotics, are lower in real terms today than they
were 50 years ago. Careful studies have not been conducted in Latin America or the Caribbean,
but detailed studies in the US have shown several ways in which medical costs for particular
treatments or illnesses have declined. For example, in the US during the 1990s, the cost of
treating depression per remission fell by about 20 percent due to improved use of
pharmaceuticals. Moreover, between 1969 and 1998, the cost of cataract surgery declined on
average by 1.6 percent per year. Even though input prices rose over this period, inputs were used
more intensively and productively for a net decline in cost (Cutler and McClellan, 2001).
Indicators of price inflation for pharmaceuticals can also be misleading. For instance, when a
patent ends and generic drugs become available, official statistics treat the generic drug as a new
commodity rather than as a substitute, or at least partial substitute, for the original brand name
16
drug. As a result, one study showed that a standard index would register a 14 percent increase in
price over a 45-month period, while a more appropriate index taking into account this
substitutability would find that the price of medication to treat that particular condition had fallen
by 48 percent (Griliches and Cockburn, 1994).
Another way of thinking about access to health care services is relative to the goal of
improved health. Rising costs of care in many cases reflect more than proportional increases in
associated health gain. So, for example, between 1950 and 1990 the cost of treating low
birthweight newborns rose by $39,000 , but this was associated with an average 12-year increase
in life expectancy for these children. Similarly, between 1984 and 1994, the cost of treating
someone with a heart attack rose $7,000, but the improvements in treatment were associated with
an additional year of life (Cutler and McClellan, 2001).
The contrast between studies that demonstrate declining costs per unit of health gain and
the commonsense view that healthcare is more and more expensive can be understood if it is the
most expensive and most recently introduced treatments that are foremost in people’s minds. The
overall cost of medical care has increased in every country because more, better quality, and
newer services are being provided. These newer services are considerably more expensive—but
also more productive—than older ones. If a similar approach were applied to personal
computers, it would appear that computer prices are stable or rising, when in fact the price
relative to computing power has declined considerably. The pace of technological advances in
medicine, thus, works in two directions: reducing the unit costs for certain kinds of care,
particularly once they become routine, and raising unit costs for other kinds of care that are
producing larger health gains.
In sum, healthcare services in Latin America and the Caribbean are more available,
accessible, and affordable. The supply of healthcare services has grown much faster than the
population or its health care needs, and these services are more accessible because they are less
spatially concentrated than before. In addition, healthcare services are more affordable than they
were in the 1950s. The cost of healthcare services is generally declining despite the visible
increase in costs for newly introduced medications and treatments and a growing share of the
population is affiliated with public or private programs that reduce the financial barriers to
getting needed health care services. This 50-year retrospective is an important reminder of how
far the Region has come with regard to providing health care services. Nevertheless, it should not

17
detract from efforts to address the continuing gaps in access to even very basic services for
important segments of the population and to address the changing profile of illnesses
characteristic of the population.
4. How Far is the Region from Reaching Universal Access? The definition of effective access to healthcare services includes an implicit contrast with what is
attainable—a concept that is quite difficult to define and measure. Nevertheless, it may be
possible to approximate the gap in access to healthcare in the region with reference to what is
already provided to society’s most privileged households. In other words, if the top 20 percent of
the population has access to particular services, it demonstrates that those services can be
provided in that country to those who face the fewest barriers (physical and financial barriers, in
particular). Fortunately, a large number of studies have looked at the distribution of healthcare
services across income groups and can be used to illustrate the dimensions of the gap in access to
health care. 4.1 General Utilization of Health Care As discussed earlier, utilization is a useful but imperfect measure of health care access. The share
of different income quintiles who use services is a reasonable indication of how far the system is
from giving everyone equal access to healthcare services. Some studies go further and adjust
utilization figures for each population’s group health needs in recognition of the common
finding that poorer people generally experience worse health than those who are wealthier (van
Doorslaer, et al. 2004). Nevertheless, adjustments of this kind often have marginal effects on the
results (see, for example, Sapelli and Vial, 1998).
Chile and Peru provide a useful contrast for the range of experiences in Latin America
and the Caribbean (see Tables 5 and 6). In Chile, despite an income difference of 20 to 1
between the richest and poorest quintiles, the share of the population that uses health care
services differs only modestly across income groups. Between 8.8 percent and 9.7 percent of
each income group used preventive health care, and between 2.8 percent and 3.7 percent utilized
emergency care (higher among the poor, presumably because of greater need). For
hospitalizations, utilization varied from 20.4 percent for the poorest fifth of the population to
23.6 percent for the richest fifth, while general consultations ranged from 8.7 percent to 9.7
percent, respectively.

18
The differences are small but still significant, suggesting that poor Chileans are almost as
likely as the rich to get necessary care, but not with exactly the same probability. Also, it is likely
that the quality of care provided may vary systematically and inversely with income.
Nevertheless, the gap between what the health system can provide and what people use is not
driven overwhelmingly by an individual’s income class. In fact, Chile seems to compare
favorably in this regard when compared to many OECD countries (see Table 7).
The contrast within the Region becomes apparent when comparing Chile with Peru. In
Peru, the utilization of health care services as a whole ranged from 25.1 percent for the poorest
fifth of the population to 48 percent among the richest fifth. The difference in the probability of
utilizing care between the richest and poorest income quintiles is about 2 to 1 nationally, but
slightly lower in the country’s urban areas (1.7). Another way of considering this is to interpret
the difference in utilization as the degree to which health care access is restricted; in Chile, this
figure would only be about 2.2 percent if the focus is on general consultations, while in Peru it
would be 10 times greater, about 23 percent.
Table 5. Utilization of Healthcare Services in Chile by Income Quintile (% of population)
Income Quintiles
Poorest
20% 2 3 4 Richest
20% General Consultations 20.4 21.4 22.7 23.1 23.6 Hospitalizations 8.7 9.3 10.0 10.5 9.7 Emergency care 3.7 3.6 3.7 3.7 2.8 Preventive interventions 8.8 9.4 9.7 8.8 8.8
Source: Sapelli and Vial (1998). Table 6. Utilization of Healthcare Services in Peru by Income Quintile (% of population)
Poorest 2 3 4 Richest Peru 25.1 35.2 40 45.3 48 Urban 29.5 39.8 43.9 46.3 49.6 Rural 19.9 27.8 27.6 37.4 38.8 Metropolitan Lima 35.9 40.7 43.1 44.4 48.1
Source: Valdivia (2002).

19
Table 7. Utilization of Hospital Services in Selected OECD Countries (% of population)
Poorest 2 3 4 Richest
Belgium 11 11 13 10 10 Canada 10 10 9 8 8 Finland 11 14 13 10 12 France 9 10 9 9 10 Greece 6 5 4 6 6 Portugal 5 5 6 6 9 Spain 7 6 8 8 8 Sweden 8 11 10 10 10 United Kingdom 10 12 11 11 10
Source: van Doorslaer et al. (2004). 4.2 Prenatal Care and Skilled Birth Attendance Prenatal care and skilled birth attendance are among the clearest indicators of a well-functioning
health care system and a good measure of access. These services are predictable, well-
understood, proven, and required for a large and important share of the population. The services
are also highly cost-effective.
High rates of prenatal care and skilled birth attendance require more than the availability
of a supply—women also need to believe that such services are worthwhile and choose to use
them. The barriers to using available services may be cultural or financial, but they can also
include simple ignorance of the value of these services. Though this might qualify some of the
results that are discussed below, it is also true that a good healthcare system can educate people
about health-promoting services and reach out to them in culturally acceptable ways. To the
degree that a country views public health as a collective responsibility, such outreach would be
an integral part of public health policy.
The Region’s rates of prenatal care and skilled birth attendance are high relative to other
developing regions. In South Asia, only 42 percent of pregnant women have three or more
prenatal consultations, and only 37 percent are attended to by a skilled birth attendant. By
contrast, these shares are 83 percent and 82 percent, respectively, in Latin America and the
Caribbean—close to the rates of the East Asian and Pacific region (see Table 8). In some
countries, access to these services may be widespread and equitable. For example, the
Dominican Republic has a remarkably high rate of utilization of these services considering its
level of income. However, in most of the Region’s countries, prenatal care and skilled birth

20
attendance are not widespread or equitably distributed. In Bolivia, Guatemala, Haiti and Peru,
less than half the pregnant women in the poorest income quintile get these services, despite rates
of over 90 percent among pregnant women in the highest income quintile (Gwatkin et al., 2007).
Table 8. Share of Births Attended by Skilled Professionals (%), Selected Countries
Country (Year of Data) Share Haiti 2000 23.8 Guatemala 2002 41.4 Honduras 2001 55.7 Bolivia 2003 66.8 Nicaragua 2001 66.9 Peru 2004 73.4 Paraguay 2004 77.1 Guyana 2000 85.6 El Salvador 2003 92.4 Panama 2003 92.5 Venezuela 2003 95.0 Trinidad and Tobago 2000 96.0 Colombia 2005 96.4 Jamaica 2005 96.7 Costa Rica 2004 98.5 Argentina 2003 98.7 Dominican Republic 2002 98.7 Bahamas 2000 99.0 Chile 2004 99.8 Cuba 2005 99.9 Barbados 2003 100.0
Source: United Nations: http://mdgs.un.org/unsd/mdg/Data.aspx. Accessed July 14, 2008.
In sum, people in Latin America and the Caribbean have more access to better health care
than ever before; however, with the exception of relatively few countries (e.g., Chile, Costa Rica
and Uruguay), the wealthiest quintile gets access to significantly more healthcare services than
others. This is true whether access is measured for preventive care (e.g., immunization, prenatal
services, and professional birth attendance) or curative care (e.g., general consultations,
hospitalizations, emergency treatment). The variation across income groups demonstrates that
supply limitations, financial barriers, or political obstacles—and not technological or institutional
constraints—account for the remaining gaps in the population’s access to health care services.

21
5. Perceptions of Healthcare Services Just because people have greater access to healthcare services does not necessarily mean that
they feel that they have improved access. Perceptions of healthcare access are influenced by
many other factors, relative shifts in supply and demand, including changing expectations, and
comparisons with peers. Over a period of 50 years, dramatic changes have occurred in
population size, technology, education, income and culture. A three-fold population increase has
driven rising demand for healthcare services. As the population’s epidemiological profile has
changed, the kinds of services that are demanded have also changed. For example, today the
region has a much lower demand for treating children’s infectious diseases and a greater
demand for treating chronic conditions of the elderly than in the 1950s.
People demand access to more healthcare services today than ever before. A number of
factors drive this rising demand and the concomitant expectation that those demands should be
met. As the Region’s income level has increased, the demand for healthcare services has also
risen. Independent of income, rising educational attainment also drives demand for more
healthcare services. Cultural trends have also contributed to increasing demand for healthcare
services. The spread of electronic media, in particularly, makes people aware of medical services
to treat conditions that might otherwise have been ignored, remained unrecognized, or simply
accommodated (e.g., depression, allergies, cataracts). Finally, the political process itself often
raises expectations. Expedience may lead politicians to promise more than government can
deliver.
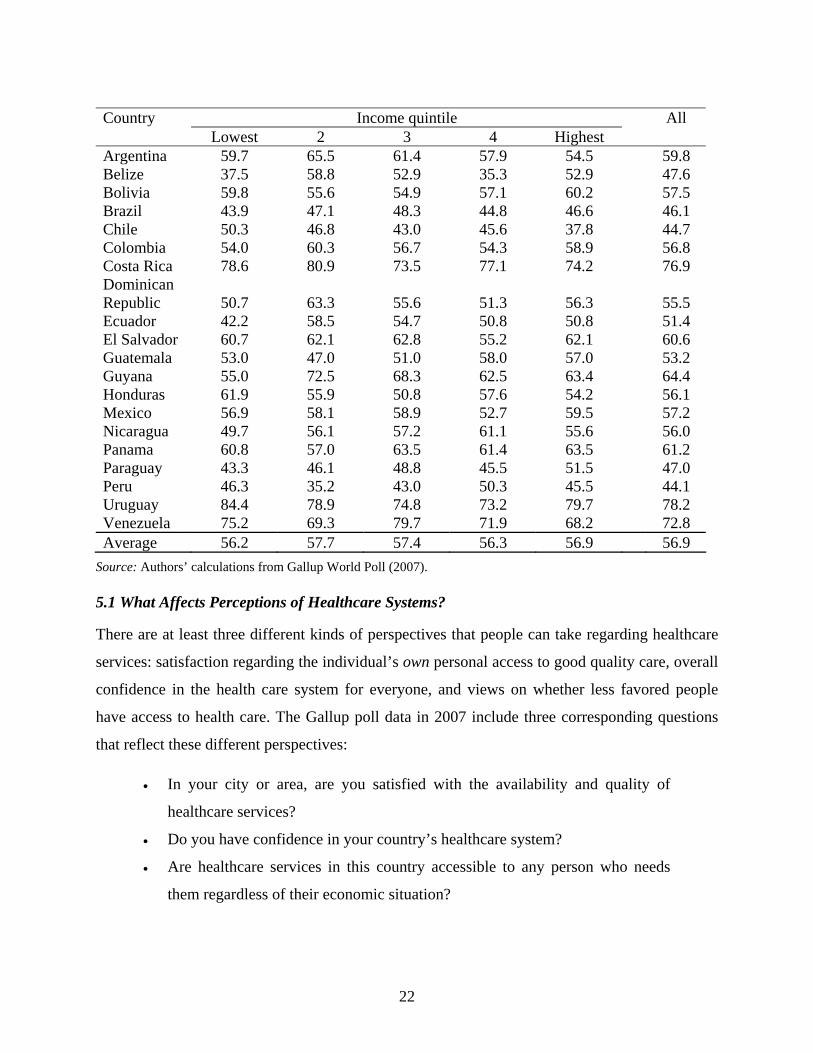
Satisfaction with the availability and quality of health care seems to vary considerably
across countries (see Table 9). More than 70 percent of people in Uruguay, Costa Rica, and
Venezuela report satisfaction with healthcare services. By contrast, less than half of those in
Paraguay, Belize, Chile, Peru and Brazil are satisfied.
Satisfaction with healthcare services also varies across income quintiles, but there is no
consistent pattern across countries. In some countries, the wealthiest quintile expresses less
satisfaction than the poorest quintile, but in many countries the pattern is exactly the opposite.
More refined statistical techniques are needed to ascertain how income and other factors affect
people’s perceptions of the health care system.
Table 9. Share of Respondents Who Are Satisfied with the Availability of Quality Health Care in the City or Area Where They Live, by Income Quintile (%)
22
Country Income quintile All Lowest 2 3 4 Highest Argentina 59.7 65.5 61.4 57.9 54.5 59.8 Belize 37.5 58.8 52.9 35.3 52.9 47.6 Bolivia 59.8 55.6 54.9 57.1 60.2 57.5 Brazil 43.9 47.1 48.3 44.8 46.6 46.1 Chile 50.3 46.8 43.0 45.6 37.8 44.7 Colombia 54.0 60.3 56.7 54.3 58.9 56.8 Costa Rica 78.6 80.9 73.5 77.1 74.2 76.9 Dominican Republic 50.7 63.3 55.6 51.3 56.3 55.5 Ecuador 42.2 58.5 54.7 50.8 50.8 51.4 El Salvador 60.7 62.1 62.8 55.2 62.1 60.6 Guatemala 53.0 47.0 51.0 58.0 57.0 53.2 Guyana 55.0 72.5 68.3 62.5 63.4 64.4 Honduras 61.9 55.9 50.8 57.6 54.2 56.1 Mexico 56.9 58.1 58.9 52.7 59.5 57.2 Nicaragua 49.7 56.1 57.2 61.1 55.6 56.0 Panama 60.8 57.0 63.5 61.4 63.5 61.2 Paraguay 43.3 46.1 48.8 45.5 51.5 47.0 Peru 46.3 35.2 43.0 50.3 45.5 44.1 Uruguay 84.4 78.9 74.8 73.2 79.7 78.2 Venezuela 75.2 69.3 79.7 71.9 68.2 72.8 Average 56.2 57.7 57.4 56.3 56.9 56.9
Source: Authors’ calculations from Gallup World Poll (2007). 5.1 What Affects Perceptions of Healthcare Systems? There are at least three different kinds of perspectives that people can take regarding healthcare
services: satisfaction regarding the individual’s own personal access to good quality care, overall
confidence in the health care system for everyone, and views on whether less favored people
have access to health care. The Gallup poll data in 2007 include three corresponding questions
that reflect these different perspectives: • In your city or area, are you satisfied with the availability and quality of
healthcare services?
• Do you have confidence in your country’s healthcare system?
• Are healthcare services in this country accessible to any person who needs
them regardless of their economic situation?

23
The responses to the first of these questions will be referred to as access, the second as
reliability, and the third as equity. The main hypothesis that we wish to explore is whether the
supply of healthcare services—proxied by the availability of nurses and doctors—increases
perceptions of access, confidence and equity. Further hypotheses to test include whether these
perceptions are systematically affected by a person’s sex, age, income, health insurance
coverage, health, or different features of their country related to the population’s health status or
educational attainment.
5.2 Data and Methodological Considerations The dataset used to analyze these questions contains roughly 12,000 observations, depending
upon which variables are used, from people in 20 countries of Latin America and the Caribbean.
The respondents were adults over 18 years of age, selected randomly from within the household
to avoid the bias that would result from choosing whoever was first available. The interviews
were conducted in person and lasted approximately one hour.
Because the responses are binary (i.e., yes or no), a logit model is appropriate for the
analysis and the resulting estimates are presented in Tables 10, 11, and 12. In addition, the
likelihood of intragroup correlation among individuals in the same country, who are responding
to questions regarding the same health system, was addressed by using a clustered sandwich
estimator which relaxes the assumption that observations be independent within groups (in this
case, countries). This correction only affects the estimation of standard errors and not
coefficients, but therefore affects judgments regarding the statistical significance of the
estimates.
Each question was analyzed with the same set of variables, and six different
specifications are presented. The first model contains all of the individual’s socioeconomic
variables including their self-reported health status. The second model adds a variable regarding
whether the individual feels that they have relatives or friends that they can “count on” when
they are in trouble. This variable, denominated “friends” in the tables, reflects the degree to
which an individual has a social support network and is also probably related to personality and
outlook.1 The third model adds a variable of key interest—the number of doctors per 10,000
inhabitants—a very rough indicator of the supply of health care services in the country. Model

24
four introduces two variables related to financial coverage: whether an individual reports that a
public program would pay for hospital care (labeled “Public Insurance”) or that a private health
insurer would pay for hospital care (labeled “Private Insurance”). Model five introduces
additional country-specific variables: the infant mortality rate (deaths per 100,000 live births),
average educational attainment of the population in years, and the Gini index for measuring
income inequality. The final model removes the country-specific variables (including doctors per
inhabitant) and replaces them with variables to capture all of the fixed effects related to
differences across countries (i.e., dummy variables are introduced for every country but one).2
1 The question that is asked in the survey is: “If you were in trouble, do you have relatives or friends you can count on?” 2 Additional estimations tested how robust particular variables were by replacing them with alternative measures (e.g., supply of nurses instead of the supply of doctors) or eliminating them from the model to see how their absence affected the size and significance of other factors. These alternatives are not reported here for reasons of space but are available from the author by request.

25
Table 10. Responses to “In your city or area, are you satisfied with the availability and quality of healthcare services?” Variable Model 1 Model 2 Model 3 Model 4 Model 5 Model 6 Male -0.059 ** -0.065 ** -0.052 * -0.046 -0.062 ** -0.082 *** Age -0.016 ** -0.014 ** -0.015 ** -0.016 ** -0.015 ** -0.016 ** Age^2 0.000 *** 0.000 *** 0.000 *** 0.000 *** 0.000 *** 0.000 *** Married -0.106 *** -0.111 *** -0.107 *** -0.120 *** -0.140 *** -0.139 *** Urban 0.051 0.058 0.014 0.001 0.018 0.046 Income 0.030 0.022 0.010 -0.016 -0.006 -0.025 Health State 0.111 *** 0.108 *** 0.106 *** 0.098 *** 0.095 *** 0.085 *** Friends 0.144 *** 0.142 *** 0.133 *** 0.146 *** 0.134 *** Doctors 0.188 * 0.152 0.181 ** Public Insurance 0.390 *** 0.448 *** 0.435 *** Private Insurance 0.216 0.285 ** 0.319 *** Infant Mortality 0.015 ** Ave Education -0.095 * Gini Index -5.434 *** Country Fixed Effects No No No No No Yes *** Constant -0.565 ** -0.651 ** -0.787 ** -0.646 * 2.383 ** -0.612 ** N 12,819 12,688 12,688 12,536 12,459 12,536 Pseudo R^2 0.012 0.013 0.016 0.021 0.031 0.041
Note: Significance indicated as: *** 1%; ** 5%; * 10%.

26
Table 11. Responses to “Do you have confidence in your country's healthcare system?” Variable Model 1 Model 2 Model 3 Model 4 Model 5 Model 6 Male -0.060 -0.069 -0.052 -0.054 -0.069 -0.084 * Age -0.020 *** -0.017 *** -0.018 *** -0.020 *** -0.019 *** -0.019 *** Age^2 0.000 *** 0.000 *** 0.000 *** 0.000 *** 0.000 *** 0.000 *** Married -0.049 -0.052 -0.046 -0.057 -0.067 -0.072 Urban -0.220 ** -0.217 ** -0.274 *** -0.281 *** -0.276 *** -0.252 *** Income -0.028 -0.039 -0.054 -0.082 *** -0.072 ** -0.105 *** Health State 0.074 *** 0.069 *** 0.066 *** 0.057 *** 0.055 *** 0.049 *** Friends 0.257 *** 0.255 *** 0.249 *** 0.260 *** 0.248 *** Doctors 0.242 * 0.210 0.263 ** Public Insurance 0.359 *** 0.406 *** 0.335 *** Private Insurance 0.222 0.247 ** 0.219 ** Infant Mortality 0.013 ** Ave Education -0.053 Gini Index -2.618 Country Fixed Effects No No No No No Yes *** Constant 0.453 * 0.286 0.114 0.278 1.536 1.172 *** N 12,766 12,640 12,640 12,491 12,411 12,491 Pseudo R^2 0.008 0.009 0.015 0.019 0.023 0.039
Note: Significance indicated as: *** 1%; ** 5%; * 10%.

27
Table 12. Responses to “Are healthcare services in this country accessible to any person who needs them regardless of their economic situation?”
Variable Model 1 Model 2 Model 3 Model 4 Model 5 Model 6 Male 0.093 ** 0.092 ** 0.098 ** 0.108 ** 0.089 * 0.027 Age -0.006 -0.005 -0.005 -0.009 -0.008 -0.005 Age^2 0.000 0.000 0.000 0.000 0.000 0.000 Married -0.035 -0.033 -0.031 -0.039 -0.068 -0.044 Urban -0.038 -0.041 -0.064 -0.078 -0.066 -0.078 * Income -0.020 -0.028 -0.035 -0.073 ** -0.066 ** -0.115 *** Health State 0.067 *** 0.063 *** 0.062 *** 0.052 *** 0.054 *** 0.048 *** Friends 0.171 ** 0.169 ** 0.154 ** 0.172 ** 0.161 ** Doctors 0.100 0.055 0.022 Public Insurance 0.679 *** 0.750 *** 0.699 *** Private Insurance 0.195 0.300 *** 0.369 *** Infant Mortality 0.025 *** Ave Education -0.012 Gini Index -6.095 ** Country Fixed Effects No No No No No Yes *** Constant -0.166 -0.279 -0.350 -0.158 2.544 * 1.391 *** N 12,839 12,725 12,725 12,583 12,503 12,583 Pseudo R^2 0.004 0.004 0.005 0.023 0.033 0.084
Note: Significance indicated as: *** 1%; ** 5%; * 10%.
28
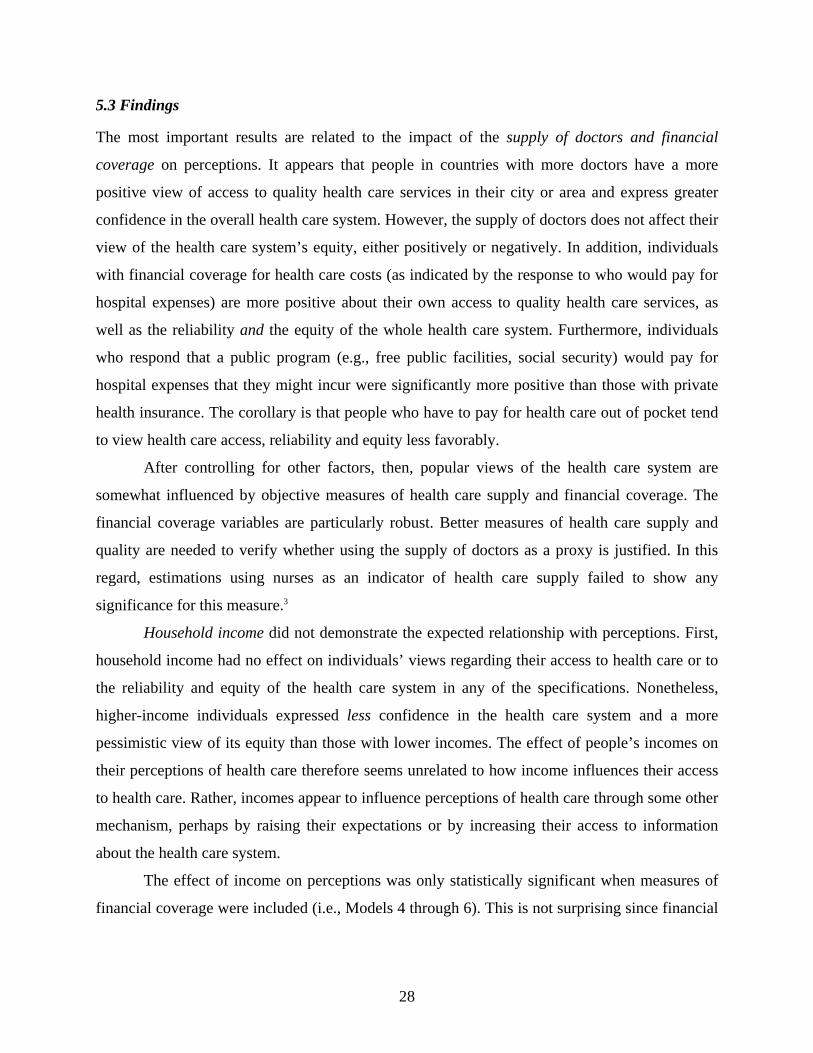
5.3 Findings The most important results are related to the impact of the supply of doctors and financial
coverage on perceptions. It appears that people in countries with more doctors have a more
positive view of access to quality health care services in their city or area and express greater
confidence in the overall health care system. However, the supply of doctors does not affect their
view of the health care system’s equity, either positively or negatively. In addition, individuals
with financial coverage for health care costs (as indicated by the response to who would pay for
hospital expenses) are more positive about their own access to quality health care services, as
well as the reliability and the equity of the whole health care system. Furthermore, individuals
who respond that a public program (e.g., free public facilities, social security) would pay for
hospital expenses that they might incur were significantly more positive than those with private
health insurance. The corollary is that people who have to pay for health care out of pocket tend
to view health care access, reliability and equity less favorably.
After controlling for other factors, then, popular views of the health care system are
somewhat influenced by objective measures of health care supply and financial coverage. The
financial coverage variables are particularly robust. Better measures of health care supply and
quality are needed to verify whether using the supply of doctors as a proxy is justified. In this
regard, estimations using nurses as an indicator of health care supply failed to show any
significance for this measure.3
Household income did not demonstrate the expected relationship with perceptions. First,
household income had no effect on individuals’ views regarding their access to health care or to
the reliability and equity of the health care system in any of the specifications. Nonetheless,
higher-income individuals expressed less confidence in the health care system and a more
pessimistic view of its equity than those with lower incomes. The effect of people’s incomes on
their perceptions of health care therefore seems unrelated to how income influences their access
to health care. Rather, incomes appear to influence perceptions of health care through some other
mechanism, perhaps by raising their expectations or by increasing their access to information
about the health care system.
The effect of income on perceptions was only statistically significant when measures of
financial coverage were included (i.e., Models 4 through 6). This is not surprising since financial

29
coverage has such a large influence on perceptions of health care access, reliability and equity
and since financial coverage is highly correlated with income. This reinforces the idea that
income influences perceptions by raising expectations or increasing information about health
care since it becomes statistically significant after including an indicator—financial coverage—
that more directly influences access to health care services.
An additional finding is that people who are in better health have much more positive
views of the health care system’s accessibility, reliability and equity than those who are ill. An
individual’s self-reported health state, on a scale of 1 to 10, is positively related to all three
perceptions and is statistically significant at the 1 percent level regardless of the model that is
estimated. Furthermore, the estimates using an alternative and more objective measure of health
status (namely, EQ5D), showed a positive and robust impact on perceptions. This finding
suggests that one of the reasons it is difficult to mobilize popular opinion to effect changes in
health care systems may be due to the fact that at any given point in time, most individuals are
reasonably healthy and this contributes to relatively benign views regarding the accessibility,
reliability and equity of health care.
Social support was also a robust factor in explaining perceptions of the health care
system. Individuals who report that they can rely on relatives and friends are also more likely to
express positive views regarding the accessibility, reliability and equity of the health care
system, regardless of the specification used.
Variables that controlled for country characteristics were generally significant but not
always in the expected directions. In countries with greater income inequality, individuals tended
to be less satisfied with their access to quality health care and more pessimistic about the ability
of poor people to get necessary health care, but it had no effect on their opinions regarding the
system’s reliability. Countries with more educated populations tended to express less satisfaction
with their access to health care, while this indicator had no impact on views regarding either
reliability or equity. Finally, after controlling for all other factors, countries with poorer health
status seem to have more positive views regarding access, reliability and equity of health care.
This result is opposite of the uncontrolled correlations between infant mortality and these three
perspectives, which are all negative and significant.
3 Estimations are not reported here due to space limitations but can be obtained by contacting the author.

30
This apparent paradox may result from the choice of variable, as infant mortality is a very
rough indicator of population health status, particularly in Latin America and the Caribbean,
where it is low relative to the range in other developing regions. When life expectancy (also a
very rough measure of population health) was used instead, no statistically significant effect was
found. However, it is more likely that the infant mortality rate is highly correlated with some
other important country-specific factors which are not included in the model and which
overcome any direct effects this variable may have. In this regard, it is worth noting that the
fixed effects models—in which dummy variables control for all average differences across
countries—fit the data better, as indicated by the Pseudo-R2. This difference was quite
substantial for views on equity, for which the fixed effects model had a Pseudo-R2 of 0.084,
compared to only 0.033 in the case of Model 5 that included four country-specific variables.
Perceptions of health care services are influenced by many factors, but the most
consistent ones appear to be a person’s own health status, financial coverage and health care
supply. Individuals are more confident of access to health care services in their own communities
when they are healthier, have financial coverage, and when their country has more doctors. In
such cases, they also express greater confidence in the reliability of the overall health system and
are more likely to believe that people can get health care services in their country regardless of
economic circumstance. Thus, better-functioning health care systems—i.e., ones in which
services are available and financial barriers are reduced—are likely to be perceived as better
systems.
Other factors may interfere in this relatively strong relationship between perceptions of
the health care system and objective measures of its performance. Countries in which people
have strong social support networks tend to be more optimistic and view their health care
system’s accessibility, reliability and equity more favorably regardless of its quality. Within
countries, wealthier people are likely to express less confidence in the health care system and
have a negative view of it’s equity than those with lower incomes after controlling for financial
barriers. Consequently, it appears that the rich have higher expectations for the health care
system and are likely to be more critical than others.

31
6. Conclusions People throughout the world want to live in good health and translate that desire into demands
for access to healthcare services. Ironically, access to health care services is not a certain route to
good health—the links between healthcare services and better health, in the aggregate, are
tenuous even when healthcare services can make a big difference in particular cases. It is also
ironic that the health care services that people demand—e.g., visible high-technology services
like intensive care units at hospitals or pharmaceuticals like anti-retrovirals—are not necessarily
the services that are most needed in comparison to, say, prenatal screening for preeclampsia or
peer counseling on sexually transmitted diseases. The final irony is that the way people perceive
access to health care is weakly associated with objective measures of such access. People may be
appropriately discounting past experience and focusing on the future when they judge their
access to healthcare– relative to other groups in society who enjoy privileged access to the most
advanced and latest medical technologies. However, as a basis for making public policy, this
drive for equity in a system that is continually advancing the mark of “adequate health care” is a
recipe for policymaking in a context of continual frustration.
The main conclusions of this paper are both hopeful and puzzling. First, access to
healthcare services is more widespread and equitable in the Region than ever before, yet large
inequities today are also quite real. Second, the definition of access to healthcare services is
continually changing as a consequence of advances in medical technology, changing supplies
and prices of inputs, public policy actions, and the population’s changing epidemiological
profile. Third, popular perceptions of access to healthcare services are driven both by objective
measures of healthcare service provision, an absolute benchmark, and by expectations regarding
what medicine can do and who is already getting particular services, a relative benchmark.
First, objective measures of the available resources, distribution of resources, utilization
of care, and health outcomes show that people in Latin America and the Caribbean have much
greater access to healthcare services today than ever before. The number of health professionals
and health facilities has expanded almost twice as fast as the rate of population growth, and the
variation across regions within countries has declined. Services that were utilized only by the
most privileged classes of society in the 1950s, such as prenatal care and skilled birth attendance,
are now widespread. Even in the Region’s poorest countries, more than half of pregnant women
in the lowest income quintile utilize these services; while in the Region’s middle income

32
countries, the ratio is between two-thirds and 90 percent. By almost every health outcome
measure—including those which can be linked most closely to health care services such as
neonatal survival—the Region’s access to necessary healthcare services has improved.
Second, success appears to breed discontent. The best predictor of inequitable access in
health care services is a country’s income level (Wagstaff, 2002). As medical advances occur,
wealthier groups get access first. In this relay race, fortunate countries begin to diffuse and
expand access to these services so that the poor eventually get access to these services at rates
that are comparable to the rich. But by the time they catch up, new services, new standards, and
new expectations emerge.
As a consequence of rising access and continuing discontent, public policy is often driven
by factors that are least likely to improve the population’s health status. Building fancy hospitals
is more visible and rewarding to most politicians than distributing bednets. Guaranteeing
everyone access to the same services, on paper, is also more attractive than trying to deal with
the difficult task of improving the efficient management of reimbursements or health care
provision.
The implications for public policy depend essentially on a society’s objectives with
regard to health care access. Better information may give people more realistic expectations of
what existing resources for health care can really deliver, but do we want to discourage the
public from exerting pressure to improve health systems that have room for improvement?
Responding directly to people’s demands—for example, acting on preferences for treatment
instead of prevention or interventions that are less cost-effective but more greatly desired—may
address perceived needs but at a cost of other health gains foregone. Responding to perceptions
is also a losing game, as the expectation of what health care should provide to everyone is a
constantly evolving target.
Ultimately, the quest for improving access to health care services in democratic societies
must rely on a public dialogue, in which popular perceptions are confronted by as much
objective information as possible, inputs from experts regarding cost-effective ways to improve
health inform the discussion, and serious efforts are made by all concerned to increase the
productivity of health care services through advances in management as well as medical
technology.
33
References Cutler, D.M., and M. McClellan. 2001. “Productivity Change in Health Care.” American
Economic Review 91(2): 281-286.
Fajardo-Ortiz, G. 2005. “Escudriñando la historia de la atención hospitalaria en Tapachula,
Chiapas.” Cirugía y Cirujanos 73(3): 237-240.
Griliches, Z., and I. Cockburn. 1994. “Generics and New Goods in Pharmaceutical Price
Indexes.” American Economic Review 84(5): 1213-1232.
Gwatkin, D. et al. 2007. Socio-Economic Differences in Health, Nutrition, and Population within
Developing Countries: An Overview. Washington, DC, United States: World Bank.
Melnyk, K.A. 1990. “Barriers to Care: Operationalizing the Variable.” Nursing Research 39:
108-112.
Penchansky, R., and J.W. Thomas. 1981. “The Concept of Access: Definition and Relationship
to Consumer Satisfaction.” Medical Care 19(2): 127-140.
Rosero-Bixby, L. 2004. “Spatial Access to Health Care in Costa Rica and its Equity: a GIS-
Based Study.” Social Science & Medicine 58(7): 1271-84.
Sapelli, C., and B. Vial. 1998. “Utilización de prestaciones de salud en Chile: ¿Es diferente entre
grupos de ingreso?” Cuadernos de Economía 35(106): 343-382. .
Secretaría Nacional de Salud (SSS). 2008. Sistema Nacional de Información en Salud. Mexico.
http://sinais.salud.gob.mx/infraestructura/
Sekhri, N., and W.D. Savedoff. 2005. “Private Health Insurance: Implications for Developing
Countries.” Bulletin of the World Health Organization 83(2): 127-134.
http://www.who.int/bulletin/volumes/83/2/en/127.pdf
Shengelia, B., C.J.L. Murray and O.B. Adams. 2003. “Beyond Access and Utiliation: Defining
and Measuring Health System Coverage.” In: C.J.L. Murray and D.B. Evans, editors.
Health Systems Performance Assessment: Debates, Methods, and Empiricism. Geneva,
Switzerland: World Health Organization.
Valdivia, M. 2002. “Public Health Infrastructure and Equity in the Utilization of Outpatient
Health Care Services in Peru.” Health Policy and Planning 17(Supplement 1): 12–19

34
Van Doorslaer, E., and C. Masseria. 2004. “Income-Related Inequality in the Use of Medical
Care in 21 OECD Countries.” OECD Health Working Paper 14. Paris, France:
Organisation for Economic Co-operation and Development.
Wagstaff, A. 2002. “Inequalities in Health in Developing Countries: Swimming against the
Tide?” Policy Research Working Paper 2795. Washington, DC, United States: World
Bank.
WHO (World Health Organization). 2006. The World Health Report 2006: Working Together for
Health. Geneva, Switzerland: WHO.