Embed Size (px)
Citation preview

670 IEEE JOURNAL OF BIOMEDICAL AND HEALTH INFORMATICS, VOL. 18, NO. 2, MARCH 2014
A Motion-Tolerant Adaptive Algorithm for WearablePhotoplethysmographic Biosensors
Rasoul Yousefi, Student Member, IEEE, Mehrdad Nourani, Senior Member, IEEE,Sarah Ostadabbas, Student Member, IEEE, and Issa Panahi, Senior Member, IEEE
Abstract—The performance of portable and wearable biosensorsis highly influenced by motion artifact. In this paper, a novel real-time adaptive algorithm is proposed for accurate motion-tolerantextraction of heart rate (HR) and pulse oximeter oxygen saturation(SpO2 ) from wearable photoplethysmographic (PPG) biosensors.The proposed algorithm removes motion artifact due to varioussources including tissue effect and venous blood changes duringbody movements and provides noise-free PPG waveforms for fur-ther feature extraction. A two-stage normalized least mean squareadaptive noise canceler is designed and validated using a novelsynthetic reference signal at each stage. Evaluation of the pro-posed algorithm is done by Bland–Altman agreement and corre-lation analyses against reference HR from commercial ECG andSpO2 sensors during standing, walking, and running at differentconditions for a single- and multisubject scenarios. Experimentalresults indicate high agreement and high correlation (more than0.98 for HR and 0.7 for SpO2 extraction) between measurementsby reference sensors and our algorithm.
Index Terms—Adaptive filter, motion artifact, noise reduction,photoplethysmography (PPG), pulse oximeter, wearable biosensor.
I. INTRODUCTION
A. Motivation
PHOTOPLETHYSMOGRAPHY (PPG) is a noninvasivemeasurement of the blood flow at the surface of the skin
by using red and infrared lights. Two common applications ofthe PPG are calculations of the arterial oxygen saturation andheart rate (HR). There are several new applications in differ-ent stages of maturity that require various analyses on the PPGsignal including amplitude, rhythm, peripheral pulse, respira-tory variability, and tissue perfusion. For example, increasedand decreased signal amplitude can be signs of vasodilationand vasoconstriction, respectively [1]. The amplitude is directlyproportional to the vascular distensibility [2]. PPG signals werealso found to be useful for detection and diagnosis of cardiacarrhythmias [3], [4]. PPG signal is known to be sensitive topulsatile blood flow and captures the peripheral pulses. Thepressure at which the pulse is captured highly corresponds to
Manuscript received October 23, 2012; revised January 8, 2013 and April 1,2013; accepted May 13, 2013. Date of publication May 20, 2013; date of currentversion March 3, 2014.
The authors are with the Quality of Life Technology Laboratory, The Univer-sity of Texas at Dallas, Richardson, TX 75080 USA (e-mail: [email protected]; [email protected]; [email protected]; [email protected]).
Color versions of one or more of the figures in this paper are available onlineat http://ieeexplore.ieee.org.
Digital Object Identifier 10.1109/JBHI.2013.2264358
the systolic blood pressure (BP) [5]. The respiratory rate canbe reliably determined by PPG signal [6]–[8]. Noninvasive con-tinuous tissue perfusion and peripheral blood flow detection isanother potential advantage of the PPG signal.
All the aforementioned applications require a clean and en-hanced signal for feature extraction, analysis, and monitoring.Therefore, the signal quality is critical for wearable PPG sig-nals and systems [9], [10]. In new wearable and implantabledevices/applications, the biometric signal needs to be monitoredduring daily activities where motion is always present. Motionartifact is the most problematic source of noise which deteri-orates signal integrity and can, in the worst case, corrupt it tosuch an extent that it might be rendered clinically unusable. Ex-amples from motions of the patient in real-world clinical settingare movement during transport, rubbing, waving, seizures, andkicking in neonates/infants. As a side effect, inaccurate readingand interpretation of the PPG signal due to motion artifact canincrease caregiver’s workload which can lead to an increasedcost of care and inefficiency of patient’s treatment [11]–[13].Therefore, there is a high demand for an effective algorithmfor wearable and mobile PPG biosensors to enhance the signalquality in the presence of motion artifact.
B. Current State of the Art
Despite all the attractive benefits and applications of the PPGsignal and ease of integration into wearable devices, most ofthe useful information can be distorted or concealed by motionartifact. This is true in all wearable and portable applications inboth clinical settings and daily activities. One of the commonlyused methods to reduce artifact is adaptive noise cancellationusing accelerometers as a noise reference signal [14], [15]. A2-D active noise cancellation has been tried using the directionalaccelerometer data for finger PPG sensor [16]. The addition of areflectance PPG sensor as the reference signal was implementedin [10]. Unfortunately, the reflectance PPG sensor is itself sus-ceptible to motion. The main drawback of all these methods isthe cost of extra hardware for the noise reference. Additionally,using three-axis accelerometer data is computationally inten-sive [10] and they truly reflect motion (as opposed to motion-induced noise). More precisely, researchers found no direct orhigh correlation between acceleration data from accelerome-ter and motion artifact in PPG signal [17]. To deal with thisproblem, a synthetic noise generation method is proposed usingconcurrent usage of singular value decomposition (SVD), inde-pendent component analysis (ICA), and fast Fourier transform(FFT) [18]. The algorithm basically assumes that the originalPPG signal has only power at certain frequencies and the rest
2168-2194 © 2013 IEEE. Personal use is permitted, but republication/redistribution requires IEEE permission.See http://www.ieee.org/publications standards/publications/rights/index.html for more information.
YOUSEFI et al.: MOTION-TOLERANT ADAPTIVE ALGORITHM FOR WEARABLE PHOTOPLETHYSMOGRAPHIC BIOSENSORS 671
is noise and then uses FFT, SVD, and ICA to generate threenoise references. The algorithm switches between three gener-ated reference noise signals by quantifying the randomness ofeach signal using skewness and kurtosis. Such assumption onmotion artifact does not correlate well with different real-worldsources of noise. Moreover, the highest randomness does notnecessarily mean the highest correlation with the true motionartifact in the PPG signal.
On the industry side, Masimo Corporation has introduced dis-crete saturation transform (DST) to find pulse oximeter oxygensaturation in the presence of motion in portable devices [19],[20]. Typically, the DST algorithm consists of a reference sig-nal generator, an adaptive filter, and a peak finder to find themost likely SpO2 value based on the incoming signals. In thisapproach, the reference signal generator produces reference sig-nals for all possible SpO2 values. For each reference signal, theadaptive filter produces an output signal. Energy of each outputsignal is computed and plotted versus corresponding SpO2 val-ues. The right-most peak of the power plot (the largest saturationvalue) is nominally considered as oxygen saturation of arterialblood flow. Since this approach does not remove the motionartifact (e.g., due to tissue effect), the effect of motion artifactwill be literally transformed to the output power plot in DST.More specifically, in presence of motion artifact, new peaks willbe present on the output plot [21] and the peak finder may failto find the peak corresponding to accurate SpO2 . Conversely,the peak corresponding to SpO2 may be concealed due to highmotion noise power causing the peak search to fail for that timewindow.
C. Main Contribution and Paper Organization
In order to address motion artifact issues and design a prac-tical wearable PPG sensor, different sources of motion-inducederror need to be identified, quantified, and estimated. In thispaper, we enhance and expand our earlier work reported in [22]and use the basic optical theory of pulse oximetry to design anddevelop signal-processing techniques for noise reduction andsignal enhancement. We propose a novel two-stage adaptive al-gorithm that efficiently removes the effect of tissue and venousblood noise during motion. This algorithm extracts fundamen-tal period of the PPG signal, the HR, and the oxygen saturationlevel. The key contribution of our technique is to separate anextremely clean signal corresponding to the arterial blood flow.Once the clean signal is provided, a conventional technique canbe used to extract the oxygen saturation value. In this paper, forexperimentation, we have used the conventional ratio of ratiostechnique for SpO2 extraction [23].
This paper is organized as follows. In Section II, a briefreview of optical techniques of the PPG signal generation andoptical theory behind the source of PPG signal are presented.In Section III, we quantify different noise components due tovarious sources and propose a reference noise generator. Then,we formulate the problem of optimum noise source generationto be used in the adaptive algorithm. The proposed algorithm isdescribed in Section IV. The experimental setup and validation
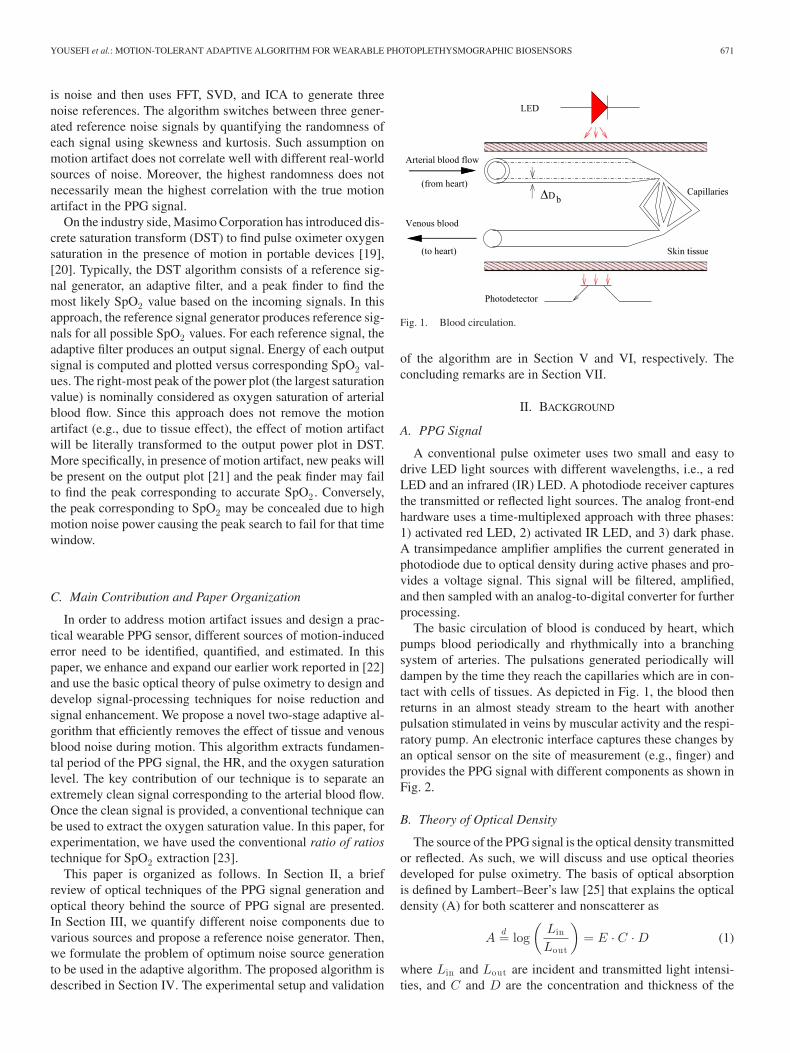
Fig. 1. Blood circulation.
of the algorithm are in Section V and VI, respectively. Theconcluding remarks are in Section VII.
II. BACKGROUND
A. PPG Signal
A conventional pulse oximeter uses two small and easy todrive LED light sources with different wavelengths, i.e., a redLED and an infrared (IR) LED. A photodiode receiver capturesthe transmitted or reflected light sources. The analog front-endhardware uses a time-multiplexed approach with three phases:1) activated red LED, 2) activated IR LED, and 3) dark phase.A transimpedance amplifier amplifies the current generated inphotodiode due to optical density during active phases and pro-vides a voltage signal. This signal will be filtered, amplified,and then sampled with an analog-to-digital converter for furtherprocessing.
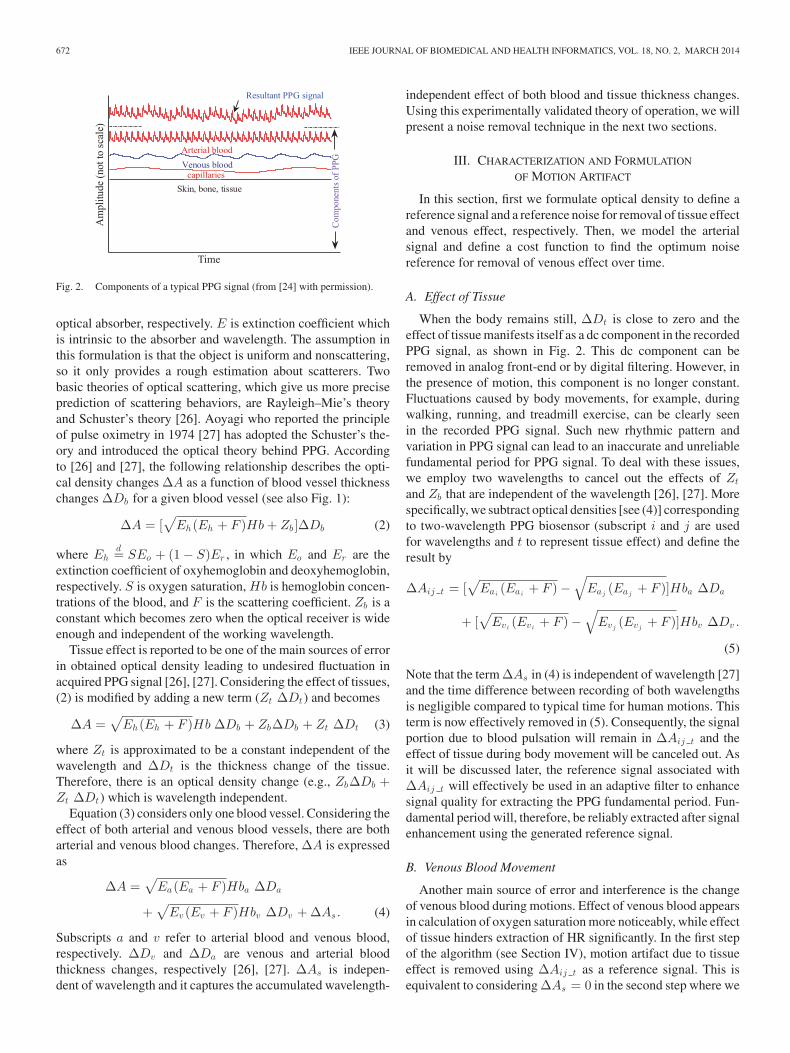
The basic circulation of blood is conduced by heart, whichpumps blood periodically and rhythmically into a branchingsystem of arteries. The pulsations generated periodically willdampen by the time they reach the capillaries which are in con-tact with cells of tissues. As depicted in Fig. 1, the blood thenreturns in an almost steady stream to the heart with anotherpulsation stimulated in veins by muscular activity and the respi-ratory pump. An electronic interface captures these changes byan optical sensor on the site of measurement (e.g., finger) andprovides the PPG signal with different components as shown inFig. 2.
B. Theory of Optical Density
The source of the PPG signal is the optical density transmittedor reflected. As such, we will discuss and use optical theoriesdeveloped for pulse oximetry. The basis of optical absorptionis defined by Lambert–Beer’s law [25] that explains the opticaldensity (A) for both scatterer and nonscatterer as
Ad= log
(Lin
Lout
)= E · C · D (1)
where Lin and Lout are incident and transmitted light intensi-ties, and C and D are the concentration and thickness of the
672 IEEE JOURNAL OF BIOMEDICAL AND HEALTH INFORMATICS, VOL. 18, NO. 2, MARCH 2014
Com
pone
nts o
f PPG
Am
plitu
de (n
ot to
scal
e)
Time
Resultant PPG signal
Skin, bone, tissuecapillaries
Venous bloodArterial blood
Fig. 2. Components of a typical PPG signal (from [24] with permission).
optical absorber, respectively. E is extinction coefficient whichis intrinsic to the absorber and wavelength. The assumption inthis formulation is that the object is uniform and nonscattering,so it only provides a rough estimation about scatterers. Twobasic theories of optical scattering, which give us more preciseprediction of scattering behaviors, are Rayleigh–Mie’s theoryand Schuster’s theory [26]. Aoyagi who reported the principleof pulse oximetry in 1974 [27] has adopted the Schuster’s the-ory and introduced the optical theory behind PPG. Accordingto [26] and [27], the following relationship describes the opti-cal density changes ΔA as a function of blood vessel thicknesschanges ΔDb for a given blood vessel (see also Fig. 1):
ΔA = [√
Eh(Eh + F )Hb + Zb ]ΔDb (2)
where Ehd= SEo + (1 − S)Er , in which Eo and Er are the
extinction coefficient of oxyhemoglobin and deoxyhemoglobin,respectively. S is oxygen saturation, Hb is hemoglobin concen-trations of the blood, and F is the scattering coefficient. Zb is aconstant which becomes zero when the optical receiver is wideenough and independent of the working wavelength.
Tissue effect is reported to be one of the main sources of errorin obtained optical density leading to undesired fluctuation inacquired PPG signal [26], [27]. Considering the effect of tissues,(2) is modified by adding a new term (Zt ΔDt ) and becomes
ΔA =√
Eh(Eh + F )Hb ΔDb + ZbΔDb + Zt ΔDt (3)
where Zt is approximated to be a constant independent of thewavelength and ΔDt is the thickness change of the tissue.Therefore, there is an optical density change (e.g., ZbΔDb +Zt ΔDt ) which is wavelength independent.
Equation (3) considers only one blood vessel. Considering theeffect of both arterial and venous blood vessels, there are botharterial and venous blood changes. Therefore, ΔA is expressedas
ΔA =√
Ea(Ea + F )Hba ΔDa
+√
Ev (Ev + F )Hbv ΔDv + ΔAs. (4)
Subscripts a and v refer to arterial blood and venous blood,respectively. ΔDv and ΔDa are venous and arterial bloodthickness changes, respectively [26], [27]. ΔAs is indepen-dent of wavelength and it captures the accumulated wavelength-
independent effect of both blood and tissue thickness changes.Using this experimentally validated theory of operation, we willpresent a noise removal technique in the next two sections.
III. CHARACTERIZATION AND FORMULATION
OF MOTION ARTIFACT
In this section, first we formulate optical density to define areference signal and a reference noise for removal of tissue effectand venous effect, respectively. Then, we model the arterialsignal and define a cost function to find the optimum noisereference for removal of venous effect over time.
A. Effect of Tissue
When the body remains still, ΔDt is close to zero and theeffect of tissue manifests itself as a dc component in the recordedPPG signal, as shown in Fig. 2. This dc component can beremoved in analog front-end or by digital filtering. However, inthe presence of motion, this component is no longer constant.Fluctuations caused by body movements, for example, duringwalking, running, and treadmill exercise, can be clearly seenin the recorded PPG signal. Such new rhythmic pattern andvariation in PPG signal can lead to an inaccurate and unreliablefundamental period for PPG signal. To deal with these issues,we employ two wavelengths to cancel out the effects of Zt
and Zb that are independent of the wavelength [26], [27]. Morespecifically, we subtract optical densities [see (4)] correspondingto two-wavelength PPG biosensor (subscript i and j are usedfor wavelengths and t to represent tissue effect) and define theresult by
ΔAij t = [√
Eai(Eai
+ F ) −√
Eaj(Eaj
+ F )]Hba ΔDa
+ [√
Evi(Evi
+ F ) −√
Evj(Evj
+ F )]Hbv ΔDv .
(5)
Note that the term ΔAs in (4) is independent of wavelength [27]and the time difference between recording of both wavelengthsis negligible compared to typical time for human motions. Thisterm is now effectively removed in (5). Consequently, the signalportion due to blood pulsation will remain in ΔAij t and theeffect of tissue during body movement will be canceled out. Asit will be discussed later, the reference signal associated withΔAij t will effectively be used in an adaptive filter to enhancesignal quality for extracting the PPG fundamental period. Fun-damental period will, therefore, be reliably extracted after signalenhancement using the generated reference signal.
B. Venous Blood Movement
Another main source of error and interference is the changeof venous blood during motions. Effect of venous blood appearsin calculation of oxygen saturation more noticeably, while effectof tissue hinders extraction of HR significantly. In the first stepof the algorithm (see Section IV), motion artifact due to tissueeffect is removed using ΔAij t as a reference signal. This isequivalent to considering ΔAs = 0 in the second step where we

YOUSEFI et al.: MOTION-TOLERANT ADAPTIVE ALGORITHM FOR WEARABLE PHOTOPLETHYSMOGRAPHIC BIOSENSORS 673
remove effect of venous blood movement. Therefore, we get thefollowing equations for a two-wavelength PPG biosensor:
⎧⎪⎪⎪⎪⎪⎨⎪⎪⎪⎪⎪⎩
ΔAi =√
Eai(Eai
+ F )Hba ΔDa
+√
Evi(Evi
+ F )Hbv ΔDv
ΔAj =√
Eaj(Eaj
+ F )Hba ΔDa
+√
Evj(Evj
+ F )Hbv ΔDv .
(6)
There are two sources of information, ΔAi and ΔAj , and eachsource is a mixture of arterial blood (represented by subscripta) and venous blood (represented by subscript v) at a particularwavelength. The first term of optical density in (6) representsthe arterial signal and the second term represents the venousblood signal. We introduce weighted subtraction of these twosources, venous reference noise, ΔAij v = ΔAi − βΔAj as
⎧⎪⎪⎪⎪⎪⎨⎪⎪⎪⎪⎪⎩
ΔAij v =[(ra − β)
√Eaj
(Eaj+ F )
]Hba ΔDa
+[(rv − β)
√Evj
(Evj+ F )
]Hbv ΔDv
ra =√
Eai(Eai
+ F )/√
Eaj(Eaj
+ F )
rv =√
Evi(Evi
+ F )/√
Evj(Evj
+ F )
(7)
where ra is the ratio of arterial optical densities which is linearlyrelated to arterial oxygen saturation and rv is the ratio of venousoptical densities. After removal of the tissue effect, the weightedsubtraction of optical densities can be used to separate two signalsources related to artery and venous. Equation (7) implies thatwith proper tuning of β, signal associated with ΔAij v maycontain venous source (i.e., β = ra ), artery source (i.e., β = rv )or a combination of these two sources. In other words, we cansweep β and generate a reference signal for the various valuesof β. There is always a range of β where the reference signalhas the venous component and a wider range where the outputsignal has the arterial component.
Successful separation of the venous component in (7) allowsus to use it as the reference noise signal in an adaptive filter toremove the venous noise from (6). In order to find β that removesarterial signal [first term of (7)] and keeps venous signal, weneed a criteria to quantify the performance of any given β. Thearterial signal is a periodic signal with a temporal structure.The more pronounced periodic property of the arterial term in(7) will be exploited by the subsequent adaptive and predictionerror filtering to separate these two signals leading us to obtaingood estimate of the arterial signal. In the next section, weformulate this problem to find the optimum β (βopt) to be usedin estimating the venous noise reference signal and to implementan adaptive filter for removal of venous blood movement noise.
C. Optimum β
To explain the algorithm for optimum β, model of Fig. 3(a)is developed. This model consists of three main units: weightedsubtracter, adaptive enhancer, and predictor filter. The adaptiveenhancer is added to remove the second term of ΔAi in (6) andkeep the arterial component using the subtracter output as thereference noise. The prediction error filtering is used to predict
(a)
(b)
Fig. 3. Modeling temporal structure using predictor filter.
the arterial component using previous values of the signal andgenerate the prediction error.
Inputs x1 and x2 corresponding to the optical densities ΔAi
and ΔAj in (6) are linear combinations of arterial and venoussignals. Using arterial and venous optical density ratios, ra andrv , defined in (7), x1 and x2 can be expressed as{
x1 = rasa + rv sv
x2 = sa + sv .(8)
The subtracter generates weighted subtraction of input signalsx1 and x2 and generates a noise reference signal correspondingto ΔAij v in (7). The adaptive filter uses this noise referencesignal to filter out the noise, second term of (6). Arterial sourcesignal is a temporally correlated signal. As shown in Fig. 3(a),the temporal structure of the enhanced arterial signal can bemodeled with an adaptive filter with the z-transform of B(z) atthe output of the adaptive enhancer. The predictor filter mod-els the generated arterial signal, ra sa(n). The role of B(z)is to estimate ra sa for any given β. For the optimum valueof β, ra sa ≈
√Eai
(Eai+ F )Hb ΔDa (i.e., the first term of
ΔAi), which is a predictable (periodic) signal representing ar-terial signal. Therefore, for βopt , the variance of the predictionerror will be minimized.
In order to find optimum β, algorithm of Fig. 3(b) is imple-mented. This algorithm first extracts a scaled estimate of thearterial signal in x1 (i.e. sas) by minimizing variance of theerror signal e(n) at the output of the linear predictor. The errorsignal, e, is the difference between current sample of sas(n)and the output of the linear predictor filter B(z) which can be asimple finite impulse response (FIR) filter. This relation can bemathematically expressed as
e(n) = (1 − B(z))sas(n). (9)
Generally, the FIR prediction filter of order P can be expressedas
B(z) =P∑
l=0
blz−l . (10)
Optimization of rv and coefficient of B(z) can be done byminimizing mean square error defined as the cost function:
J(rv ,b) = E[e2 ] (11)

674 IEEE JOURNAL OF BIOMEDICAL AND HEALTH INFORMATICS, VOL. 18, NO. 2, MARCH 2014
Fig. 4. Proposed motion-tolerant algorithm for signal enhancement.
where b is the vector of coefficient of FIR filter. This cost func-tion has been previously used in the context of blind signalextraction [28]. In order to simplify the computation and use theextracted fundamental period of the signal, a linear predictor ischosen, B(z) = bz−Ta , where Ta is the fundamental period ofthe arterial source signal in discrete time and b is the only coef-ficient of the filter. The cost function, E[e2 ], can be manipulatedand written as
J(rv , b) = E[s2as(n)] − 2bE[sas(n)sas(n − Ta)]
+ b2E[s2as(n − Ta)]. (12)
When the gradients of the cost function with respect to rv andb are zero, the prediction error has its minimum value. So, byequating gradient of the cost function with respect to rv and bto zero, we obtain a system of equations. Solving this system ofequations, we have
rv =−E[x2
1 ]E[sasD x2 ] + E[x1x2 ]E[sasD x1 ]E[x2
2 ]E[sasD x1 ] − E[x1x2 ]E[sasD x2 ](13)
and
b = E[sas(n)sas(n − Ta)]/E[s2as(n − Ta)]. (14)
It can be proven that for every given b, including b for which∂J (rv ,b)
∂rv= 0, the error curve is a quadratic function of rv and
there is always a single minimum on the error curve. Afterextraction of the scaled estimate of the arterial signal (i.e., sas)in x1 , the reference noise is extracted by removing estimate ofarterial signal from x1 . This is done by minimizing variance ofsignal e1 (reference noise) in Fig. 3(b). By taking gradient of
E[e21 ] with respect to α, we obtain
α =E[x2
1 ] − rvE[x1x2 ]E[sas ]
. (15)
Signal e1 in Fig. 3(b) is actually the reference noise. Therefore,linear combination of signals x1 and x2 (i.e., x1 − βx2) withoptimum β, βopt = αrv
1−α , in Fig. 3(b) provides an estimate ofthe reference venous noise source.
IV. PROPOSED NOISE-TOLERANT ALGORITHM
The proposed algorithm for signal enhancement and extrac-tion of SpO2 /HR is shown in Fig. 4. Our adaptive algorithm hasfive main steps:
1) Remove motion noise due to tissue effect from red andinfrared signals.
2) Extract fundamental period using enhanced red or infraredsignals of step 1.
3) Find optimum venous noise reference (i.e., finding βopt)using red or infrared signals of step 1.
4) Enhance red and infrared signals using time-variant βoptfor monitoring and further feature extraction.
5) Calculate HR and SpO2 using signal obtained after re-moval of motion noise due to tissue and venous bloodchanges during bodily movement.
Next, we explain each of the aforementioned steps imple-mented in block diagram of Fig. 4.
A. Tissue Effect
As we discussed in Section III, by subtracting the red andinfrared signals, a reference signal is obtained (i.e., point P1

YOUSEFI et al.: MOTION-TOLERANT ADAPTIVE ALGORITHM FOR WEARABLE PHOTOPLETHYSMOGRAPHIC BIOSENSORS 675
(a)
(b)
Fig. 5. Adaptive noise canceler (a) with reference noise (N) and (b) withreference signal (M).
in Fig. 4) which corresponds to ΔAij t in (5). This referencesignal is used in adaptive filters (M1 and M2 blocks in Fig. 4)to enhance the red and infrared signals, respectively. As shownin Fig. 5, adaptive noise canceler basically consists of a filteringprocess which applies a linear filter on a reference input. For in-stance, the reference signal I2 in Fig. 5(a) is linearly correlatedwith d(n), the noise component in I1 . Hence, by subtractingthe filter output, d(n), from a desired response, s(n) + d(n) anestimation error will be generated. An adaptive process auto-matically updates the coefficient of the filter based on a criteriaextracted from the estimation error. This criteria will be definedby the adaptive algorithm used for automatic update of the co-efficients. One of the most commonly used algorithms is theleast mean square algorithm and its variations. The adaptive al-gorithm used in this study is the normalized least mean square(NLMS) algorithm due to its lower complexity compared withother techniques and immunity to the fluctuation in the signalenergy.
Given the desired signal, input reference signal I2 , and thecurrent value of the filter coefficient w(n), the update equationcan be expresses as
w(n + 1) = w(n) +2η
ε +∑N −1
i=0 I22 (n − i)
I2(n)e(n) (16)
where N is the length of the adaptive filter and 0 < η < 1. ε isa small number to avoid division by zero due to numerical andfixed-point computations. The error signals e(n) in Fig. 5(a)and (b) are s(n) + d(n) − d(n) and d(n) + s(n) − s(n), re-spectively. In adaptive noise canceler of Fig. 5(a), the referencesignal is only correlated with the noise source. Therefore, min-imizing error power minimizes the noise power in mean squaresense and enhanced signal will be obtained at the output. Simi-larly, in adaptive noise canceler of Fig. 5(b), the reference signalis only correlated with the signal source s(n). Therefore, mini-mizing error power results in an enhanced noise at the primaryoutput, but an enhanced signal output s(n) is also available.Input red and infrared signals corrupted by motion noise are
Fig. 6. Real-time fundamental period estimator.
desired signals in filters M1 and M2 [i.e., input I1 in Fig. 5(b)].The reference signal in filters M1 and M2 of Fig. 4 representthe true signal. The enhanced output x1 and x2 in Fig. 4 arered and infrared signal after the removal of tissue effect comingfrom enhanced signal output in Fig. 5(b).
B. Fundamental Period Extraction
The autocorrelation function C(t) preserves periodicity in-formation of the input signal. When N samples of signal areavailable, autocorrelation can be expressed as
C(t) =1N
N −1∑n=0
x1(n)x1(n + t) (17)
for N larger than period of C(t), Ta , where x1(n) denotes PPGsignal at the adaptive noise canceler M2 in Fig. 4, t is a lag value,and n is discrete time. Both n and t are integers representing timeindices. The autocorrelation sequence has its maximum value atlag zero and integer multiples of its fundamental period, Ta .
The autocorrelation-based method used for pitch detection inspeech signals [29] works well in the presence of additive noise.Adopting and tuning this technique from speech processing,we have developed a fundamental period estimator for PPGbiosensors shown in Fig. 6. It is assumed that the period staysthe same, i.e., the signal is stationary on each frame. The threekey steps involved in this technique are as follows.
1) The autocorrelation of PPG signal is computed, i.e., pointX in Fig. 6 (Window length of autocorrelation function is1500 samples).
2) For each T in the limited range of the period, a window,α1δ(t − T ) + α2δ(t − 2T ) + α3δ(t − 3T ), is generated(i.e., point Y in Fig. 6). Windows are multiplied withautocorrelation function in time domain. This step resultsin a modified autocorrelation function for each window inpoint Z of Fig. 6 which is zero for all T’s except T, 2T ,and 3T .
3) For all modified autocorrelations of step 2, summationof the autocorrelation function is computed and the win-dow passing maximum energy defines period and hencefundamental period, Ta .
α1 , α2 , and α3 are empirically obtained as 1, 0.9, and 0.8,respectively, to enhance the accuracy of period estimator andprevent gross errors. The decreasing amplitude of window isconsidered to reduce susceptibility to period doubling. The ex-tracted fundamental period, Ta , is used in prediction error filterto find the optimum β.

676 IEEE JOURNAL OF BIOMEDICAL AND HEALTH INFORMATICS, VOL. 18, NO. 2, MARCH 2014
C. Updating Optimum β
After removing motion noise due to tissue effect and extract-ing fundamental period, Ta , two signals x1 and x2 in Fig. 4associated with ΔAi and ΔAj are ready. Weighted subtractionof these two signals with current βopt is used to form (7) as a ref-erence noise for adaptive filters N1 and N2 in Fig. 4. Extractedfundamental period is used in the linear predictor to generateprediction error, e. The optimum β is updated using update rules(13) and (15) for rv and α, respectively. This process is doneon a frame basis, and for each frame a new βopt is extracted.βopt gives us the best noise reference, and consequently, the en-hanced output signals contain only arterial component neededto extract features such as SpO2 .
D. Signal Enhancement
The time-variant βopt that provides the best estimation ofmotion noise due to venous blood change is used to generate asynthetic noise reference signal, the input I2 , in adaptive filtersN1 and N2 of Fig. 4. Since noise reference is provided foradaptive noise cancelers N1 and N2, adaptive noise cancelerof Fig. 5(a) is used. The enhanced red and infrared signals canbe used for further feature extraction and monitoring purposes.Dominant and high-power motion noise conceal the waveformamplitude of arterial component when no enhancement algo-rithm is applied. The proposed technique provides clean signalsat the output preserving peak-to-peak value of the arterial signalfor amplitude analysis.
E. SpO2 and HR Extraction
One of the frequently used techniques for the measurementof SpO2 in pulse oximetry is the ratio of ratios technique [23],[25]. This technique extracts the dc and ac parts of the red andIR PPG signals and computes the ratio of ratios, R, as
R =Rac/Rdc
IRac/IRdc(18)
where Rac and Rdc denote the magnitudes of the pulsatile andthe dc parts, respectively, of the PPG obtained at the red wave-length. Similarly, IRac and IRdc are the magnitudes of the pul-satile and dc portions of the IR PPG, respectively. SpO2 is thencalculated by employing the following empirical equation [18],[25]:
SpO2% = (K1 + K2R)% (19)
where K1 and K2 are constants empirically found and tuned fora particular sensor platform.
In our algorithm, the fundamental period is actually the HR.Therefore, the HR is calculated using result of “FundamentalPeriod Extraction” unit in Fig. 4. However, once the clean signalis obtained as the result of our algorithm in Fig (4), any availableHR extraction method in the literature can be applied based onthe application and the need.
Analog and Sampling
UnitsFinger Sensor
Reference Pulse Oximeter
Reference ECG SensorBluetooth Connection
Fig. 7. Experimental setup used for data collection
V. EXPERIMENTAL SETUP
A sensor platform is developed using a finger probe with redLED and infrared LED working at 660 and 895 nm, respectively.Analog conditioning circuit limits bandwidth of the signal to70 Hz and it is acquired with sampling rate of 250 Hz usingbattery powered TMS320C5515 Evaluation Module by TexasInstrument [30]. Hamming window and a low-pass filter, withcutoff frequency at 8 Hz, are implemented on TMS320C5515 inorder to attenuate the unwanted signals. The step size used forupdating the filter coefficient in adaptive noise cancelers M1and M2 of Fig. 4 is 0.002, and for both N1 and N2, the stepsize is 0.0008. Adaptive filters of the length 256 are used for M1and M2 and length 1024 for N1 and N2 in Fig. 4. K1 and K2for SpO2 computation [see (19)] is 105 and −23, respectively.Institutional Review Board approved and volunteers consentwere obtained prior to experimentations.
For the performance evaluation, as shown in experimentalsetup of Fig. 7, in addition to our sensor platform, participantswore commercially available wireless ECG and SpO2 sensors(BioHarness BT by Zepher Technologies and Onyx II, Model9560 by Nonin Medical Inc.). The experiment was done on atreadmill (Triumph 400T) to have control over speed and dura-tions. To test and validate the proposed algorithm, PPG signal iscollected from different subjects doing various motions. Threeexperimentations are designed to observe effect of motion ar-tifact and quantify enhancement using objective and subjectivetests. Fig. 8(a) shows the red PPG signal collected when the userworn the finger PPG sensor during first experiment to observeeffect of motion artifact. Motion types in this test are stand-ing, up-down, and left-right motions of the hand with differentspeed and acceleration, bending of the finger, walking, and run-ning at different speeds. Six subjects between ages of 19–50participated in the experimentation. For the objective test, anexperimentation was designed to validate the performance ofthe algorithm during normal physical activities (standing, walk-ing, and running). One participant, male 28 years old, did a30-min exercise test. This exercise consisted of 5 min walkingat 1 m/h, 5 min walking at 2 m/h, 5 min walking at 3 m/h, 5 minrunning at 4 m/h, 5 min running at 5 m/h, and then a 5 min cooldown. The cool down included 1 min running at 4 m/h, 1 minwalking at 3 m/h, 1 min walking at 2 m/h, and 1 min standing

YOUSEFI et al.: MOTION-TOLERANT ADAPTIVE ALGORITHM FOR WEARABLE PHOTOPLETHYSMOGRAPHIC BIOSENSORS 677
Fig. 8. (a) Sample red PPG signal collected using our sensor system during different motion types and comparing original and enhanced signals. (b) Timedomain. (c) Autocorrelation. (d) Power spectrum. (e) HR. (f) SpO2 .
at rest. Six participants completed controlled subjective exper-iment by walking on the treadmill for 1.5 min at 2 m/h, thenrunning at the speed of 3.5 m/h for another 1.5 min, and finallyrunning for 2 min at 5 m/h.
VI. EXPERIMENTAL RESULTS AND DISCUSSION
A. Effect of Motion Artifact
To see the effect of motion on the PPG signal, spectrogram ofthe original [see Fig. 8(a)] and enhanced PPG signal are shownin Fig. 9(a) and (b), respectively. The spectrogram is computedusing short-time fourier transform with window size of 2048,overlap size of 1024 and 4096 point FFT. High-power noisecomponent which leads to inaccurate and unreliable computa-tion of the HR and SpO2 can be clearly seen in the spectrogrampictured in Fig. 9(a). The removal of high-power noise compo-nents can be seen in Fig. 9(b) which leads to restoration of thetrue power of the signal. Harmonic enhancement can also beobserved which results in enhancement of the autocorrelationfunction and reliable HR computation.
As an example, for the portion of the signal shown in Fig. 8(b),motion artifact has changed the shape and periodicity of the sig-nal. Fig. 8(c) depicts autocorrelation function of the original andenhanced signal. The improvement of the autocorrelation can beobserved which enables us to have a reliable HR computation.
0246810
01.22.43.64.860
0.2
0.4
0.6
0.8
1
Time
Scal
ed P
ower
(a)
0246810
01.22.43.64.860
0.1
0.2
0.3
0.4
0.5
0.6
0.7
Time
Scal
ed P
ower
(b)
Fig. 9. Spectrogram of the PPG signal. (a) Original [see Fig. 8(a)].(b) Enhanced.

678 IEEE JOURNAL OF BIOMEDICAL AND HEALTH INFORMATICS, VOL. 18, NO. 2, MARCH 2014
50 100 150 200−40−20
02040
Average Heart Rate by ECG & PPG (bpm)(b)
Diff
eren
ce 1.96 sd
−1.96 sd
mean
50 100 150 200−40−20
02040
Average Heart Rate by ECG & PPG (bpm)(c)
Diff
eren
ce
80 90 100 110
−50
0
50
Average SpO2 (%)(e)
Diff
eren
ce 1.96 sd
−1.96 sdmean
80 90 100 110−2
0
2
Average SpO2 (%)(f)
Diff
eren
ce
0 5 10 15 20 25 306080
100120140160180
Minute
Hea
rt R
ate
(bpm
) Reference Enhanced Original
0 5 10 15 20 25 3090
95
100
105
110
Minute
SpO
2 (%)
Reference Enhanced Original
514.4 516.4 518.4−1
0
1
Second(a)
Am
plitu
de
514.4 516.4 518.4−1
0
1
Second(d)
Am
plitu
de
1 mph 2 mph 3 mph
4 mph 5 mph Cool Down
(g)
(h)
Fig. 10. (a) 5-s ECG waveform from reference ECG sensor. (b) Bland–Altman plot for original HR. (c) Bland–Altman plot for enhanced HR. (d) 5-s PPG signalfrom our finger sensor. (e) Bland–Altman plot for original SpO2 . (f) Bland–Altman plot for enhanced SpO2 . (g) Comparison of HR from reference ECG sensor,original signal, and enhanced signal. (h) Comparison of SpO2 from reference oximeter, original signals, and enhanced signals.
Fig. 8(d) shows the frequency content of original and enhancedsignals.
After reducing the effect of motion, HR and SpO2 are com-puted every 6 s (e.g., 1500 samples) with no overlap betweenframes of data for original noisy signal of Fig. 8(a). The fun-damental period extracted using algorithm of Fig. 6 is used forcomputation of the HR. Fig. 8(e) shows the HR computed usingboth original motion corrupted and enhanced signals (e.g., afterremoval of tissue effect). As seen in Fig. 8(e), after enhancingthe signal, our method provides a robust HR computation. SpO2computation is very sensitive to the motion. Fig. 8(f) shows theSpO2 computed using original motion corrupted signal and en-hanced signal. The SpO2 values extracted from original signal inquite unreliable, while the enhanced signal (e.g., after removalof tissue and venous effect) provides robust computation of theSpO2 .
B. Performance Evaluation, Objective, and Subjective Tests
Fig. 10(a) and (d) shows portion of ECG and PPG signals,respectively, collected using ECG sensor and our finger clipPPG sensor during objective experiment. As shown, there isa corresponding peak value for every QRS complex of ECG
waveform. Bland–Altman difference plots were used to analyzethe agreement between results from our algorithm and refer-ence measurements. Limit of Agreement (LOA) in this analysisis defined as average difference ±1.96 standard deviation of thedifference ([μ − 1.96σ, μ + 1.96σ]). 95% of all differences liesinside the LOA. HR and SpO2 values are extracted every 6 s.Three hundred pairs of HR measurement are obtained. Fig. 10(g)depicts the reference, original, and enhanced HR. Fig. 10(b) and(c) shows the agreement between HR before and after applyingour algorithm. Before applying the algorithm, in many cases,the ratio of ratios fails to compute the SpO2 . This can be graph-ically seen in Fig. 10(h) in which the computed SpO2 is shownfor reference stationary sensor, original, and enhanced signal.Fig. 10(b) and (c) shows the agreement between HR computedusing original and enhanced signals, respectively. Fig. 10(e)and (f) shows the Bland–Altman plot for SpO2 computed usingoriginal and enhanced signals, respectively.
Correlation coefficient is defined as the covariance of thevariables divided by their standard deviations. Correlation andagreement analyses are compared in Table I. Much higher corre-lation and agreement are achieved after applying our algorithmon the raw signal for SpO2 and HR. Correlation coefficient ofSpO2 measurement after applying our algorithm was 0.71 with

YOUSEFI et al.: MOTION-TOLERANT ADAPTIVE ALGORITHM FOR WEARABLE PHOTOPLETHYSMOGRAPHIC BIOSENSORS 679
TABLE ICOMPARISON OF HR AND SpO2 ACHIEVED BEFORE AND AFTER ALGORITHM
Parameters Corr. Mean Mean Abs. LOABias Bias
Heart Rate (Orig.) 0.91 −2.3 8.7 [−23.5,19.0]Heart Rate (Enh.) 0.99 0.36 2.1 [−5.3,6.0]
SpO2 (Orig./Eqn. (19)) 0 −1.8 6.9 [−26.5,23.0]SpO2 (Orig./DST) 0.1 −5.3 25.6 [−54.3,43.9]
SpO2 (Enh.) 0.73 0.15 0.6 [−1.3,1.6]
Fig. 11. Power plot of DST in the presence of motion artifact. (A) No arterialpeak. (B) Arterial peak is small. (C) Increasing function with no arterial peak.(D) Increasing function with an out-of-range arterial peak.
p-value, probability of getting a correlation as large as the oneobtained randomly, less than 0.00001. There is no correlationbetween SpO2 computed before applying the algorithm due tohigh-power noise component in the signal.
For the purpose of comparison, the DST algorithm is also im-plemented using an adaptive filter of order 32. Reference signalsare generated by sweeping SpO2 with step size of 0.01 from 0%to 100%. SpO2 is computed by finding the right-most peak ofthe power plot and results are summarized in Table I. There is alow correlation between DST algorithm and the reference SpO2measurements. Our proposed approach provides a more reliableSpO2 reading with higher correlation. Fig. 11 shows some ofcommon errors in our experimentation where the DST algorithmreports a false reading due to motion artifact. To observe the be-havior of the output power plot, SpO2 is intentionally sweptin a larger range. The algorithm expects multiple peaks in therange of 0–100% where the assumption is that the right-mostpeak corresponds to arterial oxygen saturation. The amplitudeof the peak associated with arterial oxygen saturation is typi-cally very small as shown in power plot B in Fig. 11. Thesepeaks can easily be affected and concealed by motion artifactas shown in power plots A and B of Fig. 11 where there is nopeak related to arterial oxygen saturation on curve A. In powerplots C and D, not only the peaks are affected by motion artifactbut also the power curves are an increasing functions of SpO2in the range 0–100%. To compare our algorithm versus DST
50 100 150 200
−10
−8
−6
−4
−2
0
2
4
6
8
10
Average Heart Rate by ECG & PPG (bpm)(a)
Diff
eren
ce
1.96 sd
−1.96 sd
mean
80 90 100 110
−3
−2.5
−2
−1.5
−1
−0.5
0
0.5
1
1.5
2
Average SpO2 (%)(b)
Diff
eren
ce
1.96 sd
−1.96 sd
mean
Fig. 12. Bland–Altman plots of HR and SpO2
TABLE IIEVALUATION ON MULTISUBJECT EXPERIMENT
Parameters Corr. Mean Mean Abs. LOABias Bias
Heart Rate 0.98 −0.57 2.7 [−7.0,5.9]SpO2 0.7 −0.35 0.71 [−1.9,1.2]
more specifically, we computed the correlation coefficient forvarious levels of motions, i.e., [1 m/h, 3 m/h, 5 m/h]. The corre-lation coefficients for our algorithm were [0.85, 0.78, 0.64] andfor DST became [0.52, 0.09, 0.03], respectively. As expected,our algorithm performs much better than DST for high level ofmotion artifact.
Bland–Altman plots of Fig. 12(a) and (b) show results ofsubjective experiment for HR and SpO2 measurements. A totalof 300 HR measurement pairs and 295 valid SpO2 readings arecomputed after enhancement of the red and infrared signals. Re-sults of this experimentation are summarized in Table II. Theseresults for multisubject experiment overall show high level ofagreement and correlation between reference measurement andour algorithm.
C. Discussion on Special Cases and Limitations
In some application such as abnormal heart rhythms and largeRespiratory Sinus Arrhythmias (RSA), rapid changes in HR oc-cur. For instance, RSA can modulate RR interval by 40–50%over a respiratory cycle [31]. In the proposed algorithm, thefundamental period is extracted using an autocorrelation-basedmethod after removal of tissue effect. The autocorrelation-basedmethod may result in a limited estimation error of fundamentalperiod in such applications when compared with beat-to-beatHR. Also, batch algorithm derived for removal of venous com-ponent works on consecutive blocks of data with finite numberof samples to optimize the reference noise. These sources oferror might temporarily reduce quality of reference noise andconsequently the filtering in the second stage. There are no sucheffects on the first stage of the algorithm where tissue effect

680 IEEE JOURNAL OF BIOMEDICAL AND HEALTH INFORMATICS, VOL. 18, NO. 2, MARCH 2014
TABLE IIIBEAT-TO-BEAT HR
Parameters Error Corr. Mean Mean Abs. LOABias Bias
Orig. Clean BP 0.021 0.99 0 1.12 [−4.28,4.28]Noisy BP Signal 0.49 0.78 0.10 8.22 [−21.12,21.24]Enh. BP Signal 0.024 0.98 0 1.32 [−4.59,4.59]
is removed. In order to observe sensitivity of filtering to rapidchanges of HR, we have extracted beat-to-beat HR after enhanc-ing the noisy signal with second stage of the algorithm whileusing autocorrelation-based fundamental period extractor andupdate rule for βopt .
Due to high similarity of BP signal with PPG signal, wehave used BP signal from the MIT-BIH polysomnographic [32]database (slp01a) to evaluate beat-to-beat HR. This databaseincludes BP and ECG signals. For evaluation purpose, referenceHR is derived from annotated ECG signal in database. BP signalis standardized to have zero mean and unity variance. Noise isartificially added to 1 h of clean BP signal and signals x1 andx2 are generated according to (8) with ra = 0.9 and rv = 0.6[typical optical density ratios in artery and vein; see also (7)].The noise N (0, 1) is filtered with an FIR low-pass filter withcutoff frequency of 8 Hz and multiplied by a gain factor to haveunity variance in x1 .
To extract the beat-to-beat HR from BP signal, a threshold-based method is used which finds maximum point on the signalin each cycle. BP signal is converted to frames of size 700samples. For each new frame, the mean value is subtracted fromsignal and a clipping level is extracted by computing a fixed per-centage of the maximum amplitude of the signal in that frame.The center clipped signal, the original signal minus the clippinglevel, is extracted and a peak finder finds the location of thepeak value on center clipped waveform. Result are summarizedin Table III. The relative Error in Table III is used in [33] forquantifying beat-to-beat HR and defined as
Error =
√√√√ 1N
N∑j=1
[HR(j) − Ref(j)
Ref(j)
]2
(20)
where N is the total number of beats, and HR and Ref are mea-sured HR and the reference HR obtained from annotated ECGsignal in database, respectively. Our simulation on MIT-BIHdatabase shows that beat-to-beat HR can reliably be extractedusing our algorithm even though there is an estimation error infundamental period due to rapid changes of the HR. Due to rapidchanges in HR and high power of added noise, the threshold-based method has poor performance in extracting HR from noisyBP signal even though threshold is adaptively adjusted to havethe best result. There is a high correlation between beat-to-beatHR from enhanced signal and reference beat-to-beat HR. Tofurther reduce the effect of rhythm irregularities on referencenoise in special applications, the algorithm can be tuned ap-propriately based on features that are supposed to be extractedfrom the enhanced output signals for that particular applica-tion. For instance, the size of autocorrelation window can betuned based on the rate of changes of heart beat or it can be
replaced with available reliable beat-to-beat HR extractor. Asan example, Barros and Ohnishi [33] used RSA as a frequencymodulation occurring on the signal. This study proposed heartinstantaneous frequency with highly accurate estimation of thebeat-to-beat HR. More complex prediction filter with higher or-der and adaptability can also be deployed to reduce impact ofrhythm irregularities.
VII. CONCLUSION
In this paper, a novel adaptive algorithm was developed forsignal enhancement against motion artifact. The algorithm isthen used for robust extraction of HR and oxygen saturation inwearable and portable PPG biosensors. We considered differentsources of error during body movement from optical theoriesdescribing pulse oximetry optics. The problem was mathemati-cally formulated, and at each stage of enhancement, a referencesignal was generated and utilized in NLMS adaptive filter. Theexperimental results validated reliable extraction of HR andoxygen saturation with correlation of more than 0.98 and 0.7,respectively, compared to reference stationary sensors in thepresence of the motion artifact.
REFERENCES
[1] K. H. Shelley, “Photoplethysmography: Beyond the calculation of arterialoxygen saturation and heart rate,” Anesth. Analg., vol. 105, no. 6, pp. S31–S36, Dec. 2007.
[2] J. C. Dorlas and J. A. Nijboer, “Photo-electric plethysmography as amonitoring device in anaesthesia. Application and interpretation,” Br. J.Anaesth., vol. 57, pp. 524–530, 1985.
[3] V. F. Blanc, M. Haig, M. Troli, and B. Sauve, “Computerized photo-plethysmography of the finger,” Can. J. Anaesth., vol. 40, pp. 271–278,1993.
[4] A. Awad, M. A. Ghobashy, R. G. Stout, D. G. Silverman, andK. H. Shelley, “How does the plethysmogram derived from the pulseoximeter relate to arterial blood pressure in coronary artery bypass graftpatients?,” Anesth. Analg., vol. 93, pp. 1466–1471, 2001.
[5] B. Jonsson, C. Laurent, T. Skau, and L. G. Lindberg, “A new probe for an-kle systolic pressure measurement using photoplethysmography (PPG),”Ann. Biomed. Engl., vol. 33, pp. 232–239, 2005.
[6] P. A. Leonard, J. G. Douglas, N. R. Grubb, D. Clifton, P. S. Addison,and J. N. Watson, “A fully automated algorithm for the determination ofrespiratory rate from the photoplethysmogram,” J. Clin. Monit. Comput.,vol. 20, pp. 33–36, 2006.
[7] L. Nilsson, A. Johansson, and S. Kalman, “Respiration can be monitoredby photoplethysmography with high sensitivity and specificity regard-less of anaesthesia and ventilatory mode,” Acta Anaesth. Scand., vol. 49,pp. 1157–1162, 2005.
[8] J. Y. Foo and S. J. Wilson, “Estimation of breathing interval from thephotoplethysmographic signals in children,” Physiol. Meas., vol. 26, no. 6,pp. 1049–1058, 2005.
[9] P. Bonato, D. De Rossi, A. Dittmar, S. Jayaraman, I. Korhonen,A. Lymberis, E. Mc Adams, and Y. Zhang, “IEEE EMBS technical com-mittee on wearable biomedical sensors and systems: Position paper,” inProc. Int. Workshop Wearable Implantable Body Sensor Netw., 2006,pp. 212–214.
[10] H. H. Asada, P. Shaltis, A. Reisner, S. Rhee, and R. C. Hutchinson, “Mo-bile monitoring with wearable photoplethysmographic biosensors,” IEEEEng. Med. Biol. Mag., vol. 22, no. 3, pp. 28–40, May/Jun. 2003.
[11] R. T. Brouillette, J. Lavergne, A. Leimanis, G. M. Nixon, S. Ladan, andC. D. McGregor, “Differences in pulse oximetry technology can affect de-tection of sleep-disordered breathing in children,” Anesth. Analg., vol. 94,pp. 47–53, 2002.
[12] C. G. Durbin and S. K. Rostow, “More reliable oximetry reduces thefrequency of arterial blood gas analyses and hastens oxygen weaning aftercardiac surgery: A prospective, randomized trial of the clinical impact ofa new technology,” Crit. Care Med., vol. 30, pp. 1735–1740, 2002.

YOUSEFI et al.: MOTION-TOLERANT ADAPTIVE ALGORITHM FOR WEARABLE PHOTOPLETHYSMOGRAPHIC BIOSENSORS 681
[13] B. Bohnhorst and C. F. Poets, “Major reduction in alarm frequency witha new pulse oximeter,” Intens. Care Med., vol. 24, pp. 277–278, 1998.
[14] L. B. Wood and H. Asada, “Low variance adaptive filter for cancellingmotion artifact in wearable photoplethysmogram sensor signals,” in Proc.Conf. IEEE Eng. Med. Biol. Soc., Aug. 2007, pp. 652–655.
[15] S. H. Kim, D. W. Ryoo, and C. Bae, “Adaptive noise cancellation usingaccelerometers for the PPG signal from forehead,” in Proc. Conf. IEEEEng. Med. Biol. Soc., Aug. 2007, pp. 2564–2567.
[16] H. Han, M. J. Kim, and J. Kim, “Development of real-time motion artifactreduction algorithm for a wearable photoplethysmography,” in Proc. Conf.IEEE Eng. Med. Biol. Soc., Aug. 2007, pp. 1538–1541.
[17] H. H. Asada, H. Jiang, and P. Gibbs, “Active noise cancellation usingMEMS accelerometers for motion-tolerant wearable bio-sensors,” in Proc.Conf. IEEE. Eng. Med. Biol. Soc., Sep. 2004, vol. 1, pp. 2157–2160.
[18] M. R. Ram, K. V. Madhav, E. H. Krishna, N. R. Komalla, andK. A. Reddy, “A Novel approach for motion artifact reduction in PPGsignals based on AS-LMS adaptive filter,” IEEE Trans. Instrum. Meas.,vol. 61, no. 5, pp. 1445–1457, May 2012.
[19] J. M. Goldman, M. T. Petterson, R. J. Kopotic, and S. J. Barker, “Masimosignal extraction pulse oximetry,” J. Clin. Monit., vol. 16, pp. 475–483,2000.
[20] J. M. Graybeal and M. T. Petterson, “Adaptive filtering and alternative cal-culations revolutionizes pulse oximetry sensitivity and specificity duringmotion and low perfusion,” in Proc. IEEE Eng. Med. Biol. Soc., 2004,vol. 7, pp. 5363–5366.
[21] Masimo Corp. (2012). Signal extraction technology. [Online]. Available:http://www.masimo.com/pdf/whitepaper/LAB1035R.PDF
[22] R. Yousefi, M. Nourani, and I. Panahi, “Adaptive cancellation of motionartifact in wearable biosensors,” in Proc. Int. Conf. IEEE Eng. Med. Biol.Soc., Aug. 2012, pp. 2004–2008.
[23] J. E. Sinex, “Pulse oximetry: Principles and limitations,” Amer. J. Emerg.Med., vol. 17, no. 1, pp. 59–68, Jan. 1999.
[24] K. A. Reddy, B. George, N. M. Mohan, and V. J. Kumar, “A novelcalibration-free method of measurement of oxygen saturation in arterialblood,” IEEE Trans. Instrum. Meas., vol. 58, no. 5, pp. 1699–1705, May2009.
[25] J. G. Webster, Design of Pulse Oximeters. New York, NY, USA: Taylor& Francis, 1997.
[26] T. Aoyagi, M. Fuse, N. Kobayashi, K. Machida, and K. Miyasaka, “Mul-tiwavelength pulse oximetry: Theory for the future,” Anesth. Analg.,vol. 105, no. 6, pp. S53–S58, Dec. 2007.
[27] T. Aoyagi, “Pulse oximetry: Its invention, theory, and future,” J. Anesth.,vol. 17, pp. 259–266, 2003.
[28] A. K. Barros and A. Cichocki, “Extraction of specific signals with tempo-ral structure,” Neural Comput., vol. 13, no. 9, pp. 1995–2003, 2001.
[29] J. D. Wise, J. R. Caprio, and T. W. Parks, “Maximum likelihood pitchestimation,” IEEE Trans. Acoust. Speech Signal Process., vol. 24, no. 5,pp. 418–423, Oct. 1976.
[30] Texas Instrument Inc. (2013). [Online]. Available: http://www.ti.com/tool/tmdxevm5515
[31] J. A. Hirsch and B. Bishop, “Respiratory sinus arrhythmia in humans:How breathing pattern modulates heart rate,” Amer. J. Physiol., vol. 241,no. 4, pp. 620–629, 1981.
[32] MIT-BIH Arrhythmia Database. (2013). [Online]. Available: www.physionet.org/physiobank/database/mitdb
[33] A. K. Barros and N. Ohnishi, “Heart instantaneous frequency (HIF): Analternative approach to extract heart rate variability,” IEEE Trans. Biomed.Eng., vol. 48, no. 8, pp. 850–855, Aug. 2001.
Rasoul Yousefi (S’11) received the B.S. degreein electrical engineering from Shiraz University,Shiraz, Iran, and the M.Sc. degree in circuits and sys-tems from the University of Tehran, Tehran, Iran, in2006 and 2009, respectively. He is currently workingtoward the Ph.D. degree in electrical engineering atthe University of Texas at Dallas, Richardson, USA.
His research interest includes digital circuits andsystems and signal processing with an emphasis onmedical devices and biomedical sensors. Since 2010,he has been a member of SoC Design and Test labo-
ratory and the QoLT laboratory, University of Texas at Dallas.Mr. Yousefi is a student member of the IEEE Engineering in Medicine and
Biology Society.
Mehrdad Nourani (S’91–M’94–SM’05) receivedthe B.Sc. and M.Sc. degrees in electrical engineer-ing from the University of Tehran, Tehran, Iran, andthe Ph.D. degree in computer engineering from CaseWestern Reserve University, Cleveland, OH, USA.
He is currently a Professor of Electrical Engi-neering at the University of Texas at Dallas (UTD),Richardson, USA. He is a Co-Founder of the Qual-ity of Life Technology laboratory, UTD, where heconducts an interdisciplinary research lab focused ondeveloping innovative technology and systems that
improve people’s quality of life. He has published more than 250 papers in jour-nals and refereed conference proceedings. His current research interests includefault-tolerant architectures, system-on-chip testing, design for reliability, andspecial-purpose IC/system design for biomedical/biological applications.
Dr. Nourani is a recipient of multiple awards from Clark Foundation ResearchInitiation Grant, National Science Foundation Career, Cisco Systems Inc., andSemiconductor Research Corporation. He is a member of the IEEE ComputerSociety and the ACM SIGDA.
Sarah Ostadabbas (S’11) received the B.Sc. degreein both electrical and biomedical engineering fromAmirkabir University of Technology, Tehran, Iran, in2005, and the M.Sc. degree in control engineeringfrom the Sharif University of Technology, Tehran,in 2007. She is currently working toward the Ph.D.degree in electrical engineering at the University ofTexas at Dallas, Richardson, USA.
Her research interests include embedded systemsand signal processing with an emphasis on medi-cal/biological applications and modeling. A major
application of her research is the prevention of pressure ulcer formation andamputation through predictive modeling and scheduling therapeutic care. Sheis a member of the Quality of Life Technology Laboratory, University of Texasat Dallas.
Ms. Ostadabbas is a student member of the IEEE Engineering in Medicineand Biology Society and the IEEE Women in Engineering Society.
Issa Panahi (S’84–M’88–SM’07) received the M.Sc.degree in electrical engineering from Florida Insti-tute of Technology, Melbourne, Florida, USA andthe Ph.D. degree from the University of Colorado atBoulder, Colorado, USA.
He is currently an Associate Professor of Elec-trical Engineering and also an Associate ResearchFaculty of biomedical engineering at the Universityof Texas at Dallas (UTD), Richardson, USA. He isFounding Director of the Statistical Signal Process-ing and Acoustic Research Laboratories. His research
interests include audio/acoustic/speech signal processing, stimation, identifica-tion, source separation, and noise cancellation. He joined the faculty of UTDafter working in research centers and industry for 16 years. He was a DSPChief Architect, Chief Technology Officer, and Advance Systems DevelopmentManager in the embedded DSP systems business unit at Texas Instruments. Heholds one US patent and is author/co-author of four Texas Instruments booksand more than 80 technical journal and conference articles.
He was the Founder and Vice Chair of the IEEE-Dallas Chapter of the IEEEEngineering in Medicine and Biology Society (EMBS). He is the Chair of theIEEE Dallas Chapter of IEEE Signal Processing Society. He received the 2005and the 2011 “Outstanding Service Award” from the IEEE Section. He wasan organizing member and Chair of the Plenary Sessions of the 2010 IEEEInternational Conference on Acoustics, Speech, and Signal Processing. He hasbeen session organizer and chair of several tracks at EMBS conferences.