Embed Size (px)
Citation preview
Statement A: Approved for public release; distribution is unlimited. DESTRUCTION NOTICE - For classified documents, follow the procedures in DoD 5200.22-M, National Industrial Security Program Manual, Chapter 5, Section 7. For unclassified, limited documents, destroy by any method that will prevent disclosure of contents or reconstruction of the document.
A MONTE CARLO APPROACH TO MODELING THE BREAKUP OF THE SPACE LAUNCH SYSTEM EM-1 CORE STAGE WITH AN INTEGRATED BLAST AND FRAGMENT CATALOGUE
E. H. Richardson
NASA MSFC
Huntsville, AL
M. J. Hays, J. M. Blackwood, T. Skinner
Bangham Engineering Inc.
Huntsville, AL
ABSTRACT
The Liquid Propellant Fragment Overpressure Acceleration Model (L-FOAM) is a tool developed by Bangham Engineering Incorporated (BEi) that produces a representative debris cloud from an exploding liquid-propellant launch vehicle. Here it is applied to the Core Stage (CS) of the National Aeronautics and Space Administration (NASA) Space Launch System (SLS launch vehicle). A combination of Probability Density Functions (PDF) based on empirical data from rocket accidents and applicable tests, as well as SLS specific geometry are combined in a MATLAB script to create unique fragment catalogues each time L-FOAM is run—tailored for a Monte Carlo approach for risk analysis. By accelerating the debris catalogue with the BEi blast model for liquid hydrogen / liquid oxygen explosions, the result is a fully integrated code that models the destruction of the CS at a given point in its trajectory and generates hundreds of individual fragment catalogues with initial imparted velocities. The BEi blast model provides the blast size (radius) and strength (overpressure) as probabilities based on empirical data and anchored with analytical work. The coupling of the L-FOAM catalogue with the BEi blast model is validated with a simulation of the Project PYRO S-IV destruct test. When running a Monte Carlo simulation, L-FOAM can accelerate all catalogues with the same blast (mean blast, 2 σ blast, etc.), or vary the blast size and strength based on their respective probabilities. L-FOAM then propagates these fragments until impact with the earth. Results from L-FOAM include a description of each fragment (dimensions, weight, ballistic coefficient, type and initial location on the rocket), imparted velocity from the blast, and impact data depending on user desired application. L-FOAM application is for both near-field (fragment impact to escaping crew capsule) and far-field (fragment ground impact footprint) safety considerations. The user is thus able to use statistics from a Monte Carlo set of L-FOAM catalogues to quantify risk for a multitude of potential CS destruct scenarios. Examples include the effect of warning time on the survivability of an escaping crew capsule or the maximum fragment velocities generated by the ignition of leaking propellants in internal cavities.
INTRODUCTION
The NASA Space Launch System (SLS) program requires the creation of debris catalogues that describe the fragment population resulting from a purposeful or inadvertent destruction of the Launch Vehicle (LV) during fueling, ascent and re-entry into the atmosphere. The debris catalogues are a necessary component in the determination of the Loss of Crew (LoC) probability, and are a required input to the Air Force’s 45th Space Wing (i.e. the Range) to ensure the public is properly protected from falling debris. The fragment catalogues for SLS can be divided into two primary classes—one for the liquid fueled portions of the rocket and one for the solid fueled portions of the rocket. This paper discusses the Liquid Propellant Fragment Overpressure Acceleration Model (L-FOAM), and addresses only the liquid fueled portion of the SLS rocket, specifically the EM-1 configuration of the CS. Additionally, the scope of the presented breakup model is applicable only to the fueled portions of the CS operation (e.g. on-pad and ascent only). Structural breakup is modeled to occur as the result of accidental fuel and oxidizer mixing and their resultant explosive combustion. Fragment-to-fragment interaction and crack propagation from aerodynamic forces are not
https://ntrs.nasa.gov/search.jsp?R=20150002599 2018-07-17T11:07:02+00:00Z
Statement A: Approved for public release; distribution is unlimited. DESTRUCTION NOTICE - For classified documents, follow the procedures in DoD 5200.22-M, National Industrial Security Program Manual, Chapter 5, Section 7. For unclassified, limited documents, destroy by any method that will prevent disclosure of contents or reconstruction of the document.
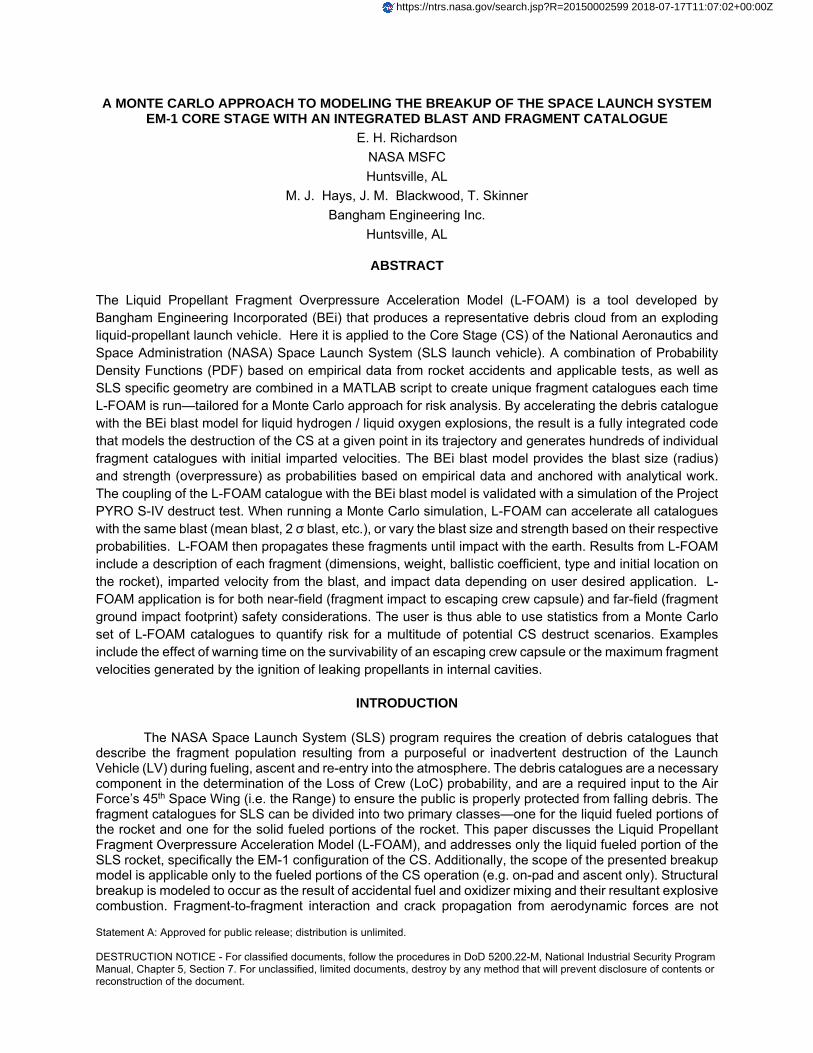
explicitly modeled, but are implicitly included due to L-FOAM’s empirical methodology. A full analytical solution of the expected blast environment and subsequent breakup mechanisms of the CS remains impractical, so it is necessary to incorporate empirical solutions to help characterize the fragment population and the imparted velocity due to the blast. Historical models of liquid-fueled rocket accident environments report the catalogue with only a dozen or so fragment classes for a variety of Mission Elapsed Times (METs) [1]. This major simplification of the fragment population results in a stair-stepping effect on mass and ballistic coefficients. One of the downsides of this approach can be seen in Figure 1, where each individual point represents an entire fragment class.
Figure 1: NSWC catalogue imparted velocities for MET = 450 seconds, where each point represents an entire fragment class
Using such an approach, ground impact assessments are thus necessarily limited to producing a small set of impact lines that show the maximum range of these sparse fragment classes. Additional statistical assumptions must be made to extrapolate out the full range of fragment shapes and imparted velocities for both LoC calculation and ground-based risk assessments. It was desired to move away from this approach, and move to a catalogue paradigm that is more reflective of the actual blast/fragment environments expected in an abort scenario, and is custom-made for Monte Carlo analysis. The result is L-FOAM, which produces thousands of unique fragments (2,000-4,000 fragments per catalogue) for an on-pad mishap or an explosion at any point in the ascent of the CS, with outputs including dimensions, imparted velocities and impact location for each individual fragment. Figure 2 shows how the L-FOAM model has a continuous prediction of the fragments in an accident environment. Each circle represents an individual fragment, and the different groupings show the expected variation within fragment classes. Such detailed output allows the user to quickly visualize the evolving fragment population as MET, vehicle configuration or blast strength is changed, opening the door for more well-informed trade studies.

Statement A: Approved for public release; distribution is unlimited. DESTRUCTION NOTICE - For classified documents, follow the procedures in DoD 5200.22-M, National Industrial Security Program Manual, Chapter 5, Section 7. For unclassified, limited documents, destroy by any method that will prevent disclosure of contents or reconstruction of the document.
Figure 2: L‐FOAM output for MET = 35 seconds, where each circle represents an individual fragment
The fragment catalogue is accelerated using the BEi blast model. This fragment and blast coupling methodology is validated against empirical data, as shown in the “Acceleration and Propagation” section. L-FOAM propagates each fragment until it reaches the ground, target object, or predefined location in flight. The various outputs of the program are then able to be analyzed using Monte Carlo methodology to determine which individual catalogues represent the desired statistical parameters. An example would be tracking the impact of SLS CS fragments relative to the crew capsule as it is being carried away by the Launch Abort System (LAS)—recording the imparted kinetic energy at impact to determine LoC, and marking impact location/time to better inform abort logic. The Monte Carlo approach provides the user a picture of potential outcomes to a given abort scenario; gaining higher confidence in decision making efforts and enabling positive design changes.
RESULTS AND DISCUSSION
The L-FOAM model is predicated on empirical data from explosions of liquid-fueled rockets—both tests and accidents. There have been numerous liquid-fueled rocket accidents, however typical post-accident recovery efforts are primarily focused on the removal of any hazardous material with forensic interest only in determining accident causes, not in characterizing the produced blast/fragment environment. Thus, the applicable fragment data from accidents is somewhat limited in describing the full fragment population.
However, one large-scale test in the Project PYRO test series collected adequate fragment information to characterize the gross breakup trends of a liquid propellant rocket system. Project PYRO focused on characterizing the blast hazard for cryogenic fuel/oxidizer systems, with the vast majority of tests on the small scale in comparison to an actual rocket stage [2]. However, one large-scale test destructed a full sized Saturn S-IV stage by using a cutter ram to rapidly fail the common bulkhead between the fuel and oxidizer tanks. See Figure 3. The resulting explosion destroyed the S-IV stage and much of its stand. There were no engines included in this test. An ignition system was included to ensure combustion of the propellants after sufficient mixing had occurred, but the propellants auto-ignited before significant mixing was achieved. This test is considered to be representative of the mixing and auto-ignition relationship expected in the event of a catastrophic failure of the SLS CS due to a load related failure or
0
200
400
600
800
1000
1200
0.1 1 10 100 1000
Imparted Velocity (ft/s)
Ballistic Coefficient (lb/ft^2)
MET = 35 seconds

Statement A: Approved for public release; distribution is unlimited. DESTRUCTION NOTICE - For classified documents, follow the procedures in DoD 5200.22-M, National Industrial Security Program Manual, Chapter 5, Section 7. For unclassified, limited documents, destroy by any method that will prevent disclosure of contents or reconstruction of the document.
Range commanded destruct. Post-test fragment collection focused on those fragments that were over 1 lb. The collated database of fragments includes the weight, approximate dimensions and type of fragment (tank, support structure, etc.). This database forms the probabilistic foundation for the L-FOAM internal logic. An additional table is mentioned in the report that is purported to include all fragments over 1 inch in selected areas after the test. The table is not included in any of the digitized versions available for NASA and its subcontractors. The re-discovery of this table would help further refine the fragmentation trends for full stage destructs.
Figure 3: Project PYRO S‐IV Stage Destruct Test
It is necessary to collate the limited available data from the Project PYRO S-IV test to produce several Probability Density Functions (PDFs) capable of predicting general size trends for the major components of the CS of SLS. The three main fragment classes are tank, insulation and ancillary fragments. The tank fragment class can be further broken up into fuel tank and oxidizer tank, but the underlying PDF remains the same. Likewise, there are several types of insulation with varying thicknesses on the CS, but two Solid Rocket Booster (SRB) derived PDFs from the Titan 34D-9 accident and 1202-1 test are sufficient to describe the extent of the fragmentation and the relative sizes of the fragments [3,4]. The ancillary fragment class is the most ambiguous of the three as it includes a wide range of disparate rocket materials such as baffles, avionics boxes, and structural supports. The Project PYRO S-IV fragment catalogue provides enough data to create a PDF for the range of expected size and weight of this generic fragment class, thereby encompassing the aggregate risk for this wide range of specific parts. Future L-FOAM catalogues will better differentiate between the various components currently lumped together in this fragment class. It is important to note that the engines are modeled as being ejected intact from the destroyed CS. This matches historical trends in which the engines are mostly undamaged (in a fragment generation standpoint) until ground impact [5-8]. The specific case of an uncontained engine explosion is not explicitly addressed by the delivered L-FOAM catalogues at this time.
The Project PYRO S-IV test did not include sufficient insulation fragment information to develop a reliable probabilistic model for the breakup of this fragment class. The lack of insulation fragment data for

Statement A: Approved for public release; distribution is unlimited. DESTRUCTION NOTICE - For classified documents, follow the procedures in DoD 5200.22-M, National Industrial Security Program Manual, Chapter 5, Section 7. For unclassified, limited documents, destroy by any method that will prevent disclosure of contents or reconstruction of the document.
liquid-fueled rockets in general required looking elsewhere for usable data. The Titan 34D-9 accident report included detailed maps identifying the areas of the steel SRB case where the insulation remained adhered and did not form new fragments, see Figures 4 and 5 below:
Figure 4: Disassociation from Range Destruct Figure 5: Disassociation from Random Case Failure
This data informs the distribution on how much insulation becomes disassociated from the tank in the SLS CS. The only empirical data adequate to make a PDF on the breakup sizes of insulation comes from the 1202-1 test, in which the Air Force purposely destructed a 2 segment solid rocket motor. Similitude for these two solid propellant derived distributions is discussed at greater length in the insulation fragment section.
TANK FRAGMENTS
This fragment class takes up a large fraction of the total dry mass of the CS. The Project PYRO S-IV fragment data is weighted towards oxygen and hydrogen tank fragments, so this is a well-characterized population. The mass properties for the hydrogen and oxygen tanks are:
Hydrogen tank dry mass = 31,963 lbs. Oxygen tank dry mass = 17,124 lbs.
The general equation for determining the log-normal probability distribution is given by:
f iσ √ π
e σ (1)

Statement A: Approved for public release; distribution is unlimited. DESTRUCTION NOTICE - For classified documents, follow the procedures in DoD 5200.22-M, National Industrial Security Program Manual, Chapter 5, Section 7. For unclassified, limited documents, destroy by any method that will prevent disclosure of contents or reconstruction of the document.
where µ is the mean and σ is the standard deviation. This is the underlying distribution for the “LOGNRND” function in MATLAB that L-FOAM uses to generate appropriately sized tank fragments. The PDFs for the X and Y dimensions are described below, and shown with the data in Figure 6:
X dimension: µ = 3.5 in. σ = 0.6 in.
Y dimension: µ = 3.0 in. σ = 0.6 in.
Figure 6: Curve Fits for X and Y Dimension PDFs (PYRO S‐IV Based)
The Z dimension is fixed based on the wall thickness of the respective tank. L-FOAM generates fragments according to the two PDFs and tank thickness until the total tank mass is accounted for. Both hydrogen and oxygen tanks are modeled using the same dimensional PDFs since the collated fragment data show little size distribution difference other than the tank thickness. This seems reasonable given that the propellant tanks are designed to a similar factor of safety and are exposed to the same blast environment. Forward work (or acquisition of new fragment databases) may necessitate differing models, but the current knowledge base does not warrant two separate models for the fragmentation of the two tanks. L-FOAM distributes the initial location of these tank pieces along a radial line through the axis of the CS, with distances representative of the actual tank lengths.
ANCILLARY FRAGMENTS
This fragment class covers the assorted structural members and other sizeable objects like baffles or avionics boxes. The collected fragments from the Project PYRO S-IV test are either tank material, test stand material or grouped with the ancillary class of fragments. The impetus for this methodology is that detailed component level design of the SLS CS is still in flux. Thus, the approach of using an ancillary fragment PDF covers the expected fragment trends without specifying details of all individual components. The downside to this method is that there is no direct map from an output fragment to a specific part on the CS. The redeeming factor is that the risk represented by this catch-all fragment class should be equivalent to the cumulative risk of all individual CS components. It is desired to reduce the total mass of the ancillary

Statement A: Approved for public release; distribution is unlimited. DESTRUCTION NOTICE - For classified documents, follow the procedures in DoD 5200.22-M, National Industrial Security Program Manual, Chapter 5, Section 7. For unclassified, limited documents, destroy by any method that will prevent disclosure of contents or reconstruction of the document.
fragment class and instead expand the L-FOAM catalogue to include additional fragment classes as the CS design moves toward completion. This improves clarity for the end-user on what drives fragment risk on a component level. The L-FOAM catalogue will begin to converge towards that higher level of detail in ongoing efforts as additional component-level design details are made available. The mass in this fragment class is derived from taking the total dry mass and subtracting the masses for the insulation and tank fragment classes. It is large because the tank fragment class includes only the outer shell, and ignores structural members. The inter-tank mass is included as well in the ancillary fragment class. The mass properties and PDF for this fragment class are included below, with the data and curve fits shown in Figures 7 and 8: Total Weight of ancillary fragment class = 86,840 lbs. X dimension: µ = 3.1 in. σ = 0.6 in. Y dimension: µ = 3.1 in. σ = 1.2 in. Z dimension: µ = 0.25 in. σ = 1.1 in.
Figure 7: Curve Fit for X and Y Ancillary Dimension PDFs (PYRO S‐IV Based)

Statement A: Approved for public release; distribution is unlimited. DESTRUCTION NOTICE - For classified documents, follow the procedures in DoD 5200.22-M, National Industrial Security Program Manual, Chapter 5, Section 7. For unclassified, limited documents, destroy by any method that will prevent disclosure of contents or reconstruction of the document.
Figure 8: Curve Fit for Z Ancillary Dimension PDF (PYRO S‐IV Based)
INSULATION FRAGMENTS
Insulation covers large areas of the cryogenic tanks. As such, the destruct event places considerable strain on this weak material, but does not always result in the insulation separating from the tank. The insulation that does disassociate can then fragment into smaller pieces with lower ballistic coefficients. There is little collected insulation fragment data from any liquid propellant accident or test. As such, it is necessary to utilize the available insulation data from solid propellant accidents and tests. This is not ideal, but the strength of the explosion environment for both liquid propellant and solid propellant destruct events are well beyond the tensile strength of their respective insulation. The trends available from the 1202-1 destruct test and the Titan 34D-9 accident are able to provide a first order cut at the expected trends for the insulation breakup of the SLS CS. Additional research and testing is needed to either validate this assumption, or provide the dataset for the development of unique insulation breakup trends for liquid propellant rockets.
The 1202-1 destruct test characterizes a number of these individual fragments with recorded X, Y and Z major dimensions. For L-FOAM utilization, both X and Y dimensions are calculated from a PDF based on a Gaussian distribution. While the other PDFs are based on a log-normal distribution, the data appears to better support a normal distribution. The fragment data is sparse, so the acquisition of additional data may drive future PDFs toward a log-normal fit. The Z dimension is assumed to be fixed at the nominal insulation thickness since the empirical data reflects a standard thickness. The 1202-2 fragment data is shown in Figure 9.

Statement A: Approved for public release; distribution is unlimited. DESTRUCTION NOTICE - For classified documents, follow the procedures in DoD 5200.22-M, National Industrial Security Program Manual, Chapter 5, Section 7. For unclassified, limited documents, destroy by any method that will prevent disclosure of contents or reconstruction of the document.
Figure 9: X and Y dimension data from 1202‐1 insulation fragments
The resulting X and Y dimension PDFs are as follows: X dimension: µ = 22.9 (in) σ = 10.0 (in) Y dimension: µ = 7.0 (in) σ = 5.9 (in)
Dimensions are given for both hydrogen and oxygen tanks:
LOX tank area = 2573 ft2
LH2 tank area = 7718 ft2 LOX tank thickness = 0.75 in LH2 tank thickness = 1.25 in Density = 0.031 lbm/in3
Once the Z dimension (thickness) is set, the next step is determining what percentage of the total
insulation area is converted into fragments. There are reconstructed case fragment maps of both SRBs in the Titan 34D-9 accident that show the area of exposed steel on the inside of the case, see Figures 4 and 5. This gives a baseline to estimate the total amount of insulation that is from the case during destruct events from a Range destruct and a random case failure. The percentage of exposed steel is calculated for each segment and used to create two Gaussian distributions. There is more bare steel (~25% increase) in the scenario of a random case failure, likely as a result of the greater number of cracks and slower crack growth rates allowing more insulation to separate from the case. A Gaussian distribution from the 1202-1 destruct test is used to determine the amount of insulation removed from the propellant tanks. The general equation for describing this Gaussian PDF is given below:
f iσ√ π
eμ
σ (2)
0
20
40
60
80
100
120
140
160
180
200
1 2 3 4 5 6 7 8 9 10 11 12 13 14 15 16
Dim
ension Length (in)
Fragment Number
y
x

Statement A: Approved for public release; distribution is unlimited. DESTRUCTION NOTICE - For classified documents, follow the procedures in DoD 5200.22-M, National Industrial Security Program Manual, Chapter 5, Section 7. For unclassified, limited documents, destroy by any method that will prevent disclosure of contents or reconstruction of the document.
where µ is the mean and σ is the standard deviation. This is the underlying distribution in the “NORMRND” function in MATLAB that L-FOAM uses. The following values describe the PDFs in terms of the percent of the total insulation area that is disassociated from the tank pieces: Range Destruct PDF: µ = 57 % σ = 10 % Random Case Failure PDF: µ = 82 % σ = 9 %
It is safe to conclude that the 1202-1 database accurately describes the larger insulation pieces produced by its explosion, but it misses some of the smaller pieces of insulation which are more difficult to locate and catalogue. The tiny pieces of insulation have low ballistic coefficients due to their low density and thickness. This suggests that ignoring them in the 1202-1 database would probably not affect crew safety since they will slow rapidly after leaving the combustion zone. Even if they are able to impact the crew capsule, they have low mass and negligible structural strength, leading to low imparted kinetic energy. In fact, some of the pieces generated in L-FOAM from the 1202-1 based PDF will be similarly inconsequential to the total risk since it generates some pieces smaller than empirically recorded due to the nature of the underlying PDF. Wrapping up a potentially large population of tiny insulation fragments into collections on the order of the 1202-1 database of fragments is deemed to be the conservative, and computationally expedient methodology for generating an insulation fragment set in L-FOAM. The insulation that is not modeled as individual fragments is automatically modeled as being attached to appropriate pieces of tank, effectively increasing the tank fragment weight without changing the apparent area of the tank fragment drastically.
MONTE CARLO SIMULATION
L-FOAM is structured for ease-of-use in Monte Carlo simulations. Memory saving techniques within the MATLAB code and the use of a function to print results to Excel files has allowed full Monte Carlo simulations to be run on a laptop computer in a reasonable amount of time (typically hours), instead of relying on a multi-core system that is far more computationally expensive. Monte Carlo simulations of 500 runs have been completed to test the robustness of the methodology, but smaller sets on the order of 100-200 runs are sufficient to satisfy statistical requirements for the output indicator values. These indicator values are summaries of each run that allow the user to identify mean case and worst case runs. Upon the completion of a Monte Carlo set of L-FOAM runs, statistical analysis is performed using the indicator values to determine which data sets represent the desired percentile and confidence interval. The end user can either perform analysis with the entire data set, or use the Monte Carlo statistics on an indicator value to analyze only specific catalogues (average run, worst case run, etc.) Current indicator values integrated in L-FOAM are total fragment count, total kinetic energy, average apogee and average distance travelled from the center of explosion. The current NASA-deliverable application of L-FOAM uses the indicator value of total fragment count to determine the nominal, best case, and worst case scenarios, but other applications may well necessitate the usage of those other indicator values. The raw output of L-FOAM is not a direct SLS requirement, so the current standard statistical requirements for the “worst case” run are a 2σ percentile with a 50% confidence interval. A more stringent statistical requirement on either the percentile or the confidence interval would inappropriately increase the value of the downstream SLS requirement that uses L-FOAM as a primary input. One of the downstream requirements is the LoC probability for abort scenarios. Using inappropriately conservative values for an upstream L-FOAM indicator (such as 3σ instead of 2σ percentile) would lead to an artificial inflation of the downstream abort environment LoC. Such a scenario results in inaccurate reporting of the downstream SLS requirement (e.g. LoC reported as a 3σ percentile, but is actually 4σ or 5σ).

Statement A: Approved for public release; distribution is unlimited. DESTRUCTION NOTICE - For classified documents, follow the procedures in DoD 5200.22-M, National Industrial Security Program Manual, Chapter 5, Section 7. For unclassified, limited documents, destroy by any method that will prevent disclosure of contents or reconstruction of the document.
FRAGMENT ACCELERATION AND PROPAGATION
To accelerate the CS fragments, the BEi Model for liquid-propellant rockets is applied to each fragment. The BEi model is based on a synthesis of theoretical work (Farber limit), empirical pressure readings (HOVI, LSHOE, PYRO and accidents), and design considerations for the SLS CS [2, 7-20]. The initial combustion region is modeled with a flat overpressure value that then decays as it leaves the combustion zone [21]. All fragment acceleration is accomplished in that initial combustion region. Statistical work allows the BEi Model to vary both the amount of mixed propellants and how well those propellants are mixed. This changes the distance and forcing function (overpressure) for fragment acceleration. The statistical work is summed in a mean and “2 " model. A theoretical maximum model is included as a bounding case. The BEi Model is shown in Figure 10 below along with the supporting empirical data:
Figure 10: The BEi Model with supporting test and accident data. Green line is the mean model, red line is the 2σ model, and dark blue line is the maximum theoretical (Farber limit) model
The maximum theoretical model is derived from the Farber limit. It is a theoretical value that limits the total amount of cryogenic propellant allowed to mix before auto-ignition occurs [22-29]. While there are numerous studies (see Table 1) on the maximum pressure wave produced by hydrogen-oxygen combustion, the actual conditions of a catastrophic launch vehicle accident are unlikely to create these perfect mixing conditions as can be seen in the peak overpressures of Figure 10 [30-38].
Table 1. Experimental Hydrogen Detonation Pressures

Statement A: Approved for public release; distribution is unlimited. DESTRUCTION NOTICE - For classified documents, follow the procedures in DoD 5200.22-M, National Industrial Security Program Manual, Chapter 5, Section 7. For unclassified, limited documents, destroy by any method that will prevent disclosure of contents or reconstruction of the document.
Empirical data from the HOVI, LSHOE, and PYRO test programs were able to provide an anchor to probabilistic estimates on the blast strength expected from a cryogenic hydrogen-oxygen explosion in a configuration similar to the SLS CS. In order to test the validity of the both the BEi blast model and its integration with L-FOAM, a study was performed on the Project PYRO S-IV fragment catalogue. There was sufficient blast overpressure measurements to make a BEi blast model of the S-IV explosion environment. The S-IV fragment database was run as a direct input in L-FOAM and accelerated using the appropriately sized BEi blast model. After propagation to ground, the fragment impact range was summarized and compared to the empirical fragment impact range from the same test. As shown in Figure 11, results indicate that L-FOAM has success in modeling the complex interaction of breakup, blast environment and propagation. Some fragment are shown to travel beyond 1100 ft, which is more than the maximum empirical distance. This is considered acceptable since the fragment density at that distance is so low that it is unlikely to discover such fragments. The overall trend matches well however.
Author Pressure (PSI)Edwards, D.H., et al. 397Hansen, O.R., et al. 305Hord et al 294Zabetakis, M.G. 279
Author Pressure (PSI)Kang et al 156Kinney et al. 181Van Wingerden, K., et al. 225Zeldovlch, Y.B. 189
Hydrogen/Oxygen Detonation Pressure
Hydrogen/Air Detonation Pressure

Statement A: Approved for public release; distribution is unlimited. DESTRUCTION NOTICE - For classified documents, follow the procedures in DoD 5200.22-M, National Industrial Security Program Manual, Chapter 5, Section 7. For unclassified, limited documents, destroy by any method that will prevent disclosure of contents or reconstruction of the document.
Figure 11: Comparison of L‐FOAM Results to Empirical Results for the Project PYRO S‐IV Destruct Test
The propagation of a fragment outside the combustion region is modeled assuming a freely
tumbling fragment. To account for tumbling motion, a composite ballistic coefficient is calculated based on the ballistic coefficients for each major orientation of each fragment. It is possible to force L-FOAM to propagate with a fragment facing a particular direction such as “face on” or “edge on” but the composite approach is deemed to be a representative approximation of the physical phenomena. The propagation of the S-IV fragments was accomplished using this approach, showing good correlation with the empirical data. Drag force is calculated for speeds less than Mach 1 by the following equation:
F ρV C A (3)
where is atmospheric density, V is the velocity of the fragment, is the drag coefficient, and A is the fragment’s composite surface area. Preliminary value for drag force at speeds exceeding Mach 1 is calculated using a wave drag function derived from normal shock relations as a first cut [39].
F P .
. .
. . .
.A (4)
where M is the Mach number, A is the composite area of the fragment and P is the ambient pressure.
The propagation portion of L-FOAM is a straightforward 3 degrees-of-freedom propagation tool that incorporates the initial state vector of the CS at time of destruct and the imparted velocities of the produced fragment distribution. Straight line winds can be included or ignored. Future releases may include a full wind velocity profile as a function of altitude if desired. The propagation section uses an adaptive time step in order to minimize run time for large Monte Carlo simulations. The minimum time step is 0.001 seconds and is utilized during the initial stages of propagation while the fragments are at maximum velocity. The time step then adaptively increases based on the ratio of ballistic coefficient and velocity as the fragment slows to terminal velocity. The maximum time step is 0.05 seconds. A sensitivity study was conducted on

Statement A: Approved for public release; distribution is unlimited. DESTRUCTION NOTICE - For classified documents, follow the procedures in DoD 5200.22-M, National Industrial Security Program Manual, Chapter 5, Section 7. For unclassified, limited documents, destroy by any method that will prevent disclosure of contents or reconstruction of the document.
the average and maximum values for fragment range, impact velocity and apogee. This study was conducted over the range of required METs. Any MET after liftoff had minimal induced error of approximately 1% across all six studied parameters. The 0 MET scenarios had a maximum of 3% error for average range and maximum range (undershooting the values calculated without the adaptive time step), with the other four parameters exhibiting approximately 1% error. This is considered to be within the noise of the simulation. Time savings make the adaptive time step method an excellent option for efficiently running a Monte Carlo simulation.
A summary of L-FOAM output for an on-pad explosion is included below in Table 2. The imparted velocity for this summary is calculated using the mean BEi blast model. Some additional parameters which could be included based on user requirements are: fragment dimensions, drag coefficients, impact locations, apogee, velocity at impact, and time until impact (either with ground or crew capsule). It should be noted that some of the total insulation weight is included in the tank fragment category because not all insulation dissociates from the tanks. A full output from L-FOAM includes all data for each individual fragment.
Table 2: Example L‐FOAM Output Summarized by Fragment Class
Fragment Type
Fragment Count
Average Weight (lb)
Total Weight (lb)
Average Ballistic Coefficient (lb/ ft2)
Average Imparted Velocity (ft/s)
Average Imparted Kinetic Energy (kJ)
Tank Fragment
836 91 76081 12.2 400 345
Ancillary Fragment
337 258 86840 22.5 415 467
Insulation Piece
1770 14 25079 5.4 551 54
Sum 2943
SUMMARY AND CONCLUSIONS
The development of L-FOAM has led to an increase in the fidelity of risk assessment for the catastrophic failure of liquid-propellant rockets. Instead of relying on a small number of representative fragment classes, L-FOAM is able to populate any number of fragment catalogues with unique fragments. This results in around 2,000-4,000 fragments per catalogue, which are able to be individually accelerated and propagated. Coupled with Monte Carlo methodology, L-FOAM provides a powerful tool for the analysis of fragment safety related concerns in the operation and flight of the SLS rocket. An additionally unique capability in L-FOAM is that it is coupled with the BEi Model for the blast environment of liquid hydrogen – liquid oxygen accidents. Most fragmentation models include little to no interaction terms with the underlying blast model—a serious computational issue given that the fragmentation and acceleration are driven primarily by the blast environment. This coupling affords the user the ability to perform risk assessments in abort trade studies that include both fragmentation and blast wave risk in a manner that is physically consistent. Current applications are for calculating the LoC probability for on-pad and in-flight aborts, and for providing the Range with expected debris impact zones. Additional applications range from flight termination logic to reducing potential over-conservatism in crew abort systems. L-FOAM can be adapted for SLS configuration changes or for Commercial Crew designs.

Statement A: Approved for public release; distribution is unlimited. DESTRUCTION NOTICE - For classified documents, follow the procedures in DoD 5200.22-M, National Industrial Security Program Manual, Chapter 5, Section 7. For unclassified, limited documents, destroy by any method that will prevent disclosure of contents or reconstruction of the document.
FUTURE WORK
Future work centers on adding fidelity to the fragment generation model, and on making the fragment propagation portion of the code more robust. The drag calculations need to be further refined, both for sub-sonic and sonic portions of the acceleration and propagation. The case and insulation fragment classes are well characterized, but the ancillary fragment class is more of a stepping stone until detailed design information on the EM-1 configuration of the CS is made available. As individual components are added to the model, their mass will be subtracted from the ancillary fragment class until the class only covers the incidental portions of the design, leaving all major components in their own fragment classes. This will increase confidence that the ballistic coefficients and imparted velocities are truly indicative of the real fragment hazard posed by a destructing CS. As noted in the text, there is a lack of empirical data on the breakup patterns of foam insulation on destructing liquid propellant rockets, leaving the L-FOAM breakup trends reliant on the correlation of SRB insulation breakup to the CS insulation breakup.
It is further recognized that future design iterations of SLS will necessitate additional L-FOAM versions which account for major changes. An L-FOAM model is also needed to describe the breakup of the Interim Cryogenic Propulsion Stage (ICPS) for the first flight of SLS (EM-1). After that flight, the ICPS may be replaced by a new design known as the Exploration Upper Stage for EM-2, and L-FOAM will again be modified to derive its configuration-specific breakup trends.
The propagation of fragments is a fairly simple model at present. L-FOAM is capable of modeling fragment propagation in a flat-earth model, and has a rough geodetic model for in-flight breakup. Various other coordinate systems may be necessary to incorporate into the model in order to be compatible with Range and other applications. On the same note, the ability of L-FOAM to track fragments in relationship to a reference trajectory for an escaping crew capsule can be implemented. The reference frames for L-FOAM fragment propagation and an abort trajectory need to match as well as possible to ensure accuracy of impact predictions. Currently, the program only uses a single reference trajectory, and propagates each of the Monte Carlo runs against this same trajectory. It is preferred to fully integrate the Monte Carlo runs of the Crew Module escape trajectory with the Monte Carlo runs of the L-FOAM catalogue. This will ensure continuity between models and better interface with end-users in terms of statistical summaries.
REFERENCES
1. Space Shuttle Range Safety Command Destruct System Analysis and Verification, Phase III – Breakup of Space Shuttle Cluster Via Range Safety Command Destruct System, NSWC TR 80-417, Naval Surface Warfare Center, Dahlgren, VA (Mar 1981).
2. Willoughby, C. W. and Mansfield, J., Liquid Propellant Explosive Hazards Final Report, Vols. 1–3, URS Research Company, AFRPL TR-68-92 (Dec 1968).
3. Reynolds, J. R., Benz, F., Nance, W., Clayton, R. M., Newman, S. C., Congo, R., Parker, L. C., Eck, M., Riehl, W., Fletcher, R., Spitale, G., Kuhl, A., Taylor, J., Mukunda, M., Final Report of the NASA/DOE/INSRP STS 51-L and Titan 34D-9 Explosion Working Group, Vols. I and II, NASA Kennedy Space Center (Jun 16, 1989).
4. Test Evaluation Report (Ground Test) 1202-1, ER-UTC 64-116, United Technology Center, Sunnyvale, CA (May 8, 1964)
5. Thilges, J. H., Data from Missile Post‐Ignition Aborts, STLFD 66‐478, (Apr 1, 1966).

Statement A: Approved for public release; distribution is unlimited. DESTRUCTION NOTICE - For classified documents, follow the procedures in DoD 5200.22-M, National Industrial Security Program Manual, Chapter 5, Section 7. For unclassified, limited documents, destroy by any method that will prevent disclosure of contents or reconstruction of the document.
6. Thompson, E. M., Report of Missile Mishap Discoverer X DRAFT, Air Force Ballistic Missile Division, 29
(Feb 1960).
7. Perlman, S. S., Investigation of the Atlas‐Centaur Vehicle Explosion, John F. Kennedy Space Center
Safety Division Report, (Mar 2, 1965).
8. Kite, F. D., Webb, D. M., Bader, B. E., Golub, C. N., Launch Hazards Assessment Program, Report on 9.
Atlas/Centaur Abort, Sandia Laboratory and Pan American World Airways, PAFB, SC‐RR‐65‐333, (Oct
1965).
9. Bunker, R., Starritt, L., Flint, Q., Eck, M., Taylor, J., Namikawa, T., and Takeno, K., NASA/NASDA Joint Hydrogen/Oxygen Vertical Impact (HOVI) Test Program, NASA TR-820-001R (Apr 2, 1998).
10. Bunker, R., Dees, J. Eck, M., Weaver, R., and Benz, F., Large-Scale Hydrogen/Oxygen Explosion Project Special Interim Test Data Report, NASA WSTF # 95-28791 (Jan 5, 1995).
11. Bunker, R., Eck, M., Taylor, J. W., and Hancock, S., Correlation of Liquid Propellants NASA Headquarters RTOP, WSTF-TR-0985-001-01-02 (Jan 2003).
12. Maloy, T. L., Missile 9C Failure, 24 September 1959, Convair General Dynamics Corporation, FTA
6182, (Oct 1, 1959).
13. Fletcher, R. F., Characteristics of Liquid Propellant Explosions, Annals of New York Academy of
Science, 152, I, pp. 432‐440 (1968).
14. Withee, W. W., Rosenbaum, M., Flight Test Evaluation Report Missile 48D, AZC‐27‐120, (Apr 28,
1960).
15. Defense Explosives Safety Mishap Analysis Module (ESMAM) Specific Mishap Detail, 1159.00, 2
(Mar 1965).
16. Gayle, J. B., Investigation of S‐IV All Systems Vehicle Explosion, NASA TN D‐563, (Sep 1964).
17. Gayle, J. B., Liquid Propellant Blast Hazards, CPIA Pub 56, (Aug 1964).
18. Debus, K. H., Report of Investigation S‐IVB‐503 Incident January 20, 1967, George C. Marshall Space
Flight Center, (Feb 8, 1962).
19. Thatcher, E. V., O’Malley, T. J., Henriksen, O. M., Davidon, T. P., Solid, L. D., Swing, M. J., Caldwell, W.
H., Adkins, F. W., Carden, J. R., Wignall, P. R., WS 107A‐1 Flight Test Working Group Flight Test Report
Atlas Missile 11F, General Dynamics/Astronautics, AD852659, (Apr 30, 1962).
20. Cocchiaro, J., Fire and Explosive Hazards of Liquid Propellants and Related Materials ‐ An Accident
Overview, CPIA Pub 661, (Oct 1, 1997).

Statement A: Approved for public release; distribution is unlimited. DESTRUCTION NOTICE - For classified documents, follow the procedures in DoD 5200.22-M, National Industrial Security Program Manual, Chapter 5, Section 7. For unclassified, limited documents, destroy by any method that will prevent disclosure of contents or reconstruction of the document.
21. Blackwood, J. M., Skinner, T., Richardson, E. H., and Bangham, M. E., An Empirical Non-TNT Approach to Launch Vehicle Explosion Modeling, AIAA SciTech 2015, Kissimmee, FL (Jan 5-9, 2015).
22. Farber, E. A., A Mathematical Model for Defining Explosive Yield and Mixing Probabilities of Liquid Propellants, Third Space Congress (Mar 1966).
23. Farber, E. A., Characteristics of Liquid Rocket Propellant Explosion Phenomena, University of Florida, (Nov 1969).
24. Farber, E. A., Clement, F. W., and Bonzon, C. F., Prediction of Explosive Yield and Other Characteristics of Liquid Propellant Rocket Explosions, University of Florida (Oct 1968).
25. Farber, E. A. and Deese, J. H., A Systematic Approach for the Analytical Analysis and Prediction of the Yield from Liquid Propellant Explosions, pp. 520-531.
26. Farber, E. A. and San Martin, R. L., Studies and Analyses of the Mixing Phenomena Liquid Propellants Leading to Yield-Time Function Relationship, Annals of New York Academy of Science, pp. 666-684 (1966).
27. Farber, E. A., Smith, J. H., and Watts, E. H., Electrostatic Charge Generation and Auto-Ignition Results of Liquid Rocket Propellant Experiments (Oct 1972).
28. Farber, E. A., Smith, J. H., and Watts, E. H., Prediction of Explosive Yield and Other Characteristics of Liquid Rocket Propellant Explosions Final Report, University of Florida (Jun 30, 1973).
29. Farber, E. A., Explosive Yield Limiting Self-Ignition Phenomena in LO2/LH2 and LO2/RP-1 Mixtures, Fifteenth Explosives Safety Seminar, San Francisco, CA, pp. 1287-1303 (Sep 18-20, 1973).
30. Edwards, D. H., Williams, G. T., and Breeze, J. C., Pressure and Velocity Measurements on Detonation Waves in Hydrogen-Oxygen Mixtures, Journal of Fluid Mechanics, 6, pp. 497–517 (1959).
31. Hansen, O. R., Rernoult, J., Sherman, M. P., and Tieszen, S. R., Validation of FLACS-HYDROGEN CFD Consequence Prediction Model Against Large Scale H2 Explosion Experiments in the Flame Facility, Presented at the International Conference on Hydrogen Safety, Pisa (Sep 8-10, 2005).
32. Hord, J., Explosion Criteria for Liquid Hydrogen Test Facilities, National Bureau of Standards Report 10-734 (Feb 1972).
33. Zabetakis, M. G. and Burgess, D. S., Flammability Characteristics of Combustible Gases and Vapors, Bulletin 627, Bureau of Mines, U.S.G.P.O., Washington (1965).
34. Kang, H. S., Kim, S. B., Kim, M. H., and No, H. C., CFD Analysis of a Hydrogen Explosion Test with High Ignition Energy in Open Space.
35. Kinney, G. F. and Graham, K. J., Explosive Shocks in Air, 2nd ed, Springer Verlag (1985).
36. Kinney, G. F., Sewell, R. G. S., and Graham, K. J., Peak Overpressures for Internal Blast, Naval Weapons Center (1979).
Statement A: Approved for public release; distribution is unlimited. DESTRUCTION NOTICE - For classified documents, follow the procedures in DoD 5200.22-M, National Industrial Security Program Manual, Chapter 5, Section 7. For unclassified, limited documents, destroy by any method that will prevent disclosure of contents or reconstruction of the document.
37. van Wingerden, K., Bjerketvedt, D., and Bakke, J. R., Detonations in Pipes and in the Open, Proceedings of the Petro-Chemical Congress (Jun 23-24, 1999).
38. Zel’dovich, Y. B., On the Theory of the Propagation of Detonation in Gaseous Systems, National Advisory Committee for Aeronautics, Technical Memorandum 1261 (Nov 1950).
39. Anderson, J. D., Modern Compressible Flow: With Historical Perspective, 2nd ed., McGraw-Hill, (1990).


![UNLIMITED ADVENTURES. UNLIMITED OPPORTUNITIES [INBOUND 2014]](https://img.pdfslide.us/doc/110x75/55d54daebb61ebd6228b4731/unlimited-adventures-unlimited-opportunities-inbound-2014.jpg)