Embed Size (px)
Citation preview

1
Proceedings of CHT-15 ICHMT International Symposium on Advances in Computational Heat Transfer
May 25-29, 2015, Rutgers University, Piscataway, NJ, USA
CHT-15-033
A MOLECULAR DYNAMICS STUDY OF PASSIVE HEAT FLUX ENHANCEMENT IN BOILING LIQUID ARGON
Ricardo Diaz and Zhixiong Guo Department of Mechanical and Aerospace Engineering,
Rutgers, The State University of New Jersey, Piscataway, NJ 08854, USA
ABSTRACT Molecular dynamics simulations were employed to investigate the pool boiling heat transfer of a liquid argon thin film on a copper substrate. The aim of the study was to determine the efficacy of passive techniques for enhancing overall heat flux. Simulations were run using a patterned wall structured with copper nano-pillars. For the nano-structured wall, three different scenarios were considered: 1) an argon-philic wall of argon-philic pillar arrangement, 2) an argon-philic wall with argon-phobic pillar arrangement, and 3) argon-phobic wall with an argon-philic pillar arrangement. The solid copper wall is five atom-layers thick, while the nano-pillars were nine atom-layers thick. The argon liquid was laid on top of the solid wall and had a thickness greater than that of the nano-pillars. The remainder of the simulation box was populated with argon vapor particles. Once the solid, liquid, vapor system was equilibrated near argon’s boiling point temperature, the copper wall was suddenly heated to a higher temperature and allowed to interact with the argon atoms. Two superheats were used, one near the boiling temperature to induce normal ‘nucleate’ boiling, and the other far above the boiling temperature to induce explosive boiling. Results indicate that the argon-phobic/philic patterning acts to increase overall heat flux, with the argon-phobic nano-pillar/argon-philic wall showing the best performance. KEYWORDS Molecular dynamics; Simulation; Boiling heat transfer; Nano-patterned surface
NOMENCLATURE
E Potential energy (eV) r Interparticle distance (Å) rc Cutoff distance (Å) ε Lennard-Jones potential well depth (eV) σ Lennard-Jones characteristic length (Å)

2
INTRODUCTION
Heat transfer on the micro- and nanoscales has quickly become an important area of research due to its implications for use in MEMS/NEMS devices and electronics cooling [Wei et al. 2009, Wen et al. 2009, Madhour et al. 2011, Herrault et al. 2012]. As these devices become more powerful they will in turn generate more heat, which will need to be removed as efficiently as possible. Boiling heat transfer on nano/microscale substrates has the capacity for rapid large heat flux removal, and as such has previously been implemented in small-scale devices [Cosley et al. 2004], although the mechanisms driving this nano- heat transfer are not well understood. Advances in nanoscale manufacturing have made it possible to further enhance heat transfer at small scales via use of nano-structured surfaces. Nano-structuring surfaces is a good passive technique that can greatly improve boiling heat transfer due to increased boiling surface area and nucleation sites [Li et al. 2008, Hendricks et al. 2010, Lee et al. 2010]. Another passive technique that has been studied experimentally is the effect of hydrophobic and hydrophilic patterned surfaces on heat transfer. This patterning can effect bubble nucleation and increase critical heat flux values [Betz et al. 2010]. The parameters involved in employing these passive techniques can be hard to control experimentally, thus in this study Molecular Dynamics (MD) simulations have been used to investigate the effect of phobic/philic patterning of a nano-structured substrate during both normal and explosive boiling. MD simulation is a powerful tool that can be used to investigate nanoscale phenomena with more precise control than experimental setups. Previously many MD studies have been conducted on heterogeneous systems using flat substrates to investigate evaporation, effect of wettability, etc. [e.g. Ji and Yan 2008, Shi and Dhir 2009, Hens et al. 2014] and there have recently been some studies focused on boiling/evaporation on nano-structured substrates using differently shaped nano-structures [Morshed et al. 2011, Seyf and Zhang 2013], though to the authors’ knowledge no MD study has been conducted using a phobic/philic patterned surface.
METHOD The system created for the simulations was comprised of a solid copper wall, a layer of liquid argon, and argon vapor molecules in a simulation box measuring 72.3 x 72.3 x 745 Angstroms (Å). The wall at the bottom of the simulation box consisted of a base of five monolayers of solid copper, upon which rested four solid copper nano-posts. The nano-posts were nine monolayers high and had a cross-sectional area of 14.46 x 14.46 Å. The base wall and nano-posts totaled 5,263 atoms, and were arranged in a FCC lattice structure corresponding to the (100) plane. For the copper atoms a lattice constant of 3.615 Å was used, corresponding to a density of 8.9 g/cm3. Eleven monolayers (2,318 atoms) of argon molecules were placed just above the copper wall base, covering the wall and posts. For the argon liquid atoms a lattice constant of 5.256 Å was used, corresponding to an initial density of 1.4 g/cm3. Finally, 320 argon atoms (corresponding to a density of 5.77x10⁻³ g/cm3) were placed above the liquid, filling the rest of the simulation box. Figures 1 (a) and (b) detail the initial configuration of the copper atoms and the entire simulation box, respectively.

3
(a) (b)
Figure 1. Sketch of the simulation model: (a) overall simulation configuration (b) enlarged view of copper substrate and nano-pillars.
Interactions between all atoms were modeled with the standard 12-6 Lennard-Jones potential, given by:
E = 4ε σr
!
"#
$
%&12
−σr
!
"#
$
%&6(
)**
+
,--for r < rc (1)
where ε is the potential well depth, σ is a characteristic length at which the potential becomes zero, and r is the interatomic length. To reduce the computational cost a cut-off distance (rc) of 4*σAr-Ar was employed.
In order to look at the effect of surface patterning, different Cu-Ar potential well depths and characteristic lengths were used in order to simulate ‘standard’, ‘argon-phobic,’ and ‘argon-philic’ cases. The σ and ε Cu-Ar interaction values for the standard case were calculated via Lorentz-Berthelot mixing rules, where:
σ ij =
12σ i +σ j( ) and εij = εiε j
(2)
The argon-phobic arrangement refers specifically to the copper nano-posts, i.e. the nano-posts were modeled as argon-phobic while the base wall used the usual Lorentz-Berthelot mixing rules (which are considered to result in an ‘philic’ Cu-Ar interaction). For the argon-philic arrangement the copper base wall was instead modeled as argon-phobic, while the nano-posts were modeled as argon-philic. In each case the εCu-Ar value was halved in order to artificially simulate a phobic interaction between the required copper and argon atoms. Table 1 details the Cu-Cu, Ar-Ar [from Seyf and Zhang 2013], and various Cu-Ar interaction parameters.

4
Table 1 Lennard-Jones Parameters
Interacting Atoms σ (Å) ε (eV) Cu-Cu 2.33 0.4096 Ar-Ar 3.405 0.01423
Figure 2. Argon vapor pressure history.
For each case the simulation was carried out in two phases. Phase I consists of equilibrating the system at 90K. Once the system is brought to its energy minimum Phase II commences, using a Langevin thermostat to raise the temperature of the system to either 105K (low temperature case) or 300K (high temperature case). The thermostat is applied only to the second monolayer of the
Time (ps)0 250 500 750 1000 1250 1500 1750 2000 2250 2500 2750 3000 3250 3500 3750 4000
Pres
sure
(bar
)
0
0.5
1
1.5
2
2.5
3
Avg Pressure - standardAvg Pressure - phobicAvg Pressure - philic
Time (ps)0 2 4 6 8 10
Pres
sure
(bar
)
0
0.5
1
1.5
(a) Avg Ar Vapor Pressure (105K)
Time (ps)0 250 500 750 1000 1250 1500 1750 2000 2250 2500 2750 3000 3250 3500 3750 4000
Pres
sure
(bar
)
0
5
10
15
20
25
Pressure - standardPressure - phobicPressure - philic
(b) Ar Vapor Pressure (300K)

5
copper base wall, while the first layer is fixed to prohibit movement through the bottom of the simulation domain. The rest of the atoms are allowed to interact as they normally would, corresponding to the microcanonical (NVE) ensemble. Phase II lasts a total of 4 ns and uses the velocity Verlet algorithm for integration, with a time step of 5 fs. The simulation domain is periodic in the four sidewalls of both the x and y directions, while the top of the simulation domain is a fixed, adiabatic boundary. All simulations were run using LAMMPS software (version 30 Oct 2014), which is based on Plimpton’s [1995] work, while system visualization was performed with VMD v1.9.1 [Humphrey et al. 1996].
RESULTS & DISCUSSION
During the minimization of Phase I, pressure was monitored to ensure a reasonable system setup. The vapor pressure for the standard, philic, and phobic arrangements were 1.12, 1.19, and 1.14 bar respectively, which is slightly below the experimentally determined saturation vapor pressure for argon at 90K [~1.35 bar according to Gilgen et al. 1994]. Figure 2 shows the average argon vapor pressure history for the three arrangements under both the low and high temperature conditions.
Nucleate Boiling For Phase II of the nucleate boiling simulation, the copper monolayer Langevin thermostat was set to jump from 90K to 105K, resulting in the onset of nucleate boiling. Figure 3 shows the temperature history for the philic, phobic, and standard cases. In each case it is seen that the copper reached equilibrium in roughly 30 ps. Due to the presence of nano-structures and low degree of superheat, the argon molecules reached the target temperature quickly (~100 ps) and remained relatively constant throughout the course of the simulation. Figure 4 shows the density development for the liquid region near the copper substrate (z < 36 Å) for the low temperature case (105K), encompassing all four nano-structures. As can be seen, the density for the argon-phobic case in this region is less than that of the other cases. The average density for the argon-phobic case was 0.768 g/cm3, while for the standard and argon-philic cases the average densities were 0.817 g/cm3 and 0.819 g/cm3, respectively. This could possibly be due to the argon-phobic nano-structures, which have a larger total surface area in contact with argon than the argon-philic base wall. This decreased density region could lead to an increased rate of bubble nucleation and energy transfer, while the argon-philic base wall could act to replenish evaporated argon atoms and thus prevent dry-out due to local hot spots/vapor layers. The liquid argon evaporation rate was also monitored, and is presented in Figure 5. The evaporation rates for each case reach their peak early in the simulation, then gradually decrease as the argon temperature equilibrates and the number of remaining liquid atoms decreases (due to evaporation). Although the standard, philic, and phobic evaporation rates all decrease in a similar fashion, the phobic rate is consistently highest and has the largest maximum value. This could again be due to the decreased density in the liquid region, nucleating more bubbles which then separate from the wall and rise to the top of the liquid layer before entering the vapor region (resulting in higher heat transfer).

6
Figure 3. Temperature history (low temperature cases).
Time (ps)0 250 500 750 1000 1250 1500 1750 2000 2250 2500 2750 3000 3250 3500 3750 4000
Tem
pera
ture
(K)
90
92
94
96
98
100
102
104
106
108
110
Cu Temp - standardCu Temp - phobicCu Temp - philic
Time (ps)0 10 20 30 40 50
Tem
pera
ture
(K)
85
90
95
100
105
110
(a) Cu Temp (105K)
Time (ps)0 250 500 750 1000 1250 1500 1750 2000 2250 2500 2750 3000 3250 3500 3750 4000
Tem
pera
ture
(K)
65
70
75
80
85
90
95
100
105
110
115
Ar Temp - standardAr Temp - phobicAr Temp - philic
Time (ps)0 20 40 60 80 100
Tem
pera
ture
(K)
50
60
70
80
90
100
110
(b) Ar Temp (105K)

7
Figure 4. Argon density profiles (low temperature cases).
Figure 5. Evaporation rate (low temperature cases).
Time (ps)0 500 1000 1500 2000 2500 3000 3500 4000
Den
sity
(g/c
m3)
0.65
0.7
0.75
0.8
0.85
0.9
0.95
1
1.05
Density - standard Density - phobic Density - philic
@105K
Time (ps)0 500 1000 1500 2000 2500 3000 3500 4000
Evap
orat
ion
Rat
e (A
tom
s/ps)
0
0.1
0.2
0.3
0.4
0.5
0.6Evaporation Rate - standardEvaporation Rate - philicEvaporation Rate - phobic
@105K

8
Figure 6. Average heat flux (low temperature cases).
The heat flux normal to the base wall (in the z-direction) was calculated using the following equation:
⎥⎦
⎤⎢⎣
⎡−= ∑ ∑
i iiiii vSve
VJ 1
(3)
Where ei is the per-atom energy (potential + kinetic), and Si is the per-atom stress tensor. A higher heat transfer rate for the phobic case is confirmed in Figure 6. As can be seen, after ~500 ps the initial (average) heat flux oscillation begins to flatten out and reach a quasi-steady state, with the phobic case having the highest value. At the end of the simulation the heat flux in the phobic case was ~17% higher than that of the standard case, while the philic case showed a ~7% improvement over the standard case. The maximum heat flux values seen were on the order of 1x10⁸ W/m2, which is consistent with the predictions of evaporative kinetic theory [Gambill & Lienhard, 1989]. Based on the theory the limit of attainable heat flux is given by
(4)
where ρg is the saturated vapor density, hfg is the latent heat of vaporization, R is the ideal gas constant (per unit mass), and T is the temperature. For argon, Eq. (4) gives a value of ~2x10⁸ W/m2. Explosive Boiling For Phase II of the high temperature boiling simulation the thermostat was set to jump from 90K to 300K, well above the boiling point of argon, to induce explosive boiling. Figure 7 shows the temperature profile for each case. The equilibration time for the copper wall was ~60 ps, while the argon did not reach equilibrium. This is because during explosive boiling, a high pressure vapor layer forms close to the copper wall, which acts to force
Time (ps)0 250 500 750 1000 1250 1500 1750 2000 2250 2500 2750 3000 3250 3500 3750 4000
Hea
t Flu
x (W
/m2)
# 107
0
1
2
3
4
5
6
7
8
9
10
11Avg Flux - standardAvg Flux - phobicAvg Flux - philic
Time (ps)3500 3600 3700 3800 3900 4000
Hea
t Flu
x (W
/m2)
# 106
2.5
3
3.5
4
@105K

9
the bulk argon liquid away from the substrate heat source (in the z-direction). This vapor is also insulating due to its low density, and restricts heat transfer. This can be seen as the temperature drop at around 250 ps (for all cases), before the steady climb toward the thermostat temperature. The rate of temperature change is similar for all cases, though the argon in the standard case tends to have a higher overall temperature. This is most likely caused by slower vapor layer formation, which allows for more initial heat transfer before the insulating vapor layer is fully formed.
Figure 7. Temperature history (high temperature cases).
Time (ps)0 250 500 750 1000 1250 1500 1750 2000 2250 2500 2750 3000 3250 3500 3750 4000
Tem
pera
ture
(K)
50
100
150
200
250
300
350
Cu Temp - standardCu Temp - phobicCu Temp - philic
Time (ps)0 10 20 30 40 50 60
Tem
pera
ture
(K)
50
100
150
200
250
300
350
(a) Cu Temp (300K)
Time (ps)0 250 500 750 1000 1250 1500 1750 2000 2250 2500 2750 3000 3250 3500 3750 4000
Tem
pera
ture
(K)
50
100
150
200
250
300
Ar Temp - standardAr Temp - phobicAr Temp - philic
Time (ps)0 20 40 60 80 100
Tem
pera
ture
(K)
50
100
150
200
250
(b) Ar Temp (300K)

10
Figure 8 shows slightly better coverage of argon atoms on the copper nano-structures for the philic vs. the phobic case, which could affect the argon temperature profile and overall heat flux. Since in the explosive boiling case the vapor layer forms quickly, having an argon-philic base (i.e. the phobic case) wall could help maintain a number of argon atoms near the substrate for initial wetting/heat transfer (since the base wall heats up more quickly than the nano-structures). Figure 9 shows the argon density profile at different times for the standard case. The movement of the peak density value in the positive z-direction confirms the upward movement of the bulk liquid due to the high-pressure vapor layer formation at the wall surface.
(a) (b)
Figure 8. Nano-structure coverage: (a) Argon-phobic and (b) Argon-philic (high temperature
case).
Figure 9. Argon density profiles at different times (standard arrangement, high temperature
case).
Z Distance (Å)0 100 200 300 400 500 600 700
Den
sity
(g/c
m3)
0
0.1
0.2
0.3
0.4
0.5
0.6
0.7
0.8
0.9
10 ps120 ps230 ps340 ps
@ 300K

11
Figure 10. Evaporation rate vs. time (high temperature cases).
Figure 11. Average heat flux (high temperature cases).
Figures 10 & 11 show the evaporation rate and average heat flux versus time, respectively. As in the low temperature cases, the phobic scenario gives both the highest overall evaporation and energy transfer rates, although the results for the explosive boiling cases were much more closely grouped. In the case of the heat flux there is a local maximum (and minimum) in the first 20 to 40 ps in which the philic and phobic cases show slightly higher heat flux, shortly after which the
Time (ps)0 500 1000 1500 2000 2500 3000 3500 4000
Evap
orat
ion
Rat
e (A
tom
s/ps)
0
2
4
6
8
10
12
14
16
Evaporation Rate - standardEvaporation Rate - philicEvaporation Rate - phobic
Time (ps)2500 3000 3500 4000
Evap
Rat
e (A
tom
s/ps)
0.4
0.5
0.6
0.7
0.8
0.9
@ 300K
Time (ps)0 250 500 750 1000 1250 1500 1750 2000 2250 2500 2750 3000 3250 3500 3750 4000
Hea
t Flu
x (W
/m2)
# 108
-0.5
0
0.5
1
1.5
2
2.5
3
3.5
4Avg Flux - standardAvg Flux - phobicAvg Flux - philic
Time3000 3200 3400 3600 3800 4000
Hea
t Flu
x
# 107
2.5
3
3.5
Time0 20 40 60
Hea
t Flu
x
# 108
1
1.1
1.2
1.3
1.4
1.5
@ 300K

12
maximum heat flux is reached. Here at the peak heat flux values the standard case actually has the highest heat flux value of the three cases. This can be attributed to the vapor layer formation, which occurs most slowly in the standard case due to its initially low heat flux. The insulating effects of the vapor layer are slightly mitigated, allowing for higher heat flux in these stages compared to the philic and phobic cases. However over time this initial effect is reduced, and the phobic case results in the highest overall heat flux at the end of the simulation (~2.7x10⁸ W/m2).
ERROR ANALYSIS
In Figure 11 error bars are shown for the average heat flux of the standard case (which showed the largest deviations), extending one standard deviation above and below the shown data points. A maximum standard deviation of 2.5x10⁷ W/m2 occurred near the peak heat flux at ~250 ps, while the mean deviation over the entire simulation time was 3.2x10⁶ W/m2. Each case was run for a total of five simulations in order to gather the standard deviation data.
Figure 12. Energy difference (based on cutoff radius).
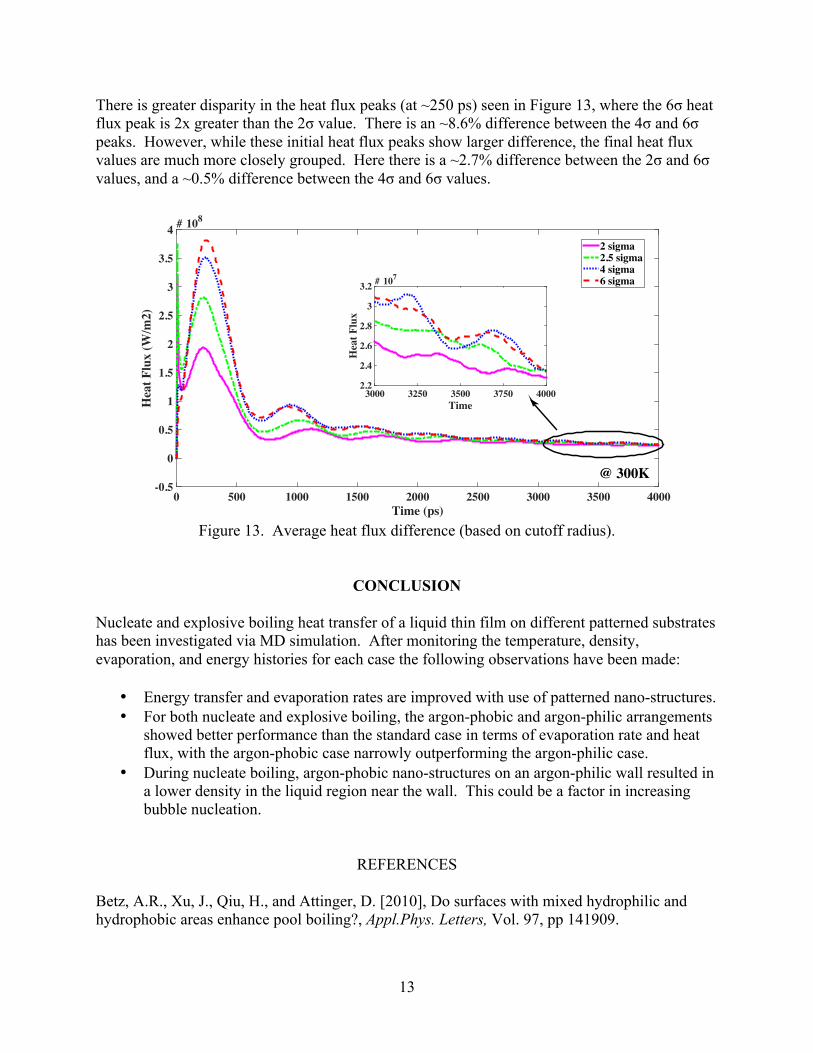
In order to gauge the impact of the cutoff radius, multiple runs of the standard scenario at high temperature were carried out, each using different cutoff radii. The results are shown in Figure 12, which shows the difference in total energy over time, and Figure 13, which details the difference in the average heat flux. The cutoff radii chosen were 2σ, 4σ, 6σ, and 8σ. Additionally, 2.5σ was included as it is often recommended as the minimum cutoff radius for MD simulations. From Figure 12 we can see that as σ increases the calculated energy values begin to converge toward the true value. There is a ~2.5% difference between the 2σ and 6σ energy values, and <0.5% difference between the 4σ and 6σ values.
Time (ps)0 250 500 750 1000 1250 1500 1750 2000 2250 2500 2750 3000 3250 3500 3750 4000
Ener
gy (e
V)
# 104
-1.55
-1.54
-1.53
-1.52
-1.51
-1.5
-1.49
-1.48
-1.47
-1.46
-1.45
2 sigma2.5 sigma4 sigma6 sigma
@ 300K
13
There is greater disparity in the heat flux peaks (at ~250 ps) seen in Figure 13, where the 6σ heat flux peak is 2x greater than the 2σ value. There is an ~8.6% difference between the 4σ and 6σ peaks. However, while these initial heat flux peaks show larger difference, the final heat flux values are much more closely grouped. Here there is a ~2.7% difference between the 2σ and 6σ values, and a ~0.5% difference between the 4σ and 6σ values.
Figure 13. Average heat flux difference (based on cutoff radius).
CONCLUSION
Nucleate and explosive boiling heat transfer of a liquid thin film on different patterned substrates has been investigated via MD simulation. After monitoring the temperature, density, evaporation, and energy histories for each case the following observations have been made:
• Energy transfer and evaporation rates are improved with use of patterned nano-structures. • For both nucleate and explosive boiling, the argon-phobic and argon-philic arrangements
showed better performance than the standard case in terms of evaporation rate and heat flux, with the argon-phobic case narrowly outperforming the argon-philic case.
• During nucleate boiling, argon-phobic nano-structures on an argon-philic wall resulted in a lower density in the liquid region near the wall. This could be a factor in increasing bubble nucleation.
REFERENCES Betz, A.R., Xu, J., Qiu, H., and Attinger, D. [2010], Do surfaces with mixed hydrophilic and hydrophobic areas enhance pool boiling?, Appl.Phys. Letters, Vol. 97, pp 141909.
Time (ps)0 500 1000 1500 2000 2500 3000 3500 4000
Hea
t Flu
x (W
/m2)
# 108
-0.5
0
0.5
1
1.5
2
2.5
3
3.5
4
Time3000 3250 3500 3750 4000
Hea
t Flu
x
# 107
2.2
2.4
2.6
2.8
3
3.2
2 sigma2.5 sigma4 sigma6 sigma
@ 300K

14
Cosley, M.R., Fischer, R.L., Thiesen, J.H., and Willen, G.S. [2004], Patent US6679315 B2, Small Scale Chip Cooler Assembly. Gamble, W.R. and Lienhard, J.H. [1989], An upper bound for the critical boiling heat flux, ASME J. Heat Transfer, Vol. 111, Issue 3, pp 815-818. Gilgen, R., Kleinrahm, R., and Wagner, W. [1994], Measurement and correlation of the (pressure, density, temperature) relation of argon II. Saturated-liquid and saturated-vapour densities and vapour pressures along the entire coexistence curve, J. Chem. Thermodyn., Vol. 26, Issue 4, pp 399-413. Hendricks, T., Krishnan, S., Choi, C., Chang, C.-H. and Paul, B. [2010], Enhancement of pool boiling heat transfer using nanostructured surfaces on aluminum and copper, Intl. J. Heat Mass Transfer, Vol. 53, Issues 15-16, pp 3357-3365. Hens, A., Agarwal, R., and Biswas, G. [2014], Nanoscale study of boiling and evaporation in a liquid Ar film on a Pt heater using molecular dynamics simulation, Intl. J. Heat Mass Transfer, Vol. 71, pp 303-312. Herrault, F., Hidalgo, P.A., Ji, C.-H., Glezer, A., and Allen, M.G. 2012. Cooling performance of micromachined self-oscillating reed actuators in heat transfer channels with integrated diagnostics. In: Micro Electro Mechanical Systems, IEEE 25th Intl Conference on MEMS, 1217-1220. Humphrey, W., Dalke, A., and Schulten, K. [1996], VMD – Visual Molecular Dynamics, J. Molec. Graphics, Vol. 14, pp 33-38. http://www.ks.uiuc.edu/Research/vmd/ Ji, C.Y., and Yan, Y.Y. [2008], A molecular dynamics simulation of liquid-vapour-solid system near triple-phase contact line of flow boiling in a microchannel, App. Therm. Eng, Vol. 28, Issues 2-3, pp 195-202. Lee, C.Y., Bhuiya, M., and Kim, K.J. [2010], Pool boiling heat transfer with nano-porous surface, Intl. J. Heat Mass Transfer, Vol. 53, Issues 19-20, pp 4274-4279. Li, C., Wang, Z., Wang, P.-I., Peles, Y., Koratkar, N., and Peterson, G.P. [2008], Nanostructured copper interfaces for enhanced boiling, Small Vol. 4, Issue 8, pp 1084–1088. Madhour, Y., Olivier, J., Costa-Patry, E., Paredes, S., Michel, B., and Thome, J. [2011], Flow boiling of R134a in a multi-microchannel heat sink with hotspot heaters for energy-efficient microelectronic CPU cooling applications, IEEE Transactions on Components, Packaging and Manuf. Tech, Vol 1, No. 6, pp 873-883. Morshed, A.K.M.M., Paul, T.C., and Khan, J.A. [2011], Effect of nanostructures on evaporation and explosive boiling of thin liquid films: a molecular dynamics study, Appl. Phys. A, Mat. Sci. & Proc., Vol. 105, pp 445-451.
15
Plimpton, S. [1995], Fast parallel algorithms for short-range molecular-dynamics, J. Comput. Phys., Vol 117, pp 1-19. http://lammps.sandia.gov - Sandia National Laboratories, USA. Seyf, H.R., and Zhang, Y. [2013], Molecular dynamics simulation of normal and explosive boiling on nanostructured surface, J. Heat Transfer, Vol. 135, Issue 12, pp 121503. Shi, B. and Dhir, V.K. [2009], Molecular dynamics simulation of the contact angle of liquids on solid surfaces, J. Chem. Phys., Vol. 130, pp 034705. Wei, J., Zhao, J., Yuan, M., and Xue, Y. [2009], Boiling heat transfer enhancement by using micro-pin-finned surface for electronics cooling, Microgravity Sci. Technol, Vol 21, Suppl 1, pp S159-S173. Wen, D., Lin, G., Vafaei, S., and Zhang, K. [2009], Review of nanofluids for heat transfer applications, Particuology, Vol. 7, Issue 2, pp 141-150.