Embed Size (px)
Citation preview

Communications on Applied Electronics (CAE) – ISSN : 2394-4714
Foundation of Computer Science FCS, New York, USA
Volume 2 – No.3, June 2015 – www.caeaccess.org
23
A Modified TV Tuner for Spectrum Sensing in TV UHF
Bands
Sameh Tahseen Higher Institute for Engineering
Thebes Academy Elec. & Comm. Eng. Dept.
Maadi, Cairo, Egypt
Mohamed Abouelatta Faculty of Engineering Ain Shams University
Elec. & Comm. Eng. Dept. Abbassia, Cairo, 11517, Egypt
Abdelhalim Zekry Faculty of Engineering Ain Shams University
Elec. & Comm. Eng. Dept. Abbassia, Cairo, 11517, Egypt
ABSTRACT
A novel system containing low cost TV box has been
designed to sense the UHF TV band spectrum.
Microcontroller chip is programmed using micro Pascal
software to control the TV tuner for scanning the TV band.
The implemented system has been used to measure the
utilization of the UHF TV band covering the frequency range
from 470 to 860 MHz in Cairo (EGYPT). The sensing output
data has been recorded and analyzed using suitable software.
The obtained results demonstrate significant amount of
spectrum available for deployment of cognitive radio systems
and IEEE 802.22 WRAN standard in the UHF TV
broadcasting band
General Terms
A new methodology for detecting UHF TV broadcasting
band, TV tuner, UHF TV Spectrum usage.
Keywords
Cognitive Radio, Spectrum sensing, TV tuner, UHF TV band
spectrum usage.
1. INTRODUCTION Wireless communication systems were grown significantly.
However this growth is faced by limits, because wireless
communications is using the radio spectrum which is a finite
resource. Cognitive Radio (CR) concept appeared trying to
saturate this famine.CR is an intelligent adaptable wireless
communication system that is aware of its surrounding
environment and uses the methodology of understanding-by-
building to learn from the environment and adapt its internal
parameters, in order to detect the presence of the primary user
signal, and detects the unused spectrum and shares it without
harmful interference to other users. It determines which
portion of the spectrum is available and detects the presence
or absence of licensed users when a user operates in licensed
band. In all countries, the government regulates the usage of
the frequency spectrum by national regulatory institutions like
the Federal Communications Commission (FCC) in the USA.
In Egypt, the National Telecommunication Regulatory
Authority (NTRA) is the governmental authority that
administer the telecommunication sector. FCC coordinated
allocating frequency bands and issuing exclusive licenses to
systems within a geographical area while regulating other
systems with respect to these bands.
1.1 SPACE SPECTRUM
1.1.1 TV Band Spectrum In November 2008 the United States FCC issued a R&O on
the unlicensed use of TV white space spectrum [1]. To
operate in TV white space, there are requirements needed
based on cognitive radio technology including location
awareness and spectrum sensing. There are a number of other
requirements intended to provide protection for the licensed
services that operate in the TV bands. These requirements
impose technical challenges for the design of devices
operating in TV white space spectrum. FCC set rules
managing the operation of the TV band devices (TVBDs).
There are two classes of TV band devices: fixed and
personal/portable. The shorter term portable will be used for
the personal/portable devices. These portable devices are
divided into Mode I and Mode II devices.
Fixed devices are permitted to transmit up to 30 dBm (1 watt)
with up to 6 dBi antenna gain, while portable devices are
permitted to transmit up to 20 dBm (100 mw) with no
antenna gain. Fixed devices are permitted to use a higher gain
antenna as long as the transmit power is decreased dB-for-dB
for any antenna gain above 6 dBi.
The Very High Frequency (VHF) channels (2-13) and the
Ultra High Frequency (UHF) channels (14-51) are TV
channels. However, there are restrictions on which channels
are permissible for use by TVBDs. Channels (3-4) in the VHF
channels and channels (36-38) in the UHF channels are not
permitted for fixed devices. Fixed devices are forbidden to use
channel (3-4) to prevent interference with external devices
(e.g. DVD players) when they connect to a TV utility.
Portable devices are not permitted at all in the VHF band.
However they are permitted in UHF band except channels
(14-20) and channel 37.Channel 37 is a protected channel,
used for radio astronomy measurements. Finally, Portable
devices are not permitted on channels (14-20) since, some of
those channels are used for public safety applications [2].
1.2 SPECTRUM SENSING Sensing the spectrum hole is an important requirement of
cognitive radio network. In general, spectrum holes are
categorized into two types, spatial spectrum holes and
temporal spectrum holes. A spatial spectrum holes is
unoccupied band by the primary user (PU) therefore the
secondary users (SUs) can use it. A temporal spectrum hole is
unoccupied band by the PU during the sensing time. Hence,
the SUs can occupy this band in the current time slot [3, 4].
The spectrum holes are classified into three broadly defined
types [5, 6]: Black spaces, which are occupied some of the
time with high power RF signal interference. Gray spaces,
which are partially occupied with low power signal. White
spaces, which are free with RF interference except for white
Gaussian noise.

Communications on Applied Electronics (CAE) – ISSN : 2394-4714
Foundation of Computer Science FCS, New York, USA
Volume 2 – No.3, June 2015 – www.caeaccess.org
24
Fig 1: Spectrum Holes
The Gray and White spaces can be used by SU (unlicensed
operators), but Black spaces cannot be used because of the
interference that will be caused to the PUs. IF one or more of
PUs back to reuse his band (White or Gray space), the CR
moves to another available spectrum hole as shown in Figure
1 [4], and that’s why Cognitive Radio considered as
intelligent adaptable wireless communication system used to
achieve the mission of spectrum utilization regarding causing
interference between licensed users and unlicensed (portable)
users, by using one or more of the spectrum sensing
techniques which is discussed in next section.
The characteristics and operation of the primary users
inherently dictates the secondary users’ opportunity spectrum
access. The primary users also have the privileged access to
the frequency band. An acceptable level of interference must
be guaranteed by the secondary users of their ability to share
the spectrum with the primary users.
Recently Spectrum sensing has been developed, where it is
defined and various aspects of spectrum sensing task are
mentioned and discussed.
Tian Z. and G.B. Giannakis. (2006) [7] have developed a
wavelet approach to efficient spectrum sensing of wideband
channels. They have developed a couple of wideband
spectrum sensing techniques based on the local maxima of the
wavelet transform modulus and the multi-scale wavelet
products, which provided an effective radio sensing
architecture to identify and locate spectrum holes in the signal
spectrum.
Zhi, Q. et al. (2008) [8] have introduced a novel wideband
spectrum sensing technique, called multiband joint detection,
which jointly detects the signal energy levels over multiple
frequency bands rather than consider one band at a time.
Nekovee, M. (n.d.). (2010) [9] have reviewed the state-of-
the-art in technology, regulation and standardization of
cognitive access to TVWS and examined the spectrum
opportunity and commercial use cases associated with this
form of secondary access.
Dzulkifli, M. et al. (2011) [10] have presented the spectrum
occupancy of the UHF TV band in the frequency range from
470 to 798 MHz in an outdoor environment of a suburban
area in Johor Bahru, Malaysia.
Nishant Dev Khaira and Prateek Bhadauria (2012) [11] have
investigated the optimization problem of detection efficiency
under the constraint of detection probability.
Fawzy, A. et al. (2015) [12] have designed and implemented a
wideband front end spectrum sensor built from commercial of
the shelf components, they have provided the sensor front end
architecture, component details, circuit design, and
implementation.
1.2.1 CLASSIFICATION OF SPECTRUM
SENSING TECHNIQUES Spectrum sensing techniques are classified into three main
types as shown in Figure 2, Non Cooperative sensing
(Transmitter Detection), Cooperative sensing and Interference
based sensing. Non Cooperative sensing is further classified
into energy detection, matched filter detection and
cyclostationary feature detection [3].
a) Non-cooperative detection Is based on the detection of the weak signal from a primary
transmitter. In primary transmitter based detection techniques,
a cognitive user determines signal strength generated from the
primary user. In this method, the location of the PUs are
not known to the cognitive users because there is no
signaling between the primary users and the
cognitive users.
Fig 2: Classification of spectrum sensing techniques
Transmitter detection can be defined as follows:
, signal is absent
, signal is present
Where r(t) is the signal received by the cognitive user, s(t) is
the transmitted signal of the primary user, w(t) is the AWGN
(Additive White Gaussian Noise) and α is the amplitude gain
of the channel. H0 is a null hypothesis, H1 is an alternative
hypothesis.
b) Cooperative or collaborative detection
In this technique cognitive radio users are in cooperation,
where information from multiple users is incorporated for
primary user detection.
In this work we aim to achieve TV UHF band sensor using
novel setup containing the low cost commercial TV box set
controlled by a programmed microcontroller chip IC. In
which the TV spectrum band can be swept within a short time
interval compared to other costly sensors. Adjustable
frequency division can be obtained.

Communications on Applied Electronics (CAE) – ISSN : 2394-4714
Foundation of Computer Science FCS, New York, USA
Volume 2 – No.3, June 2015 – www.caeaccess.org
25
2. SYSTEM SETUP The reduced block diagram of the spectrum sensor is shown in
Figure 3. It is composed of the antenna, the tuning and
sensing unit as well as the spectrum analyzer. Figure 4 shows
the detailed block diagram of system.
Fig 3: Reduced Spectrum sensor block diagram
Fig 4: Detailed Block diagram of the system
The tuning and sensing unit is purposely built from a TV UHF
band receiver that consists of omnidirectional antenna, a
commercial TV set box, and a microcontroller chip.
The radio frequency signal is captured by the antenna and fed
to the TV tuner. This signal is then amplified and converted
down to an Intermediate Frequency IF using internal mixer
whose local voltage controlled oscillator frequency is
controlled by a microcontroller chip IC. The microcontroller
is programmed such that the voltage controlled local oscillator
frequency generates frequencies that is when mixed with the
input RF signals frequencies produces the intermediate
frequency IF signal of the TV. Then the IF signal is fed after
amplification to the spectrum analyzer. By using RS-232
cable and software, the output of the spectrum analyzer is sent
to laptop where it is stored processed using Matlab and
displayed.
The spectrum data gathered over time is evaluated to estimate
the UHF TV band utilization.
A photo of the built spectrum sensing set up according to the
block diagram in Fig. 4, is shown in Fig. 5
Fig 5: UHF TV band spectrum sensing setup
The used tuner module is modified to scan automatically the
UHF TV band spectrum. It is so that older tuners modules are
controlled by discrete analog voltages applied on the varactor
diodes of the voltage controlled oscillator (VFO). This has
been replaced with Inter-Integrated Circuit (I2C) controlled
tuner. I2C will be discussed in the next section.
Figure 6 shows the tuner TNF 8327-DF3 pin out, which is
built in the used TV box. Pin1 is Automatic Gain Control
AGC voltage, Pin 2 not connected, Pin 3 and Pin 4 are I2C
bus, where Pin 3 is Serial Clock (SCL) and Pin 4 is Serial
Data (SDA), Pin 5 and Pin 6 are biasing voltages 5V and 33V
respectively, and finally Pin 7 is IF output.
Fig 6: TV Tuner Pinout
2.1 Microcontroller programing Phillips introduced the I2C bus for mass-produced items such
as television and audio equipment, the I2C bus is a
bidirectional two wire serial bus that provides a
communication link between integrated circuits.
The I2C paths have been cut to disconnect them from the
internal control of scanning and are connected to the new
programmed microcontroller I2C pins to control the
frequency scanning. This programmed microchip together
with the voltage controlled local oscillator of the TV work as
a frequency synthesizer.
2.1.1 I2C write mode (R/W = 0) Using the internal tuning IC (SN761678) datasheet we found
the parameters and details that helped us to program the
microcontroller chip. Table 1 shows the write data format.
N14 to N0 are Programmable counter set bits. The oscillator
frequency FLO is given by
Tuner
Communications on Applied Electronics (CAE) – ISSN : 2394-4714
Foundation of Computer Science FCS, New York, USA
Volume 2 – No.3, June 2015 – www.caeaccess.org
26
, (1)
where
, (2)
and is the reference frequency
(3)
CP is Charge pump current set bit, CP = 1. T2, T1 and T0 are
Test bits and are set to 0, 0 and 1 respectively as a normal
mode. RSA and RSB are Reference divider ratio selection bits
as shown in Table 2. By selecting a reference divider as 640,
1024, or 512, from equation (3) we get reference frequencies
as 50, 31.25, or 62.5 KHz respectively. BS4 to BS1 is band
switch byte, selecting BS4 = 1 will choose UHF band.
The local oscillator frequency is mixed with RF input signal
to generate the IF signal. This output is amplified and fed to
the spectrum analyzer.
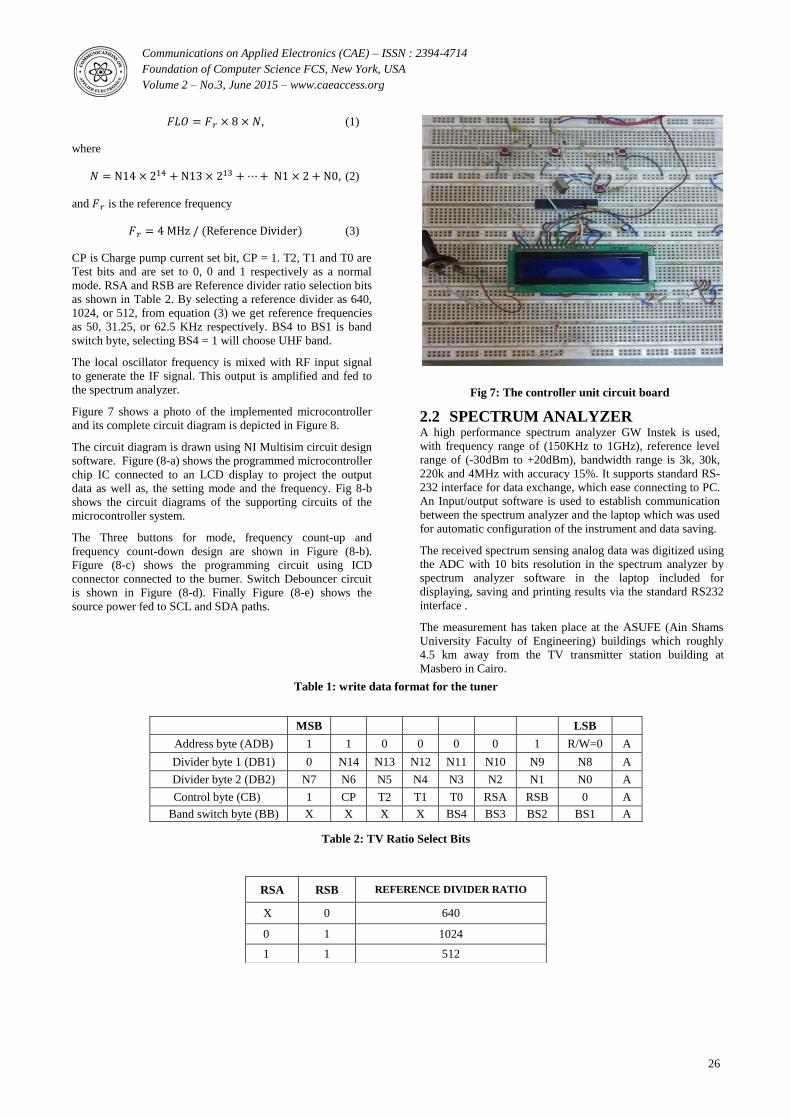
Figure 7 shows a photo of the implemented microcontroller
and its complete circuit diagram is depicted in Figure 8.
The circuit diagram is drawn using NI Multisim circuit design
software. Figure (8-a) shows the programmed microcontroller
chip IC connected to an LCD display to project the output
data as well as, the setting mode and the frequency. Fig 8-b
shows the circuit diagrams of the supporting circuits of the
microcontroller system.
The Three buttons for mode, frequency count-up and
frequency count-down design are shown in Figure (8-b).
Figure (8-c) shows the programming circuit using ICD
connector connected to the burner. Switch Debouncer circuit
is shown in Figure (8-d). Finally Figure (8-e) shows the
source power fed to SCL and SDA paths.
Fig 7: The controller unit circuit board
2.2 SPECTRUM ANALYZER A high performance spectrum analyzer GW Instek is used,
with frequency range of (150KHz to 1GHz), reference level
range of (-30dBm to +20dBm), bandwidth range is 3k, 30k,
220k and 4MHz with accuracy 15%. It supports standard RS-
232 interface for data exchange, which ease connecting to PC.
An Input/output software is used to establish communication
between the spectrum analyzer and the laptop which was used
for automatic configuration of the instrument and data saving.
The received spectrum sensing analog data was digitized using
the ADC with 10 bits resolution in the spectrum analyzer by
spectrum analyzer software in the laptop included for
displaying, saving and printing results via the standard RS232
interface .
The measurement has taken place at the ASUFE (Ain Shams
University Faculty of Engineering) buildings which roughly
4.5 km away from the TV transmitter station building at
Masbero in Cairo.
Table 1: write data format for the tuner
Table 2: TV Ratio Select Bits
MSB LSB
Address byte (ADB) 1 1 0 0 0 0 1 R/W=0 A
Divider byte 1 (DB1) 0 N14 N13 N12 N11 N10 N9 N8 A
Divider byte 2 (DB2) N7 N6 N5 N4 N3 N2 N1 N0 A
Control byte (CB) 1 CP T2 T1 T0 RSA RSB 0 A
Band switch byte (BB) X X X X BS4 BS3 BS2 BS1 A
RSA RSB REFERENCE DIVIDER RATIO
X 0 640
0 1 1024
1 1 512

Communications on Applied Electronics (CAE) – ISSN : 2394-4714
Foundation of Computer Science FCS, New York, USA
Volume 2 – No.3, June 2015 – www.caeaccess.org
27
Fig 8: System circuit diagram
Sweeping of the whole TV band lasts around 2 minutes while
choosing frequency reference of 62.5 kHz. This is the highest
scanning speed to get reproducible spectrum analysis result.
Setting the spectrum analyzer with RBW 220 kHz, span 5
MHz/Div. and 0 dB REF LVL. We observed the spectrum in
the intended band for total time of 9 hours with 2 minutes
interval for one sweep.
3. SPECTRUM OCCUPANCY RESULTS
AND ANALYSIS The measurements results are shown in Figure 9, and the
calculated spectrum occupancy are shown in Figure 10 and
Figure 11. The first graph shows the average received power
versus frequency. The second and third graphs is a plot
showing the spectrum occupancy versus frequency.
Figure 10 shows the spectrum occupancy of the UHF TV
band with a threshold of -67 dBm. As seen from the second
graph, the spectrum utilization is 14.82 %, therefore the
occupancy is high at the lower region of the band and
becomes less towards higher frequencies.
Figure 11 shows the spectrum occupancy of the UHF TV
band with a threshold of -60 dBm. As shown in the second
graph as well, the spectrum utilization is 1.57 %, therefore the
occupancy is very high from 470 to 700 MHz, but it appears
to have less utilization above the 700 MHz region. It is also
seen from the figures that there is an additional radio
frequency activities beside the TV channels, mostly because
of local wireless microphone. Comparing the two figures,
threshold of -67 dBm seems to give a higher occupancy.
Using the higher value of the threshold seems to indicate a
possibility of false detection, i.e. the frequency is currently
occupied but considered as vacant. It is however, both figures
seems to possess an abundant of white spaces, especially in
the 700 MHz region, which could provide possible
opportunity for the deployment of IEEE 802.22 WRAN. The
heavy utilization in the UHF TV broadcasting is because of
the close distance between the measurements site and the
Egyptian TV transmitter (Masbero) in Cairo. There are nine
television stations operating in Egypt. Transmission
frequencies of these stations are shown in Table 3 and plotted
in Figure 9.
Current TV broadcasting uses analogue transmission. The
transition to digital terrestrial television (DTTV) is currently
underway and expected to be completed by the end of 2015,
nationwide (worldwide completion of the digital transition is
at the end of 2015 as well). DTTV systems deploy digital
technology instead of the conventional analogue technology
for the delivery of terrestrial free to air or subscription
television services [10].
TV analogue system requires nine frequency channel (each
with a Band Width (BW) of 8 MHz) in order to transmit all of
the TV channels resulting in 72 MHz (9 x 8 MHz) of BW. By
Channel No. Center frequency
(MHz)
22 479
26 511
28 526
30 543
34 575
38 607
40 623
46 671
Table 3: TV channels in Egypt
Table 3: TV channels in Egypt
a)
a)
e)
e)
d)
d) b)
b)
c)
c)

Communications on Applied Electronics (CAE) – ISSN : 2394-4714
Foundation of Computer Science FCS, New York, USA
Volume 2 – No.3, June 2015 – www.caeaccess.org
28
switching to DTTV, these nine TV channels could be
accommodated in much smaller bandwidth. Once the
completion of the digital transition is finished, more white
spaces are expected to be available for further exploitation
[10].
500 550 600 650 700 750 800 850
-80
-70
-60
-50
-40
-30
-20
-10
0
Ch.46Ch.38
Ch.34Ch.30Ch.28
Ch.26
Po
wer
(dB
m)
Frequecy (MHz)
Ch.22
TV broadcasting band (Ch. 21 - 69 )
500 550 600 650 700 750 800 8500.0
0.5
1.0
Frequecy (MHz)
Occ
up
an
cy
500 550 600 650 700 750 800 8500.0
0.5
1.0
Oc
cu
pa
nc
y
Frequecy (MHz)
4. CONCLUSION UHF TV band spectrum sensor has been designed and
implemented using a commercial TV box. Microcontroller is
programmed to control the TV tuner for scanning the
frequency band. This sensor has succeeded to sweep the UHF
TV band spectrum within short time interval. The
Microcontroller chip IC is programmed, to select frequency
division references of (31.25, 50, 62.5) kHz.
The UHF TV band spectrum has been recorded within 2
minutes interval using the system designed.
The measurements have been taken at the ASU (Ain Shams
University) Faculty of Engineering building which roughly
4.5 km away from the TV transmitter station. From analyzing
these data, the occupancy percentage at these conditions are
determined and the spectrum utilization is obtained. The
obtained results demonstrate a significant amount of
unoccupied spectrum in the TV broadcasting band especially
in range from (700-860) MHz region as there is no Digital TV
broadcasting in EGYPT.
For future work, we plan to extend the measurement to cover
the whole spectrum of the UHF and VHF bands. These future
studies would help in more understanding of dynamic
spectrum utilization and deployment of cognitive radio
networks.
5. ACKNOWLEDGMENTS The article is partially supported by a grant of the Foundation
of Computer Science, NY, USA vide FCS/RT56/15
6. REFERENCES [1] Federal Communication Commission, Third Report and
Order and Memorandum Opinion and Order In the
Matter of Unlicensed Operation in the TV Broadcast
Bands, Additional Spectrum for Unlicensed Devices
Below 900 MHz and in the 3 GHz Band, (2012).
[2] Shellhammer, S., Sadek, A., & Zhang, W. (2009).
Technical challenges for cognitive radio in the TV white
space spectrum. Information Theory and Applications
Workshop, 323-333.
[3] Baradkar, H., & Akojwar, S. (2014). Implementation of
Energy Detection Method for Spectrum Sensing in
Cognitive Radio Based Embedded Wireless Sensor
Network Node. Electronic Systems, Signal Processing
and Computing Technologies (ICESC), 490-495.
[4] Abdulsattar, M., & Hussein, Z. (2012). Energy Detection
Technique for Spectrum Sensing in Cognitive Radio: A
Survey. International Journal of Computer Networks &
Communications, 223-242.
[5] Yucek, T., & Arslan, H. (2009). A Survey of Spectrum
Sensing Algorithms For Cognitive Radio Applications.
IEEE COMMUNICATIONS SURVEYS &
TUTORIALS, 116-130.
[6] Christopherclement, J., Krishnan, K., & Bagubali, A.
(2012). Cognitive Radio: Spectrum Sensing Problems in
Signal Processing. International Journal of Computer
Applications, 37-40
[7] Tian, Z., & Giannakis, G. (n.d.). A Wavelet Approach to
Wideband Spectrum Sensing for Cognitive Radios. 2006
1st International Conference on Cognitive Radio
Oriented Wireless Networks and Communications.
[8] Zhi, Q., Shuguang, C., Sayed, A., & Poor, H. (2008).
Wideband Spectrum Sensing in Cognitive Radio
Networks. Communications, 2008. ICC '08. IEEE
International Conference on.
[9] Nekovee, M. (n.d.). Cognitive Radio Access to TV
White Spaces: Spectrum Opportunities, Commercial
Applications and Remaining Technology Challenges.
2010 IEEE Symposium on New Frontiers in Dynamic
Spectrum (DySPAN).
[10] Dzulkifli, M., Kamarudin, M., & Rahman, T. (n.d.).
Spectrum occupancy at UHF TV band for cognitive radio
applications. 2011 IEEE International RF & Microwave
Conference.
[11] Khaira, N., & Bhadauria, P. (2012). Cooperative
spectrum sensing and Detection efficiency in cognitive
radio network. International Journal of Electronics and
Computer Science Engineering.
[12] Fawzy, A., Ghoname, R., & Zekry, A. (2015).
Developing front end wideband spectrum sensor for
cognitive radio. International Journal of Sciences: Basic
and Applied Research.
Fig 9: Measured frequency spectrum sensed in TV
band
Fig 9: Measured frequency spectrum sensed in TV
band
Spectrum utilization 14.82 %
Spectrum utilization 14.82 %
Fig 10: Calculated spectrum occupancy of UHF
TV band with threshold -67 dBm
Fig 10: Calculated spectrum occupancy of UHF
TV band with threshold -67 dBm
Spectrum utilization 1.57 %
Spectrum utilization 1.57 %
Fig 11: Calculated spectrum occupancy of UHF
TV band with threshold -60 dBm
Fig 11: Calculated spectrum occupancy of UHF
TV band with threshold -60 dBm