Embed Size (px)
Citation preview

Industrial Marketing Management 40 (2011) 424–438
Contents lists available at ScienceDirect
Industrial Marketing Management
A model to investigate the influence of marketing-mix efforts and corporate imageon brand equity in the IT software sector
Ji-Hern Kim 1, Yong J. Hyun ⁎Graduate School of Management, Korea Advanced Institute of Science and Technology, 207-43 Cheongryang, Dongdaemoon, Seoul, Republic of Korea
⁎ Corresponding author. Tel.: +82 2 958 3528; fax: +E-mail addresses: [email protected] (J.-H. K
[email protected] (Y.J. Hyun).1 Tel.: +82 2 958 3648.
0019-8501/$ – see front matter © 2010 Elsevier Inc. Aldoi:10.1016/j.indmarman.2010.06.024
a b s t r a c t
a r t i c l e i n f oArticle history:Received 17 December 2009Received in revised form 26 April 2010Accepted 15 June 2010Available online 7 July 2010
Keywords:Brand equityIndustrial brandingDimensions of brand equityMarketing-mix effortsCorporate image
A model is developed to examine the relationships among marketing-mix efforts (channel performance,value-oriented price, promotion, and after-sales service), corporate image, three dimensions of brand equity(brand awareness with associations, perceived quality, and brand loyalty), and market performance. Themodel considers three distinctive aspects of business markets. After-sales service is taken as a keymarketing-mix effort. Corporate image is placed as a mediator from the marketing-mix efforts to thedimensions of brand equity. Personal selling is defined as a main component of promotion. The model istested in the context of a Korean IT software sector. The test results show that all the marketing-mix effortspositively affect the overall value of brand equity, which is a proxy of market performance, via the threedimensions of brand equity. Corporate image mediates the effect of the marketing-mix efforts on the threedimensions of brand equity.
82 2 958 3604.im),
l rights reserved.
© 2010 Elsevier Inc. All rights reserved.
1. Introduction
A product is branded when target buyers learn about the productand, as a result, store in their memory knowledge structures of theproduct (Keller, 1993; Krishnan, 1996). These knowledge structuresincrease the value buyers obtain from the product by influencing theirthinking, feeling and doing with respect to the product. Thus, theproduct is of more value when it is branded than unbranded, and thisgreater value is referred to as brand equity (Aaker, 1991, 1996; Keller,1993). When the brand equity of a product is high enough, targetbuyers behave positively towards the product. For example, they paymore for the product, purchase it repeatedly, engage in favorableword-of-mouth behaviors, and so on (Aaker, 1991; Keller, 2008). Inthis respect, a firm can enhance its competitive position and increasefinancial performance by making its brand stronger.
Brand equity as sourced from the knowledge structures may becharacterized by a set of dimensions. According to Aaker (1996), thesedimensions include brand awareness, brand associations, perceivedquality, and brand loyalty. Keller (2008) proposes six dimensions ofbrand equity, arranged in four hierarchical levels: salience in thebottom level, performance and image in the next level, judgment andfeeling in the second-to-top level, and resonance in the top level.Consumer choice is much affected by brand equity characterized as
such, and thus those in consumer markets are fully aware of the needto appropriately manage brand equity (Aaker, 1991, 1996; Keller,2008).
On the other hand, brand equity is relatively downplayed inbusiness markets due to some distinct aspects of the business marketexchange (Kotler & Pfoertsch, 2007; Webster & Keller, 2004). Arelatively small number of buyers exist in business markets and thenit is wasteful to invest in building up a vast coverage in, for example,brand awareness and brand loyalty. Also, a group of people withdifferent roles (defined as initiators, users, buyers, deciders, influen-cers, and gatekeepers) participate in the process of purchasingindustrial goods. Decision making in this process is more rationalbecause it is group-oriented, and experts in product purchase and/orusage are involved in it. Individuals' perceptions and feelings are lesslikely to affect the group-oriented decisionmaking (Bendixen, Bukasa,& Abratt, 2004). Thus, it may be argued that brand equity plays a lessimportant role in industrial marketing than consumer marketing(Saunders & Watt, 1979; Sinclair & Seward, 1988).
Despite the argument, research indicates that brand equity is acritical competitive driver in industrial marketing, as well as inconsumer marketing (Kotler & Pfoertsch, 2007; Mudambi, 2002; vanRiel, Pahud deMortanges, & Streukens, 2005;Webster & Keller, 2004).As brand strength increases, industrial buyers become more likely torepurchase and pay a price premium (Bendixen et al., 2004; Hutton,1997; Roberts & Merrilees, 2007; Taylor, Hunter, & Lindberg, 2007).Higher brand reputation would lead to more assurance of theindustrial product quality (Cretu & Brodie, 2007). Even in a muchearlier period, for example, it was once popularly mentioned:“Purchase managers prefer IBM PCs to unbranded high value

425J.-H. Kim, Y.J. Hyun / Industrial Marketing Management 40 (2011) 424–438
alternatives.” Furthermore, Borghini and Cova (2006) explain thatbrand equity is a basis for sellers' cultivating relationships withbuyers. Webster and Keller (2004) also explain that sellers withhigher brand equity are more likely to develop and maintain theirrelationships with buyers. A strong brand helps sellers to reinforcetheir control over the relational exchange with buyers. For example,Intel successfully launched the “Intel Inside” campaign, whichbrought Intel more of such control. In sum, brand equity isinstrumental to making the buyer–seller relationship stronger, andin turn this stronger relationship leads to the higher brand equity.
Cretu and Brodie (2007) reported that three brand-relevant studieswere conducted prior to 1990. These three studies focus mainly onissues involving the brand-naming factor and its impact on marketingactivities such as positioning and promotion. As seen in Tables 1 and 2,a literature survey reveals that a limited number of studies have beenconducted since 1990 to investigate the phenomena of brand equity inbusiness markets. Among these studies, 12 studies focus on therelationships between the dimensions of brand equity andmarketing-mix efforts (e.g., price and promotion) or market performancevariables (e.g., profit and sales volume). They do not comprehensivelyconsider the key variables that concern (1) the characteristics of brandequity in business market context, (2) marketing-mix efforts, and(3)market performance. In addition, none of the studies looks into theentire structural relationships among the three sorts of variables.Instead, each study selects several variables relevant to a particularproduct market context, and only explores relationships among thoseselected variables.
We thus address a gap in the research—i.e., the need to establish acomprehensive model that incorporates the three sorts of keyvariables and explain the entire structural relationships amongthese variables. This structural relationships model is manageriallyimportant because it helps firms to understand which marketingefforts they should undertake to build up the dimensions of brandequity that contribute to strengthening their market power and inturn increasing their financial performance. As an example, supposechannel performance has more impact on brand image, a dimensionof brand equity, than the value-oriented price, and brand image is themost influential on profit among all the critical dimensions of brandequity. Given this information, the firm may decide to allocate a largeportion of its resources to leveling up channel performance.
The structural relationships model is well established in consumermarketing, and knowledge produced from this model is useful forunderstanding how brand equity is developed and how it affectsmarket performance in business markets (Atilgan, Aksoy, & Akinci,
Table 1Studies on brand naming and conditions for branding activities.
Study Business market Major find
Saunders andWatt (1979)
Man-made fiber products Brand namrather, it isit is accom
Sinclair andSeward (1988)
Wood products Retailers anaming ma
Shipley andHoward (1993)
Random-sampled industrial productslisted on the Kompass Register of U.K. companies
Ten proposbrand nambrand namdifferent fr
Hutton (1997) Personal computers, copiers, fax machines andfloppy disks
Branding sproducts apressure o
Mudambi (2002) Precision bearings The industlow-intereclusters th
Schuiling andMoss (2004)
Pharmaceutical products The pharmname stratsubject ofthe FMCG
2005; Chaudhuri & Holbrook, 2001; Netemeyer et al., 2004; Simon &Sullivan, 1993; Villarejo-Ramos & Sanchez-Franco, 2005; Yoo &Donthu, 2001, 2002; Yoo, Donthu, & Lee, 2000). However, thismodel cannot capture some distinctive aspects of business markets,and as a result we need to develop a comprehensive model forbusiness markets, taking into consideration these distinctive aspects.
Among these aspects, three are particularly noteworthy. First, it isfrequently acknowledged that the role of corporate image is moreimportant in industrial marketing than consumer marketing (Bend-ixen et al., 2004; Schuiling &Moss, 2004; van Riel et al., 2005;Webster& Keller, 2004). Research in business markets indicates that corporateimage has greater impact on brand loyalty than product image (vanRiel et al., 2005), or choice decision varies depending on corporatereputation (Cretu & Brodie, 2007). Few studies in consumermarketing systematically investigate the role of corporate image inthe brand equity building process. Second, the relationship betweenthe seller and the buyer is much more critical for securing marketpower in business markets than consumer markets. After-salesservice is instrumental to cultivating the buyer–seller relationship inbusiness markets (Kuhn, Alpert, & Pope, 2008). It contributes a greatdeal to buyer satisfaction and in turn strengthens the buyer–sellerrelationship (Mudambi, Doyle, &Wong, 1997; van Riel et al., 2005). Inconsumer marketing, after-sales service is taken as a product-,promotion-, or channel-related element; because of this, its role hasbeen less emphasized. Third, as mentioned above, relatively fewbuyers exist and group decision making frequently occurs for productpurchase in business markets. Thus, promotion in business markets ispursued in a very different manner from that in consumer markets(Kuhn et al., 2008; Mudambi, 2002; Webster & Keller, 2004). Forexample, personal selling plays a more important role in businessmarkets than consumer markets, and cents-off promotional activitiesare frequently undertaken in consumer marketing, whereas they aregenerally irrelevant in the context of the business market. This natureof promotion should be fully reflected in the analysis of brand equityin the business market context.
Considering the above three aspects, we aim to develop and test amodel to comprehensively consider marketing-mix efforts, corporateimage, dimensions of brand equity and market performance. Thismodel is addressed in the context of an IT software sector. Brandequity is an important factor to affect buyers' choice behaviors andfirms' marketing activities in the industrial market of IT software.Considering what Hutton (1997) explains, for example, we may thinkthat buyers prefer well-known software brands rather than lesser-known ones for three primary reasons. First, they are not familiar with
ings
ing is not useful to buyers for distinguishing how the products are differentiated;rather confusing. Brand naming is rarely effective in the competitive market unlesspanied by active promotion.re not sure about the effect of the supplier's brand naming. However, brandy be helpful due to a halo effect when corporate image is good enough.itions about the importance of brand naming, the incidence of brand-name usage,ing strategies, brand naming processes, and managerial resource commitment toing are supported. In addition, branding strategies and practices of small firms areom large firms.trategies are effective in business markets. Brand is especially important whenre complex and require greater service and support, when buyers face timer resource limitations, and when buyers are afraid of product failure.rial buyers are divided into three clusters: branding-receptive, highly tangible, andst buyers. Different branding strategies should be used depending on to whiche target buyers belong.aceutical and FMCG industries are compared in terms of the choice of brandegies, the level of brand globalization, the use of brand extension, and theco-branding. The pharmaceutical industry would benefit from benchmarking ofbranding experience because they rarely have structural differences.

Table 2
Study Business market Classification of studies Relationships
BED ABED CBED DCIB
a. Exploratory studies on industrial brandingMudambi et al. (1997) Precision bearings ABED→BED
ABED: (1) company: profit, share, reputation, image, (2) distribution:reliable, hassle, EDI/JIT, lead time, (3) product: reliable, high-tech, fit, defects,(4) support services: expertise, rapport, range of serviceBED: brand value (single-dimension construct)DCIB: corporate image, support service
● ● ●
Michell et al. (2001) Industrial products listed inthe Kompass Register of U.K.companies
ABED→BEDABED (antecedents of brand loyalty): quality, reliability, performance,service, value for money, availability, familiarity, relationship with sales team,price, advertising, and company performanceBED: brand name benefits (brand awareness), brand sponsor strategy(brand associations), competitive differentials of brands(tangible and other proprietary assets) and the generators of customerloyalty (brand loyalty and perceived quality)DCIB: corporate image, salesperson
● ● ●
McQuiston (2004) Steel for laser cuttingmachine
ABED→BEDABED: (1) physical product: good quality, (2) logistics: fast and efficient delivery,spirit of cooperation among stockholders, (3) customer support:skilled staff, (4) corporate image and policy: recognized brand name andstrong customer orientationBED: brand value (single-dimension construct)DCIB: support service, corporate image
● ● ●
Bendixen et al. (2004) Medium-voltage electricalequipment
ABED→BEDABED (antecedents of brand awareness): technical consultant, sales representative,conference, exhibition, direct mail, journal, magazine,word of mouth, mass mediaBED: brand awareness, perceived quality, brand loyaltyDCIB: salesperson
● ● ●
b. Modeling studies on the antecedents and consequences of dimensions of brand equityBaldauf et al. (2003) Tiles (reseller) market BED→CBED
BED: brand awareness, perceived quality, brand loyalty, end user's brand value andpurchase intention (perceived by resellers)CBED: profitability performance, market performance,
● ●
van Riel et al. (2005) Specialty chemicals ABED→BEDABED: value for money, distribution performance, providing information(promotion), personnelBED: perceived quality of product and service, loyalty intentionDCIB: corporate image, salesperson, support service
● ● ●
Cretu and Brodie (2007) Shampoo for hair salons ABED→BEDABED: company reputation, prices/costBED: customer value, customer loyalty, brand image, product andservice qualityDCIB: corporate image
● ● ●
Roberts and Merrilees (2007) Mall tenants ABED→BEDABED: service quality, empowerment to tenants and responsive behavior ofmall center, consumers' brand attitude to mallBED: trust, lease contract renewal
● ●
Taylor et al. (2007) Professional liabilityinsurance service
BED→CBEDBED: perceived quality, perceived brand value, brand attitude, brand uniqueness,brand satisfaction, loyalty intentionCBED: overall value of brand equity
● ●
Davis et al. (2008) Logistics service BED→CBEDBED: brand awareness, brand imageCBED: overall value of brand equity
● ●
Han and Sung (2008) Electronics, electricity,engineering, chemicals,plastics, equipment
ABED→BED→CBEDABED: supplier's competence, purchasing valueBED: brand loyalty, brand trust, brand satisfaction, switching cost, commitment,relationship qualityCBED: transaction performance
● ● ●
Jensen and Klastrup (2008) Pumps ABED→BEDABED: product quality, service quality, price, differentiation, promise, trustand credibilityBED: customer brand relationship
● ●
BED: Brand Equity Dimensions.ABED: Antecedents of Brand Equity Dimensions.CBED: Consequences of Brand Equity Dimensions.DCIB: Distinctive Characteristic of Industrial Branding.
426 J.-H. Kim, Y.J. Hyun / Industrial Marketing Management 40 (2011) 424–438
the product category because of its complexity. Second, IT softwareentails a large amount of support services. Third, the malfunction of ITsoftware would create serious problems for the company and buyers
themselves. Also Webster and Keller (2004) notice that HewlettPackard, IBM, Intel, Siemens, and Cisco are top performers in businessmarkets and their high brand equity contributes to such top

427J.-H. Kim, Y.J. Hyun / Industrial Marketing Management 40 (2011) 424–438
performance. Despite the importance of brand equity in the ITsoftware sector, little research has been conducted to uncover theprocess by which brand equity is developed (Ojasalo, Natti, &Olkkonen, 2008). Moreover, the distinctive nature of industrialbranding is found in the IT software sector. Srivastava and Mookerjee(2004) conduct in-depth interviews with professionals working fortwo IT software companies and show that corporate image (charac-terized by stability, reliability and financial strength) and after-salesservice (characterized by upgrade policy, maintenance and respon-siveness) are critical determinants of brand equity. Thus, the ITsoftware sector may be a context where the model is meaningfullypursued.
Adapted from Aaker (1996) and Yoo and Donthu (2001), ourmodel in the IT software context regards brand equity as consisting ofthree dimensions: brand awareness with associations, perceivedquality, and brand loyalty. Applying the hierarchy-of-effects theory(Lavidge & Steiner, 1961), the model posits three causal paths frombrand awareness with associations to perceived quality, from thatawareness to brand loyalty, and from perceived quality to brandloyalty. In the model, corporate image is an antecedent of thedimensions of brand equity, as well as a consequence of marketing-mix efforts. The model specifies the effects of marketing-mix effortson corporate image. The model addresses after-sales service as amarketing-mix element, and defines and operationalizes promotionin adaptation to the business market context. The three dimensions ofbrand equity are placed in the model to affect market performance.
This paper is organized as follows. First, a literature review ispresented that reveals how research on brand equity has beenconducted in the area of industrial marketing during the past twodecades. Then, based on the literature review, this paper develops themodel as mentioned above, and addresses a set of hypotheses fromthe model. Next is the empirical test of the hypotheses. The collectionand analysis of data for testing the hypotheses is described. This isfollowed by the results of the hypotheses tests and a discussion ofthem. Finally, limitations of the present study and directions of thefuture study are mentioned.
2. Literature review
Our literature survey dates back to the 1970s. As Table 1 shows, sixstudies examine the effect of brand naming activity on productdifferentiation and buyer behavior (Saunders &Watt, 1979; Shipley &Howard, 1993; Sinclair & Seward, 1988), or suggest a variety ofconditions where branding activities are effective andwhich brandingstrategies should be used in those conditions (Hutton, 1997;Mudambi, 2002; Schuiling & Moss, 2004). Twelve studies in Table 2analyze the structures of brand equity and/or its relationships withthe antecedents and consequences. The six studies in Table 1 are notdirectly relevant to our study, and thus we hereafter discuss the 12studies in Table 2.
In consumer marketing, there is a significant amount of researchthat empirically tests the relationships among dimensions of brandequity, their antecedents, and consequences (e.g., Atilgan et al.,2005; Netemeyer et al., 2004; Simon & Sullivan, 1993; Villarejo-Ramos & Sanchez-Franco, 2005; Yoo & Donthu, 2001, 2002; Yoo etal., 2000). In contrast, research on such relationships rarely exists inindustrial marketing though there are some efforts to examine therelationships among them. Some of the studies are summarized inTable 2.
Four studies in the first part of Table 2 use exploratory approachesin that they seek to discover something about how brand equitystructures relate to antecedents, using qualitative methods and/orpresenting descriptive data produced in an ad hoc manner. Oneshortcoming of the exploratory studies is that they do not examinehow dimensions of brand equity relate to their consequences. Anothershortcoming is that they do not consider an entire set of key brand
equity dimensions, namely, brand awareness with associations,perceived quality, and brand loyalty. According to their researchfocus, they selectively consider in their analysis some of the keydimensions (Bendixen et al., 2004; Michell, King, & Reast, 2001) ortake brand equity as a single-dimension construct (McQuiston, 2004;Mudambi et al., 1997). Moreover, they only consider some distinctiveaspects of industrial branding that concern the importance ofcorporate image, after-sales service and personal selling in thebrand equity building process.
Michell et al. (2001) adopt dimensions of brand equity proposedby Aaker (1991) and reinterpret them in the business marketcontext. They do not consider the consequences of brand equitydimensions, and only examine the antecedents of brand loyaltyamong dimensions of brand equity. In addition, they do not addressthe role of after-sales service in industrial branding. The results oftheir survey show manufacturers of industrial products believe thekey drivers of brand loyalty are quality of a product, availability,value for the money, relationships with sales teams, advertising andcompany performance. Bendixen et al. (2004) take brand awarenessas a dimension of brand equity, and show that its two mostimportant antecedents in an electrical equipment market aretechnical consultant and salesperson. The antecedents of otherdimensions of brand equity are not examined. The consequences ofdimensions of brand equity and the role of corporate image arelikewise not considered. Mudambi et al. (1997) conduct in-depthinterviews with manufacturers, distributors and customers in aprecision bearings market to uncover the antecedents of brandequity. They address brand equity as a single-dimension construct,termed a “pinwheel of brand value”. They then explain how it relatesto four antecedents: product performance, distribution perfor-mance, support services performance, and company performance.The consequences of brand equity are not considered, andpromotional activities such as personal selling, ad campaigns andWeb site communications are not addressed as the antecedents ofbrand equity. McQuiston (2004) conducts a case study of a Finnishsteel company and addresses brand equity as a single-dimensionconstruct. The study relates brand equity to four antecedents:technical solution, logistical solution, customer support solution,and corporate image and policy. The consequences of brand equityare not considered, and promotional activities are not defined as thedeterminants of brand equity.
The second part of Table 2 shows eight studies that empirically testthe relationship of dimensions of brand equity with antecedents and/or with consequences. Among them, only one study examines theentire structural relationships among dimensions of brand equity,their antecedents, and consequences (Han & Sung, 2008). However,this study does not investigate the distinctive nature of industrialbranding that concerns how corporate image, after-sales service andpersonal selling affect the development of brand equity. Theremaining studies focus on the relationships between dimensions ofbrand equity and either consequences (Baldauf, Cravens, & Binder,2003; Davis, Golicic, & Marquartdt, 2008; Taylor et al., 2007) orantecedents (Cretu & Brodie, 2007; Jensen & Klastrup, 2008; Roberts &Merrilees, 2007; van Riel et al., 2005). Moreover, except van Riel et al.(2005), some of the remaining studies do not fully cover thedistinctive nature of industrial branding that concerns how corporateimage, after-sales service and personal selling affect the developmentof brand equity (Cretu & Brodie, 2007), and the others do not dealwith issues related to the distinctive nature (Baldauf et al., 2003; Daviset al., 2008; Jensen & Klastrup, 2008; Roberts & Merrilees, 2007;Taylor et al., 2007).
Baldauf et al. (2003) examine the relationship between dimen-sions of brand equity and their consequences in a tile reseller market.They find that five dimensions of brand equity—brand awareness,perceived quality, brand loyalty, purchase intention and end user'sperceived brand value—are significant predictors of market

428 J.-H. Kim, Y.J. Hyun / Industrial Marketing Management 40 (2011) 424–438
performance (e.g., sales volume) and profitability performance (e.g.,margin). They do not examine the relationships between dimensionsof brand equity and their antecedents while not considering thedistinctive nature of industrial branding that concerns how corporateimage, after-sales service and personal selling affect the developmentof brand equity. Davis et al. (2008) examine the applicability of Keller(1993) concept of brand equity to an industrial logistics servicemarket. They consider brand equity as comprising two dimensions:brand awareness and brand image. The overall value of brand equity isused to operationalize market performance of the brand. The results ofstructural equation modeling show that brand awareness and brandimage explain a significant amount of variance in the overall value ofbrand equity. The relationships between dimensions of brand equityand their antecedents are not examined, and the distinctive nature ofindustrial branding as mentioned above is not considered, either. In anindustrial insurance market, Taylor et al. (2007) uncover the relation-ships between dimensions of brand equity and their consequences aswell as relationships among dimensions of brand equity. Theirproposed model addresses brand equity as comprising perceivedquality, brand value, brand attitude and brand uniqueness. The overallvalue of brand equity is proposed as their consequence. It alsopresents brand satisfaction and loyalty intention as consequences ofthe overall value of brand equity, but they should be interpreted asdimensions of brand equity according to the results of previousresearch (Aaker, 1991, 1996; Yoo & Donthu, 2001). In other words,only relationships among dimensions of brand equity are analyzed,while ignoring relationships between dimensions of brand equity andtheir consequences. The antecedents of dimensions of brand equity arenot examined while the aforementioned distinctive nature ofindustrial branding is not considered.
van Riel et al. (2005) propose a model that distinguishes betweenproduct brand equity and corporate brand equity, and investigatetheir antecedents. The model proposes perceived product qualityand service quality as dimensions of brand equity, and brand loyalty(termed loyalty intention) as their consequence. However, accord-ing to the results of existing research, all of these elements should beconsidered dimensions of brand equity (Aaker, 1991, 1996; Yoo &Donthu, 2001). Moreover, corporate brand equity may be inter-preted as corporate image, because the construct is measured withitems related to corporate reputation (e.g., financially stablecompany and leading edge supplier). As such, van Riel et al.(2005) analyze the relationships among dimensions of brand equityand their antecedents, taking into account the important role ofcorporate image in industrial branding. However, relationshipsbetween dimensions of brand equity and their consequences arenot examined. The results of structural equation modeling show thatvalue for the money and distribution performance are the keydrivers of perceived product quality and brand loyalty, whilepromotion and personnel (i.e., employee and staff) are theantecedents of perceived service quality, brand loyalty and corpo-rate image. Corporate image is found to positively affect brandloyalty. Cretu and Brodie (2007) examine the relationships betweendimensions of brand equity and their antecedents, and the relation-ships among dimensions of brand equity. They also do not considerthe consequences of the dimensions of brand equity. Their modelsuggests that the dimensions of brand equity include brand image,product and service quality, customer value, and customer loyalty.The corporate image (termed company reputation) is considered tobe an important antecedent of dimensions of brand equity. However,the role of after-sales service and personal selling as the antecedentsof brand equity dimensions are not scrutinized. Results of an analysisshow that product and service quality as well as price and costs as anantecedent has effects on customer loyalty, directly and indirectlythrough customer value. The brand image is found to have directeffects on customer value and indirect effect on customer loyaltythrough product and service quality, while corporate image has a
direct effect on both of them. Roberts andMerrilees (2007) make thepoint that products have dominated the conventional brandingresearch in business markets, and extend the scope of research intoservice sectors. They analyze the relationships between dimensionsof brand equity and their antecedents in a mall tenant contractmarket. The consequences of dimensions of brand equity are notinvestigated while the aforementioned distinctive nature of indus-trial branding is not considered. The brand trust (i.e., the trustbetween mall center and tenants) and repurchase intention (i.e.,lease contract renewal) are proposed as dimensions of brand equity,and service quality, responsive behavior of mall center, andempowerment to tenants as their antecedents. The consumer'sbrand attitude toward mall is proposed as a mediator in relation-ships between dimensions of brand equity and their antecedents.The results of a structural model show the responsive behavior of themall center has a direct effect on brand trust and repurchaseintention while service quality of the mall center and empowermentto tenants have an indirect influence on them through theconsumer's brand attitude to the mall. Jensen and Klastrup (2008)examine the relationships between customer brand relationship as adimension of brand equity and its antecedents. The results of astructural model show that customer brand relationship is influ-enced by product quality, service quality, price, differentiation,promise, and trust and credibility. They examine the antecedents ofonly customer brand relationship among dimensions of brandequity, and however do not consider its consequences and theaforementioned distinctive nature of industrial branding. Han andSung (2008) propose a comprehensive model that considers bothantecedents and consequences of dimensions of brand equity usingsamples from various business markets: electronics, electricity,engineering, chemicals, plastics and equipment markets. Theyaddress the supplier's competence and buyer's purchasing value asthe antecedents of dimensions of brand equity such as brandsatisfaction, brand trust, brand loyalty, commitment and relation-ship quality. The transaction performance is used as a consequenceof dimensions of brand equity. However, they do not consider theaforementioned distinctive nature of industrial branding.
In light of the shortfalls discovered in a review of the literature, it isnecessary to develop and empirically test a comprehensivemodel thatencompasses dimensions of brand equity, their antecedents andconsequences, and reflects the distinctive aspects of industrialbranding.
3. Model and hypotheses
As shown in Fig. 1, the model addresses three dimensions ofbrand equity, four marketing-mix efforts as antecedents of thedimensions, and the overall value of brand equity as a consequenceof the dimensions. It also includes corporate image as a mediatorbetween the marketing-mix efforts and dimensions of brand equity,which reflects distinctive aspects of industrial branding. The threedimensions of brand equity are brand awareness with associations,perceived quality, and brand loyalty. These are adapted from Aaker(1996), and Yoo and Donthu (2001). According to Yoo et al. (2000),the overall value of brand equity is adopted as a proxy of marketperformance. Marketing-mix efforts include channel performance,value-oriented price, promotion and after-sales service. It isnoteworthy that after-sales service is included as an antecedent ofdimensions of brand equity, and promotion is defined andoperationalized in adaptation to the business market context,which is described later.
In the model, the marketing-mix efforts affect the three dimen-sions of brand equity both directly and indirectly through corporateimage. In turn, these three dimensions affect the overall value ofbrand equity. They are structured in a hierarchy: brand awareness

Fig. 1. Structural-relationships among marketing—mix efforts, corporate image, and brand equity.
429J.-H. Kim, Y.J. Hyun / Industrial Marketing Management 40 (2011) 424–438
with associations affects perceived quality and brand loyalty;perceived quality affects brand loyalty.
3.1. Marketing-mix efforts and brand equity dimensions
3.1.1. ChannelIn consumer marketing, research shows that channel performance
contributes to building brand equity (Dodds, Monroe, & Grewal, 1991;Grewal, Krishnan, Baker, & Borin, 1998; Rao & Monroe, 1989; Yooet al., 2000). Good store-image not only attracts more attention,interests, and contacts from potential consumers, but also increasesconsumer satisfaction and positive word of mouth. Thus, it levels upbrand awareness with associations and brand loyalty. In addition,distributing through good-image stores signals that a brand has goodquality. Distribution intensity also has a positive impact on dimen-sions of brand equity because high distribution intensity increases theprobability of buying a brand wherever and whenever consumerswant (Farris, Olver, & Kluyver, 1989; Yoo et al., 2000). Specifically,since the increase in distribution intensity reduces consumer effortsfor finding and acquiring a brand, consumers are likely to perceive itas more valuable, which in turn increases consumer satisfaction andbrand loyalty (Yoo et al., 2000).
In industrial marketing, the activities of order processing,coverage, and delivery are found to be critical for building brandequity (McQuiston, 2004; Mudambi et al., 1997). van Riel et al. (2005)find that these activities positively affect perceived quality and brandloyalty. These activities relate to channel performance, and thepositive image of the industrial channel member makes buyersmore assured of the performance. In this respect, as Schuiling andMoss (2004) argue, we may reason that in the context of industrialmarketing, channel performance that concerns the distribution
density and the channel member's image has a positive impact onthe dimensions of brand equity. Considering all this, we mayformulate the following hypotheses:
H1a. Channel performance positively affects brand awareness withassociations.
H1b. Channel performance positively affects perceived quality.
H1c. Channel performance positively affects brand loyalty.
3.1.2. PriceIn consumer markets, price is an extrinsic cue of product quality,
and thus high-priced brands are often perceived to be of higherquality (Dodds et al., 1991; Yoo et al., 2000). On the other hand,given product quality is homogeneous and easily substantiated, ahigher price may negatively affect brand loyalty because it does notsignal higher product quality, but instead only highlights that moremoney must be paid. This negative effect of high price on brandloyalty has been reported in industrial branding (Cretu & Brodie,2007; Jensen & Klastrup, 2008; Michell et al., 2001). Mudambi et al.(1997) propose that some industrial buyers estimate low priceaccounts for about 70% of the final decision in business markets. Incontrast, however, Abratt (1986) shows that industrial buyersconsider low price less important than other product selectioncriteria (e.g., technical service and product reliability), and arewilling to pay a price premium for the superior equipment in high-tech markets. Higher price with more channel service wouldincrease brand loyalty. As the impact that the price has on brandequity varies depending on market characteristics, van Riel et al.(2005) use value for the money as an antecedent of dimensions ofbrand equity instead of the price. They demonstrate that value for
430 J.-H. Kim, Y.J. Hyun / Industrial Marketing Management 40 (2011) 424–438
the money has a positive impact on brand satisfaction, which in turnincreases brand loyalty. It is likely that the value-oriented pricewould be a salient characteristic of the brand, and thus grabattention while motivating consumers to think more about thebrand. On the other hand, it would undermine higher qualityperception although it tells that product quality is fair for the price.For example, it makes buyers perceive that the brand is of high value,but it may have a negative impact on the buyer's perception that thebrand has premium quality. With all this in mind, we develop thefollowing hypotheses:
H2a. The value-oriented price positively affects brand awarenesswith associations.
H2b. The value-oriented price negatively affects premium-qualityperception.
H2c. The value-oriented price positively affects brand loyalty.
3.1.3. PromotionPromotion is defined as providing information for persuasion (van
Riel et al., 2005). It includes advertising, promotional events, personalselling, Web site-based communication activities, and so on. Inconsumer marketing, the positive effects of advertising on thedimensions of brand equity have been fully substantiated (Aaker &Jacobson, 1994; Cobb-Walgren, Ruble, & Donthu, 1995; Simon &Sullivan, 1993; Yoo & Donthu, 2002; Yoo et al., 2000). Promotionalevents with long-term goals could build brand equity through offeringactual product experience that helps to create strong, favorable, andunique associations (Keller, 2008). On the other hand, short-termprice reductions such as cent-off deals might not be desirable forbuilding brand equity, even though they boost sales in the short run(Aaker, 1991; Yoo et al., 2000).
In industrial marketing, promotional activities such as brochures,salesperson, and Web sites are frequently mentioned as antecedentsof dimensions of brand equity (Sharma, Krishnan, & Grewal, 2001;van Riel et al., 2005). Exhibition, trade show, conferences, direct mailads, press releases, word of mouth, and technical consultant are alsoconsidered as sources of information, particularly in high-techmarkets (Abratt, 1986). A salesperson is often emphasized as anespecially important medium of communication in business markets(Kuhn et al., 2008; Lynch & Chernatony, 2004; Mudambi, 2002). Therationale is that personal selling is instrumental to offering informa-tion tailored to the different needs that each member in anorganization buying center has (Mudambi, 2002; Webster & Keller,2004). Gordon, Calantone, and di Benendetto (1993) argue that initialawareness and association of a brand are often achieved by directcontacts with salespersons in businessmarkets. Bendixen et al. (2004)also find that technical consultant and sales representative are themost effective avenues for achieving brand awareness in an industrialelectrical equipment market. Abratt (1986) shows that sales repre-sentative is a major source of information for increasing buyers'awareness and choice in high-tech industrial markets. Moreover, vanRiel et al. (2005) demonstrate the positive influence that promotionhas on brand loyalty as well as perceived service quality. Therefore,the following hypotheses are devised:
H3a. Promotion positively affects brand awareness with associations.
H3b. Promotion positively affects perceived quality.
H3c. Promotion positively affects brand loyalty.
3.1.4. After-sales serviceIn consumer marketing, after-sales service (often referred to as
support service) has not been considered a major antecedent ofbrand equity, but rather has been taken as a product-, promotion-, or
channel-related element. In contrast, it has been used as a key elementfor positively affecting brand equity in industrial marketing since therapport with the customer as well as technical support may give goodopportunities to establish close relationshipswith customers,which inturn compels customers to patronize the company (Kuhn et al., 2008;Mudambi et al., 1997). Arguing that support service is one of theprimary factors for building brand loyalty in businessmarkets, Kuhn etal. (2008) make the point that Keller's customer-based brand equity(CBBE) model tends to ignore elements relevant to support services,and suggest a revised CBBEmodel for industrial branding. vanRiel et al.(2005) show that satisfactionwith support service has a positive effecton brand loyalty in business markets. After-sales service is also foundto be a more important product-selection criterion than price in high-tech markets (Abratt, 1986). Little research examines the effects ofafter-sales service on brand awareness with associations and per-ceived quality. However, excellent support service is expected to be amemorable characteristic of a brand, leading to the creation offavorable brand associations. For instance, Acme Brick is rememberedas offering excellent support services such as a 100-year limitedguarantee (Kotler & Pfoertsch, 2006). Furthermore, unless consumersare satisfied with repair or restoration through after-sales service, thequality of a product is not likely to be considered credible. Thus, wearrive at the following hypotheses:
H4a. After-sales service positively affects brand awareness withassociations.
H4b. After-sales service positively affects perceived quality.
H4c. After-sales service positively affects brand loyalty.
3.2. Relationships between marketing-mix efforts and corporate image
Corporate image can be defined as a particular type of feedbackfrom those in a given market regarding the credibility of the identityclaims that the organization makes (Cretu & Brodie, 2007; Wartick,2002; Whetten & Mackay, 2002). Dowling (1986) suggests theprocess by which the industrial company develops the corporateimage and proposes that the corporate image is influenced byproduct, price, distribution channel, advertising, after-sales service,concern about the environment, and employee attitude. Henderson(1971) proposes that marketing-mix activities such as productappearance, retail outlet, and promotion are pivotal in developingthe corporate image. van Riel et al. (2005) show in business marketsthat promotion and personnel (employee and staff) influence thecorporate image. Corporate image is also found to be influencedstrongly by characteristics of the salesperson (e.g., expertise,likeability, similarity and frequent business contact) as an importantsource of information (Doney & Cannon, 1997). Thus, we expect thatmarketing activities such as channel performance, value-orientedprice, promotion, and after-sales service have a positive impact onthe corporate image.
H5a. Channel performance positively affects the corporate image.
H5b. Value-oriented price positively affects the corporate image.
H5c. Promotion positively affects the corporate image.
H5d. After-sales service positively affects the corporate image.
3.3. Relationships between corporate image and brand equity dimensions
The role of the corporate image in establishing brand equity ismore emphasized in industrial marketing than in consumermarketing (Kuhn et al., 2008; Michell et al., 2001). Although thereare inherent difficulties in managing corporate image—due to itsfragility and the time and effort required to rectify it if it becomes

Table 3Industrial classification of respondents.
Industry Frequency Percent
Wholesale and retail trade 139 35.8Information and communication 54 13.9Manufacturing 52 13.4Construction 21 5.4Accommodation and food service 14 3.6Education 14 3.6
431J.-H. Kim, Y.J. Hyun / Industrial Marketing Management 40 (2011) 424–438
contaminated (Herbig & Milewicz, 1995)—such efforts are worth-while in business markets. Mudambi et al. (1997) suggest thatcorporate image is an important antecedent of brand equity inbusiness markets. van Riel et al. (2005) show that corporate imagessuch as “financially stable,” “leading edge” and “world famous” havepositive effects on brand loyalty. Good corporate image is likely togive trustworthiness and credibility to consumers or industrialbuyers, which in turn leads to an increase in the perceived quality ofa brand (Chen & Dubinsky, 2003; Cretu & Brodie, 2007; Martinez &Pina, 2005). Yoon, Guffey, and Kijewski (1993) show that companyreputation affects purchase intention directly as well as indirectlythrough the quality expectation of offering in a business insurancemarket. Good corporate image also serves as entry barriers againstpotential competitors (Herbig & Milewicz, 1995). In addition, goodcorporate image is particularly important when buyers need toevaluate a new supplier or product since it reduces uncertainty andrationalizes the selection process (Blomback & Axelsson, 2007).McQuiston (2004) explains that corporate image is a key driver forcreating relevant associations in industrial buyers' minds. Thus, weaddress the following hypotheses:
H6a. Good corporate image positively affects brand awareness withassociations.
H6b. Good corporate image positively affects perceived quality.
H6c. Good corporate image positively affects brand loyalty.
3.4. Relationships between brand equity dimensions and overall value ofbrand equity
The overall value of brand equity is defined as the value added tothe branded product relative to the unbranded product. It is theoutcome of the three dimensions of brand equity: brand awarenesswith associations, perceived quality, and brand loyalty (Yoo & Donthu,2001; Yoo et al., 2000). The positive effects of the three dimensions ofbrand equity on the overall value of brand equity are found in cross-cultural study of America and Korea (Yoo & Donthu, 2002). Thus, weformulate the following hypotheses:
H7a. Brand awareness with associations positively affects the overallvalue of brand equity.
H7b. Perceived quality positively affects the overall value of brandequity.
H7c. Brand loyalty positively affects the overall value of brand equity.
Yoo et al. (2000) and Yoo and Donthu (2001) suggest interrela-tions among three dimensions of brand equity. Applying thehierarchy-of-effects theory (Lavidge & Steiner, 1961), our modellays out three causal paths: from brand awareness with associationsto perceived quality, from that awareness to brand loyalty, and fromperceived quality to brand loyalty. These causal relationships aresupported by the CBBE pyramid (Keller, 2008)2 and the five-stagedevelopment process of industrial brand equity (Gordon et al., 1993).3
Thus, we arrive at the following hypotheses:
H8a. Brand awareness with associations positively affects perceivedquality.
2 CBBE pyramid consists of hierarchical four steps: identity, meaning, responses, andrelationships in order. Four steps could correspond to each of dimensions of brandequity: identity to brand awareness, meaning to brand association, response toperceived quality, and relationships to brand loyalty.
3 The five stages in developing industrial brand equity are, in order, brand birth,creation of brand awareness and association, building of quality and value perceptions,emergence of brand loyalty, and launching of brand extension.
H8b. Brand awareness with associations positively affects brandloyalty.
H8c. Perceived quality positively affects brand loyalty.
4. Method
4.1. Market context
The model is tested in the context of a Korean IT software marketwhere small to midsize firms purchase the IT software customized totheir needs from application service providers (ASP's). It is commonthat they lack resources to maintain and update the purchased ITsoftware, and thus ASP's take the job for the maintenance and update.The estimated size of this ASP market amounted to about 0.1 billiondollars in 2002 and increased to about 0.3 billion dollars in 2007. Themarket is still growing.Whilemore than 100 firms compete in the ASPmarket, the top five competitors (i.e., leading brands) occupyapproximately 50% of the market or more. These five competitorsset up the internet cable, and provide solution packages (e.g., softwareprograms for CRM, channel management, timesheet, accounting orcredit card payment) according to customer needs. In addition, theyoffer support services—for instance, restoring malfunctioned softwaresystems and installing newly released application programs. Thepromotional expenditures of the entire ASP industry could not beestimated in a precise manner. However, it is found that one of the topfive competitors spent about 4 million dollars on promotionalactivities in 2007. Two main categories of these activities are ofsalesperson promotion and above-the-line advertising.
4.2. Sampling and data collection
Product managers of a Korean IT software company prepared a listof the software purchasing companies. This list was delivered to themarketing research company that collected data. The sample wasdrawn randomly from the list. Respondents were those whoparticipated in a process of purchasing the IT software in the sampledcompanies. The face-to-face interview was administered to gatherdata for the top five IT software brands in the Korean ASP market asmentioned above. The sample size is 390. Elimination of incompleteresponses leaves 388 eligible for analysis. Respondents worked formore than one year in the purchasing department and weredistributed across various industries (Table 3). More than 80% ofrespondents belonged to companies that had less than 20 employees(Table 4). Data from respondents who did not participate in theprocess of brand choice were screened out.
Repair 12 3.1Human health and social work activities 12 3.1Arts, sports, and recreation 11 2.8Accounting 10 2.6Finance 8 2.1Transportation 6 1.5Real estimate and renting 6 1.5Others 29 7.5Total 388 100

Table 5Operational measures and scale reliability values.
Marketing-mix efforts Standardizedloading
t-value
Channel (α=0.827)CH1: X has various channels to purchase it 0.712 –
CH2: The process of purchasing X is simple 0.806 14.366CH3: Delivering and installing X is fast and correct 0.840 14.809
Price (α=0.835)PC1: The price of X is low 0.790 –
PC2: The price of X is reasonable for quality of product 0.909 12.955Promotion (α=0.897)
PM1: The frequency of salesperson's visit is high 0.710 –
PM2: Salespersons is kind 0.738 13.745PM3: Salesperson is able to give enoughinformation about services
0.838 15.539
PM4: Various promotion campaigns are offered 0.757 14.101PM5: The ad campaigns for X are seen frequently 0.805 14.953PM6: The Web site of X provides enough information 0.788 14.664
After-sales service (α=0.860)AS1: The process of call for after-sales service is simple 0.794 –
AS2: The restoration of system is fast 0.861 18.238AS3: The result of after-sales service is desirable 0.813 17.111
Dimension of brand equity and corporate image Standardizedloading
t-value
Brand awareness with associations (α=0.822)BAA1: I am always aware of X 0.699 –
BAA2: Characteristics of X come to my mind quickly 0.855 14.329BAA3: I can quickly recall the symbol or logo of X 0.804 13.859
Perceived quality (α=0.850)PQ1: The quality of X is credible 0.680 13.873PQ2: X must be of very good quality 0.792 –
PQ3: High quality of X is consistent 0.800 16.877PQ4: X has a higher quality than other brands 0.808 17.088
Brand loyalty (α=0.831)BL1: I am satisfied with X 0.906 –
BL2: X is my favorite brand 0.905 24.897BL3: I have confidence in X 0.631 14.087
Overall value of brand equity (α=0.869)OBE1: Although another brand has same features as X,I would prefer to buy X
0.788 –
OBE2: If another brand is not different from X, it seemssmarter to purchase X
0.844 18.039
OBE3: Although there is another brand as good as X,I prefer to buy X
0.870 18.682
Corporate image (α=0.869)CI1: What offers X is a high-tech company 0.728 –
CI2: What offers X is a leading company 0.760 14.531CI3: What offers X has long experience 0.776 14.832CI4: What offers X is a representative of the IT softwareindustry
0.737 14.007
CI5: What offers X is a customer-oriented company 0.784 14.993
4 The dropped items are “My company spends little in using X” and “I have difficultyin imagining an image of X.”
Table 4Size of companies.
Number of employees Frequency Percent
Less than 20 319 82.220 to 49 42 10.850 to 100 16 4.1More than 100 11 2.9Total 388 100
432 J.-H. Kim, Y.J. Hyun / Industrial Marketing Management 40 (2011) 424–438
4.3. Scale development
Measures of marketing-mix efforts and corporate image aredeveloped from in-depth interviews with product managers andsales representatives of a Korean IT software company. The productmanagers provided findings from periodical research on buyerresponses to marketing activities and corporate image. The measureswere initially developed based on the result from analyzing thosefindings and what the product managers suggested. Sales represen-tatives of the company then reviewed the measures. The measureswere finally determined after this review. Measures of channelperformance, value-oriented price, and after-sales service eachconsist of three items, and those of promotion and corporate imageeach consist of six items and five items. All items are summarized inthe first part of Table 5.
Measures of dimensions of brand equity and the overall value ofbrand equity are adapted from Oliver (1999), Yoo et al. (2000), Yooand Donthu (2001, 2002), and Atilgan et al. (2005). Eight items thatmeasure brand awareness with associations and perceived qualityare adapted from Yoo et al. (2000) and Atilgan et al. (2005). Threeitems that measure brand loyalty are drawn from the four-stageloyalty model of Oliver (1999). This model aims to conceptualize the“cognitive–affective–conative-action” loyalty sequence. The cona-tive loyalty and action loyalty may be indiscriminant concepts fromthe overall value of brand equity, and cognitive loyalty is theweakest type of loyalty. In light of this, we choose affective loyaltyfor this study. Affective loyalty relates to a favorable attitude towardand satisfaction with a specific brand (Blut, Evanschitzky, Vogel, &Ahlert, 2007). Three items—satisfaction, likeability, and confidence—are used for affective loyalty. van Riel et al. (2005) also usesatisfaction to measure loyalty intention in business markets.Finally, three items of the overall value of brand equity are adaptedfrom Yoo et al. (2000). All items are summarized in the second partof Table 5.
4.4. Questionnaire
The questionnaire is organized as follows. First, after a shortintroduction, respondents are requested to answer questions to checkwhether they participate in purchasing decisions, and are screenedout if they do not. Then, dimensions of brand equity, the overall valueof brand equity, corporate image, and marketing-mix efforts aremeasured. All items are measured on the 7-point Likert scale withanchors of 1=strongly disagree and 7=strongly agree. Finally,questions about demographics are asked.
5. Results
5.1. Measurement model
Constructs of the model are compared with one another in apairwise manner to examine convergent and discriminant validity(Bagozzi, Yi, & Phillips, 1991). Using AMOS 4.0, we conductconfirmatory factor analysis (CFA) for the measurement model offour exogenous constructs (marketing-mix efforts) and five endog-enous constructs (dimensions of brand equity, overall value of brand
equity, and corporate image). Acceptable goodness-of-fit statistics areobtained in both measurement models. However, one item for priceand one item for brand awareness with associations4 are dropped outto improve convergent validity. Standardized factor loading of the twoitems are lower than 0.5. We conduct CFA again with the remainingitems. All coefficients are found to be statistically significant (pN0.05)and goodness-of-fit statistics are acceptable (CFA with marketingactivities: X2
(71)=203.564, GFI=0.926, AGFI=0.891, SRMR=0.039,RMSEA=0.069, CFI=0.959, IFI=0.959; CFA with three dimensionsof brand equity, the overall value of brand equity, and corporateimage: X2
(125)=349.161, GFI=0.909, AGFI=0.875, SRMR=0.063,RMSEA=0.068, CFI=0.950, IFI=0.950). Secondly, Average VarianceExtracted (AVE) and Construct Reliability (CR) are computed for allconstructs and compared with Squared Multiple Correlation (SMC) tocheck convergent and discriminant validity. As presented in

Fig. 2. Results of the structural equation modeling. Note: We also analyze an alternative model where one more relationship between corporate image and overall value of brandequity is added. The added relationship is not significant and all other relationships are maintained. Because the parsimony fit index (e.g., PGFI) is lower than original model, weadopt the present model.
433J.-H. Kim, Y.J. Hyun / Industrial Marketing Management 40 (2011) 424–438
Appendix 1a and 1b, the AVE and CR of constructs are higher than 0.5and 0.7, respectively, indicating an adequate level of convergentvalidity. AVE is higher than SMC except for perceived quality andcorporate image. However, the confidence interval (±two standarderrors) around the correlation estimate between the two factors doesnot include 1.0 (Appendix 2b), thus indicating discriminant validity(Anderson & Gerbing, 1988). Finally, Cronbach's α range from 0.822to 0.897, which means reliability is secured (Nunnally, 1978).
5.2. Structural model
The structural equations model is estimated using AMOS 4.0. Fourconstructs ofmarketing-mix efforts are specified as exogenous constructs.The exogenous constructs are related to four endogenous constructs (i.e.,corporate image and threedimensions of brand equity),which are relatedto the overall value of brand equity. The goodness-of-fit statisticsare acceptable (X2
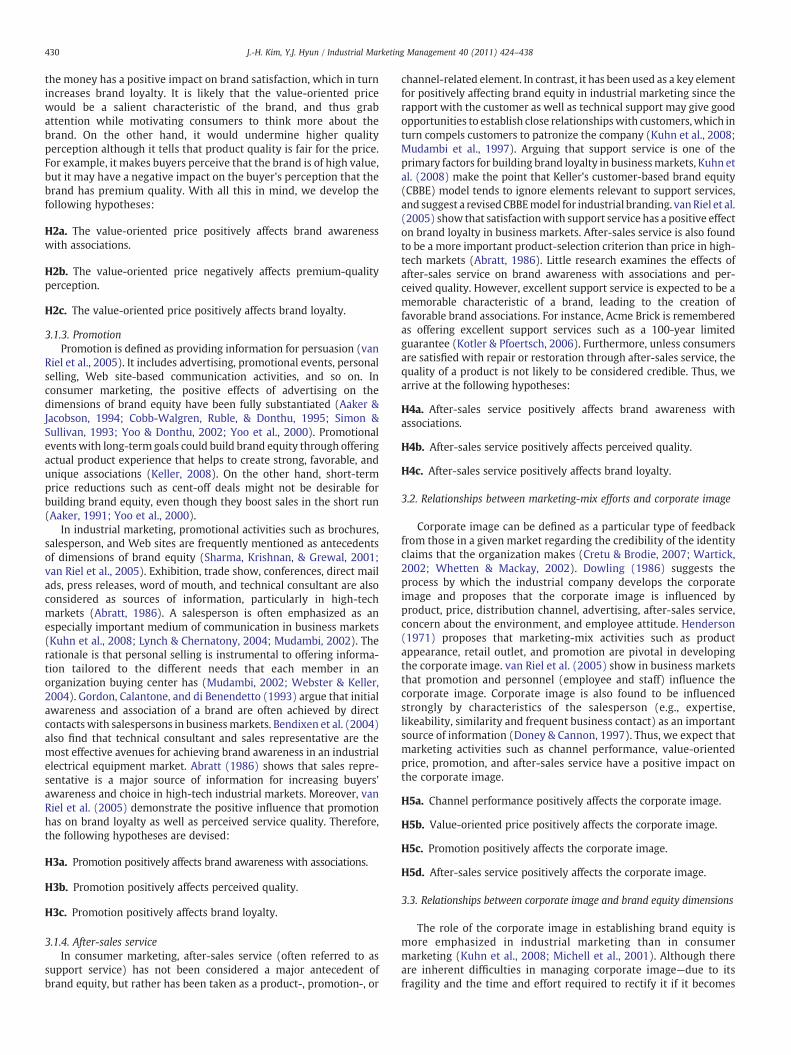
(403)=928.936, SRMR=0.060, RMSEA=0.058,GFI=0.870, AGFI=0.841, CFI=0.935, IFI=0.936). Results of the testare presented in Fig. 2 and Table 6.
5.2.1. Relationships between marketing-mix efforts and brand equitydimensions
H1a, H1c, H2a, H3a, H3b, and H4b are accepted while H1b, H2b,H2c, H3c, H4a, and H4c are not accepted. Channel performancepositively affects brand awareness with associations and brandloyalty. However, as H1b is not accepted, channel performance doesnot impact perceived quality. The three measurement items ofchannel performance are relevant to purchase convenience ratherthan product quality. Thus, it is not likely in the structural model thatchannel performance relates to perceived quality. The value-orientedprice positively influences brand awareness with associations. H2band H2c are not accepted, which indicates that the value-orientedprice does not affect both perceived quality and brand loyalty. Thiswould imply that the value-oriented price is less likely to affectquality perception and brand judgment than other marketing-mixelements in the industrial market of IT software. Abratt (1986) argues
that price is considered relatively less important in the process ofbrand choice decision in high-tech markets. Given that IT softwareproducts are more complex and intangible, it is not easy to determinewhether price is reasonable for the quality or buyers may notemphasize the role of price as an extrinsic cue of product quality.
As expected, promotion positively affects brand awareness withassociations and perceived quality (H3a and H3b). H3c is notaccepted, however, which means that the effect of promotion onbrand loyalty is not significant. The six measurement items ofpromotion are mainly regarding the delivery of information aboutthe product so that product purchase may be stimulated. Brandloyalty concerns the relationship between buyers and sellers, whichis not easily changed merely by such information delivery (Keller,2008). After-sales service positively affects perceived quality (H4b).As H4a and H4c are not accepted, after-sales service influencesneither brand awareness with associations nor brand loyalty. Theperformance of the IT software product is closely related to after-sales service. Then, after-sales service would lead mostly to quality-relevant associations, which largely concern the construct ofperceived quality. Considering this, we may guess in the structuralmodel that the relationship of after-sales service with perceivedquality is strong while its relationships with the other two brandequity dimensions (i.e., brand awareness with associations andbrand loyalty) are too weak to be statistically significant. In addition,as described above, brand loyalty refers to the buyer–sellerrelationship, which is so enduring. The impact of after-sales servicewould not be high enough to change the relationship.
The analysis of total effect (TE) is done to compare amongmarketing-mix efforts in themagnitude of the effect on each dimensionof brand equity. The TE analysis aggregates the direct effect between amarketing-mix effort and a brand equity dimension and the indirecteffect the marketing-mix effort have on the brand equity dimension byway of an intervening variable like corporate image. Brand awarenesswith associations is influenced the most by promotion (TE=0.373),perceived quality by after-sales service (TE=0.416), and brand loyaltyby channel performance (TE=0.529). Delivering information about the
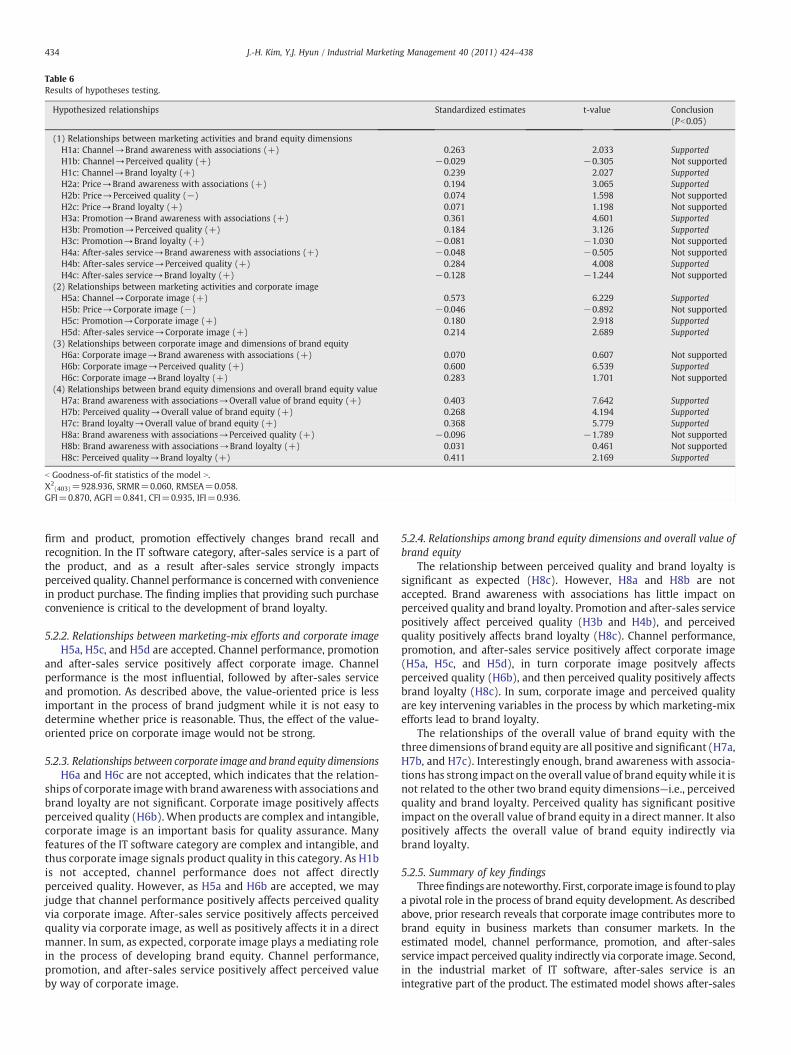
Table 6Results of hypotheses testing.
Hypothesized relationships Standardized estimates t-value Conclusion(Pb0.05)
(1) Relationships between marketing activities and brand equity dimensionsH1a: Channel→Brand awareness with associations (+) 0.263 2.033 SupportedH1b: Channel→Perceived quality (+) −0.029 −0.305 Not supportedH1c: Channel→Brand loyalty (+) 0.239 2.027 SupportedH2a: Price→Brand awareness with associations (+) 0.194 3.065 SupportedH2b: Price→Perceived quality (−) 0.074 1.598 Not supportedH2c: Price→Brand loyalty (+) 0.071 1.198 Not supportedH3a: Promotion→Brand awareness with associations (+) 0.361 4.601 SupportedH3b: Promotion→Perceived quality (+) 0.184 3.126 SupportedH3c: Promotion→Brand loyalty (+) −0.081 −1.030 Not supportedH4a: After-sales service→Brand awareness with associations (+) −0.048 −0.505 Not supportedH4b: After-sales service→Perceived quality (+) 0.284 4.008 SupportedH4c: After-sales service→Brand loyalty (+) −0.128 −1.244 Not supported
(2) Relationships between marketing activities and corporate imageH5a: Channel→Corporate image (+) 0.573 6.229 SupportedH5b: Price→Corporate image (−) −0.046 −0.892 Not supportedH5c: Promotion→Corporate image (+) 0.180 2.918 SupportedH5d: After-sales service→Corporate image (+) 0.214 2.689 Supported
(3) Relationships between corporate image and dimensions of brand equityH6a: Corporate image→Brand awareness with associations (+) 0.070 0.607 Not supportedH6b: Corporate image→Perceived quality (+) 0.600 6.539 SupportedH6c: Corporate image→Brand loyalty (+) 0.283 1.701 Not supported
(4) Relationships between brand equity dimensions and overall brand equity valueH7a: Brand awareness with associations→Overall value of brand equity (+) 0.403 7.642 SupportedH7b: Perceived quality→Overall value of brand equity (+) 0.268 4.194 SupportedH7c: Brand loyalty→Overall value of brand equity (+) 0.368 5.779 SupportedH8a: Brand awareness with associations→Perceived quality (+) −0.096 −1.789 Not supportedH8b: Brand awareness with associations→Brand loyalty (+) 0.031 0.461 Not supportedH8c: Perceived quality→Brand loyalty (+) 0.411 2.169 Supported
b Goodness-of-fit statistics of the model N.X2
(403)=928.936, SRMR=0.060, RMSEA=0.058.GFI=0.870, AGFI=0.841, CFI=0.935, IFI=0.936.
434 J.-H. Kim, Y.J. Hyun / Industrial Marketing Management 40 (2011) 424–438
firm and product, promotion effectively changes brand recall andrecognition. In the IT software category, after-sales service is a part ofthe product, and as a result after-sales service strongly impactsperceived quality. Channel performance is concernedwith conveniencein product purchase. The finding implies that providing such purchaseconvenience is critical to the development of brand loyalty.
5.2.2. Relationships between marketing-mix efforts and corporate imageH5a, H5c, and H5d are accepted. Channel performance, promotion
and after-sales service positively affect corporate image. Channelperformance is the most influential, followed by after-sales serviceand promotion. As described above, the value-oriented price is lessimportant in the process of brand judgment while it is not easy todetermine whether price is reasonable. Thus, the effect of the value-oriented price on corporate image would not be strong.
5.2.3. Relationships between corporate image and brand equity dimensionsH6a and H6c are not accepted, which indicates that the relation-
ships of corporate imagewith brand awarenesswith associations andbrand loyalty are not significant. Corporate image positively affectsperceived quality (H6b). When products are complex and intangible,corporate image is an important basis for quality assurance. Manyfeatures of the IT software category are complex and intangible, andthus corporate image signals product quality in this category. As H1bis not accepted, channel performance does not affect directlyperceived quality. However, as H5a and H6b are accepted, we mayjudge that channel performance positively affects perceived qualityvia corporate image. After-sales service positively affects perceivedquality via corporate image, as well as positively affects it in a directmanner. In sum, as expected, corporate image plays a mediating rolein the process of developing brand equity. Channel performance,promotion, and after-sales service positively affect perceived valueby way of corporate image.
5.2.4. Relationships among brand equity dimensions and overall value ofbrand equity
The relationship between perceived quality and brand loyalty issignificant as expected (H8c). However, H8a and H8b are notaccepted. Brand awareness with associations has little impact onperceived quality and brand loyalty. Promotion and after-sales servicepositively affect perceived quality (H3b and H4b), and perceivedquality positively affects brand loyalty (H8c). Channel performance,promotion, and after-sales service positively affect corporate image(H5a, H5c, and H5d), in turn corporate image positvely affectsperceived quality (H6b), and then perceived quality positively affectsbrand loyalty (H8c). In sum, corporate image and perceived qualityare key intervening variables in the process by which marketing-mixefforts lead to brand loyalty.
The relationships of the overall value of brand equity with thethree dimensions of brand equity are all positive and significant (H7a,H7b, and H7c). Interestingly enough, brand awareness with associa-tions has strong impact on the overall value of brand equitywhile it isnot related to the other two brand equity dimensions—i.e., perceivedquality and brand loyalty. Perceived quality has significant positiveimpact on the overall value of brand equity in a direct manner. It alsopositively affects the overall value of brand equity indirectly viabrand loyalty.
5.2.5. Summary of key findingsThreefindings arenoteworthy. First, corporate image is found toplay
a pivotal role in the process of brand equity development. As describedabove, prior research reveals that corporate image contributes more tobrand equity in business markets than consumer markets. In theestimated model, channel performance, promotion, and after-salesservice impact perceived quality indirectly via corporate image. Second,in the industrial market of IT software, after-sales service is anintegrative part of the product. The estimated model shows after-sales

435J.-H. Kim, Y.J. Hyun / Industrial Marketing Management 40 (2011) 424–438
service has strong impact on perceived quality whereas it does notsignificantly affect brandawarenesswith associations andbrand loyalty.Third, brand awareness with associations strongly affects the overallvalue of brand equity while it does not relate to the other two brandequity dimensions of perceived quality and brand loyalty. On the otherhand, perceived quality positively relates to brand loyalty. The findingwould imply that brand awareness with associations is very distinctivefrom perceived quality and brand loyalty, and it contributes to theoverall value of brand equity in a very different manner as compared tothe other two dimensions.
6. Discussion
6.1. Theoretical and managerial implications
In industrial marketing, little prior research focuses on therelationships among the marketing-mix efforts, dimensions of brandequity, and market performance. The present study tests a model toexplain these relationships in the context of an IT software sector. Themodel considers three characteristics of industrial marketing. First, ittakes after-sales service as a key marketing-mix effort. Second, itplaces corporate image as an intervening variable frommarketing-mixefforts to the dimensions of brand equity. Third, it emphasizes theimportance of personal selling in promotion. Overall, the model isconfirmed to a significant degree with all the three characteristics ofindustrial marketing substantiated. Although the external validity ofthe tested model is limited because its context is confined to the ITsoftware sector, its findings help to extend our knowledge of howbrand equity relates tomarketing-mix efforts andmarket performancein business markets.
Among the marketing-mix efforts addressed in the model, channelperformance has the most impact (TE=0.393) on the overall value ofbrand equity, followed by promotion (TE=0.251), after-sales service(TE=0.136) and value-oriented price (TE=0.112). All the threedimensions of brand equity are found to significantly affect the overallvalue of brand equity. Interesting, though, perceived quality relates tobrand loyalty while brand awareness with associations does not relateto perceived quality and brand loyalty. This implies that brand loyaltyis not based on brand awareness with associations, and however,perceived quality has strong impact on brand loyalty. Given thatproduct complexity and importance is high in the IT software product,it is plausible that mere familiarity or brand recall does not lead tobrand loyalty.
Previous research reveals that corporate image influences howbuyers perceive the product (Bendixen et al., 2004; Mudambi et al.,1997; Schuiling & Moss, 2004; Webster & Keller, 2004), but has rarelyexamined in empirical settings the relationship of corporate imagewith marketing-mix efforts or the dimensions of brand equity. Thisresearch finds that corporate image mediates the effects of channelperformance, promotion, and after-sales service on perceived quality,which in turn affects the overall value of brand equity both in a directmanner and by way of brand loyalty. However, the direct effect ofcorporate image on brand loyalty is not significant in the research.Cretu and Brodie (2007) investigate the relationships among corpo-rate image, perceived quality, and brand loyalty. They find that thedirect effect of corporate image on brand loyalty is significant. Therelationship between corporate image and brand loyalty may differdepending on product characteristics. In Cretu and Brodie (2007),research context is the market of shampoo for hair salons while thecontext of this research is the market of IT software. Productcomplexity and involvement are high in the IT software product andthus the purchaser's brand judgment and choice decision is in arelatively seriousmanner. In this serious judgment anddecision, brandloyalty is based more on the intrinsic cue like product quality than theextrinsic cue like image. On the other hand, product complexity andinvolvement are low in the shampoo product. By the same token,
corporate image may be a basis for brand loyalty because brandjudgment and choice decision are made in a heuristic manner.
This researchproduces evidence for the effects of after-sales serviceon the dimensions of brand equity in the business market. Consumerbranding research tends to ignore the role of after-sales service in thebrand equity development process—e.g., Keller (2008). Extant re-search on industrial branding addresses such issues as concernedwiththe role of after-sales service, but it does not present little empiricalevidence for the role (Kuhn et al., 2008; McQuiston, 2004; Mudambiet al., 1997). Findings of this research show that after-sales service hasthe highest impact on perceived quality among the marketing-mixefforts while perceived quality has significant impact on the overallvalue of brand equity both in a direct manner and via brand loyalty.Also, the impact of after-sales service on corporate image is greaterthan promotion and the value-oriented price while corporate imagehas strong impact on perceived quality which eventually affects theoverall value of brand equity.
Personal selling is very important in business markets because arelatively small number of customers require that information betailored to particular needs depending on the customer's role in thepurchase decision process (Kotler & Pfoertsch, 2006). Thus, personalselling has been addressed as a meaningful antecedent of brand equityin previous research on industrial branding (Gordon et al., 1993; Kuhnet al., 2008; McQuiston, 2004; Webster & Keller, 2004). However,evidence for the relationship between personal selling and thedimensions of brand equity is sparse (e.g., van Riel et al. (2005)). Thisresearch finds that personal selling as a key component of promotionaffects the dimensions of brand equity, as well as corporate image.
Managerial implications of this research could be mainly in threeaspects. First, channel activities to increase purchase convenience areparticularly important to reinforce brand equity. Managers shouldbroaden distribution coverage, facilitate purchase process, and make adelivery in time so that they may develop brand equity in an efficientmanner. In contrast, the value-oriented price is confirmed to haverelatively less impact on the development of brand equity. It increasesbrand awareness with associations, but does not play a role to assureproduct quality and to make brand loyalty higher. Second, corporateimagehashigh impact onperceivedquality.Wemayguess that it plays arole to signal product quality. Thus, managers should better findinfluential drivers other than such marketing-mix efforts as addressedin this research. Third, brand awareness with associations has strongdirect impact on the overall value of brand equity. Then, any marketingactivities that level up brand familiarity or recall would reinforce theoverall value of brand equity, although they do not change perceivedquality or brand loyalty. Managers should find the way to efficientlyundertake such activities, so that they may increase the overall value ofbrand equity without paying much cost.
6.2. Limitations and future research
The model of this research has five major shortcomings. Futureresearch need to overcome these shortcomings so that its findingsmay have both internal and external validity to a much more degree.First, it does not consider some important characteristics of industrialmarketing. That is, the model does not include those variablesconcerned with the buyer–seller relationship (Cannon & Perreault,1999), the difference in buying behavior among market segments(Mudambi, 2002), the role difference among members of thedecision-making unit (DMU) (Webster & Keller, 2004) and so on.Future research can improve the model with such variables. Forexample, Hallen and Johanson (1985) find that more than ten personsengage in maintaining the relationships with buyers in businessmarkets. Gummesson (1991) states that marketing function is notconfined only to the marketing department in business markets andactors from various parts of the company performmarketing function.All this is not considered in the model of this research.
436 J.-H. Kim, Y.J. Hyun / Industrial Marketing Management 40 (2011) 424–438
Second, the model is tested in the context of a Korean IT softwaresector, and most of samples are confined to small companies with lessthan twenty employees. In this respect its external validity is limited.Findings would differ across contexts. As research in various contextsis accumulated in the future, we may have a model with moreexternal validity. Third, this research uses the overall value of brandequity as a proxy variable of market performance. It is found to relatepositively to market performance (Baldauf et al., 2003). However,future research should develop and use a variety of direct measures ofmarket performance, such as sales volume, market share, and profit.Fourth, in addition to the marketing-mix efforts addressed in thisstudy, there are a variety of meaningful antecedents of the brand
equity dimensions. For example, the web-enhanced brand commu-nity as a tool for relationship marketing can increase brand loyalty inbusiness markets (Andersen, 2005). The relationship with thesupplier's personnel and the ease of operation and maintenance canalso affect brand equity (Bendixen et al., 2004). Lastly, the model ofthis research is addressed in a static viewpoint. For example,corporate image is regarded as an enduring belief (Cretu & Brodie,2007). Current corporate image results from accumulating all theprevious efforts for building up the image. In addition, brand equitydrivers are likely to change over time (Parasuraman, 1997). All thisdynamic aspect of the brand equity building process is not consideredin the model.
Appendix
Appendix 1a. Reliability and validity test for marketing-mix efforts
Construct
Indicator Convergent validity Discriminant validity(AVENSMC)CR
AVE Construct1 Construct2 Correlation SMCChannel
CH1CH2CH30.830
0.620 1 2 0.590 0.348 3 0.677 0.458 4 0.778 0.605Price
PC1PC20.840
0.725 2 3 0.474 0.225 4 0.572 0.327Promotion
PM1PM2PM3PM4PM5PM60.899
0.599 3 4 0.696 0.484 1. Convergent validity: AVEN0.5,CRN0.72. Discriminant validity: AVENSMCBoth convergent validity and discriminant validity are secured
After-sales service
AS1AS2AS30.863
0.677CR: Construct Reliability.AVE: Average Variance Extracted.SMC: Squared Multiple Correlations.
Appendix 1b. Reliability and validity test for brand equity and corporate image
Construct
Indicator Convergent validity Discriminant validity (AVENSMC)CR
AVE Construct1 Construct2 Correlation SMCBrand awarenesswith associations
BAA1BAA2BAA3
0.830
0.621 1 2 0.569 0.324 3 0.499 0.249 4 0.722 0.521Perceived quality
PQ1PQ2PQ3PQ40.854
0.594 5 0.598 0.358 2 3 0.742 0.5514
0.745 0.555 5 0.890 0.792Brand loyalty
BL1BL2BL30.975
0.679 3 4 0.769 0.591 5 0.752 0.5664
5 0.756 0.571 Overall value of brand equity OBE1OBE2OBE3
0.873
0.696 1. Convergent validity: AVEN0.5, CRN0.72. Discriminant validity: AVENSMCConvergent validity is secured. Although SMC is higher than AVE forperceived quality and corporate image, the confidence interval (± twostandard errors) around the correlation estimate between the two factorsdoes not include 1.0.Corporate image
CI1CI2CI3CI4CI50.870
0.574a. See Appendix 2a, 2b.
Appendix 2a. Construct correlations among brand equity and corporate image
Construct
1 2 3 4 51. Brand awareness with associations
1 2. Perceived quality 0.569 (0.040)a 1 3. Brand loyalty 0.499 (0.046) 0.742 (0.051) 1 4. Brand equity 0.722 (0.052) 0.745 (0.050) 0.769 (0.060) 1 5. Corporate image 0.598 (0.042) 0.890 (0.049) 0.752 (0.053) 0.756 (0.052) 1aStandard errors in parentheses.

Appendix 2b. Construct correlations among marketing-mix efforts
Construct 1 2 3 4
1. Channel 12. Price 0.590 (0.052)a 13. Promotion 0.677 (0.051) 0.474 (0.064) 14. After-sales service 0.778 (0.048) 0.572 (0.061) 0.696 (0.062) 1
aStandard errors in parentheses.
437J.-H. Kim, Y.J. Hyun / Industrial Marketing Management 40 (2011) 424–438
References
Aaker, D. A. (1991). Managing brand equity. New York: The Free Press.Aaker, D. A. (1996). Building strong brands: Building, measuring, and managing brand
equity. New York: The Free Press.Aaker, D. A., & Jacobson, R. (1994). The financial information content of perceived
quality. Journal of Marketing Research, 31(2), 191−201.Abratt, R. (1986). Industrial buying in high-tech markets. Industrial Marketing
Management, 15(4), 293−298.Andersen, P. H. (2005). Relationship marketing and brand involvement of professionals
through web-enhanced brand communities: The case of Coloplast. IndustrialMarketing Management, 34(1), 285−297.
Anderson, J. C., & Gerbing, D. W. (1988). Structural equation modeling in practice: Areview and recommended two-step approach. Psychological Bulletin, 103(3),411−423.
Atilgan, E., Aksoy, S., & Akinci, S. (2005). Determinants of the brand equity: Averification approach in the beverage industry in Turkey.Marketing Intelligence andPlanning, 23(3), 237−248.
Bagozzi, R. P., Yi, Y., & Phillips, L. W. (1991). Assessing construct validity inorganizational research. Administrative Science Quarterly, 36(3), 421−458.
Baldauf, A., Cravens, K. S., & Binder, G. (2003). Performance consequences of brandequity management: Evidence from organizations in the value chain. Journal ofProduct & Brand Management, 12(4), 220−236.
Bendixen, M., Bukasa, K. A., & Abratt, R. (2004). Brand equity in the business-to-business market. Industrial Marketing Management, 33(5), 371−380.
Blomback, A., & Axelsson, B. (2007). The role of corporate brand image in the selectionof new subcontractors. Journal of Business & Industrial Marketing, 22(6), 418−430.
Blut, M., Evanschitzky, H., Vogel, V., & Ahlert, D. (2007). Switching barriers in the four-stage loyalty model. Advances in Consumer Research, 34, 726−734.
Borghini, S., & Cova, B. (2006). Living with brands in industrial contexts. 22nd IMPconference, Milan, Italy.
Cannon, J. P., & Perreault, W. D., Jr. (1999). Buyer–seller relationships in businessmarkets. Journal of Marketing Research, 36(4), 439−460.
Chaudhuri, A., & Holbrook, M. B. (2001). The chain of effects from brand trust and brandaffect to brand performance: The role of brand loyalty. Journal of Marketing, 65(2),81−93.
Chen, Z., & Dubinsky, A. J. (2003). A conceptual model of perceived customer value in e-commerce: A preliminary investigation. Psychology and Marketing, 20(4),323−347.
Cobb-Walgren, C. J. C., Ruble, C. A., & Donthu, N. (1995). Brand equity, brand preference,and purchase intent. Journal of Advertising, 24(3), 25−40.
Cretu, A. E., & Brodie, R. J. (2007). The influence of brand image and company reputationwhere manufacturers market to small firms: A customer value perspective.Industrial Marketing Management, 36(2), 230−240.
Davis, D. F., Golicic, S. L., & Marquartdt, A. J. (2008). Branding a B2B service: Does abrand differentiate a logistics service provider? Industrial Marketing Management,37(2), 218−227.
Dodds, W. B., Monroe, K. B., & Grewal, D. (1991). Effects of price, brand, and storeinformation on buyers' product evaluation. Journal of Marketing Research, 15(1),307−319.
Doney, P. M., & Cannon, J. P. (1997). An examination of the nature of trust in buyer–seller relationships. Journal of Marketing, 61(2), 35−51.
Dowling, G. R. (1986). Managing your corporate images. Industrial MarketingManagement, 15(2), 109−115.
Farris, P., Olver, J., & Kluyver, C. D. (1989). The relationship between distribution andmarket share. Marketing Science, 8(2), 107−128.
Gordon, G. L., Calantone, R. J., & di Benendetto, A. C. (1993). Brand equity in thebusiness-to-business sector: An exploratory study. Journal of Product and BrandManagement, 2(3), 4−16.
Gummesson, E. (1991). Marketing-orientation revisited: The crucial role of the part-time marketer. European Journal of Marketing, 25(2), 60−75.
Grewal, D., Krishnan, R., Baker, J., & Borin, N. A. (1998). The effect of store name, brandname and price discounts on consumers' evaluations and purchase intentions.Journal of Retailing, 74(3), 331−352.
Hallen, L., & Johanson, J. (1985). Industrial marketing strategies and different nationalenvironments. Journal of Business Research, 13(6), 495−509.
Han, S. L., & Sung, H. S. (2008). Industrial brand value and relationship performance inbusiness markets: A general structural equation model. Industrial MarketingManagement, 37(7), 807−818.
Henderson, B. S. (1971). The right marketing mix for the corporate imagery mix: Role ofvarious publics and marketing basics. Business Horizons, 14(1), 87−94.
Herbig, P., & Milewicz, J. (1995). The relationship of reputation and credibility to brandsuccess. Journal of Consumer Marketing, 12(4), 5−10.
Hutton, J. (1997). A study of brand equity in an organizational context. Journal ofProduct and Brand Management, 6(6), 428−439.
Jensen, M. B., & Klastrup, K. (2008). Towards a B2B customer-based brand equity model.Journal of Targeting, Measurement and Analysis for Marketing, 16(2), 122−128.
Keller, K. L. (1993). Conceptualizing, measuring and managing customer-based brandequity. Journal of Marketing, 57(1), 1−22.
Keller, K. L. (2008). Strategic brand management: building, measuring, and managingbrand equity, 3rd ed. New Jersey: Pearson Education International.
Kotler, P., & Pfoertsch, W. (2006). B2B brand management. Berlin Heidelberg: Springer.Kotler, P., & Pfoertsch, W. (2007). Being known or being one of many: The need for
brand management for business-to-business companies. Journal of Business andIndustrial Marketing, 22(6), 357−362.
Krishnan, H. S. (1996). Characteristics of memory associations: A customer-basedbrand equity perspective. International Journal of Research in Marketing, 13(4),389−405.
Kuhn,K.L.,Alpert,F.,&Pope,N.K.L.(2008).AnapplicationofKeller'sbrandequitymodelinaB2Bcontext.QualitativeMarketResearch:AnInternationalJournal,11(1),40−58.
Lavidge, R. J., & Steiner, G. A. (1961). A model for predictive measurements ofadvertising effectiveness. Journal of Marketing, 24(6), 59−62.
Lynch, J., & Chernatony, L. D. (2004). The power of emotion: Brand communication inbusiness-to-business markets. Journal of Brand Management, 11(5), 403−419.
Martinez, E., & Pina, J. M. (2005). Influence of corporate image on brand extensions: Amodel applied to the service sector. Journal of Marketing Communication, 11(4),263−281.
McQuiston, D. H. (2004). Successful branding of a commodity product: The case ofRAEX LASER steel. Industrial Marketing Management, 33(4), 345−354.
Michell, P., King, J., & Reast, J. (2001). Brand values related to industrial products.Industrial Marketing Management, 30(5), 415−425.
Mudambi, S. (2002). Branding importance in business-to-business markets: Threebuyer clusters. Industrial Marketing Management, 31(6), 525−533.
Mudambi, S., Doyle, P., & Wong, V. (1997). An exploration of branding in industrialmarkets. Industrial Marketing Management, 26(5), 433−446.
Netemeyer, R. G., Krishnan, B., Pullig, C., Wang, G., Yagci, M., Dean, D., Ricks, J., & Wirth,F. (2004). Developing and validating measures of facets of customer-based brandequity. Journal of Business Research, 57(2), 209−224.
Nunnally, J. C. (1978). Psychometric theory, 2nd ed. New York: McGraw-Hill.Ojasalo, J., Natti, S., & Olkkonen, R. (2008). Brand building in software SMEs: An
empirical study. Journal of Product and Brand Management, 17(2), 92−107.Oliver, R. L. (1999). Whence consumer loyalty? Journal of Marketing, 63, 33−44.Parasuraman, A. (1997). Reflections on gaining competitive advantage through
customer value. Journal of the Academy of Marketing Science, 25(2), 154−161.Rao, A. R., & Monroe, K. B. (1989). The effect of price, brand name, and store name on
buyers' perception of product quality: An integrated review. Journal of MarketingResearch, 26(3), 351−357.
Roberts, J., & Merrilees, B. (2007). Multiple roles of brands in business-to-businessservices. Journal of Business and Industrial Marketing, 22(6), 410−417.
Saunders, J. A., &Watt, F. A.W. (1979). Do brand names differentiate identical industrialproducts? Industrial Marketing Management, 8(2), 114−123.
Schuiling, I., & Moss, G. (2004). How different are branding strategies in thepharmaceutical industry and the fast-moving consumer goods sector? Journal ofBrand Management, 11(5), 366−380.
Sharma, A., Krishnan, R., & Grewal, D. (2001). Value creation in markets: A critical areaof focus for business to business markets. Industrial Marketing Management, 30(4),391−402.
Shipley, D., & Howard, P. (1993). Brand-naming industrial products. IndustrialMarketing Management, 22(1), 59−66.
Simon, C. J., & Sullivan, M. W. (1993). The measurement and determinants of brandequity: A financial approach. Marketing Science, 12(1), 28−52.
Sinclair, S. A., & Seward, K. E. (1988). Effectiveness of branding a commodity product.Industrial Marketing Management, 17(1), 23−33.
Srivastava, N. V., & Mookerjee, A. (2004). Determinants of brand equity for bankingbusiness application software products. International Journal of TechnologyManagement, 28(1), 128−138.
Taylor, S. A., Hunter, G. L., & Lindberg, D. L. (2007). Understanding (customer-based)brand equity in financial services. Journal of Services Marketing, 21(4), 241−252.
van Riel, A. C. R., Pahud deMortanges, C., & Streukens, S. (2005). Marketing antecedentsof industrial brand equity: An empirical investigation in specialty chemicals.Industrial Marketing Management, 34(8), 841−847.
Villarejo-Ramos, A. F., & Sanchez-Franco, M. J. (2005). Impact of marketingcommunication and price promotion on brand equity. Journal of Brand Manage-ment, 12(6), 431−444.
Wartick, S. L. (2002). Measuring corporate reputation: Definition and data. Business andSociety, 41(4), 393−414.

438 J.-H. Kim, Y.J. Hyun / Industrial Marketing Management 40 (2011) 424–438
Webster, F. E., Jr, & Keller, K. L. (2004). A roadmap for branding in industrial markets.Journal of Brand Management, 11(5), 388−402.
Whetten, D. A., &Mackay, A. (2002). A social actor conception of organizational identityand its implications for the study of organizational reputation. Business and Society,41(4), 393−414.
Yoo, B., & Donthu, N. (2001). Developing and validating a multidimensional consumer-based brand equity scale. Journal of Business Research, 52(1), 1−14.
Yoo, B., & Donthu, N. (2002). Testing cross-cultural invariance of the brand equitycreation process. Journal of Product and Brand Management, 11(6), 380−398.
Yoo, B., Donthu, N., & Lee, S. (2000). An examination of selected marketing mixelements and brand equity. Journal of the Academy of Marketing Science, 28(2),195−212.
Yoon, E., Guffey, H. J., & Kijewski, V. (1993). The effects of information and companyreputation on intentions to buy a business service. Journal of Business Research, 27(3), 215−228.
Ji-Hern Kim is a doctoral candidate in the Graduate School of Management, KoreaAdvanced Institute of Science and Technology (KAIST). He was a researcher at KoreaTelecom (KT) Marketing Institute where he worked for developing the KT brandstrategy. His current research interests include the analysis of brand asset structuresand the effect of self-congruity on brand evaluation.
Yong J. Hyun is a professor of marketing in the Graduate School of Management,KAIST. He received a Ph.D. degree in business administration from the University ofWisconsin-Madison. His research focuses mainly on promotion effects and brandequity, channel structure, and issues of fair trade in marketing. His papers appear inMarketing Science, the Journal of Consumer Research, the Journal of InternationalBusiness Studies, and so on.