Embed Size (px)
Citation preview
Aha
H
aub
o
o©
GEOPHYSICS, VOL. 72, NO. 4 �JULY-AUGUST 2007�; P. I45–I50, 9 FIGS., 1 TABLE.10.1190/1.2719497
model study for estimating optimum upward-continuationeight for gravity separation with application to a Bouguer gravitynomaly over a mineral deposit, Jilin province, northeast China
ualin Zeng1, Deshu Xu2, and Handong Tan1
ac�
�WTsFcsdap
hgcpacttt
maad
a
ved Jancesses
cesseson, Min
ABSTRACT
Upward continuation can be used to separate a regionalgravity anomaly resulting from deep sources from the ob-served gravity. We present a practical method, based on mod-el studies, to derive an optimum upward continuation heightfor regional-residual gravity separation. Using this methodwe can calculate an optimal height for upward continuation.Although mathematically there is no optimum height, thismethod provides an objective procedure to calculate a bestheight for upward continuation. We initially use a 2D modelto calculate an optimum separation height, as given by themaximum crosscorrelation between the upward continuationof the observed gravity and a known regional anomaly. For anunknown regional field, we calculate a series of crosscorrela-tions between the upward continuations at two successiveheights. The average height of the maximum deflection ofthese crosscorrelation values yields the optimum height forregional-residual separation. The method was applied to theBouguer gravity anomaly over a mineral deposit in the Jilinprovince in northeast China. When we subtract the estimatedregional anomaly obtained in this manner from the Bougueranomaly, we can obtain a residual anomaly that clearly showsthe location of two known iron bodies.
INTRODUCTION
Upward continuation is a method to separate a regional gravitynomaly resulting from deep sources from the observed gravity. Thepward continuation operator �Jacobsen, 1987� is a numerically sta-le operation, and it forms a natural link between ground surveys and
Manuscript received by the Editor June 13, 2006; revised manuscript recei1China University of Geosciences, State Key Laboratory of Geological Pro
gy, Beijing, China. E-mail: [email protected], [email protected] University of Geosciences, State Key Laboratory of Geological Pro
gy, Beijing, China; and Institute of Geophysical and Geochemical Explorati2007 Society of Exploration Geophysicists.All rights reserved.
I45
Downloaded 03 Dec 2010 to 202.204.109.189. Redistribution subject to
irborne surveys. There are two key problems with the method: �1�onventional upward continuation overattenuates the regional, and2� the height must be known.
First, let us consider the overattenuation problem. Pawlowski1995� proposes a preferential continuation operator based on
iener filtering and the Green’s theorem equivalent layer principle.he preferential continuation operator possesses a continuation re-ponse that acts upon a specific band of the observed potential field’sourier amplitude spectrum. It is possible to use preferential upwardontinuation to attenuate short-wavelength anomalies from shallowources while minimally attenuating long-wavelength signals fromeep sources. Application of the preferential continuation to gravitynomalies in China has been effective in solving the overattenuationroblem �Xu and Zeng, 2000; Zeng and Xu, 2001�.
Second, let us consider the requirement that upward continuationeight be known first. Gupta and Ramani �1980� point out that theravity separation filter design is dictated, in the case of the upwardontinuation technique, by the choice of continuation height. Theroblem is choosing a proper �optimum� height for upward continu-tion. Many people make this choice by inspection. Or they mighthoose a height by comparing gravity anomalies upward continuedo different heights. However, these two approaches lack an objec-ive criterion to give a proper �optimum� height for the upward con-inuation.
We propose a method based on model studies to estimate an opti-al height for upward continuation to separate regional and residual
nomalies. Using the method, we show a successful application onn anomaly over a mineral deposit in northeast China. Finally, weiscuss the conditions for applying the method.
METHOD
For separating regional gravity anomalies from residual ones, wessume that a regional anomaly is caused by sources that �1� have
uary 16, 2007; published online May 9, 2007.and Mineral Resources, and School of Geophysics and Information Technol-
and Mineral Resources, and School of Geophysics and Information Technol-istry of Land and Resources, Hebei, China. E-mail: xu�[email protected].
SEG license or copyright; see Terms of Use at http://segdl.org/
wtrzdht
M
aigdbABa�
FsTtca
C
a�
w
tumtHat
mdtatcbhaa
amche
Fa==bd
I46 Zeng et al.
ide horizontal extent, �2� are deep in terms of the depth to the top ofhe sources, and �3� have similar depth. Likewise, we assume that aesidual anomaly is produced by sources that �1� are limited in hori-ontal extent, �2� are shallow, and �3� have depths different from theeep anomalies but similar to one another. The method proposedere is based on these assumptions; it does not work for sources athree or more depths.
A3
A1 A2
B4
B1 B2 B3
B5
x (100 m)0 50 100 150 200
x (100 m)0 50 100 150 200
x (100 m)0 50 100 150 200
x (100 m)0 50 100 150 200
y (1
00 m
)
150
100
50
a)
y (1
00 m
)
150
100
50
b)
c)
d)
Gra
vity
ano
mal
y (m
Gal
)
1
1
2 2
2
22 2
44
4
4
4
4
668
0
0
P P´
P P´
P P´
10
5
0
0–10
–20
–30–40
–5
12
3
A1
B1 B2 B3
A2
h (1
00 m
)
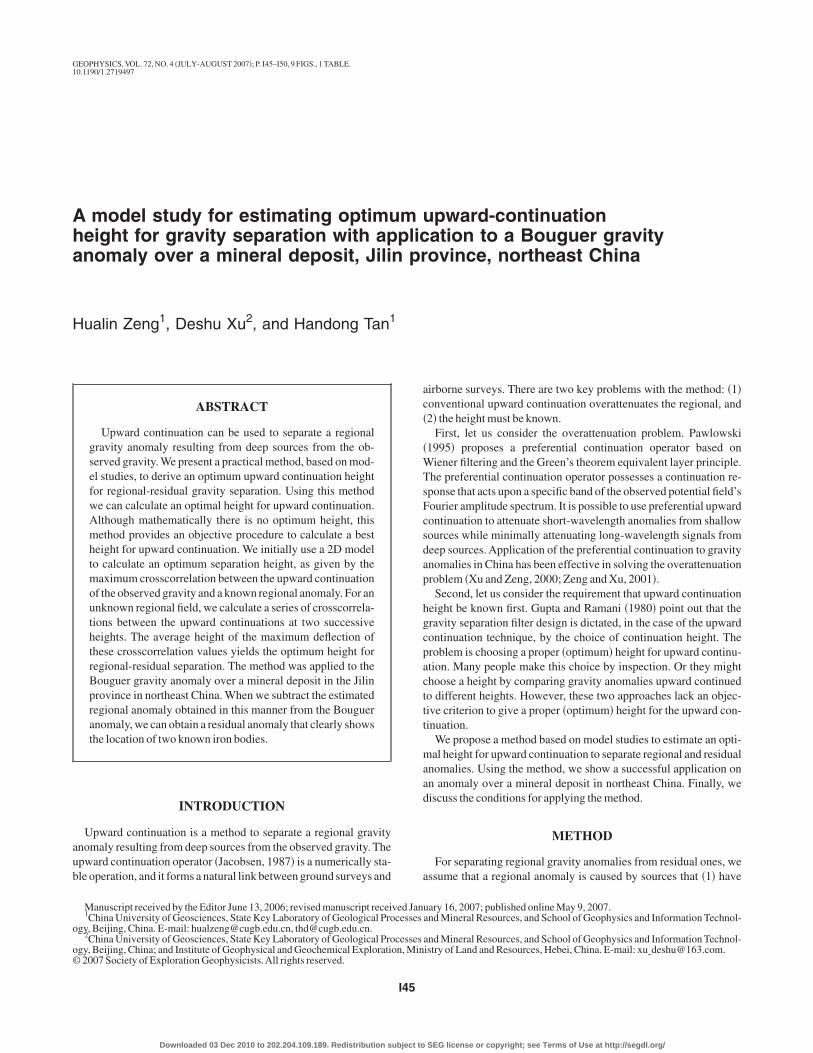
igure 1. �a� Location of prisms producing the synthetic gravitynomaly. �b� The synthetic gravity anomaly, contour interval �CI�1 mGal. �c� Gravity profile PP� along the east-west line of �a�; 1synthetic gravity anomaly, 2 = regional anomaly resulting from
odies A, 3 = local anomaly resulting from bodies B. �d� Verticalistributions of prisms along the profile.
Downloaded 03 Dec 2010 to 202.204.109.189. Redistribution subject to
odel
We created gravity maps �see Figure 1b� using rectangular prismst two different depths, A and B �Figure 1a and d�. The regional grav-ty anomaly �greg is assumed to be produced by the prisms at thereater depth �A�. The residual anomaly �gres is assumed to be pro-uced by bodies at a shallower depth �B� �Figure 1d�. Table 1 lists theodies’ depth to top, dimensions, width, and thickness. Bodies A1,2, and A3 are the deep sources that produce the regional anomaly.odies B1, B2, B3, B4, and B5 are shallow and produce the residualnomaly. The upper part of Figure 1c shows three values: the totalcurve 1�, regional �curve 2�, and residual �curve 3�.
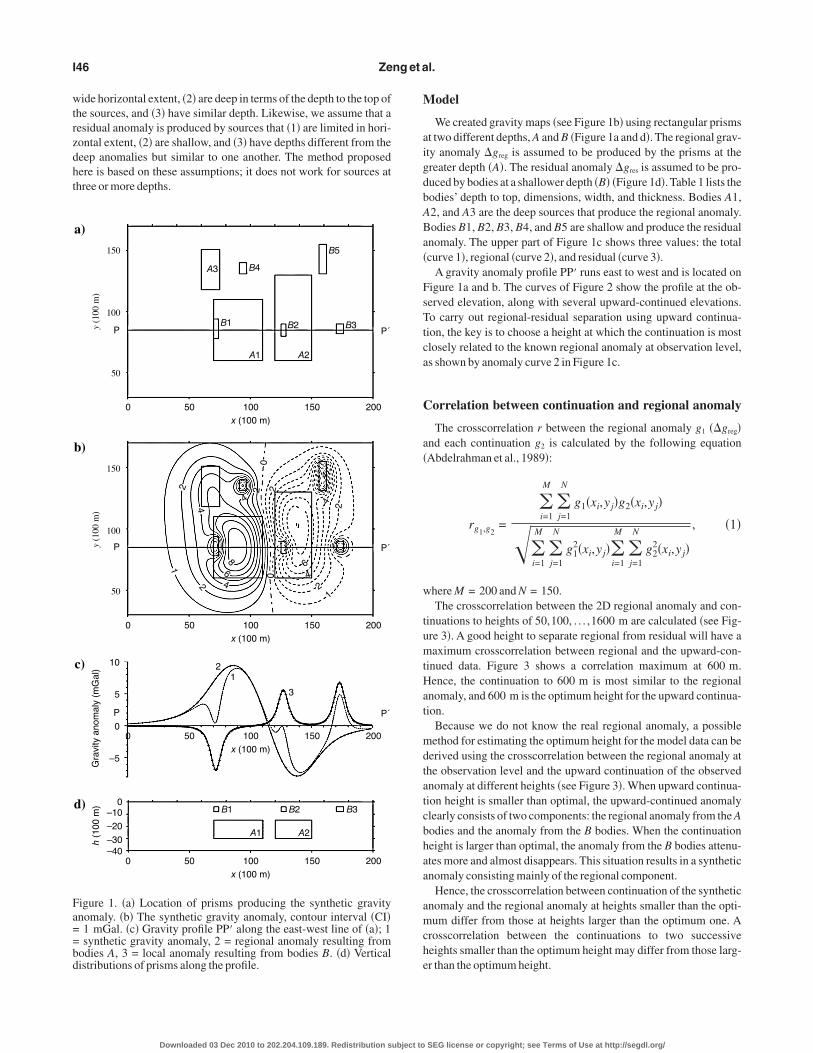
A gravity anomaly profile PP� runs east to west and is located onigure 1a and b. The curves of Figure 2 show the profile at the ob-erved elevation, along with several upward-continued elevations.o carry out regional-residual separation using upward continua-
ion, the key is to choose a height at which the continuation is mostlosely related to the known regional anomaly at observation level,s shown by anomaly curve 2 in Figure 1c.
orrelation between continuation and regional anomaly
The crosscorrelation r between the regional anomaly g1 ��greg�nd each continuation g2 is calculated by the following equationAbdelrahman et al., 1989�:
rg1,g2=
�i=1
M
�j=1
N
g1�xi,yj�g2�xi,yj�
��i=1
M
�j=1
N
g12�xi,yj��
i=1
M
�j=1
N
g22�xi,yj�
, �1�
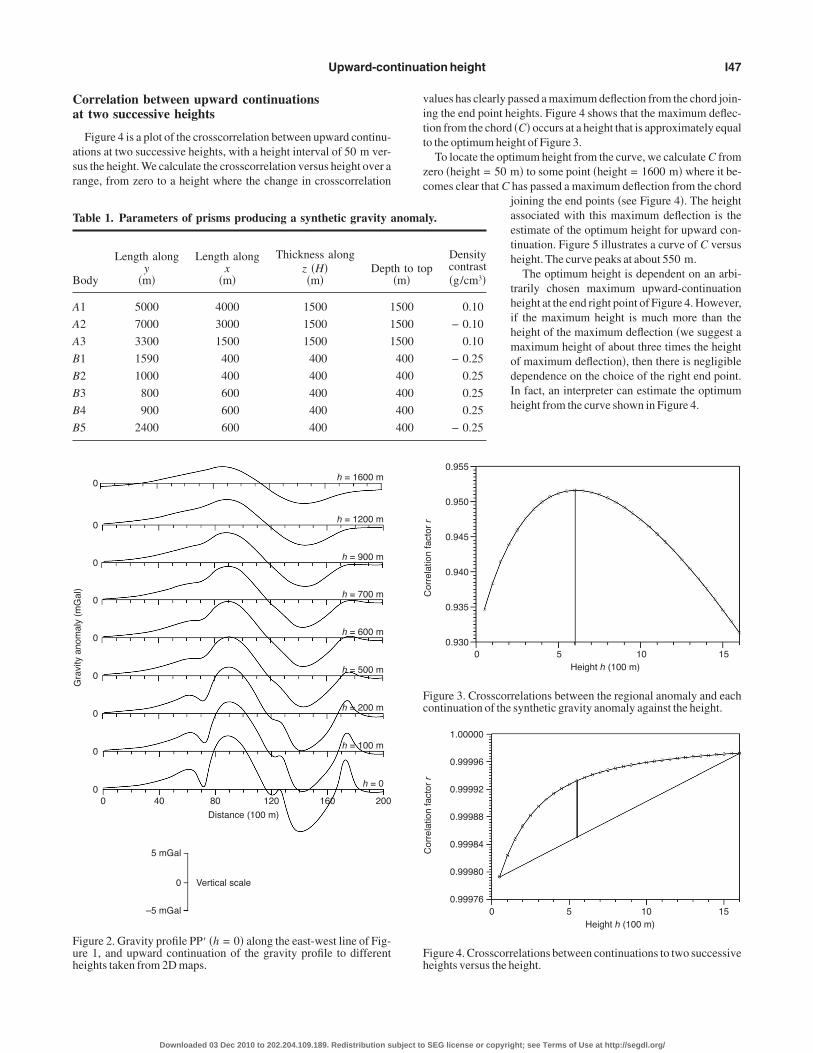
here M = 200 and N = 150.The crosscorrelation between the 2D regional anomaly and con-
inuations to heights of 50,100, . . . ,1600 m are calculated �see Fig-re 3�. A good height to separate regional from residual will have aaximum crosscorrelation between regional and the upward-con-
inued data. Figure 3 shows a correlation maximum at 600 m.ence, the continuation to 600 m is most similar to the regional
nomaly, and 600 m is the optimum height for the upward continua-ion.
Because we do not know the real regional anomaly, a possibleethod for estimating the optimum height for the model data can be
erived using the crosscorrelation between the regional anomaly athe observation level and the upward continuation of the observednomaly at different heights �see Figure 3�. When upward continua-ion height is smaller than optimal, the upward-continued anomalylearly consists of two components: the regional anomaly from the Aodies and the anomaly from the B bodies. When the continuationeight is larger than optimal, the anomaly from the B bodies attenu-tes more and almost disappears. This situation results in a syntheticnomaly consisting mainly of the regional component.
Hence, the crosscorrelation between continuation of the syntheticnomaly and the regional anomaly at heights smaller than the opti-um differ from those at heights larger than the optimum one. A
rosscorrelation between the continuations to two successiveeights smaller than the optimum height may differ from those larg-r than the optimum height.
SEG license or copyright; see Terms of Use at http://segdl.org/
Ca
asr
vitt
zc
T
B
A
A
A
B
B
B
B
B
Fuh
Fc
Fh
Upward-continuation height I47
orrelation between upward continuationst two successive heights
Figure 4 is a plot of the crosscorrelation between upward continu-tions at two successive heights, with a height interval of 50 m ver-us the height. We calculate the crosscorrelation versus height over aange, from zero to a height where the change in crosscorrelation
able 1. Parameters of prisms producing a synthetic gravity a
ody
Length alongy
�m�
Length alongx
�m�
Thickness alongz �H��m�
Dept
1 5000 4000 1500 1
2 7000 3000 1500 1
3 3300 1500 1500 1
1 1590 400 400
2 1000 400 400
3 800 600 400
4 900 600 400
5 2400 600 400
20016012080
Distance (100 m)
400
Gra
vity
ano
mal
y (m
Gal
)
0
0
0
0
0
0
0
0
0
h = 0
h = 100 m
h = 200 m
h = 500 m
h = 600 m
h = 700 m
h = 900 m
h = 1200 m
h = 1600 m
5 mGal
0 Vertical scale
–5 mGal
igure 2. Gravity profile PP� �h = 0� along the east-west line of Fig-re 1, and upward continuation of the gravity profile to differenteights taken from 2D maps.
Downloaded 03 Dec 2010 to 202.204.109.189. Redistribution subject to
alues has clearly passed a maximum deflection from the chord join-ng the end point heights. Figure 4 shows that the maximum deflec-ion from the chord �C� occurs at a height that is approximately equalo the optimum height of Figure 3.
To locate the optimum height from the curve, we calculate C fromero �height = 50 m� to some point �height = 1600 m� where it be-omes clear that C has passed a maximum deflection from the chord
joining the end points �see Figure 4�. The heightassociated with this maximum deflection is theestimate of the optimum height for upward con-tinuation. Figure 5 illustrates a curve of C versusheight. The curve peaks at about 550 m.
The optimum height is dependent on an arbi-trarily chosen maximum upward-continuationheight at the end right point of Figure 4. However,if the maximum height is much more than theheight of the maximum deflection �we suggest amaximum height of about three times the heightof maximum deflection�, then there is negligibledependence on the choice of the right end point.In fact, an interpreter can estimate the optimumheight from the curve shown in Figure 4.
ly.
pDensitycontrast�g/cm3�
0.10
− 0.10
0.10
− 0.25
0.25
0.25
0.25
− 0.25
0.955
0.950
0.945
0.940
0.935
0.9300 5 10 15
Cor
rela
tion
fact
or r
Height (100 m)h
igure 3. Crosscorrelations between the regional anomaly and eachontinuation of the synthetic gravity anomaly against the height.
1.00000
0.99996
0.99992
0.99988
0.99984
0.99980
0.999760 5 10 15
Cor
rela
tion
fact
or r
Height (100 m)h
igure 4. Crosscorrelations between continuations to two successiveeights versus the height.
noma
h to to�m�
500
500
500
400
400
400
400
400
SEG license or copyright; see Terms of Use at http://segdl.org/
D�
�
c6to
bdb
sa
5u0
Fc4
Fb=td
Ft
I48 Zeng et al.
FIELD EXAMPLE
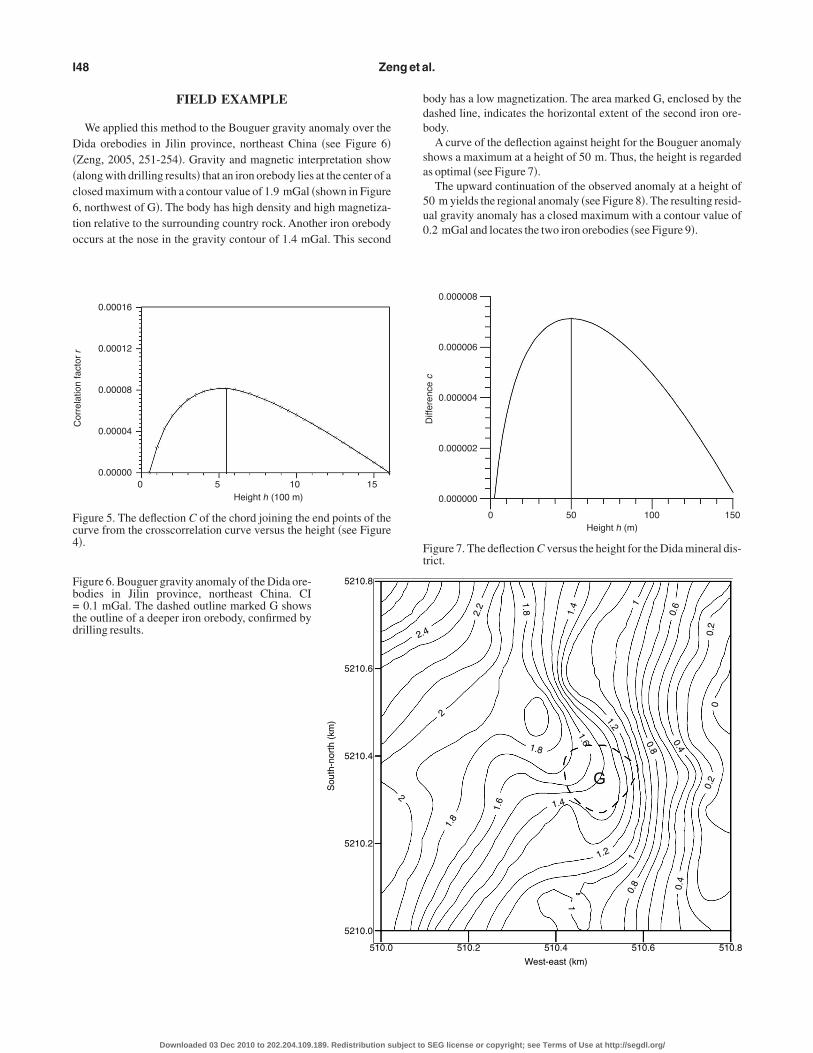
We applied this method to the Bouguer gravity anomaly over theida orebodies in Jilin province, northeast China �see Figure 6�
Zeng, 2005, 251-254�. Gravity and magnetic interpretation showalong with drilling results� that an iron orebody lies at the center of alosed maximum with a contour value of 1.9 mGal �shown in Figure, northwest of G�. The body has high density and high magnetiza-ion relative to the surrounding country rock. Another iron orebodyccurs at the nose in the gravity contour of 1.4 mGal. This second
0.00016
0.00012
0.00008
0.00004
0.000000 5 10 15
Cor
rela
tion
fact
or r
Height (100 m)h
igure 5. The deflection C of the chord joining the end points of theurve from the crosscorrelation curve versus the height �see Figure�.
Sou
th-n
orth
(km
)
510.0
5210.0
5210.2
5210.4
5210.6
5210.8igure 6. Bouguer gravity anomaly of the Dida ore-odies in Jilin province, northeast China. CI0.1 mGal. The dashed outline marked G shows
he outline of a deeper iron orebody, confirmed byrilling results.
Downloaded 03 Dec 2010 to 202.204.109.189. Redistribution subject to
ody has a low magnetization. The area marked G, enclosed by theashed line, indicates the horizontal extent of the second iron ore-ody.
A curve of the deflection against height for the Bouguer anomalyhows a maximum at a height of 50 m. Thus, the height is regardeds optimal �see Figure 7�.
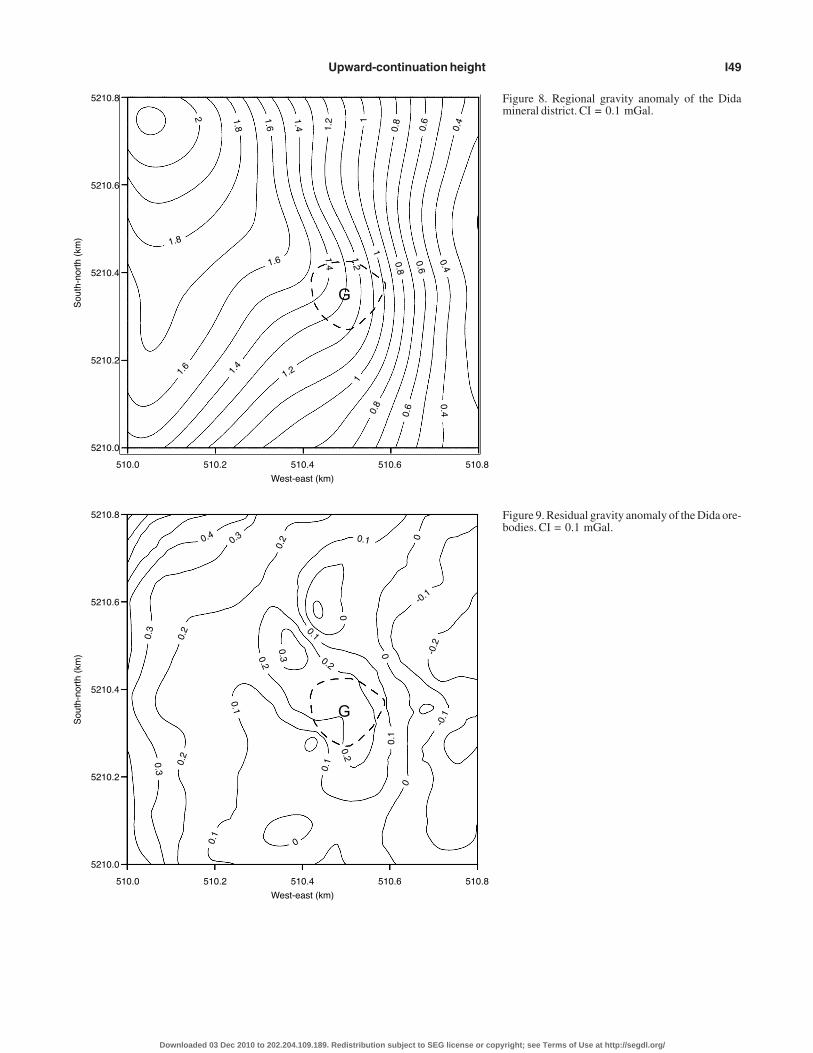
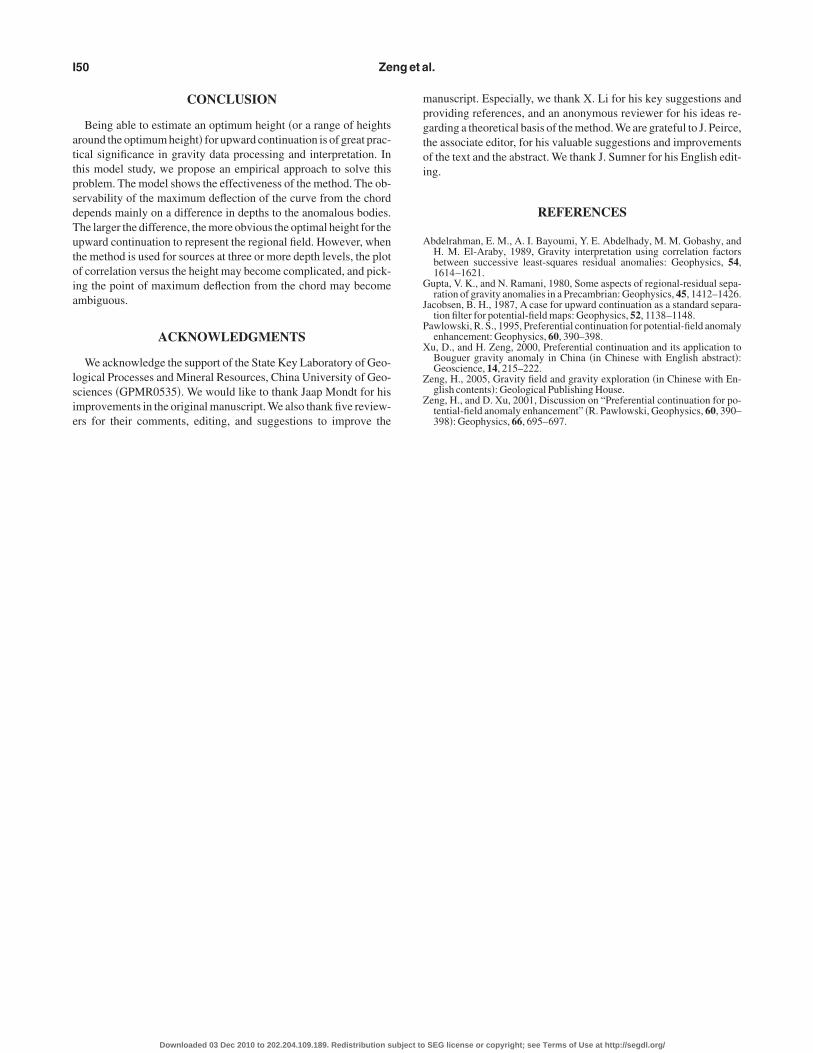
The upward continuation of the observed anomaly at a height of0 m yields the regional anomaly �see Figure 8�. The resulting resid-al gravity anomaly has a closed maximum with a contour value of.2 mGal and locates the two iron orebodies �see Figure 9�.
510.2 510.4 510.6 510.8
West-east (km)
G
4
2.2
2
1.8 1.4
1.8
1.6
1.6 1.4
11
1
0.6
0.2
00.
2
0.4
0.4
0.8
0.8
1.2
1.2
1.8
0.000008
0.000006
0.000004
0.000002
0.000000
Diff
eren
ce
c
Height (m)h0 50 100 150
igure 7. The deflection C versus the height for the Dida mineral dis-rict.
2.
2
SEG license or copyright; see Terms of Use at http://segdl.org/
Upward-continuation height I49
South
-nor
th (
km)
510.0 510.2 510.4 510.6 510.8
West-east (km)
5210.0
5210.2
5210.4
5210.6
5210.8
2 1.8
1.8
1.6
1.6
1.6
1.4
1.4
1.4
1.2
1.2
1.21
1
1
0.8
0.8
0.80.
6
0.6
0.6
0.4
0.40.4
G
Figure 8. Regional gravity anomaly of the Didamineral district. CI = 0.1 mGal.
Sou
th-n
orth
(km
)
510.0 510.2 510.4 510.6 510.8
West-east (km)
5210.0
5210.2
5210.4
5210.6
5210.8
0.4 0.30.3
0.3
0.3
0.2
0.2
0.2
0.2
0.2
0.2
0.1
0.1
0.1
0.1
0.1
0.1
-0.1
-0.1
0
0
0
0
0
-0.2
G
Figure 9. Residual gravity anomaly of the Dida ore-bodies. CI = 0.1 mGal.
Downloaded 03 Dec 2010 to 202.204.109.189. Redistribution subject to SEG license or copyright; see Terms of Use at http://segdl.org/
attpsdTutoia
lsie
mpgtoi
A
G
J
P
X
Z
Z
I50 Zeng et al.
CONCLUSION
Being able to estimate an optimum height �or a range of heightsround the optimum height� for upward continuation is of great prac-ical significance in gravity data processing and interpretation. Inhis model study, we propose an empirical approach to solve thisroblem. The model shows the effectiveness of the method. The ob-ervability of the maximum deflection of the curve from the chordepends mainly on a difference in depths to the anomalous bodies.he larger the difference, the more obvious the optimal height for thepward continuation to represent the regional field. However, whenhe method is used for sources at three or more depth levels, the plotf correlation versus the height may become complicated, and pick-ng the point of maximum deflection from the chord may becomembiguous.
ACKNOWLEDGMENTS
We acknowledge the support of the State Key Laboratory of Geo-ogical Processes and Mineral Resources, China University of Geo-ciences �GPMR0535�. We would like to thank Jaap Mondt for hismprovements in the original manuscript. We also thank five review-rs for their comments, editing, and suggestions to improve the
Downloaded 03 Dec 2010 to 202.204.109.189. Redistribution subject to
anuscript. Especially, we thank X. Li for his key suggestions androviding references, and an anonymous reviewer for his ideas re-arding a theoretical basis of the method. We are grateful to J. Peirce,he associate editor, for his valuable suggestions and improvementsf the text and the abstract. We thank J. Sumner for his English edit-ng.
REFERENCES
bdelrahman, E. M., A. I. Bayoumi, Y. E. Abdelhady, M. M. Gobashy, andH. M. El-Araby, 1989, Gravity interpretation using correlation factorsbetween successive least-squares residual anomalies: Geophysics, 54,1614–1621.
upta, V. K., and N. Ramani, 1980, Some aspects of regional-residual sepa-ration of gravity anomalies in a Precambrian: Geophysics, 45, 1412–1426.
acobsen, B. H., 1987, A case for upward continuation as a standard separa-tion filter for potential-field maps: Geophysics, 52, 1138–1148.
awlowski, R. S., 1995, Preferential continuation for potential-field anomalyenhancement: Geophysics, 60, 390–398.
u, D., and H. Zeng, 2000, Preferential continuation and its application toBouguer gravity anomaly in China �in Chinese with English abstract�:Geoscience, 14, 215–222.
eng, H., 2005, Gravity field and gravity exploration �in Chinese with En-glish contents�: Geological Publishing House.
eng, H., and D. Xu, 2001, Discussion on “Preferential continuation for po-tential-field anomaly enhancement” �R. Pawlowski, Geophysics, 60, 390–398�: Geophysics, 66, 695–697.
SEG license or copyright; see Terms of Use at http://segdl.org/