Embed Size (px)
Citation preview
Available online at www.sciencedirect.com
www.elsevier.com/locate/actamat
Acta Materialia 57 (2009) 739–748
A model of ultrafine microstructure evolution in materials deformedby high-pressure torsion
Jan Kratochvıl a, Martin Kruzık b,a, Radan Sedlacek c,*
a Czech Technical University, Faculty of Civil Engineering, Department of Physics, Thakurova 7, 166 29 Prague, Czech Republicb Academy of Sciences of Czech Republic, Institute of Information Theory and Automation, Pod vodarenskou vezı 4, 182 08 Prague, Czech Republic
c Technische Universitat Munchen, Fakultat fur Maschinenwesen Lehrstuhl fur Werkstoffkunde und Werkstoffmechanik, Boltzmannstr. 15,
85747 Garching, Germany
Received 23 April 2008; received in revised form 21 August 2008; accepted 11 October 2008Available online 18 November 2008
Abstract
The proposed crystal plasticity model outlines a possible mechanism of a material response under severe plastic deformation asobserved in high-pressure torsion experiments. A simplified version of the model based on an assumption of uniform deformation ofplane-strain double slip reveals rotations of slip systems caused by the imposed shear strain. An axial compression and a shear stressof twist govern this process. The accompanied continuous reconstruction of the deformation substructure is probably one of the mainreasons for the observed strengthening. Local variations in the crystal lattice orientation are responsible for the microstructurefragmentation.� 2008 Acta Materialia Inc. Published by Elsevier Ltd. All rights reserved.
Keywords: High pressure torsion; Nanocrystalline materials; Ultrafine grained microstructure; Dislocation boundaries; Micromechanical modeling
1. Introduction
It has been well documented that severe plastic deforma-tion produces ultrafine grained materials with extraordi-nary mechanical properties [1]. Very high strength andrelatively good ductility are attributed to their fine micro-structure. The simplest method to achieve severe plasticdeformation is high-pressure torsion (HPT). This methodallows the application of very high strains without inter-ruption. The strain can be defined approximately as simpleshear, c = rh/h, where h is the twist angle, h is the height ofthe cylindrical specimen and r is the distance from the tor-sion axis. Due to the dependence of c on r, one can look atthe material after a specific amount of strain in one speci-men. Due to the relatively small size and structural inho-mogeneity of the specimens, HPT is not very convenientas a practical technological tool. However, because of the
1359-6454/$34.00 � 2008 Acta Materialia Inc. Published by Elsevier Ltd. All
doi:10.1016/j.actamat.2008.10.016
* Corresponding author.E-mail address: [email protected] (R. Sedlacek).
relative simplicity of its loading conditions, the HPTmethod is suitable for experimental and theoretical studiesof the microstructure evolution during severe plasticdeformation.
Systematic parameter studies of the microstructure evo-lution with increasing strain in copper, nickel and Armcoiron deformed by conventional and cyclic HPT have beenreported in [2,3]. The experiments were directed towardsexploring the basic questions: how do the original grainsfragment into much smaller structural elements? Does sat-uration exist in the structural refinement? How do temper-ature, pressure and cycling affect these phenomena? Theanswers to these questions provide a base for the theoreti-cal analysis and modeling of the fragmentation process.
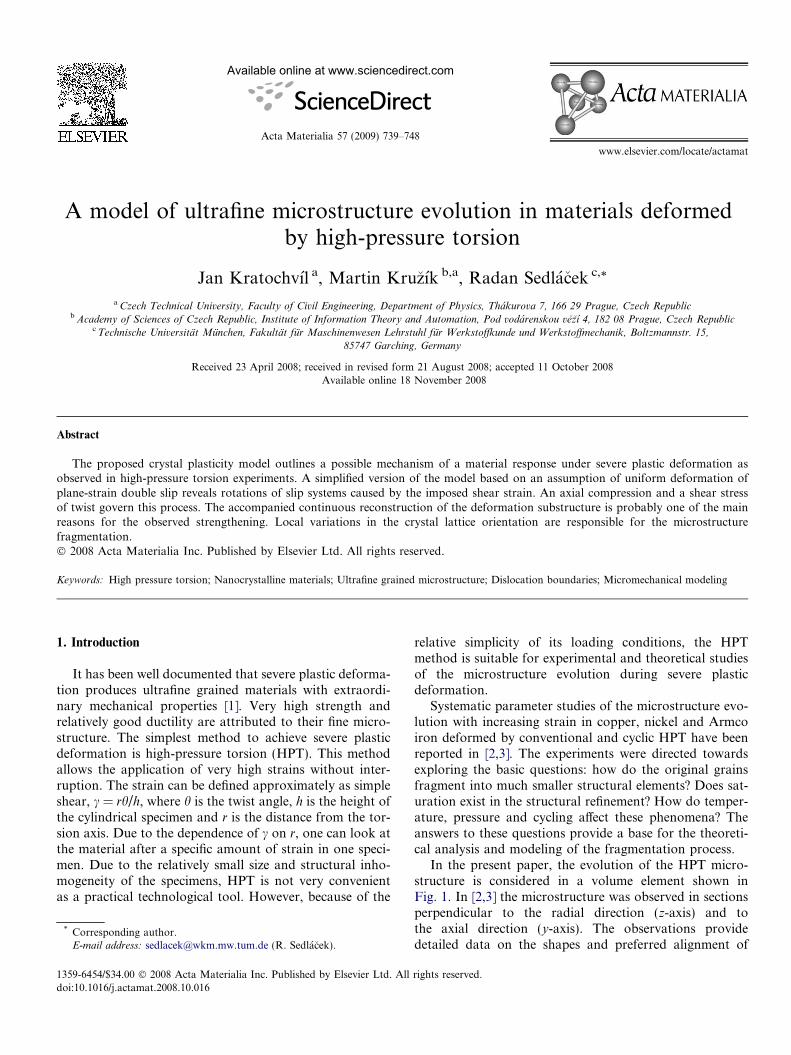
In the present paper, the evolution of the HPT micro-structure is considered in a volume element shown inFig. 1. In [2,3] the microstructure was observed in sectionsperpendicular to the radial direction (z-axis) and tothe axial direction (y-axis). The observations providedetailed data on the shapes and preferred alignment of
rights reserved.
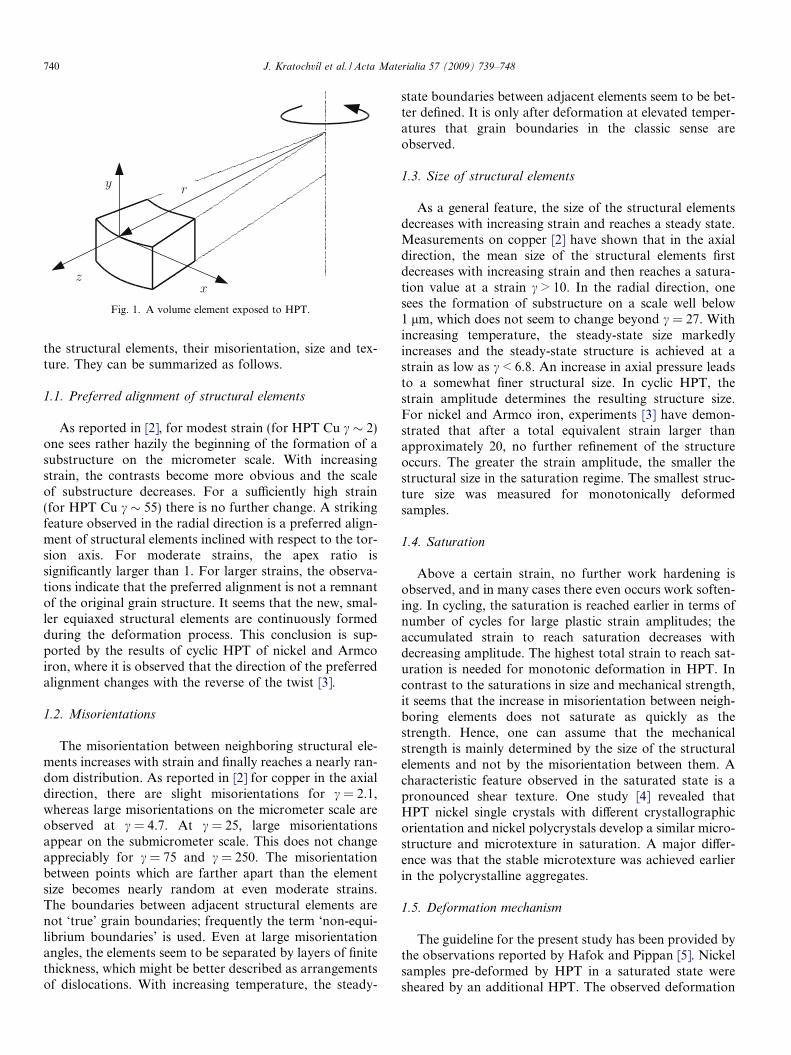
Fig. 1. A volume element exposed to HPT.
740 J. Kratochvıl et al. / Acta Materialia 57 (2009) 739–748
the structural elements, their misorientation, size and tex-ture. They can be summarized as follows.
1.1. Preferred alignment of structural elements
As reported in [2], for modest strain (for HPT Cu c � 2)one sees rather hazily the beginning of the formation of asubstructure on the micrometer scale. With increasingstrain, the contrasts become more obvious and the scaleof substructure decreases. For a sufficiently high strain(for HPT Cu c � 55) there is no further change. A strikingfeature observed in the radial direction is a preferred align-ment of structural elements inclined with respect to the tor-sion axis. For moderate strains, the apex ratio issignificantly larger than 1. For larger strains, the observa-tions indicate that the preferred alignment is not a remnantof the original grain structure. It seems that the new, smal-ler equiaxed structural elements are continuously formedduring the deformation process. This conclusion is sup-ported by the results of cyclic HPT of nickel and Armcoiron, where it is observed that the direction of the preferredalignment changes with the reverse of the twist [3].
1.2. Misorientations
The misorientation between neighboring structural ele-ments increases with strain and finally reaches a nearly ran-dom distribution. As reported in [2] for copper in the axialdirection, there are slight misorientations for c = 2.1,whereas large misorientations on the micrometer scale areobserved at c = 4.7. At c = 25, large misorientationsappear on the submicrometer scale. This does not changeappreciably for c = 75 and c = 250. The misorientationbetween points which are farther apart than the elementsize becomes nearly random at even moderate strains.The boundaries between adjacent structural elements arenot ‘true’ grain boundaries; frequently the term ‘non-equi-librium boundaries’ is used. Even at large misorientationangles, the elements seem to be separated by layers of finitethickness, which might be better described as arrangementsof dislocations. With increasing temperature, the steady-
state boundaries between adjacent elements seem to be bet-ter defined. It is only after deformation at elevated temper-atures that grain boundaries in the classic sense areobserved.
1.3. Size of structural elements
As a general feature, the size of the structural elementsdecreases with increasing strain and reaches a steady state.Measurements on copper [2] have shown that in the axialdirection, the mean size of the structural elements firstdecreases with increasing strain and then reaches a satura-tion value at a strain c > 10. In the radial direction, onesees the formation of substructure on a scale well below1 lm, which does not seem to change beyond c = 27. Withincreasing temperature, the steady-state size markedlyincreases and the steady-state structure is achieved at astrain as low as c < 6.8. An increase in axial pressure leadsto a somewhat finer structural size. In cyclic HPT, thestrain amplitude determines the resulting structure size.For nickel and Armco iron, experiments [3] have demon-strated that after a total equivalent strain larger thanapproximately 20, no further refinement of the structureoccurs. The greater the strain amplitude, the smaller thestructural size in the saturation regime. The smallest struc-ture size was measured for monotonically deformedsamples.
1.4. Saturation
Above a certain strain, no further work hardening isobserved, and in many cases there even occurs work soften-ing. In cycling, the saturation is reached earlier in terms ofnumber of cycles for large plastic strain amplitudes; theaccumulated strain to reach saturation decreases withdecreasing amplitude. The highest total strain to reach sat-uration is needed for monotonic deformation in HPT. Incontrast to the saturations in size and mechanical strength,it seems that the increase in misorientation between neigh-boring elements does not saturate as quickly as thestrength. Hence, one can assume that the mechanicalstrength is mainly determined by the size of the structuralelements and not by the misorientation between them. Acharacteristic feature observed in the saturated state is apronounced shear texture. One study [4] revealed thatHPT nickel single crystals with different crystallographicorientation and nickel polycrystals develop a similar micro-structure and microtexture in saturation. A major differ-ence was that the stable microtexture was achieved earlierin the polycrystalline aggregates.
1.5. Deformation mechanism
The guideline for the present study has been provided bythe observations reported by Hafok and Pippan [5]. Nickelsamples pre-deformed by HPT in a saturated state weresheared by an additional HPT. The observed deformation
J. Kratochvıl et al. / Acta Materialia 57 (2009) 739–748 741
mechanism was shearing with microshear bands, whichcorresponds to the imposed torsion of the sample with nochange in the substructure pattern. The width of the bandswas about twice that of the average size of the substructureelements. From the observations, Hafok and Pippan con-cluded that the deformation was achieved by an intergran-ular glide. Grain boundary sliding was excluded as themain deformation mechanism in the explored HPTprocess.
For the interpretation of the fragmentation process, weemploy the framework of crystal plasticity summarized inSection 2. In Sections 3 and 4, the considerations arerestricted to spatially homogeneous plane-strain, rigid-plas-tic deformation carried by double slip. A rate-independentmaterial response is considered. Despite these simplifica-tions, the idealized framework provides a possible explana-tion for some of the observations summarized above. Thebasic feature of the model is a rotation of the slip systemscarrying the imposed HPT strain. The slip activity is gov-erned by the shear stress imposed by torsion and by axialcompression. In Section 5 we suggest that the results ofthe recent paper [6] can be employed in a qualitative analy-sis of the fragmentation process. In [6], formation of a struc-tural element pattern (misoriented cell pattern) wasexplained as the result of a trend to reduce energeticallycostly multislip. In the context of HPT, this means that ateach orientation of the slip systems there is a tendency tobuild the corresponding pattern. The rotation of the slipsystems causes a continuous reconstruction of the pattern.The effect leads to an increase in the dislocation densityand enhanced hardening. In the deformation process, theorientation of the slip systems asymptotically approachesa steady state related to the saturation effect.
1 In detail: L ¼ _FF�1 ¼ R _FpðFpÞ�1RT þ _RRT , where _FpðFpÞ�1 is therate of plastic distortion in the reference lattice, R _FpðFpÞ�1RT ¼ Lp is therate of plastic distortion rotated with the lattice into the currentconfiguration and _RRT ¼ X is the lattice spin.
2 Explicitly: _si ¼ _RsðiÞ0 ¼ _RRT sðiÞ ¼ XsðiÞ and _mi ¼ _Rm
ðiÞ0 ¼ _RRT mðiÞ ¼
XmðiÞ.
2. Crystal plasticity
The crystal plasticity equations were introduced in suchclassic papers as Refs. [7,8]. Here, the rigid-plastic approx-imation to the kinematics of crystal plasticity elaborated in[9] is considered. The constitutive assumption adopted is arate-independent material response.
2.1. Kinematics
Each material point can be identified by its position in areference configuration. The point which was at position Xin the reference configuration is in the current configura-tion in time t in the position x(X, t). The differenceu = x � X is the displacement of the material point X.The deformation of the material is described by the trans-formation F of an infinitesimal material fiber from the ref-erence to the current configuration,
dx ¼ F dX : ð1ÞAssuming that x(X, t) is a continuous and differentiable
vector field, this transformation can be introduced as thedeformation gradient F = ox/oX = I + ou/oX, where I is
the second-order identity tensor. In the rigid-plasticapproximation the crystal lattice can (rigidly) rotate butis not (elastically) deformed. The plastic deformation of acrystal can be notionally decomposed in two steps. First,the material flows through the crystal lattice by shearingalong active slip systems to reach an intermediate configu-ration. This step is described by the plastic deformationgradient Fp. Second, the plastic deformation Fp is followedby a rigid rotation R of the lattice. The correspondingdecomposition reads
F ¼ RFp: ð2Þ
We note in passing that in the case of inhomogeneous plas-tic deformation Fp, the lattice rotation R can re-establishthe compatibility of the overall material deformation. Thisprocess leads, for example, to formation of misoriented dis-location cells (cf. [9,10,6]).
The velocity v of a material point is given by the(Lagrangian) derivative of its position, vðx; tÞ ¼ _xðX; tÞ.Now, we perform the time derivative of Eq. (1)
d _x ¼ _F dX ¼ @vðx; tÞ@X
dX ¼ @v
@xF F�1 dx ¼ L dx;
where Lðx; tÞ ¼ _FF�1 ¼ @v=@x is the velocity gradient.Using Eq. (2), the latter can be decomposed1 as
L ¼ Lp þX; ð3Þwhere Lp is the rate of plastic distortion in the current con-figuration and X is the lattice spin. The rate of plastic dis-tortion, which represents the plastic flow in the currentconfiguration, can be written in terms of shear strain rates_cðiÞðx; tÞ on the active slip systems (i), i = 1,2, . . . , I,
Lp ¼XI
i¼1
_cðiÞsðiÞ �mðiÞ: ð4Þ
The ith slip system is defined in the reference configura-tion by the unit vector in the direction of slip s
ðiÞ0 ðX ; tÞ
and the unit normal to the glide plane mðiÞ0 ðX; tÞ. The lat-
tice vectors s(i) and m(i) rotate rigidly by virtue of thedeformation gradient F from the reference into currentconfiguration
sðiÞ ¼ RsðiÞ0 ; mðiÞ ¼ Rm
ðiÞ0 : ð5Þ
From the time derivation of Eq. (5), it follows that the cur-rent lattice vectors spin rigidly with the lattice2
_sðiÞ ¼ XsðiÞ; _mðiÞ ¼ XmðiÞ ð6Þ
Fig. 2. Schematics of plane-strain symmetric double slip with / = 55�.
742 J. Kratochvıl et al. / Acta Materialia 57 (2009) 739–748
2.2. Constitutive model
The plastic shear rates _cðiÞ in the current slip systems (i)are driven by resolved shear stresses s(i):
_cðiÞ ¼ kðiÞsignsðiÞ; ð7Þwhere k(i) P 0 are the plastic multipliers. Eq. (7) is the flowrule. The resolved shear stresses are related to the Cauchystress S(x, t) by the relation
sðiÞ ¼ sðiÞ � S mðiÞ: ð8ÞA slip system (i) can be activated only if the magnitude ofthe resolved shear stress s(i) reaches the critical value (yieldstress) sðiÞy :
jsðiÞj ¼ sðiÞy : ð9Þ
This is the yield condition. The critical resolved shearstress, i.e. the hardness of a slip system, has a characterof a friction, so that sðiÞy > 0. The rate of change in sðiÞy ,i.e. the hardening of the ith slip system, can be written inthe standard form
_sðiÞy ¼XI
j¼1
H ijj _cðjÞj: ð10Þ
The hardening matrix H is deformation-history dependentand in general not symmetric.
3. Lattice rotations
The analysis of lattice rotations in torsion performed inSection 3.2 below is inspired by the detailed study (experi-mental and computational) of structure and micromecha-nisms of strain localization process during plane-straincompression (PSC) of face-centered cubic single crystalsand polycrystals in a channel die performed by Harrenet al. [8]. We recall the basic results of the latter analysis first.
3.1. Symmetric double slip in plane-strain compression
X-ray measurements were carried out by Harren et al.[8] to determine the lattice reorientation of the single crys-tals of various initial crystallographic orientations beforemacroscopic shear bands appeared, i.e. up to the engineer-ing compression strain �0.3 � 0.9. It was observed that,except for crystals oriented symmetrically with respect tothe compression and extension axes, the crystals exhibitedan overall common behavior. After yield, all these crystalsstarted to reorient in such a way that their crystallographicdirection [110] approached the compression axis and thedirection [001] became parallel to the extension axis alongthe channel, i.e. these reorientations tend to bring the crys-tals toward the (110)[0 01] orientation. The (110)[00 1]geometry coincides with a stable state of symmetric slipon four slip systems: ð111Þ½10�1Þ�, ð111Þ½01�1� andð11�1Þ½101�, ð11�1Þ½011�. The net shearing systems associatedwith this symmetric state are then ½11�2� in (111) and [11 2]
in ð11�1Þ, and hence the resulting deformation of this sym-metric state is aligned with the channel. So, for these crys-tals, as the deformation proceeds, this state of plane-straincrystallographic deformation is approached.
In order to simulate the compression tests of single crys-tals, Harren et al. [8] employed a two-dimensional singlecrysta modell with the two considered slip systems(11 1)½11�2� and ð11�1Þ[112]. Its reference configuration isshown in Fig. 2. The orientation of the slip systems withrespect to compression axis is / ¼ arccosfð½110�=ffiffiffi
2pÞ � ð½112�=
ffiffiffi6pÞg � 55�, Fig. 2. The experimental observa-
tions and the computed deformation response were in closeagreement.
In the PSC tests of polycrystals [8], the observedmicromechanics demonstrated that highly nonuniformgrain deformations and lattice rotations provided a ‘crys-tallographic path’ that allowed slip to be transmitted acrossgrain boundaries. The FEM calculations based on a plane-strain model of the polycrystal have been consistent withthe experimental observations. The study revealed that inthe early stages of deformation the grains tend to rotatetoward an ideal texture orientation. This increases the glo-bal anisotropy of the polycrystal, but decreases the localheterogeneity, since the grain lattices all tend to becomemore or less aligned with each other. As the deformationcontinues, the alignment tends to decrease the grain bound-ary lattice misorientations, thus allowing for an easiertransmission of slip. As the rotations toward the ideal tex-ture proceed, the inherently nonuniform deformationswithin the grains precipitate the formation of grain levelshearing modes. The shearing within a single grain oftenbehaves in a similar manner to that within the singlecrystals.
Inspired by this successful model, we use a simple crys-tallographic double-slip plane-strain approximation for the
J. Kratochvıl et al. / Acta Materialia 57 (2009) 739–748 743
analysis of the slip systems behavior in torsion. However,we apply the simple model to the PSC first, to see if it pre-dicts the rotation of the slip systems towards the symmetricdouble slip mode assumed by Harren et al. [8].
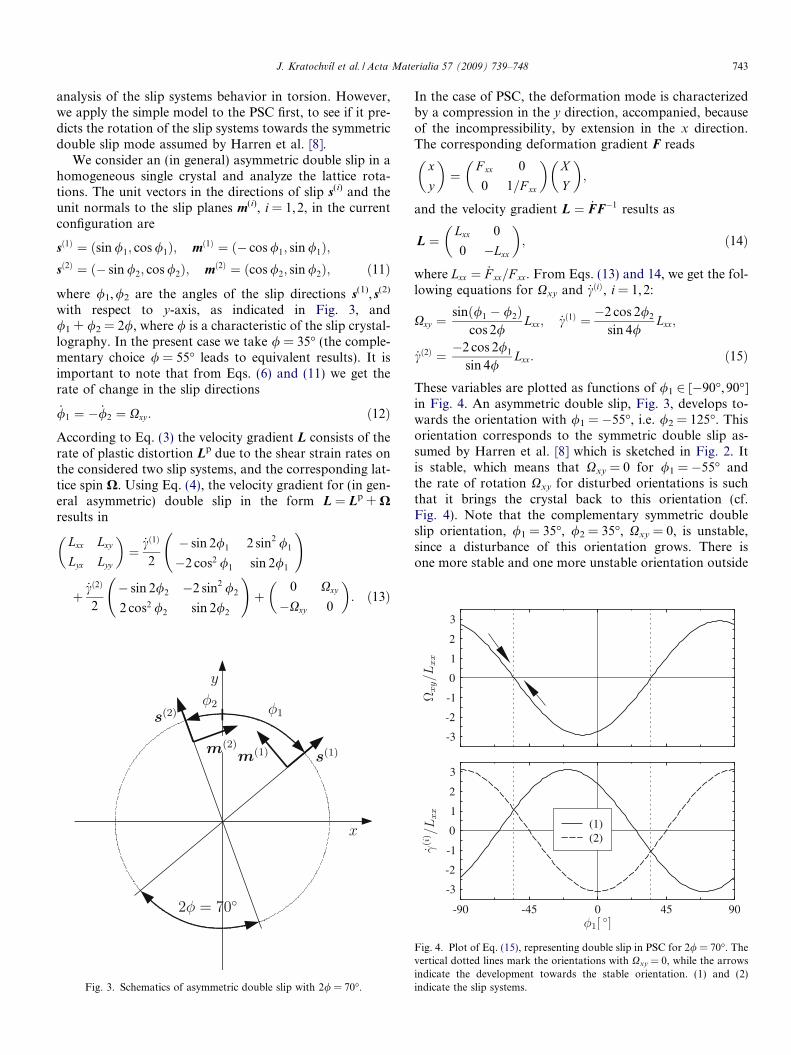
We consider an (in general) asymmetric double slip in ahomogeneous single crystal and analyze the lattice rota-tions. The unit vectors in the directions of slip s(i) and theunit normals to the slip planes m(i), i = 1,2, in the currentconfiguration are
sð1Þ ¼ ðsin /1; cos /1Þ; mð1Þ ¼ ð� cos /1; sin /1Þ;sð2Þ ¼ ð� sin /2; cos /2Þ; mð2Þ ¼ ðcos /2; sin /2Þ; ð11Þ
where /1,/2 are the angles of the slip directions s(1), s(2)
with respect to y-axis, as indicated in Fig. 3, and/1 + /2 = 2/, where / is a characteristic of the slip crystal-lography. In the present case we take / = 35� (the comple-mentary choice / = 55� leads to equivalent results). It isimportant to note that from Eqs. (6) and (11) we get therate of change in the slip directions
_/1 ¼ � _/2 ¼ Xxy : ð12ÞAccording to Eq. (3) the velocity gradient L consists of therate of plastic distortion Lp due to the shear strain rates onthe considered two slip systems, and the corresponding lat-tice spin X. Using Eq. (4), the velocity gradient for (in gen-eral asymmetric) double slip in the form L = Lp + Xresults in
Lxx Lxy
Lyx Lyy
� �¼ _cð1Þ
2
� sin 2/1 2 sin2 /1
�2 cos2 /1 sin 2/1
!
þ _cð2Þ
2
� sin 2/2 �2 sin2 /2
2 cos2 /2 sin 2/2
!þ
0 Xxy
�Xxy 0
� �: ð13Þ
Fig. 3. Schematics of asymmetric double slip with 2/ = 70�.
In the case of PSC, the deformation mode is characterizedby a compression in the y direction, accompanied, becauseof the incompressibility, by extension in the x direction.The corresponding deformation gradient F reads
x
y
� �¼
F xx 0
0 1=F xx
� �X
Y
� �;
and the velocity gradient L ¼ _FF�1 results as
L ¼Lxx 0
0 �Lxx
� �; ð14Þ
where Lxx ¼ _F xx=F xx. From Eqs. (13) and 14, we get the fol-lowing equations for Xxy and _cðiÞ, i = 1,2:
Xxy ¼sinð/1 � /2Þ
cos 2/Lxx; _cð1Þ ¼ �2 cos 2/2
sin 4/Lxx;
_cð2Þ ¼ �2 cos 2/1
sin 4/Lxx: ð15Þ
These variables are plotted as functions of /1 2 [�90�, 90�]in Fig. 4. An asymmetric double slip, Fig. 3, develops to-wards the orientation with /1 = �55�, i.e. /2 = 125�. Thisorientation corresponds to the symmetric double slip as-sumed by Harren et al. [8] which is sketched in Fig. 2. Itis stable, which means that Xxy = 0 for /1 = �55� andthe rate of rotation Xxy for disturbed orientations is suchthat it brings the crystal back to this orientation (cf.Fig. 4). Note that the complementary symmetric doubleslip orientation, /1 = 35�, /2 = 35�, Xxy = 0, is unstable,since a disturbance of this orientation grows. There isone more stable and one more unstable orientation outside
ig. 4. Plot of Eq. (15), representing double slip in PSC for 2/ = 70�. Theertical dotted lines mark the orientations with Xxy = 0, while the arrowsdicate the development towards the stable orientation. (1) and (2)
Fvin
indicate the slip systems.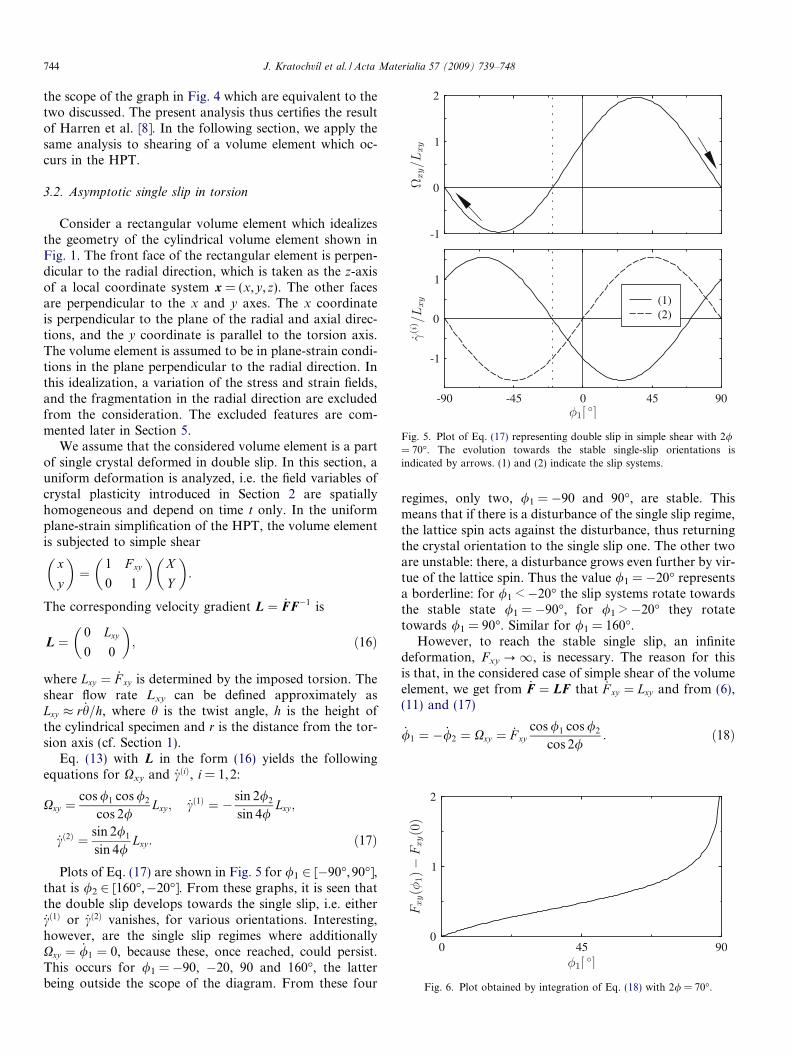
Fig. 5. Plot of Eq. (17) representing double slip in simple shear with 2/= 70�. The evolution towards the stable single-slip orientations isindicated by arrows. (1) and (2) indicate the slip systems.
Fig. 6. Plot obtained by integration of Eq. (18) with 2/ = 70�.
744 J. Kratochvıl et al. / Acta Materialia 57 (2009) 739–748
the scope of the graph in Fig. 4 which are equivalent to thetwo discussed. The present analysis thus certifies the resultof Harren et al. [8]. In the following section, we apply thesame analysis to shearing of a volume element which oc-curs in the HPT.
3.2. Asymptotic single slip in torsion
Consider a rectangular volume element which idealizesthe geometry of the cylindrical volume element shown inFig. 1. The front face of the rectangular element is perpen-dicular to the radial direction, which is taken as the z-axisof a local coordinate system x = (x,y,z). The other facesare perpendicular to the x and y axes. The x coordinateis perpendicular to the plane of the radial and axial direc-tions, and the y coordinate is parallel to the torsion axis.The volume element is assumed to be in plane-strain condi-tions in the plane perpendicular to the radial direction. Inthis idealization, a variation of the stress and strain fields,and the fragmentation in the radial direction are excludedfrom the consideration. The excluded features are com-mented later in Section 5.
We assume that the considered volume element is a partof single crystal deformed in double slip. In this section, auniform deformation is analyzed, i.e. the field variables ofcrystal plasticity introduced in Section 2 are spatiallyhomogeneous and depend on time t only. In the uniformplane-strain simplification of the HPT, the volume elementis subjected to simple shear
x
y
� �¼
1 F xy
0 1
� �X
Y
� �:
The corresponding velocity gradient L ¼ _FF�1 is
L ¼0 Lxy
0 0
� �; ð16Þ
where Lxy ¼ _F xy is determined by the imposed torsion. Theshear flow rate Lxy can be defined approximately asLxy � r _h=h, where h is the twist angle, h is the height ofthe cylindrical specimen and r is the distance from the tor-sion axis (cf. Section 1).
Eq. (13) with L in the form (16) yields the followingequations for Xxy and _cðiÞ, i = 1,2:
Xxy ¼cos /1 cos /2
cos 2/Lxy ; _cð1Þ ¼ � sin 2/2
sin 4/Lxy ;
_cð2Þ ¼ sin 2/1
sin 4/Lxy : ð17Þ
Plots of Eq. (17) are shown in Fig. 5 for /1 2 [�90�, 90�],that is /2 2 [160�,�20�]. From these graphs, it is seen thatthe double slip develops towards the single slip, i.e. either_cð1Þ or _cð2Þ vanishes, for various orientations. Interesting,however, are the single slip regimes where additionallyXxy ¼ _/1 ¼ 0, because these, once reached, could persist.This occurs for /1 = �90, �20, 90 and 160�, the latterbeing outside the scope of the diagram. From these four
regimes, only two, /1 = �90 and 90�, are stable. Thismeans that if there is a disturbance of the single slip regime,the lattice spin acts against the disturbance, thus returningthe crystal orientation to the single slip one. The other twoare unstable: there, a disturbance grows even further by vir-tue of the lattice spin. Thus the value /1 = �20� representsa borderline: for /1 < �20� the slip systems rotate towardsthe stable state /1 = �90�, for /1 > �20� they rotatetowards /1 = 90�. Similar for /1 = 160�.
However, to reach the stable single slip, an infinitedeformation, Fxy ?1, is necessary. The reason for thisis that, in the considered case of simple shear of the volumeelement, we get from _F ¼ LF that _F xy ¼ Lxy and from (6),(11) and (17)
_/1 ¼ � _/2 ¼ Xxy ¼ _F xycos /1 cos /2
cos 2/: ð18Þ
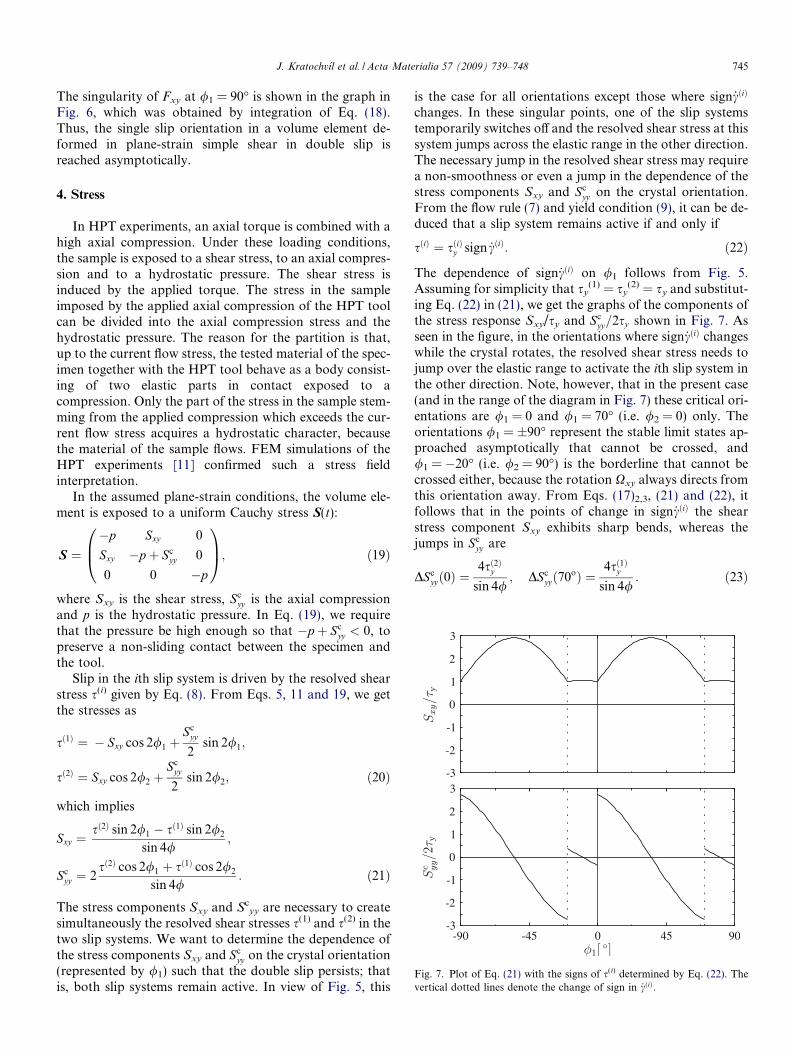
Fig. 7. Plot of Eq. (21) with the signs of s(i) determined by Eq. (22). Thevertical dotted lines denote the change of sign in _cðiÞ.
J. Kratochvıl et al. / Acta Materialia 57 (2009) 739–748 745
The singularity of Fxy at /1 = 90� is shown in the graph inFig. 6, which was obtained by integration of Eq. (18).Thus, the single slip orientation in a volume element de-formed in plane-strain simple shear in double slip isreached asymptotically.
4. Stress
In HPT experiments, an axial torque is combined with ahigh axial compression. Under these loading conditions,the sample is exposed to a shear stress, to an axial compres-sion and to a hydrostatic pressure. The shear stress isinduced by the applied torque. The stress in the sampleimposed by the applied axial compression of the HPT toolcan be divided into the axial compression stress and thehydrostatic pressure. The reason for the partition is that,up to the current flow stress, the tested material of the spec-imen together with the HPT tool behave as a body consist-ing of two elastic parts in contact exposed to acompression. Only the part of the stress in the sample stem-ming from the applied compression which exceeds the cur-rent flow stress acquires a hydrostatic character, becausethe material of the sample flows. FEM simulations of theHPT experiments [11] confirmed such a stress fieldinterpretation.
In the assumed plane-strain conditions, the volume ele-ment is exposed to a uniform Cauchy stress S(t):
S ¼�p Sxy 0
Sxy �p þ Scyy 0
0 0 �p
0B@
1CA; ð19Þ
where Sxy is the shear stress, Scyy is the axial compression
and p is the hydrostatic pressure. In Eq. (19), we requirethat the pressure be high enough so that �p þ Sc
yy < 0, topreserve a non-sliding contact between the specimen andthe tool.
Slip in the ith slip system is driven by the resolved shearstress s(i) given by Eq. (8). From Eqs. 5, 11 and 19, we getthe stresses as
sð1Þ ¼ � Sxy cos 2/1 þSc
yy
2sin 2/1;
sð2Þ ¼ Sxy cos 2/2 þSc
yy
2sin 2/2; ð20Þ
which implies
Sxy ¼sð2Þ sin 2/1 � sð1Þ sin 2/2
sin 4/;
Scyy ¼ 2
sð2Þ cos 2/1 þ sð1Þ cos 2/2
sin 4/: ð21Þ
The stress components Sxy and Scyy are necessary to create
simultaneously the resolved shear stresses s(1) and s(2) in thetwo slip systems. We want to determine the dependence ofthe stress components Sxy and Sc
yy on the crystal orientation(represented by /1) such that the double slip persists; thatis, both slip systems remain active. In view of Fig. 5, this
is the case for all orientations except those where sign _cðiÞ
changes. In these singular points, one of the slip systemstemporarily switches off and the resolved shear stress at thissystem jumps across the elastic range in the other direction.The necessary jump in the resolved shear stress may requirea non-smoothness or even a jump in the dependence of thestress components Sxy and Sc
yy on the crystal orientation.From the flow rule (7) and yield condition (9), it can be de-duced that a slip system remains active if and only if
sðiÞ ¼ sðiÞy sign _cðiÞ: ð22Þ
The dependence of sign _cðiÞ on /1 follows from Fig. 5.Assuming for simplicity that sy
(1) = sy(2) = sy and substitut-
ing Eq. (22) in (21), we get the graphs of the components ofthe stress response Sxy/sy and Sc
yy=2sy shown in Fig. 7. Asseen in the figure, in the orientations where sign _cðiÞ changeswhile the crystal rotates, the resolved shear stress needs tojump over the elastic range to activate the ith slip system inthe other direction. Note, however, that in the present case(and in the range of the diagram in Fig. 7) these critical ori-entations are /1 = 0 and /1 = 70� (i.e. /2 = 0) only. Theorientations /1 = ±90� represent the stable limit states ap-proached asymptotically that cannot be crossed, and/1 = �20� (i.e. /2 = 90�) is the borderline that cannot becrossed either, because the rotation Xxy always directs fromthis orientation away. From Eqs. (17)2,3, (21) and (22), itfollows that in the points of change in sign _cðiÞ the shearstress component Sxy exhibits sharp bends, whereas thejumps in Sc
yy are
DScyyð0Þ ¼
4sð2Þy
sin 4/; DSc
yyð70oÞ ¼4sð1Þy
sin 4/: ð23Þ
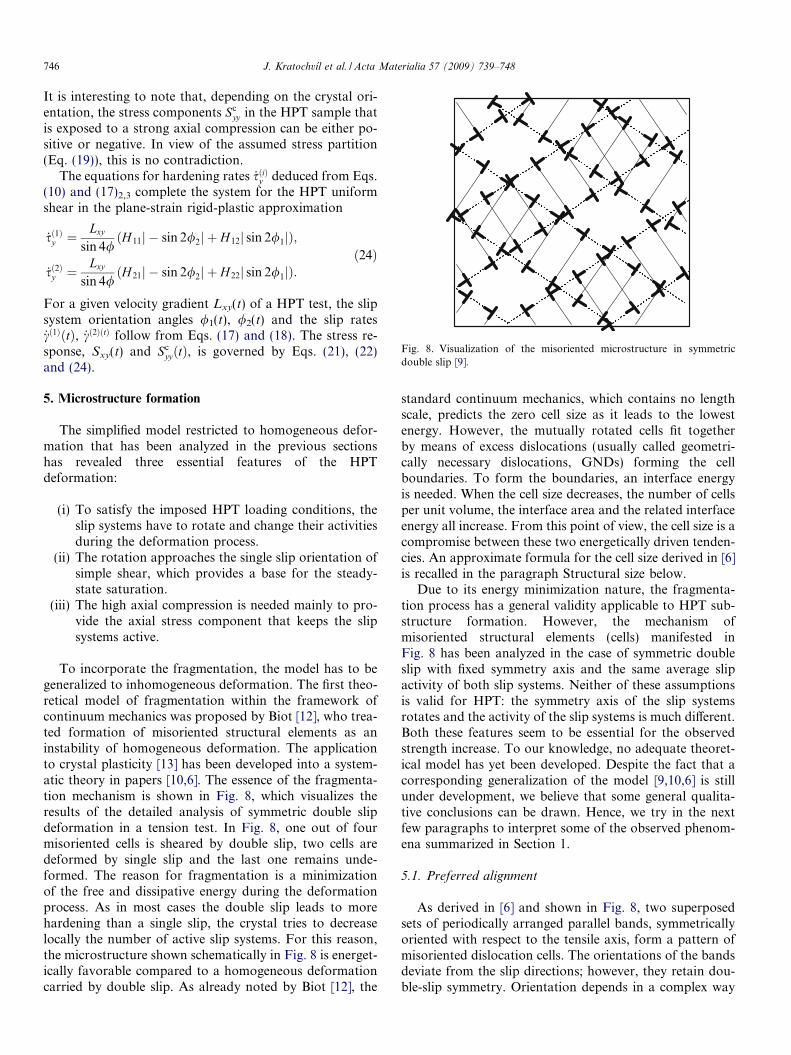
Fig. 8. Visualization of the misoriented microstructure in symmetricdouble slip [9].
746 J. Kratochvıl et al. / Acta Materialia 57 (2009) 739–748
It is interesting to note that, depending on the crystal ori-entation, the stress components Sc
yy in the HPT sample thatis exposed to a strong axial compression can be either po-sitive or negative. In view of the assumed stress partition(Eq. (19)), this is no contradiction.
The equations for hardening rates _sðiÞy deduced from Eqs.(10) and (17)2,3 complete the system for the HPT uniformshear in the plane-strain rigid-plastic approximation
_sð1Þy ¼Lxy
sin 4/ðH 11j � sin 2/2j þ H 12j sin 2/1jÞ;
_sð2Þy ¼Lxy
sin 4/ðH 21j � sin 2/2j þ H 22j sin 2/1jÞ:
ð24Þ
For a given velocity gradient Lxy(t) of a HPT test, the slipsystem orientation angles /1(t), /2(t) and the slip rates_cð1ÞðtÞ, _cð2ÞðtÞ follow from Eqs. (17) and (18). The stress re-sponse, Sxy(t) and Sc
yyðtÞ, is governed by Eqs. (21), (22)and (24).
5. Microstructure formation
The simplified model restricted to homogeneous defor-mation that has been analyzed in the previous sectionshas revealed three essential features of the HPTdeformation:
(i) To satisfy the imposed HPT loading conditions, theslip systems have to rotate and change their activitiesduring the deformation process.
(ii) The rotation approaches the single slip orientation ofsimple shear, which provides a base for the steady-state saturation.
(iii) The high axial compression is needed mainly to pro-vide the axial stress component that keeps the slipsystems active.
To incorporate the fragmentation, the model has to begeneralized to inhomogeneous deformation. The first theo-retical model of fragmentation within the framework ofcontinuum mechanics was proposed by Biot [12], who trea-ted formation of misoriented structural elements as aninstability of homogeneous deformation. The applicationto crystal plasticity [13] has been developed into a system-atic theory in papers [10,6]. The essence of the fragmenta-tion mechanism is shown in Fig. 8, which visualizes theresults of the detailed analysis of symmetric double slipdeformation in a tension test. In Fig. 8, one out of fourmisoriented cells is sheared by double slip, two cells aredeformed by single slip and the last one remains unde-formed. The reason for fragmentation is a minimizationof the free and dissipative energy during the deformationprocess. As in most cases the double slip leads to morehardening than a single slip, the crystal tries to decreaselocally the number of active slip systems. For this reason,the microstructure shown schematically in Fig. 8 is energet-ically favorable compared to a homogeneous deformationcarried by double slip. As already noted by Biot [12], the
standard continuum mechanics, which contains no lengthscale, predicts the zero cell size as it leads to the lowestenergy. However, the mutually rotated cells fit togetherby means of excess dislocations (usually called geometri-cally necessary dislocations, GNDs) forming the cellboundaries. To form the boundaries, an interface energyis needed. When the cell size decreases, the number of cellsper unit volume, the interface area and the related interfaceenergy all increase. From this point of view, the cell size is acompromise between these two energetically driven tenden-cies. An approximate formula for the cell size derived in [6]is recalled in the paragraph Structural size below.
Due to its energy minimization nature, the fragmenta-tion process has a general validity applicable to HPT sub-structure formation. However, the mechanism ofmisoriented structural elements (cells) manifested inFig. 8 has been analyzed in the case of symmetric doubleslip with fixed symmetry axis and the same average slipactivity of both slip systems. Neither of these assumptionsis valid for HPT: the symmetry axis of the slip systemsrotates and the activity of the slip systems is much different.Both these features seem to be essential for the observedstrength increase. To our knowledge, no adequate theoret-ical model has yet been developed. Despite the fact that acorresponding generalization of the model [9,10,6] is stillunder development, we believe that some general qualita-tive conclusions can be drawn. Hence, we try in the nextfew paragraphs to interpret some of the observed phenom-ena summarized in Section 1.
5.1. Preferred alignment
As derived in [6] and shown in Fig. 8, two superposedsets of periodically arranged parallel bands, symmetricallyoriented with respect to the tensile axis, form a pattern ofmisoriented dislocation cells. The orientations of the bandsdeviate from the slip directions; however, they retain dou-ble-slip symmetry. Orientation depends in a complex way
J. Kratochvıl et al. / Acta Materialia 57 (2009) 739–748 747
on the angle between the slip systems 2/, on the hardeningmatrices (an analogy of the present hardening coefficientsHij) and on the pre-stress (an analogy of the present stressS). The symmetry axis of the double slip that coincides withthe tensile axis represents a preferred alignment of the cellpattern.
In HPT, the symmetry axis of the double slip rotateswith the slip systems toward ±(90� � /), which corre-sponds to the stable slip orientations. In analogy toFig. 8, we can expect the cell pattern in the radial directionof HPT to follow this symmetry axis. As, in HPT, the slipsin the individual slip systems differ and their distributionvaries (see Eq. (17) and Fig. 5), the preferred alignmentof the cell pattern need not coincide with the symmetry axisdirection. Nevertheless, a tendency of the cell pattern tofollow the orientation of the slip systems might be a reasonfor the observed preferred alignment of the structural ele-ments inclined with respect to the torsion axis [2]. Thishypothesis is supported by the results of the cyclic HPT[3], where the direction of the preferred alignment changeswith the reverse of the twist. The proposed model exhibits asimilar feature: the reverse of the applied shear rotates theslip systems in the opposite direction and the newly formedcell pattern would tend to form a mirror preferredalignment.
5.2. Misorientations
The model presented in [6] predicts that the misorienta-tion increases with strain. In the case of the HPT model, wecan expect similar increase in the cell misorientation. How-ever, unlike the observed tendency to randomly distributedlarge misorientations [2], the modeled misorientations aresmall periodic deviations from the uniform orientation.From the proposed HPT model, one can deduce that theboundaries between adjacent cells may have a special struc-ture that is different from the standard grain boundaries.At each orientation of the slip systems, there is a tendencyto build a particular cell pattern. Due to the rotation of thesystems, these patterns may overlap. This might be a rea-son for formation of the observed dislocation layers offinite thickness separating the cells, the so-called ‘non-equi-librium boundaries’. According to this hypothesis, theboundaries formed in later stages of deformation, wherethe rate of rotation per applied shear strain diminishes,should be better defined and be akin to the ‘true’ grainboundaries.
3 In [15], it was demonstrated that the stress is highest for a ‘circular’continuous change of loading trajectories.
5.3. Structural size
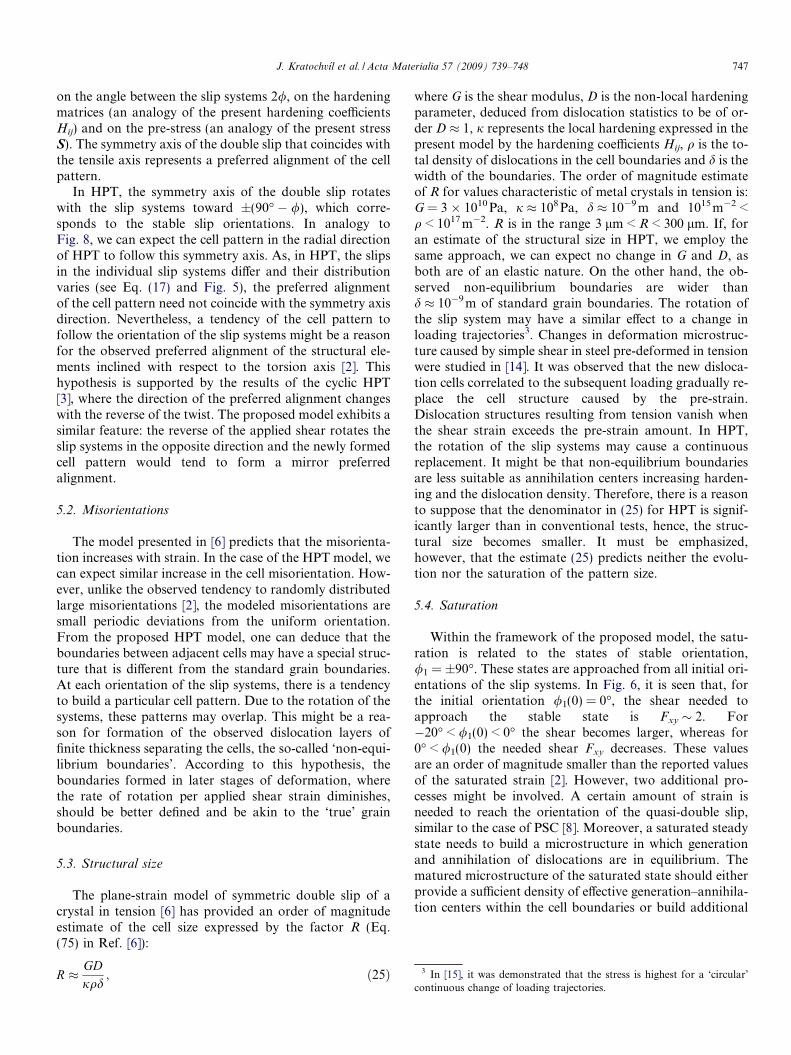
The plane-strain model of symmetric double slip of acrystal in tension [6] has provided an order of magnitudeestimate of the cell size expressed by the factor R (Eq.(75) in Ref. [6]):
R � GDjqd
; ð25Þ
where G is the shear modulus, D is the non-local hardeningparameter, deduced from dislocation statistics to be of or-der D � 1, j represents the local hardening expressed in thepresent model by the hardening coefficients Hij, q is the to-tal density of dislocations in the cell boundaries and d is thewidth of the boundaries. The order of magnitude estimateof R for values characteristic of metal crystals in tension is:G = 3 1010 Pa, j � 108 Pa, d � 10�9 m and 1015 m�2 <q < 1017 m�2. R is in the range 3 lm < R < 300 lm. If, foran estimate of the structural size in HPT, we employ thesame approach, we can expect no change in G and D, asboth are of an elastic nature. On the other hand, the ob-served non-equilibrium boundaries are wider thand � 10�9 m of standard grain boundaries. The rotation ofthe slip system may have a similar effect to a change inloading trajectories3. Changes in deformation microstruc-ture caused by simple shear in steel pre-deformed in tensionwere studied in [14]. It was observed that the new disloca-tion cells correlated to the subsequent loading gradually re-place the cell structure caused by the pre-strain.Dislocation structures resulting from tension vanish whenthe shear strain exceeds the pre-strain amount. In HPT,the rotation of the slip systems may cause a continuousreplacement. It might be that non-equilibrium boundariesare less suitable as annihilation centers increasing harden-ing and the dislocation density. Therefore, there is a reasonto suppose that the denominator in (25) for HPT is signif-icantly larger than in conventional tests, hence, the struc-tural size becomes smaller. It must be emphasized,however, that the estimate (25) predicts neither the evolu-tion nor the saturation of the pattern size.
5.4. Saturation
Within the framework of the proposed model, the satu-ration is related to the states of stable orientation,/1 = ±90�. These states are approached from all initial ori-entations of the slip systems. In Fig. 6, it is seen that, forthe initial orientation /1(0) = 0�, the shear needed toapproach the stable state is Fxy � 2. For�20� < /1(0) < 0� the shear becomes larger, whereas for0� < /1(0) the needed shear Fxy decreases. These valuesare an order of magnitude smaller than the reported valuesof the saturated strain [2]. However, two additional pro-cesses might be involved. A certain amount of strain isneeded to reach the orientation of the quasi-double slip,similar to the case of PSC [8]. Moreover, a saturated steadystate needs to build a microstructure in which generationand annihilation of dislocations are in equilibrium. Thematured microstructure of the saturated state should eitherprovide a sufficient density of effective generation–annihila-tion centers within the cell boundaries or build additional
748 J. Kratochvıl et al. / Acta Materialia 57 (2009) 739–748
accidental annihilation centers. This tendency seems todetermine the saturated microstructure.
5.5. Fragmentation in axial direction
As has been already mentioned, the assumption of theplane-strain double slip excludes the fragmentation seen inthe axial direction. The most distinguished feature relatedto the axial cell pattern is the gradient of plastic strain inthe radial direction. Using the estimate c = rh/h and$c = h/h = bRG, we get RG = c/(r b), where h is the twistangle, h is the height of the cylindrical specimen, r is the dis-tance from the torsion axis, $ is the gradient in the radialdirection, b = 2.5 10�10 m is the magnitude of the Burgervector and RG is the density of GNDs. For representative val-ues r = 2mm (in [2] specimens were cut at r = 1.5mm andr = 3mm from the torsion axis) and c = 10, the estimategives RG = 2 1013 m�2. In the plane-strain approximationused in the previous section, the GNDs of the cell boundariesseen in the radial direction have an edge character. From thispoint of view, GNDs in the axial direction could be modeledas screw parts connecting the edge segments to form disloca-tion loops. Due to the radial gradient nature of the cellarrangement as seen in the axial direction, there is no reasonfor a preferred alignment, as already observed in [2].
6. Summary
In the present analysis, the observation reported in Ref.[5] that the HPT shearing imposed by torsion wasachieved by an intergranular glide has been acceptedas a principle guideline. The evolution of the HPT microstructure observed in
sections perpendicular to the radial direction has beenstudied as simple shear carried by double slip. The mostclearly distinguished feature relating to the HPT micro-structure as observed in the axial direction is the radialgradient of shear strain. The basic feature of the modeling of the microstructure
in the radial direction is a rotation of the slip systemscarrying the imposed shear strain. The orientations ofthe slip systems asymptotically approach a steady stateof single slip. The analysis indicates that the high axial compression is
needed mainly to provide the axial stress component tokeep the slip systems active and to preserve the contactbetween the specimen and the tool.
The present knowledge about the mechanism of theobserved fragmentation into the misoriented structural ele-ments is incomplete; nevertheless, it suggests the interpreta-tion of some HPT observations:
The formation of the misoriented structural elementscan be explained as a result of a trend to reduce the ener-getically costly multislip. This means that at each slipsystem orientation there is a tendency to build a corre-sponding pattern with a locally reduced number of slipsystems. The rotation of the slip systems causes a continuous
reconstruction of the pattern. The necessary destructionof the previous pattern can lead to an increase in the dis-location density and enhanced hardening. The asymptotically reached steady state of the lattice
rotation may be related to the observed saturation effect. A tendency of the pattern to follow the orientation of
the rotating slip systems might be a reason for theobserved preferred alignment of the structural elementsinclined with respect to the torsion axis as observed inthe radial direction. The size of the structural elements is a result of the com-
petition between two tendencies: during the deformationprocess, the internal and dissipative energy tends todecrease the structural size, whereas the interface energyof the cell boundaries opposes this trend.
Acknowledgements
We are grateful to Prof. R. Pippan for inspiring discus-sions, and providing information on HPT and valuablecomments on the manuscript. Thanks are also due to Prof.E. Werner for critically reading the text. Finally, we thankthe anonymous referee for his/her comments and sugges-tions. The research was supported by Grants VZ-MSMT6840770003 (J.K.) and VZ-MSMT 6840770021 (M.K.).
References
[1] Valiev RZ, Islamgaliev RK, Alexandrov IV. Progr Mater Sci2004;45:103.
[2] Hebesberger T, Stuwe HP, Vorhauer A, Wetscher F, Pippan R. ActaMater 2005;53:393.
[3] Wetscher F, Pippan R. Philos Mag 2006;86:5867.[4] Hafok M, Pippan R. Mater Sci Forum 2007;550:277.[5] Hafok M, Pippan R. Scr Mater 2007;56:757.[6] Kratochvıl J, Kruzık M, Sedlacek R. Phys Rev B 2007;75:064104.[7] Asaro RJ. J Appl Mech 1983;50:921.[8] Harren SV, Deve HE, Asaro RJ. Acta Metall 1988;36:2435.[9] Sedlacek R. Instability origin of subgrain formation. PhD thesis,
Universitat Erlangen-Nurnberg, Erlangen, 1999.[10] Sedlacek R, Kratochvıl J, Blum W. Phys Stat Sol 2001;186:1.[11] Ecker W. Simulation eines Hochdruck-Torsions-Versuches zum
Zwecke der Kalibrierung von Werkstoffdaten von Schienenmaterial.Master’s thesis, Montanuniversitat Leoben, Leoben, 2004.
[12] Biot MA. Mechanics of incremental deformations. New York: Wiley;1965.
[13] Kratochvıl J, Orlova A. Philos Mag 1990;A61:281.[14] Rauch EF, Schmitt JH. Mater Sci Eng A 1989;113:441.[15] Tanaka E, Murakami S, Ooka M. J Mech Phys Solids 1985;
33:559.