Embed Size (px)
DESCRIPTION
A Model of Plankton Dynamics for the Coastal Upwelling System
Citation preview
*Corresponding author: Fax: 001-831-775-1620.E-mail address: [email protected] (F.P. Chavez)
Deep-Sea Research II 47 (2000) 1077}1106
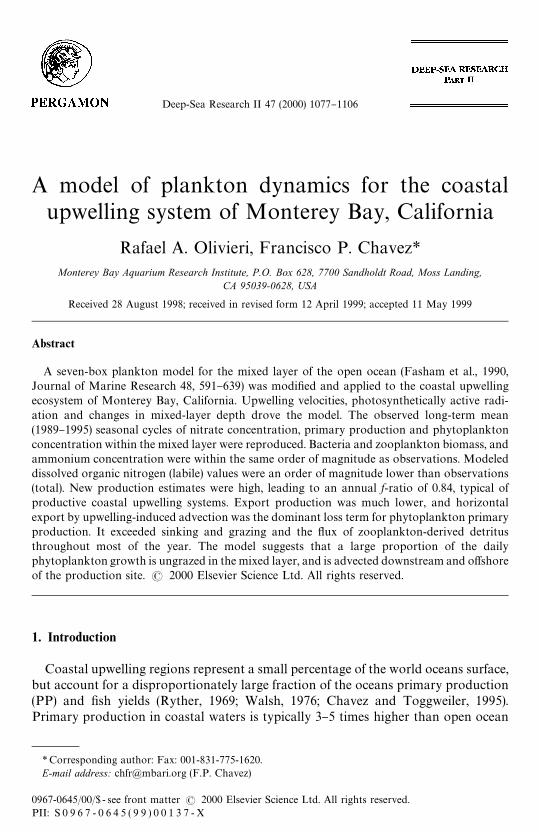
A model of plankton dynamics for the coastalupwelling system of Monterey Bay, California
Rafael A. Olivieri, Francisco P. Chavez*Monterey Bay Aquarium Research Institute, P.O. Box 628, 7700 Sandholdt Road, Moss Landing,
CA 95039-0628, USA
Received 28 August 1998; received in revised form 12 April 1999; accepted 11 May 1999
Abstract
A seven-box plankton model for the mixed layer of the open ocean (Fasham et al., 1990,Journal of Marine Research 48, 591}639) was modi"ed and applied to the coastal upwellingecosystem of Monterey Bay, California. Upwelling velocities, photosynthetically active radi-ation and changes in mixed-layer depth drove the model. The observed long-term mean(1989}1995) seasonal cycles of nitrate concentration, primary production and phytoplanktonconcentration within the mixed layer were reproduced. Bacteria and zooplankton biomass, andammonium concentration were within the same order of magnitude as observations. Modeleddissolved organic nitrogen (labile) values were an order of magnitude lower than observations(total). New production estimates were high, leading to an annual f-ratio of 0.84, typical ofproductive coastal upwelling systems. Export production was much lower, and horizontalexport by upwelling-induced advection was the dominant loss term for phytoplankton primaryproduction. It exceeded sinking and grazing and the #ux of zooplankton-derived detritusthroughout most of the year. The model suggests that a large proportion of the dailyphytoplankton growth is ungrazed in the mixed layer, and is advected downstream and o!shoreof the production site. ( 2000 Elsevier Science Ltd. All rights reserved.
1. Introduction
Coastal upwelling regions represent a small percentage of the world oceans surface,but account for a disproportionately large fraction of the oceans primary production(PP) and "sh yields (Ryther, 1969; Walsh, 1976; Chavez and Toggweiler, 1995).Primary production in coastal waters is typically 3}5 times higher than open ocean
0967-0645/00/$ - see front matter ( 2000 Elsevier Science Ltd. All rights reserved.PII: S 0 9 6 7 - 0 6 4 5 ( 9 9 ) 0 0 1 3 7 - X

waters on a per unit of area basis, but export production, organic carbon reaching thebenthos, and accumulation of organic carbon in the sediments can be many timeslarger (Berger et al., 1989). While the coastal upwelling process and its biological andchemical consequences have been studied extensively (see Barber and Smith, 1981a,b;Hutchings et al., 1995), these studies have been sporadic in space and time. Inputparameters needed for modeling coastal upwelling ecosystems, therefore, have beenonly marginally available, and long-term data sets for model validation have beenlacking. In 1989 the Monterey Bay Aquarium Research Institute (MBARI) began anintensive study of the coastal upwelling system of central California (Chavez, 1996),incorporating biweekly to monthly ship expeditions together with continuous obser-vations from strategically placed moored platforms (Chavez et al., 1997). The resultsfrom these time-series measurements have provided insights into the processes regula-ting biological production in a coastal upwelling ecosystem as well as data for modelinput and validation.
In this contribution we describe the modi"cation and application of an upperopen-ocean ecosystem model to a coastal upwelling ecosystem. The model we selectedwas the Fasham et al. (1990) model, here referred to as the `FDMa model (Sarmientoet al., 1993; Haney and Jackson, 1996). The FDM model is one of a series ofPhytoplankton}Nutrient}Zooplankton (PNZ) models that trace their roots to theearly work by Fleming (1939) and Riley (1946). The original FDM model was usedto simulate the seasonal cycle of nutrients and primary production at Bermuda'sStation S. More recently it has been incorporated into the Princeton North AtlanticGeneral Circulation Model (Sarmiento et al., 1993), and in a tropical Paci"cocean circulation model (Toggweiler and Carson, 1995) with reasonable success.FDM also has been used as a test-bed for parameter optimization protocols (Matear,1995), and to explore the consequences of variations in phytoplankton growthformulations (Haney and Jackson, 1996). We explore the use of FDM for modelinga coastal upwelling pelagic ecosystem. The primary goal of our modeling exercise wasto simulate the long-term mean (1989}1995) seasonal cycle of primary productionand then to explore the model predictions for other variables, in particular new andexport production.
2. Environmental setting
Monterey Bay is a complex and dynamic coastal upwelling environment (Breakerand Broenkow, 1994; Rosenfeld et al., 1994; Paduan and Rosenfeld, 1996), andsubstantially di!erent from the oligotrophic subtropical open ocean around Bermudawhere the FDM model was originally applied. The ocean around Bermuda's StationS, even though more variable than previously thought (Goldman, 1988), is closer tosteady state than coastal upwelling ecosystems (Mann and Lazier, 1991). MontereyBay #uctuates seasonally from high primary production (PP) during spring andsummer upwelling, to a relative low level during winter non-upwelling periods(Chavez, 1996). The euphotic zone integrated PP for Monterey Bay during the winterlow (Chavez, 1996) is similar to the mean PP reported for the Hawaii Ocean
1078 R.A. Olivieri, F.P. Chavez / Deep-Sea Research II 47 (2000) 1077}1106
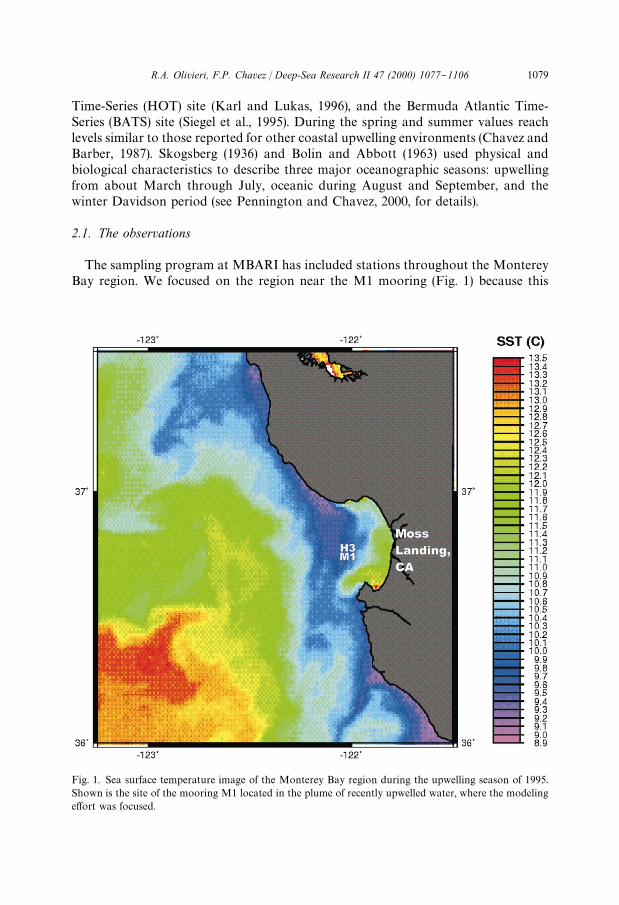
Fig. 1. Sea surface temperature image of the Monterey Bay region during the upwelling season of 1995.Shown is the site of the mooring M1 located in the plume of recently upwelled water, where the modelinge!ort was focused.
Time-Series (HOT) site (Karl and Lukas, 1996), and the Bermuda Atlantic Time-Series (BATS) site (Siegel et al., 1995). During the spring and summer values reachlevels similar to those reported for other coastal upwelling environments (Chavez andBarber, 1987). Skogsberg (1936) and Bolin and Abbott (1963) used physical andbiological characteristics to describe three major oceanographic seasons: upwellingfrom about March through July, oceanic during August and September, and thewinter Davidson period (see Pennington and Chavez, 2000, for details).
2.1. The observations
The sampling program at MBARI has included stations throughout the MontereyBay region. We focused on the region near the M1 mooring (Fig. 1) because this
R.A. Olivieri, F.P. Chavez / Deep-Sea Research II 47 (2000) 1077}1106 1079
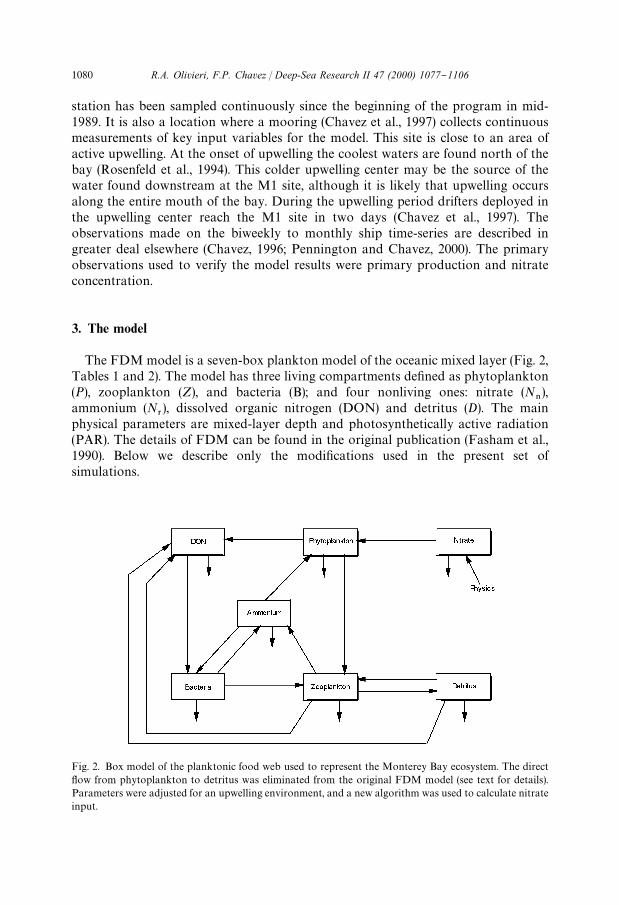
Fig. 2. Box model of the planktonic food web used to represent the Monterey Bay ecosystem. The direct#ow from phytoplankton to detritus was eliminated from the original FDM model (see text for details).Parameters were adjusted for an upwelling environment, and a new algorithm was used to calculate nitrateinput.
station has been sampled continuously since the beginning of the program in mid-1989. It is also a location where a mooring (Chavez et al., 1997) collects continuousmeasurements of key input variables for the model. This site is close to an area ofactive upwelling. At the onset of upwelling the coolest waters are found north of thebay (Rosenfeld et al., 1994). This colder upwelling center may be the source of thewater found downstream at the M1 site, although it is likely that upwelling occursalong the entire mouth of the bay. During the upwelling period drifters deployed inthe upwelling center reach the M1 site in two days (Chavez et al., 1997). Theobservations made on the biweekly to monthly ship time-series are described ingreater deal elsewhere (Chavez, 1996; Pennington and Chavez, 2000). The primaryobservations used to verify the model results were primary production and nitrateconcentration.
3. The model
The FDM model is a seven-box plankton model of the oceanic mixed layer (Fig. 2,Tables 1 and 2). The model has three living compartments de"ned as phytoplankton(P), zooplankton (Z), and bacteria (B); and four nonliving ones: nitrate (N
/),
ammonium (N3), dissolved organic nitrogen (DON) and detritus (D). The main
physical parameters are mixed-layer depth and photosynthetically active radiation(PAR). The details of FDM can be found in the original publication (Fasham et al.,1990). Below we describe only the modi"cations used in the present set ofsimulations.
1080 R.A. Olivieri, F.P. Chavez / Deep-Sea Research II 47 (2000) 1077}1106
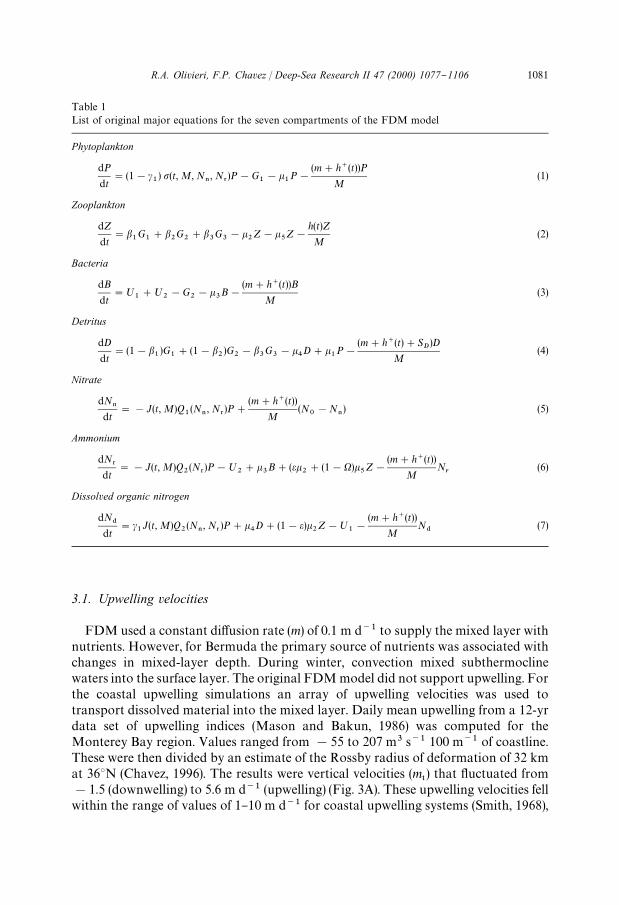
Table 1List of original major equations for the seven compartments of the FDM model
Phytoplankton
dP
dt"(1!c
1) p(t, M, N
/, N
3)P!G
1!k
1P!
(m#h`(t))P
M(1)
Zooplankton
dZ
dt"b
1G
1#b
2G
2#b
3G
3!k
2Z!k
5Z!
h(t)Z
M(2)
Bacteria
dB
dt";
1#;
2!G
2!k
3B!
(m#h`(t))B
M(3)
Detritus
dD
dt"(1!b
1)G
1#(1!b
2)G
2!b
3G
3!k
4D#k
1P!
(m#h`(t)#SD)D
M(4)
Nitrate
dN/
dt"!J(t, M)Q
1(N
/, N
3)P#
(m#h`(t))
M(N
0!N
/) (5)
Ammonium
dN3
dt"!J(t, M)Q
2(N
3)P!;
2#k
3B#(ek
2#(1!X)k
5Z!
(m#h`(t))
MN
r(6)
Dissolved organic nitrogen
dN$
dt"c
1J(t, M)Q
2(N
/, N
3)P#k
4D#(1!e)k
2Z!;
1!
(m#h`(t))
MN
$(7)
3.1. Upwelling velocities
FDM used a constant di!usion rate (m) of 0.1 m d~1 to supply the mixed layer withnutrients. However, for Bermuda the primary source of nutrients was associated withchanges in mixed-layer depth. During winter, convection mixed subthermoclinewaters into the surface layer. The original FDM model did not support upwelling. Forthe coastal upwelling simulations an array of upwelling velocities was used totransport dissolved material into the mixed layer. Daily mean upwelling from a 12-yrdata set of upwelling indices (Mason and Bakun, 1986) was computed for theMonterey Bay region. Values ranged from !55 to 207 m3 s~1 100 m~1 of coastline.These were then divided by an estimate of the Rossby radius of deformation of 32 kmat 363N (Chavez, 1996). The results were vertical velocities (m
5) that #uctuated from
!1.5 (downwelling) to 5.6 m d~1 (upwelling) (Fig. 3A). These upwelling velocities fellwithin the range of values of 1}10 m d~1 for coastal upwelling systems (Smith, 1968),
R.A. Olivieri, F.P. Chavez / Deep-Sea Research II 47 (2000) 1077}1106 1081
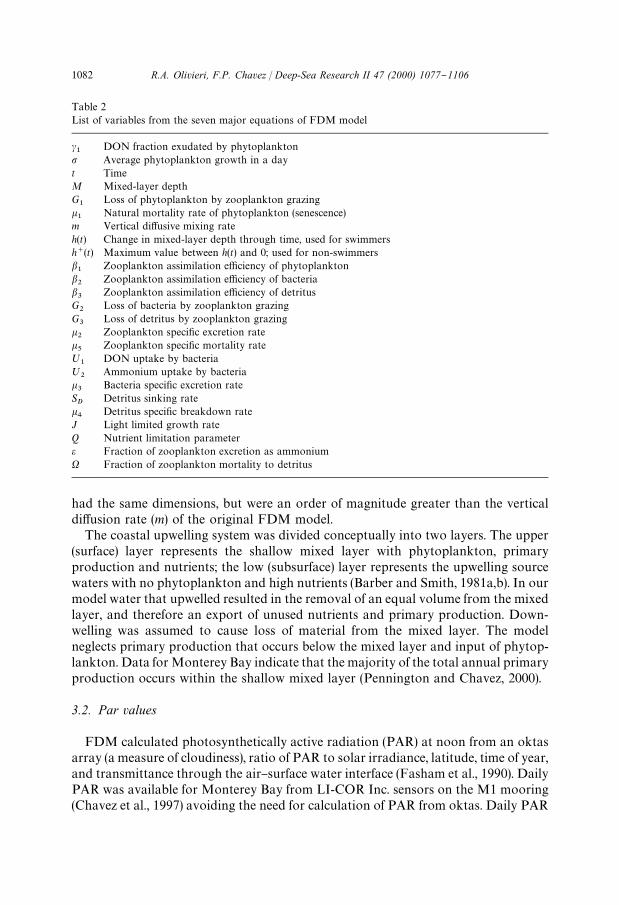
Table 2List of variables from the seven major equations of FDM model
c1
DON fraction exudated by phytoplanktonp Average phytoplankton growth in a dayt TimeM Mixed-layer depthG
1Loss of phytoplankton by zooplankton grazing
k1
Natural mortality rate of phytoplankton (senescence)m Vertical di!usive mixing rateh(t) Change in mixed-layer depth through time, used for swimmersh`(t) Maximum value between h(t) and 0; used for non-swimmersb1
Zooplankton assimilation e$ciency of phytoplanktonb2
Zooplankton assimilation e$ciency of bacteriab3
Zooplankton assimilation e$ciency of detritusG
2Loss of bacteria by zooplankton grazing
G3
Loss of detritus by zooplankton grazingk2
Zooplankton speci"c excretion ratek5
Zooplankton speci"c mortality rate;
1DON uptake by bacteria
;2
Ammonium uptake by bacteriak3
Bacteria speci"c excretion rateSD
Detritus sinking ratek4
Detritus speci"c breakdown rateJ Light limited growth rateQ Nutrient limitation parametere Fraction of zooplankton excretion as ammoniumX Fraction of zooplankton mortality to detritus
had the same dimensions, but were an order of magnitude greater than the verticaldi!usion rate (m) of the original FDM model.
The coastal upwelling system was divided conceptually into two layers. The upper(surface) layer represents the shallow mixed layer with phytoplankton, primaryproduction and nutrients; the low (subsurface) layer represents the upwelling sourcewaters with no phytoplankton and high nutrients (Barber and Smith, 1981a,b). In ourmodel water that upwelled resulted in the removal of an equal volume from the mixedlayer, and therefore an export of unused nutrients and primary production. Down-welling was assumed to cause loss of material from the mixed layer. The modelneglects primary production that occurs below the mixed layer and input of phytop-lankton. Data for Monterey Bay indicate that the majority of the total annual primaryproduction occurs within the shallow mixed layer (Pennington and Chavez, 2000).
3.2. Par values
FDM calculated photosynthetically active radiation (PAR) at noon from an oktasarray (a measure of cloudiness), ratio of PAR to solar irradiance, latitude, time of year,and transmittance through the air}surface water interface (Fasham et al., 1990). DailyPAR was available for Monterey Bay from LI-COR Inc. sensors on the M1 mooring(Chavez et al., 1997) avoiding the need for calculation of PAR from oktas. Daily PAR
1082 R.A. Olivieri, F.P. Chavez / Deep-Sea Research II 47 (2000) 1077}1106
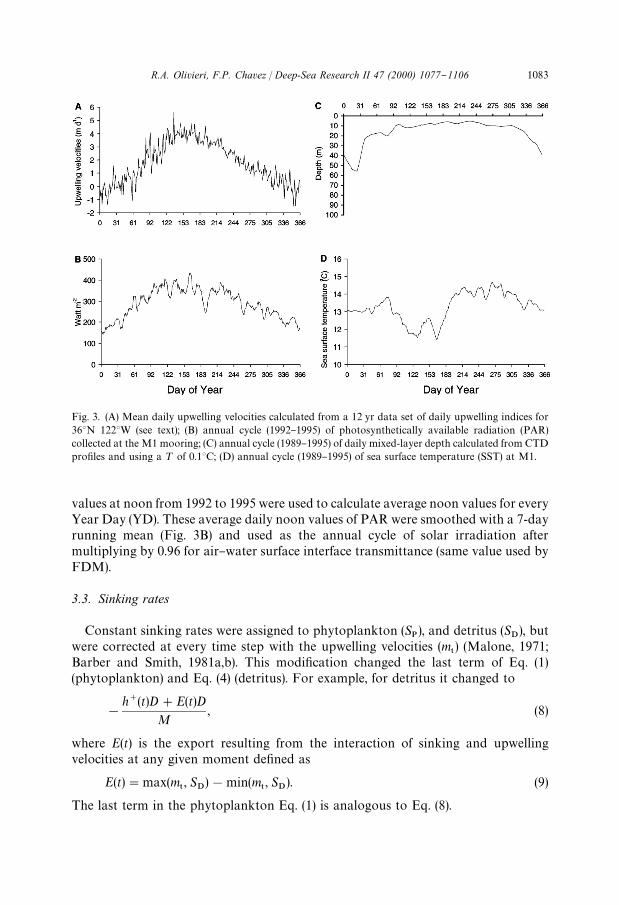
Fig. 3. (A) Mean daily upwelling velocities calculated from a 12 yr data set of daily upwelling indices for363N 1223W (see text); (B) annual cycle (1992}1995) of photosynthetically available radiation (PAR)collected at the M1 mooring; (C) annual cycle (1989}1995) of daily mixed-layer depth calculated from CTDpro"les and using a ¹ of 0.13C; (D) annual cycle (1989}1995) of sea surface temperature (SST) at M1.
values at noon from 1992 to 1995 were used to calculate average noon values for everyYear Day (YD). These average daily noon values of PAR were smoothed with a 7-dayrunning mean (Fig. 3B) and used as the annual cycle of solar irradiation aftermultiplying by 0.96 for air}water surface interface transmittance (same value used byFDM).
3.3. Sinking rates
Constant sinking rates were assigned to phytoplankton (SP), and detritus (S
D), but
were corrected at every time step with the upwelling velocities (m5) (Malone, 1971;
Barber and Smith, 1981a,b). This modi"cation changed the last term of Eq. (1)(phytoplankton) and Eq. (4) (detritus). For example, for detritus it changed to
!
h`(t)D#E(t)D
M, (8)
where E(t) is the export resulting from the interaction of sinking and upwellingvelocities at any given moment de"ned as
E(t)"max(m5, S
D)!min(m
5, S
D). (9)
The last term in the phytoplankton Eq. (1) is analogous to Eq. (8).
R.A. Olivieri, F.P. Chavez / Deep-Sea Research II 47 (2000) 1077}1106 1083
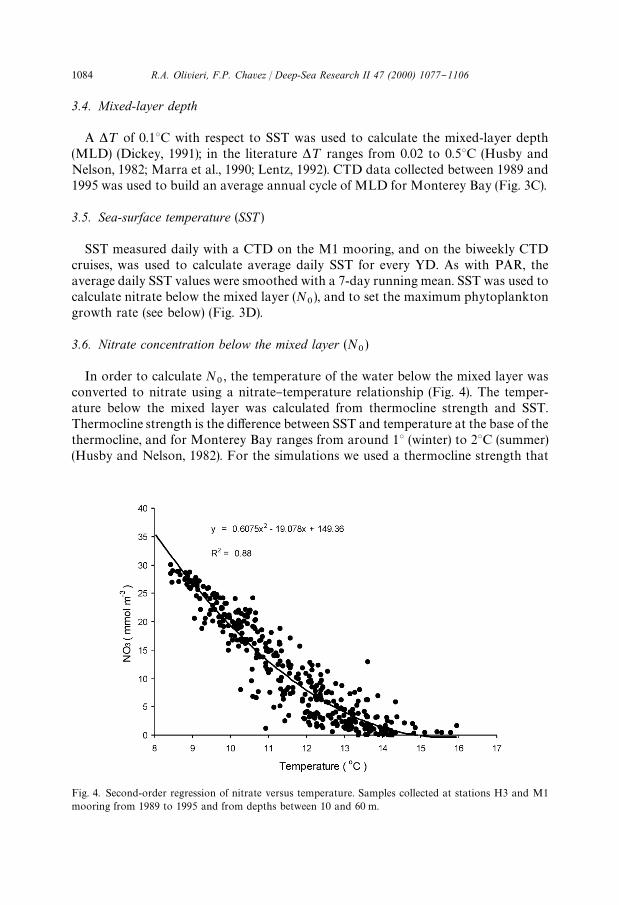
Fig. 4. Second-order regression of nitrate versus temperature. Samples collected at stations H3 and M1mooring from 1989 to 1995 and from depths between 10 and 60 m.
3.4. Mixed-layer depth
A *¹ of 0.13C with respect to SST was used to calculate the mixed-layer depth(MLD) (Dickey, 1991); in the literature *¹ ranges from 0.02 to 0.53C (Husby andNelson, 1982; Marra et al., 1990; Lentz, 1992). CTD data collected between 1989 and1995 was used to build an average annual cycle of MLD for Monterey Bay (Fig. 3C).
3.5. Sea-surface temperature (SST )
SST measured daily with a CTD on the M1 mooring, and on the biweekly CTDcruises, was used to calculate average daily SST for every YD. As with PAR, theaverage daily SST values were smoothed with a 7-day running mean. SST was used tocalculate nitrate below the mixed layer (N
0), and to set the maximum phytoplankton
growth rate (see below) (Fig. 3D).
3.6. Nitrate concentration below the mixed layer (N0)
In order to calculate N0, the temperature of the water below the mixed layer was
converted to nitrate using a nitrate}temperature relationship (Fig. 4). The temper-ature below the mixed layer was calculated from thermocline strength and SST.Thermocline strength is the di!erence between SST and temperature at the base of thethermocline, and for Monterey Bay ranges from around 13 (winter) to 23C (summer)(Husby and Nelson, 1982). For the simulations we used a thermocline strength that
1084 R.A. Olivieri, F.P. Chavez / Deep-Sea Research II 47 (2000) 1077}1106
gradually increased from 1.253 (late winter) to 23C (late summer), re#ecting wintervertical mixing and summer strati"cation. For any YD, the thermocline strength wassubtracted from SST, and this temperature was used in the nitrate}temperatureregression to approximate N
0. At temperatures *14.853C, N
0was set to
0.0 mmol m~3.
3.7. Phytoplankton terms
In FDM,<P, the maximum phytoplankton growth rate was a constant, and was the
mean of the phytoplankton maximum growth calculated using the temperaturefunction of Eppley (1972). We calculated<
Pevery YD from SST using Eppley's (1972)
function. FDM used a value for a of 0.025 d~1 (W m~2)~1. Kudela (1995) reporteda values for Monterey Bay that ranged from 0.015 to 0.031 mg C (mg Chla)~1 h~1(lE m~2 S~1)~1. With a 1 : 1 ratio of mol N to g Chl (Eppley et al., 1992) anda Red"eld C : N ratio, these values ranged from 0.021 to 0.043 (W m~2)~1 d~1.Measurements (F. Chavez, unpublished) during spring of 1995 ranged from 0.015 to0.146 (W m~2)~1 d~1, with a mean a of 0.055 (W m~2)~1 d~1. Harrison et al. (1981)values for the Peru upwelling system ranged from 0.003 to 0.099 (W m~2)~1 d~1, witha mean of 0.042 (W m~2)~1 d~1. Harrison et al. (1981) also noticed that a increasedwith Chl and proximity to coast. In our model we used an a of 0.03 d~1 (W m~2)~1,slightly higher than the one used in FDM.
The phytoplankton growth equation used by FDM requires values for the attenu-ation coe$cients for phytoplankton and water (plus detritus and dissolved coloredmaterial) k
#, and k
8(Fasham et al., 1990). k
#and k
8can be approximated with Riley's
(1946) linear equation:
k"k8#k
#C, (10)
where the intercept k8
is the light attenuation coe$cient of water plus the non-phytoplankton and dead phytoplankton components, k
#is the attenuation by live
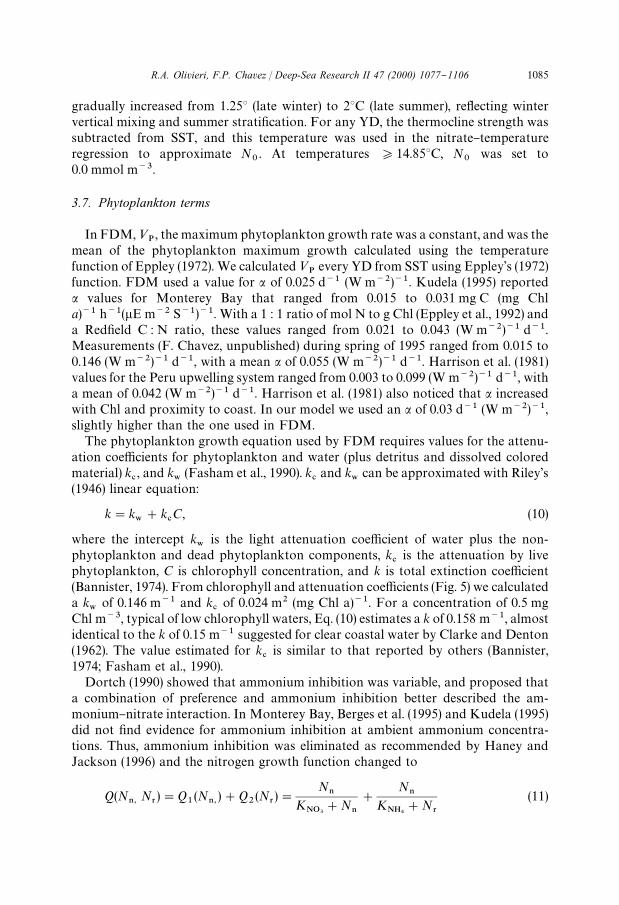
phytoplankton, C is chlorophyll concentration, and k is total extinction coe$cient(Bannister, 1974). From chlorophyll and attenuation coe$cients (Fig. 5) we calculateda k
8of 0.146 m~1 and k
#of 0.024 m2 (mg Chl a)~1. For a concentration of 0.5 mg
Chl m~3, typical of low chlorophyll waters, Eq. (10) estimates a k of 0.158 m~1, almostidentical to the k of 0.15 m~1 suggested for clear coastal water by Clarke and Denton(1962). The value estimated for k
#is similar to that reported by others (Bannister,
1974; Fasham et al., 1990).Dortch (1990) showed that ammonium inhibition was variable, and proposed that
a combination of preference and ammonium inhibition better described the am-monium}nitrate interaction. In Monterey Bay, Berges et al. (1995) and Kudela (1995)did not "nd evidence for ammonium inhibition at ambient ammonium concentra-tions. Thus, ammonium inhibition was eliminated as recommended by Haney andJackson (1996) and the nitrogen growth function changed to
Q(N/,
N3)"Q
1(N
/,)#Q
2(N
3)"
N/
KNO3
#N/
#
N/
KNH4
#N3
(11)
R.A. Olivieri, F.P. Chavez / Deep-Sea Research II 47 (2000) 1077}1106 1085
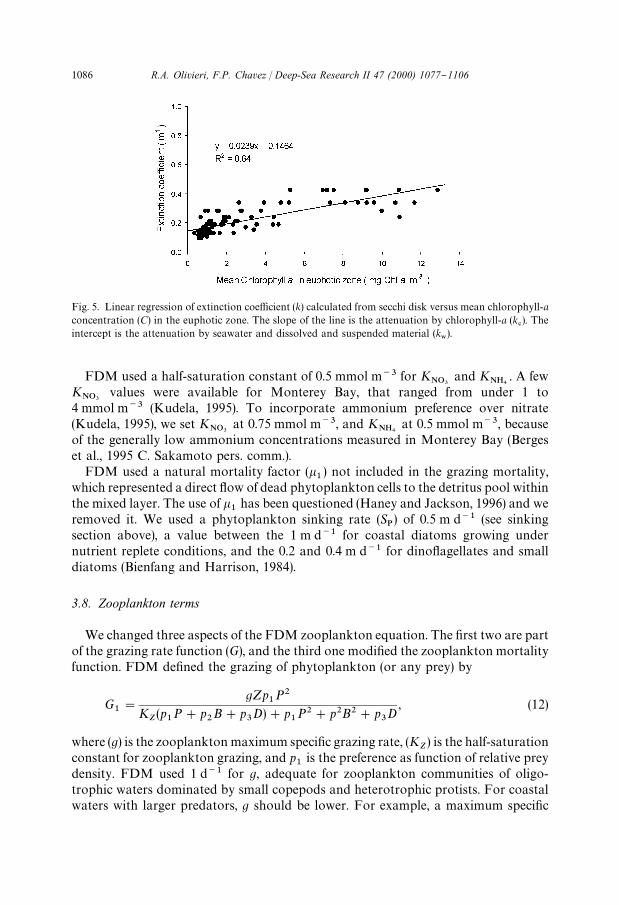
Fig. 5. Linear regression of extinction coe$cient (k) calculated from secchi disk versus mean chlorophyll-aconcentration (C) in the euphotic zone. The slope of the line is the attenuation by chlorophyll-a (k
#). The
intercept is the attenuation by seawater and dissolved and suspended material (k8).
FDM used a half-saturation constant of 0.5 mmol m~3 for KNO3
and KNH4
. A fewK
NO3values were available for Monterey Bay, that ranged from under 1 to
4 mmol m~3 (Kudela, 1995). To incorporate ammonium preference over nitrate(Kudela, 1995), we set K
NO3at 0.75 mmol m~3, and K
NH4at 0.5 mmol m~3, because
of the generally low ammonium concentrations measured in Monterey Bay (Bergeset al., 1995 C. Sakamoto pers. comm.).
FDM used a natural mortality factor (k1) not included in the grazing mortality,
which represented a direct #ow of dead phytoplankton cells to the detritus pool withinthe mixed layer. The use of k
1has been questioned (Haney and Jackson, 1996) and we
removed it. We used a phytoplankton sinking rate (SP) of 0.5 m d~1 (see sinking
section above), a value between the 1 m d~1 for coastal diatoms growing undernutrient replete conditions, and the 0.2 and 0.4 m d~1 for dino#agellates and smalldiatoms (Bienfang and Harrison, 1984).
3.8. Zooplankton terms
We changed three aspects of the FDM zooplankton equation. The "rst two are partof the grazing rate function (G), and the third one modi"ed the zooplankton mortalityfunction. FDM de"ned the grazing of phytoplankton (or any prey) by
G1"
gZp1P2
KZ(p
1P#p
2B#p
3D)#p
1P2#p2B2#p
3D
, (12)
where (g) is the zooplankton maximum speci"c grazing rate, (KZ) is the half-saturation
constant for zooplankton grazing, and p1
is the preference as function of relative preydensity. FDM used 1 d~1 for g, adequate for zooplankton communities of oligo-trophic waters dominated by small copepods and heterotrophic protists. For coastalwaters with larger predators, g should be lower. For example, a maximum speci"c
1086 R.A. Olivieri, F.P. Chavez / Deep-Sea Research II 47 (2000) 1077}1106

ingestion rate of around 0.2 d~1 was calculated for Euphausia lucens (Stuart, 1986), thedominant euphausiid and contributor of about half of the zooplankton biomass in theBenguela current (Stuart, 1986). Euphausiids are also abundant in Monterey Bay;therefore g was set at 0.6 d~1. A plot of carbon-speci"c grazing rates and diatomcarbon concentration (Stuart, 1986) showed the half saturation grazing rate forE. lucens feeding on diatoms to be around 220 lg C l~1, which by Red"eld conversionequates to 2.76 mmol N m~3. We, therefore, increased K
Zto 3 mmol N m~3 from the
1 mmol N m~3 used in FDM.The "nal modi"cation to the zooplankton equation was to the mortality induced by
predators outside the model (k5Z), used as a closure term in the equation. With the
original function primary production goes into an unrealistic cyclic behavior undernutrient rich conditions (Steele and Henderson, 1992). The mortality function waschanged to a quadratic (k
5Z2) as recommended by Steele and Henderson (1981). Fasham
(1995) and McGillicuddy et al. (1995) utilized quadratic functions for the same purpose.
3.9. Bacteria, detritus and dissolved organic nitrogen terms
With the exception of an increase in SD
(see sinking topic above) from 10 to25 m d~1, we kept the inputs for B, D, and DON as in FDM. The change of S
Dwas
based on a 25 m d~1 sinking rate for small fecal pellets calculated by Smith (1987), andthe 20}30 m d~1 rates measured in situ in Monterey Bay for small marine snowaggregates (Pilskaln et al., 1996).
3.10. Model validation
Primary production (PP) integrated over the euphotic zone and nitrate concentra-tion in the mixed layer from Monterey Bay were used to validate the model results. Anaverage annual curve of daily PP was built from PP measured from 1989 to early1996. A similar curve was constructed for nitrate concentration in the mixed layerfrom values obtained from 1989 to 1995. We used Red"eld ratios to convert modelPP, in units of mmol N m~2 d~1, to mg C m~2 d~1, for comparison with the 14C in-cubations. We followed the recommendation of Fasham et al. (1990) and (1) useda time step of 0.2 days, and (2) ran the model for various years (at least 4) to ensurea stable annual pattern.
4. Results
4.1. Evolution of the MB model
The "rst simulation was as speci"ed by the original FDM model with the PARarray, instead of oktas. Values estimated for Monterey Bay were used fork8, k
#, a, K
NO3, and MLD. <
Pwas set at 1.9 d~1 from average SST. N
0was set at
a constant 10 mmol m~3. PP oscillated in a cyclic manner, as predicted by Steele andHenderson (1992), and did not resemble the "eld measurements (Fig. 6A). N
/also did
R.A. Olivieri, F.P. Chavez / Deep-Sea Research II 47 (2000) 1077}1106 1087
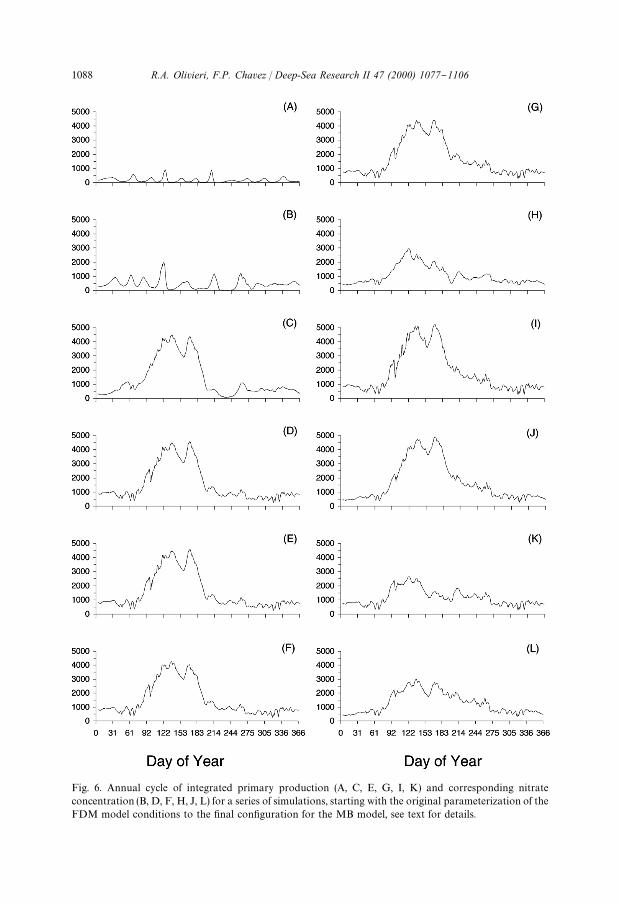
Fig. 6. Annual cycle of integrated primary production (A, C, E, G, I, K) and corresponding nitrateconcentration (B, D, F, H, J, L) for a series of simulations, starting with the original parameterization of theFDM model conditions to the "nal con"guration for the MB model, see text for details.
1088 R.A. Olivieri, F.P. Chavez / Deep-Sea Research II 47 (2000) 1077}1106
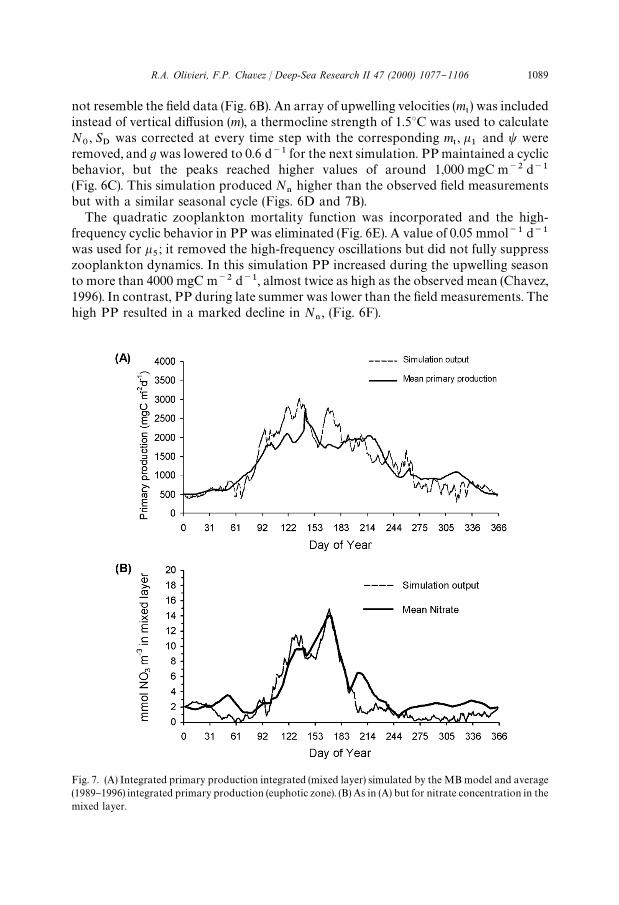
Fig. 7. (A) Integrated primary production integrated (mixed layer) simulated by the MB model and average(1989}1996) integrated primary production (euphotic zone). (B) As in (A) but for nitrate concentration in themixed layer.
not resemble the "eld data (Fig. 6B). An array of upwelling velocities (m5) was included
instead of vertical di!usion (m), a thermocline strength of 1.53C was used to calculateN
0, S
Dwas corrected at every time step with the corresponding m
5, k
1and t were
removed, and g was lowered to 0.6 d~1 for the next simulation. PP maintained a cyclicbehavior, but the peaks reached higher values of around 1,000 mgC m~2 d~1
(Fig. 6C). This simulation produced N/
higher than the observed "eld measurementsbut with a similar seasonal cycle (Figs. 6D and 7B).
The quadratic zooplankton mortality function was incorporated and the high-frequency cyclic behavior in PP was eliminated (Fig. 6E). A value of 0.05 mmol~1 d~1
was used for k5; it removed the high-frequency oscillations but did not fully suppress
zooplankton dynamics. In this simulation PP increased during the upwelling seasonto more than 4000 mgC m~2 d~1, almost twice as high as the observed mean (Chavez,1996). In contrast, PP during late summer was lower than the "eld measurements. Thehigh PP resulted in a marked decline in N
/, (Fig. 6F).
R.A. Olivieri, F.P. Chavez / Deep-Sea Research II 47 (2000) 1077}1106 1089
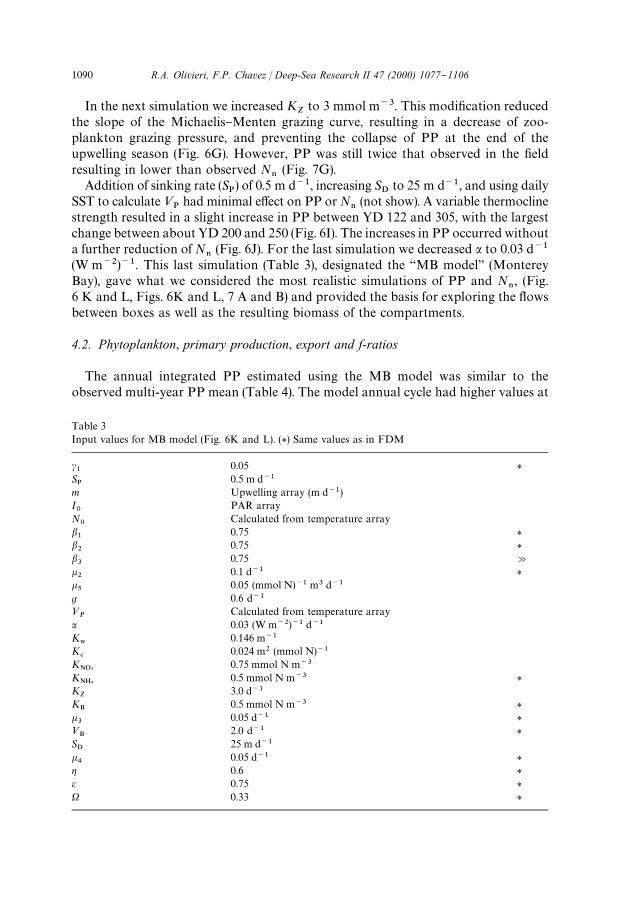
Table 3Input values for MB model (Fig. 6K and L). (*) Same values as in FDM
c1
0.05 *SP
0.5 m d~1
m Upwelling array (m d~1)I0
PAR arrayN
0Calculated from temperature array
b1
0.75 *b2
0.75 *b3
0.75 Ak2
0.1 d~1 *k5
0.05 (mmol N)~1 m3 d~1
g 0.6 d~1
<P
Calculated from temperature arraya 0.03 (W m~2)~1 d~1
K8
0.146 m~1
K#
0.024 m2 (mmol N)~1
KNO3
0.75 mmol N m~3
KNH4
0.5 mmol N m~3 *K
Z3.0 d~1
KB
0.5 mmol N m~3 *k3
0.05 d~1 *<
B2.0 d~1 *
SD
25 m d~1
k4
0.05 d~1 *g 0.6 *e 0.75 *X 0.33 *
In the next simulation we increased KZ
to 3 mmol m~3. This modi"cation reducedthe slope of the Michaelis}Menten grazing curve, resulting in a decrease of zoo-plankton grazing pressure, and preventing the collapse of PP at the end of theupwelling season (Fig. 6G). However, PP was still twice that observed in the "eldresulting in lower than observed N
/(Fig. 7G).
Addition of sinking rate (SP) of 0.5 m d~1, increasing S
Dto 25 m d~1, and using daily
SST to calculate<P
had minimal e!ect on PP or N/
(not show). A variable thermoclinestrength resulted in a slight increase in PP between YD 122 and 305, with the largestchange between about YD 200 and 250 (Fig. 6I). The increases in PP occurred withouta further reduction of N
/(Fig. 6J). For the last simulation we decreased a to 0.03 d~1
(W m~2)~1. This last simulation (Table 3), designated the `MB modela (MontereyBay), gave what we considered the most realistic simulations of PP and N
/, (Fig.
6 K and L, Figs. 6K and L, 7 A and B) and provided the basis for exploring the #owsbetween boxes as well as the resulting biomass of the compartments.
4.2. Phytoplankton, primary production, export and f-ratios
The annual integrated PP estimated using the MB model was similar to theobserved multi-year PP mean (Table 4). The model annual cycle had higher values at
1090 R.A. Olivieri, F.P. Chavez / Deep-Sea Research II 47 (2000) 1077}1106
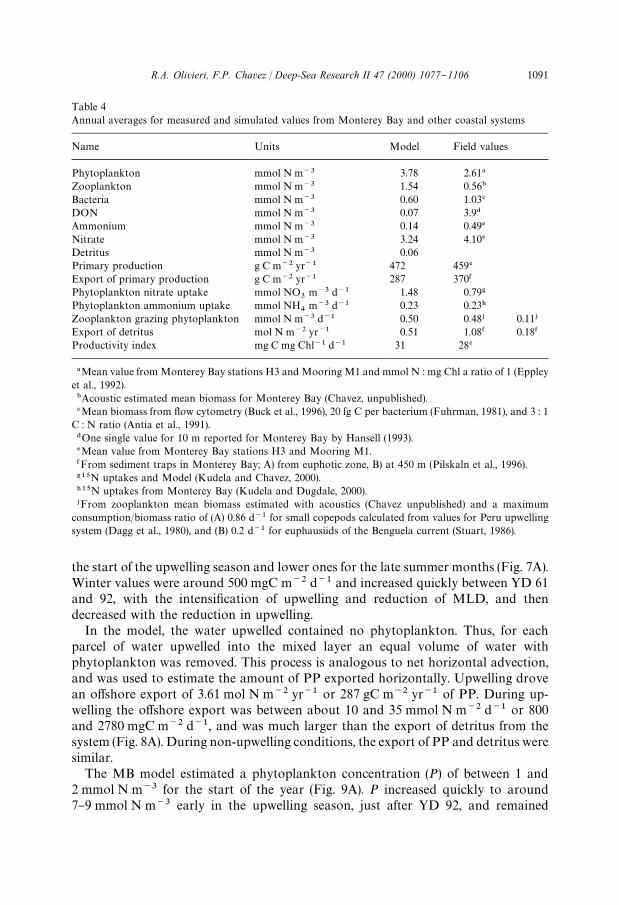
Table 4Annual averages for measured and simulated values from Monterey Bay and other coastal systems
Name Units Model Field values
Phytoplankton mmol N m~3 3.78 2.61!
Zooplankton mmol N m~3 1.54 0.56"
Bacteria mmol N m~3 0.60 1.03#
DON mmol N m~3 0.07 3.9$
Ammonium mmol N m~3 0.14 0.49%
Nitrate mmol N m~3 3.24 4.10%
Detritus mmol N m~3 0.06Primary production g C m~2 yr~1 472 459%
Export of primary production g C m~2 yr~1 287 370&
Phytoplankton nitrate uptake mmol NO3
m~3 d~1 1.48 0.79'
Phytoplankton ammonium uptake mmol NH4
m~3 d~1 0.23 0.23)
Zooplankton grazing phytoplankton mmol N m~3 d~1 0.50 0.48+ 0.11+
Export of detritus mol N m~2 yr~1 0.51 1.08& 0.18&
Productivity index mg C mg Chl~1 d~1 31 28%
!Mean value from Monterey Bay stations H3 and Mooring M1 and mmol N : mg Chl a ratio of 1 (Eppleyet al., 1992)."Acoustic estimated mean biomass for Monterey Bay (Chavez, unpublished).#Mean biomass from #ow cytometry (Buck et al., 1996), 20 fg C per bacterium (Fuhrman, 1981), and 3 : 1
C : N ratio (Antia et al., 1991).$One single value for 10 m reported for Monterey Bay by Hansell (1993).%Mean value from Monterey Bay stations H3 and Mooring M1.&From sediment traps in Monterey Bay; A) from euphotic zone, B) at 450 m (Pilskaln et al., 1996).'15N uptakes and Model (Kudela and Chavez, 2000).)15N uptakes from Monterey Bay (Kudela and Dugdale, 2000).+From zooplankton mean biomass estimated with acoustics (Chavez unpublished) and a maximum
consumption/biomass ratio of (A) 0.86 d~1 for small copepods calculated from values for Peru upwellingsystem (Dagg et al., 1980), and (B) 0.2 d~1 for euphausiids of the Benguela current (Stuart, 1986).
the start of the upwelling season and lower ones for the late summer months (Fig. 7A).Winter values were around 500 mgC m~2 d~1 and increased quickly between YD 61and 92, with the intensi"cation of upwelling and reduction of MLD, and thendecreased with the reduction in upwelling.
In the model, the water upwelled contained no phytoplankton. Thus, for eachparcel of water upwelled into the mixed layer an equal volume of water withphytoplankton was removed. This process is analogous to net horizontal advection,and was used to estimate the amount of PP exported horizontally. Upwelling drovean o!shore export of 3.61 mol N m~2 yr~1 or 287 gC m~2 yr~1 of PP. During up-welling the o!shore export was between about 10 and 35 mmol N m~2 d~1 or 800and 2780 mgC m~2 d~1, and was much larger than the export of detritus from thesystem (Fig. 8A). During non-upwelling conditions, the export of PP and detritus weresimilar.
The MB model estimated a phytoplankton concentration (P) of between 1 and2 mmol N m~3 for the start of the year (Fig. 9A). P increased quickly to around7}9 mmol N m~3 early in the upwelling season, just after YD 92, and remained
R.A. Olivieri, F.P. Chavez / Deep-Sea Research II 47 (2000) 1077}1106 1091
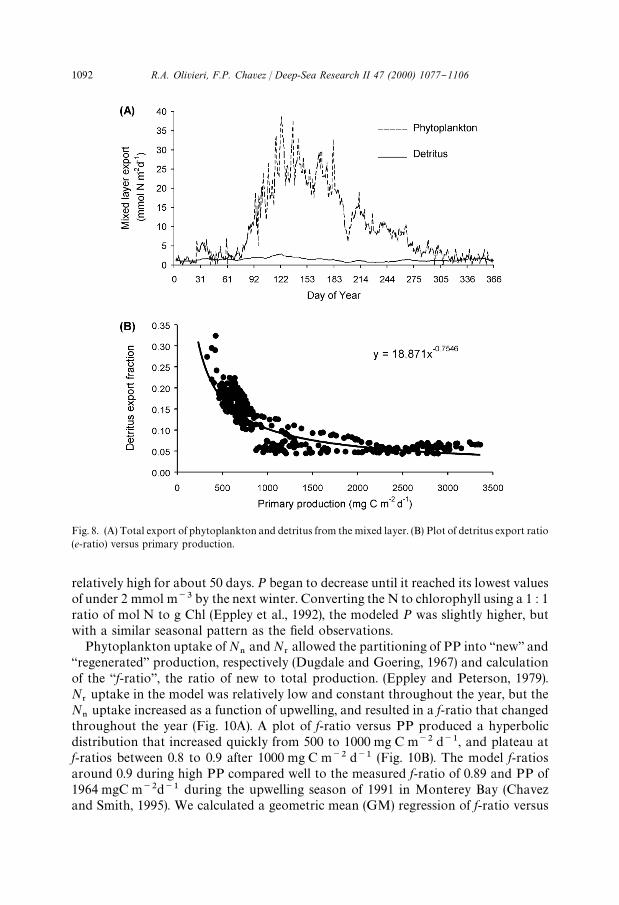
Fig. 8. (A) Total export of phytoplankton and detritus from the mixed layer. (B) Plot of detritus export ratio(e-ratio) versus primary production.
relatively high for about 50 days. P began to decrease until it reached its lowest valuesof under 2 mmol m~3 by the next winter. Converting the N to chlorophyll using a 1 : 1ratio of mol N to g Chl (Eppley et al., 1992), the modeled P was slightly higher, butwith a similar seasonal pattern as the "eld observations.
Phytoplankton uptake of N/
and N3allowed the partitioning of PP into `newa and
`regenerateda production, respectively (Dugdale and Goering, 1967) and calculationof the `f-ratioa, the ratio of new to total production. (Eppley and Peterson, 1979).N
3uptake in the model was relatively low and constant throughout the year, but the
N/
uptake increased as a function of upwelling, and resulted in a f-ratio that changedthroughout the year (Fig. 10A). A plot of f-ratio versus PP produced a hyperbolicdistribution that increased quickly from 500 to 1000 mg C m~2 d~1, and plateau atf-ratios between 0.8 to 0.9 after 1000 mg C m~2 d~1 (Fig. 10B). The model f-ratiosaround 0.9 during high PP compared well to the measured f-ratio of 0.89 and PP of1964 mgC m~2d~1 during the upwelling season of 1991 in Monterey Bay (Chavezand Smith, 1995). We calculated a geometric mean (GM) regression of f-ratio versus
1092 R.A. Olivieri, F.P. Chavez / Deep-Sea Research II 47 (2000) 1077}1106
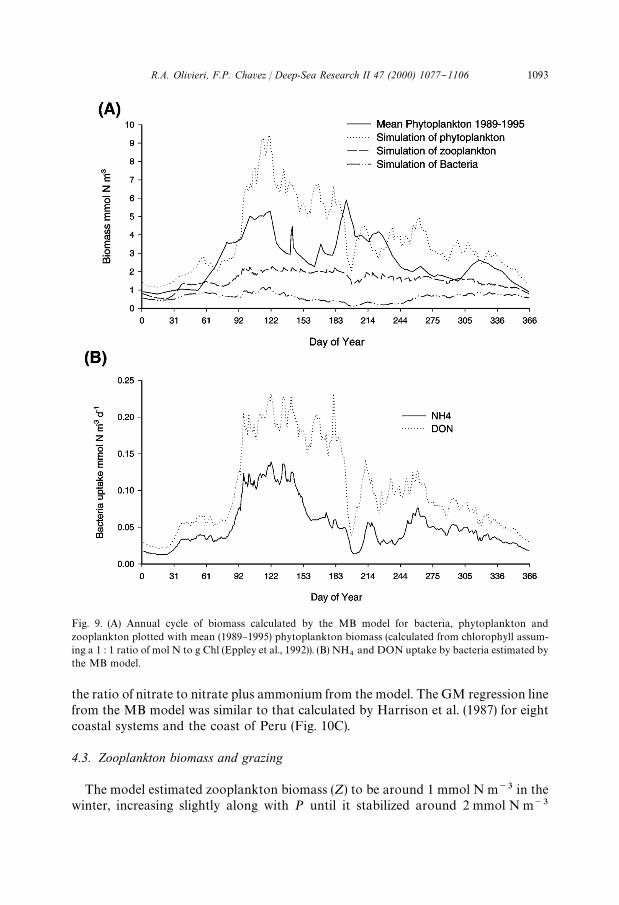
Fig. 9. (A) Annual cycle of biomass calculated by the MB model for bacteria, phytoplankton andzooplankton plotted with mean (1989}1995) phytoplankton biomass (calculated from chlorophyll assum-ing a 1 : 1 ratio of mol N to g Chl (Eppley et al., 1992)). (B) NH
4and DON uptake by bacteria estimated by
the MB model.
the ratio of nitrate to nitrate plus ammonium from the model. The GM regression linefrom the MB model was similar to that calculated by Harrison et al. (1987) for eightcoastal systems and the coast of Peru (Fig. 10C).
4.3. Zooplankton biomass and grazing
The model estimated zooplankton biomass (Z) to be around 1 mmol N m~3 in thewinter, increasing slightly along with P until it stabilized around 2 mmol N m~3
R.A. Olivieri, F.P. Chavez / Deep-Sea Research II 47 (2000) 1077}1106 1093
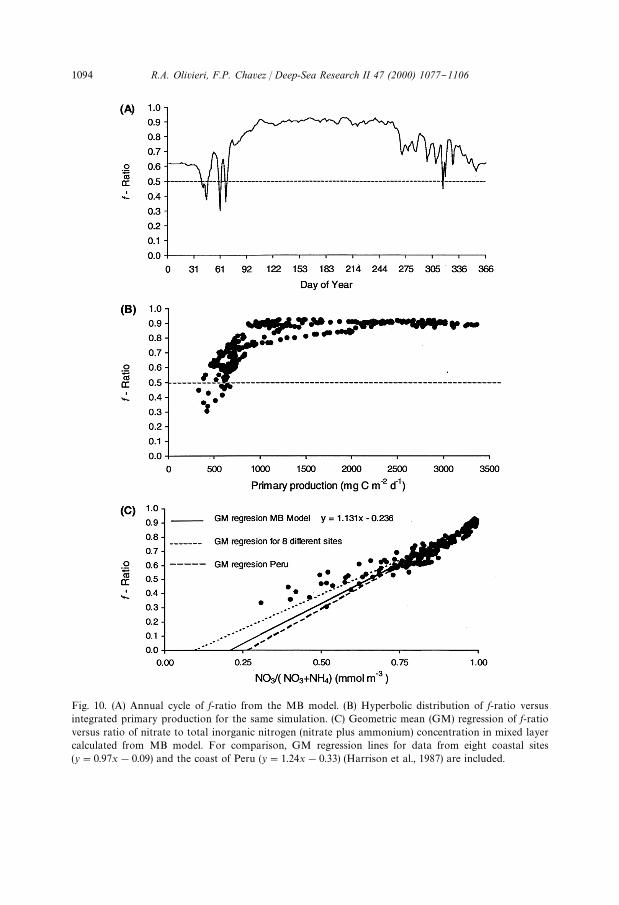
Fig. 10. (A) Annual cycle of f-ratio from the MB model. (B) Hyperbolic distribution of f-ratio versusintegrated primary production for the same simulation. (C) Geometric mean (GM) regression of f-ratioversus ratio of nitrate to total inorganic nitrogen (nitrate plus ammonium) concentration in mixed layercalculated from MB model. For comparison, GM regression lines for data from eight coastal sites(y"0.97x!0.09) and the coast of Peru (y"1.24x!0.33) (Harrison et al., 1987) are included.
1094 R.A. Olivieri, F.P. Chavez / Deep-Sea Research II 47 (2000) 1077}1106
(Fig. 9A). Silver and Davoll (1975,1976,1977) collected zooplankton sampleswith a 330 lm net at a station located a few kilometers north of M1. Theyreported their values in displacement volumes (ml 1000 m~3). We convertedthese to mmol N m~3 assuming 1 ml of sample equal to 1 g wet-weight (Ahlstromand Thrailkill, 1963), 0.052 gC per g wet weight (Frost, 1987) and C : N mole ratio of6.3 (Parsons et al., 1984). The lowest estimates of Z were about twice as the high asthose of Silver and Davoll (1975,1976,1977). The annual mean Z was higher butsimilar in magnitude to the values estimated from acoustic data in Monterey Bay(Table 4).
Zooplankton in the model grazed a phytoplankton biomass of 2.0 mol N m~2 yr~1
or 162 gC m~2 yr~1. Bacterial biomass grazed by zooplankton was (0.06 molN m~2 yr~1, or (3% of the phytoplankton biomass. The low detritus concentration(about an order of magnitude lower than that of bacteria) resulted in a negligibleingestion of detritus (fecal pellets) by zooplankton.
4.4. Bacteria
Bacterial counts were available from #ow cytometry samples from Monterey Bayand were converted to biomass in mmol N m~3, using 20 fgC per bacterium (Fuhr-man et al., 1989) and a C : N mol ratio of 3 : 1 (Antia et al., 1991). The bacterialbiomass (B) from the model was slightly lower than the biomass estimated by #owcytometry (Table 4). The standing stock of bacteria did not #uctuate greatly over thecourse of the year (Fig. 9A). Highest bacterial integrated biomass was observed duringwinter months, and lowest was from the end of upwelling and start of the oceanicperiod. These #uctuations in standing stock numbers were presumably a consequenceof the change in MLD throughout the year.
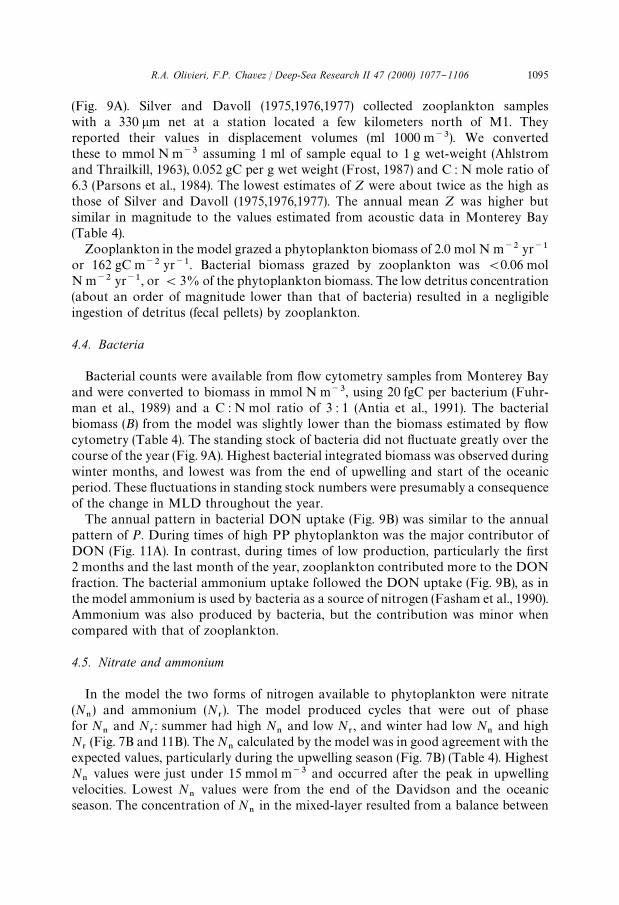
The annual pattern in bacterial DON uptake (Fig. 9B) was similar to the annualpattern of P. During times of high PP phytoplankton was the major contributor ofDON (Fig. 11A). In contrast, during times of low production, particularly the "rst2 months and the last month of the year, zooplankton contributed more to the DONfraction. The bacterial ammonium uptake followed the DON uptake (Fig. 9B), as inthe model ammonium is used by bacteria as a source of nitrogen (Fasham et al., 1990).Ammonium was also produced by bacteria, but the contribution was minor whencompared with that of zooplankton.
4.5. Nitrate and ammonium
In the model the two forms of nitrogen available to phytoplankton were nitrate(N
/) and ammonium (N
3). The model produced cycles that were out of phase
for N/
and N3: summer had high N
/and low N
3, and winter had low N
/and high
N3(Fig. 7B and 11B). The N
/calculated by the model was in good agreement with the
expected values, particularly during the upwelling season (Fig. 7B) (Table 4). HighestN
/values were just under 15 mmol m~3 and occurred after the peak in upwelling
velocities. Lowest N/
values were from the end of the Davidson and the oceanicseason. The concentration of N
/in the mixed-layer resulted from a balance between
R.A. Olivieri, F.P. Chavez / Deep-Sea Research II 47 (2000) 1077}1106 1095
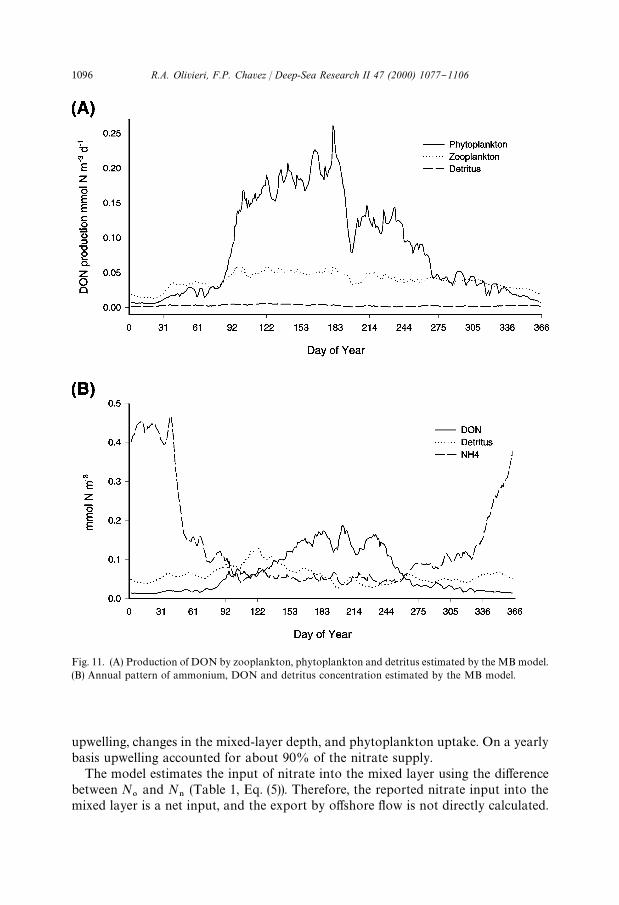
Fig. 11. (A) Production of DON by zooplankton, phytoplankton and detritus estimated by the MB model.(B) Annual pattern of ammonium, DON and detritus concentration estimated by the MB model.
upwelling, changes in the mixed-layer depth, and phytoplankton uptake. On a yearlybasis upwelling accounted for about 90% of the nitrate supply.
The model estimates the input of nitrate into the mixed layer using the di!erencebetween N
0and N
/(Table 1, Eq. (5)). Therefore, the reported nitrate input into the
mixed layer is a net input, and the export by o!shore #ow is not directly calculated.
1096 R.A. Olivieri, F.P. Chavez / Deep-Sea Research II 47 (2000) 1077}1106
However, the o!shore nitrate #ow can be calculated as N/
times the upwellingvelocity. The calculated annual o!shore export of nitrate was 3.63 mol N m~2 yr~1
and 41% of the annual nitrate supply.The supply of nitrate resulting from changes in mixed-layer depth was limited to
winter when the mixed-layer depth increases (Fig. 3C). On an annual basis thiscontribution was less than 10%. However, the increase in mixed-layer depth is duringperiods of weaker upwelling; therefore when it occurs, it is the dominant source of newnitrogen.
N3
concentration calculated by the model was low during most of the year, andreached its highest values of 0.45 mmol m~3 during winter (Davidson period)(Fig. 11B). Comparison between observed and model values (Table 4) suggest that themodel underestimates this property. Low N
3, at or below 0.1 mmol m~3 for most of
the year, had the e!ect of controlling Q, the phytoplankton nitrogen-dependentgrowth function. According to Eq. (11), under optimal nutrient conditions the max-imum value of Q, approaches 2. In the model the highest Q values were under 1.
4.6. Detritus and DON
The detritus (D) and DON fractions in the model are byproducts from othercompartments. D originated from the non-assimilated fraction (b) of the zooplanktongrazing (which equates to fecal pellet production). DON originates from zooplanktonexcretion that is not ammonium (1!e), the breakdown of detritus (k
4), and the
exudation fraction (c) of phytoplankton production (Fasham et al., 1990).The annual pattern in D concentration shows highest values during upwelling, but
the changes are extremely small and parallel to those of zooplankton (Fig. 11B).A larger di!erence was found when the mixed-layer depth integrated D values werecompared. The highest values were associated with winter (Davidson), while thelowest values occurred at the end of upwelling during the summer. There was,therefore, no correlation between PP and detritus #ux.
On an annual basis the model predicts a detritus #ux out of the mixed layer ofabout 9% of PP. Pilskaln et al. (1996) reported values of 18% PP #ux for the base ofthe euphotic zone, and 3% measured #ux at 450 m. The detritus sinking rate wasalways greater than the upwelling velocity, so detritus was not exported horizontallybut sank locally. In the model the e-ratio, or ratio of detritus export to totalproduction approximates a negative power function, with higher relative exportduring low PP, and low relative ratios at higher PP (Fig. 8B). The MB modelpredicted DON concentrations at least an order of magnitude lower than expected(Hansell, 1993). The annual DON cycle was similar to that reported for other coastalsystems where the maximum values for dissolved organic matter tend to occur duringlate summer (Williams, 1995). The MB model predicted the DON peak later in theyear than the peak of D (Fig. 11B). Highest DON concentrations were associated withthe cessation of upwelling, and they were about 10 times as high as those from winter.The highest DON concentrations were associated with times of shallow MLD.Highest DON values integrated over the mixed layer were about 4 times greater thanthe lowest ones.
R.A. Olivieri, F.P. Chavez / Deep-Sea Research II 47 (2000) 1077}1106 1097
5. Discussion
The FDM model was modi"ed and used to simulate the annual cycle of integratedPP and nitrate concentration for the mixed layer of Monterey Bay (Fig. 7A). It alsoproduced results for phytoplankton, zooplankton and bacterial biomass that weresimilar to the observations. Ammonium concentration was apparently under-estimated, and DON was about an order of magnitude lower than the few observa-tions. Several other rate parameters were similar to those measured in Monterey Bayor reported in the literature (Table 4).
Construction of the MB model required few changes from the original equationsused in FDM suggesting that FDM may be a good representation of a generic pelagicecosystem. Changes were required in the basic physics (and therefore nutrient supply)to account for the upwelling process. Model parameters were adjusted to account forthis process (i.e., phytoplankton sinking) and for the resulting food web structure(diatom-dominated versus microbial loop). The use of a quadratic zooplanktonmortality function (Steele and Henderson, 1981) was important. It removed cyclicoscillations in phytoplankton biomass and production under nutrient rich conditions(Steele and Henderson, 1992) by decoupling phytoplankton and zooplankton growth(i.e., diatom}macrozooplankton versus microbial loop). The quadratic mortality is inessence the consumption of zooplankton by higher predators. It becomes importantat high zooplankton concentrations and places a cap on these populations.
The FDM model has now been applied with some success to open-ocean oligo-trophic environments (Fasham et al., 1990), the mesotrophic equatorial Paci"c(Toggweiler and Carson, 1995), the open-ocean North Atlantic (Sarmiento et al., 1993),with some slight modi"cations to the subarctic Paci"c and Atlantic oceans (Fasham,1995), and in this contribution to an eutrophic coastal upwelling system. The implica-tion is that one core pelagic ecosystem model can be used for global simulations.Previous e!orts dealt primarily with ecosystems that were microbial-loop-dominated;our contribution has shown that it can also be applied to a coastal diatom-dominatedsystem. The challenge for global modelers will be to "nd (in their models) the physical(or chemical) processes that lead to these two very di!erent pelagic ecosystems(Chavez and Smith, 1995).
Current ecosystem modeling e!orts are incorporating additional phytoplanktonand zooplankton compartments in an e!ort to simulate the occurrence of thesedi!erent ecosystems. The next level of complexity has two size classes of phytoplan-kton, one composed of small single-celled phytoplankton like Synechococcus, and theother of larger phytoplankton like diatoms. Two size classes of zooplankton, onecomposed of microzooplankton-like ciliates and the other of meso-and macrozoo-plankton, like copepods and euphausiids, are also required. The microzooplanktongraze primarily on the small single-celled phytoplankton and bacteria, whilethe mesozooplankton primarily consume netphytoplankton, microzooplankton anddetritus. A drawback to increasing the number of boxes is that the connections or#ows increase nonlinearly and therefore the model becomes more complex anddi$cult to balance. If it is primarily an either/or scenario (diatom}mesozooplanktonversus picoplankton}microzooplankton), then regulating the grazing term, in space or
1098 R.A. Olivieri, F.P. Chavez / Deep-Sea Research II 47 (2000) 1077}1106
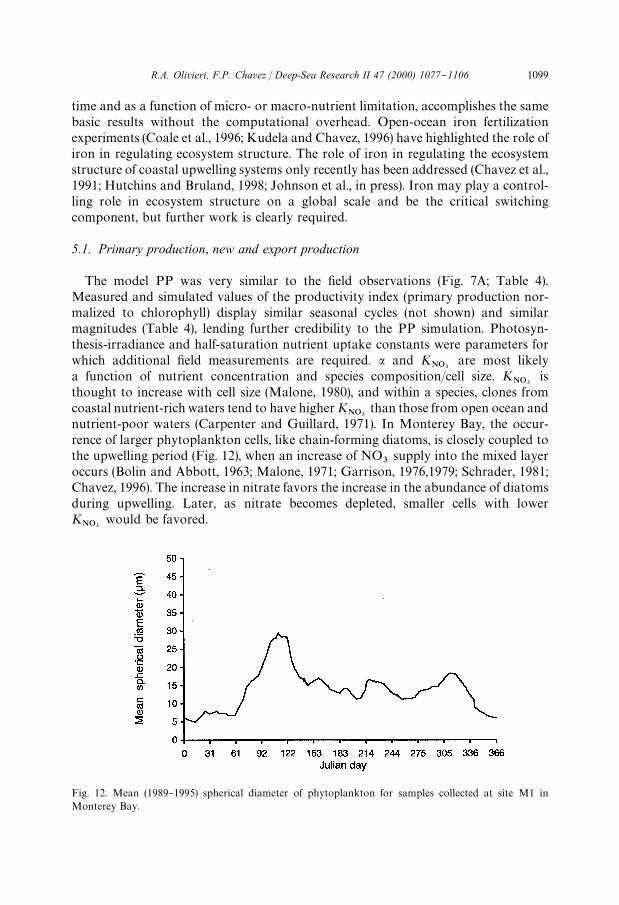
Fig. 12. Mean (1989}1995) spherical diameter of phytoplankton for samples collected at site M1 inMonterey Bay.
time and as a function of micro- or macro-nutrient limitation, accomplishes the samebasic results without the computational overhead. Open-ocean iron fertilizationexperiments (Coale et al., 1996; Kudela and Chavez, 1996) have highlighted the role ofiron in regulating ecosystem structure. The role of iron in regulating the ecosystemstructure of coastal upwelling systems only recently has been addressed (Chavez et al.,1991; Hutchins and Bruland, 1998; Johnson et al., in press). Iron may play a control-ling role in ecosystem structure on a global scale and be the critical switchingcomponent, but further work is clearly required.
5.1. Primary production, new and export production
The model PP was very similar to the "eld observations (Fig. 7A; Table 4).Measured and simulated values of the productivity index (primary production nor-malized to chlorophyll) display similar seasonal cycles (not shown) and similarmagnitudes (Table 4), lending further credibility to the PP simulation. Photosyn-thesis-irradiance and half-saturation nutrient uptake constants were parameters forwhich additional "eld measurements are required. a and K
NO3are most likely
a function of nutrient concentration and species composition/cell size. KNO3
isthought to increase with cell size (Malone, 1980), and within a species, clones fromcoastal nutrient-rich waters tend to have higher K
NO3than those from open ocean and
nutrient-poor waters (Carpenter and Guillard, 1971). In Monterey Bay, the occur-rence of larger phytoplankton cells, like chain-forming diatoms, is closely coupled tothe upwelling period (Fig. 12), when an increase of NO
3supply into the mixed layer
occurs (Bolin and Abbott, 1963; Malone, 1971; Garrison, 1976,1979; Schrader, 1981;Chavez, 1996). The increase in nitrate favors the increase in the abundance of diatomsduring upwelling. Later, as nitrate becomes depleted, smaller cells with lowerK
NO3would be favored.
R.A. Olivieri, F.P. Chavez / Deep-Sea Research II 47 (2000) 1077}1106 1099
The model calculated an annual f-ratio of 0.84, with a new production of5 mol N m~2 yr~1 or 400 g C m~2 yr~1. The model f-ratios of 0.9 during upwellinghigh PP are supported by "eld values from Monterey Bay (Chavez and Smith,1995; White and Dugdale, 1997). f-ratios higher than 0.5 are typical of coastalupwelling systems dominated by diatoms (Hutchings et al., 1995). The model com-puted the f-ratio as the uptake of nitrate versus the uptake of nitrate and ammonium,comparable to f-ratios calculated with 15N uptake experiments. Nitrate uptake isa measure of new production (Dugdale and Goering, 1967), and therefore of thecarbon that should be exported vertically under steady state (Eppley and Peterson,1979). Our estimates of detritus export (fecal pellets and comparable to what a sedi-ment trap might catch) and the e-ratio (detritus export divided by PP) are signi"cantlydi!erent than new production and the f-ratio (Figs. 8B and 10B). The e-ratio versusPP scatter plot (Fig. 8B) is similar to that measured by moored (Pilskaln et al., 1996)and #oating sediment traps (J. Newton, personal communication). The model resultspresented here are consistent with the observations, both of which show the lack ofa strong, positive correlation between PP and export in this highly productiveenvironment.
How do we explain the apparent paradox of new and export production? In the MBmodel, a large fraction of the PP was unused within the mixed layer and exportedhorizontally as ungrazed phytoplankton cells (Fig. 8A). The upwelling circulationdrove this horizontal export (which accounted for most if not all of the ungrazed PPexport). Similar mechanisms were invoked by Chavez (1996) to explain observationsof PP and nutrients during the 1992 El Nin8 o and by Pilskaln et al. (1996) toexplain the e-ratio trend determined from POC #ux and PP measurements. Theconcept of a one-dimensional biological pump is clearly not appropriate for theMB coastal upwelling system (Silver et al., 1998; Service et al., 1998) where thereis a space and time uncoupling between sources (nutrients, new production) andsinks (vertical export). Recent modeling and experimental research in the open-ocean upwelling system of the equatorial Paci"c also show that horizontaladvection of new production needs to be considered to balance the productionbudget (Landry et al., 1997; Loukos et al., 1998). The model results show thatnitrate uptake and carbon export are only equivalent when considered over appropri-ate temporal and spatial scales (Eppley, 1989; Legendre and Gosselin, 1989).Further work is required to de"ne these scales for the coastal upwelling systemof MB.
5.2. Nitrate and ammonium
The model simulated the observed nitrate concentration (N/) accurately. N
/is
a function of physical supply and phytoplankton uptake. Physical supply is a functionof upwelling velocities, SST, thermocline strength, and change in mixed-layer depth.SST and thermocline strength were used to estimate nitrate concentration (N
0) below
the mixed layer. For future simulations N0should come from (moored) measurements
of temperature or nitrate from below the mixed layer. The calculated horizontalnitrate export was 40% of the physical supply, highlighting the importance of
1100 R.A. Olivieri, F.P. Chavez / Deep-Sea Research II 47 (2000) 1077}1106
upwelling as a source of nutrients (and production) for o!shore communities (Chavez,1996).
The climatological ammonium data set is small, and we know little about theregeneration terms. The zooplankton component, which is the primary source ofammonium, is also one of the least understood. We have not considered the supply ofammonium to the mixed layer by upwelling or mixing. Grazing and excretion occur inthe upper waters of the mesopelagic zone, both in and below the mixed layer.
5.3. DON
The accurate measurement of DON in the ocean has been surrounded by contro-versy (Hansell et al., 1993; Bronk et al., 1994; Williams, 1995). Based on the values ofHansell (1993) and Kudela (pers. comm.) the model underestimated surface DONconcentrations by an order of magnitude. However, this might be associated withdi!erences between measured (refractory) and modeled (labile) pools of DON. In themodel the total annual DON production by phytoplankton was much larger than theDON produced by zooplankton (Fig. 11A). However, at times of low primaryproduction the zooplankton DON contribution was larger than the phytoplanktoncontribution.
5.4. Zooplankton
One of the few multi-year zooplankton programs for Monterey Bay was that bySilver and Davoll (1975,1976,1977). This program collected samples with a 330 lmnet. This net misses a signi"cant fraction of the zooplankton community (Hopcroftet al., 1999). In the model, phytoplankton was the zooplankton main food source,bacteria was a distant second, and detritus (coprophagy) was a negligible fraction.Further studies of this component are required and e!orts to correct the paucity ofzooplankton data in this region are currently underway (Hopcroft et al., 1999;GLOBEC report 17, 1996).
5.5. General conclusions
The model reproduces the observed integrated primary production, phytoplanktonbiomass and nitrate concentrations within the mixed layer of the coastal upwellingsystem of Monterey Bay. The model also estimates the #ows between the compart-ments of the planktonic ecosystem. The #ows describe the dynamics of the systembetter than biomass, and facilitate comparison with other ecosystems (Ulanowicz,1986). The results of the model con"rm the major role of upwelling as a physical forcedriving the primary production cycle. This role is not limited to setting the magnitudeand pattern of nitrate supply, but is also important in terms of horizontal advection ofnutrients and phytoplankton out of the system.
The success of our modeling e!ort is due in part to the relative wealth of measuredinput and validation parameters available for the region. Time series, like those atBermuda, Hawaii and Monterey Bay, are recognized as valuable when they are
R.A. Olivieri, F.P. Chavez / Deep-Sea Research II 47 (2000) 1077}1106 1101
needed, but on a day-to-day basis often appear routine. These e!orts are resourceintensive and hence they are often ignored or given low priority for funding. However,they provide essential background information for process studies, are needed fordetecting seasonal, interannual and long term trends, and for modeling.
Finally, ecosystem models will be needed to explore relationships between long-term variations in ocean physics (White et al., 1997), biogeochemical cycling and"sheries (GLOBEC report 17, 1996). A logical step is to incorporate an NPZ modelinto the improving three-dimensional physical models of the northeast Paci"c. TheMB model (or a derivative), embedded in a general circulation model of the northeastPaci"c, could be used to investigate El Nin8 o e!ects, the dramatic ecosystem changesthat have taken place in the mid-1970's (Roemmich and McGowan, 1995) as well asthe response of the ecosystem to climate change.
Acknowledgements
We gratefully acknowledge the "nancial support of the David and Lucile PackardFoundation. Reiko Michisaki and Steve Lowder provided exceptional technicalsupport.
References
Ahlstrom, E.H., Thrailkill, J.R., 1963. Plankton volume loss with time of preservation. CaliforniaCooperative Oceanic Fisheries Investigations Report 9, 57}73.
Antia, N.J., Harrison, P.J., Oliveira, L., 1991. The role of dissolved organic nitrogen in phytoplanktonnutrition, cell biology and ecology. Phycologia 30, 1}89.
Bannister, T.J., 1974. A general model of steady state phytoplankton growth in a nutrient saturated mixedlayer. Limnology and Oceanography 19, 13}30.
Barber, R.T., Smith, R.L., 1981a. Coastal upwelling ecosystems. In: Longhurst, A.R. (Ed.), Analysis ofMarine Ecosystems. Academic Press, New York, pp. 31}68.
Barber, R.T., Smith Jr., W.O., 1981b. The role of circulation, sinking, and vertical migration in physicalsorting of phytoplankton in the upwelling center at 153S. In: Richards, F.A. (Ed.), Coastal Upwelling.American Geophysical Union, Washington DC, pp. 366}371.
Berges, J.A., Cochlan, W.P., Harrison, P.J., 1995. Laboratory and "eld responses of algal nitrate reductaseto diel periodicity in irradiance, nitrate exhaustion, and the presence of ammonium. Marine EcologyProgress Series 124, 259}269.
Berger, W.H., Smetacek, V.S., Wefer, G., 1989. Ocean productivity and paleoproductivity* An overview.In: Berger, W.H., Smetacek, V.S., Wefer, G. (Eds.), Productivity of the Oceans: Present and Past. Wiley,Chichester, pp. 1}34.
Bienfang, P.K., Harrison, P.J., 1984. Sinking-rate response of natural assemblages of temperate andsubtropical phytoplankton to nutrient depletion. Marine Biology 83, 293}300.
Bolin, R.L., Abbott, D.P., 1963. Studies on the marine climate and phytoplankton of the central coastal areaof California, 1954}1960. California Cooperative Oceanic Fisheries Investigations Report 9, 23}45.
Breaker, L.C., Broenkow, W.W., 1994. The circulation of Monterey Bay and related processes. Oceanogra-phy and Marine Biology: an Annual Review 32, 1}64.
Bronk, D.A., Glibert, P.M., Ward, B.B., 1994. Nitrogen uptake, dissolved organic nitrogen release, and newproduction. Science 265, 1843}1846.
1102 R.A. Olivieri, F.P. Chavez / Deep-Sea Research II 47 (2000) 1077}1106
Buck, K.R., Chavez, F.P., Campbell, L., 1996. Basin-wide distributions of living carbon components and theinverted trophic pyramid of the Central Gyre of the North Atlantic Ocean, Summer 1993. AquaticMicrobial Ecology 10, 283}298.
Carpenter, E.J., Guillard, R.L., 1971. Intraspeci"c di!erences in nitrate half-saturation constants for threespecies of marine phytoplankton. Ecology 52, 183}185.
Chavez, F.P., 1996. Forcing and biological impact of onset of the 1992 El Nin8 o in central California.Geophysical Research Letters 23, 265}268.
Chavez, F.P., Barber, R.T., 1987. An estimate of new production in the equatorial Paci"c. Deep-SeaResearch 34, 1229}1243.
Chavez, F.P., Smith, S.L., 1995. Biological and chemical consequences of open ocean upwelling. In:Summerhayes, C.P., Emeis, K.C., Angel, M.V., Smith, R.L., Zeitzschel, B. (Eds.), Upwelling in theOceans: Modern Processes and Ancient records. Wiley, Chichester, pp. 149}169.
Chavez, F.P., Toggweiler, J.R., 1995. Physical estimates of global new production: the upwelling contribu-tion. In: Summerhayes, C.P., Emeis, K.C., Angel, M.V., Smith, R.L., Zeitzschel, B. (Eds.), Upwelling inthe Oceans: Modern Processes and Ancient Records. Wiley, Chichester, pp. 313}320.
Chavez, F.P., Barber, R.T., Huyer, A., Kosro, P.M., Ramp, S.R., Stanton, T., Rojas de Mendiola, B., 1991.Horizontal advection and the distribution of nutrients in the coastal transition zone o! northernCalifornia: e!ects on primary production, phytoplankton biomass and species composition. Journal ofGeophysical Research 96, 14833}14848.
Chavez, F.P., Pennington, J.T., Herlien, R., Jannasch, H., Thurmond, G., Friederich, G.E., 1997. Mooringsand drifters for real-time interdisciplinary oceanography. Journal of Atmospheric and Oceanic Techno-logy 14, 1199}1211.
Clarke, G.L., Denton, E.J., 1962. Light and animal life. The Sea, Ideas and Observations on Progress in theStudy of the Seas 1, 456}468.
Coale, K.H., Johnson, K.S., Fitzwater, S.E., Gordon, R.M., Tanner, S., Chavez, F.P., Ferioli, L., Sakamoto,C., Rogers, P., Millero, F., Steinberg, P., Nightingale, P., Cooper, D., Cochlan, W., Landry, M.,Constantinou, J., Rollwagen, G., Transvina, A., Kudela, R., 1996. A massive phytoplankton bloominduced by an ecosystem-scale iron fertilization experiment in the equatorial Paci"c Ocean. Nature 383,495}501.
Dagg, M., Cowles, T., Whitledge, T., Smith, S., Howe, S., Judkins, D., 1980. Grazing and excretion byzooplankton in the Peru upwelling system during April 1977. Deep-Sea Research, 27A.
Dickey, T.D, 1991. The emergence of concurrent high-resolution physical and bio-optical measurements inthe upper ocean and their applications. Reviews of Geophysics 29, 383}413.
Dortch, Q., 1990. The interaction between ammonium and nitrate uptake in phytoplankton. MarineEcology Progress Series 61, 183}201.
Dugdale, R.C., Goering, J.J., 1967. Uptake of new and regenerated forms of nitrogen in primary production.Limnology and Oceanography 12, 196}206.
Eppley, R.W., 1972. Temperature and phytoplankton growth in the sea. Fisheries Bulletin 70,1063}1085.
Eppley, R.W., 1989. New production: History, methods, problems. In: Berger, W.H., Smetacek, V.S., Wefer,G. (Eds.), Productivity of the Oceans: Present and Past. Wiley, Chichester, pp. 85}89.
Eppley, R.W., Peterson, B.J., 1979. Particulate organic matter #ux and planktonic new production in thedeep ocean. Nature 282, 677}680.
Eppley, R.W., Chavez, F.P., Barber, R.T., 1992. Standing stocks of particulate carbon and nitrogen in theEquatorial Paci"c. Journal Geophysical Research 97, 655}661.
Fasham, M.J.R., 1995. Variations in the seasonal cycle of biological production in subarctic oceans: a modelsensitivity analysis. Deep-Sea Research 42, 1111}1149.
Fasham, M.J.R., Ducklow, H.W., McKelvie, S.M., 1990. A nitrogen-based model of the plankton dynamicsin the ocean mixed layer. Journal of Marine Research 48, 591}639.
Fleming, R.H., 1939. The control of diatom populations by grazing. Conseil Perm. Internat. p. l'Explor. dela Mer, Jour. du Conseil 14, 210}227.
Frost, B.W., 1987. Grazing control of phytoplankton stock in the open subarctic Paci"c Ocean: a modelassessing the role of mesozooplankton, particularly the large calanoid copepods Neocalanus spp.Marine Ecology Progress Series 39, 49}68.
R.A. Olivieri, F.P. Chavez / Deep-Sea Research II 47 (2000) 1077}1106 1103
Fuhrman, J.A., 1981. Patterns of bacterioplankton growth in the sea. xii, 110 leaves.Fuhrman, J.A., Sleeter, T.D., Carlson, C.A., Proctor, L., 1989. Dominance of bacteria biomass in the
Sargasso Sea and its ecological implications. Marine Ecology Progress Series 57, 207}217.Garrison, D.L., 1976. Contributions of the net plankton and nanoplankton to the standing stocks and
primary productivity in Monterey Bay, California during the upwelling season. Fishery Bulletin 74,183}194.
Garrison, D.L., 1979. Monterey Bay phytoplankton I. Seasonal cycles of phytoplankton assemblages.Journal of Plankton Research 1, 241}265.
GLOBEC Report No. 17 (1996) US GLOBEC Northeast Paci"c Implementation Plan US Global OceanEcosystems Dynamics. December 1996, Berkeley, 60 pp.
Goldman, J.C., 1988. Spatial and temporal discontinuities of biological processes in pelagic surface waters.In: Rothschild, B.J. (Ed.), Toward a Theory on Biological-Physical Interactions in the World Oceans.Kluwer Academic Publishers, Dordrecht, pp. 273}296.
Haney, J.D., Jackson, G.A., 1996. Modeling phytoplankton growth. Journal of Plankton Research 18,63}85.
Hansell, D.A., 1993. Results and observations from the measurement of DOC and DON in seawater usinga high-temperature catalytic oxidation techniques. Marine Chemistry 41, 195}202.
Hansell, D.A., Williams, P.M., Ward, B.B., 1993. Measurements of doc and don in the Southern CaliforniaBight using oxidation by high temperature combustion. Deep-Sea Research Part I 40, 219}234.
Harrison, W.G., Platt, T., Lewis, M.R., 1987. f-Ratio and its relationship tp ambient nitrate concentration incoastal waters. Journal of Plankton Research 9, 235}248.
Harrison, W.G., Platt, T., Calientes, R., Ochoa, N., 1981. Photosynthetic parameters and primary produc-tion of phytoplankton populations o! the northern coast of Peru. In: Richards, F.A. (Ed.), CoastalUpwelling. American Geophysical Union, Washington, DC, pp. 303}311.
Hopcroft, R., Lombard, D.R., Chavez, F.P., 1999. The signi"cance of small copepods o! central California.ASLO Navigating into the Next Century, pp. 88.
Husby, D.M., Nelson, C.S., 1982. Turbulence and vertical stability in the California current. CaliforniaCooperative Oceanic Fisheries Investigations Report 23, 113}129.
Hutchins, D.A., Bruland, K.W., 1998. Iron-limited diatom growth and Si : N uptake ratios in a coastalupwelling regime. Nature 393, 561}564.
Hutchings, L., Pitcher, G.C., Probyn, T.A., Bailey, G.W., 1995. The chemical and biological consequence ofcoastal upwelling. In: Summerhayes, C.P., Emeis, K.C., Angel, M.V., Smith, R.L., Zeitzschel, B. (Eds.),Upwelling in the Oceans: Modern Processes and Ancient Records. Wiley, Chichester, pp. 65}81.
Karl, D.M., Lukas, R., 1996. The Hawaii Ocean Time-series (HOT) program: Background, rationale, and"eld implementation. Deep-Sea Research II 43, 129}156.
Kudela, R.M., 1995. Characterization and prediction of planktonic nitrogenous nutrition and new produc-tion in Monterey Bay, California: nutrient and physiological interactions. Ph.D. dissertation, Universityof Southern California, Los Angeles, 326 pp.
Kudela, R.M., Chavez, F.P., 1996. Bio-optical properties in relation to an algal bloom caused by ironenrichment in the equatorial Paci"c. Geophysical Research Letters 23, 3751}3754.
Kudela, R.M., Chavez, F.P., 2000. Modeling the impact of the 1992 El Nin8 o on new production inMonterey Bay, California. Deep-Sea Research II 47, 1055}1076.
Kudela, R.M., Dugdale, R., 2000. Nutrient regulation of phytoplankton productivity in Monterey Bay,California. Deep-Sea Research II 47, 1023}1053.
Landry, M.R., Barber, R.T., Bidigare, R.R., Chai, F., Coale, K.H., Dam, H.G., Lewis, M.R., Lindley, S.T.,McCarthy, J.J., Roman, M.R., Stoeker, D.K., Verity, P.G., White, J.R., 1997. Iron and grazing constrainson primary production in the central equatorial Paci"c: an EQPAC synthesis. Limnology andOceanography 42, 405}418.
Legendre, L., Gosselin, M., 1989. New production and export of organic matter to the deep ocean:consequences of some recent discoveries. Limnology and Oceanography 34, 1374}1380.
Lentz, S.J., 1992. The surface boundary layer in coastal upwelling regions. Journal of Physical Oceanogra-phy 22, 1517}1539.
Loukos, H., Frost, B., Harrison, D.E., Murray, J.W., 1998. An ecosystem model with iron limitation ofprimary production in the equatorial Paci"c at 1403W. Deep-Sea Research II 44, 2221}2249.
1104 R.A. Olivieri, F.P. Chavez / Deep-Sea Research II 47 (2000) 1077}1106
Malone, T.C., 1971. The relative importance of nanoplankton and netplankton as primary producers in theCalifornia Current system. Fisheries Bulletin 69, 799}820.
Malone, T.C., 1980. Algal size, In: Morris, I. (Ed.), The physiological ecology of phytoplankton. Studies inEcology, Vol. 7. University of California Press, Berkeley, CA, pp. 433}463.
Mann, K.H., Lazier, J.R.N., 1991. Dynamics of Marine Ecosystems: Biological}Physical Interactions in theOceans. Blackwell Scienti"c Publictions, London, 466 pp.
Marra, J., Bidigare, R.R., Dickey, T.D., 1990. Nutrient and mixing, chlorophyll and phytoplankton growth.Deep-Sea Research 37, 127}143.
Mason, J.E., Bakun, A., 1986. Upwelling index update, US West coast, 33N}48N latitude. US Department ofCommerce, NOAA Technical Memorandum. NMFS SWFC 67, 81 pp.
Matear, R., 1995. Parameter optimization and analysis of ecosystem models using simulated annealing: a casestudy at station P. Journal of Marine Research 53, 571}607.
McGillicuddy Jr., D.J., Robinson, A.R., McCarthy, J.J., 1995. Couple physical and biological modeling of thespring bloom in the North Atlantic (I): model formulation and one dimensional bloom processes.Deep-Sea Research 42, 1313}1357.
Paduan, J.D., Rosenfeld, L.K., 1996. Remotely sensed surface current in Monterey Bay from shore-based HFradar (Coastal Ocean Dynamics Application Radar). Journal of Geophysical Research 101,20669}20686.
Pennington, J.T., Chavez, F.P., 2000. Seasonal #uctuations of temperature, salinity, nitrate, chlorophyll andprimary production at station H3/M1 over 1989}1996 in Monterey Bay, California. Deep-Sea ResearchII 47, 947}973.
Pilskaln, C.H., Paduan, J.B., Chavez, F.P., Anderson, R.Y., Berelson, W.M., 1996. Carbon export andregeneration in the coastal upwelling system of Monterey Bay, central California. Journal of MarineResearch 54, 1149}1178.
Riley, G.A., 1946. Factors controlling phytoplankton population on Georges Bank. Journal of MarineResearch 6, 54}73.
Roemmich, D., McGowan, J., 1995. Climatic warming and the decline of zooplankton in the CaliforniaCurrent. Science 267, 1324}1326.
Rosenfeld, L., Schwing, F., Gar"eld, N., Tracy, D.E., 1994. Bifurcated #ow from an upwelling center: a coldwater source for Monterey Bay. Continental Shelf Research 14, 931}964.
Ryther, J.H., 1969. Photosynthesis and "sh production in the sea. Science 166, 72}76.Sarmiento, J.L., Slater, R.D., Fasham, M.J.R., Ducklow, H.W., Toggweiler, J.R., Evans, G.T., 1993.
A seasonal three-dimensional ecosystem model of nitrogen cycling in the north Atlantic euphotic zone.Global Biogeochemical Cycles 7, 417}450.
Schrader, G.C., 1981. Seasonal Cycles of Phytoplankton in Relation to the Hydrography of Monterey Bay.California State University and Colleges, Moss Landing Marine Laboratories Technical Publication,81-2. 92 pp.
Service, S.K., Rice, J.A., Chavez, F.P., 1998. Relationship between physical and biological variables duringthe upwelling period in Monterey Bay CA. Deep-Sea Research II 45, 1669}1685.
Siegel, D.A., Michaels, A.F., Sorensen, J.C., O'Brien, M.C., Hammer, M.A., 1995. Seasonal variabilityof light availability and utilization in the Sargasso Sea. Journal Geophysical Research 100, 8695}9713.
Silver, M.W., Davoll, P.J., 1975. California Cooperative Fisheries Investigations, plankton data report,Monterey Bay, July to 1974 July 1975. University of California, Santa Cruz, Coastal Marine Laborat-ory. Technical Report, No. 2. 88 pp.
Silver, M.W, Davoll, P.J., 1976. California Cooperative Fisheries Investigations, plankton data report,Monterey Bay, July 1975 to July 1976. University of California, Santa Cruz, Coastal Marine Laborat-ory. Technical Report, No. 5. 169 pp.
Silver, M.W, Davoll, P.J., 1977. California Cooperative Fisheries Investigations, plankton data report,Monterey Bay, July 1976 to June 1977. University of California, Santa Cruz, Coastal Marine Laborat-ory. Technical Report, No. 8. 95 pp.
Silver, M.W., Coale, S.L., Pilskaln, C.H., Chavez, F.P., 1998. Exploratory observations of marine aggregatesat sub-euphotic depths. Deep-Sea Research II 45, 1839}1861.
Skogsberg, T., 1936. Hydrography of Monterey Bay, California. Thermal conditions, 1929}1933. Transac-tions of the American Philosophical Society 29, 1}152.
R.A. Olivieri, F.P. Chavez / Deep-Sea Research II 47 (2000) 1077}1106 1105
Smith Jr., K.L., 1987. Food energy supply and demand: a discrepancy between particulate organic carbon#ux and sediment community oxygen consumption in the deep ocean. Limnology and Oceanography32, 201}220.
Smith, R.L., 1968. Upwelling. Oceanographic Marine Biology Annual Review, 11}46.Steele, J.H., Henderson, E.W., 1981. A simple plankton model. The American Naturalist 117, 676}691.Steele, J.H., Henderson, E.W., 1992. The role of predation in plankton models. Journal of Plankton
Research 14, 157}172.Stuart, V., 1986. Feeding and metabolism of Euphausia lucens (Euphausiacea) in the southern Benguela
current. Marine Ecology 30, 117}125.Toggweiler, J.R., Carson, S., 1995. What are upwelling systems contributing to the ocean's carbon and
nitrogen budgets?. In: Summerhayes, C.P., Emeis, K.C., Angel, M.V., Smith, R.L., Zeitzschel, B. (Eds.),Upwelling in the Oceans: Modern Processes and Ancient Records. Wiley, Chichester, pp. 337}360.
Ulanowicz, R.E., 1986. Growth and development: Ecosystems phenomenology. Springer, Berlin, 203 pp.Walsh, J.J., 1976. Models of the Sea. In: Cushing, D.H., Walsh, J.J. (Eds.), The ecology of the sea. Saunders,
London, pp. 388}407.White, K.K., Dugdale, R.C., 1997. Silicate and nitrate uptake in the Monterey Bay upwelling system.
Continental Shelf Research 17, 455}472.White, W.B., Lean, J., Cayan, D.R., Dettinger, M.D., 1997. Response of global upper ocean temperature to
changing solar irradiance. Journal of Geophysical Research 102, 3255}3266.Williams, P.J.leB., 1995. Evidence for the seasonal accumulation of carbon-rich dissolved organic material,
its scale in comparison with changes in particulate material and the consequential e!ect on net C/Nassimilation ratios. Marine Chemistry 51, 17}29.
1106 R.A. Olivieri, F.P. Chavez / Deep-Sea Research II 47 (2000) 1077}1106