Embed Size (px)
Citation preview
A Model of Intergenerational Mobility Variation over Time and
Place
Author: Gary Solon
University of Michigan
Abstract Background: A rapidly expanding literature is examining the
empirical association between the incomes of parents and their children. With the acquisition of new data, researchers have begun to explore the ways in which intergenerational income mobility varies over time and between countries.
Purpose: Present a theoretical framework for interpreting the empirical results from this newly emerging literature.
The fisrt question: The paper modifies the Becker-Tomes model of intergenerational
income mobility by rationalizing the log-linear intergenerational income regression commonly estimated by empirical reasearchers.
The steady-state elasticity in the regression is increasing with:• The heritability of income-related traits• The efficacy of human capital inverstment• The earnings return to human capital and to decrease with :• The progressivity of public investment in human capitalThese results provide a simple framework for considering possible
reasons for cross-country differences in intergenerational mobility.
The second question: How intergenerational mobility changes over time?
Example: Should we expect the recent era of increasing earnings inequality has also been an era of decreasing intergenerational mobility?
The author use the model to examine how the intergenerational elasticity changes when the steady state is perturbed by an innovation to either the earnings return to human capital or the progressivity of public inverstment in human capital.
The results suggest: • An increase in the earnings return to human capital tends to
decrease intrgenerational mobility• An shift to more progressive in public investment in human
capital tends to increase it.
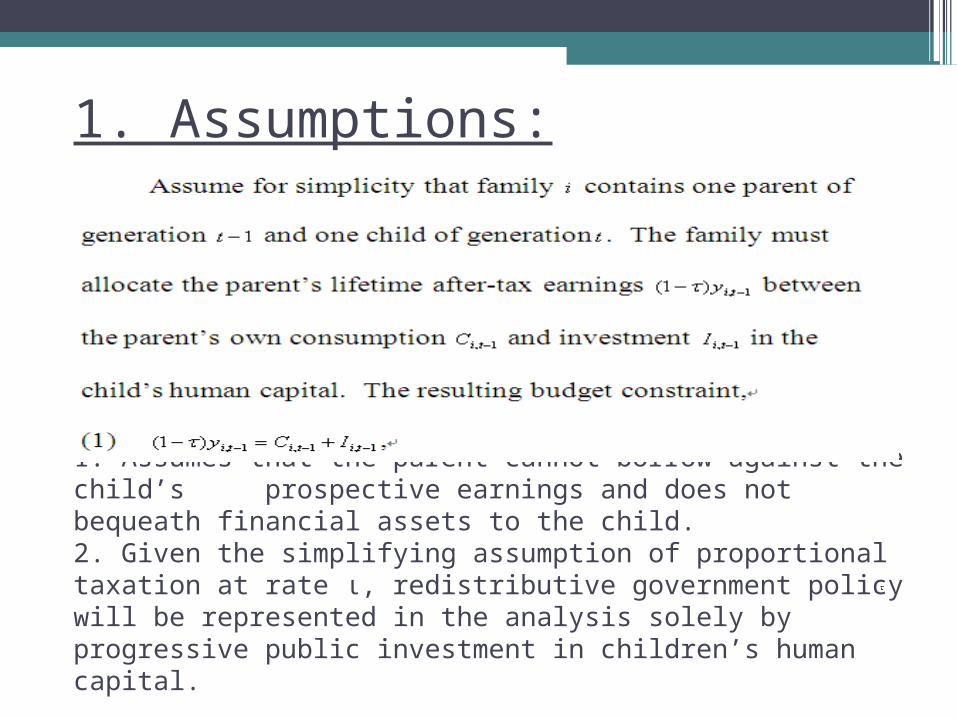
1. Assumes that the parent cannot borrow against the child’s prospective earnings and does not bequeath financial assets to the child.2. Given the simplifying assumption of proportional taxation at rate ι, redistributive government policy will be represented in the analysis solely by progressive public investment in children’s human capital.
1. Assumptions:
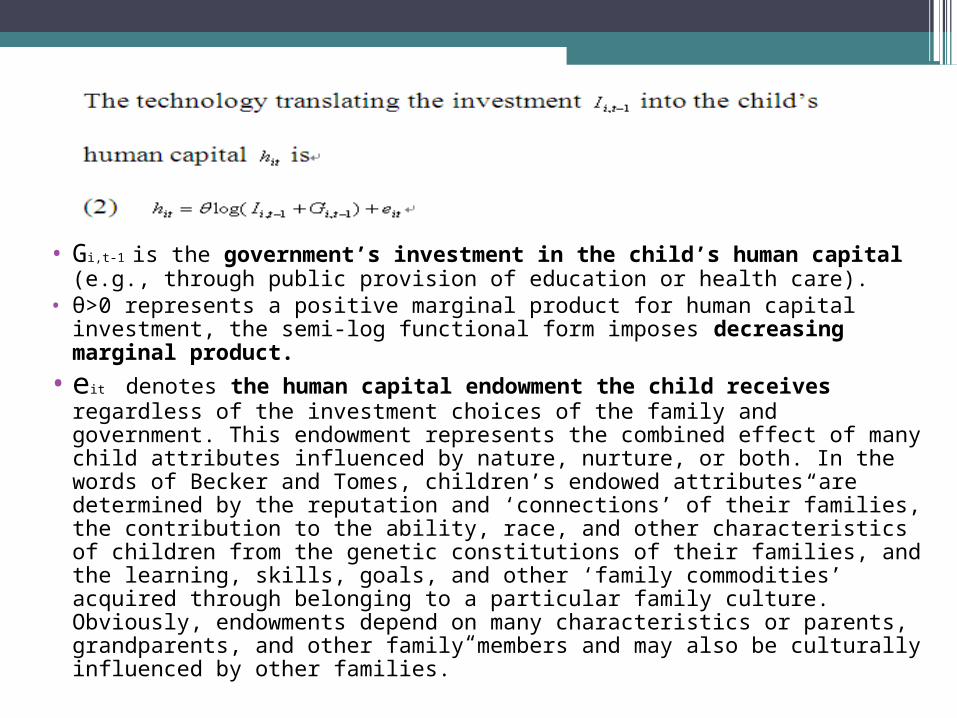
• Gi,t-1 is the government’s investment in the child’s human capital (e.g., through public provision of education or health care).
• θ>0 represents a positive marginal product for human capital investment, the semi-log functional form imposes decreasing marginal product.
• eit denotes the human capital endowment the child receives regardless of the investment choices of the family and government. This endowment represents the combined effect of many child attributes influenced by nature, nurture, or both. In the words of Becker and Tomes, children’s endowed attributes“ are determined by the reputation and ‘connections’ of their families, the contribution to the ability, race, and other characteristics of children from the genetic constitutions of their families, and the learning, skills, goals, and other ‘family commodities’ acquired through belonging to a particular family culture. Obviously, endowments depend on many characteristics or parents, grandparents, and other family members and may also be culturally influenced by other families.”

2. Family Investment Behavior


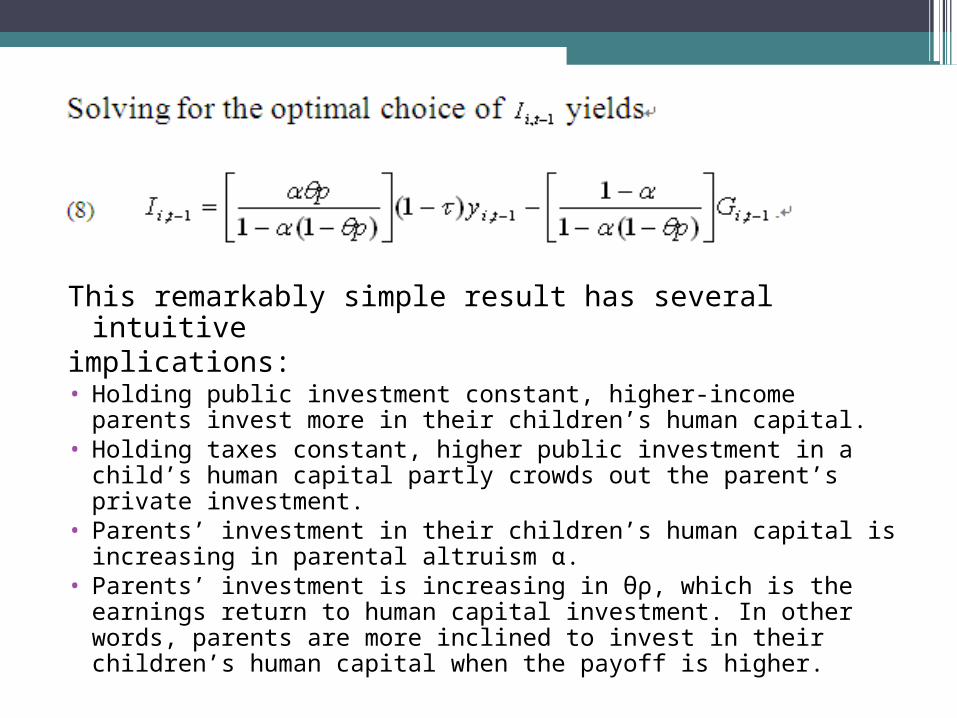
This remarkably simple result has several intuitiveimplications:• Holding public investment constant, higher-income
parents invest more in their children’s human capital.• Holding taxes constant, higher public investment in a
child’s human capital partly crowds out the parent’s private investment.
• Parents’ investment in their children’s human capital is increasing in parental altruism α.
• Parents’ investment is increasing in θρ, which is the earnings return to human capital investment. In other words, parents are more inclined to invest in their children’s human capital when the payoff is higher.
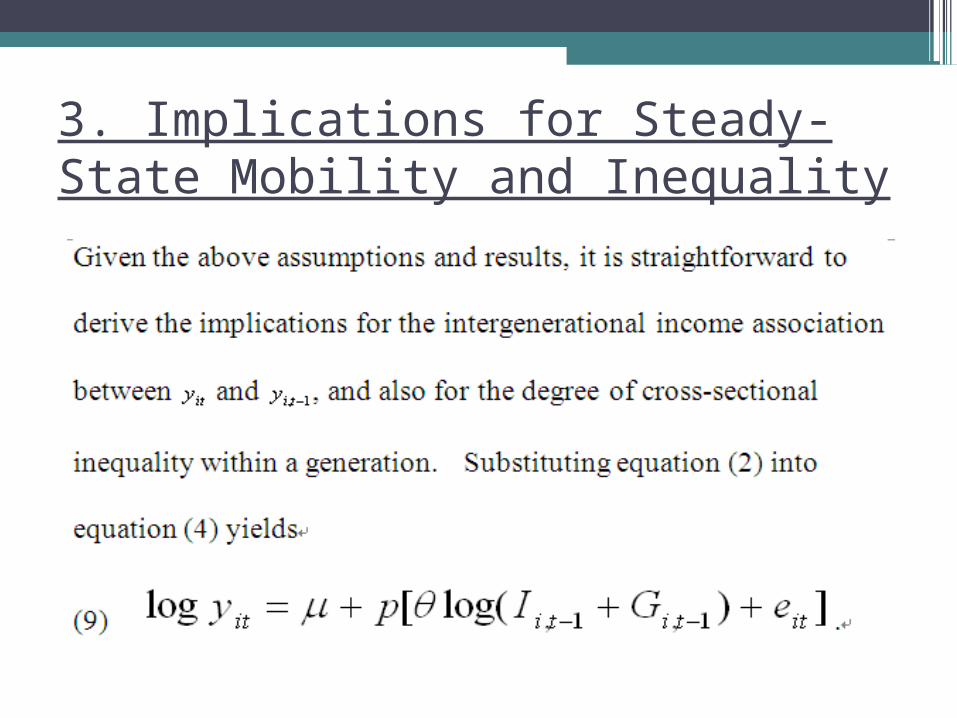
3. Implications for Steady-State Mobility and Inequality
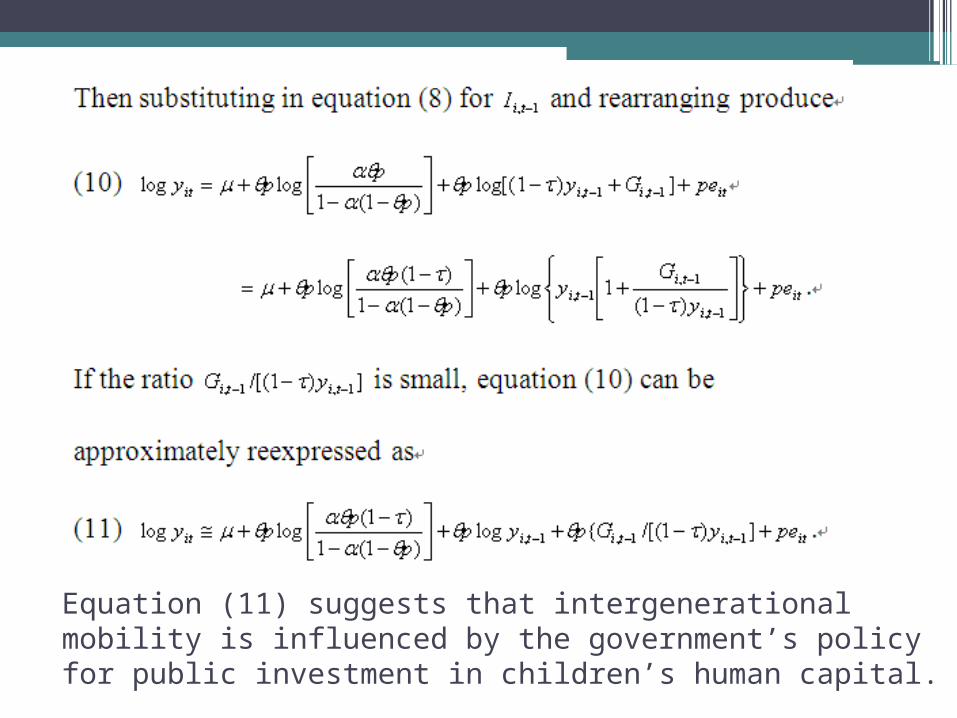
Equation (11) suggests that intergenerational mobility is influenced by the government’s policy for public investment in children’s human capital.
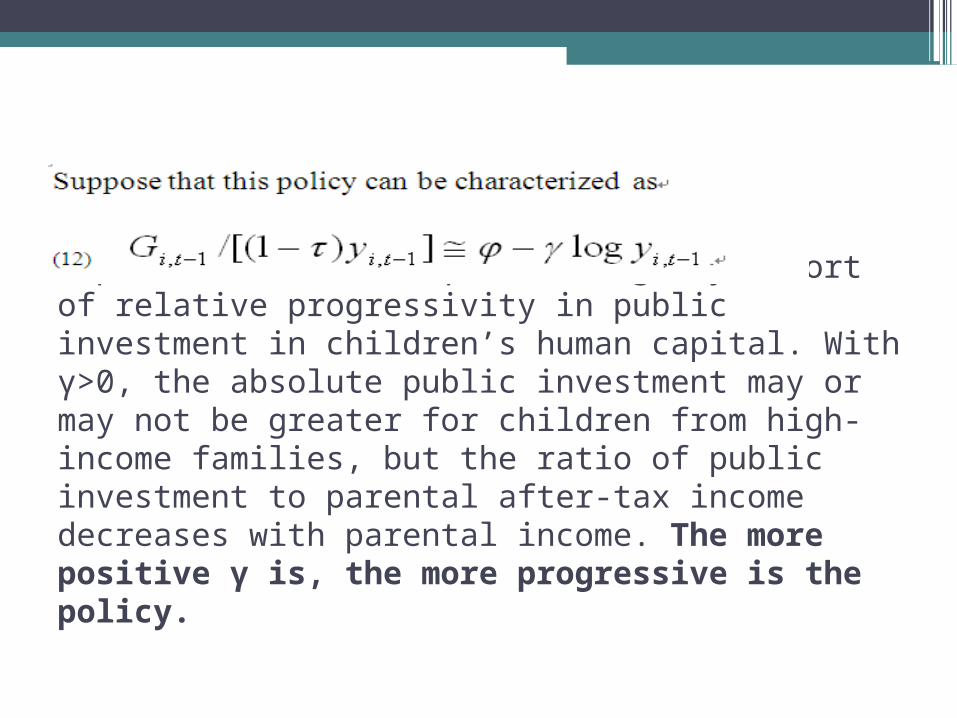
A positive value of γ would signify a sort of relative progressivity in public investment in children’s human capital. With γ>0, the absolute public investment may or may not be greater for children from high-income families, but the ratio of public investment to parental after-tax income decreases with parental income. The more positive γ is, the more progressive is the policy.
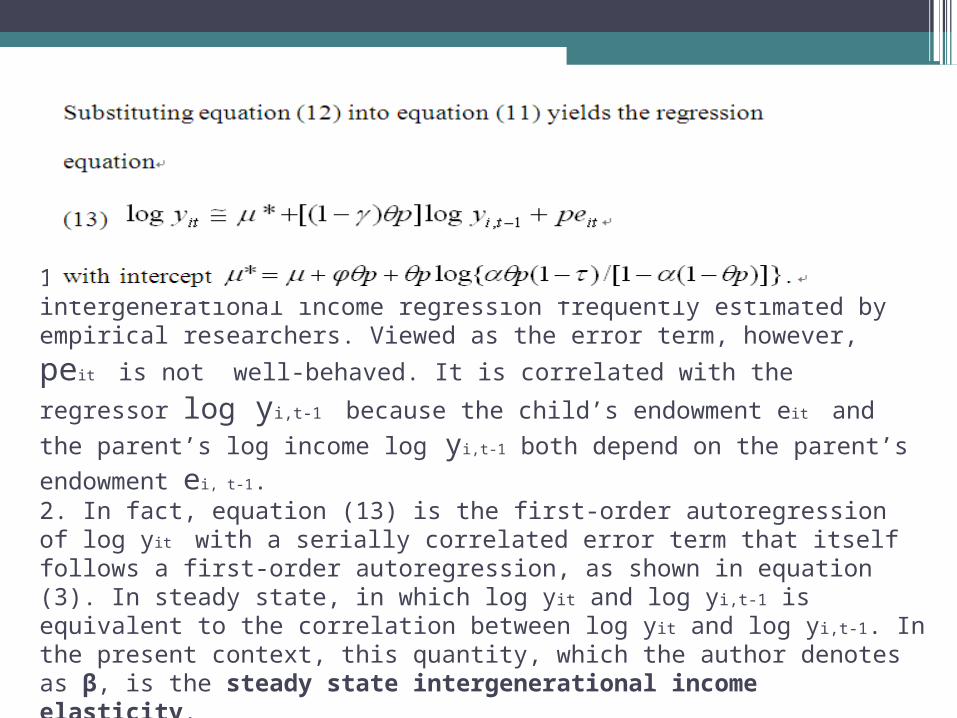
1. At first, equation (13) looks like the log-linear intergenerational income regression frequently estimated by empirical researchers.
Viewed as the error term, however, peit is not well-behaved. It is
correlated with the regressor log yi,t-1 because the child’s endowment
eit and the parent’s log income log yi,t-1 both depend on the parent’s
endowment ei, t-1.2. In fact, equation (13) is the first-order autoregression of log yit with a serially correlated error term that itself follows a first-order autoregression, as shown in equation (3). In steady state, in which log yit and log yi,t-1 is equivalent to the correlation between log yit and log yi,t-1. In the present context, this quantity, which the author denotes as β, is the steady state intergenerational income elasticity.
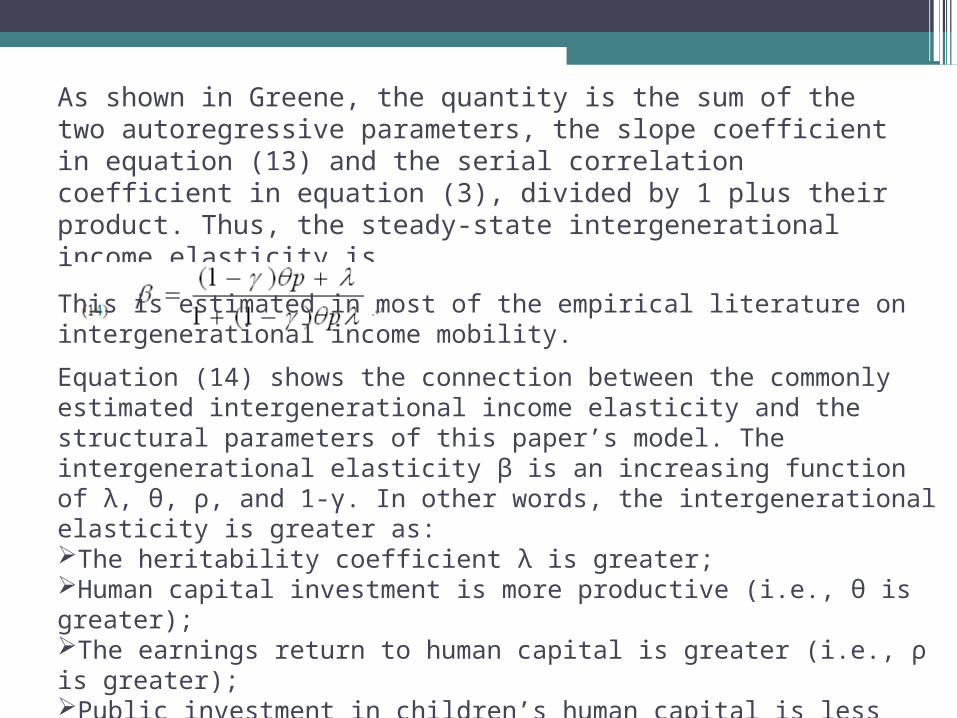
As shown in Greene, the quantity is the sum of the two autoregressive parameters, the slope coefficient in equation (13) and the serial correlation coefficient in equation (3), divided by 1 plus their product. Thus, the steady-state intergenerational income elasticity is
This is estimated in most of the empirical literature on intergenerational income mobility.
Equation (14) shows the connection between the commonly estimated intergenerational income elasticity and the structural parameters of this paper’s model. The intergenerational elasticity β is an increasing function of λ, θ, ρ, and 1-γ. In other words, the intergenerational elasticity is greater as:The heritability coefficient λ is greater;Human capital investment is more productive (i.e., θ is greater);The earnings return to human capital is greater (i.e., ρ is greater); Public investment in children’s human capital is less progressive (i.e., λ is less positive).
The implications for cross-country comparisons are immediate. If country A displays less intergenerational mobility than country B, this could be because country A has stronger heritability, more productive human capital, or less progressive public investment in human capital.
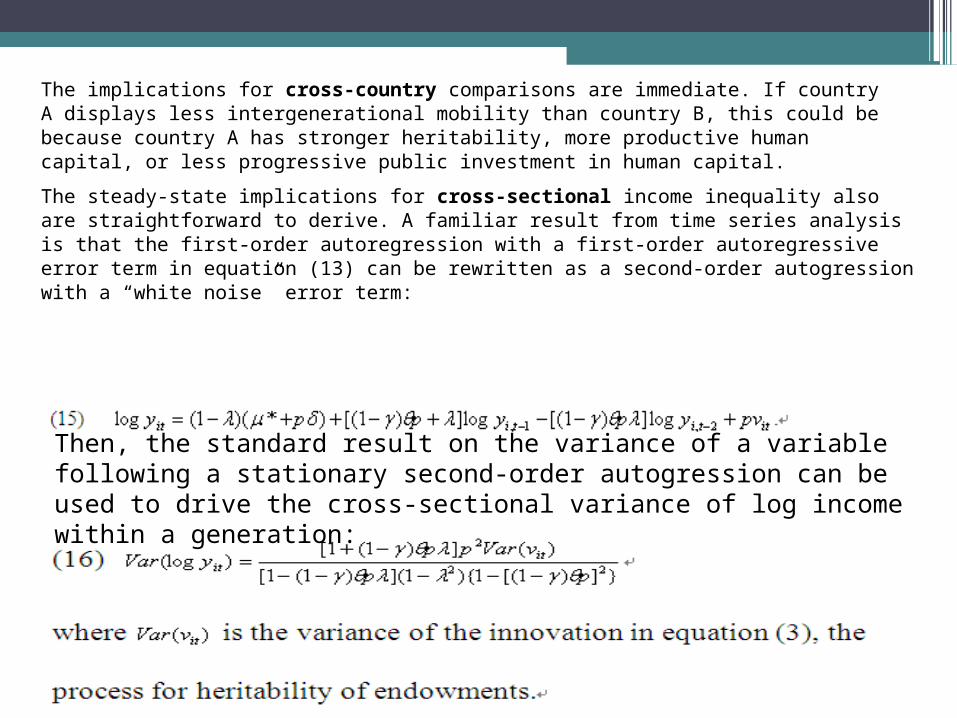
The steady-state implications for cross-sectional income inequality also are straightforward to derive. A familiar result from time series analysisis that the first-order autoregression with a first-order autoregressive error term in equation (13) can be rewritten as a second-order autogressionwith a “white noise” error term:
Then, the standard result on the variance of a variable following a stationary second-order autogression can be used to drive the cross-sectional variance of log income within a generation:
Like the intergenerational elasticity β, this expression for Var(log yit) is an increasing function of λ, θ, ρ, and 1-γ. Thus, like the intergenerational elasticity, cross-sectional income inequality is greater in the presence of stronger heritability, more productive human capital investment, higher returns to human capital, and less progressive public investment in human capital.
This connection between intergenerational mobility and cross-sectional inequality accords with Bjorklund and Jantti’s conjecture that the contrasts between Sweden and the US in both intergenerational mobility and cross-sectional inequality. The mapping between intergenerational mobility and cross-sectional inequality, however, is not exact because the expression for Var(log yit) in equation (16) also depends on Var(vit), which does not appear in the expression for β in equation (14). Thus, two countries with approximately the same intergenerational elasticity might differ in cross-sectional inequality because they differ in their heterogeneity of endowed income-related traits.
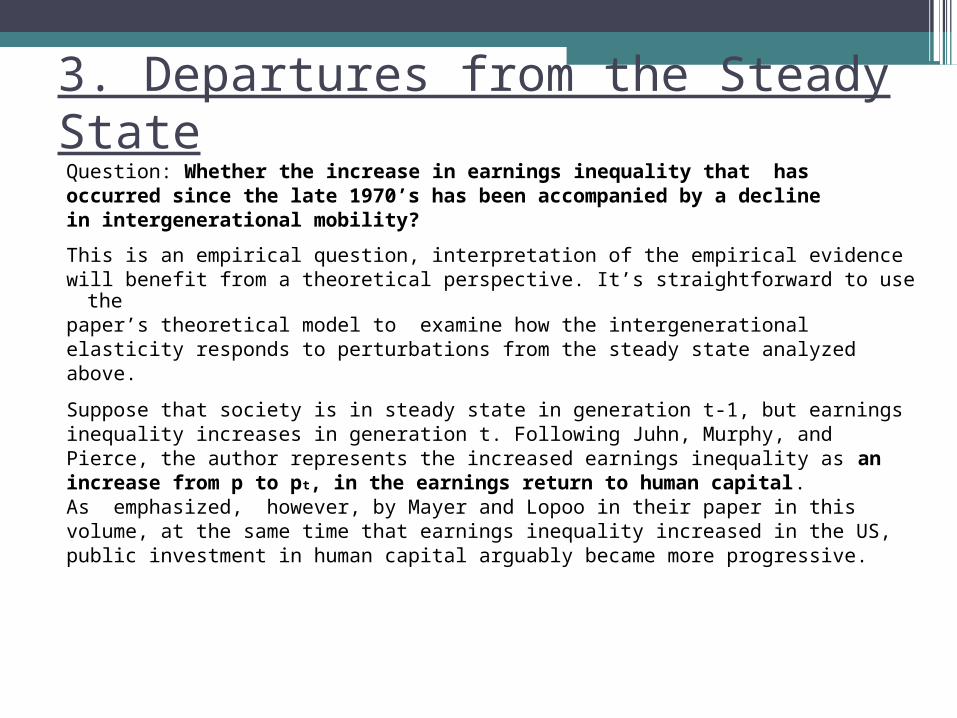
3. Departures from the Steady StateQuestion: Whether the increase in earnings inequality that hasoccurred since the late 1970’s has been accompanied by a
decline in intergenerational mobility?
This is an empirical question, interpretation of the empirical evidencewill benefit from a theoretical perspective. It’s straightforward to use
thepaper’s theoretical model to examine how the intergenerationalelasticity responds to perturbations from the steady state analyzedabove.
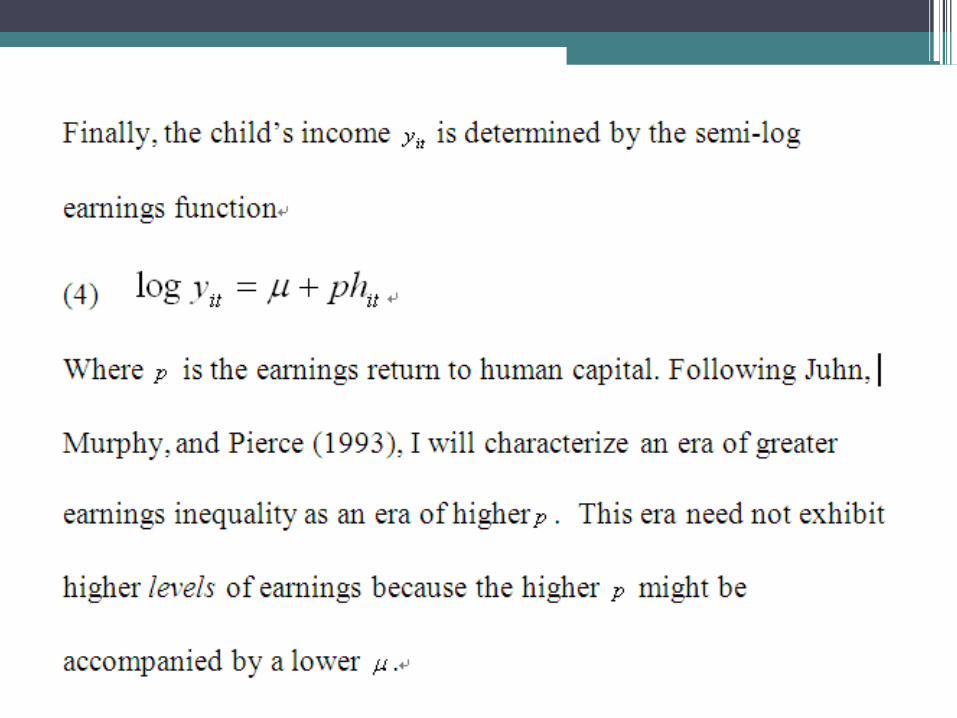
Suppose that society is in steady state in generation t-1, but earnings inequality increases in generation t. Following Juhn, Murphy, and Pierce, the author represents the increased earnings inequality as an increase from p to pt, in the earnings return to human capital. As emphasized, however, by Mayer and Lopoo in their paper in this volume, at the same time that earnings inequality increased in the US, public investment in human capital arguably became more
progressive.
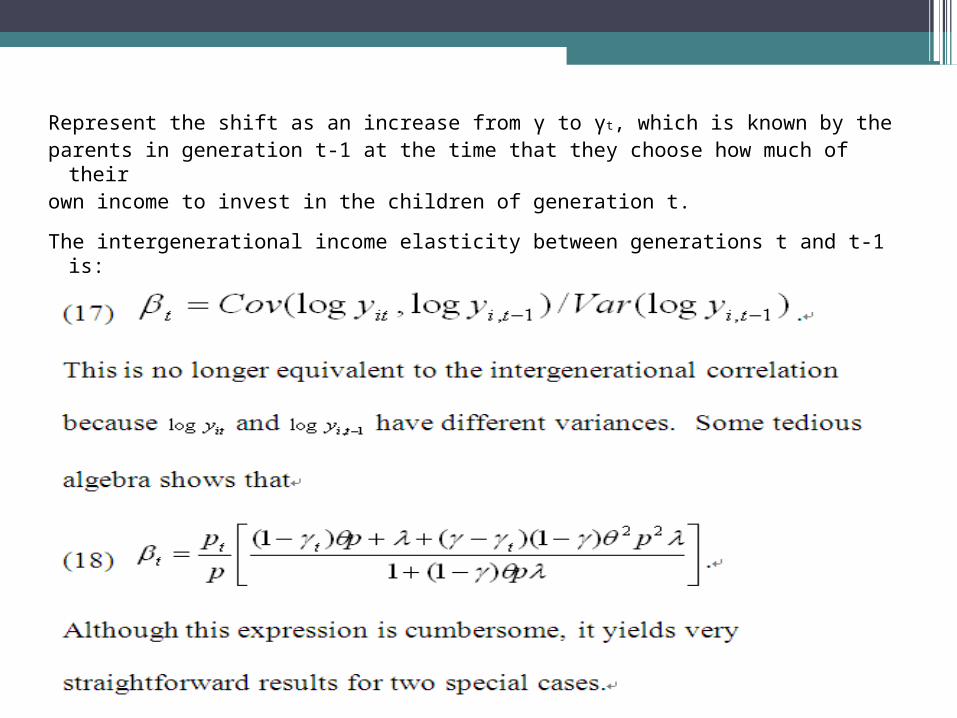
Represent the shift as an increase from γ to γt, which is known by the parents in generation t-1 at the time that they choose how much of their own income to invest in the children of generation t.
The intergenerational income elasticity between generations t and t-1 is:
Conclusion The paper has developed a simple model in which
optimizing behavior by families leads to the log-linear intergenerational income regression equation commonly estimated by empirical researchers.
The steady-state intergenerational income elasticity turns out to be a straightforward function of parameters representing four key factors: the strength of the “mechanical” transmission of income-generating traits, the efficacy of investment in children’s human capital, the earnings return to human capital, and the progressivity of public investment in children’s human capital. The implication is that, if country A displays less intergenerational mobility than country B, this could be because country A has stronger heritability, more productive human capital investment, higher returns to human capital, or less progressive public investment in human capital. These same factors also tend to increase cross-sectional income inequality.
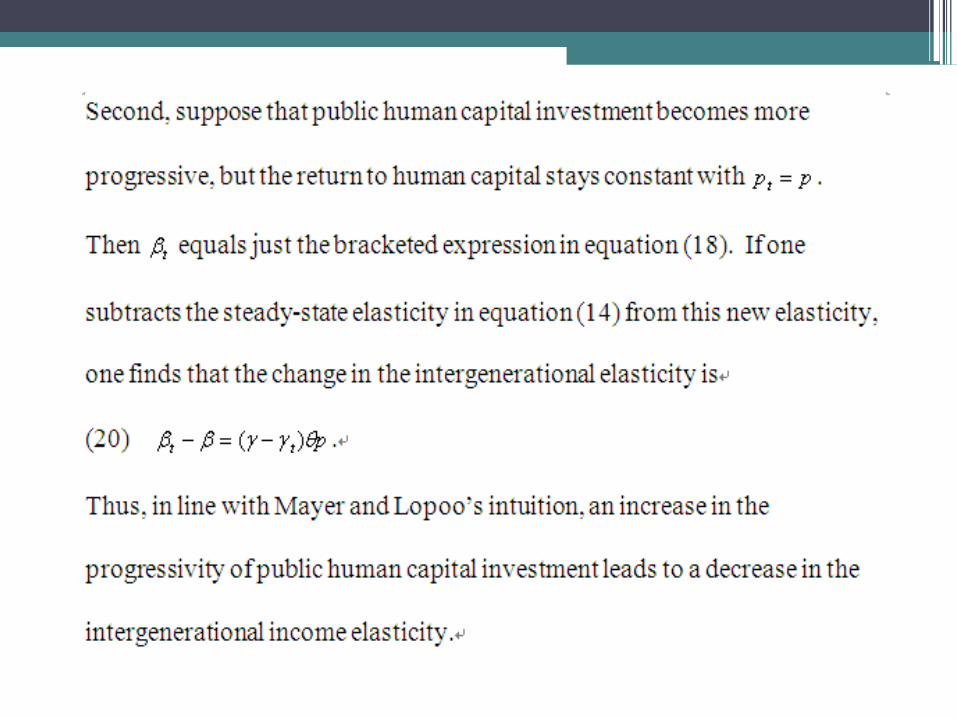
Finally, an analysis of perturbation of the steady state suggests that an era of rising returns to human capital or declining progressivity in public human capital investment is also an era of declining intergenerational mobility.