Embed Size (px)
Citation preview
A model of face selection in viewingvideo storiesYuki Suda1 & Shigeru Kitazawa1,2,3,4
1Department of Neurophysiology, Graduate School of Medicine, Juntendo University, Bunkyo, Tokyo, 113-8421, JAPAN,2Dynamic Brain Network Laboratory, Graduate School of Frontier Biosciences, Osaka University, Suita, Osaka, 565-0871, JAPAN,3Department of Brain Physiology, Graduate School of Medicine, Osaka University, Suita, Osaka, 565-0871, JAPAN, 4Center forInformation and Neural Networks (CiNet), National Institute of Information and Communications Technology, and Osaka University,Suita, Osaka, 565-0871, JAPAN.
When typical adults watch TV programs, they show surprisingly stereo-typed gaze behaviours, as indicatedby the almost simultaneous shifts of their gazes from one face to another. However, a standard saliencymodel based on low-level physical features alone failed to explain such typical gaze behaviours. To find rulesthat explain the typical gaze behaviours, we examined temporo-spatial gaze patterns in adults while theyviewed video clips with human characters that were played with or without sound, and in the forward orreverse direction. We here show the following: 1) the ‘‘peak’’ face scanpath, which followed the face thatattracted the largest number of views but ignored other objects in the scene, still retained the key features ofactual scanpaths, 2) gaze behaviours remained unchanged whether the sound was provided or not, 3) thegaze behaviours were sensitive to time reversal, and 4) nearly 60% of the variance of gaze behaviours wasexplained by the face saliency that was defined as a function of its size, novelty, head movements, and mouthmovements. These results suggest that humans share a face-oriented network that integrates several visualfeatures of multiple faces, and directs our eyes to the most salient face at each moment.
When typical adults watch TV programs or movie scenes, they show surprisingly stereo-typed gazebehaviours in time and space1–3, as typically indicated by almost simultaneous shifts of their gazes fromone face to another4. Recent studies have shown with the aid of multidimensional scaling that such
typical temporo-spatial gaze behaviours were not shared by adults with autism4 or by monkeys3 and were quitedifferent from those generated artificially based on low-level physical features3. These previous findings suggestthat temporo-spatial gaze behaviours of typical adults are driven by some human specific social ‘‘saliency’’, whichmust be different from the standard saliency model that depends solely on the low-level physical features5,6. In thepresent study, we propose a rule that determines the dynamic choice among the faces while viewing motionpictures.
First, we placed a face detection mechanism along a cascade of other factors in our model for face selection(Figure 1a) because typical adults spend most of their time viewing a face, whether they viewed motion pictures4,7,8
or still pictures9,10. However, we also looked at other items in a scene; for example, text typically attractsattention4,9,11. Thus, in the first part of this study, we tested whether the essence of actual gaze behaviours wasretained after disregarding non-face objects while they viewed short video clips that featured two or more humancharacters.
We then examined gaze patterns when the video clips were played without sound, to evaluate if verbalsemantics plays a critical role in determining our gaze behaviour. If verbal semantics in conversation is critical,our stereo-typed gaze behaviours should be significantly altered by not providing sound. We also presented thevideo clips in reverse, to further test whether the normal context other than the verbal semantics is critical for thegeneration of gaze behaviours. If the gaze behaviours are depending solely on the low-level physical features, thebehaviours should be symmetric in time reversal.
We then hypothesized that the saliency of each face is determined by a combination of its size, novelty,head movement, and mouth movement (Figure 1a). We chose size because a recent neuroimaging study hasshown that responses in the fusiform face area were clearly modulated by the size of the face stimuli12. Weadded the novelty component because the amygdala, which is assumed to be a member of face detectioncircuits, is reported to respond strongly to novel faces13–15. We chose head and mouth movements because anumber of face areas over the occipitotemporal cortex are responsive both to biological motion and face
OPEN
SUBJECT AREAS:
HUMAN BEHAVIOUR
SACCADES
ATTENTION
Received10 September 2014
Accepted3 December 2014
Published19 January 2015
Correspondence andrequests for materials
should be addressed toS.K. (kitazawa@fbs.
osaka-u.ac.jp)
SCIENTIFIC REPORTS | 4 : 7666 | DOI: 10.1038/srep07666 1
stimuli16. In addition, movements in not only the mouth but alsothe head are reported to provide information on the timing ofspeech and turn-takings in conversation17,18.
We show here that our gaze behaviours did not much depend onthe availability of sound, but were sensitive to time reversal. Wefurther show that our face saliency model explained nearly 60% ofthe variance of gaze behaviours, and that the weights for the fourcomponents were dynamically adjusted depending on the directionof replay.
ResultsComparison of actual and artificial scanpaths. To characterizeactual scanpaths recorded from individual participants (a timeseries of 1736 gaze positions for each participant), we comparedthem with several artificially generated scanpaths: ‘‘peak-face’’,‘‘random-face’’, and ‘‘physical’’ saliency scanpaths. In viewing aframe shown in Figure 2a, most participants looked at the teachersin the centre and at the left female teacher in particular. As a result,the ‘‘peak-face’’ scanpath, defined as an artificial scanpath thatfollowed the face with the largest number of gazes, fell on the faceof the female teacher (orange dot). In contrast, a ‘‘random-face’’scanpath, defined as an artificial scanpath that followed a face thatwas chosen randomly in each frame, fell on a boy in the right (reddiamond), and a ‘‘physical’’ saliency scanpath (intensity channel),defined as an artificial scanpath that followed the peak of saliency in
terms of low-level physical features defined by intensity, fell on theborder of the black hair of a girl in the left against a white background(green square). The ‘‘peak’’ face scanpath seemed to represent theactual gazes of the 24 participants, but other artificial scanpaths didnot.
This was generally true over the entire duration of the video stim-uli, as indicated by the plots on the MDS plane (Figure 2b). Actualscanpaths (cyan and magenta symbols) clustered together, and the‘‘peak-face’’ scanpaths fell near the centre of the cluster (orangesymbols). In contrast, the ‘‘random-face’’ scanpaths (diamonds)and the ‘‘physical’’ saliency scanpaths (squares) fell in the periphery.Of particular importance, forward replay scanpaths (cyan circles)and reverse replay scanpaths (magenta triangles) formed two distinctclusters on the MDS plane, irrespective of whether the sound wasavailable (filled symbols) or not (open symbols).
These observations were directly confirmed statistically by com-paring the mean of within- or across-group distances (Figure 2c; one-way ANOVA, F6, 6377 5 2885, p , 0.0001). First, the mean distancebetween the ‘‘peak’’ face scanpaths and the actual scanpaths (Peak/Actual, 49 6 20 pixels; mean 6 s.d.) was significantly smaller thanthose calculated for the ‘‘random-face’’ (Random/Actual, 158 6 9pixels, p , 0.0001), and the ‘‘physical’’ saliency scanpaths (Physical/Actual, 157 6 23 pixels, p , 0.0001). In addition, the mean distancebetween the actual scanpaths and the ‘‘peak’’ face scanpaths (Peak/Actual, 49 6 20 pixels) was significantly ‘‘smaller’’ than the mean
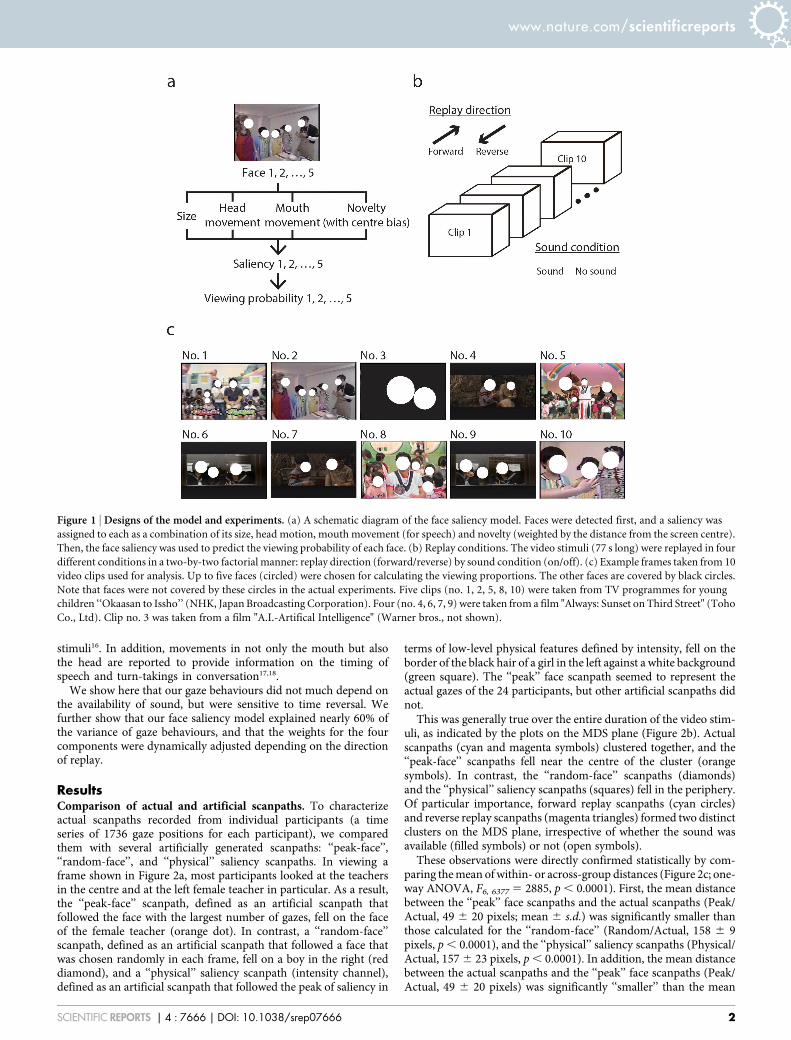
Figure 1 | Designs of the model and experiments. (a) A schematic diagram of the face saliency model. Faces were detected first, and a saliency was
assigned to each as a combination of its size, head motion, mouth movement (for speech) and novelty (weighted by the distance from the screen centre).
Then, the face saliency was used to predict the viewing probability of each face. (b) Replay conditions. The video stimuli (77 s long) were replayed in four
different conditions in a two-by-two factorial manner: replay direction (forward/reverse) by sound condition (on/off). (c) Example frames taken from 10
video clips used for analysis. Up to five faces (circled) were chosen for calculating the viewing proportions. The other faces are covered by black circles.
Note that faces were not covered by these circles in the actual experiments. Five clips (no. 1, 2, 5, 8, 10) were taken from TV programmes for young
children ‘‘Okaasan to Issho’’ (NHK, Japan Broadcasting Corporation). Four (no. 4, 6, 7, 9) were taken from a film "Always: Sunset on Third Street" (Toho
Co., Ltd). Clip no. 3 was taken from a film "A.I.-Artifical Intelligence" (Warner bros., not shown).
www.nature.com/scientificreports
SCIENTIFIC REPORTS | 4 : 7666 | DOI: 10.1038/srep07666 2
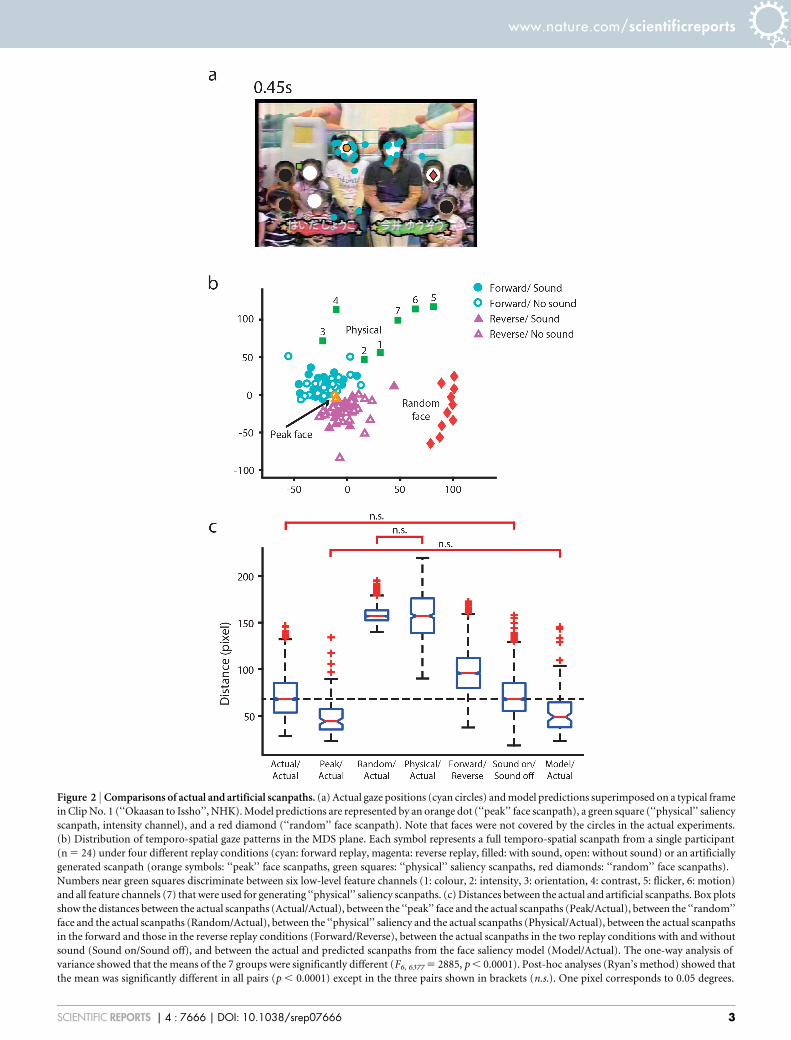
Figure 2 | Comparisons of actual and artificial scanpaths. (a) Actual gaze positions (cyan circles) and model predictions superimposed on a typical frame
in Clip No. 1 (‘‘Okaasan to Issho’’, NHK). Model predictions are represented by an orange dot (‘‘peak’’ face scanpath), a green square (‘‘physical’’ saliency
scanpath, intensity channel), and a red diamond (‘‘random’’ face scanpath). Note that faces were not covered by the circles in the actual experiments.
(b) Distribution of temporo-spatial gaze patterns in the MDS plane. Each symbol represents a full temporo-spatial scanpath from a single participant
(n 5 24) under four different replay conditions (cyan: forward replay, magenta: reverse replay, filled: with sound, open: without sound) or an artificially
generated scanpath (orange symbols: ‘‘peak’’ face scanpaths, green squares: ‘‘physical’’ saliency scanpaths, red diamonds: ‘‘random’’ face scanpaths).
Numbers near green squares discriminate between six low-level feature channels (1: colour, 2: intensity, 3: orientation, 4: contrast, 5: flicker, 6: motion)
and all feature channels (7) that were used for generating ‘‘physical’’ saliency scanpaths. (c) Distances between the actual and artificial scanpaths. Box plots
show the distances between the actual scanpaths (Actual/Actual), between the ‘‘peak’’ face and the actual scanpaths (Peak/Actual), between the ‘‘random’’
face and the actual scanpaths (Random/Actual), between the ‘‘physical’’ saliency and the actual scanpaths (Physical/Actual), between the actual scanpaths
in the forward and those in the reverse replay conditions (Forward/Reverse), between the actual scanpaths in the two replay conditions with and without
sound (Sound on/Sound off), and between the actual and predicted scanpaths from the face saliency model (Model/Actual). The one-way analysis of
variance showed that the means of the 7 groups were significantly different (F6, 6377 5 2885, p , 0.0001). Post-hoc analyses (Ryan’s method) showed that
the mean was significantly different in all pairs (p , 0.0001) except in the three pairs shown in brackets (n.s.). One pixel corresponds to 0.05 degrees.
www.nature.com/scientificreports
SCIENTIFIC REPORTS | 4 : 7666 | DOI: 10.1038/srep07666 3
distance between actual scanpaths (Actual/Actual, 71 6 22 pixels,Figure 2c, p , 0.0001). Second, the mean distance between actualscanpaths (Actual/Actual, 71 6 22 pixels) was not affected by theavailability of the sound (Sound on/Sound off, 72 6 22 pixels, p 50.63). Third, the mean distance between the actual scanpaths(Actual/Actual, 71 6 22 pixels) became significantly larger whenmeasured between scanpaths in the forward and reverse replay con-ditions (Forward/Reverse, 97 6 23 pixels, p , 0.0001).
We are able to draw several important implications from theseresults. First, the ‘‘peak-face’’ scanpath, after disregarding all objectsother than faces, still represented the essence of actual gaze beha-viours. Second, actual gaze behaviours little depended on verbalsemantics that was completely lost when the sound was not provided.Third, gaze behaviours were not symmetric about the time reversal.Our proposed model should take account of all these points.
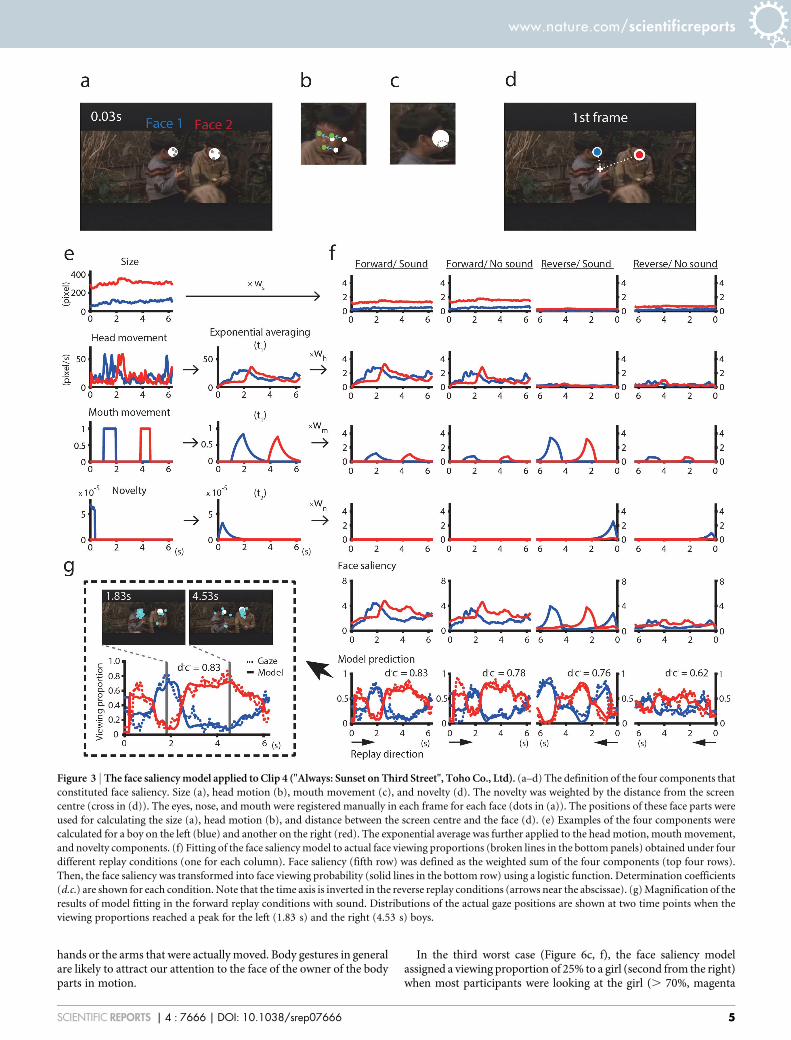
Application of the face saliency model. To test the extent to whichour proposed face saliency model was able to explain the temporalprofiles of the face viewing proportions, we fitted the model to each of40 data sets (10 video clips 3 4 replay conditions). While viewingvideo clip No. 4 that featured two boys taking turns in their con-versation (forward replay condition with sound), most participantsviewed the left boy at 1.83 s with a peak viewing proportion of 0.8(Figure 3g, blue dotted line). Then, most of them shifted their gazes tothe right boy with a peak viewing proportion of 0.8 at 4.53 s (reddotted line). More than 80% of this typical gaze behaviour (dottedlines) was explained by the face saliency model (solid lines) in that83% of the variance of the viewing proportion was explained by themodel (d.c. 5 0.83, Figure 3g). In this particular example, the headmotion contributed the basic temporal profiles, mouth movement(with ordinary speech sound) added more transients, size providedbasic biases, but the novelty component contributed little (Figure 3f,leftmost column, Forward/Sound). The features of temporal profilesand the relative contributions of the four components in the forwardreplay condition with sound were carried over to the forward replaycondition without sound (d.c. 5 0.78, Forward/No sound, Figure 3f).However, temporal profiles in the reverse replay condition withsound were quite different from those in the forward replay con-ditions. The contribution from the mouth movement component(with speech sound in reverse) became much larger, and the sizecomponent ceased to contribute (d.c. 5 0.76, Reverse/Sound,Figure 3f). When the video clip was replayed in reverse withoutsound, temporal profiles were similar to those in the reverse replaycondition with sound, but the dynamic range of the viewingproportions had shrunk. As a result, the determination coefficientin this condition was the worst of the four conditions but was still aslarge as 0.62 (Reverse/No sound, Figure 3f). Taken together, the four-component face saliency model, through adjustments of the relativeweights of the four components, captured the key features of the gazebehaviours while viewing Clip 4.
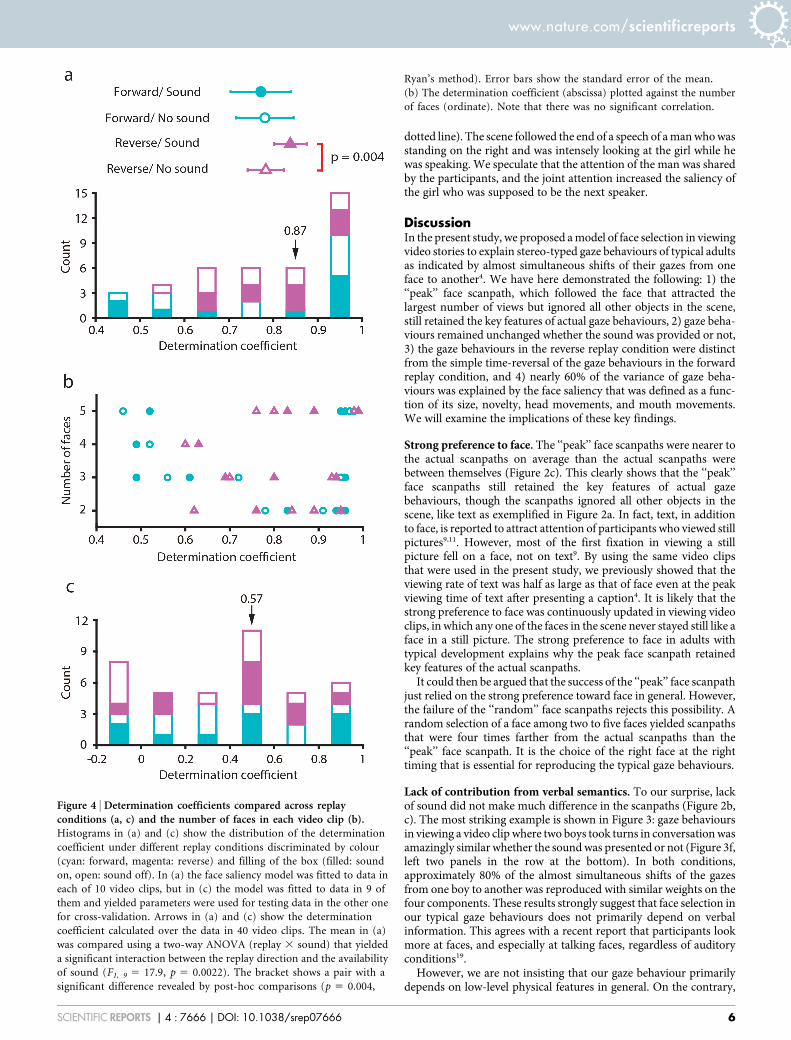
Validity of the four component model. The determination coe-fficient (d.c.) ranged from 0.46 to 0.99 with the mean of 0.79(Figure 4a, n 5 40), and was as large as 0.87 when the d.c. wascalculated over the entire 10 video clips (Table 1, top row, d.f. 540, d.c. 5 0.87). The face saliency model was successful in that themodel explained 87% of the dynamic changes in the face viewingproportions. When we dropped one of 9 parameters in the four-component face saliency model, the decrease in d.c. ranged from0.01 to 0.17 (2nd to 10th rows in Table 1). However, Akaike’sinformation criterion increased (became worse) in all cases (DAIC. 1500). Thus, we judge that all four components and 9 parameterswere indispensable, although we think that our model has muchroom for further improvement, as discussed later.
To further confirm the validity of the four component model, wemade a ‘‘model-peak-face’’ scanpath that followed the face with thelargest value of viewing proportion predicted by the face saliency
model. The mean distance between the ‘‘model’’ peak face scanpathand the actual scanpaths (Model/Actual, 57 6 27 pixels, Figure 2c)was as small as that between the original ‘‘peak’’ face scanpath andthe actual scanpaths (Peak/Actual, 49 6 20 pixels). These results alsoindicate that the ‘‘model-peak-face’’ scanpaths were significantlynearer to the actual scanpaths than the actual scanpaths werebetween themselves.
We further tested whether the estimated parameters can begeneralized across different video clips. For this purpose, we usedeach video clip as test data while using the other 9 as data formodel fitting (Fig. 4c). The d.c. decreased but was still as large as0.57 when the gaze positions over the entire 10 video clips wereevaluated as a whole.
It is worth noting here that two of the four components, ‘‘size’’ and‘‘head motion’’, correlates with the zooming of the scene, whereas theother two, ‘‘mouth movement’’ and ‘‘novelty’’, was assigned a valueof zero or one irrespective of whether the face was zoomed in or out.Therefore, the model parameters are not necessarily expected togeneralize across different scenes with different magnifications.This was further confirmed by fitting the full four-component modelto the entire 10 video clips in each of four conditions (the 11th row inTable 1, degrees of freedom 5 36). The d.c. was still as large as 0.66but the AIC became much larger (DAIC 5 21209) than when themodel was fitted to each video clip. Thus, the model parametersshould be estimated for each scene, and we may not compare thevalues of estimated parameters across different video clips.
For the purpose of comparison, we introduced the ‘‘relative con-tribution’’ from each of the four components to the face saliency, asdefined by Eq. 4 in Methods. The sum of the relative contributionsacross the four components was normalized to one (Eq. 5), so that thevalue can be compared across different conditions and video clips.
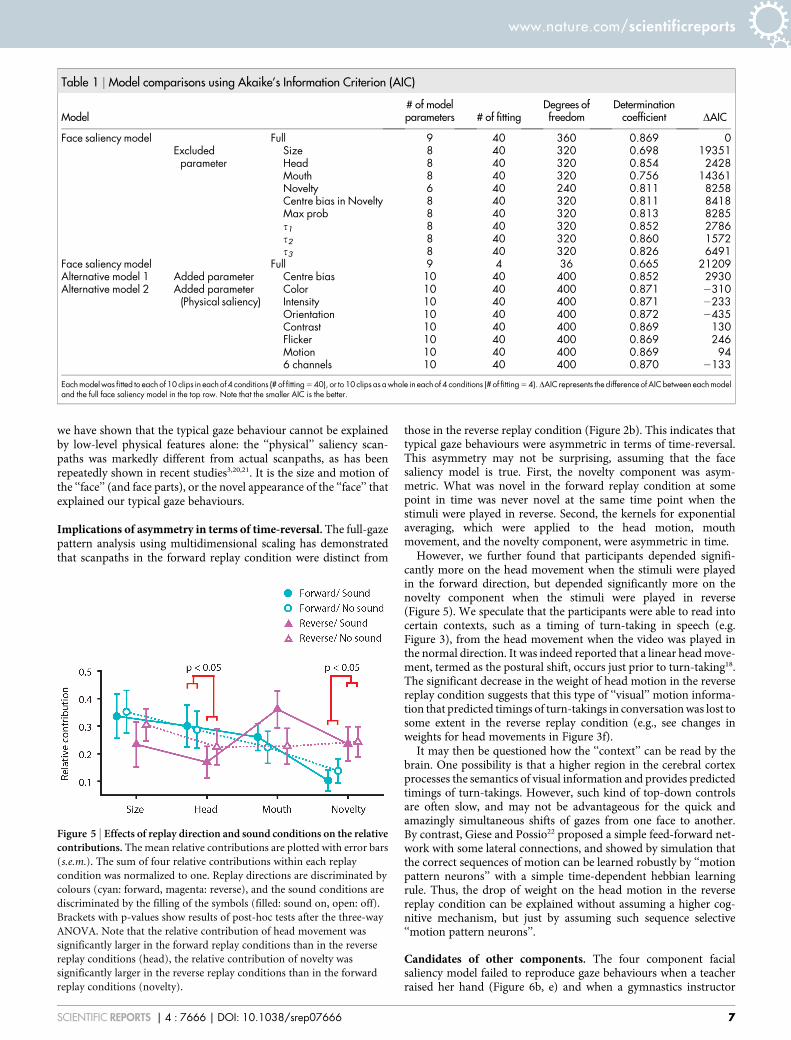
Effects of replay and sound conditions on the relative contri-butions. The relative contributions from the four componentswere similar on average (Figure 5, Ws 5 0.31 6 0.037; Wh 5 0.256 0.033; Wm 5 0.27 6 0.030; Wn 5 0.18 6 0.026; means 6 s.e.m.).To clarify how the weights across the four components were adjusteddepending on the replay conditions with and without sound, weapplied the three-way ANOVA to the relative contributions of thefour components. As a result, the three main effects (component,replay direction, and the sound condition) were not significant, butan interaction term between the components (size, head motion,mouth movement, and novelty) and the replay direction (forwardand reverse) was found to be significant (F3,27 5 3.6, p 5 0.026). Post-hoc tests showed that the relative contribution of novelty wassignificantly larger in the reverse replay condition than in theforward replay condition (p 5 0.016, Figure 5). In contrast, themean relative contribution of the head movement was significantlylarger in the forward condition than in the reverse condition (p 50.047, Figure 5).
To summarize, the sound condition did not alter weights acrossthe four components. By contrast, the replay direction dynamicallyadjusted weights on the novelty and the head motion: the weight onthe head motion in the forward replay condition was shifted to theweight on the novelty in the reverse replay condition.
Effects of gestures. As previously shown in Figure 3, we were able toexplain nearly 60% of gaze behaviours on average by our face saliencymodel. The model is by no means perfect with only four componentsin the model. To look for directions in which to improve, we searchedfor frames in which there was a large discrepancy between the actualviewing proportion and the value predicted by the present model.The worst three cases are shown in Figure 6. Of importance, in two ofthe three scenes, the main characters were extending the arms(Figure 6a, d) or raising the right hand (Figure 6b, e). At theseoccasions, gazes of the participants moved onto the faces of thecharacters that raised or extended their arms but never onto the
www.nature.com/scientificreports
SCIENTIFIC REPORTS | 4 : 7666 | DOI: 10.1038/srep07666 4
hands or the arms that were actually moved. Body gestures in generalare likely to attract our attention to the face of the owner of the bodyparts in motion.
In the third worst case (Figure 6c, f), the face saliency modelassigned a viewing proportion of 25% to a girl (second from the right)when most participants were looking at the girl (. 70%, magenta
Figure 3 | The face saliency model applied to Clip 4 ("Always: Sunset on Third Street", Toho Co., Ltd). (a–d) The definition of the four components that
constituted face saliency. Size (a), head motion (b), mouth movement (c), and novelty (d). The novelty was weighted by the distance from the screen
centre (cross in (d)). The eyes, nose, and mouth were registered manually in each frame for each face (dots in (a)). The positions of these face parts were
used for calculating the size (a), head motion (b), and distance between the screen centre and the face (d). (e) Examples of the four components were
calculated for a boy on the left (blue) and another on the right (red). The exponential average was further applied to the head motion, mouth movement,
and novelty components. (f) Fitting of the face saliency model to actual face viewing proportions (broken lines in the bottom panels) obtained under four
different replay conditions (one for each column). Face saliency (fifth row) was defined as the weighted sum of the four components (top four rows).
Then, the face saliency was transformed into face viewing probability (solid lines in the bottom row) using a logistic function. Determination coefficients
(d.c.) are shown for each condition. Note that the time axis is inverted in the reverse replay conditions (arrows near the abscissae). (g) Magnification of the
results of model fitting in the forward replay conditions with sound. Distributions of the actual gaze positions are shown at two time points when the
viewing proportions reached a peak for the left (1.83 s) and the right (4.53 s) boys.
www.nature.com/scientificreports
SCIENTIFIC REPORTS | 4 : 7666 | DOI: 10.1038/srep07666 5
dotted line). The scene followed the end of a speech of a man who wasstanding on the right and was intensely looking at the girl while hewas speaking. We speculate that the attention of the man was sharedby the participants, and the joint attention increased the saliency ofthe girl who was supposed to be the next speaker.
DiscussionIn the present study, we proposed a model of face selection in viewingvideo stories to explain stereo-typed gaze behaviours of typical adultsas indicated by almost simultaneous shifts of their gazes from oneface to another4. We have here demonstrated the following: 1) the‘‘peak’’ face scanpath, which followed the face that attracted thelargest number of views but ignored all other objects in the scene,still retained the key features of actual gaze behaviours, 2) gaze beha-viours remained unchanged whether the sound was provided or not,3) the gaze behaviours in the reverse replay condition were distinctfrom the simple time-reversal of the gaze behaviours in the forwardreplay condition, and 4) nearly 60% of the variance of gaze beha-viours was explained by the face saliency that was defined as a func-tion of its size, novelty, head movements, and mouth movements.We will examine the implications of these key findings.
Strong preference to face. The ‘‘peak’’ face scanpaths were nearer tothe actual scanpaths on average than the actual scanpaths werebetween themselves (Figure 2c). This clearly shows that the ‘‘peak’’face scanpaths still retained the key features of actual gazebehaviours, though the scanpaths ignored all other objects in thescene, like text as exemplified in Figure 2a. In fact, text, in additionto face, is reported to attract attention of participants who viewed stillpictures9,11. However, most of the first fixation in viewing a stillpicture fell on a face, not on text9. By using the same video clipsthat were used in the present study, we previously showed that theviewing rate of text was half as large as that of face even at the peakviewing time of text after presenting a caption4. It is likely that thestrong preference to face was continuously updated in viewing videoclips, in which any one of the faces in the scene never stayed still like aface in a still picture. The strong preference to face in adults withtypical development explains why the peak face scanpath retainedkey features of the actual scanpaths.
It could then be argued that the success of the ‘‘peak’’ face scanpathjust relied on the strong preference toward face in general. However,the failure of the ‘‘random’’ face scanpaths rejects this possibility. Arandom selection of a face among two to five faces yielded scanpathsthat were four times farther from the actual scanpaths than the‘‘peak’’ face scanpath. It is the choice of the right face at the righttiming that is essential for reproducing the typical gaze behaviours.
Lack of contribution from verbal semantics. To our surprise, lackof sound did not make much difference in the scanpaths (Figure 2b,c). The most striking example is shown in Figure 3: gaze behavioursin viewing a video clip where two boys took turns in conversation wasamazingly similar whether the sound was presented or not (Figure 3f,left two panels in the row at the bottom). In both conditions,approximately 80% of the almost simultaneous shifts of the gazesfrom one boy to another was reproduced with similar weights on thefour components. These results strongly suggest that face selection inour typical gaze behaviours does not primarily depend on verbalinformation. This agrees with a recent report that participants lookmore at faces, and especially at talking faces, regardless of auditoryconditions19.
However, we are not insisting that our gaze behaviour primarilydepends on low-level physical features in general. On the contrary,
Figure 4 | Determination coefficients compared across replayconditions (a, c) and the number of faces in each video clip (b).Histograms in (a) and (c) show the distribution of the determination
coefficient under different replay conditions discriminated by colour
(cyan: forward, magenta: reverse) and filling of the box (filled: sound
on, open: sound off). In (a) the face saliency model was fitted to data in
each of 10 video clips, but in (c) the model was fitted to data in 9 of
them and yielded parameters were used for testing data in the other one
for cross-validation. Arrows in (a) and (c) show the determination
coefficient calculated over the data in 40 video clips. The mean in (a)
was compared using a two-way ANOVA (replay 3 sound) that yielded
a significant interaction between the replay direction and the availability
of sound (F1, 9 5 17.9, p 5 0.0022). The bracket shows a pair with a
significant difference revealed by post-hoc comparisons (p 5 0.004,
Ryan’s method). Error bars show the standard error of the mean.
(b) The determination coefficient (abscissa) plotted against the number
of faces (ordinate). Note that there was no significant correlation.
www.nature.com/scientificreports
SCIENTIFIC REPORTS | 4 : 7666 | DOI: 10.1038/srep07666 6
we have shown that the typical gaze behaviour cannot be explainedby low-level physical features alone: the ‘‘physical’’ saliency scan-paths was markedly different from actual scanpaths, as has beenrepeatedly shown in recent studies3,20,21. It is the size and motion ofthe ‘‘face’’ (and face parts), or the novel appearance of the ‘‘face’’ thatexplained our typical gaze behaviours.
Implications of asymmetry in terms of time-reversal. The full-gazepattern analysis using multidimensional scaling has demonstratedthat scanpaths in the forward replay condition were distinct from
those in the reverse replay condition (Figure 2b). This indicates thattypical gaze behaviours were asymmetric in terms of time-reversal.This asymmetry may not be surprising, assuming that the facesaliency model is true. First, the novelty component was asym-metric. What was novel in the forward replay condition at somepoint in time was never novel at the same time point when thestimuli were played in reverse. Second, the kernels for exponentialaveraging, which were applied to the head motion, mouthmovement, and the novelty component, were asymmetric in time.
However, we further found that participants depended signifi-cantly more on the head movement when the stimuli were playedin the forward direction, but depended significantly more on thenovelty component when the stimuli were played in reverse(Figure 5). We speculate that the participants were able to read intocertain contexts, such as a timing of turn-taking in speech (e.g.Figure 3), from the head movement when the video was played inthe normal direction. It was indeed reported that a linear head move-ment, termed as the postural shift, occurs just prior to turn-taking18.The significant decrease in the weight of head motion in the reversereplay condition suggests that this type of ‘‘visual’’ motion informa-tion that predicted timings of turn-takings in conversation was lost tosome extent in the reverse replay condition (e.g., see changes inweights for head movements in Figure 3f).
It may then be questioned how the ‘‘context’’ can be read by thebrain. One possibility is that a higher region in the cerebral cortexprocesses the semantics of visual information and provides predictedtimings of turn-takings. However, such kind of top-down controlsare often slow, and may not be advantageous for the quick andamazingly simultaneous shifts of gazes from one face to another.By contrast, Giese and Possio22 proposed a simple feed-forward net-work with some lateral connections, and showed by simulation thatthe correct sequences of motion can be learned robustly by ‘‘motionpattern neurons’’ with a simple time-dependent hebbian learningrule. Thus, the drop of weight on the head motion in the reversereplay condition can be explained without assuming a higher cog-nitive mechanism, but just by assuming such sequence selective‘‘motion pattern neurons’’.
Candidates of other components. The four component facialsaliency model failed to reproduce gaze behaviours when a teacherraised her hand (Figure 6b, e) and when a gymnastics instructor
Table 1 | Model comparisons using Akaike’s Information Criterion (AIC)
Model# of modelparameters # of fitting
Degrees offreedom
Determinationcoefficient DAIC
Face saliency model Full 9 40 360 0.869 0Excluded
parameterSize 8 40 320 0.698 19351Head 8 40 320 0.854 2428Mouth 8 40 320 0.756 14361Novelty 6 40 240 0.811 8258Centre bias in Novelty 8 40 320 0.811 8418Max prob 8 40 320 0.813 8285t1 8 40 320 0.852 2786t2 8 40 320 0.860 1572t3 8 40 320 0.826 6491
Face saliency model Full 9 4 36 0.665 21209Alternative model 1 Added parameter Centre bias 10 40 400 0.852 2930Alternative model 2 Added parameter
(Physical saliency)Color 10 40 400 0.871 2310Intensity 10 40 400 0.871 2233Orientation 10 40 400 0.872 2435Contrast 10 40 400 0.869 130Flicker 10 40 400 0.869 246Motion 10 40 400 0.869 946 channels 10 40 400 0.870 2133
Each model was fitted to each of 10 clips in each of 4 conditions (# of fitting 5 40), or to 10 clips as a whole in each of 4 conditions (# of fitting 5 4).DAIC represents the difference of AIC between each modeland the full face saliency model in the top row. Note that the smaller AIC is the better.
Figure 5 | Effects of replay direction and sound conditions on the relativecontributions. The mean relative contributions are plotted with error bars
(s.e.m.). The sum of four relative contributions within each replay
condition was normalized to one. Replay directions are discriminated by
colours (cyan: forward, magenta: reverse), and the sound conditions are
discriminated by the filling of the symbols (filled: sound on, open: off).
Brackets with p-values show results of post-hoc tests after the three-way
ANOVA. Note that the relative contribution of head movement was
significantly larger in the forward replay conditions than in the reverse
replay conditions (head), the relative contribution of novelty was
significantly larger in the reverse replay conditions than in the forward
replay conditions (novelty).
www.nature.com/scientificreports
SCIENTIFIC REPORTS | 4 : 7666 | DOI: 10.1038/srep07666 7
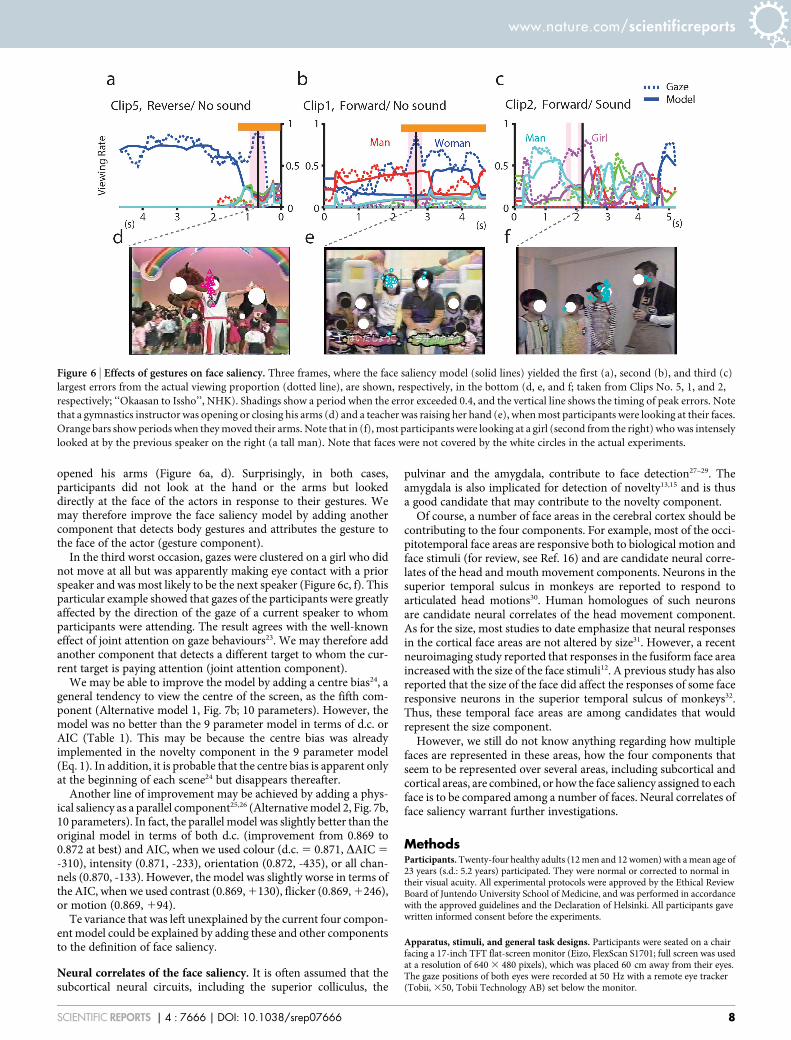
opened his arms (Figure 6a, d). Surprisingly, in both cases,participants did not look at the hand or the arms but lookeddirectly at the face of the actors in response to their gestures. Wemay therefore improve the face saliency model by adding anothercomponent that detects body gestures and attributes the gesture tothe face of the actor (gesture component).
In the third worst occasion, gazes were clustered on a girl who didnot move at all but was apparently making eye contact with a priorspeaker and was most likely to be the next speaker (Figure 6c, f). Thisparticular example showed that gazes of the participants were greatlyaffected by the direction of the gaze of a current speaker to whomparticipants were attending. The result agrees with the well-knowneffect of joint attention on gaze behaviours23. We may therefore addanother component that detects a different target to whom the cur-rent target is paying attention (joint attention component).
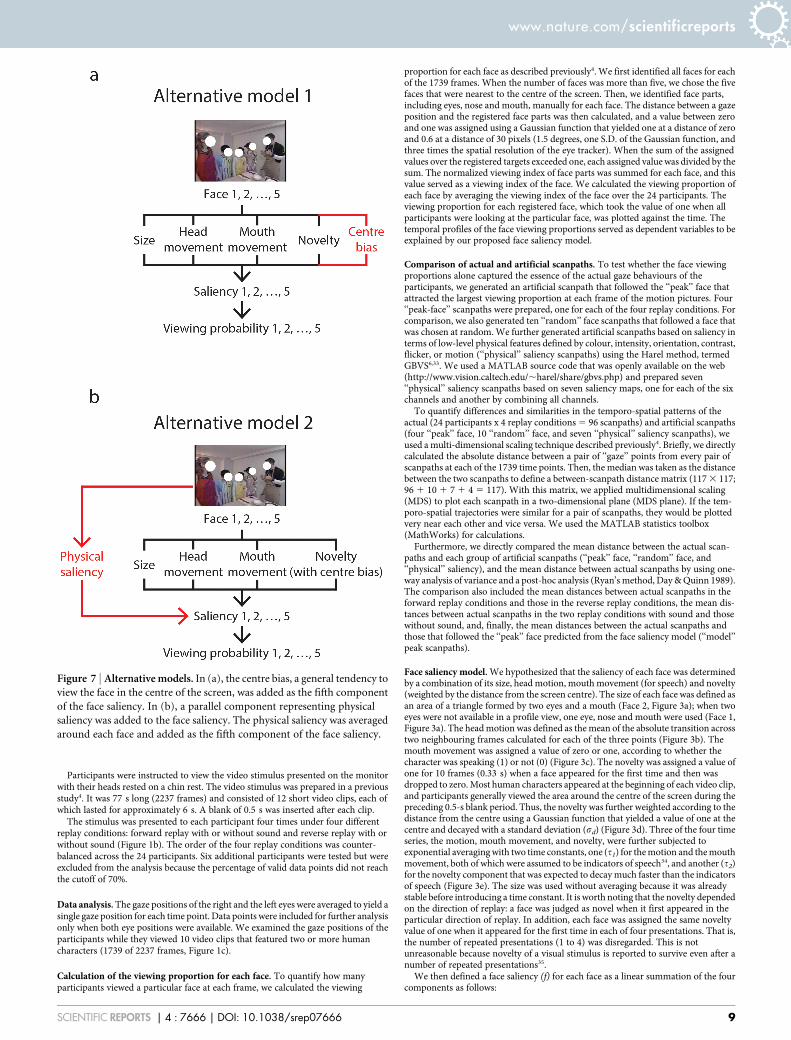
We may be able to improve the model by adding a centre bias24, ageneral tendency to view the centre of the screen, as the fifth com-ponent (Alternative model 1, Fig. 7b; 10 parameters). However, themodel was no better than the 9 parameter model in terms of d.c. orAIC (Table 1). This may be because the centre bias was alreadyimplemented in the novelty component in the 9 parameter model(Eq. 1). In addition, it is probable that the centre bias is apparent onlyat the beginning of each scene24 but disappears thereafter.
Another line of improvement may be achieved by adding a phys-ical saliency as a parallel component25,26 (Alternative model 2, Fig. 7b,10 parameters). In fact, the parallel model was slightly better than theoriginal model in terms of both d.c. (improvement from 0.869 to0.872 at best) and AIC, when we used colour (d.c. 5 0.871, DAIC 5
-310), intensity (0.871, -233), orientation (0.872, -435), or all chan-nels (0.870, -133). However, the model was slightly worse in terms ofthe AIC, when we used contrast (0.869, 1130), flicker (0.869, 1246),or motion (0.869, 194).
Te variance that was left unexplained by the current four compon-ent model could be explained by adding these and other componentsto the definition of face saliency.
Neural correlates of the face saliency. It is often assumed that thesubcortical neural circuits, including the superior colliculus, the
pulvinar and the amygdala, contribute to face detection27–29. Theamygdala is also implicated for detection of novelty13,15 and is thusa good candidate that may contribute to the novelty component.
Of course, a number of face areas in the cerebral cortex should becontributing to the four components. For example, most of the occi-pitotemporal face areas are responsive both to biological motion andface stimuli (for review, see Ref. 16) and are candidate neural corre-lates of the head and mouth movement components. Neurons in thesuperior temporal sulcus in monkeys are reported to respond toarticulated head motions30. Human homologues of such neuronsare candidate neural correlates of the head movement component.As for the size, most studies to date emphasize that neural responsesin the cortical face areas are not altered by size31. However, a recentneuroimaging study reported that responses in the fusiform face areaincreased with the size of the face stimuli12. A previous study has alsoreported that the size of the face did affect the responses of some faceresponsive neurons in the superior temporal sulcus of monkeys32.Thus, these temporal face areas are among candidates that wouldrepresent the size component.
However, we still do not know anything regarding how multiplefaces are represented in these areas, how the four components thatseem to be represented over several areas, including subcortical andcortical areas, are combined, or how the face saliency assigned to eachface is to be compared among a number of faces. Neural correlates offace saliency warrant further investigations.
MethodsParticipants. Twenty-four healthy adults (12 men and 12 women) with a mean age of23 years (s.d.: 5.2 years) participated. They were normal or corrected to normal intheir visual acuity. All experimental protocols were approved by the Ethical ReviewBoard of Juntendo University School of Medicine, and was performed in accordancewith the approved guidelines and the Declaration of Helsinki. All participants gavewritten informed consent before the experiments.
Apparatus, stimuli, and general task designs. Participants were seated on a chairfacing a 17-inch TFT flat-screen monitor (Eizo, FlexScan S1701; full screen was usedat a resolution of 640 3 480 pixels), which was placed 60 cm away from their eyes.The gaze positions of both eyes were recorded at 50 Hz with a remote eye tracker(Tobii, 350, Tobii Technology AB) set below the monitor.
Figure 6 | Effects of gestures on face saliency. Three frames, where the face saliency model (solid lines) yielded the first (a), second (b), and third (c)
largest errors from the actual viewing proportion (dotted line), are shown, respectively, in the bottom (d, e, and f; taken from Clips No. 5, 1, and 2,
respectively; ‘‘Okaasan to Issho’’, NHK). Shadings show a period when the error exceeded 0.4, and the vertical line shows the timing of peak errors. Note
that a gymnastics instructor was opening or closing his arms (d) and a teacher was raising her hand (e), when most participants were looking at their faces.
Orange bars show periods when they moved their arms. Note that in (f), most participants were looking at a girl (second from the right) who was intensely
looked at by the previous speaker on the right (a tall man). Note that faces were not covered by the white circles in the actual experiments.
www.nature.com/scientificreports
SCIENTIFIC REPORTS | 4 : 7666 | DOI: 10.1038/srep07666 8
Participants were instructed to view the video stimulus presented on the monitorwith their heads rested on a chin rest. The video stimulus was prepared in a previousstudy4. It was 77 s long (2237 frames) and consisted of 12 short video clips, each ofwhich lasted for approximately 6 s. A blank of 0.5 s was inserted after each clip.
The stimulus was presented to each participant four times under four differentreplay conditions: forward replay with or without sound and reverse replay with orwithout sound (Figure 1b). The order of the four replay conditions was counter-balanced across the 24 participants. Six additional participants were tested but wereexcluded from the analysis because the percentage of valid data points did not reachthe cutoff of 70%.
Data analysis. The gaze positions of the right and the left eyes were averaged to yield asingle gaze position for each time point. Data points were included for further analysisonly when both eye positions were available. We examined the gaze positions of theparticipants while they viewed 10 video clips that featured two or more humancharacters (1739 of 2237 frames, Figure 1c).
Calculation of the viewing proportion for each face. To quantify how manyparticipants viewed a particular face at each frame, we calculated the viewing
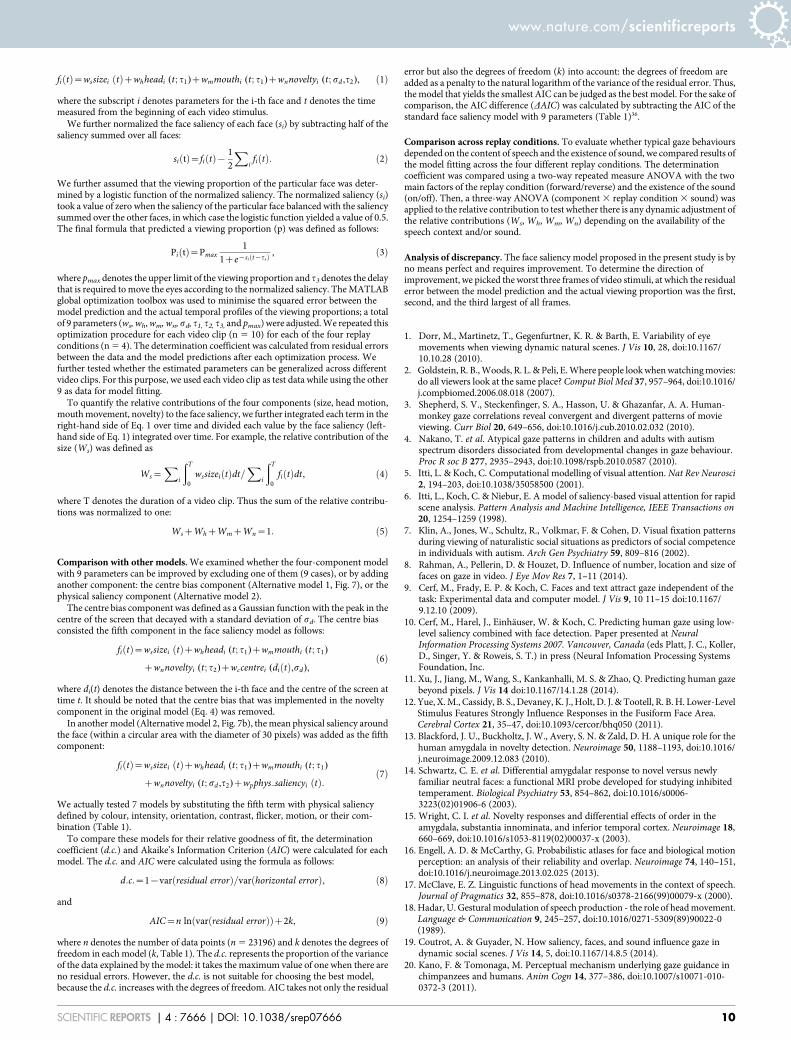
proportion for each face as described previously4. We first identified all faces for eachof the 1739 frames. When the number of faces was more than five, we chose the fivefaces that were nearest to the centre of the screen. Then, we identified face parts,including eyes, nose and mouth, manually for each face. The distance between a gazeposition and the registered face parts was then calculated, and a value between zeroand one was assigned using a Gaussian function that yielded one at a distance of zeroand 0.6 at a distance of 30 pixels (1.5 degrees, one S.D. of the Gaussian function, andthree times the spatial resolution of the eye tracker). When the sum of the assignedvalues over the registered targets exceeded one, each assigned value was divided by thesum. The normalized viewing index of face parts was summed for each face, and thisvalue served as a viewing index of the face. We calculated the viewing proportion ofeach face by averaging the viewing index of the face over the 24 participants. Theviewing proportion for each registered face, which took the value of one when allparticipants were looking at the particular face, was plotted against the time. Thetemporal profiles of the face viewing proportions served as dependent variables to beexplained by our proposed face saliency model.
Comparison of actual and artificial scanpaths. To test whether the face viewingproportions alone captured the essence of the actual gaze behaviours of theparticipants, we generated an artificial scanpath that followed the ‘‘peak’’ face thatattracted the largest viewing proportion at each frame of the motion pictures. Four‘‘peak-face’’ scanpaths were prepared, one for each of the four replay conditions. Forcomparison, we also generated ten ‘‘random’’ face scanpaths that followed a face thatwas chosen at random. We further generated artificial scanpaths based on saliency interms of low-level physical features defined by colour, intensity, orientation, contrast,flicker, or motion (‘‘physical’’ saliency scanpaths) using the Harel method, termedGBVS6,33. We used a MATLAB source code that was openly available on the web(http://www.vision.caltech.edu/,harel/share/gbvs.php) and prepared seven‘‘physical’’ saliency scanpaths based on seven saliency maps, one for each of the sixchannels and another by combining all channels.
To quantify differences and similarities in the temporo-spatial patterns of theactual (24 participants x 4 replay conditions 5 96 scanpaths) and artificial scanpaths(four ‘‘peak’’ face, 10 ‘‘random’’ face, and seven ‘‘physical’’ saliency scanpaths), weused a multi-dimensional scaling technique described previously4. Briefly, we directlycalculated the absolute distance between a pair of ‘‘gaze’’ points from every pair ofscanpaths at each of the 1739 time points. Then, the median was taken as the distancebetween the two scanpaths to define a between-scanpath distance matrix (117 3 117;96 1 10 1 7 1 4 5 117). With this matrix, we applied multidimensional scaling(MDS) to plot each scanpath in a two-dimensional plane (MDS plane). If the tem-poro-spatial trajectories were similar for a pair of scanpaths, they would be plottedvery near each other and vice versa. We used the MATLAB statistics toolbox(MathWorks) for calculations.
Furthermore, we directly compared the mean distance between the actual scan-paths and each group of artificial scanpaths (‘‘peak’’ face, ‘‘random’’ face, and‘‘physical’’ saliency), and the mean distance between actual scanpaths by using one-way analysis of variance and a post-hoc analysis (Ryan’s method, Day & Quinn 1989).The comparison also included the mean distances between actual scanpaths in theforward replay conditions and those in the reverse replay conditions, the mean dis-tances between actual scanpaths in the two replay conditions with sound and thosewithout sound, and, finally, the mean distances between the actual scanpaths andthose that followed the ‘‘peak’’ face predicted from the face saliency model (‘‘model’’peak scanpaths).
Face saliency model. We hypothesized that the saliency of each face was determinedby a combination of its size, head motion, mouth movement (for speech) and novelty(weighted by the distance from the screen centre). The size of each face was defined asan area of a triangle formed by two eyes and a mouth (Face 2, Figure 3a); when twoeyes were not available in a profile view, one eye, nose and mouth were used (Face 1,Figure 3a). The head motion was defined as the mean of the absolute transition acrosstwo neighbouring frames calculated for each of the three points (Figure 3b). Themouth movement was assigned a value of zero or one, according to whether thecharacter was speaking (1) or not (0) (Figure 3c). The novelty was assigned a value ofone for 10 frames (0.33 s) when a face appeared for the first time and then wasdropped to zero. Most human characters appeared at the beginning of each video clip,and participants generally viewed the area around the centre of the screen during thepreceding 0.5-s blank period. Thus, the novelty was further weighted according to thedistance from the centre using a Gaussian function that yielded a value of one at thecentre and decayed with a standard deviation (sd) (Figure 3d). Three of the four timeseries, the motion, mouth movement, and novelty, were further subjected toexponential averaging with two time constants, one (t1) for the motion and the mouthmovement, both of which were assumed to be indicators of speech34, and another (t2)for the novelty component that was expected to decay much faster than the indicatorsof speech (Figure 3e). The size was used without averaging because it was alreadystable before introducing a time constant. It is worth noting that the novelty dependedon the direction of replay: a face was judged as novel when it first appeared in theparticular direction of replay. In addition, each face was assigned the same noveltyvalue of one when it appeared for the first time in each of four presentations. That is,the number of repeated presentations (1 to 4) was disregarded. This is notunreasonable because novelty of a visual stimulus is reported to survive even after anumber of repeated presentations35.
We then defined a face saliency (f) for each face as a linear summation of the fourcomponents as follows:
Figure 7 | Alternative models. In (a), the centre bias, a general tendency to
view the face in the centre of the screen, was added as the fifth component
of the face saliency. In (b), a parallel component representing physical
saliency was added to the face saliency. The physical saliency was averaged
around each face and added as the fifth component of the face saliency.
www.nature.com/scientificreports
SCIENTIFIC REPORTS | 4 : 7666 | DOI: 10.1038/srep07666 9
fi tð Þ~wssizei tð Þzwhheadi (t; t1)zwmmouthi (t; t1)zwnnoveltyi (t; sd ,t2), ð1Þ
where the subscript i denotes parameters for the i-th face and t denotes the timemeasured from the beginning of each video stimulus.
We further normalized the face saliency of each face (si) by subtracting half of thesaliency summed over all faces:
si tð Þ~fi tð Þ{ 12
Xifi tð Þ: ð2Þ
We further assumed that the viewing proportion of the particular face was deter-mined by a logistic function of the normalized saliency. The normalized saliency (si)took a value of zero when the saliency of the particular face balanced with the saliencysummed over the other faces, in which case the logistic function yielded a value of 0.5.The final formula that predicted a viewing proportion (p) was defined as follows:
Pi tð Þ~Pmax1
1ze{si t{tsð Þ , ð3Þ
where pmax denotes the upper limit of the viewing proportion and t3 denotes the delaythat is required to move the eyes according to the normalized saliency. The MATLABglobal optimization toolbox was used to minimise the squared error between themodel prediction and the actual temporal profiles of the viewing proportions; a totalof 9 parameters (ws, wh, wm, wn, sd, t1, t2, t3, and pmax) were adjusted. We repeated thisoptimization procedure for each video clip (n 5 10) for each of the four replayconditions (n 5 4). The determination coefficient was calculated from residual errorsbetween the data and the model predictions after each optimization process. Wefurther tested whether the estimated parameters can be generalized across differentvideo clips. For this purpose, we used each video clip as test data while using the other9 as data for model fitting.
To quantify the relative contributions of the four components (size, head motion,mouth movement, novelty) to the face saliency, we further integrated each term in theright-hand side of Eq. 1 over time and divided each value by the face saliency (left-hand side of Eq. 1) integrated over time. For example, the relative contribution of thesize (Ws) was defined as
Ws~X
i
ðT
0wssizei tð Þdt=
Xi
ðT
0fi tð Þdt, ð4Þ
where T denotes the duration of a video clip. Thus the sum of the relative contribu-tions was normalized to one:
WszWhzWmzWn~1: ð5Þ
Comparison with other models. We examined whether the four-component modelwith 9 parameters can be improved by excluding one of them (9 cases), or by addinganother component: the centre bias component (Alternative model 1, Fig. 7), or thephysical saliency component (Alternative model 2).
The centre bias component was defined as a Gaussian function with the peak in thecentre of the screen that decayed with a standard deviation of sd. The centre biasconsisted the fifth component in the face saliency model as follows:
fi tð Þ~wssizei tð Þzwhheadi (t; t1)zwmmouthi (t; t1)
zwnnoveltyi (t; t2)zwccentrei (di tð Þ,sd),ð6Þ
where di(t) denotes the distance between the i-th face and the centre of the screen attime t. It should be noted that the centre bias that was implemented in the noveltycomponent in the original model (Eq. 4) was removed.
In another model (Alternative model 2, Fig. 7b), the mean physical saliency aroundthe face (within a circular area with the diameter of 30 pixels) was added as the fifthcomponent:
fi tð Þ~wssizei tð Þzwhheadi (t; t1)zwmmouthi (t; t1)
zwnnoveltyi (t; sd ,t2)zwpphys saliencyi tð Þ:ð7Þ
We actually tested 7 models by substituting the fifth term with physical saliencydefined by colour, intensity, orientation, contrast, flicker, motion, or their com-bination (Table 1).
To compare these models for their relative goodness of fit, the determinationcoefficient (d.c.) and Akaike’s Information Criterion (AIC) were calculated for eachmodel. The d.c. and AIC were calculated using the formula as follows:
d:c:~1{var residual errorð Þ=var horizontal errorð Þ, ð8Þ
and
AIC~n ln var residual errorð Þð Þz2k, ð9Þ
where n denotes the number of data points (n 5 23196) and k denotes the degrees offreedom in each model (k, Table 1). The d.c. represents the proportion of the varianceof the data explained by the model: it takes the maximum value of one when there areno residual errors. However, the d.c. is not suitable for choosing the best model,because the d.c. increases with the degrees of freedom. AIC takes not only the residual
error but also the degrees of freedom (k) into account: the degrees of freedom areadded as a penalty to the natural logarithm of the variance of the residual error. Thus,the model that yields the smallest AIC can be judged as the best model. For the sake ofcomparison, the AIC difference (DAIC) was calculated by subtracting the AIC of thestandard face saliency model with 9 parameters (Table 1)36.
Comparison across replay conditions. To evaluate whether typical gaze behavioursdepended on the content of speech and the existence of sound, we compared results ofthe model fitting across the four different replay conditions. The determinationcoefficient was compared using a two-way repeated measure ANOVA with the twomain factors of the replay condition (forward/reverse) and the existence of the sound(on/off). Then, a three-way ANOVA (component 3 replay condition 3 sound) wasapplied to the relative contribution to test whether there is any dynamic adjustment ofthe relative contributions (Ws, Wh, Wm, Wn) depending on the availability of thespeech context and/or sound.
Analysis of discrepancy. The face saliency model proposed in the present study is byno means perfect and requires improvement. To determine the direction ofimprovement, we picked the worst three frames of video stimuli, at which the residualerror between the model prediction and the actual viewing proportion was the first,second, and the third largest of all frames.
1. Dorr, M., Martinetz, T., Gegenfurtner, K. R. & Barth, E. Variability of eyemovements when viewing dynamic natural scenes. J Vis 10, 28, doi:10.1167/10.10.28 (2010).
2. Goldstein, R. B., Woods, R. L. & Peli, E. Where people look when watching movies:do all viewers look at the same place? Comput Biol Med 37, 957–964, doi:10.1016/j.compbiomed.2006.08.018 (2007).
3. Shepherd, S. V., Steckenfinger, S. A., Hasson, U. & Ghazanfar, A. A. Human-monkey gaze correlations reveal convergent and divergent patterns of movieviewing. Curr Biol 20, 649–656, doi:10.1016/j.cub.2010.02.032 (2010).
4. Nakano, T. et al. Atypical gaze patterns in children and adults with autismspectrum disorders dissociated from developmental changes in gaze behaviour.Proc R soc B 277, 2935–2943, doi:10.1098/rspb.2010.0587 (2010).
5. Itti, L. & Koch, C. Computational modelling of visual attention. Nat Rev Neurosci2, 194–203, doi:10.1038/35058500 (2001).
6. Itti, L., Koch, C. & Niebur, E. A model of saliency-based visual attention for rapidscene analysis. Pattern Analysis and Machine Intelligence, IEEE Transactions on20, 1254–1259 (1998).
7. Klin, A., Jones, W., Schultz, R., Volkmar, F. & Cohen, D. Visual fixation patternsduring viewing of naturalistic social situations as predictors of social competencein individuals with autism. Arch Gen Psychiatry 59, 809–816 (2002).
8. Rahman, A., Pellerin, D. & Houzet, D. Influence of number, location and size offaces on gaze in video. J Eye Mov Res 7, 1–11 (2014).
9. Cerf, M., Frady, E. P. & Koch, C. Faces and text attract gaze independent of thetask: Experimental data and computer model. J Vis 9, 10 11–15 doi:10.1167/9.12.10 (2009).
10. Cerf, M., Harel, J., Einhauser, W. & Koch, C. Predicting human gaze using low-level saliency combined with face detection. Paper presented at NeuralInformation Processing Systems 2007. Vancouver, Canada (eds Platt, J. C., Koller,D., Singer, Y. & Roweis, S. T.) in press (Neural Infomation Processing SystemsFoundation, Inc.
11. Xu, J., Jiang, M., Wang, S., Kankanhalli, M. S. & Zhao, Q. Predicting human gazebeyond pixels. J Vis 14 doi:10.1167/14.1.28 (2014).
12. Yue, X. M., Cassidy, B. S., Devaney, K. J., Holt, D. J. & Tootell, R. B. H. Lower-LevelStimulus Features Strongly Influence Responses in the Fusiform Face Area.Cerebral Cortex 21, 35–47, doi:10.1093/cercor/bhq050 (2011).
13. Blackford, J. U., Buckholtz, J. W., Avery, S. N. & Zald, D. H. A unique role for thehuman amygdala in novelty detection. Neuroimage 50, 1188–1193, doi:10.1016/j.neuroimage.2009.12.083 (2010).
14. Schwartz, C. E. et al. Differential amygdalar response to novel versus newlyfamiliar neutral faces: a functional MRI probe developed for studying inhibitedtemperament. Biological Psychiatry 53, 854–862, doi:10.1016/s0006-3223(02)01906-6 (2003).
15. Wright, C. I. et al. Novelty responses and differential effects of order in theamygdala, substantia innominata, and inferior temporal cortex. Neuroimage 18,660–669, doi:10.1016/s1053-8119(02)00037-x (2003).
16. Engell, A. D. & McCarthy, G. Probabilistic atlases for face and biological motionperception: an analysis of their reliability and overlap. Neuroimage 74, 140–151,doi:10.1016/j.neuroimage.2013.02.025 (2013).
17. McClave, E. Z. Linguistic functions of head movements in the context of speech.Journal of Pragmatics 32, 855–878, doi:10.1016/s0378-2166(99)00079-x (2000).
18. Hadar, U. Gestural modulation of speech production - the role of head movement.Language & Communication 9, 245–257, doi:10.1016/0271-5309(89)90022-0(1989).
19. Coutrot, A. & Guyader, N. How saliency, faces, and sound influence gaze indynamic social scenes. J Vis 14, 5, doi:10.1167/14.8.5 (2014).
20. Kano, F. & Tomonaga, M. Perceptual mechanism underlying gaze guidance inchimpanzees and humans. Anim Cogn 14, 377–386, doi:10.1007/s10071-010-0372-3 (2011).
www.nature.com/scientificreports
SCIENTIFIC REPORTS | 4 : 7666 | DOI: 10.1038/srep07666 10
21. Tatler, B. W., Hayhoe, M. M., Land, M. F. & Ballard, D. H. Eye guidance in naturalvision: reinterpreting salience. J Vis 11, 5, doi:10.1167/11.5.5 (2011).
22. Giese, M. A. & Poggio, T. Neural mechanisms for the recognition of biologicalmovements. Nat Rev Neurosci 4, 179–192, doi:10.1038/nrn1057 (2003).
23. Frischen, A., Bayliss, A. P. & Tipper, S. P. Gaze cueing of attention: visualattention, social cognition, and individual differences. Psychol Bull 133, 694–724,doi:10.1037/0033-2909.133.4.694 (2007).
24. Marat, S., Rahman, A., Pellerin, D., Guyader, N. & Houzet, D. Improving visualsaliency by adding ‘face feature map’ and ‘center bias’. Cogn Comput 5, 63–75(2013).
25. Sugano, Y., Matsushita, Y. & Sato, Y. Appearance-based gaze estimation usingvisual saliency. IEEE Trans Pattern Anal Mach Intell 35, 329–341, doi:10.1109/TPAMI.2012.101 (2013).
26. Schauerte, B. & Stiefelhagen, R. Predicting human gaze using quaternion DCTimage signature saliency and face detection. Paper presented at 2012 IEEEWorkshop on Applications of Computer Vision (WACV) Breckenridge, Colorado137–144 doi:10.1109/WACV.2012.6163035 (Piscataway, New Jersey, IEEE, 2012,9 Jan).
27. de Gelder, B., Frissen, I., Barton, J. & Hadjikhani, N. A modulatory role for facialexpressions in prosopagnosia. Proc Natl Acad Sci U S A 100, 13105–13110,doi:10.1073/pnas.1735530100 (2003).
28. Johnson, M. H. Subcortical face processing. Nat Rev Neurosci 6, 766–774,doi:10.1038/nrn1766 (2005).
29. Nakano, T., Higashida, N. & Kitazawa, S. Facilitation of face recognition throughthe retino-tectal pathway. Neuropsychologia 51, 2043–2049, doi:10.1016/j.neuropsychologia.2013.06.018 (2013).
30. Jellema, T. & Perrett, D. I. Cells in monkey STS responsive to articulated bodymotions and consequent static posture: a case of implied motion?Neuropsychologia 41, 1728–1737 (2003).
31. Rolls, E. T. The representation of information about faces in the temporal andfrontal lobes. Neuropsychologia 45, 124–143, doi:10.1016/j.neuropsychologia.2006.04.019 (2007).
32. Rolls, E. T. & Baylis, G. C. Size and contrast have only small effects on theresponses to faces of neurons in the cortex of the superior temporal sulcus of themonkey. Exp Brain Res 65, 38–48 (1986).
33. Harel, J., Koch, C. & Perona, P. Graph-based visual saliency. Paper presented at20th Annual Conference on Neural Information Processing Systems 2006.
Vancouver, British Columbia, Canada 545–552 (New York, Neural InformationProcessing Systems (NIPS), 2006, 4 Dec).
34. Hadar, U., Steiner, T. J., Grant, E. C. & Rose, F. C. Head movement correlates ofjuncture and stress at sentence level. Lang Speech 26, 117–129 (1983).
35. Foley, N. C., Jangraw, D. C., Peck, C. & Gottlieb, J. Novelty enhances visualsalience independently of reward in the parietal lobe. J Neurosci 34, 7947–7957,doi:10.1523/JNEUROSCI.4171-13.2014 (2014).
36. Burnham, K. P. & Anderson, D. R. Model selection and multimodel inference: apractical information -theoretic approach. 2nd edn, (Springer, 2002).
AcknowledgmentsThe study was partly supported by Grants-in-Aid for Scientific Research on InnovativeAreas (#25119002) and the Health Labour Sciences Research Grant from the Ministry ofHealth Labour and Welfare to S.K.
Author contributionsY.S. and S.K. designed the study, collected and analysed the data, and wrote the paper.
Additional informationCompeting financial interests: The authors declare no competing financial interests.
How to cite this article: Suda, Y. & Kitazawa, S. A model of face selection in viewing videostories. Sci. Rep. 4, 7666; DOI:10.1038/srep07666 (2014).
This work is licensed under a Creative Commons Attribution-NonCommercial-NoDerivs 4.0 International License. The images or other third party material inthis article are included in the article’s Creative Commons license, unless indicatedotherwise in the credit line; if the material is not included under the CreativeCommons license, users will need to obtain permission from the license holderin order to reproduce the material. To view a copy of this license, visit http://creativecommons.org/licenses/by-nc-nd/4.0/
www.nature.com/scientificreports
SCIENTIFIC REPORTS | 4 : 7666 | DOI: 10.1038/srep07666 11