Embed Size (px)
Citation preview
6/18/2015
1
Makarand (Mark) Hastak, Ph.D., PE, CCPProfessor and Head, Construction Engineering & Management
Professor of Civil Engineering, Purdue UniversityEditor-in-Chief, ASCE Journal of Management in Engineering
A Model for Profitability Analysis of a Construction
Company
Purdue University
2
West Lafayette, Indiana
6/18/2015
2
Purdue University
3
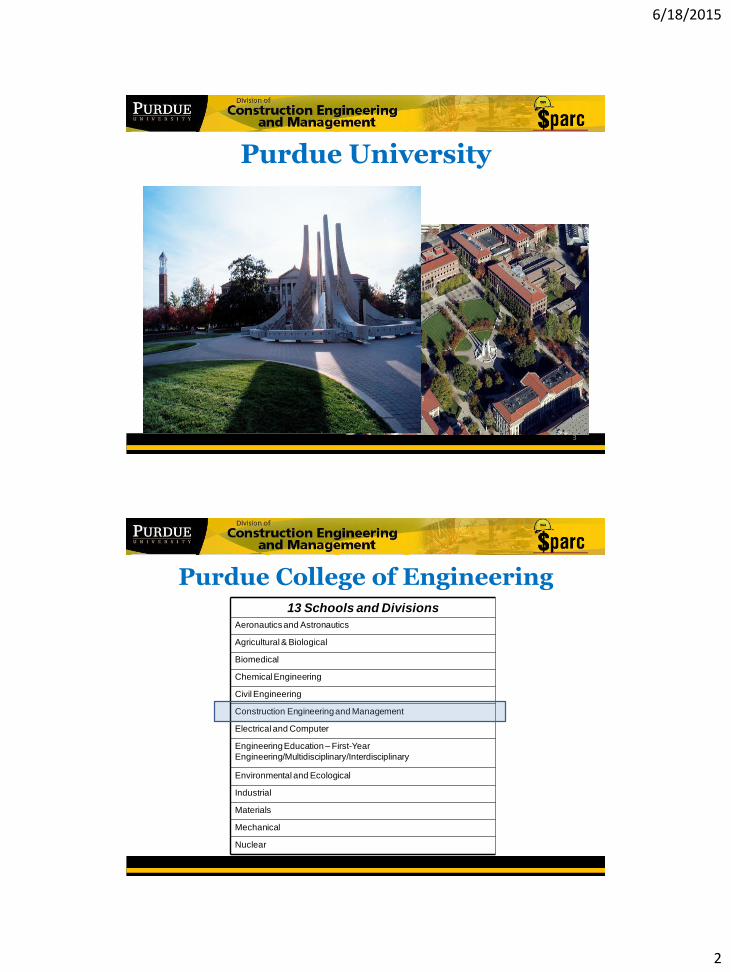
Purdue College of Engineering13 Schools and Divisions
Aeronautics and Astronautics
Agricultural & Biological
Biomedical
Chemical Engineering
Civil Engineering
Construction Engineering and Management
Electrical and Computer
Engineering Education –First-Year
Engineering/Multidisciplinary/Interdisciplinary
Environmental and Ecological
Industrial
Materials
Mechanical
Nuclear

6/18/2015
3
Introduction to CEM
• Established in 1976 (38 years)
• CEM Faculty – 6 tenure track CEM/CE faculty– 7 Faculty of Engineering Practice and Lecturers– 2 tenure track ME faculty (Courtesy Appointment)– 2 tenure track NE faculty (Courtesy Appointment)
• One of the largest Construction Engineering faculty in the U.S.
CEM Curriculum
80% Engineering, 20% Management
Focused on construction industry requirements
Areas of specialization
Students can Minor in any areas of Engineering
Three 12-week paid internships with CEM sponsor firm
Minor in CEM available for students in other majors
6/18/2015
4
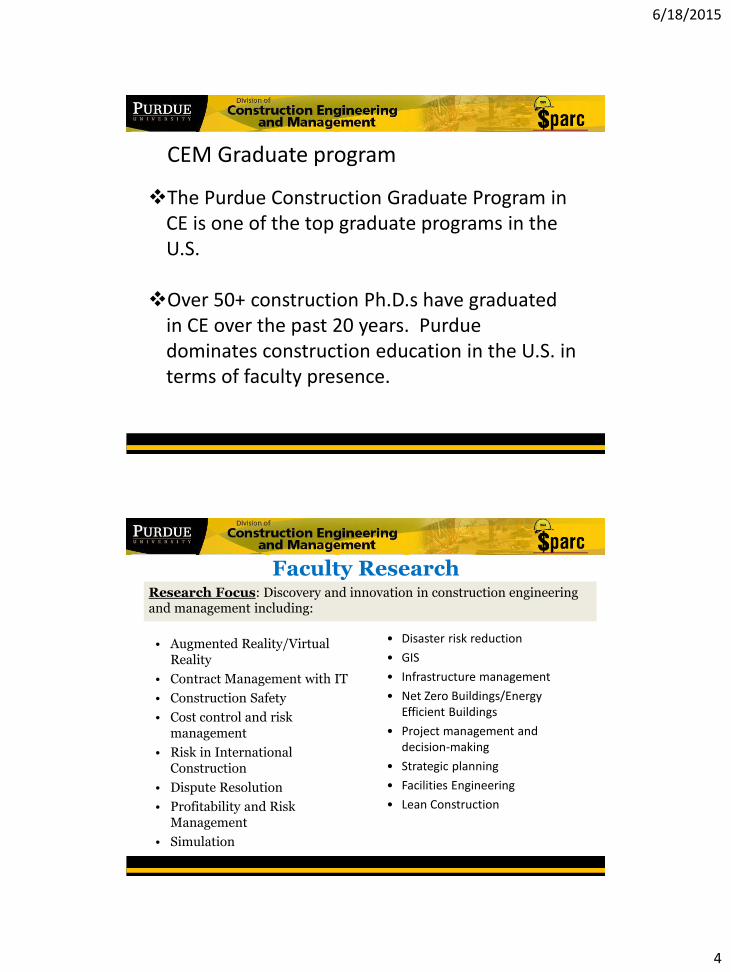
The Purdue Construction Graduate Program in CE is one of the top graduate programs in the U.S.
Over 50+ construction Ph.D.s have graduated in CE over the past 20 years. Purdue dominates construction education in the U.S. in terms of faculty presence.
CEM Graduate program
Research Focus: Discovery and innovation in construction engineering and management including:
Faculty Research
• Augmented Reality/Virtual Reality
• Contract Management with IT
• Construction Safety
• Cost control and risk management
• Risk in International Construction
• Dispute Resolution
• Profitability and Risk Management
• Simulation
• Disaster risk reduction
• GIS
• Infrastructure management
• Net Zero Buildings/Energy Efficient Buildings
• Project management and decision-making
• Strategic planning
• Facilities Engineering
• Lean Construction
6/18/2015
5
SPARC LAB – Division of CEM
“Solutions for Profitability and Assessment of Risk in Construction”
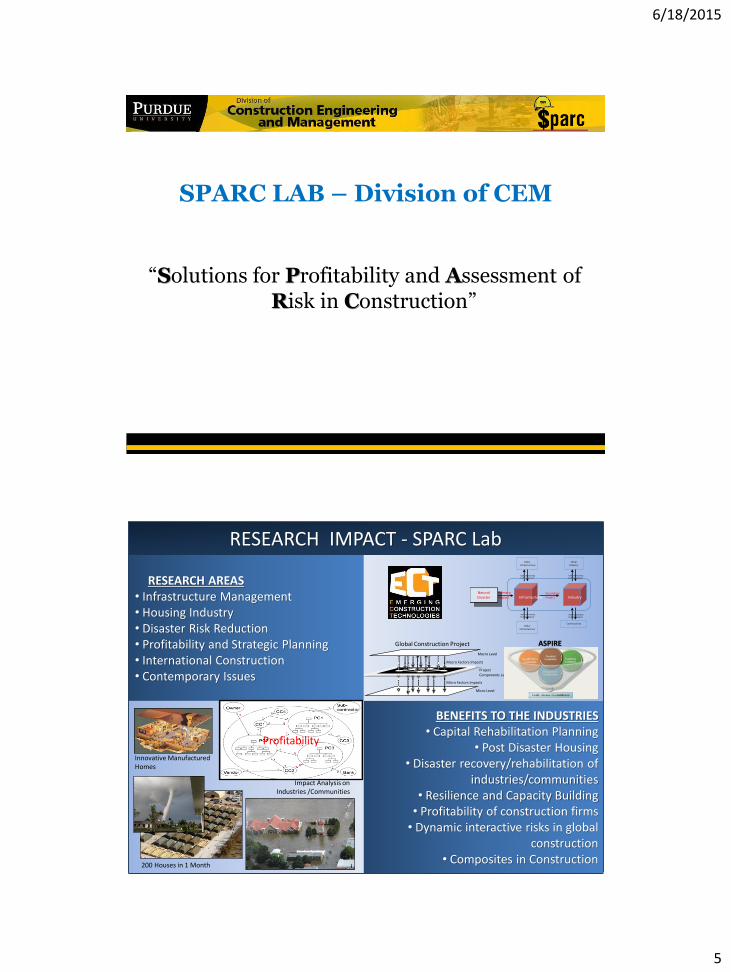
RESEARCH IMPACT - SPARC Lab
Global Construction Project
Micro Level
Macro Level
Project Components Level
Micro Factors Impacts
Macro Factors Impacts
BENEFITS TO THE INDUSTRIES• Capital Rehabilitation Planning
• Post Disaster Housing• Disaster recovery/rehabilitation of
industries/communities• Resilience and Capacity Building• Profitability of construction firms• Dynamic interactive risks in global
construction• Composites in Construction
InfrastructurePrimaryImpact
Inter-relationship(Indirect Impact)
Natural Disaster
OtherInfrastructure
OtherInfrastructure
SecondaryImpact Industry
Other Industry
Communities
Inter-relationship(Indirect Impact)
Inter-relationship(Indirect Impact)
Inter-relationship(Indirect Impact)
ASPIRE
200 Houses in 1 Month
Impact Analysis on Industries /Communities
Innovative Manufactured Homes
RESEARCH AREAS• Infrastructure Management• Housing Industry• Disaster Risk Reduction• Profitability and Strategic Planning• International Construction• Contemporary Issues
Profitability
6/18/2015
6
Risk Assessment
Infrastructure
Housing Industry
Profitability
International Construction
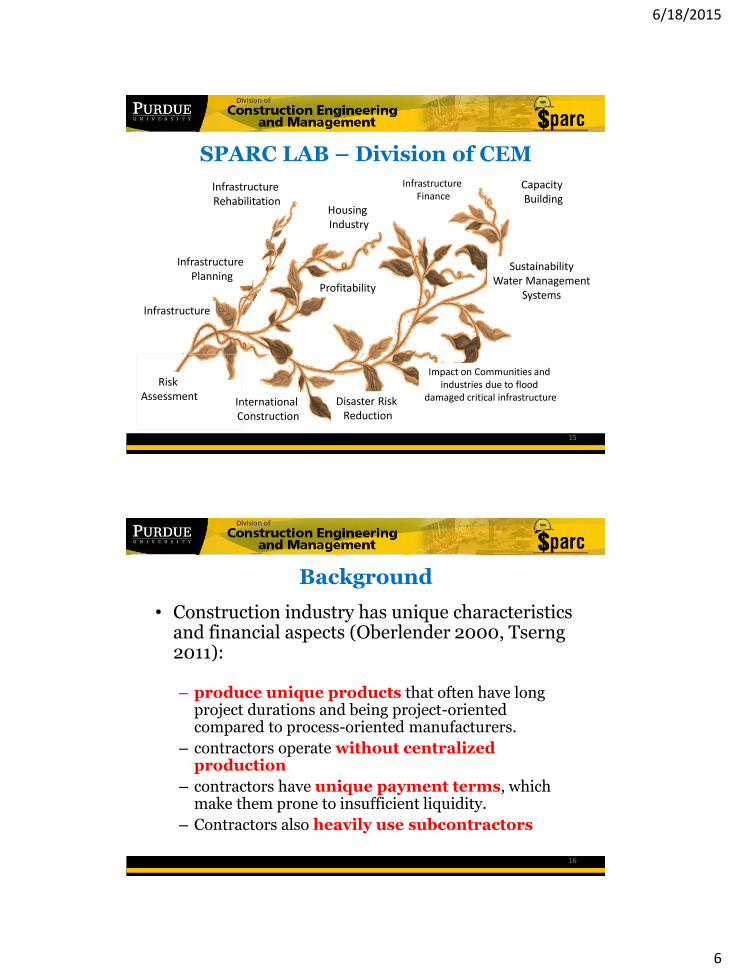
SPARC LAB – Division of CEM
Infrastructure Planning
Infrastructure Rehabilitation
Impact on Communities and industries due to flood
damaged critical infrastructure
SustainabilityWater Management
Systems
Disaster Risk Reduction
Capacity Building
15
Infrastructure Finance
Background
• Construction industry has unique characteristics and financial aspects (Oberlender 2000, Tserng2011):
– produce unique products that often have long project durations and being project-oriented compared to process-oriented manufacturers.
– contractors operate without centralized production
– contractors have unique payment terms, which make them prone to insufficient liquidity.
– Contractors also heavily use subcontractors
16
6/18/2015
7
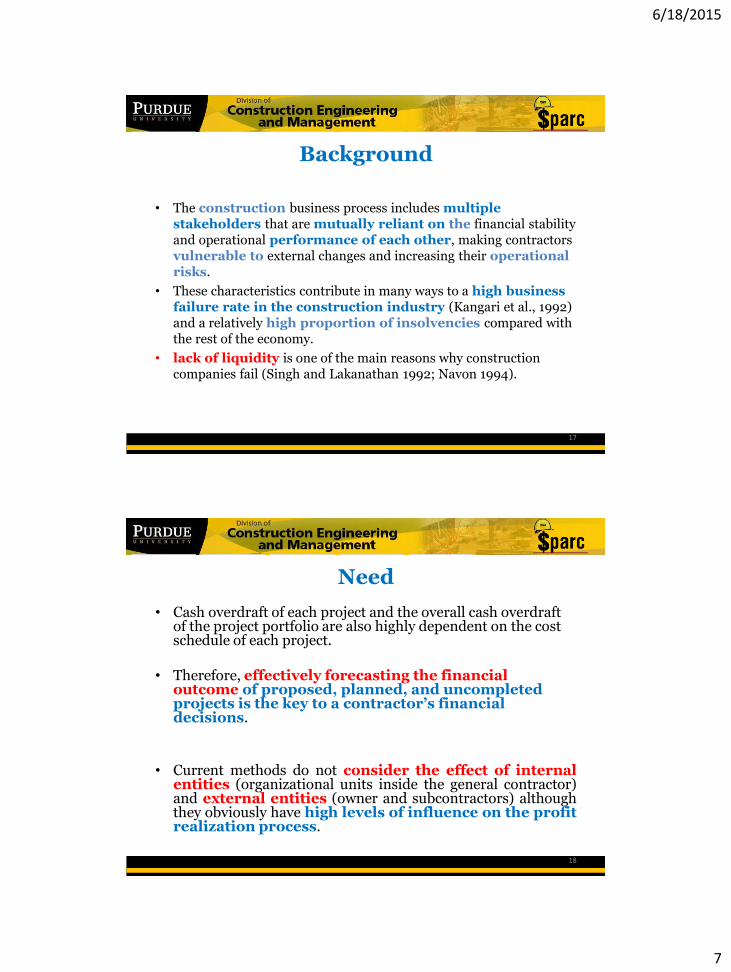
Background
• The construction business process includes multiple stakeholders that are mutually reliant on the financial stability and operational performance of each other, making contractors vulnerable to external changes and increasing their operational risks.
• These characteristics contribute in many ways to a high business failure rate in the construction industry (Kangari et al., 1992) and a relatively high proportion of insolvencies compared with the rest of the economy.
• lack of liquidity is one of the main reasons why construction companies fail (Singh and Lakanathan 1992; Navon 1994).
17
Need
• Cash overdraft of each project and the overall cash overdraft of the project portfolio are also highly dependent on the cost schedule of each project.
• Therefore, effectively forecasting the financial outcome of proposed, planned, and uncompleted projects is the key to a contractor’s financial decisions.
• Current methods do not consider the effect of internalentities (organizational units inside the general contractor)and external entities (owner and subcontractors) althoughthey obviously have high levels of influence on the profitrealization process.
18
6/18/2015
8
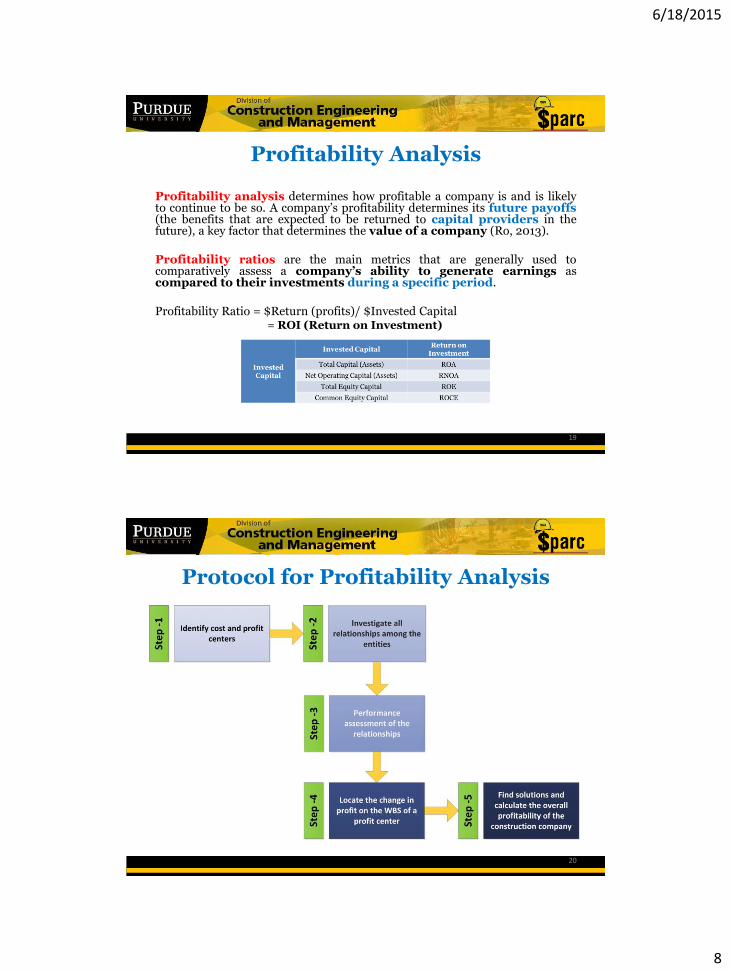
Profitability Analysis
Profitability analysis determines how profitable a company is and is likelyto continue to be so. A company’s profitability determines its future payoffs(the benefits that are expected to be returned to capital providers in thefuture), a key factor that determines the value of a company (Ro, 2013).
Profitability ratios are the main metrics that are generally used tocomparatively assess a company’s ability to generate earnings ascompared to their investments during a specific period.
Profitability Ratio = $Return (profits)/ $Invested Capital= ROI (Return on Investment)
19
Protocol for Profitability Analysis
20
6/18/2015
9
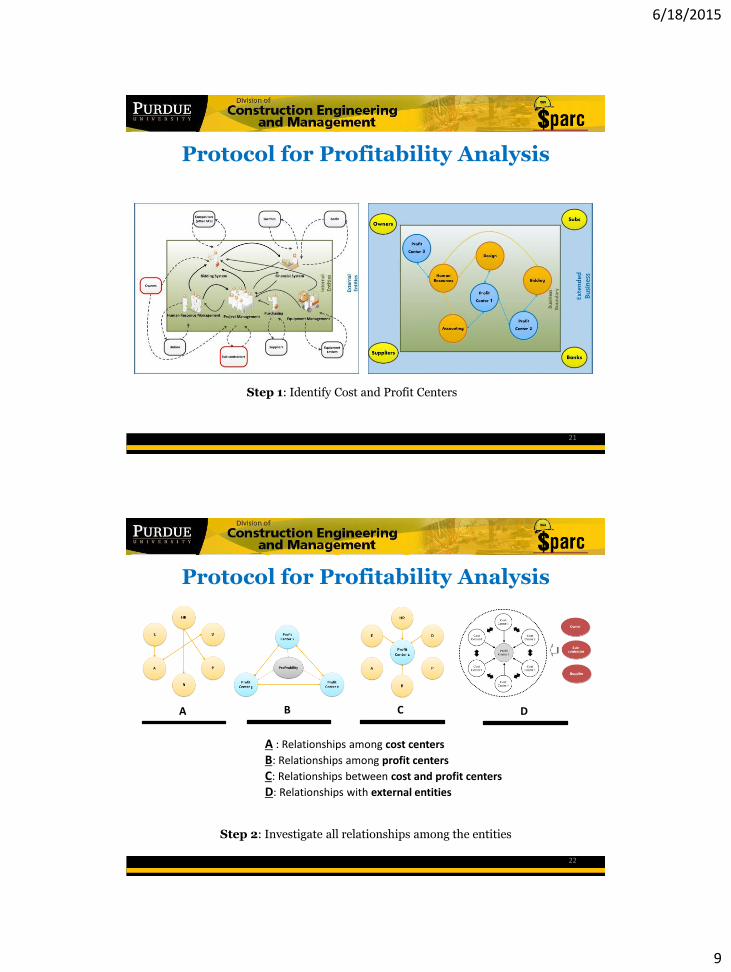
Protocol for Profitability Analysis
21
Step 1: Identify Cost and Profit Centers
Protocol for Profitability Analysis
22
A B C D
A : Relationships among cost centers
B: Relationships among profit centers
C: Relationships between cost and profit centers
D: Relationships with external entities
Step 2: Investigate all relationships among the entities
6/18/2015
10
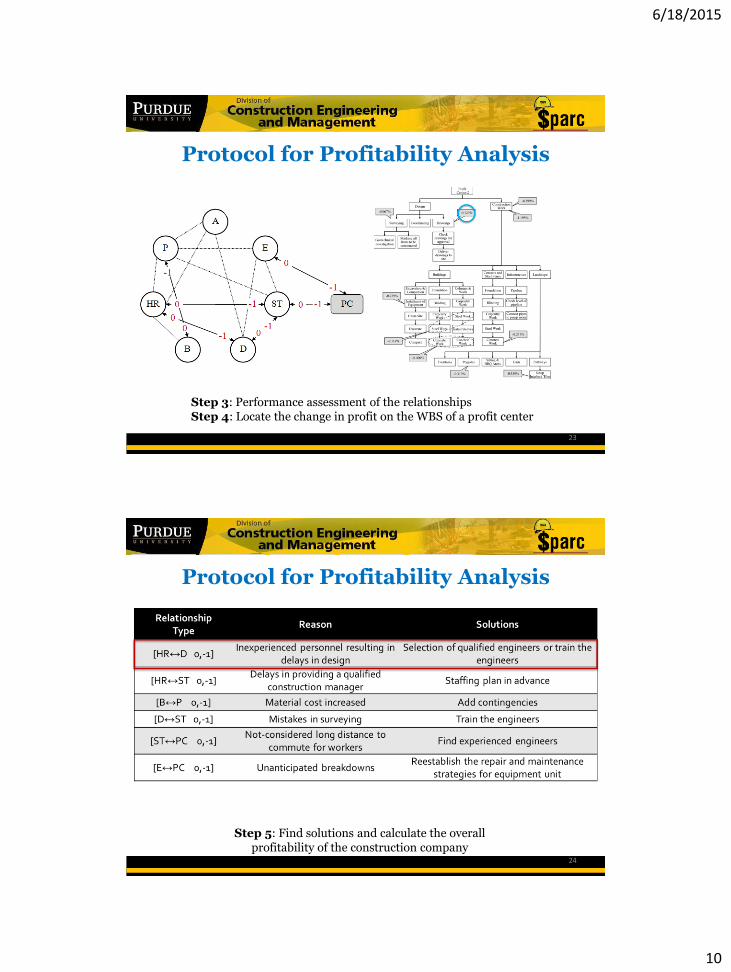
Protocol for Profitability Analysis
23
Step 3: Performance assessment of the relationshipsStep 4: Locate the change in profit on the WBS of a profit center
Protocol for Profitability Analysis
24
Step 5: Find solutions and calculate the overall profitability of the construction company
6/18/2015
11
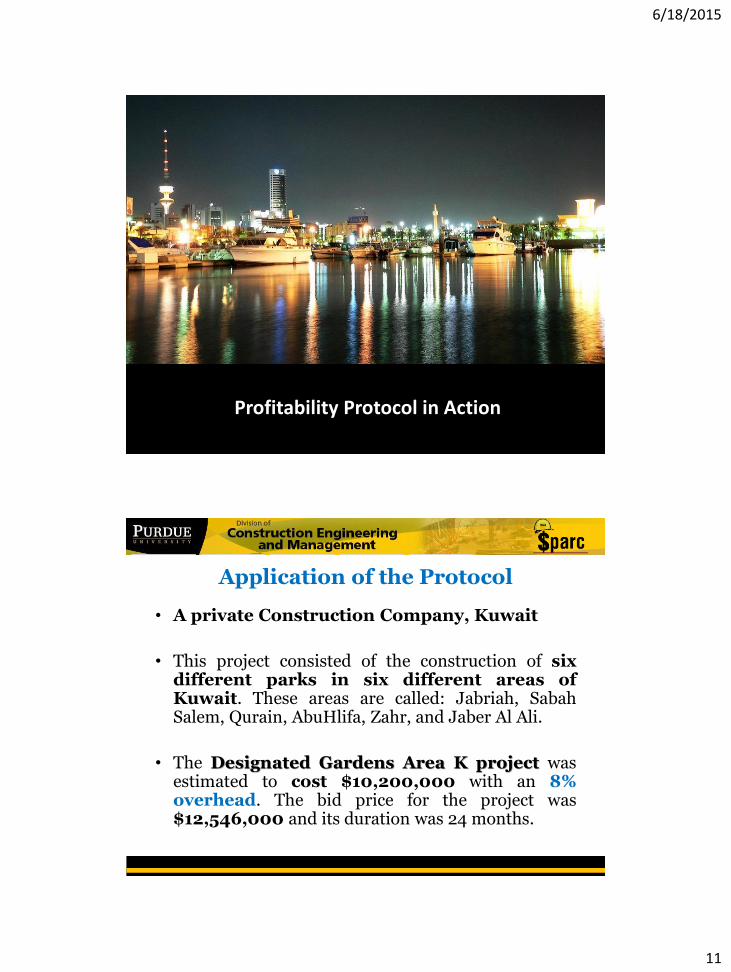
Profitability Protocol in Action
Application of the Protocol
• A private Construction Company, Kuwait
• This project consisted of the construction of sixdifferent parks in six different areas ofKuwait. These areas are called: Jabriah, SabahSalem, Qurain, AbuHlifa, Zahr, and Jaber Al Ali.
• The Designated Gardens Area K project wasestimated to cost $10,200,000 with an 8%overhead. The bid price for the project was$12,546,000 and its duration was 24 months.
i
iOC iPMPMPM ),3,2,1(
6/18/2015
12
Application of the Protocol
• Designated Gardens Area K project (Profit center)
– Bid value: $12,546,000
– Project cost: $10,200,000
– Overhead (8%): $816,000
– Estimated Profit: $1,530,000
i
iOC iPMPMPM ),3,2,1(
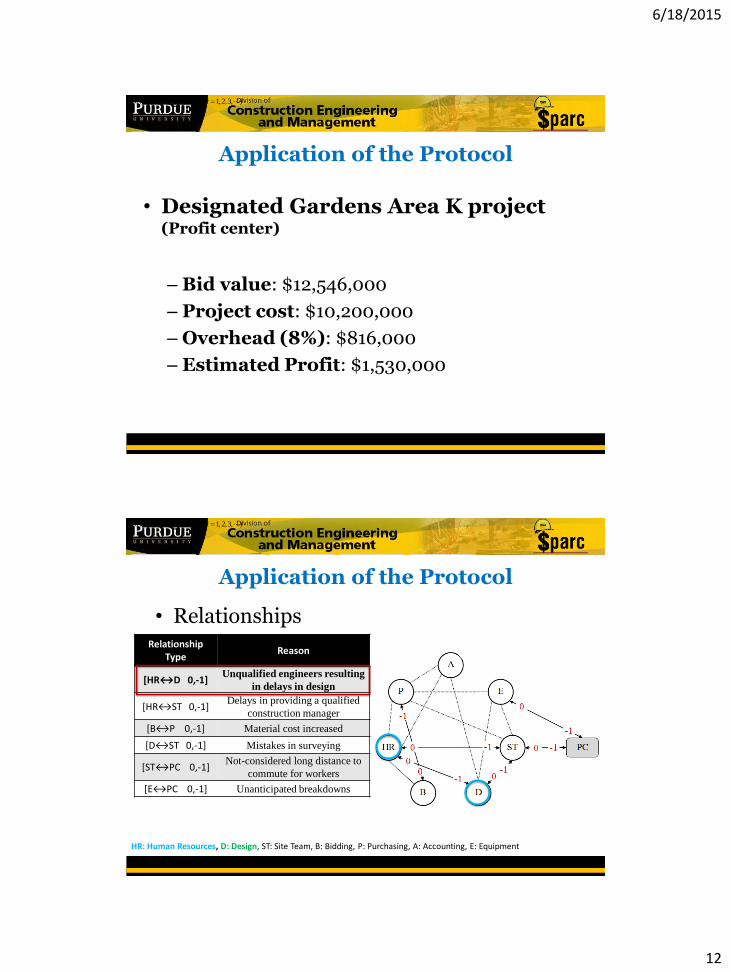
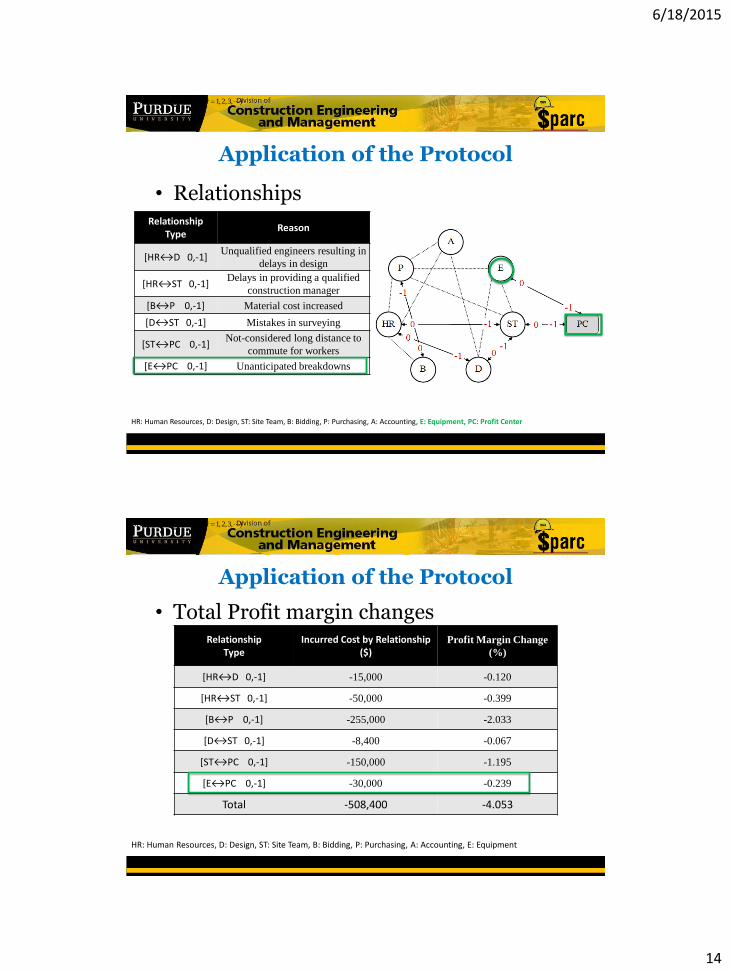
Application of the Protocol
• Relationships
i
iOC iPMPMPM ),3,2,1(
RelationshipType
Reason
[HR↔D 0,-1]Unqualified engineers resulting
in delays in design
[HR↔ST 0,-1]Delays in providing a qualified
construction manager
[B↔P 0,-1] Material cost increased
[D↔ST 0,-1] Mistakes in surveying
[ST↔PC 0,-1]Not-considered long distance to
commute for workers
[E↔PC 0,-1] Unanticipated breakdowns
HR: Human Resources, D: Design, ST: Site Team, B: Bidding, P: Purchasing, A: Accounting, E: Equipment
6/18/2015
13
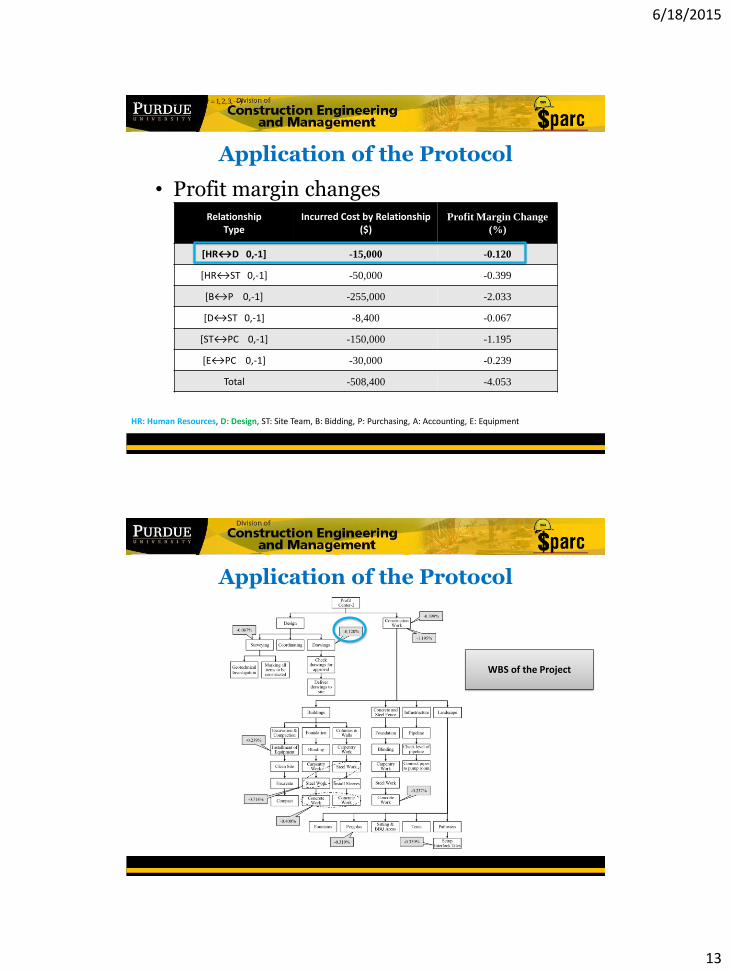
Application of the Protocol
• Profit margin changes
i
iOC iPMPMPM ),3,2,1(
RelationshipType
Incurred Cost by Relationship ($)
Profit Margin Change
(%)
[HR↔D 0,-1] -15,000 -0.120
[HR↔ST 0,-1] -50,000 -0.399
[B↔P 0,-1] -255,000 -2.033
[D↔ST 0,-1] -8,400 -0.067
[ST↔PC 0,-1] -150,000 -1.195
[E↔PC 0,-1] -30,000 -0.239
Total -508,400 -4.053
HR: Human Resources, D: Design, ST: Site Team, B: Bidding, P: Purchasing, A: Accounting, E: Equipment
Application of the Protocol
WBS of the Project
6/18/2015
14
Application of the Protocol
• Relationships
i
iOC iPMPMPM ),3,2,1(
RelationshipType
Reason
[HR↔D 0,-1]Unqualified engineers resulting in
delays in design
[HR↔ST 0,-1]Delays in providing a qualified
construction manager
[B↔P 0,-1] Material cost increased
[D↔ST 0,-1] Mistakes in surveying
[ST↔PC 0,-1]Not-considered long distance to
commute for workers
[E↔PC 0,-1] Unanticipated breakdowns
HR: Human Resources, D: Design, ST: Site Team, B: Bidding, P: Purchasing, A: Accounting, E: Equipment, PC: Profit Center
Application of the Protocol
• Total Profit margin changes
i
iOC iPMPMPM ),3,2,1(
RelationshipType
Incurred Cost by Relationship ($)
Profit Margin Change
(%)
[HR↔D 0,-1] -15,000 -0.120
[HR↔ST 0,-1] -50,000 -0.399
[B↔P 0,-1] -255,000 -2.033
[D↔ST 0,-1] -8,400 -0.067
[ST↔PC 0,-1] -150,000 -1.195
[E↔PC 0,-1] -30,000 -0.239
Total -508,400 -4.053
HR: Human Resources, D: Design, ST: Site Team, B: Bidding, P: Purchasing, A: Accounting, E: Equipment
6/18/2015
15
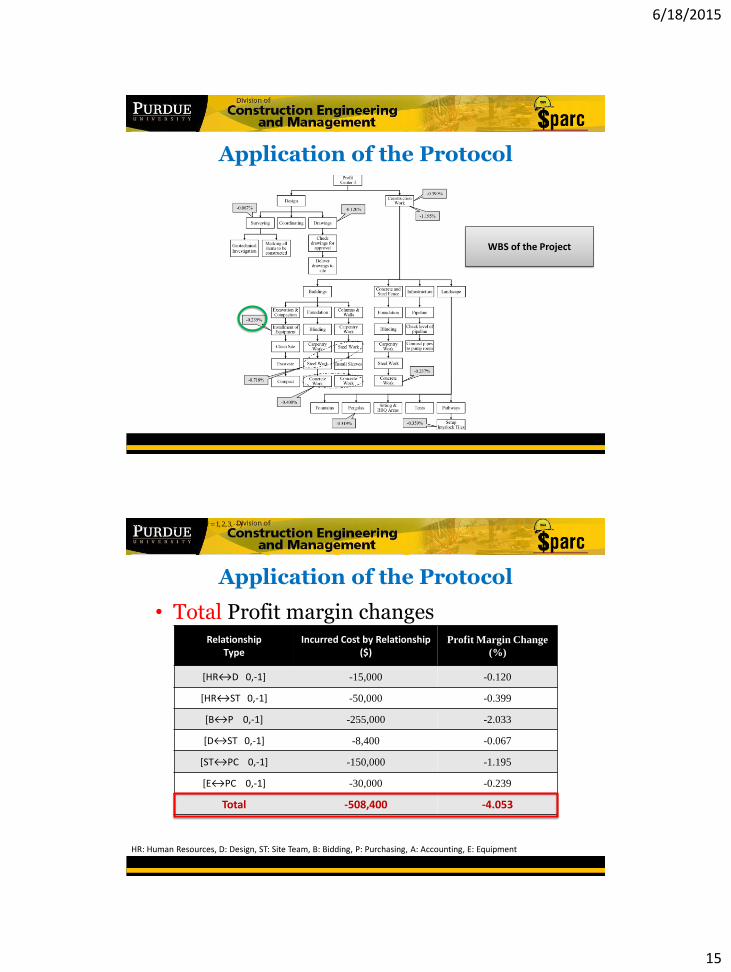
Application of the Protocol
WBS of the Project
Application of the Protocol
• Total Profit margin changes
i
iOC iPMPMPM ),3,2,1(
RelationshipType
Incurred Cost by Relationship ($)
Profit Margin Change
(%)
[HR↔D 0,-1] -15,000 -0.120
[HR↔ST 0,-1] -50,000 -0.399
[B↔P 0,-1] -255,000 -2.033
[D↔ST 0,-1] -8,400 -0.067
[ST↔PC 0,-1] -150,000 -1.195
[E↔PC 0,-1] -30,000 -0.239
Total -508,400 -4.053
HR: Human Resources, D: Design, ST: Site Team, B: Bidding, P: Purchasing, A: Accounting, E: Equipment
6/18/2015
16
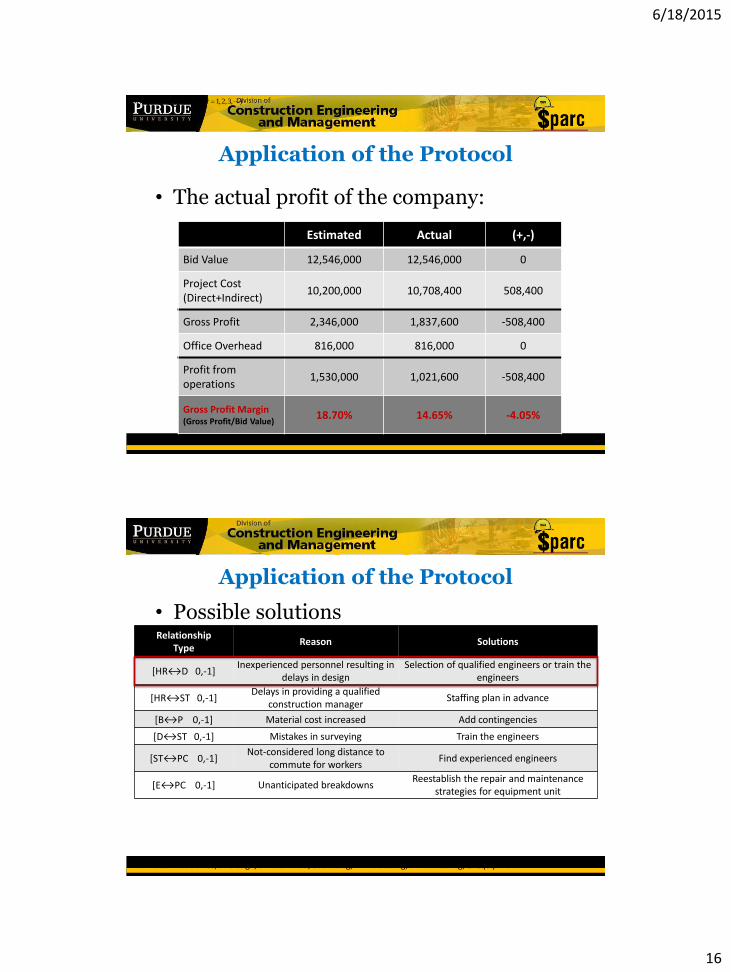
Application of the Protocol
• The actual profit of the company:
i
iOC iPMPMPM ),3,2,1(
Estimated Actual (+,-)
Bid Value 12,546,000 12,546,000 0
Project Cost (Direct+Indirect)
10,200,000 10,708,400 508,400
Gross Profit 2,346,000 1,837,600 -508,400
Office Overhead 816,000 816,000 0
Profit from operations
1,530,000 1,021,600 -508,400
Gross Profit Margin (Gross Profit/Bid Value)
18.70% 14.65% -4.05%
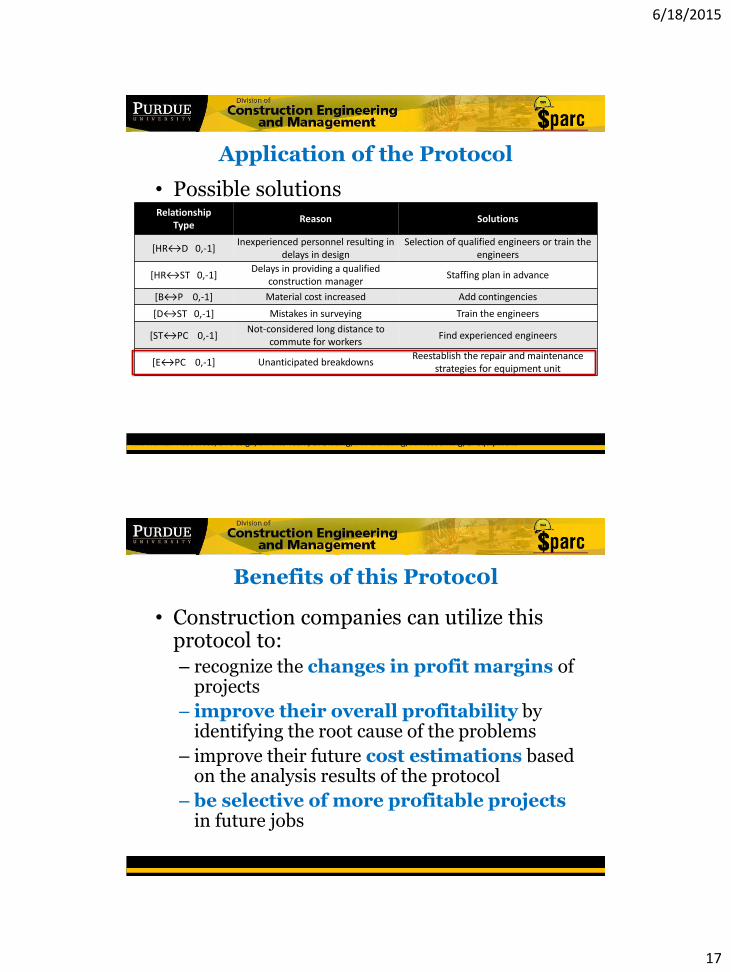
Application of the Protocol
• Possible solutionsRelationship
TypeReason Solutions
[HR↔D 0,-1]Inexperienced personnel resulting in
delays in designSelection of qualified engineers or train the
engineers
[HR↔ST 0,-1]Delays in providing a qualified
construction managerStaffing plan in advance
[B↔P 0,-1] Material cost increased Add contingencies
[D↔ST 0,-1] Mistakes in surveying Train the engineers
[ST↔PC 0,-1]Not-considered long distance to
commute for workersFind experienced engineers
[E↔PC 0,-1] Unanticipated breakdownsReestablish the repair and maintenance
strategies for equipment unit
HR: Human Resources, D: Design, ST: Site Team, B: Bidding, P: Purchasing, A: Accounting, E: Equipment
6/18/2015
17
Application of the Protocol
• Possible solutionsRelationship
TypeReason Solutions
[HR↔D 0,-1]Inexperienced personnel resulting in
delays in designSelection of qualified engineers or train the
engineers
[HR↔ST 0,-1]Delays in providing a qualified
construction managerStaffing plan in advance
[B↔P 0,-1] Material cost increased Add contingencies
[D↔ST 0,-1] Mistakes in surveying Train the engineers
[ST↔PC 0,-1]Not-considered long distance to
commute for workersFind experienced engineers
[E↔PC 0,-1] Unanticipated breakdownsReestablish the repair and maintenance
strategies for equipment unit
HR: Human Resources, D: Design, ST: Site Team, B: Bidding, P: Purchasing, A: Accounting, E: Equipment
Benefits of this Protoc0l
• Construction companies can utilize this protocol to:– recognize the changes in profit margins of
projects
– improve their overall profitability by identifying the root cause of the problems
– improve their future cost estimations based on the analysis results of the protocol
– be selective of more profitable projects in future jobs
6/18/2015
18
An Alternative Approach
• The Protocol helps us identify root cause of the problems as an ex-post analysis.
• Protocol does not consider time and profit realization process as a dynamic process.
• Time has a significant effect on cash flow and profitability.
• Dynamic interaction between project realization process and external entities (owner, subs) needs a different approach.
39
System of Systems Approach
• A “system of systems” or “collaborative systems” is an assemblage of components, which may be regarded as individual systems, and these building components have operational and managerial independence.
• Operationally-independent components are those which fulfill valid purposes in their own right and continue to operate to fulfill those purposes if disassembled from the overall system
• Managerial independence of the components means that these component systems are managed for their own purposes rather than for the purpose of the whole.
40
6/18/2015
19
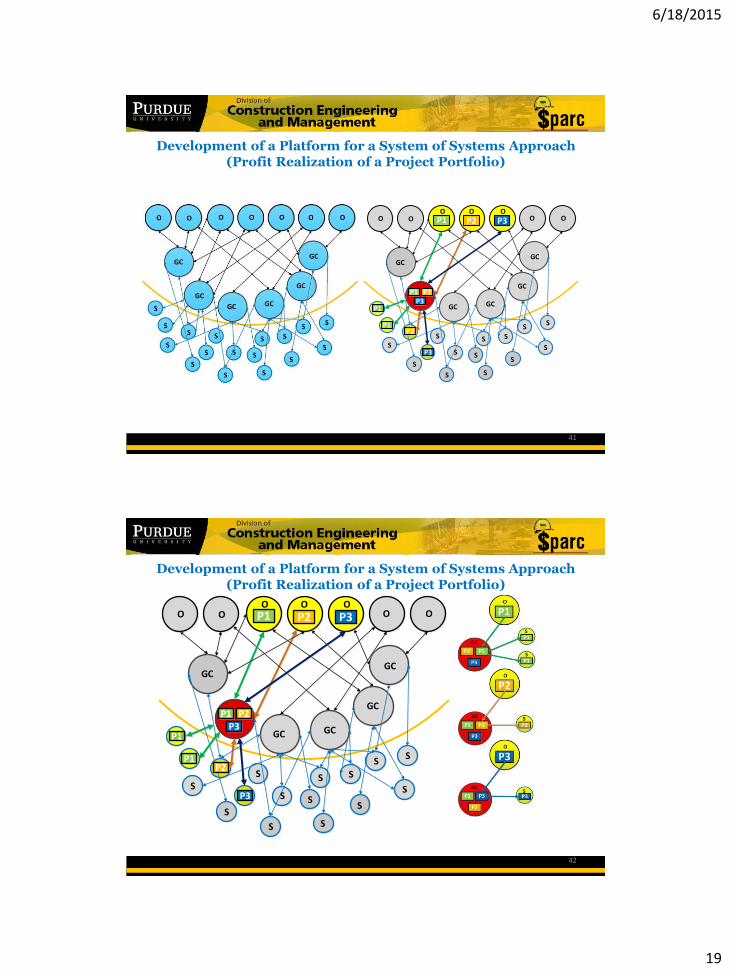
Development of a Platform for a System of Systems Approach (Profit Realization of a Project Portfolio)
41
GC
S
O
P1
P2 P3O
OO O
O O
GC GC
GC
GC
P2P3
P1
P1P2
P3
S
S
S
S
S
S S
S
S
SS
S
P1
Development of a Platform for a System of Systems Approach (Profit Realization of a Project Portfolio)
42
GC
S
O
P1
P2 P3O
OO O
O O
GC GC
GC
GC
P2P3
P1
P1P2
P3
S
S
S
S
S
S S
S
S
SS
S
P1
6/18/2015
20
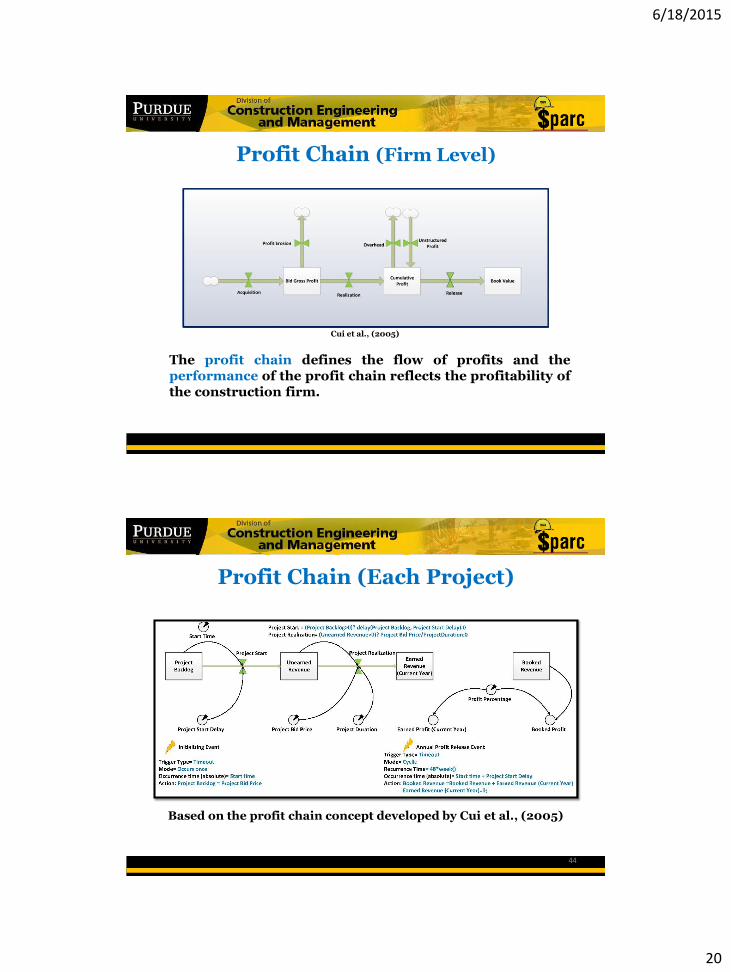
Profit Chain (Firm Level)
The profit chain defines the flow of profits and theperformance of the profit chain reflects the profitability ofthe construction firm.
Cui et al., (2005)
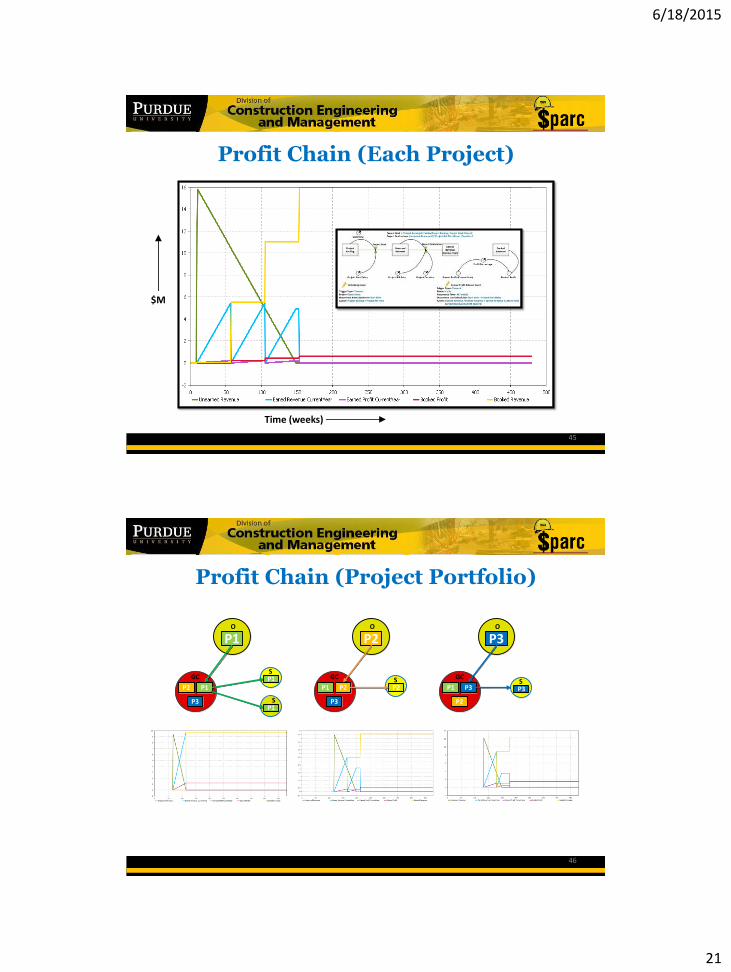
Profit Chain (Each Project)
44
Based on the profit chain concept developed by Cui et al., (2005)
6/18/2015
21
Profit Chain (Each Project)
45
$M
Time (weeks)
Profit Chain (Project Portfolio)
O
P1
P1P2
P3
GC P1S
P1S
O
P2
P2
P3
GC
P2S
P1
O
P3
P3
P2
GC
P3S
P1
46
6/18/2015
22
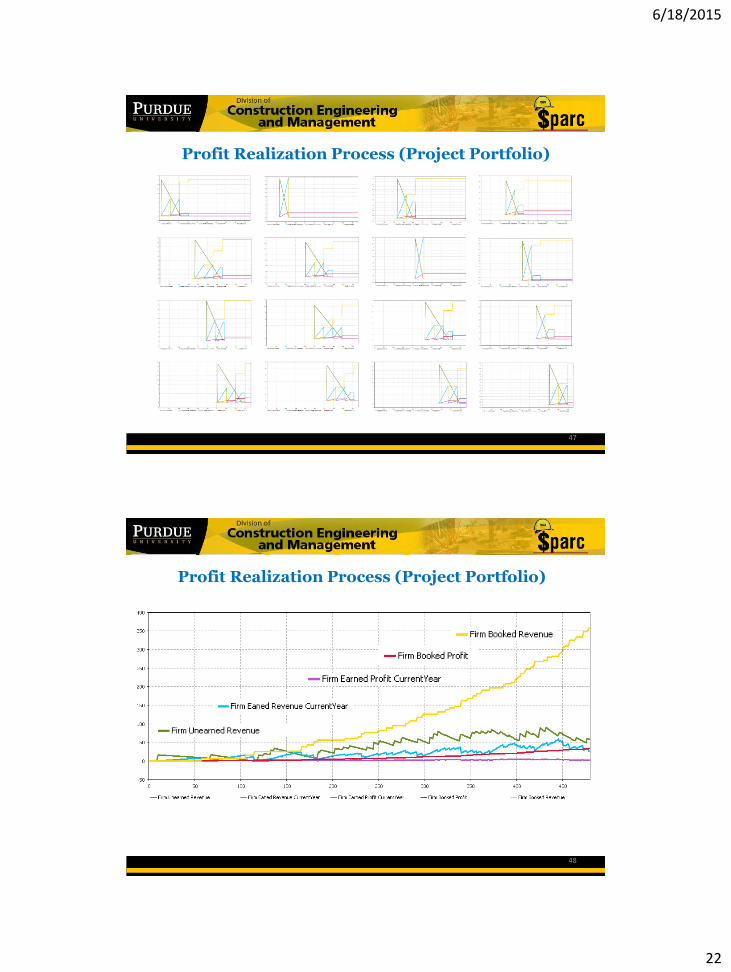
Profit Realization Process (Project Portfolio)
47
Profit Realization Process (Project Portfolio)
48

6/18/2015
23
Future Research
• Assessment of the overall financial performance of GCs by looking at the contributions of the internal and external entities to the flow of profit between key players in the construction market
• Projection of a contractor’s operating profit by simulating the projected schedule of costs
• Projection of project portfolio cash flows and its effect on a contractor’s cost of capital and overall profitability
• Examination of the effects of different scenarios on the financial performance of a firm based on the current status of the business and the known constraints in the model boundary
• Analysis of different financial management decisions on a firm’s profitability forecast
49
Makarand (Mark) Hastak, Ph.D., PE, CCPProfessor and Head, Construction Engineering & ManagementProfessor of Civil EngineeringEditor-in-Chief, ASCE Journal of Management in EngineeringPurdue [email protected]
50