Embed Size (px)
Citation preview

Cleared for Public Release
A Model for Forecasting Enlisted Student IA Billet Requirements Steven W. Belcher
with
David L. Reese and Kletus S. Lawler
March 2016

Copyright © 2016 CNA
This document contains the best opinion of CNA at the time of issue. It does not necessarily represent the opinion of the sponsor.
Distribution
Cleared for public release. Specific authority: N00014-16-D-5003.
Copies of this document can be obtained through the Defense Technical Information Center at www.dtic.mil or contact CNA Document Control and Distribution Section at 703-824-2123.
Photography Credit: 150814-N-PU674-001 PENSACOLA, Fla. (Aug. 14, 2015) Sailors attending Information Systems Technician A-school at Center for Information Dominance Unit Corry Station march to class. They are preparing to engage in a broad range of responsibilities including network administration, database management, and troubleshooting computer hardware and software. (U.S. Navy photo by Carla M. McCarthy/Released)
Approved by: March 2016
Alan J. Marcus, Acting Director Fleet and Operational Manpower Team Resource Analysis Division
i
Abstract
The student portion of the Navy’s Individuals Account (Student IA) represents the time that sailors spend in training while in a student status. Sailors in a student status are not part of the Navy’s distributable inventory and, therefore, are not available for assignment to fleet units. Overexecution of the student account, which occurs when in-year student IA execution exceeds its authorized endstrength (E/S), impedes the Navy’s ability to man the fleet.
Many factors affect how well student IA execution aligns with its authorized E/S. Chief among them is the ability to accurately forecast future student execution levels. These forecasts become the student E/S requirements for program deliberations in the Program Objectives Memorandum (POM) process. The Navy recognizes the need to improve its forecasting capability. This study addresses that need by developing a prototype model that implements a new methodology for forecasting enlisted student billet requirements. The proposed model calculates these requirements by enlisted management community (EMC) and learning center based on future accession and fleet manpower requirements.

ii
This page intentionally left blank.

iii
Executive Summary
Background and tasks
Overexecution of the student account, which occurs when in-year student IA execution exceeds authorized student endstrength (E/S), affects fleet manning levels. Having more sailors in a student status than funded student E/S means fewer sailors for assignment to the fleet. This is true whether the overexecution occurs in total (i.e., across the entire enlisted force) or within an enlisted management community.
Many factors affect how well student execution aligns with its authorized E/S. Chief among them is the ability to accurately forecast future student execution levels, because these forecasts become the student E/S requirements for program deliberations in the POM process. The Navy’s current forecasting model has limited utility. The Navy recognizes these limitations and has called for development of a new student IA requirements forecasting model. CNA was asked to support development of this new model.
To support this effort, we undertook the following tasks:
Define the objectives of a forecasting model that will be used in building the student IA program.
Develop a methodology for forecasting student IA requirements that meets these objectives.
Compile values for the model’s input variables.
Incorporate this methodology into a prototype computer-based student IA forecasting model.
Findings
We summarize the main findings from each of these tasks below.

iv
Forecasting objectives
To support building the student IA program, the forecasting model needs to generate the following output:
Enlisted student E/S requirements for the POM and FYDP years broken out by manpower resource sponsor
Enlisted student billet requirements for these years defined by enlisted management community, paygrade, and learning center.
To maximize the utility of this model, the forecasting methodology should include the following capabilities:
Base student forecasts on future manpower requirements
Account for friction (i.e., inefficiencies) in the training supply chain
Allow users to change pre-fleet training programs.
Forecasting methodology
Our proposed methodology divides the training that contributes to enlisted student IA into four categories:
Recruit training (i.e., boot camp)
Pre-fleet skills training, which consists of training that accessions attend after boot camp but before reaching the fleet
Post-fleet skills training, which consists mostly of C-school training for journeyman and supervisor NECs
“Other” training, which includes the enlisted education and enlisted-to-officer commissioning programs.
We developed separate methods to forecast student IA requirements for each of these categories. We highlight the key features of each method below.1
1 The “Other” training category accounts for less than 2 percent of all student IA execution. Therefore, we recommend that the managers of the programs in this category provide estimates of future student IA requirements.

v
Pre-fleet skills training: Our methodology segments the training programs for
each community by learning center and, within each learning center, by A-school and C-school. It calculates student IA execution based on the number of students in training and the average total time they spend in training. Because most students in pre-fleet training are new accessions, the main inputs for determining the number of students are the monthly accession goals for each rating. The total time students spend at school consists of time under instruction and time not under instruction.
Post-fleet training: Our methodology is based on the relationship between
historic execution and manpower requirements. It uses the concept of a post-fleet student IA rate, which represents the ratio of annual student IA execution time to annual full-duty time for all post-fleet sailors.
Recruit training: Our methodology for recruit training depends only on the
number of in-year and previous-year accessions, the monthly phasing of these accessions, and their total time in training.
Input variables
Our methodology uses two types of input: future manpower requirements and variables that define the training programs of each rating. Future manpower requirements include accession levels for the pre-fleet skills and recruit training models and fleet billets for the post-fleet skills training model. The training variables define the pre-fleet training paths and student flow statistics, and the post-fleet student IA rates.
Prototype forecasting tool
To implement this methodology, we developed a functional prototype Excel spreadsheet tool that provides an easy-to-use interface through which the user can enter the required input data and view the resulting forecasts of student billet requirements by rating, EMC, paygrade, learning center, and resource sponsor. Our intent in developing this prototype is that it would serve as a foundation for the Navy to build upon and modify, as necessary, to meet its student IA forecasting needs.

vi
This page intentionally left blank.

vii
Contents
Introduction .................................................................................................................................. 1
Background ............................................................................................................................. 1
Study tasks ............................................................................................................................. 2
Organization of document .................................................................................................. 2
Student Account .......................................................................................................................... 3
Student IA execution ............................................................................................................ 3
Student IA program .............................................................................................................. 4
Funding student E/S ............................................................................................................. 5
Student IA forecasting objectives........................................................................................... 7
N12’s role in student IA programming ............................................................................. 7
Model objectives .................................................................................................................... 8
Output .............................................................................................................................. 8
Approach ......................................................................................................................... 8
Other considerations ..................................................................................................... 9
Methodology ............................................................................................................................... 10
Framework ............................................................................................................................ 10
Pre-fleet skills training ....................................................................................................... 11
Design ............................................................................................................................. 11
Calculating student execution – the basics ............................................................ 13
Determining student execution within a fiscal year ............................................. 14
Output ............................................................................................................................ 15
Post-fleet skills training ..................................................................................................... 16
Recruit training .................................................................................................................... 17
Other training and education ........................................................................................... 18
Input Data .................................................................................................................................... 19
Pre-fleet training student flow statistics ........................................................................ 19
Training programs ....................................................................................................... 20
Post-fleet student IA rates ................................................................................................. 24
viii
Recruit training variables .................................................................................................. 26
Forecasting tool ......................................................................................................................... 27
Pre-fleet skills training module ........................................................................................ 27
Input ............................................................................................................................... 27
Output ............................................................................................................................ 29
Calculations ................................................................................................................... 29
Post-fleet training module ................................................................................................. 32
Recruit training module ..................................................................................................... 34
Conclusions ................................................................................................................................ 37
References ................................................................................................................................... 38

ix
List of Figures
Figure 1. Training that counts as student IA execution ........................................... 4 Figure 2. Learning center to resource sponsor alignment ....................................... 6 Figure 3. Distribution of student execution by training category:
FY 2012 - 2014 ............................................................................................... 11 Figure 4. Pre-fleet skills training model ..................................................................... 12 Figure 5. Calculating student execution in the projection year ............................ 14 Figure 6. Training days in the projection year, by accession year and month .. 15 Figure 7. Approach used in post-fleet training module ......................................... 17 Figure 8. Model for computing student IA in recruit training .............................. 17 Figure 9. Recruit training days in the projection year by accession year and
month ............................................................................................................... 18 Figure 10. Rules for determining nongraduation rates and training times .......... 22 Figure 11. Tracking components of student IA execution ....................................... 22 Figure 12. Input section of the pre-fleet skills training module: accession,
recruit training attrition, and reclassification data ................................ 30 Figure 13. Input section of the pre-fleet skills training module: training
programs and student flow statistics ........................................................ 30 Figure 14. Output section of the pre-fleet skills training module .......................... 31 Figure 15. Input section of the post-fleet skills training module: billet
requirements ................................................................................................... 32 Figure 16. Input section of the post-fleet skills training module: learning
center data....................................................................................................... 33 Figure 17. Output section of the post-fleet skills training module ....................... 34 Figure 18. Input section of the recruit training module ........................................... 35 Figure 19. Output section of the recruit training module ........................................ 36

x
This page intentionally left blank.

xi
List of Tables
Table 1. YNS pre-fleet training data .......................................................................... 20 Table 2. Pre-fleet skills training paths for submarine communities .................. 21 Table 3. Student flow statistics in pre-fleet skills training for YNS
graduates ......................................................................................................... 23 Table 4. Student flow statistics in pre-fleet skills training for YNS
nongraduates .................................................................................................. 24 Table 5. Full-duty and student IA execution time for surface combat
systems ratings in FY 2015 .......................................................................... 25 Table 6. Post-fleet student IA rates for surface combat systems ratings.......... 25

xii
This page intentionally left blank.

xiii
Glossary
ACC Accounting Category Code BUPERS Bureau of Naval Personnel CeTARS Corporate Enterprise Training Activity Resource Systems CID Center for Information Dominance Training CNATT Center Naval Aviation Technical Training CSCS Center Surface Combat Systems Training CSF Center for Security Force Training CSS Center for Service Support Training DUINS Duty Under Instruction EMC Enlisted Management Community EMR Enlisted Master Record EOD Explosive Ordnance Disposal EPA Enlisted Programmed Authorizations E/S Endstrength FY Fiscal Year IA Individuals Account NEC Navy Enlisted Classification NUI Not Under Instruction PACT Professional Apprentice Career Track PCS Permanent Change of Station PG Paygrade PFY Previous Fiscal Year POM Program Objectives Memorandum RCN Rating Control Number SLC Submarine Learning Center STA-21 Seaman to Admiral Program SWCC Special Warfare Combatant-Craft Crewmen SWOS Surface Warfare Officer School TDY Temporary Duty TEMDUINS Temporary Duty Under Instruction TFMMS Total Force Manpower Management System TPPH Transients, Patients, Prisoners, and Holdees TTT Total Time to Train UI Under Instruction

xiv
This page intentionally left blank.

1
Introduction
Background
In recent years, the Navy has struggled to meet fleet manning goals [1]. Overexecution of the student account, which occurs when in-year student IA execution exceeds authorized student endstrength (E/S), has contributed to these struggles.2 Having more sailors in a student status than funded student E/S means fewer sailors for assignment to the fleet. This is true whether the overexecution occurs in total or within an enlisted management community.3
Many factors affect how well student execution aligns with its authorized E/S. Chief among them is the ability to accurately forecast future student execution levels. These forecasts become the student E/S requirements for program deliberations in the POM process. They also are used in defining authorized student E/S at the billet level of detail for entry into the Navy’s Total Force Manpower Management System (TFMMS).4
The Total Force Manpower, Training, and Education Requirements division of the Office of the Chief of Naval Operations (OPNAV N12) defines student E/S requirements for POM deliberations. N12 also defines the authorized student E/S by rating and paygrade and enters this billet information into TFMMS. The model it currently uses to forecast these requirements is limited in that it outputs only a single execution level for the entire enlisted force.5 N12 leadership recognizes the need to improve this capability and has called for development of a new student IA requirements forecasting model.
2 The Navy uses the term endstrength in two contexts. When describing personnel, it refers to the total number of servicemembers in the Navy. When used in a programming or budgeting context, it refers to the number of authorized billets.
3Overexecution of the student account usually refers to aggregate levels, whereas misalignments in the student account refer to execution versus E/S mismatches at the community and paygrade levels.
4 TFMMS is the Navy’s authoritative source for manpower requirements.
5 The model also lacks transparency to show the contributions of each of the factors that affect student execution levels.
2
Study tasks
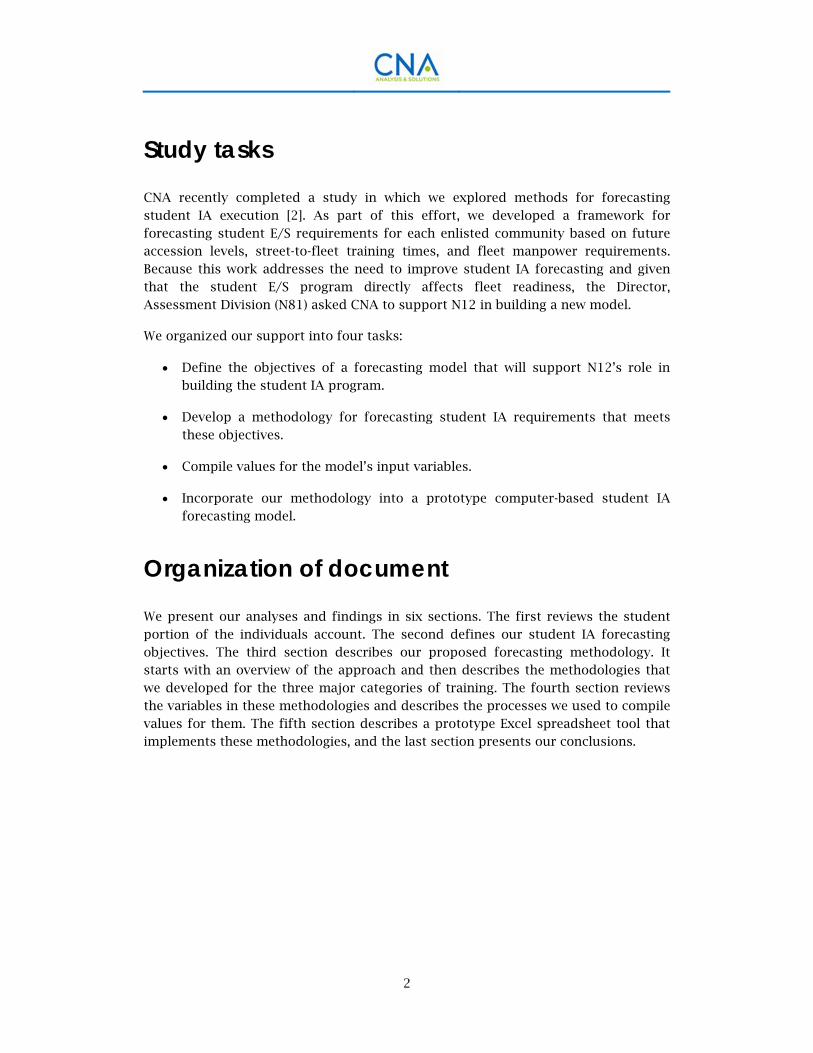
CNA recently completed a study in which we explored methods for forecasting student IA execution [2]. As part of this effort, we developed a framework for forecasting student E/S requirements for each enlisted community based on future accession levels, street-to-fleet training times, and fleet manpower requirements. Because this work addresses the need to improve student IA forecasting and given that the student E/S program directly affects fleet readiness, the Director, Assessment Division (N81) asked CNA to support N12 in building a new model.
We organized our support into four tasks:
Define the objectives of a forecasting model that will support N12’s role in building the student IA program.
Develop a methodology for forecasting student IA requirements that meets these objectives.
Compile values for the model’s input variables.
Incorporate our methodology into a prototype computer-based student IA forecasting model.
Organization of document
We present our analyses and findings in six sections. The first reviews the student portion of the individuals account. The second defines our student IA forecasting objectives. The third section describes our proposed forecasting methodology. It starts with an overview of the approach and then describes the methodologies that we developed for the three major categories of training. The fourth section reviews the variables in these methodologies and describes the processes we used to compile values for them. The fifth section describes a prototype Excel spreadsheet tool that implements these methodologies, and the last section presents our conclusions.

3
Student Account
The student account is part of the Navy’s Individuals Account (IA).6 The term
“Student IA” is used in two contexts. In the Navy’s programming and budgeting
arena, student IA is a manpower program that represents the E/S the Navy buys to account for the total time during a fiscal year that sailors spend in training while in a student status. When used in describing personnel execution, student IA refers to the average number of servicemembers in training in a student status.
Student IA execution
Student IA execution consists of sailors who attend training in a student status. These sailors are assigned to student Unit Identification Codes (UICs) and have an Accounting Category Code (ACC) of 340, 341, or 342. Sailors in a student status are not part of the Navy’s distributable inventory and, therefore, are not available for assignment to fleet units.
Not all the formal schoolhouse training counts toward student IA execution. As shown in Figure 1, most chargeable training (i.e., training that counts toward student IA execution) is one of two types. The first is the initial entry training that recruits attend before reaching their first full-duty station. This comprises recruit training, A-school training, and, for some ratings and enlistment programs, C-school training.7
6 The related Transient, Patient, Prisoner, and Holdee (TPPH) account, which is the other component of the Individuals Account, contains endstrength to account for the times when sailors are in transit between assignments or in a prisoner, patient, or holdee status.
7 DoD Instruction 1120.11 states that student IA includes “all in-transit time commencing upon entry into active service through completion of the final course of initial entry training” [3].

4
Figure 1. Training that counts as student IA execution
The second type of chargeable training is the training that sailors attend while on Bureau of Naval Personnel (BUPERS) orders, either duty-under-instruction (DUINS) orders for training longer than 20 weeks or temporary DUINS (TEMDUINS) orders for training less than 20 weeks. This includes A-school training for fleet returnees (e.g., sailors in the Professional Apprentice Career Track (PACT) program and those converting to a new rating), C-school training between assignments to earn a Navy Enlisted Classification (NEC), and leadership training. It also includes time spent in enlisted-to-officer commissioning programs (e.g., Seaman to Admiral (STA-21)) and enlisted education programs, such as the senior enlisted academy and bachelor degree program.
Sailors attending school on Temporary Duty (TDY) orders do not count against student IA execution. For example, if a ship sends a sailor to school on TDY orders to earn an NEC, the time that sailor spends in training does not count against student IA execution. Yet, another sailor attending the same course, but on Permanent-Change-of-Station (PCS) orders, would count against student IA execution.
Student IA program
The student IA program is an overhead cost (sailors in a student status still get paid) that stems from the requirement to train and prepare sailors (especially new recruits) for assignment to fleet units.
Reference [4] describes the process the Navy uses to build the student IA program. It comprises three steps. The first is to forecast student IA E/S requirements for the POM year (i.e., two years in the future) and each year of the Future Years Defense Plan (FYDP). The second step is for the manpower resource sponsors to decide how much student E/S to buy. Ideally, they would buy enough E/S to match the forecast requirements. However, fiscal constraints and other factors affect how much student E/S gets funded. The third step is to define the authorized student E/S in the

5
approved POM at the billet level of detail. The Navy refers to this process as qualitizing the E/S. It entails defining student billets by UIC, rating, and paygrade and entering this information into TFMMS.8
Funding student E/S
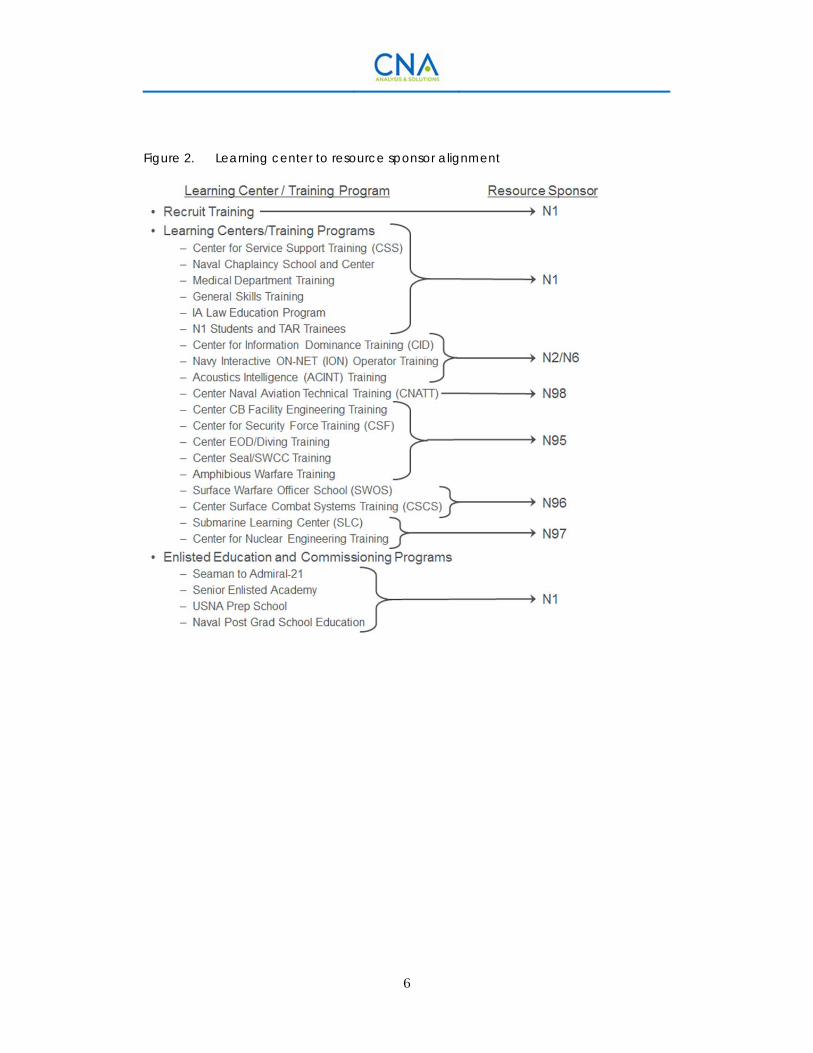
The manpower resource sponsors buy student E/S. The current rule for allocating student E/S requirements among these sponsors is based on an alignment of learning centers to resource sponsors. Figure 2 shows the current alignment. In general, it aligns the warfare resource sponsors with the schools that train primarily sailors who support that warfare mission area. For example, Director, Air Warfare (OPNAV N98) is responsible for buying student E/S to match the projected execution at the learning sites that belong to the Center for Naval Aviation Technical Training (CNATT).9
8 Another step in managing the student IA program involves monitoring student IA execution levels relative to funded E/S. This is important because student IA execution is not constrained by authorized student E/S. Tracking student execution by resource sponsors is not trivial, however, because of how the Navy personnel system tracks students and the seasonal variation in training loads.
9 CNATT oversees 27 learning sites throughout the country. Each site has a unique UIC to which students are assigned, but all the authorized student billets are assigned to a single student IA UIC for CNATT.
6
Figure 2. Learning center to resource sponsor alignment
7
Student IA forecasting objectives
Our first step in developing a forecasting model was to define the modeling objectives. In other words, what functions will this model support and how will the output be used?
N12’s role in student IA programming
Because the objective of this study was to develop a forecasting model for N12, we structured our methodology to support the role that N12 performs in building the student IA program.
Of the three main functions in building the student IA program, N12 has the lead on two. The first is to generate future student E/S requirements by resource sponsor to support POM manpower programming decisions. Manpower programs define authorized E/S for the POM and FYDP years. N12 forecasts these requirements by learning center/training program so that they can be properly allocated across the manpower resource sponsors.
The second function that N12 performs is to define the authorized student E/S at the billet level of detail and enter this information into TFMMS. This step is important for two reasons. First, misalignments in the student account at the community and paygrade levels contribute to fleet manning issues. Rating Control Number (RCN) Fit measures fleet manning levels for each community. Excess manning in one community does not offset shortfalls in another. Consequently, executing more student IA than billets in a community will lead to gapped billets and lower RCN Fit levels.
Second, authorized billets in TFMMS serve as the primary input for generating Enlisted Programmed Authorizations (EPA), which are the official demand signals (i.e., inventory target) for enlisted communities. There are three categories of EPA: force structure EPA (manpower requirements on sea and shore units), student EPA, and TPPH EPA. Total EPA for a community is the sum of the three categories. Enlisted community managers strive to build an inventory that matches total EPA. Therefore, an accurate community demand signal depends on correctly defining student E/S by rating, community, and paygrade. Authorized student billets in TFMMS also serve as the benchmark for monitoring in-year student execution levels.

8
Model objectives
We defined two sets of objectives for our forecasting model. One defines the output requirements, and the other defines features and capabilities we want to incorporate in our methodology.
Output
To support N12’s role in building the student IA program, the forecasting model needs to produce the following output:
Enlisted student E/S requirements for the POM and FYDP years broken out by manpower resource sponsor
Enlisted student billet requirements defined by rating, enlisted management community, paygrade, and learning center.
Approach
We also defined the following objectives to guide the development of our forecasting approach:
The first and most important objective was to base student forecasts on future manpower requirements. Ultimately, student execution depends on the number of sailors who need to be trained. For training that contributes to student IA execution, this number depends on future accession requirements and future fleet billet authorizations. Therefore, whenever feasible, we strived to tie future execution to one of these aspects of future manpower requirements.
The second objective was to account for training friction in our calculations. Training friction refers to inefficiencies in the training supply chain that increases the average number of students in training. There are two types of friction. The first is not-under-instruction (NUI) time, i.e., the time that sailors are at school (in a student status) but not in class receiving instruction. They are awaiting instruction, awaiting transfer, in an interrupted instruction status, or traveling between schools during their initial entry training. The other type of training friction is nongraduates, i.e., sailors who started a training program but failed to graduate, either for academic or nonacademic reasons. They are considered friction because they contribute to student IA execution. Depending on the type of training, nongraduates may be reclassified into another training program, sent to the fleet as non-rated sailors, or separated from the Navy.
9
The third objective was to build in a capability to model changes to current training programs. We added this objective because of the Navy’s recent initiative to restructure pre-fleet skills training under its Ready, Relevant Learning (RRL) program.10
Other considerations
Student IA execution can be forecasted using various methods; which one is best depends on how the forecasts will be used. For example, if the objective is to determine future student IA requirements for training that will support the installation of a new weapon system, the forecasts should be conducted at the course level. If, however, the intended use is to determine total student execution for every rating, calculating these forecasts at a higher, more aggregate level may be more appropriate.
Another decision in model development is determining the proper tradeoff between the level of detail and ease of use. Although we want to address all factors that affect student execution levels, we also need to consider the amount of data that will be required to generate the forecasts. If the model is too complicated or requires too much effort to populate, it may not be used.
Another issue that affects this tradeoff is the uncertainty (or stability) of the key input parameters. Future student execution levels depend on future manpower requirements. A review of past manpower requirement projections tells us that future manpower requirements (whether accession goals or projected force structure billets) will likely change over time. Under these conditions, a simpler, less detailed model that is easy to run (and thus can be run multiple times for changing conditions) may have more utility than a complex, more detailed model that requires more data and is more laborious to use.11
10 A key component of RRL is to restructure pre-fleet skills training by limiting its contents to the skills that sailors will need to perform jobs during their first 1-2 years in the fleet. The remaining piece of pre-fleet training will be divided into blocks and given to sailors at later times in their careers.
11 Changes to accession requirements happen quite often. They occur before the fiscal year starts and during that year. For example, the Navy issued five revisions of the FY 2011 recruiting goals in which the total goal for rating accessions dropped by 4,672, or about 14 percent [1]. Student execution forecasts based on the original accession goal for this year would overestimate execution levels by about 11 percent.
10
Methodology
This section describes our proposed methodology for calculating future student billet requirements. First, it reviews the overall framework, and then it describes the design and calculations of each of the model’s components.
Framework
Our approach divides the training that contributes to enlisted student IA into four categories:
Recruit training (i.e., boot camp)
Pre-fleet skills training, which consists of all the training that accessions attend after boot camp but before reaching the fleet. This includes A-school training and, for some accessions, C-school training.
Post-fleet skills training, which consists mostly of C-school training for journeyman and supervisor NECs
“Other” training, which includes the enlisted education and enlisted-to-officer commissioning programs.
Figure 3 shows the breakout of student execution in fiscal years 2012, 2013, and 2014 by these four categories. Pre-fleet skill training was, by far, the largest category—accounting for, on average, 66 percent of all enlisted student execution. Recruit training was next at 19 percent, followed by post-fleet skill training at 13 percent, and other training at 2 percent.

11
Figure 3. Distribution of student execution by training category: FY 2012 - 2014
Source: Enlisted master record
Pre-fleet skills training
Two decisions shaped our methodology for pre-fleet skills training. The first was to base student execution on future accession requirements. We chose this design for two reasons: accessions account for nearly all the students in pre-fleet skills training, and accession goals are generally defined by community. The second decision was to incorporate some capability to account for future reductions in the lengths of this training, which the Navy expects to achieve through its RRL initiative.12
Design
Figure 4 illustrates our conceptual model for pre-fleet skills training. At the highest level, it segments the training program for each community by learning center. This enables us to compute student execution by learning center, which, in turn, allows us to allocate the E/S requirements to the appropriate manpower resource sponsor.
12 Goals for RRL are to reduce the length of A-school training by 30 percent and the length of pre-fleet C-school training by 70 percent. Implementation will be phased in by groups of ratings over several years, starting in 2017

12
Figure 4. Pre-fleet skills training model
Within each learning center, we separate training into an A-school and C-school phase. We use historic training data to determine the training paths and student flow statistics for each rating. Separating training into an A-school and C-school phase enables us to model changes to current training programs by adjusting historic training times and throughput percentages for each training phase. For example, to forecast the effects of RRL on student execution, the user would input adjustment factors to reduce the historic lengths of A-school training by 30 percent and C-school training by 70 percent.
The order of the learning centers reflects the sequence of the training program. In other words, learning center #1 is the first center that accessions attend following recruiting training. Our design assumes that all accessions attend A-school training at the first learning center.13 After that, the path varies by rating. Students who complete A-school may attend C-school at the first learning center, go directly to training at a second learning center, or go to the fleet. Accessions who go on to a second center may attend A-school training, C-school training, or both.
In addition to segmenting training paths, our methodology divides the student population at each learning center into two groups: those who successfully complete the training (i.e., graduates) and those who do not (i.e., nongraduates). Each group has its own set of student flow statistics (i.e., training times), and only graduates proceed to the next phase of training.
13 Accessions who enlist in one of the Professional Apprentice Career Track (PACT) programs attend apprentice training, which, for modeling purposes, we treat as A-school training.

13
Calculating student execution – the basics
Student IA execution depends on the number of students in training and the total time they spend in training. In addition, because our goals are to forecast student execution within a fiscal year, we need to include a time component that determines how much of the students’ total training time occurs within that fiscal year.
Students
Students in pre-fleet training come, almost entirely, from accessions (see Figure 4). The main inputs for determining the number of students are the monthly accession goals for each rating.14 We compute monthly accessions from the rating’s yearly requirement and its monthly phasing matrix, which defines the percentage of the yearly total that will be accessed each month.
To determine the number of students in pre-fleet skills training, we reduce the accession numbers to account for recruit training attrition. Graduates from recruit training enter A-school training at the first learning center. We also provide the option to add reclassifications to this total. These students are nongraduates from other pre-fleet training programs who are given an opportunity to train for another rating.
As mentioned above, all students attend A-school training at the first learning center. After that, we define the percentage of graduates from each phase of training who continue to the next phase. We use historic data for each rating to define these paths and the percentage of students that attend each phase.15
Total time to train
The total time students spend at school consists of time under instruction (UI) and time not under instruction (NUI). UI time represents the time students spend enrolled in a course receiving training, whereas NUI time represents all the other time—that is, time waiting to start training (awaiting-instruction time), time waiting to be transferred or discharged (awaiting-transfer time), and time waiting to restart training (interrupted-instruction time). The level of NUI time in enlisted training fluctuates from year to year. It depends on many factors, such as training capacities, seasonal variation in student loads, and medical, legal, and administrative issues that prevent students from attending class.
14 Some ratings are part of a larger accession program. For example, ETSW are accessed as part of the Advanced Electronic Computer Field (AECF) program. Our model requires that these programs be divided into the rating that they feed.
15 We describe the processes and data sources for compiling values for these variables later in the report.

14
Determining student execution within a fiscal year
Students who are in pre-fleet training during a fiscal year consist of accessions who entered the Navy that year, accessions who entered the Navy in the previous year, and, for ratings with long training pipelines, accessions who entered the Navy two years prior. Because the number of accessions (both in total and by rating) can vary from year to year, we need to model the number of accessions that enter the Navy each month (for the projection and prior two years) and determine, for each month, the amount of time they spend in training during the fiscal year for which we are forecasting requirements. Figure 5 illustrates this concept. In this example, we are forecasting student IA execution for FY 2019. We see that accessions in FY 2017, 2018, and 2019 all contribute to student execution in 2019, some at Learning Center #1 and some at Learning Center #2.
Figure 5. Calculating student execution in the projection yeara
a. BC is recruit training, LC1 is learning center #1, and LC2 is learning center #2.
To account for the contributions of each accession year group, we calculate the number of accessions who enter the Navy each month in each year, using the fiscal year accession requirement for each rating and the monthly phasing of that requirement across the year. The model uses separate totals for each fiscal year; however, for simplicity, it uses one monthly phasing for all three fiscal years.
Time in training for monthly accessions
To incorporate the timing component into our calculations, we determine the number of training days that sailors who enter the Navy in each month of the fiscal year and in each month of the two prior years will spend in each phase of training in the projection year. These times depend on the number of days from the middle of the accession month to the start of the projection year, the average time from the start of recruit training to the start of each phase of pre-fleet training. Because graduates and nongraduates have different training times, we compute a separate set of times for each group.

15
Figure 6 shows an example of these times based on the training path for Information Technicians–Submarine (ITS). The training path for these accessions consist of A-school at the submarine learning center (SLC) followed by A-school and C-school at the Center for Information Dominance (CID). The average training times for graduates are as follows:
Time from start of recruit training to arrival at SLC: 62 days
Total time-to-train (TTT) per graduate in SLC A-school: 77 days
Time from start of recruit training to arrival at CID: 139 days
TTT per graduate in CID A-school: 183 days
TTT per graduate in CID C-school: 134 days.
The blue portion of each column represents the time at SLC A-school in the projection year. The red portion represents the time at CID A-school in the projection year. And the green portion represents the time at CID C-school in the projection year.
Figure 6. Training days in the projection year, by accession year and month
Output
To calculate student execution, we multiply the number of monthly accessions by these training times. We do this for both the graduates and nongraduates and sum the execution across all accession months. We then divide by 365 to convert execution days into execution man-years. Because one billet equates to one man-year of execution, this gives the student billet requirements. Lastly, we multiply the total

16
requirement by the paygrade distribution of students in pre-fleet training (based on historic data) to determine billet requirements at the paygrade level.
Post-fleet skills training
Post-fleet skill training consists primarily of training during PCS moves to earn journeyman and supervisor NECs and leadership training. It accounts for about 13 percent of total enlisted student IA execution. Because of the large number of NECs, the difficulty in projecting their annual training requirements, and the large variation in the lengths of their training pipelines, instead of forecasting execution using student throughput and training times, we opted for another approach that is based on the relationship between historic execution and manpower requirements.
Figure 7 illustrates our approach, which uses the concept of a post-fleet student IA rate. This rate represents the ratio of annual student IA execution time to annual full-duty time for all post-fleet sailors.16 We define these rates for each community and, within a community, for each learning center where sailors attend training.17 One can view these as overhead rates that define the level of post-fleet skills training (at a learning center) that is required to support a fleet billet. We describe how we derived these rates later in the report.18
To forecast student execution at each learning center, we simply multiply the student IA rate by the number of full-duty fleet billets in the projection year.19 We then use the paygrade distribution of historic execution (i.e., the percentage of post-fleet skill training executed by E4 sailors, E5 sailors, and so on to define the student billet requirements by paygrade).
16 We exclude post-fleet student IA days associated with training in the “Other” category.
17 Because some learning centers account for a small percentage of the total post-fleet training for a community (and in an effort to reduce input data), we choose to include only learning centers that account for at least 10 percent of the community’s post-fleet skills training.
18 An alternative option for assigning post-fleet student E/S requirements to the resource sponsors would be to assign each community to a resource sponsor, presumably based on the learning center where most of the training for that community occurs. This would preclude having to define a post-fleet student IA rate for each learning center.
19 Full-duty billets are all billets except for student and TPPH billets.

17
Figure 7. Approach used in post-fleet training module
Recruit training
Forecasting student IA execution for recruit training is the most straightforward. As shown in Figure 8, execution levels depend only on the number of in-year and previous-year non-prior-service (NPS) accessions, the monthly phasing of these accessions, and their total time in training.
Figure 8. Model for computing student IA in recruit training
Following our approach for pre-fleet training, we separate students into graduates and nongraduates using historic recruit training attrition. We then define the TTT for each group. TTT for graduates consists of the time it takes to complete recruit training, which includes additional UI time due to setbacks or a need to attend remedial training, plus the time in transit to A-school training. TTT for nongraduates includes UI time and the time it takes to be processed for separation.

18
Because our objective is to forecast annual student execution for the projection fiscal year, we include only the training days that occur within that year. Consequently, we use an approach similar to the one that is used in the pre-fleet model. That is, the recruit training model calculates, for each month in the projection year and in the previous year, how much of their TTT occurs within the projection year. For example, if the average TTT for graduates is 61 days, then each accession who enters the Navy in August of the previous year and graduates recruit training will contribute 15 days to that year’s student execution.
Figure 9 is the equivalent of Figure 6 for recruit training. It shows the time that graduates spend in recruit training as a function of accession year and month. It is based on a TTT of 61 days. If accession requirements were equal in both years, accessions who enter in August and September of the previous year will account for about 8.3 percent of total student execution.
Figure 9. Recruit training days in the projection year by accession year and month
Other training and education
Student execution in the “Other” training category accounts for a small percentage of enlisted student IA execution. Because execution levels in these programs depend more on Navy policy than future manpower requirements and given their small execution levels, our approach is to set future requirements equal to current execution levels. In addition, we suggest that the organizations that manage these programs review and, if necessary, adjust these forecasts to account for future policy or program changes. N1 is the resource sponsor for these requirements.
19
Input Data
Our forecasting methodology uses two types of input: future manpower requirements and variables that define the training programs of each rating. Future manpower requirements include accession levels for the pre-fleet skills and recruit training models and fleet billets for the post-fleet skills training model. We envision that these requirements will be determined by other Navy organizations and provided to N12 to support student IA forecasting.
The other type of input encompasses the training variables that define the pre-fleet training paths and student flow statistics, and the post-fleet student IA rates. N12, as the primary user of the model, will be responsible for defining and updating these variables.
To support initial model development, we defined baseline values for these variables using recent execution data in the Enlisted Master Record (EMR) and the Corporate Enterprise Training Activity Resource Systems (CeTARS). This section describes the processes by which we compiled these values.
Pre-fleet training student flow statistics
Our model for pre-fleet training uses two sets of parameters. One defines the training programs for each rating, that is, the training paths defined in terms of learning centers and the percentage of students who attend A-school and C-school training at each of these centers. The other defines the student flow statistics, which include training times and graduation rates of each phase of training.
To estimate values for these parameters, we compiled a dataset that consisted of non-prior-service accessions who entered the Navy in fiscal years 2012, 2013, and 2014. We excluded Full Time Support (FTS) accessions.20
20 We also excluded sailors who: (1) became an FTS or reservist during their pre-fleet time, (2) had a course overlapping two or more learning centers, (3) had a pre-fleet loss reason "To Officer," or (4) attended schools to become officers (i.e., STA-21 UICs).

20
We tracked these accessions by rating until they either reached the fleet or left the Navy. We define reaching the fleet as having an accounting category code (ACC) of 100, 106, 108, or 352. We then divided each fiscal year accession cohort into four groups:
Boot-camp losses: accessions who failed recruit training
Still in pre-fleet training: accessions who have not yet completed their entry-level training (i.e., reached the fleet) by September 2014
Pre-fleet training graduates: reached the fleet with no course failures
Pre-fleet training nongraduates: failed at least one course.
Table 1 shows the size of these fiscal year groups for the yeoman submarine (YNS) community.
Table 1. YNS pre-fleet training data
Group 2012 2013 2014 Boot-camp losses 11 9 8 Still pre-fleet skills training 0 0 4 Pre-fleet skills graduates 54 61 52 Pre-fleet skills nongraduates 13 11 2 Total 78 81 66 Source: EMR
Training programs
To define the pre-fleet training programs, we created a UIC history that covered the time from the start of boot camp to the time the sailor reached the fleet (or separated). Using a data set that maps each training site (i.e., student UIC) to its learning center (which is the parent activity), we identified, for each rating, which learning centers were part of the training program.
To define the training programs at each learning center by A-school and C-school, we used CeTARS data to identify the courses that sailors took during their pre-fleet training. We matched each course to a school (i.e., student UIC) by comparing their start and end dates. We used the course type code to determine whether the course
represented A-school or C-school training.21
21 We defined “A” type course as A-school and all other types as C-school.

21
Table 2 shows the training programs for the submarine ratings. Of the eleven submarine communities, seven involve a single learning center and four involve two centers. For example, accessions in training to become YNSs attend A-school training at the Center for Service Support (CSS) and A-school training (i.e., basic enlisted submarine school) at the Submarine Learning Center (SLC).
Table 2. Pre-fleet skills training paths for submarine communities
EMC Code
EMC Abbr.
Learning Center 1 Learning Center 2
Name A-
school C-
school Name A-
school C-
school C150 MMSS SLC 100% 0% C151 MMSSW SLC 100% 0% C180 MT SLC 100% 100% C121 ETSNV SLC 100% 100% C126 ETSRF SLC 100% 0% C130 FT SLC 100% 0% C230 STS SLC 100% 0% C260 ITSS SLC 100% 100% CID 100% 100% C170 CSSS CSS 100% 0% SLC 100% 0% C220 LSSS CSS 100% 0% SLC 100% 0% C250 YNSS CSS 100% 0% SLC 100% 0% Source: EMR and CeTARS
Graduation rates
Figure 10 illustrates our rules for identifying graduates and nongraduates. We define graduates as any sailor who reached the Fleet in the EMC they were promised during their enlistment or who reached the Fleet in a different EMC than was promised and did not fail any pre-fleet courses. We assume sailors in this latter group were reclassified into a new rating during recruit training. We define nongraduates as any sailor who graduated from recruit training but never reached the fleet (i.e., they separated from the Navy without ever reaching full-duty status) or who reached the fleet in a different EMC from the one they were promised and had at least one course failure.
Training times
Student execution depends on TTT. TTT includes under-instruction (UI) time and not-under-instruction (NUI) time. Figure 11 shows how training times are tracked in CeTARS and in the EMR. CeTARS tracks the amount of UI and NUI time associated with each course. The EMR, on the other hand, does not differentiate UI and NUI time; it tracks only how much time the student spends at the training site (i.e., attached to a student UIC) and the time in transit between sites.

22
Figure 10. Rules for determining nongraduation rates and training times
Figure 11. Tracking components of student IA execution
Because we include the UI and NUI components of TTT as input in our model, we require both EMR with CeTARS data to compile these times. We compute UI time for each phase of training by simply summing the UI time of the courses that make up each phase. Compiling NUI time is more complicated. First, we sum the course NUI times for each phase of training. We then compare the sum of the course UI and NUI times over all phases to the total time at the training site. In most cases, the total time is greater than the sum of the course UI and NUI times. As shown in Figure 11, this occurs because there are gaps in time in the CeTARS data when the student is not attached to a course.

23
We treat this additional time as NUI time. Also, because the time in transit between sites in entry-level training is part of student IA, we treat it as NUI time as well. Accordingly, we define total NUI time as the sum of the course NUI time, the additional training site NUI time, and the transit NUI time.
Table 3 shows training times for the YNS rating. It also shows the average time (from the start of recruit training) to reach each learning center and the percentage of students that attend each phase of training. In defining our baseline values, we took averages over these years. We used the number of accessions still in pre-fleet training to determine which years to include in these averages. If a significant number of 2014 accession were still in training, we averaged over 2012 and 2013; otherwise, we averaged over 2012 to 2014.
Table 3. Student flow statistics in pre-fleet skills training for YNS graduates
Learning Center Statistic Level Variable 2012 2013 2014
Center for Service Support
LC Stats
Count in LC 50 57 45 Ave days to LC 60.8 60.3 60.1 Ave school UI days 45.6 41.8 37.1 Ave school NUI days 25.3 30.8 47.5 Ave non- school NUI days 0.9 0.2 1.5 Ave NUI days 26.2 31.1 49.0
A-School Stats % taking a-school 100 100 100 Ave A-school UI days 45.6 41.8 37.1 Ave A-school NUI days 25.3 30.8 47.5
C-School Stats Pct. taking c-school 0 0 0 Ave C-school UI days - - - Ave C-school NUI days - - -
Submarine Learning Center
LC Stats
Count in LC 50 57 45 Ave Days to LC 132.6 133.4 146.3 Ave school UI days 53.3 56.7 60.9 Ave school NUI days 17.4 13.2 11.3 Ave non- school NUI days 12.8 21.6 11.2 Ave NUI days 30.3 34.9 22.5
A-School Stats Pct. taking A-School 100 100 100 Ave A-School UI days 48.9 51.9 56.7 Ave A-School NUI days 17.4 13.2 11.3
C-School Stats Pct. taking C-School 100 100 100 Ave C-School UI days 4.3 4.7 4.3 Ave C-School NUI days 0 0 0
Source: EMR and CeTARS Note: School NUI time refers to the course NUI time, whereas non-school NUI time includes the additional training site and transit NUI times. We follow a similar process to compile training times for nongraduates. Table 4 shows these values for the YNS rating.

24
Table 4. Student flow statistics in pre-fleet skills training for YNS nongraduates
Learning Center Statistic Level Variable 2012 2013 2014
Center for Service Support
LC Stats
Count in LC 13 11 2 Ave Days to LC 59.7 62. 59.5 Ave School UI days 45 39.4 44 Ave NUI days 27.9 19.0 81.5
Submarine Learning Center
LC Stats
Count in LC 8 11 1 Ave days to LC 126.2 121.0 171.0 Ave School UI days 30.5 46.5 53.0 Ave NUI days 30.6 38.5 20.0
Source: EMR and CeTARS
Post-fleet student IA rates
The key variable in our post-fleet training methodology is the student IA rate. As we described in reviewing this methodology, this rate represents the ratio of annual student IA execution time to full-duty time for all sailors who have reached the fleet (i.e., completed entry-level training). Our methodology requires that we define this rate separately for each community and, within a community, by learning center.
We derived these rates using EMR data. For each rating, we identified sailors who had reached the fleet. We then summed the days they spent in: (1) a full-duty status, (2) a student IA status, and (3) a TPPH IA status.22 We assigned all the time at student UICs to being in a student IA status and all the time at non-student UICs to being in a full-duty status, unless an accounting category code identified the sailor as being in a TPPH status.
We compiled time in a student status by student UIC and then used our student UIC to learning center (i.e., parent UIC) mapping to aggregate student IA time by learning center. We then divided these times by total full-duty time to define the student IA rate for each learning center. Table 5 shows FY 2015 execution data for the surface combat systems ratings. The second column contains post-fleet full-duty time (in man-years), and the other columns contain post-fleet student IA time (in man-years) by learning center.23 For example, STGs accumulated 2,332 man-years of full-duty time, 49.2 man-years of post-fleet student IA time at the Center for Surface Combat
22 We excluded student time that belongs to the “Other” category of training.
23 As mentioned previously, we include times at a learning center only if the execution accounts for more than 10 percent of the rating’s total post-fleet student IA time.

25
Systems (CSCS), and 3.8 man-years of student time in general skills training.24 Table 6 shows the corresponding post-fleet student IA rates for these ratings.
Because we compile execution data by paygrade, we use these data to determine the paygrade distribution of student execution time in each rating. These distributions are used in the model to define student billet requirements by paygrade.
Table 5. Full-duty and student IA execution time for surface combat systems ratings in FY 2015
EMC Full Duty
(man-years)
Student IA (man-years)a Gen. Skills CID CSF CSS CSCS
SEAL/ SWCC CNATT
B310: FC 3,489 5.2 41.1 B311: FCAEGIS 2,123 3.0 62.2 B320: GM 3,251 7.3 16.3 54.3 B340: STG 2,332 3.8 49.2 B400: BM 4,021 3.0 5.7 2.4 2.6 B420: ETSW 5,359 7.8 19.1 81.3 45.3 B440: OS 5,445 5.2 10.3 26.3 B450: QMSW 1,827 2.2 1.4 1.9 1.5 C160: MN 765 1.4 1.5 0.8 3.0 Source: EMR a. Gen. Skills is general skills training, CID is the Center for Information Dominance, CSF is the Center for Security Force training, CSS is the Center for Service Support, CSCS is the Center for Surface Combat Systems, Seal/SWCC is the Center Seal/SWCC training, and CNATT is the Center Naval Aviation Technical Training.
Table 6. Post-fleet student IA rates for surface combat systems ratings
EMC
Student IA Rate Gen. Skills CID CSF CSS CSCS
SEAL/ SWCC CNATT
B310: FC 0.15% 1.18% B311: FCAEGIS 0.14% 2.93% B320: GM 0.22% 0.50% 1.67% B340: STG 0.16% 2.11% B400: BM 0.08% 0.14% 0.06% 0.06% B420: ETSW 0.14% 0.36% 1.52% 0.85% B440: OS 0.10% 0.19% 0.48% B450: QMSW 0.12% 0.08% 0.10% 0.08% C160: MN 0.18% 0.19% 0.10% 0.40%
24 General skills training was previously conducted under the Center For Professional and Personnel Development (CPPD).

26
Recruit training variables
We compiled values for the parameters in the recruit training module using the dataset we built for pre-fleet skills training. We simply averaged recruit training attrition and training times (both UI- and NUI-time) over all accessions. We also used historic execution data to determine the distribution of students across the five unrated training pipeline communities (M100, M200, M300, M400, and M500) and paygrades (E1, E2, and E3).

27
Forecasting tool
To implement our methodology, we developed a functional prototype Excel spreadsheet tool that provides an easy-to-use interface through which the user can enter the required input data and view the resulting forecasts of student billet requirements by rating, enlisted management community, paygrade, learning center, and resource sponsor.
The tool consists of three spreadsheet modules: a recruit training module, a pre-fleet skills training module, and a post-fleet skills training module. We review each of these modules in the sections below.
We emphasize that this tool is only a prototype and is not a finished product. The purpose of building the tool was to implement our methodology in an Excel spreadsheet model that would serve as a foundation for N12 to build upon to produce a model that meets its forecasting needs.
Pre-fleet skills training module
The pre-fleet skills training module comprises three sections: (1) an input section in which the user enters the required data, (2) an output section that shows the forecasted student billet requirements, and (3) a calculations section that computes training times in the projection year for each accession year and month.25
Input
There are two subsections of input data. The first is used to define future accession goals, and the second defines the training program and student flow statistics for each phase of training.
25 The spreadsheet model uses the following color scheme to differentiate the type of fields: yellow cells indicate input data, orange cells indicate output results, blue cells indicate row labels (rating and learning center information), and red cells indicate the results of intermediate calculations.

28
Figure 12 shows the input fields that define future accessions for each rating. The first three fields define the rating’s total accession requirements for the projection year and the two previous years. The other fields contain the rating’s monthly phasing matrix, which defines the percentage of the yearly totals that enters the Navy each month. Although we use accessions from three years in our calculations, we define only a single phasing matrix, which we apply to each accession year.26
Figure 13 shows the input fields for each learning center that is part of the rating’s pre-fleet training program. Learning Center #1 must be the first center in the training program. The required input data are as follows:
Learning center level
o Student UIC: Parent UIC of the learning center
o Primary RS: Manpower resource sponsor for the learning center
o Average time from ADSD to LC (days): Average time in days from the start of recruiting training to arrival at the learning center
o LC attrition: Percentage of students at learning center who become nongraduates.
Graduates
o A-school training
Percent attending A-school: Percentage of students at the learning center who attend A-school (set to 100 percent for the first learning center)
Graduate UI days: Average UI days at A-school per graduate
Graduate UI adjust: Factor (percentage change) to adjust the average A-school UI days per graduate (A negative factor reduces time, whereas a positive one increases time)
NUI days: Average NUI days at A-school per graduate
NUI Adjust: Factor (percentage change) to adjust the average NUI days at A-school
C-school TTT per grad (days): Calculated field (UI days plus NUI days).
o C-school training
26 We made this simplification to reduce the data requirements.

29
Percent attending C-school: Percentage of students at the learning center who attend C-school
C-school UI days: Average UI days at C-school per graduate
C-school UI Adjust: Factor (percentage change) to adjust the average C-school UI days per graduate
C-school NUI days: Average NUI days at C-school per graduate
C-school NUI Adjust: Factor (percentage change) to adjust the average C-school NUI days per graduate
C-school TTT per grad (days): Calculated field (UI days plus NUI days).
Nongraduates
Nongrad UI days: Average UI days at the learning center per nongraduate
UI Adjust: Factor (percentage change) to adjust the average UI days per nongraduate
Nongrad NUI days: Average NUI-days at the learning center per nongraduate
NUI Adjust: Factor (percentage change) to adjust the average U days per nongraduate
TTT per nongraduate (days): Calculated field (UI days plus NUI days).
The last set of inputs at each learning center defines the paygrade distribution of students in pre-fleet skills training (i.e., the percentages of students who are in paygrades E-1, E-2, E-3, and E-4).
Output Figure 14 shows the output section of the pre-fleet skills training module. Output is organized by learning center. For each center, the first section shows student IA execution (in man-years) for graduates broken out by A-school and C-school, and by accession year (i.e., accession in the projection year, in the previous year, and in two years prior). It also contains totals across these accession years. The second part shows student IA execution levels for the nongraduates. The last section shows the billet requirements. It shows billet totals and billets by paygrade.
Calculations
The other part of the spreadsheet contains intermediate calculations that compute the training times in the projection year for each accession year and month.

30
Figure 12. Input section of the pre-fleet skills training module: accession, recruit training attrition, and reclassification data
Figure 13. Input section of the pre-fleet skills training module: training programs and student flow statistics

31
Figure 14. Output section of the pre-fleet skills training module

32
Post-fleet training module
The post-fleet training module comprises multiple input and output sections.
The first input section, which is shown in Figure 15, contains the authorized billet requirements for the projection year. The other input sections are organized by learning center. Figure 16 shows the structure of one of these sections. It contains information about the learning center (i.e., name, UIC, and resource sponsor), the student IA rate for that center, and the distribution of student execution by paygrade.
Figure 15. Input section of the post-fleet skills training module: billet requirements

33
Figure 16. Input section of the post-fleet skills training module: learning center data
The output sections are also organized by learning center. Figure 17 shows one of these sections. It contains the student billet requirements at that learning center for each community and paygrade.

34
Figure 17. Output section of the post-fleet skills training module
Recruit training module
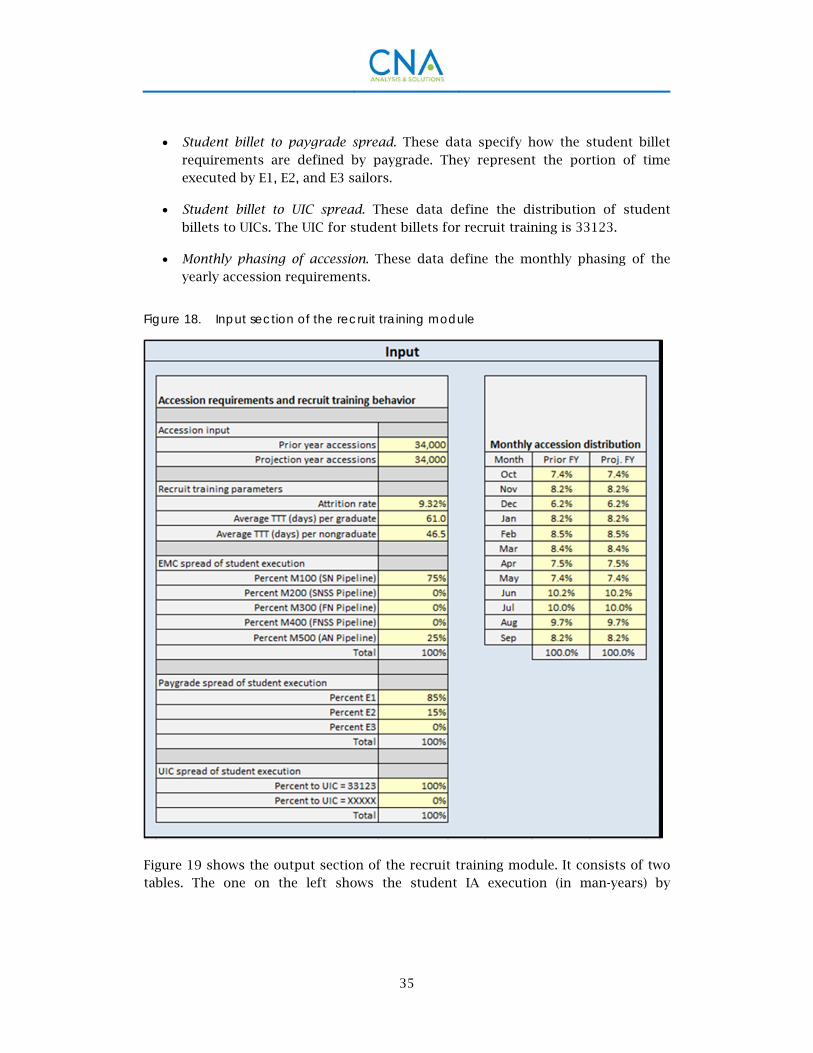
The recruit training module has an input and an output section. Figure 18 shows the input data section. The yellow highlighted cells denote input data.
There are six categories of input data:
Accession requirements. These are the Navy’s non-prior-service enlisted
accession requirements for the projection year and the previous fiscal year.
Recruit training parameters. These include the attrition rate, the average TTT
days per graduate, and the average TTT days per nongraduate.
Student billet to EMC spread. These data specify how the student billet
requirements are spread across the five unrated pipeline communities: M100 (SN P/L), M200 (SNSS P/L), M300 (FN P/L), M400 (FNSS P/L), and M500 (AN P/L).
35
Student billet to paygrade spread. These data specify how the student billet
requirements are defined by paygrade. They represent the portion of time executed by E1, E2, and E3 sailors.
Student billet to UIC spread. These data define the distribution of student
billets to UICs. The UIC for student billets for recruit training is 33123.
Monthly phasing of accession. These data define the monthly phasing of the
yearly accession requirements.
Figure 18. Input section of the recruit training module
Figure 19 shows the output section of the recruit training module. It consists of two tables. The one on the left shows the student IA execution (in man-years) by

36
accession year and month. It also shows the breakout of execution for graduates and nongraduates. The total represents the student billet requirement.
The table on the right shows the student billet requirement defined by enlisted community and paygrade. In this example, student billets were assigned to the M100 and M500 communities and distributed among the E1 and E2 paygrades. All billets are assigned to UIC 33123, and the resource sponsor responsible for buying these billets is N1.
Figure 19. Output section of the recruit training module

37
Conclusions The student portion of the Navy’s Individuals Account (Student IA) represents the time that sailors spend in training while in a student status. Sailors in a student status are not part of the Navy’s distributable inventory and, therefore, are not available to be assigned to fleet units. Overexecution of the student account, which occurs when in-year student IA execution exceeds its authorized endstrength (E/S), impedes the Navy’s ability to man the fleet.
Many factors affect how well student execution aligns with its authorized E/S. Chief among them is the ability to accurately forecast future student execution levels. To improve the Navy’s forecasting capability, we developed a prototype model that implements a new methodology to forecast enlisted student billet requirements.
Our proposed model generates the following output to support building the student IA program:
Enlisted student E/S requirements for the POM and FYDP years broken out by manpower resource sponsor
Enlisted student billet requirements for these years defined by enlisted management community, paygrade, and learning center.
The underlying methodology divides the training that contributes to enlisted student IA into four categories: recruit training, pre-fleet skills training, post-fleet skills training, and “Other” training. Each category has its own method for calculating future student IA requirements.
Our methodology uses two types of input: future manpower requirements and variables that define the training programs of each rating. Future manpower requirements include accession levels for the pre-fleet skills and recruit training models and fleet billets for the post-fleet skills training model. The training variables define the pre-fleet training paths and student flow statistics, and the post-fleet student IA rates.
We developed a prototype Excel spreadsheet model that provides an easy-to-use interface through which the user can enter the required input data and view the resulting forecasts of student billet requirements by rating, EMC, paygrade, learning center, and resource sponsor. Our intent in developing this prototype is that it would serve as a foundation for the Navy to build upon and modify, as necessary, to meet its student IA forecasting needs.

38
References
[1] Steven W. Belcher et al. Building the Enlisted Student Individuals Account (IA) Program: Justification and Guidance. Unclassified. CNA Annotated Briefing DAB-2014-U-008669-Final. Dec. 2014.
[2] Steven W. Belcher and Margaret A. Golfin. Forecasting Student Billet Requirements . Unclassified. CNA Annotated Briefing DAB-2012-U-002910-Final. Jan. 2013.
[3] Department of Defense Instruction Number 1120.11. Subject: Programming and Accounting for Active Component (AC) Military Manpower. March 17, 2015.
[4] Steven W. Belcher and Jane Pinelis. Building, Funding, and Executing the Student Individuals Account. Unclassified. CNAD0034596.A2/Final.

CNA This report was written by CNA’s Resource Analysis Division (RAD).
RAD provides analytical services—through empirical research, modeling, and simulation—to help develop, evaluate, and implement policies, practices, and programs that make people, budgets, and assets more effective and efficient. Major areas of research include health research and policy; energy and environment; manpower management; acquisition and cost; infrastructure; and military readiness.

DRM-2016-U-013002-Final
www.cna.org ● 703-824-2000
3003 Washington Boulevard, Arlington, VA 22201
CNA is a not-for-profit research organization that serves the public interest by providing
in-depth analysis and result-oriented solutions to help government leaders choose
the best course of action in setting policy and managing operations.
Nobody gets closer— to the people, to the data, to the problem.