Embed Size (px)
Citation preview

A Model for Evaluating the Impacts of Spatial and Temporal Land Use Changes
on Water Quality at Watershed Scale
Jae-Pil Cho and Saied Mostaghimi
07/29/2003

Overview of presentation
Introduction Model characteristics Model components Model application Summary & Future improvement

Introduction
Effectiveness of BMPs varies both temporally and spatially
Ideal NPS model for BMP evaluation Long-term, continuous-simulation model Distributed-parameter model Process-oriented model
Objectives To develop a continuous, distributed, and
process-oriented watershed scale model for assessing the effectiveness of temporally and spatially changing BMPs
To demonstrate the model applicability

Model Characteristics
Conceptual Model
Baseflow
Interflow
Root zone
Interception Evapotranspiration
Infiltration
Percolation
Overland flow
Channel flow

Flowchart of the model
Define soil layers
Read main input
Begin Simulation
Initialize the model
End SimulationSimulation Period Over ?
Read weather data (1day)
Yes
Pesticide degradation
Calculate daily changing
Check rotation changes
Calculate daily changing variables (ET,crop, soil,surface)
No
Runoff=0 ?No
Read breakpoint data(get start time of rainfall)
Yes
Overland flow routing
Infiltration
Overland sediment routing
Overland pesticide routing
Channel flow routing
Percolation
Pesticide leaching
Channel sediment routing
Channel Pesticide routing
Lumped Interflow and Baseflow
Precipitation ? No
Yes
Multiple soil layers based on physical soil layers and rotation information such as pesticide application depth and tillage depth
Soil Parameters• Porosity, bulk density• Effective hydraulic conductivity• Rill and Interrill erodibilityCrop Parameters• Canopy cover and height• Leaf Area Index(LAI)• Root depthGround surface parameters• Random roughness• Ridge height• Residues(flat, buried, dead root)
RunoffRunoff
RainfallRainfall
1-dayUser defined during rainfall time step
Before rainfall
time step
During rainfall
time step
After runoff
time step

Separate input files
Blocks in main inputSeparate output files
Output parametersOutput parameters
WeatherWeather
Break-pointBreak-point
MainMain
InitialInitial
Flag & General inputFlag & General input
InitialInitial
CellCell
CropCrop
TillageTillage
PesticidePesticide
RotationRotation
ChannelChannel
SoilSoil
OutputRotation InitialRotation Initial
Input file structure for considering spatial and temporal land use changes
Physical Data
Temporal Data
Spatial Data

Dynamic parameters
Leaf Area Index (LAI) Canopy cover Canopy height Root depth
CropCrop
SurfaceSurface
SoilSoil
Water andTemperatur
e stress
Biomass Above ground Root Random roughness
Ridge height Residues
Flat residue Buried residue Dead root residue
Porosity, B-Density Effective hydraulic conductivity Rill and Interrill
erodibility
Rainfall Cu. amount Kinematic E.
Spatial and Temporal Land Use Changes
Tillage Type App. date

Model Components

Hydrology & Sediment
Hydrology Overland flow: Continuity and Manning’s
equation Evapotranspiration: Ritchie’s method Infiltration: Green-Ampt infiltration for
unsteady rainfall Percolation: WEPP approach
Sediment (Based on WEPP) Rill detachment Interrill detachment Channel scour

Pesticide: application methods
Surface and Foliage application User defined depth & linearly decreasing with depth
Soil and foliage
application
Depth Pesticide
Incorporation
Pesticide
Injection
Pesticide
Incorporation User defined depth & Uniform distribution
Injection User defined depth & no mixing above this depth

Pesticide:Retention / degradation / transport
Interaction between solution and soil phase Linear isotherm: instantaneous & reversible
Cs = Kd X Cw
Degradation First-order kinetics: lumped dissipation
parameter
Cd = Co e –k d Adjustment of dissipation rate based on soil
temperature and soil moisture content Transport
Runoff Leaching Plant uptake

Model Application

Nomini Creek Watershed
Virginia
WestmorelandCounty
$
$
##
# #
#
##
#
%
%
%
%
%
%
%
PN1
PN2
PN3
PN4
PN5
PN6
PN7GN1GN2
GN3
GN4
GN5GN7GN8
GN6
QN1
QN2
QN1 boundaryQN2 boundaryStream
$ Stream gaging stations# Ground water wells% Precipitation gages
1 0 1 2 Miles
N
EW
S

Nomini Creek Watershed
Ground water dominant watershed(GWI=0.85)
Detail land use changes and pesticide application data (1985-1997) Typical planting, harvesting, tillage, pesticide
application date was decided Simulation period: 01/01/1989- 12/31/1991 Cell size: 90m*90m (267 cells) Pesticide
Pesticide
Solubility
(ppm)
Half Life Soil(days
)
Half Life
Foliage
Washoff
Fraction
Koc(ml/g)
Atrazine
33.0 60 5 0.5 100

Land use changes in QN2 55 fields and 36 different land use changes Land use changes in field#6 (1989-1991)
Pesticide application
Pesticide application
Corn
Small grain
Soybean
Corn
Tillage application

Available Output Files
Flux Surface to Root zone Root to Intermediate zone
Outlet Daily Event
User defined cell Vertical distribution Time series Dynamic soil, crop, surface parameters

Outlet output: Daily and monthly runoff
02468
1012141618
1/1/1989 1/1/1990 1/1/1991
Date
Dai
ly R
unof
f (m
m) Observed (mm) Simulated (mm)
0
10
20
30
40
50
60
70
80
Jan-
89
Apr-8
9
Jul-8
9
Oct-89
Jan-
90
Apr-9
0
Jul-9
0
Oct-90
Jan-
91
Apr-9
1
Jul-9
1
Oct-91
Month
Mon
thly
Run
off
(mm
) ObservedSimulated
Error QN2(89’-91’)
Error in total volume -11.56 %

0.0
0.1
0.2
0.3
0.4
0.5
1/1/89 1/31/89 3/2/89 4/1/89 5/1/89 5/31/89 6/30/89 7/30/89 8/29/89 9/28/89 10/28/89 11/27/89 12/27/89
Da
ily P
est
icid
e L
oss
(mg)
0.0
0.5
1.0
1.5
2.0
Jan-89 Feb-89 Mar-89 Apr-89 May-89 Jun-89 Jul-89 Aug-89 Sep-89 Oct-89 Nov-89 Dec-89
Mo
nth
ly P
est
icid
e L
oss
(mg
)
Outlet output: Daily and monthly pesticide load
Daily
Monthly
0
0.2
0.4
0.6
0.8
1
0 500 1000 1500
Time (minutes)
Flo
w R
ate
(m
3/se
c)
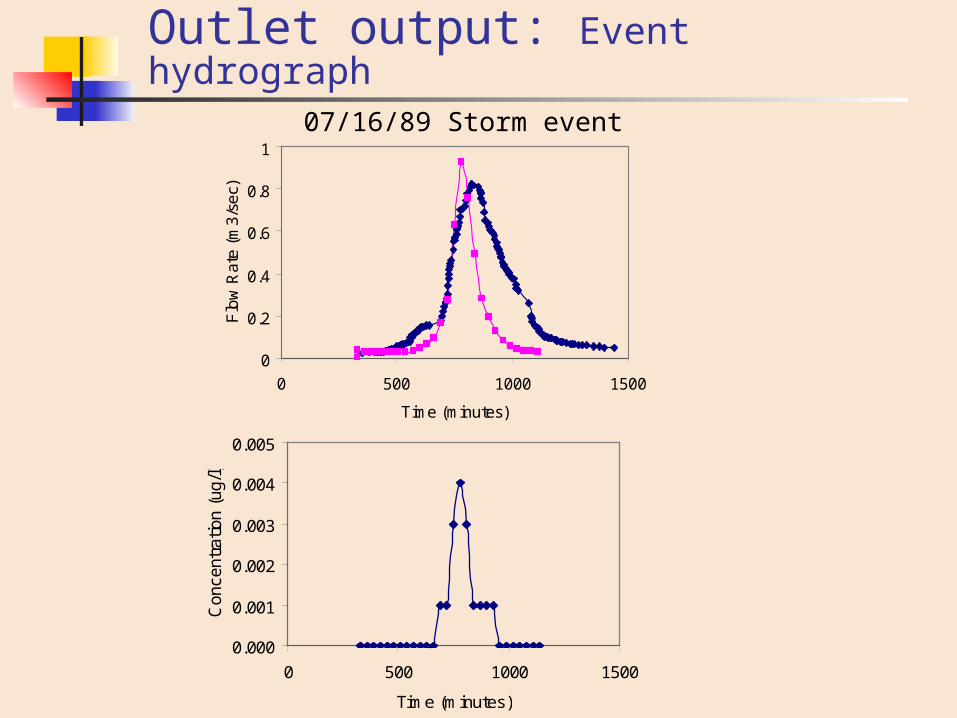
Outlet output: Event hydrograph
0.000
0.001
0.002
0.003
0.004
0.005
0 500 1000 1500
Time (minutes)
Con
cent
ratio
n (u
g/l)
07/16/89 Storm event

User-defined cell output:- Vertical distribution of pesticide concentration
0.00.20.40.60.81.01.21.41.6
0 5000 10000 15000
Concentration (ug/l)D
ep
th (
m)
0.0
0.2
0.4
0.6
0.8
1.0
1.2
1.4
1.6
0 500 1000
0.0
0.2
0.4
0.6
0.8
1.0
1.2
1.4
1.6
0 200 400 600
0.0
0.2
0.4
0.6
0.8
1.0
1.2
1.4
1.6
0 20 40 60
Concentration (ug/l)
Dep
th (m
)
0.0
0.2
0.4
0.6
0.8
1.0
1.2
1.4
1.6
0 10 20 30
0.0
0.2
0.4
0.6
0.8
1.0
1.2
1.4
1.6
0 5 10 15
4/26/1989(Application)
5/5/1989
8/5/1989 9/5/1989 10/5/1989
6/5/1989

Conclusions & Future Improvement A model was developed for assessing
the impacts of spatial and temporal land use changes on hydrology and water quality and applied to NC watershed
Future improvement Model validation (Hydrology, sediment,
pesticide) Distributed ground water modeling
Linkage with MODFLOW and MT3DMS Pre- and post-processor

Expecting modeling system
GIS
WeatherData
Surface/Unsaturated zone model
Surface/Unsaturated zone model
MODFLOW/MT3DMSMODFLOW/MT3DMS
ResultDBOutputInput
InputDB
Arc/View(ASCII)
Pesticide,Crop, SoilData
OutputInput
-Weather-Rainfall Input
Excel(VBA)
1
2
3 4
Interface
Data flow
1
2
Update input database
Create weather and breakpoint rainfall input data
3Create main input
4 Update result database
Interface

THANK YOU…
?