Embed Size (px)
Citation preview

University of Central Florida University of Central Florida
STARS STARS
Electronic Theses and Dissertations, 2004-2019
2004
A Mobile Robotic Computing Platform For Three-dimensional A Mobile Robotic Computing Platform For Three-dimensional
Indoor Mappi Indoor Mappi
Kenneth McCoig University of Central Florida
Part of the Computer Engineering Commons
Find similar works at: https://stars.library.ucf.edu/etd
University of Central Florida Libraries http://library.ucf.edu
This Masters Thesis (Open Access) is brought to you for free and open access by STARS. It has been accepted for
inclusion in Electronic Theses and Dissertations, 2004-2019 by an authorized administrator of STARS. For more
information, please contact [email protected].
STARS Citation STARS Citation McCoig, Kenneth, "A Mobile Robotic Computing Platform For Three-dimensional Indoor Mappi" (2004). Electronic Theses and Dissertations, 2004-2019. 213. https://stars.library.ucf.edu/etd/213

A MOBILE ROBOTIC COMPUTING PLATFORM FOR THREE-DIMENSIONAL INDOOR MAPPING AND DATABASE BUILDING
by
KENNETH TAYLOR MCCOIG B.S. Embry-Riddle Aeronautical University, 2002
A thesis submitted in partial fulfillment of the requirements for the degree of Master of Science
in the Department of Electrical & Computer Engineering in the College of Engineering & Computer Science
at the University of Central Florida Orlando, FL
Fall Term 2004

© 2004 Kenneth Taylor McCoig
ii

ABSTRACT
There are several industries exploring solutions to quickly and accurately digitize
unexplored indoor environments, into useable three-dimensional databases. Unfortunately, there
are inherent challenges to the indoor mapping process such as, scanning limitations and
environment complexity, which require a specific application of tools to map an environment
precisely with low cost and high speed.
This thesis successfully demonstrates the design and implementation of a low cost mobile
robotic computing platform with laser scanner, for quickly mapping with high resolution, urban
and/or indoor environments using a gyro-enhanced orientation sensor and selectable levels of
detail. In addition, a low cost alternative solution to three-dimensional laser scanning is
presented, via a standard two-dimensional SICK proximity laser scanner mounted to a custom
servo motor mount and controlled by external microcontroller. A software system to control the
robot is presented, which incorporates and adheres to widely accepted software engineering
guidelines and principles.
An analysis of the overall system, including robot specifications, system capabilities, and
justification for certain design decisions, are described in detail. Results of various open source
software algorithms, as it applies to scan data and image data, are also compared; including
evaluation of data correlation and registration techniques. In addition, laser scanner mapping
tests, specifications, and capabilities are presented and analyzed. A sample design for converting
the final scanned point cloud data to a database is presented and assessed.
iii

The results suggest the overall project yields a relatively high degree of accuracy and
lower cost over most other existing systems surveyed, as well as, the potential for application of
the system in other fields. The results also discuss thoughts for possible future research work.
iv

ACKNOWLEDGMENTS
I feel it is more than necessary and appropriate to thank the individuals, both
academically and personally, who have helped me over the course of my studies at UCF. I would
first like to thank God for guiding me along the path thus far and enabling me with the talents to
succeed in all my endeavors. I would like to thank Dr. Guy Schiavone for being my advisor and
bringing me in as a Graduate Research Assistant at IST, and most importantly for opening the
doors to research opportunities that led to this thesis. I would also like to thank my thesis
committee members, Dr. Christian Bauer and Dr. Joseph S. Berrios, for their advice and for
allowing me time out of their busy schedules. I would also like to thank Julio de la Cruz from
UCF STTC/Army RDECOM who funded the research as a portion of the Rapid Construction of
Urban Terrain Databases for Training STO.
I would especially like to thank the IST administrative staff for assisting me with tuition
funding and my colleagues in the DART lab for their technical assistance and advice with both
the hardware and software systems; in particular, Ravi Palaniappan, Judd Tracy, Lee Mangold,
Eric Woodruff, Dezhi Liao, Andrew Wheeler, Mahesh Ramamurthy, Jason Daly, and Shiyaun
Jin.
On a more personal level, I would like to thank my parents and family for supporting and
nurturing me (especially with those LEGO’s!), and raising me right, but most importantly for
surrounding me with a sometimes unspoken but never faltering love that I have always
appreciated and rarely expressed. Last, but most certainly not least, my beautiful Andrea for
v

never allowing me to give up when things were rough, putting up with the countless demos,
coming home late and going in early, working all-nighters in the lab, and taking care of things at
home with Sasha and Corky. Your help support, patience, and love during all the years we have
been together is priceless and beyond words and for that I will forever and always be grateful.
vi

TABLE OF CONTENTS
LIST OF FIGURES ....................................................................................................................... ix
LIST OF TABLES...........................................................................................................................x
LIST OF ABBREVIATIONS/ACRONYMS................................................................................ xi
CHAPTER 1: INTRODUCTION....................................................................................................1
1.1 Two Dimensions vs. Three ....................................................................................................2
1.2 Mapping Tools .......................................................................................................................3
CHAPTER 2: LITERATURE REVIEW.........................................................................................6
CHAPTER 3: DESIGN AND METHODOLOGY........................................................................10
3.1 Requirements and Planning .................................................................................................10
3.2 Robot Components...............................................................................................................15
3.2.1 Hardware...................................................................................................................... 18
3.2.2 Software ....................................................................................................................... 25
3.3 Laser Scanner.......................................................................................................................28
3.4 Calibration............................................................................................................................34
CHAPTER 4: RESULTS...............................................................................................................39
4.1 Robotic Platform..................................................................................................................39
4.2 Laser Scanner.......................................................................................................................43
4.3 Image and Range Data Manipulation ..................................................................................48
CHAPTER 5: CONCLUSION ......................................................................................................56
vii

5.1 Further Research ..................................................................................................................57
APPENDIX A SOFTWARE METRICS.......................................................................................60
LIST OF REFERENCES...............................................................................................................62
viii

LIST OF FIGURES
Figure 1: SICK Laser LMS-200 ................................................................................................... 13
Figure 2: High-Level System Architecture Diagram.................................................................... 15
Figure 3: Robot Drive Motor Configuration Differences ............................................................. 16
Figure 4: Lower Robot Assembly (Left) Uncovered (Right) Covered......................................... 17
Figure 5: Hardware/Sensor Interface Diagram............................................................................. 23
Figure 6: Network Configuration.................................................................................................. 24
Figure 7: IMR Control System Conceptual Architecture Diagram (Structural View) ................. 26
Figure 8: Basic Operating Principle of the LMS-200................................................................... 29
Figure 9: SICK Laser Mount with Camera and Servo.................................................................. 30
Figure 10: Rotational Servo Mounting ......................................................................................... 31
Figure 11: Laser Scanner Rotation in Z-axis ................................................................................ 33
Figure 12: Camera Image Calibration and Manipulation Testing ................................................ 36
Figure 13: IMR's Final Configuration Used for Acquisition of Results....................................... 40
Figure 14: Laser Scan Angles ....................................................................................................... 43
Figure 15: Opensource Image Manipulation ................................................................................ 49
Figure 16: Standard Spherical Coordinate System ....................................................................... 50
Figure 17: Standard Spherical Coordinate System Applied to IMR............................................. 51
Figure 18: Point Cloud for Scenario 1 (Top View) ...................................................................... 53
Figure 19: Point Cloud for Scenario 3 (Top View) ...................................................................... 54
ix

LIST OF TABLES
Table 1: Common Handheld, 2D, & 3D Laser Rangefinders and Scanners................................... 8
Table 2: IMR Platform Component Descriptions and Purpose/Rationale for Use....................... 19
Table 3: IMR Laser Mount Component Descriptions and Purpose/Rationale for Use ................ 20
Table 4: IMR Maximum Power Consumption ............................................................................. 21
Table 5: IMR Hardware/Materials Budget ................................................................................... 42
Table 6: Laser Mapping System Resolution Configurations........................................................ 45
Table 7: Laser Mapping System Scan Times ............................................................................... 47
x

LIST OF ABBREVIATIONS/ACRONYMS
.c7b – CTDB Database file format version 7, big endian .c7l – CTDB Database file format version 7, little endian CCD – Charge-Coupled Device CIX – Cognitive Information Exchange CLDC – Connected Limited Device Configuration CPN – Cognitive Packet Network CTDB – Compact Terrain Data Base DART – Department of Applied Research and Technology EEPROM – Electrically Erasable Programmable Read Only Memory .flt – Open Flight Database file format GPIO – General Purpose Input/Output GPL – General Public License HDD – Hard drive HSIO – High Speed Input/Output J2ME – Java™ 2 Platform, Micro Edition JRE – Java™ Runtime Environment JTAG – Joint Test Action Group IMR – Indoor Mapping Robot IST – Institute for Simulation and Training
xi

LADAR – Laser Detection And Ranging LAN – Local Area Network LIDAR – Light Detection And Ranging LMS – Laser Measurement System LOS – Line Of Sight LOC – Lines Of Code OEM – Original Equipment Manufacturer OSG – Open Scene Graph PWM – Pulse Width Modulation RADAR – Radio Detection And Ranging Army RDECOM – Army Research, Development, and Engineering Command SAF – Semi-Automated Forces SDK – Software Development Kit SEI – Software Engineering Institute SONAR – Sound Navigation And Ranging SSDA – Sequential Similarity Detection Algorithms STTC – Simulation Training and Technology Center VDC – Direct Current Volts VXL – Vision X Libraries, also known as Vision “Something” Libraries WAN – Wide Area Network WDS – Wireless Distribution System
xii

CHAPTER 1: INTRODUCTION
Digital mapping is a generic term known for the procedure of converting existing data,
into digital form. This definition is arguably a very broad term, meaning, it can represent
something as simple as typing a single character into a text editor, or it can be as complicated as
a system recording the dynamically changing weather patterns of our planet. The definition that
this paper is more concerned with is the digital mapping or recording of our environment, or
more specifically, our indoor environment.
There are several various reasons for building such a system. Certain industries are
constantly seeking alternative ways to integrate technology into everyday activities. This
evolving technology has the ability to be more effective and efficient, reduces the cost of manual
labor, and in some cases avoids endangering lives. Therefore, applications where humans are not
required or can be replaced with automated processes become more optimal than the more
traditional procedures.
Specifically, in commercial applications digital mapping has been used in one form or
another for years in airborne land surveying and robotic obstacle tracking [1]. Most recent
research has expanded the number of various mapping platforms to, include railway tunnel
surveying, search and rescue, mapping abandoned mines for safety, and robot guards which can
record physical features of intruders [2],[3],[4].
In certain situations there is a more ethical motivation at work. And that is the given basic
principle or understanding that a robot with ultimately a finite cost, i.e., expendable, is less
1

valuable when compared to that of a human life, which not popularly classified as expendable.
Why risk a human life when a robot can do the same thing, sometime, more accurately and
quickly, and with less liability to its organization?
The military has understood this concept for years, which consequently has led to
application solutions in digital mapping such as mobile robot reconnaissance for intelligence,
disaster response teams, hostage situations, and recording visual simulations for training
purposes [5].
This particular project falls under the military category and is funded partially from a
research grant given to UCF Institute for Simulation and Training as a portion of the Rapid
Construction of Urban Terrain Databases for Training STO provided by Army STTC RDECOM.
The goal of this research is to build a system capable of digitally mapping an urban or indoor
terrain quickly, inexpensively, and accurately enough, to create in as close to real-time as
possible, a properly geo-located database with selectable levels of detail and resolution. Its
ultimate purpose is to enhance visual, immersive simulations for personnel training.
So, just as there are many various ways and reasons for indoor mapping, there are just as
many ways, if not more, to scan the environment and represent the data in various resolutions,
levels of detail, precisions, permutations, etc. These selectable levels of representation are
important because they affect the speed and accuracy at which an environment is mapped.
1.1 Two Dimensions vs. Three
Almost any environmental mapping system is useless unless there is a reference point
given or a starting point as a basis of the entire system. In a two-dimensional system it is a very
elementary (x, y) Cartesian coordinate type of system based on a single plane. In most three-
2

dimensional systems it is the universal earth-centered, earth-fixed, or (x, y, z) Cartesian
coordinate system in multiple planes. This is an excellent way to represent electronic virtual
environments because any point can be expressed in any given space. However, a fact that is
arguable as a void in this type of a system is the location of that given space. We know there is
point cloud in space but where is the reference point of the space itself? For purposes of this
thesis, because we are mapping in a known “real” location on earth, it is possible to increase the
accuracy of the mapping by adding, in essence, a fourth coordinate to describe a “real” location.
Therefore, a mapping system when incorporated with other types of sensors, such as GPS and
triaxial gyros, allows more accurate database representation of terrain by including geo-location,
or accurate global positioning.
For all indoor mappings there will always be a starting point that can be given as a
reference to the global position.
Even when mapping in an unknown indoor or outdoor location, just by having one data
point with global positioning coordinates it is possible to extrapolate successive positions using
combinations of multiple sensors and localization. Sensors such as gyros, which can measure
angular acceleration, along with a magnetic compass and shaft encoders for measuring robotic
movement can all be combined to predict locations of the robot which can in turn predict
locations of mapped features to a global positioning coordinate.
1.2 Mapping Tools
A major fundamental difference between mapping indoor or urban environments and
topographic or outdoor environments is the appropriate use of mapping tools. Traditionally,
outdoor environments are scanned using LIDAR or RADAR systems. They are typically
3

mounted within satellites or on aircraft, with an occasional application on ground vehicles.
While radio and light wave emitting technology has evolved over decades and is now
mature and refined, there are still problems adapting these types of scan tools for indoors, mostly
due to the cost and physical size of the systems. In recent years a more effective classification or
tool for scanning close proximity outdoor or indoor environments has emerged known as
LADAR.
A LADAR system uses a transmitter to project a laser beam and then waits for the beam
to be reflected back to the receiver. It manipulates light much like a LIDAR system however
LIDAR is more classified and arguably more useful, for purposes of explanation in this thesis,
for scanning transparent or atmospheric mediums as opposed to LADAR which is considered
more for opaque mediums and generating 3D modeling [6]. One benefit of LADAR is the
accuracy of data returned from the scanner taking into account its proportion to size and cost.
LADAR theoretically allows for pinpoint accuracy, depending on the laser scanners resolution,
when built into a small package and at lower cost to that of RADAR scanning.
For purposes of this project, this is the greatest benefit of LADAR systems. Its ability to
accurately scan indoor or closed spaces in the three axis, x, y, and z from one small fixed
location is much more valuable than using RADAR antenna arrays which take up more physical
space.
Unfortunately because of the exorbitant cost associated with 3D laser scanners, it is for
the most part, beyond the financial reach of most researchers. However, the relatively low cost of
2D laser scanners allows researchers to obtain identical results to 3D laser scanners by modifying
the way the laser scanner is mounted to a given surface. By rotating the 2D laser scanner on a
fixed point, and accurately measuring the rotation angle theta it is possible to inexpensively
4

duplicate a 3D laser scanners results.
To achieve these results a standard 2D LMS is utilized in this project. The particular laser
chosen is the SICK LMS-200-30106. A custom mount built to hold the laser and rotate it in the y
axis also supports a one-hundred and eighty degree capable servo for rotating the laser in the z
axis thereby allowing a 3D capable scan.
At the same time video is taken and forwarded to a specific set of algorithms for
processing camera lens correction and line edge detection. Once this process is complete and
scan data error correction has taken place, the correlation of textures to scan data begins.
Depending on the desired format of the scan output the correlation software generates relations
between the data and outputs a viewable dataset or database. The time in which this process
takes place, as mentioned previously, is dependant on desired scan resolution or levels of detail.
The ultimate goal of this system is to evaluate the output of such tools compared with that
of existing systems and to evaluate the effectiveness or usability of a dynamically generated
database for virtual environments if such a system were to be implemented.
5
CHAPTER 2: LITERATURE REVIEW
In order to design an effective scanning or mapping system it is imperative to review the
designs and performance results of previously developed systems. To thoroughly review these
robotic mapping systems the following four separate categories of questions were considered.
The first group of questions is concerned with the types of robots used. How mobile or
versatile are they? Which systems use teleoperated, semi-autonomous, or autonomous robotic
control systems and what impact do these systems have on results? Which systems were custom
built or adapted from some other mechanical system? How is cost a factor?
Bergh, et al, developed a small, rugged urban robot known as “Urbie” for DARPA whose
purpose was for urban reconnaissance [5]. Zalud, et al, developed UTAR (Universal
Telepresence and Autonomous Robot) a rather large all-purpose testbed for evaluating multiple
types of hardware and software for mobile robotics [7]. El-Hakim, et al, built the DAP (Data
Acquisition Platform) on top of the existing Cybermotion K2A+ for testing 8 CCD cameras in
unison [8]. Nuchter, et al, has developed two separate robots. The first called “Ariadne” is based
on a commercial DTV for moving payloads. The second one, called “KURT2” which was
eventually renamed “KURT3D”, is a modified underground pipe inspection robot, very small
and compact [9], [10], [1], [11].
Something to keep in mind is that most robotic platforms surveyed were custom built for
their applications, such as “Urbie” and UTAR, therefore one can speculate as to the higher cost
to develop and manufacture them over previously existing platforms, such as “Ariadne” or
6

“KURT3D”.
In some cases the testing was never conducted on a robot at all. Ye and Borenstein used a
linear motion table to test the characterization of SICK laser scanning at different heights for
what would eventually be used for robot obstacle navigation [12].
The second group of questions is concerned with the types of scanners used to scan the
environment. What types of electronics, systems, or devices have been used in the past to obtain
3D images with favorable results? How are laser scanners better than other scanners?
Stereo vision is one option for reliable forms of sensing and is still used today.
Unfortunately, stereo vision systems are susceptible to certain camera and lighting conditions
such as direct light sources, darkness, and shadows. These conditions make vision difficult or
impossible [5], [13].
Some systems use modified handheld rangefinders which only range one point per scan.
However, these systems are extremely slow, and require an additional mechanical platform to
obtain more than one point [7].
Bergh, et al [5], and Garcia, et al [14], developed their own two-axis scanning laser
rangefinder because they were not pleased with the available scanners on the market at the time
[5]. They were able to match most other laser range finder capabilities but at a higher cost than
that of buying one from a manufacturer. Sequeira, et al, combined two laser range finders with
overlapping delays to form a type of stereo vision and ranging system [15].
In the table below is a brief survey of available handheld, 2D, and 3D laser rangefinders
and scanners [5], [16], [17], [18], [19].
7

Table 1: Common Handheld, 2D, & 3D Laser Rangefinders and Scanners
Manufacuterer Acuity Cyra Lieca Lieca Lieca Riegl SICKModel No.: AR4000-LIR Cyrax 2400 DISTO pro4a HDS 3000 HDS 4500 LMS-Z210 LMS-200-30106Dimensions: 1D 2D 1D 3D 3D 3D 2D
Cost: n/a 45,000$ 750$ 130,000$ 145,000$ 5,000$ 5,000$ Size (inches): 2x2x5 12.2x12.2x8 2.5x1.5x6 10x14x20 70x12x13 17.1x8.2 6.1x6.1x7.2
Weight: 1lbs 65lbs <1 lbs 35lbs 34.5lbs 28.6lbs 9.5lbsRange: 15m 50m 200m 100m 25m 8m 81m
Horizontal field of View (degrees): 150 20 - 360 360 170 180Vertical field of View (degrees): - 20 - 270 310 40 -
The third group of questions is concerned with how scanned data is manipulated. What
types of image correlation or registration techniques are used? How is scan data linked with
image data? Do any of the systems currently create realistic 3D environments or use geo-typical
versus geo-spatial models? What other algorithms are used for data manipulation?
El-Hakim, et al, proposed using markers or reflectors to accurately position surfaces
within an environment [8]. However this method is more suited towards known environments,
requiring the markers to be placed before the mapping begins. Saito, et al, also proposed a very
effective multi-camera based system with markers and an interesting correlation algorithm to
compliment it; however it is extremely inapplicable to a mobile robotic platform [20].
Nuchter, et al, use the popular and effective ICP algorithm (Iterative Closest Points) to
successfully align scan sets who share a similar shape. The algorithm is used as part of a new
design called Simultaneous Matching [21], [3], [1], [11].
The fourth and last question asks specific details about system metrics. How long does
one scan take to complete? What type of processing power is required to scan and manipulate
data visually? How is the quality of the final output measured? What is the resolution of scan
8

data?
Scott, et al, examined three different types of mapping algorithms on two different types
of range data to compare speed mapping and accuracy [22]. The methods examined, which also
relate closely to the types of mapping correlation is required, are Markov localization, the
iterative dual correspondence algorithm, and the model-free landmark extraction algorithm.
Frintrop, et al, used a mathematical method, similar to Scott, et al, of feature detection using
integral images. Which basically measure differences in reflection and depth of color range data
intensities from a SICK laser [23].
Taking into account the capabilities and results of the systems surveyed, along with
previous work personally conducted in the robotics field, a design is presented in Chapter 3
outlining potential improvements over current mapping systems, with potential decrease in
platform costs.
9

CHAPTER 3: DESIGN AND METHODOLOGY
Although the process of creating the robot is a result in and of itself, it is not the intended
main focus of this thesis. Instead, the robot acts as a tool or method of acquiring laser scan data
and eventually mapping results. However, a majority of the details pertinent to the robots
composition and its specifications are outlined in this chapter. Keeping this in mind, there are
enough details and results provided throughout this chapter that would allow the ambitious
researcher to duplicate such a robot. Other results as they pertain to the overall project and robot-
laser scanner interaction are included in the Results chapter.
As stated in Chapter 1, this project is partially funded from a portion of a research grant
for rapid construction of urban terrain databases. The obvious purpose in using the robot and
documenting the process in this chapter is to present the creation of the baseline system or
testbed to fulfill the goals of the research grant. Not all aspects of the research can be included,
due to the length of the project, and due to the fact that it is better to provide a detailed look at a
few important features, such as the laser scanner or software algorithms. However, the design of
the entire system is influenced by all portions of the research and does incorporate these features.
The design also takes into account possible desired features for the future.
3.1 Requirements and Planning The first step in any type of technical project, be it software or hardware, should be to
establish a list of requirements expected of the final system. In this case, the requirements are
10

based on a modified version of the original research project proposal submitted to Army
RDECOM. Again, to reiterate, for purposes of this project, not all aspects of intended research
are included from the original proposal. However, other components not vital to the basic
operation of the laser scanner and robot shall still be partially discussed. Only the basic
components for obtaining indoor terrain data, and manipulating it in such a way as to produce a
database, are discussed in extreme detail. Thus, having stated this, specific requirements are
extrapolated and designated as major features.
The first major requirement: Mapping shall be limited initially to indoor “terrain” only.
Mapping shall initially consist of using a mobile robotic platform incorporating laser range
finder. Other sensors to assist in the mapping process are video camera, triaxial gyro, control
servos, and GPS. Sensor calibration shall be incorporated into the robot control software.
The second major requirement: LADAR data shall be collected from the laser range
finder to create a point cloud source. An initial visualization capture, either video or still image,
shall also be collected to allow for data point and texture correlation.
Third major requirement: All mapping and control data shall be wirelessly relayed, via
high speed 802.11g hardware, to a central control station. The mapping data sent from the
LADAR system and the visualization data sent from the camera shall be processed using various
software algorithms by the central control station. The control station shall also provide an
interface to control the robot remotely.
Fourth major requirement: Use existing, where available, data correlation and image
manipulation, registration, and detection techniques such as SSDA, VXL, etc., to identify
predetermined key features. Through combination of visualization capture, mapping data and
sensor integration the mapping software shall create environment geometry.
11

The fifth and final major requirement: The robot control and mapping software systems
must be created following a formal software engineering software process to predict and control
quality, schedule, cost, and productivity, by using standard software metrics such as LOC,
defects, and time on task, among other things.
Based on these requirements different design options are considered. The first major
design consideration involves system architecture. There are two basic designs to consider, a
robot only design and robot-server design similar to a client-server design.
In the first system the robot acquires point cloud data, and builds the database onboard.
The major positive aspects of this design include less wireless bandwidth consumption, allowing
more bandwidth for communication and sending higher video resolution. The major negative
aspects include requiring more onboard computing power, space, and battery life, thus increasing
cost, which from a project management perspective is highly undesirable.
In the second system the robot acquires the point cloud data and sends the point cloud to
the server for building. The major positive aspects of this design include faster, more ‘real-time’
database build times, and the need for less computing power onboard the robot. The major
negative aspects include requiring more wireless bandwidth, increasing latency and potentially
lowering maximum video resolution.
However, because of the relatively low price of high bandwidth wireless adapters and the
ever increasing speeds of wireless devices the second architecture is chosen. It is the most cost
effective decision for a testbed of this nature.
The second major design consideration involves the type of laser scanner and the
positioning of the scanner on the mobile robot. Based on the survey conducted in the Chapter 2
Literature Review, the laser selected for use in the project is the LMS-200-30106.
12
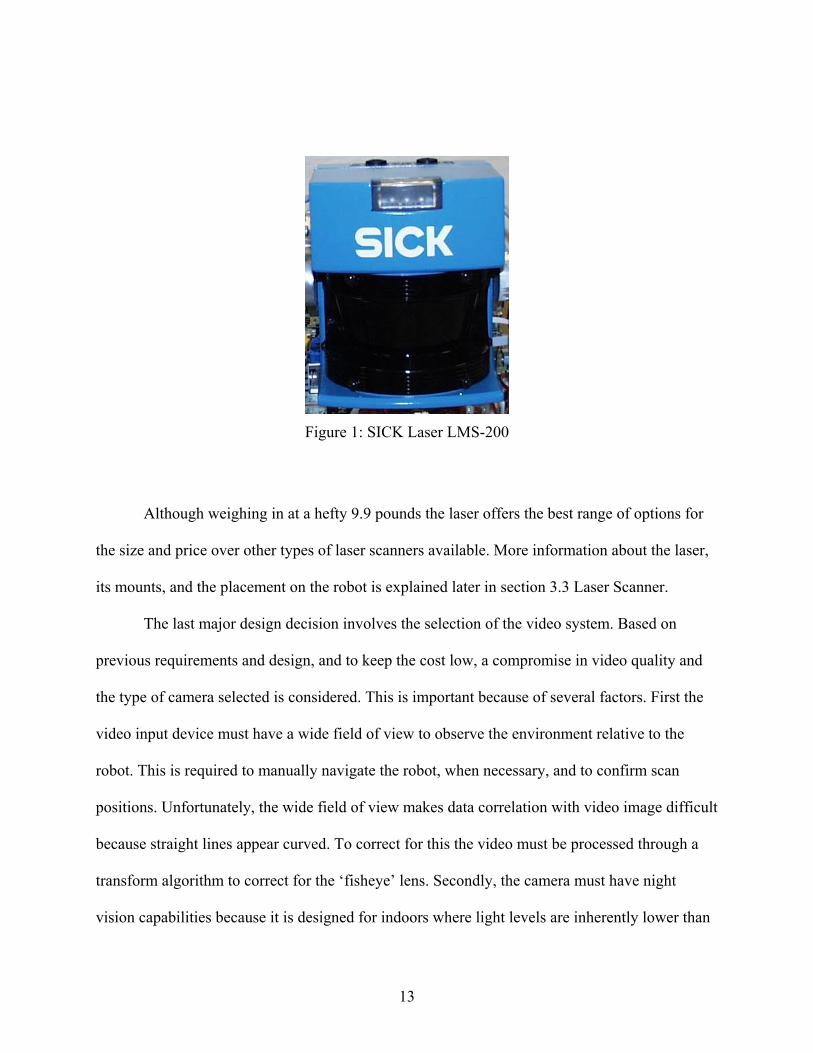
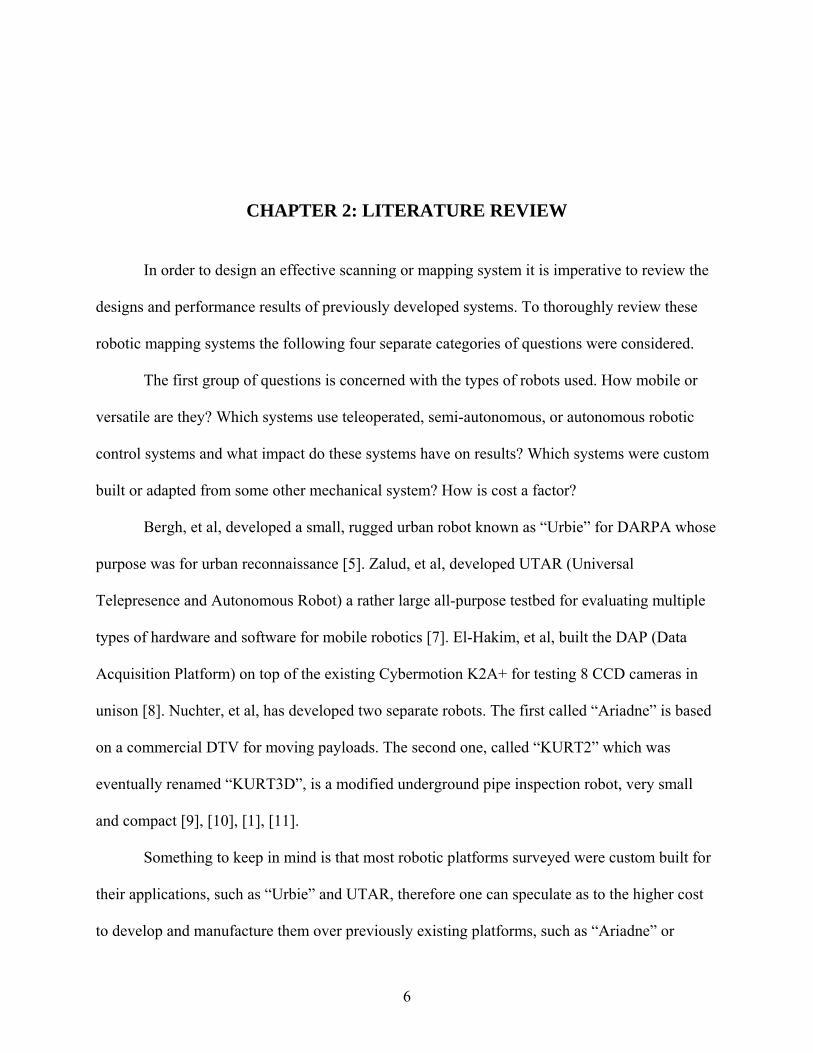
Figure 1: SICK Laser LMS-200
Although weighing in at a hefty 9.9 pounds the laser offers the best range of options for
the size and price over other types of laser scanners available. More information about the laser,
its mounts, and the placement on the robot is explained later in section 3.3 Laser Scanner.
The last major design decision involves the selection of the video system. Based on
previous requirements and design, and to keep the cost low, a compromise in video quality and
the type of camera selected is considered. This is important because of several factors. First the
video input device must have a wide field of view to observe the environment relative to the
robot. This is required to manually navigate the robot, when necessary, and to confirm scan
positions. Unfortunately, the wide field of view makes data correlation with video image difficult
because straight lines appear curved. To correct for this the video must be processed through a
transform algorithm to correct for the ‘fisheye’ lens. Secondly, the camera must have night
vision capabilities because it is designed for indoors where light levels are inherently lower than
13

outdoors. Lastly the video must have high enough of a resolution to take high quality images of
the environment however, not high enough to jeopardize bandwidth. This implies that the video
feed must be compressed to save bandwidth. An alternative option would be to add a separate
digital camera for better image resolution and a low resolution camera for robot navigation.
However, to keep project costs down, considering the robot is a testbed, the decision is
made to use a mid-grade infrared CCD video camera and output the source to a hardware
encoder. This removes the overhead associated with software compression encoding freeing up
resources on the robots’ onboard computers and decreasing the necessary bandwidth. A separate
high resolution digital camera can be considered at a later time for future work.
Finally, to give the Indoor Mapping Robot a more personal touch, it is given the name
IMR. The onboard computer is also given the hostname IMR while the control station to which it
interacts carries the hostname IMRserver.
After the major design considerations are determined the smaller remaining hardware and
software portions, most of which are dictated by requirements, others of which are selected from
previous work experience, are considered and the overall system architecture is created. The
designs of these smaller portions are outlined in each section in the remainder of this Chapter.
14
User Sensors
Issues Commands
Control Station IMR
Interpret & Issues commands to IMR
Processes and executes commands
Record and Return Sensor Data
Figure 2: High-Level System Architecture Diagram
The overall high level system architecture diagram which considers both software and
hardware capabilities and subsequent interactions are displayed in the Figure above.
3.2 Robot Components
The first step in implementing the design is to build the robot based on previously
determined requirements. The design calls for a mobile robotic platform large enough to carry, at
most, possibly a few square feet of electronics including the laser range finder, while taking into
consideration the potential for room to expand in the future if circumstances required. However,
the robot is intended for indoor use and therefore must be able to move freely in a limited space.
This implies the robot must be fairly small and able to turn 360 degrees upon itself without the
turning radius exceeding the width of rotation.
15
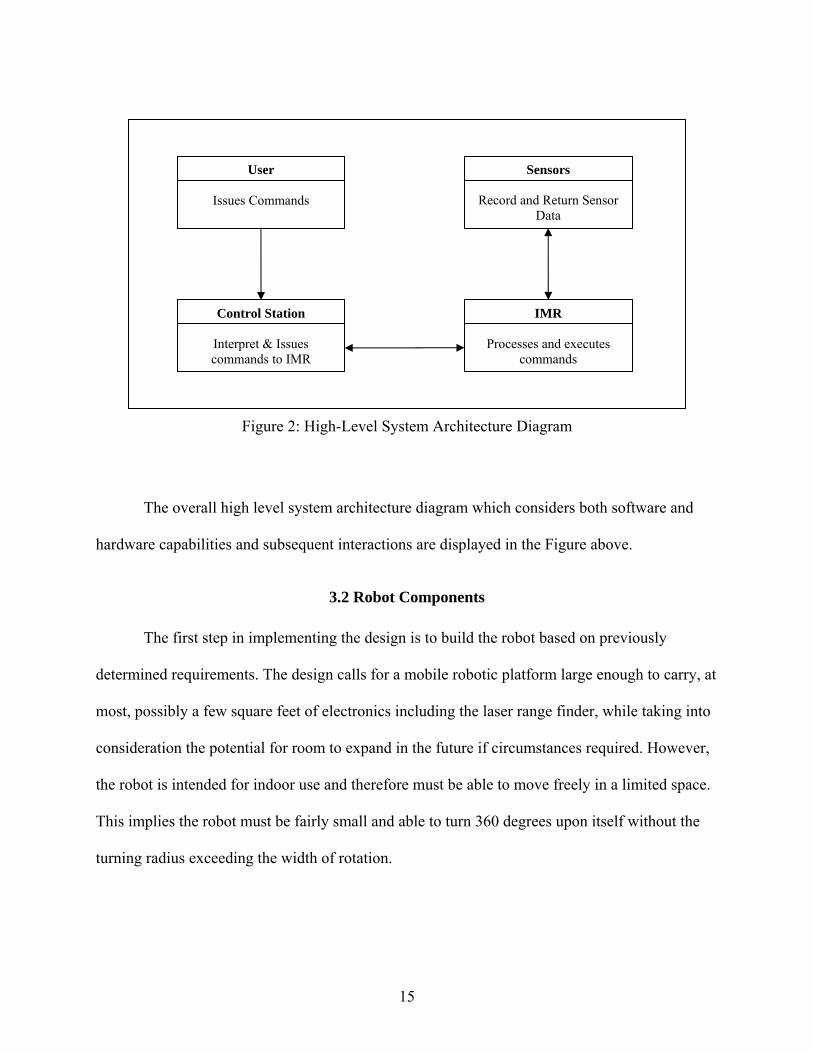
Figure 3: Robot Drive Motor Configuration Differences
A single motor solid axle drive system would be insufficient, because the turning radius
would double the width of rotation. This point is illustrated in the figure above (right). Instead,
the robot must have two motors and no axle(s) to allow a turning radius equal to that of the
robots width, with one motor pushing forward and the remaining motor pushing backward. This
point is illustrated in the figure above (left).
Recalling the purpose of the research is to concentrate on the mapping aspects of the
robot and not necessarily the building of said robot, an inexpensive alternative is chosen. A
refurbished Pride Mobility Jazzy Jet 3 Ultra electric wheelchair is obtained at a cost far below
that of the time and materials that would have been required in constructing a custom chassis.
The wheelchair includes the basics to build a solid robot drivetrain, such as powerful motors,
rigid gearboxes and high capacity batteries.
16
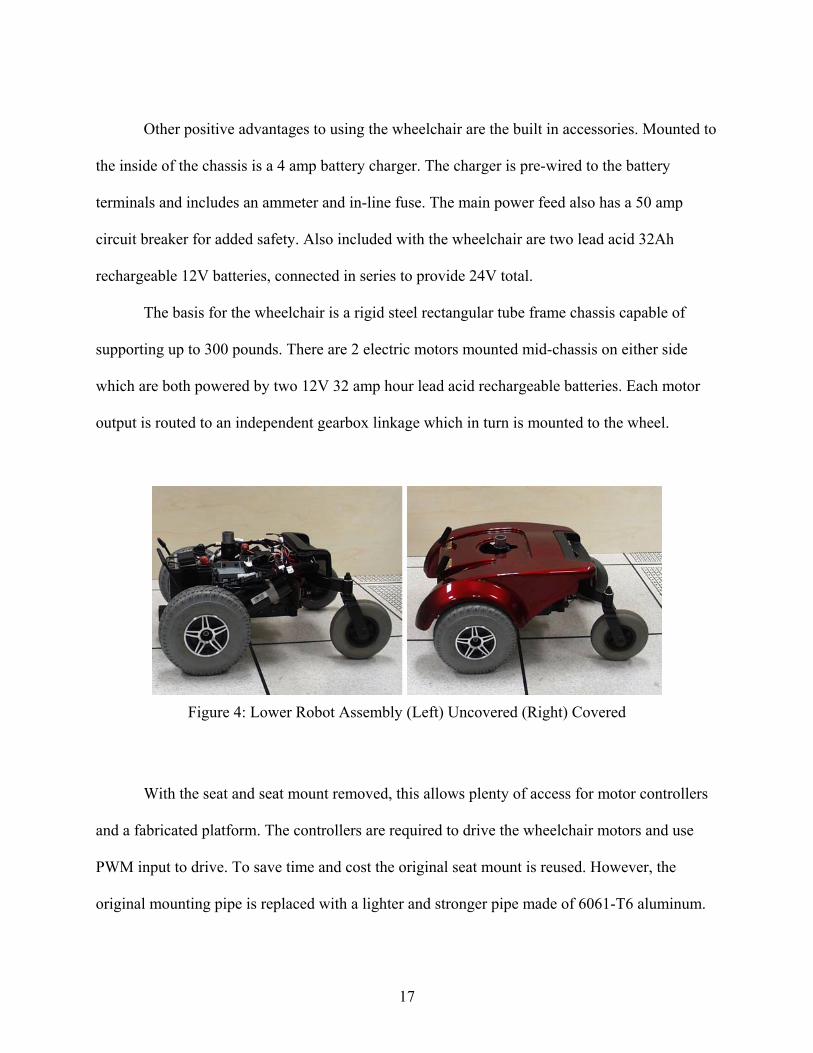
Other positive advantages to using the wheelchair are the built in accessories. Mounted to
the inside of the chassis is a 4 amp battery charger. The charger is pre-wired to the battery
terminals and includes an ammeter and in-line fuse. The main power feed also has a 50 amp
circuit breaker for added safety. Also included with the wheelchair are two lead acid 32Ah
rechargeable 12V batteries, connected in series to provide 24V total.
The basis for the wheelchair is a rigid steel rectangular tube frame chassis capable of
supporting up to 300 pounds. There are 2 electric motors mounted mid-chassis on either side
which are both powered by two 12V 32 amp hour lead acid rechargeable batteries. Each motor
output is routed to an independent gearbox linkage which in turn is mounted to the wheel.
Figure 4: Lower Robot Assembly (Left) Uncovered (Right) Covered
With the seat and seat mount removed, this allows plenty of access for motor controllers
and a fabricated platform. The controllers are required to drive the wheelchair motors and use
PWM input to drive. To save time and cost the original seat mount is reused. However, the
original mounting pipe is replaced with a lighter and stronger pipe made of 6061-T6 aluminum.
17

A new 20 inch x 16 inch x 1/8 inch plate, made also of 6061-T6 aluminum is mounted to the
original seat mount. The plate allows for a surface to mount the laser and additional hardware.
3.2.1 Hardware
The hardware components selected for IMR are based on a number of various factors.
First and foremost the components must be small or able to fit in locations with limited space.
However, they must not be so small that they incur additional cost because of their size. They
must be able to dissipate heat well, even in less than desirable conditions. Last, but certainly not
least, the cost must be fairly reasonable. The following two tables show a list of all the important
components necessary to fulfill the requirements.
18

Table 2: IMR Platform Component Descriptions and Purpose/Rationale for Use
Platform Component Description of Component and Purpose/Rationale For Use VIA EPIA M-10000 Mainboard
This motherboard utilizes a 1 GHz VIA C-3 processor with VIA main board chipset on a small, mini-ITX form factor with built-in RJ-45 jack for 100Mbit Ethernet. This board is chosen because of its small size (17cm x 17cm), fast processor, selection of built in peripherals, and low cost.
Hauppauge WinTV-PVR 250 This card takes any raw digital/S-video or analog/Composite video signal in and encodes the video to a compressed MPEG2 format. This card is chosen because of its ability to provide MPEG2 compression without the consumption of valuable software resources and to drastically reduce the bandwidth required to send the video data to the control station.
Quatech DSC-200/300 This RS-422/485 PCI serial adapter is necessary to receive the high speed data transmitted from the SICK laser. This card is chosen because of its recommendation provided by SICK.
IBM Travelstar HDD This is the hard drive for the VIA main board. Its selection for this project is based on its physical size (laptop HDD), higher resistance to G shock than regular desktop drives, and low cost.
IR-5HAD Video Camera This video camera utilizes a dual color/monochrome Sony 1/3" SuperHAD DSP CCD with IR illuminators to capture video in 0 lux lighting conditions. It is used on this robot because of its compact design, wide field of view (for navigation purposes), low power consumption, and low cost.
Linksys WRT54G Router These routers, with modified firmware, are capable of broadcasting in a, b, and g wireless frequencies up to 54 Mbps in standard and non-standard channels: 1 - 15. Both routers are utilized on this robot because of their low cost, speed, reliability, increased range (up to 900%), security, and their ability to run opensource firmware.
Motorola M12+ GPS Receiver
This GPS receiver operates at L1 frequency (1.275 GHz) and interfaces with a Synergy-GPS proto-board, with a length modified Motorola HAWK antenna. Its selection for this project is based on its ability to interface with RS-232 and its low power consumption.
Systronix JStik, JSQS, Jsimm Backplane
This native Java™ execution microcontroller allows execution of 15-20 million Java byte codes per second. The JStik is used because of ability to interface with RS-232 and low-level HSIO and GPIO, low power consumption, and compact size.
Victor 883 Motor Controllers These motor controllers are designed for use with 24V high amp drive motors for control by PWM signals. Their selection for this project is based on their ability to control 24VDC motors at high continuous and stall currents and because they have been utilized in past projects with much success.
Cincon 24VDC to 12VDC Converter
This converter simply converts battery 24VDC power to a filtered and regulated 12VDC power supply. The converter is used in this project to regulate power to the 12V bus and provide protection against high and low voltage conditions.
19
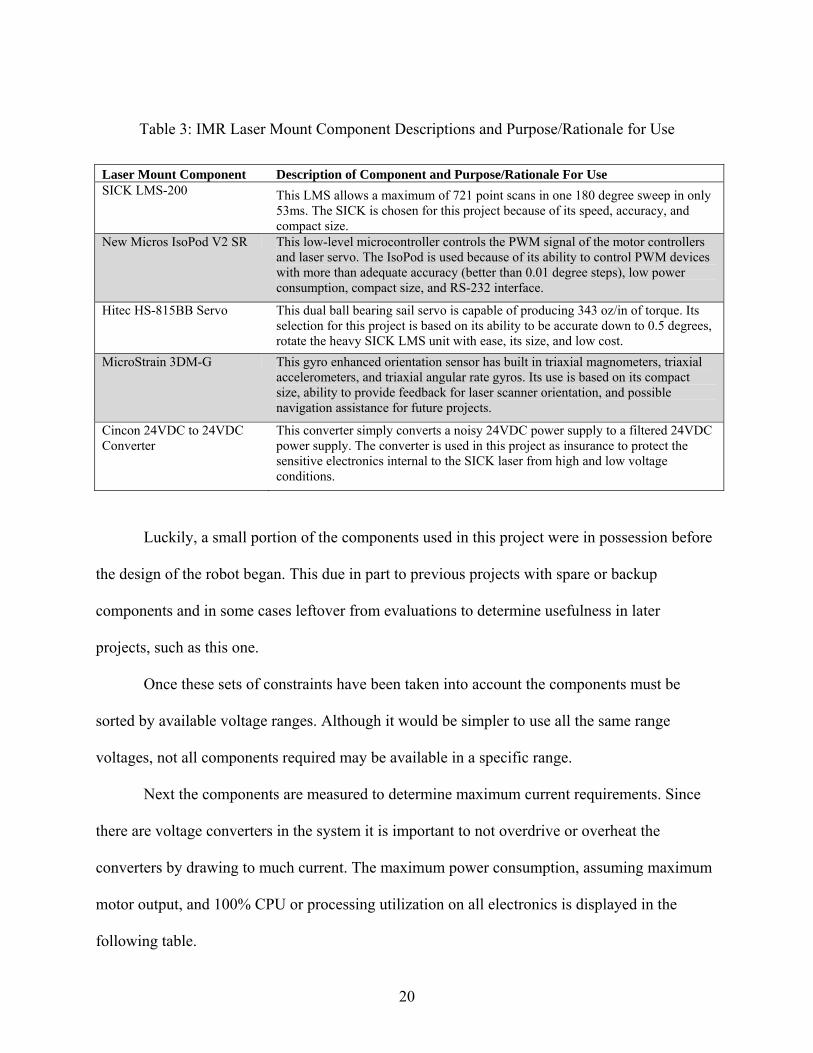
Table 3: IMR Laser Mount Component Descriptions and Purpose/Rationale for Use
Laser Mount Component Description of Component and Purpose/Rationale For Use SICK LMS-200 This LMS allows a maximum of 721 point scans in one 180 degree sweep in only
53ms. The SICK is chosen for this project because of its speed, accuracy, and compact size.
New Micros IsoPod V2 SR This low-level microcontroller controls the PWM signal of the motor controllers and laser servo. The IsoPod is used because of its ability to control PWM devices with more than adequate accuracy (better than 0.01 degree steps), low power consumption, compact size, and RS-232 interface.
Hitec HS-815BB Servo This dual ball bearing sail servo is capable of producing 343 oz/in of torque. Its selection for this project is based on its ability to be accurate down to 0.5 degrees, rotate the heavy SICK LMS unit with ease, its size, and low cost.
MicroStrain 3DM-G This gyro enhanced orientation sensor has built in triaxial magnometers, triaxial accelerometers, and triaxial angular rate gyros. Its use is based on its compact size, ability to provide feedback for laser scanner orientation, and possible navigation assistance for future projects.
Cincon 24VDC to 24VDC Converter
This converter simply converts a noisy 24VDC power supply to a filtered 24VDC power supply. The converter is used in this project as insurance to protect the sensitive electronics internal to the SICK laser from high and low voltage conditions.
Luckily, a small portion of the components used in this project were in possession before
the design of the robot began. This due in part to previous projects with spare or backup
components and in some cases leftover from evaluations to determine usefulness in later
projects, such as this one.
Once these sets of constraints have been taken into account the components must be
sorted by available voltage ranges. Although it would be simpler to use all the same range
voltages, not all components required may be available in a specific range.
Next the components are measured to determine maximum current requirements. Since
there are voltage converters in the system it is important to not overdrive or overheat the
converters by drawing to much current. The maximum power consumption, assuming maximum
motor output, and 100% CPU or processing utilization on all electronics is displayed in the
following table.
20
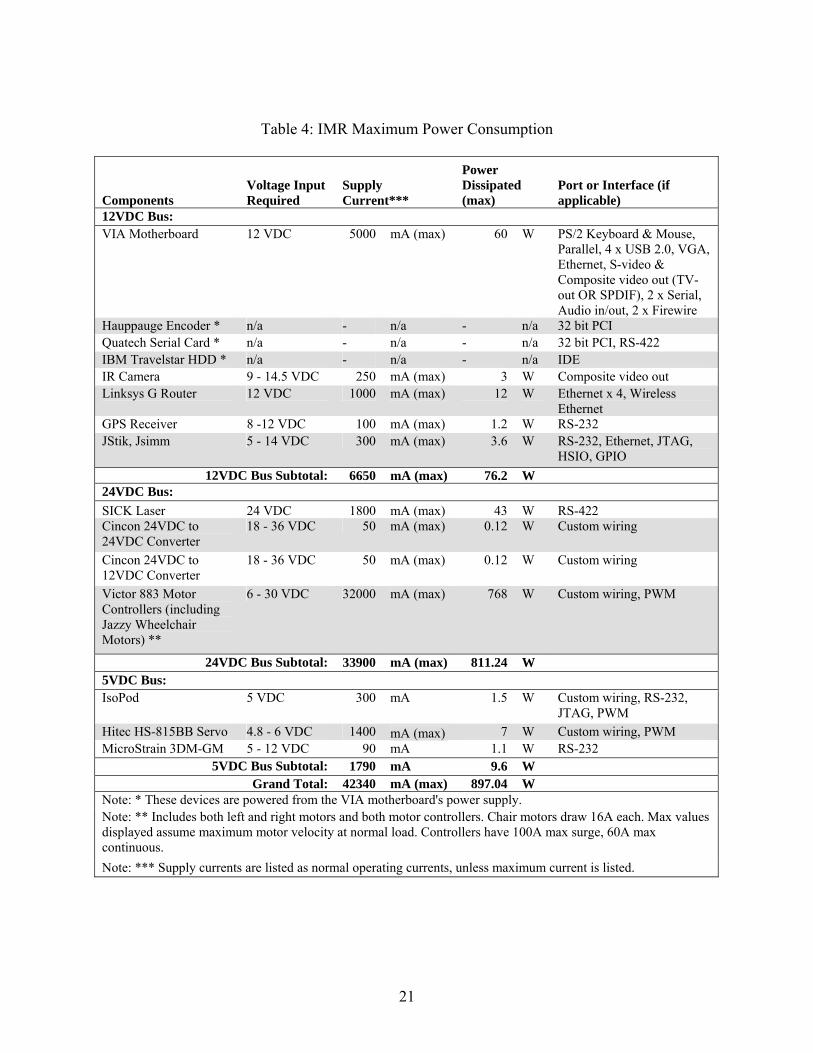
Table 4: IMR Maximum Power Consumption
Components Voltage Input Required
Supply Current***
Power Dissipated (max)
Port or Interface (if applicable)
12VDC Bus: VIA Motherboard 12 VDC 5000 mA (max) 60 W PS/2 Keyboard & Mouse,
Parallel, 4 x USB 2.0, VGA, Ethernet, S-video & Composite video out (TV-out OR SPDIF), 2 x Serial, Audio in/out, 2 x Firewire
Hauppauge Encoder * n/a - n/a - n/a 32 bit PCI Quatech Serial Card * n/a - n/a - n/a 32 bit PCI, RS-422 IBM Travelstar HDD * n/a - n/a - n/a IDE IR Camera 9 - 14.5 VDC 250 mA (max) 3 W Composite video out Linksys G Router 12 VDC 1000 mA (max) 12 W Ethernet x 4, Wireless
Ethernet GPS Receiver 8 -12 VDC 100 mA (max) 1.2 W RS-232 JStik, Jsimm 5 - 14 VDC 300 mA (max) 3.6 W RS-232, Ethernet, JTAG,
HSIO, GPIO 12VDC Bus Subtotal: 6650 mA (max) 76.2 W
24VDC Bus: SICK Laser 24 VDC 1800 mA (max) 43 W RS-422 Cincon 24VDC to 24VDC Converter
18 - 36 VDC 50 mA (max) 0.12 W Custom wiring
Cincon 24VDC to 12VDC Converter
18 - 36 VDC 50 mA (max) 0.12 W Custom wiring
Victor 883 Motor Controllers (including Jazzy Wheelchair Motors) **
6 - 30 VDC 32000 mA (max) 768 W Custom wiring, PWM
24VDC Bus Subtotal: 33900 mA (max) 811.24 W 5VDC Bus: IsoPod 5 VDC 300 mA 1.5 W Custom wiring, RS-232,
JTAG, PWM Hitec HS-815BB Servo 4.8 - 6 VDC 1400 mA (max) 7 W Custom wiring, PWM MicroStrain 3DM-GM 5 - 12 VDC 90 mA 1.1 W RS-232
5VDC Bus Subtotal: 1790 mA 9.6 W Grand Total: 42340 mA (max) 897.04 W
Note: * These devices are powered from the VIA motherboard's power supply. Note: ** Includes both left and right motors and both motor controllers. Chair motors draw 16A each. Max values displayed assume maximum motor velocity at normal load. Controllers have 100A max surge, 60A max continuous. Note: *** Supply currents are listed as normal operating currents, unless maximum current is listed.
21

There are actually two separate 24VDC buses in this system, however for simplicity sake
they are both included together in the table. The first bus provides power to the platform
electronics through the Cincon converter, while the second one provides direct power from the
batteries solely to the motors and motor controllers. Each system is controlled through a power
switch located on the back of IMR.
The method by which each different component interacts with the rest of the system can
be found in the Interface Figure below.
22

Hardware/Sensor Interface Diagram
SICK Laser Scanner
RS-422
Figure 5: Hardware/Sensor Interface Diagram
One unique feature of the hardware setup on IMR is the use of the Linksys WRT54G
routers for networking. It was determined in the design that to allow the JStik and the VIA
motherboard adequate communication bandwidth they should communicate through Ethernet
Motor Speed Controllers
VIA
Motherboard
JStik
IsoPod
Linksys Wireless G
Router (IMR)
MicroStrain 3-axis Gyro
Video Camera
GPS
Ethernet
RCA Video Base / Control
Station
PWM
Serial Serial
Power
Wireless Ethernet Linksys
Wireless G Router
(IMR server)
Ethernet
Serial
Drive Motors
Hitec Laser Servo
PWM
23
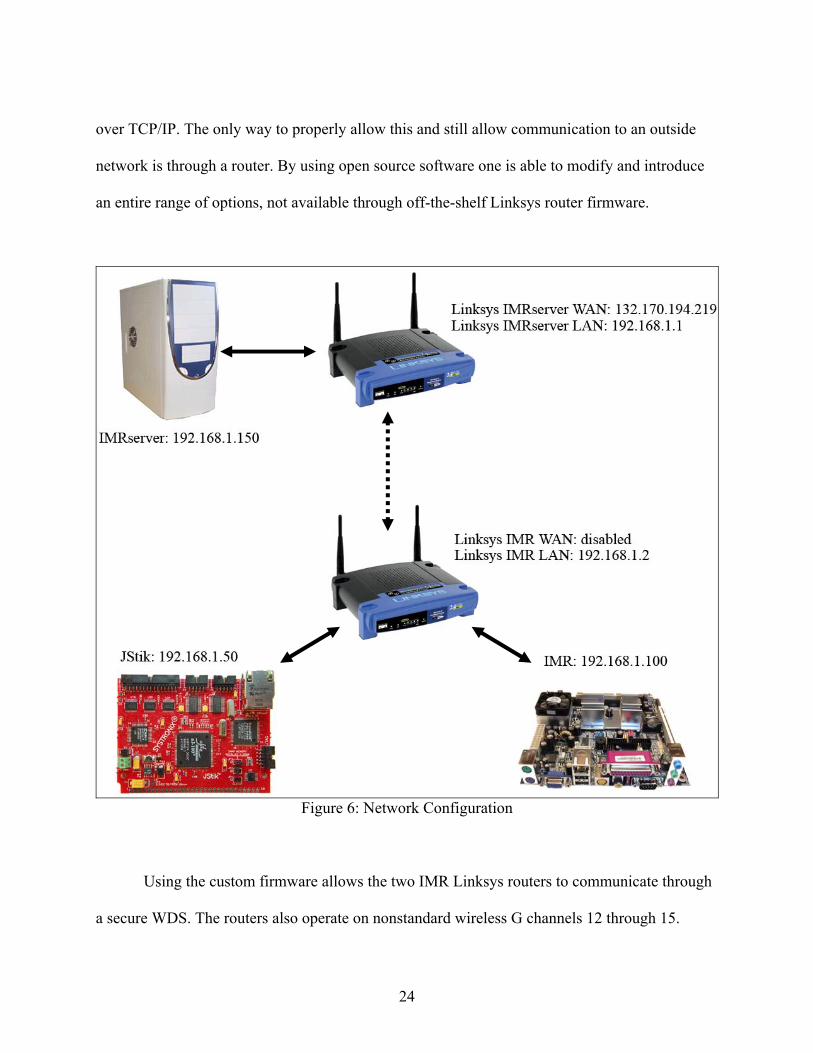
over TCP/IP. The only way to properly allow this and still allow communication to an outside
network is through a router. By using open source software one is able to modify and introduce
an entire range of options, not available through off-the-shelf Linksys router firmware.
Figure 6: Network Configuration
Using the custom firmware allows the two IMR Linksys routers to communicate through
a secure WDS. The routers also operate on nonstandard wireless G channels 12 through 15.
24

Because of this, most standard hardware cannot see that the wireless network exists, making it an
even more secure wireless network. In addition the transmit power can be decreased or increased
as high as 900% over factory firmware [24].
3.2.2 Software
Per the requirements outlined at the beginning of this chapter the software systems must
be created following a formal software engineering software process. Due to the relatively small
size of this project and because there is only one author, selecting and implementing an
enterprise or team based software process model is unnecessary and counterproductive.
Therefore the only practical option is to follow the Personal Software Process, a widely accepted,
mature, and effective software development model developed by the SEI at Carnegie Mellon to
train programmers [25]. The process level selected for the project is PSP1. The rationale behind
selecting this process level lies in the fact that the author is not an expert in the programming
languages utilized in the system. This could arguably have a negative impact on accurate
measurement of software performance, especially at the more advanced levels of PSP which
require creating more accurate software templates based on knowledge of the programming
language. Therefore, a lower level, more basic process level is implemented. The process forms
are slightly modified for more practical personal use rather than from an educational standpoint.
The remainder of this section describes the high-level overview of the software design.
Based on the requirements, the design decisions outlined in the previous sections, and the
hardware selections, the software conceptual design is formed. There are several different
independent systems that construct the framework for the IMR software system. The different
software components are easily explained by dividing them into their three different sub-systems
25
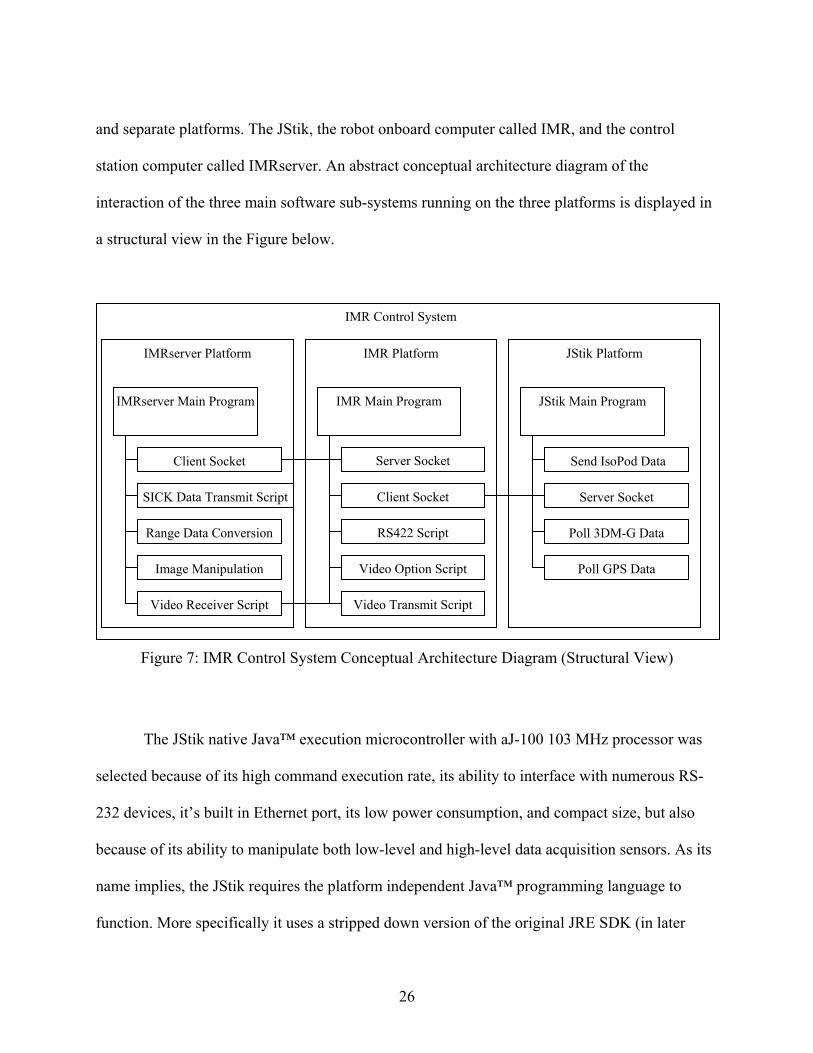
and separate platforms. The JStik, the robot onboard computer called IMR, and the control
station computer called IMRserver. An abstract conceptual architecture diagram of the
interaction of the three main software sub-systems running on the three platforms is displayed in
a structural view in the Figure below.
IMR Control System
Figure 7: IMR Control System Conceptual Architecture Diagram (Structural View)
The JStik native Java™ execution microcontroller with aJ-100 103 MHz processor was
selected because of its high command execution rate, its ability to interface with numerous RS-
232 devices, it’s built in Ethernet port, its low power consumption, and compact size, but also
because of its ability to manipulate both low-level and high-level data acquisition sensors. As its
name implies, the JStik requires the platform independent Java™ programming language to
function. More specifically it uses a stripped down version of the original JRE SDK (in later
Client Socket
Range Data Conversion
Server Socket
Video Receiver Script
Server Socket
Video Transmit Script
Video Option Script
Client Socket
Image Manipulation
SICK Data Transmit Script
Poll 3DM-G Data
Poll GPS Data
Send IsoPod Data
RS422 Script
IMR Main Program IMRserver Main Program JStik Main Program
IMRserver Platform IMR Platform JStik Platform
26

releases the name changed to J2SE SDK), called J2ME. The libraries of major importance within
this release are the CLDC libraries and included with them are classes added specifically for the
aJ-100 processor from aJile Systems Inc. Depending on the desired functions of the JStik this can
be a challenge as not all standard JRE functions are included.
To use the JStik, code is written using Java and then compiled using the libraries
described above. A separate conversion program converts the output class files to a binary
format readable by the aJ-100 chipset, followed by a separate program which uploads the binary
file to JStik flash memory. This allows the JStik to execute the flashed code at every power-up.
Once the JStik is operational it creates a socket server for accepting incoming
connections from the IMR computer. Once a socket is established the JStik waits for incoming
commands. Depending on the incoming commands, the JStik will poll the 3DM-G for gyro
orientation data, poll the GPS for position data, or issue servo or motor controller commands to
the IsoPod. All incoming commands force return confirmation receipt commands and/or the
aforementioned sensor data.
The second software platform is the onboard computer called IMR. IMR is the hostname
given to the Debian Linux operating system which resides on the IBM laptop HDD connected
through the Mini-ITX VIA Mainboard. IMR uses the standard C programming language and
compiler to control a server socket to listen for connections from the IMRserver. It also controls
the client socket to pass commands from the IMRserver socket to the JStik. Within this system
IMR also executes a few small shell script commands for controlling video input/output of the
Hauppauge card and the baud rate of the RS422 Quatech card. The scripting is used to simplify
the code, the compiling process, and ultimately to simplify the overall system by excluding
external libraries from system compile. IMR also controls issuing commands for properly
27

orienting the laser scanner, and is responsible for collecting the laser range data from the SICK
LMS.
The third software platform is the control station computer called IMRserver. IMRserver
is a standard desktop machine which also runs the Debian Linux operating system. IMRserver
also uses the C programming language to transmit commands between the client socket and the
IMR server socket. In addition to the socket control, IMRserver is also responsible for converting
the range data into useable (x, y, z) data, along with manipulating all image data. Within this
system IMR also executes a few small shell script commands for receiving video data and
initiating range data transfer. IMRserver is ultimately responsible for correlating the image and
range data.
3.3 Laser Scanner
The laser scanner is arguably the most important sensor mounted to the robot. As
mentioned previously it is selected because of its speed, accuracy, and compact size. By using an
infrared laser beam reflected on to a spinning mirror the laser is projected out the front grill of
the SICK laser toward a target. The receiver measures the “time-of-flight” for the beam to be
reflected back to the SICK and determines the distance to the target and outputs this value to the
serial port in real-time (see Figure below [18]).
28
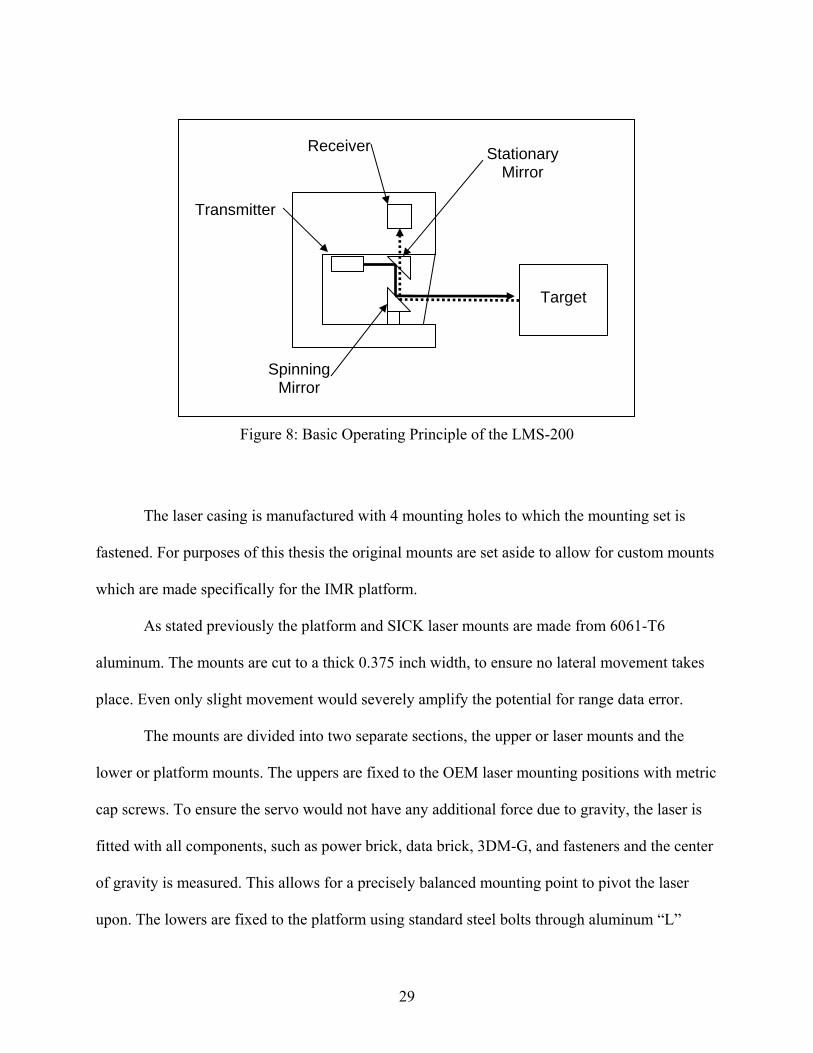
Receiver
Figure 8: Basic Operating Principle of the LMS-200
The laser casing is manufactured with 4 mounting holes to which the mounting set is
fastened. For purposes of this thesis the original mounts are set aside to allow for custom mounts
which are made specifically for the IMR platform.
As stated previously the platform and SICK laser mounts are made from 6061-T6
aluminum. The mounts are cut to a thick 0.375 inch width, to ensure no lateral movement takes
place. Even only slight movement would severely amplify the potential for range data error.
The mounts are divided into two separate sections, the upper or laser mounts and the
lower or platform mounts. The uppers are fixed to the OEM laser mounting positions with metric
cap screws. To ensure the servo would not have any additional force due to gravity, the laser is
fitted with all components, such as power brick, data brick, 3DM-G, and fasteners and the center
of gravity is measured. This allows for a precisely balanced mounting point to pivot the laser
upon. The lowers are fixed to the platform using standard steel bolts through aluminum “L”
Transmitter
Spinning Mirror
Target
Stationary Mirror
29

channel. The rationale behind the placement of the lower mounts on the platform will be
discussed later on in this section.
On each side of the laser the upper and lower mounts are connected by a single partially
threaded cap screw. The cap screw passes through two spherical ball and roller bearings pressed
into the lower mount at the laser pivot point and rests the weight of the laser on the bearings. The
cap screw threads into the upper mount pivot point and is secured with thread locking compound.
Figure 9: SICK Laser Mount with Camera and Servo
The video camera is fixed to the right side of the upper mount to allow the camera to
move with the laser. To ensure proper camera alignment the camera is mounted using an
aluminum plate to the upper laser mounts. The cap screws which mount the camera to the upper
mount is secured using thread locking compound. This prevents the camera from moving from
its position after the calibration has been performed. The bottom of the servo is mounted to the
left side of the lower mount while the top of the servo connects through the resin servo wheel to
30
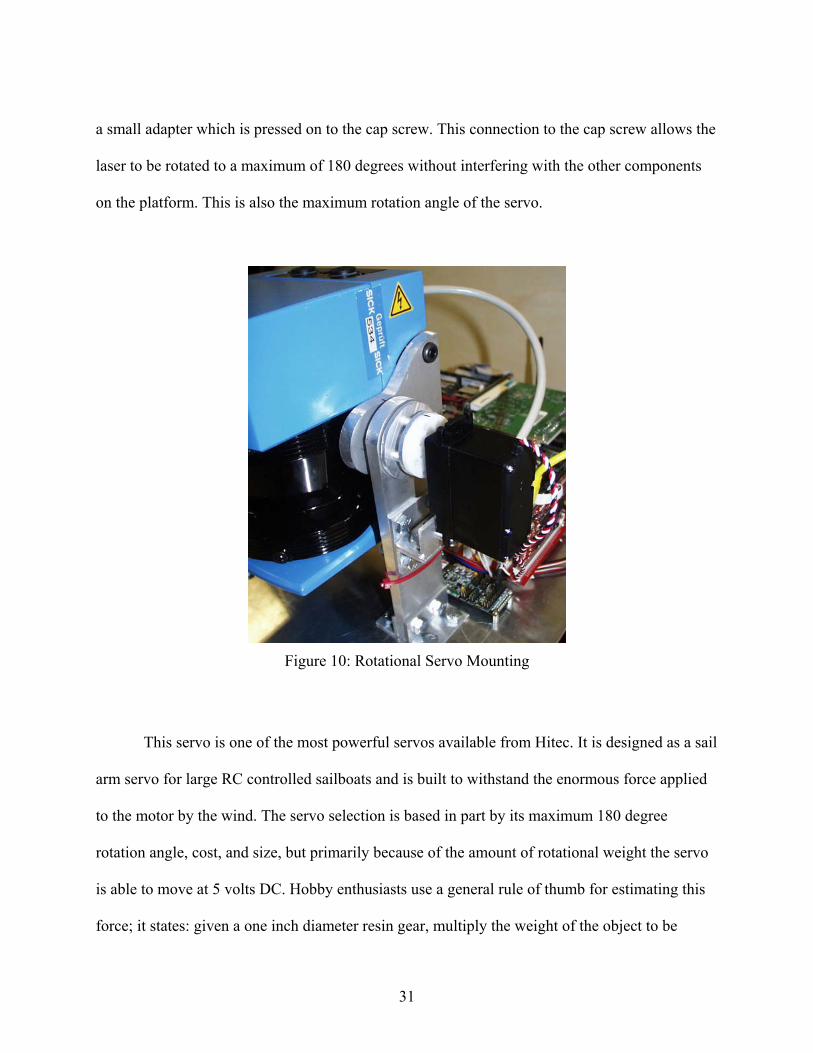
a small adapter which is pressed on to the cap screw. This connection to the cap screw allows the
laser to be rotated to a maximum of 180 degrees without interfering with the other components
on the platform. This is also the maximum rotation angle of the servo.
Figure 10: Rotational Servo Mounting
This servo is one of the most powerful servos available from Hitec. It is designed as a sail
arm servo for large RC controlled sailboats and is built to withstand the enormous force applied
to the motor by the wind. The servo selection is based in part by its maximum 180 degree
rotation angle, cost, and size, but primarily because of the amount of rotational weight the servo
is able to move at 5 volts DC. Hobby enthusiasts use a general rule of thumb for estimating this
force; it states: given a one inch diameter resin gear, multiply the weight of the object to be
31
moved by the servo by a factor of 16. So, taking the given weight of the SICK laser along with
the miscellaneous hardware mounted to it for a total of 12 pounds and multiplying this by 16 it
equals 192. Therefore any servo which is capable of producing 192 oz/in of torque or less at 5
VDC is suitable for this system. The Hitec servo selected for this project is capable of 275 oz/in
at 4.8 VDC and a maximum of 343 oz/in at 6 VDC [26]. This amount far surpasses the required
quantity which equates to an extremely stable scanning system.
Now that the maximum angle of the servo is known, the placement of the lower mounts
on the platform can be determined. Heavy consideration is given to the exact placement of the
mount on the platform and the height of the laser because it is critical to accurately and
sufficiently obtain scan data. The reasoning behind this is simple. If the mount is too close to the
front of the robot, the laser angle of the servo must be increased to compensate for the close
proximity to target, thereby decreasing efficiency and increasing time to scan. In addition this
would require the lower mounts to be modified so as not to interfere with the laser beams. This
would require the pivot point to be moved backwards from the lasers center of gravity, thereby
increasing the rotational weight of the scanner, and increasing the requirements of the servo. If
the mount is to far back on the platform the minimum servo angle must be increased for fear of
scanning the platform, which would in turn increase the distance from robot to target, thereby
needlessly decreasing the overall resolution.
A sufficient compromise to mount placement is decided upon. The height of the laser
from the ground is set at 585mm. The mount is fixed on the platform completely perpendicular
to the level platform in such a way that it provides for a minimum distance from laser to target of
610mm. This distance and height allows the laser to scan from floor to ceiling of a 10 foot high
room at a servo angle no greater than 120 degrees without encountering the platform and without
32
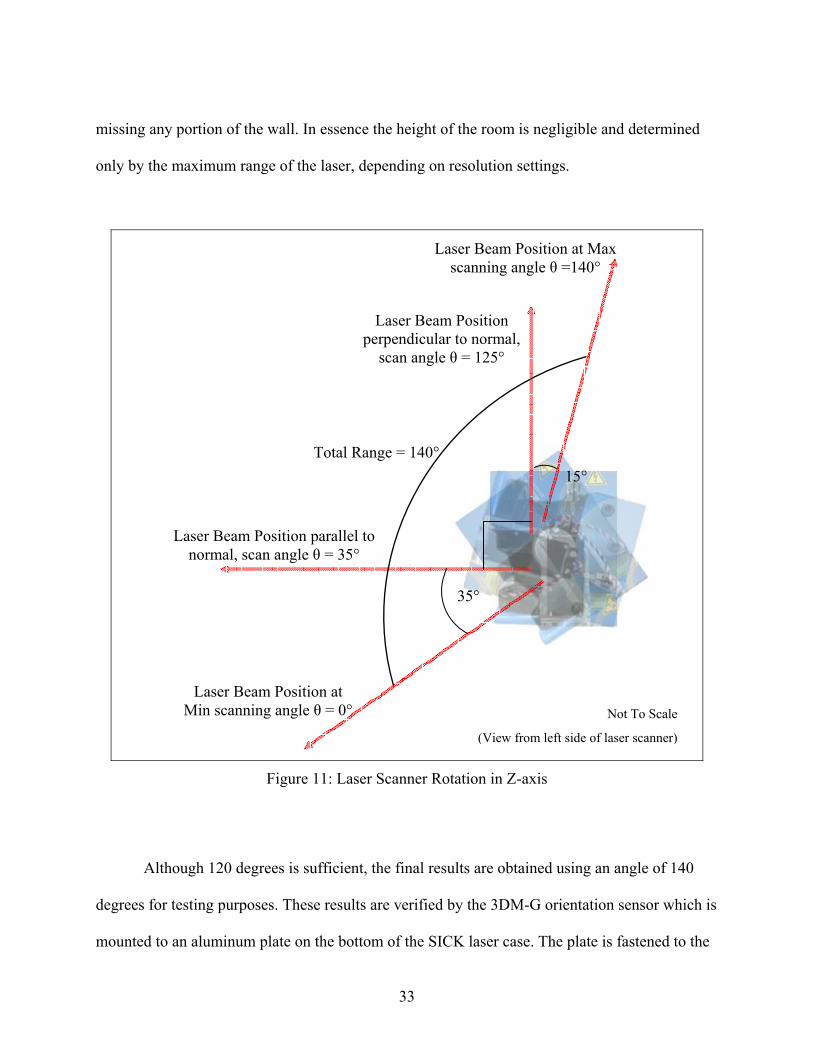
missing any portion of the wall. In essence the height of the room is negligible and determined
only by the maximum range of the laser, depending on resolution settings.
(View from left side of laser scanner)
Not To Scale
15°
Laser Beam Position at Min scanning angle θ = 0°
Laser Beam Position at Max scanning angle θ =140°
35°
Total Range = 140°
Laser Beam Position parallel to normal, scan angle θ = 35°
Laser Beam Position perpendicular to normal,
scan angle θ = 125°
Figure 11: Laser Scanner Rotation in Z-axis
Although 120 degrees is sufficient, the final results are obtained using an angle of 140
degrees for testing purposes. These results are verified by the 3DM-G orientation sensor which is
mounted to an aluminum plate on the bottom of the SICK laser case. The plate is fastened to the
33

case through metric cap screws. More information about this verification process can be found in
the Calibration subchapter below. This final effective laser scanning area equates to a little over
three quarters of a hemisphere. More results including information about resolution is explained
in Chapter 4 Results.
3.4 Calibration In order to accurately measure and control the position and orientation of the robot in its
environment a structure for measuring the error from the sensors and adjusting or calibrating the
software accordingly must be devised. Not all measurement or control devices on the robot
require end-user calibration, however, all said devices, along with explanation of why or why not
the calibration may or may not be required, are described below.
The first and arguably most important sensor on the robot is the laser scanner system.
Luckily the LMS-200 itself is factory calibrated, requiring no special adjustment by the end-user.
However, the laser is part of a scanning system which does require calibration.
As previously mentioned in section 3.3 above, the laser is balanced to its center of gravity
and the pivot point drilled and mounted at that location. An important fact to include about the
laser is the offset of the scanner mirror and laser beam intersection, from axis of servo rotations
on mount. As mentioned previously the laser scanner has been mounted such that the weight
would be as close to evenly distributed or balanced as possible. This would allow the servo the
least amount of resistance against gravity and to keep the laser scanner at the desired angle.
Unfortunately, because of this necessary design decision the mounting point is different both
vertically and horizontally than the actual laser scanning point. Therefore a finite measurable
value for offsetting this rotation point in the y axis must be accounted for in the calibration and
34

consequently in the software design of the scanner. The vertical offset, the distance from the
laser scanner mirror vertically to laser pivot point, is measured at -35mm while the horizontal
offset, the distance from the laser scanner mirror horizontally to laser pivot point, is measured at
+31.75mm. These values are accounted for in the software range data conversion system.
Next to be calibrated is the camera. As stated previously the camera is mounted in such a
way to prevent movement from its position after the calibration has been performed.
Complicating the process unfortunately is the internal CCD in the camera. Preliminary tests
show the CCD is not mounted exactly perpendicular inside the internal camera mount. This is
due most likely to a slight manufacturing defect. It is decided that no camera will be exactly
perfect therefore a rotation algorithm shall be implemented in the system. Through trial testing
the image rotation is corrected by translating or rotating the pixels counter clockwise by 3.25
degrees.
Next a calibration board with known graduation widths is placed at a specific distance
from the camera and an image is captured. By measuring the camera to board distance the
horizontal and vertical fields of view are verified with manufacturers’ specifications of 74°
horizontal and 56° vertical (105° diagonal). Measurement shows the field of view is slightly
larger than specs, at +4° horizontally, and +3° vertically. Next the field of view is mapped to the
capture image pixels which measure 640 x 480. However, the capture image does not precisely
match the effective pixel count within the CCD. In addition, the 3.6mm wide angle lens creates a
very noticeable ‘fisheye’ effect. These camera attributes combine to form a mild image distortion
which equates to quite a challenge for selecting proper combination and order of image
manipulation software algorithms. This distortion is most prevalent towards the bottom edges of
the image. The worst of it is located in the bottom right corner and may have more serious
35
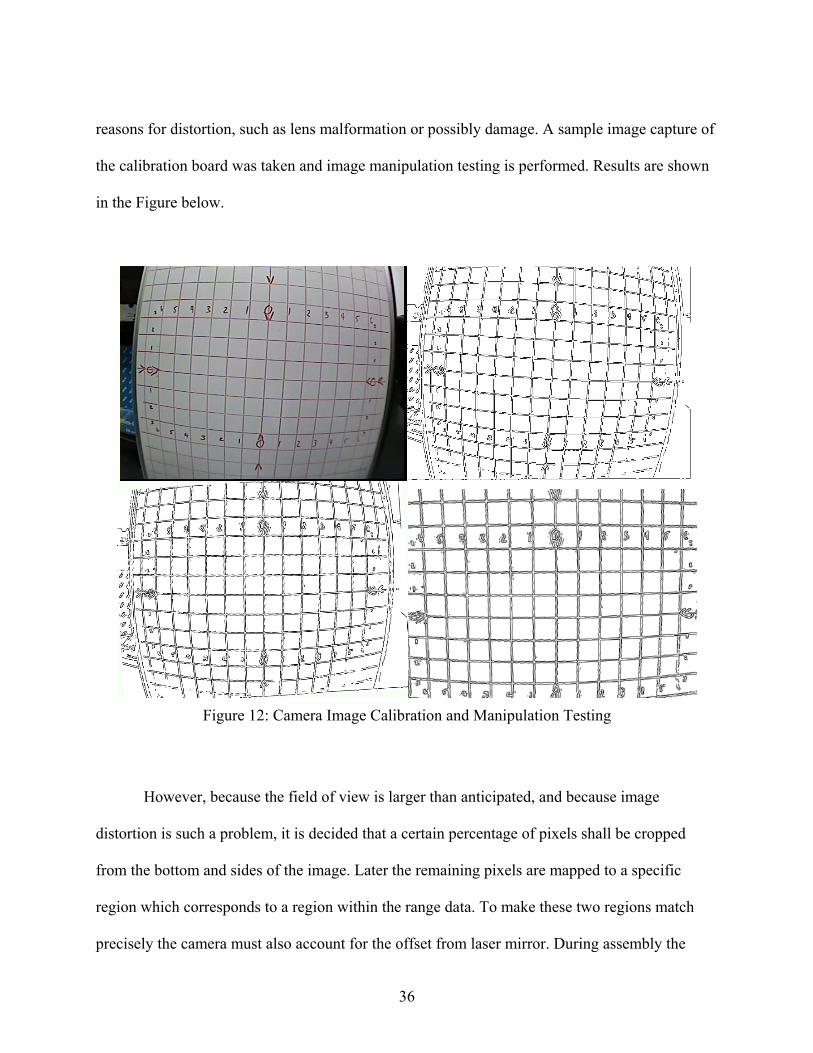
reasons for distortion, such as lens malformation or possibly damage. A sample image capture of
the calibration board was taken and image manipulation testing is performed. Results are shown
in the Figure below.
Figure 12: Camera Image Calibration and Manipulation Testing
However, because the field of view is larger than anticipated, and because image
distortion is such a problem, it is decided that a certain percentage of pixels shall be cropped
from the bottom and sides of the image. Later the remaining pixels are mapped to a specific
region which corresponds to a region within the range data. To make these two regions match
precisely the camera must also account for the offset from laser mirror. During assembly the
36

camera is mounted such that offset in the x-axis is 0, indicating the laser mirror matches the lens
aperture of the CCD. The offsets above the laser mirror, in the z-axis, are measured at +76mm,
and +133mm right of the laser mirror, in the y-axis. These offsets are necessary to prevent the
camera from colliding with the lower mounts during servo rotation. These offset values are
added in software to properly calibrate the camera to scan data. Results for image manipulation
including rotation/translation, edge detection, fisheye removal, and image/range data correlation
are included in Chapter 4 Results.
The next sensor to consider calibrating is the 3DM-G triaxial gyro enhanced orientation
sensor. However, fortunately the manufacturer of the 3DM-G, MicroStrain, individually
calibrates each sensor and sends a certificate of calibration which certifies the exact range of the
sensor. The calibration is only good for each particular serial numbered sensor. MicroStrain
guarantees these values to be true and accurate and therefore calibration of the gyro only consists
of verifying the values included with the calibration certificate.
The next device to consider calibration is the Hitec servo which controls the laser system
rotation. By purposely mounting the servo at the 0 degree rotation angle and lining this position
up with the starting angle determined in subchapter 3.3 above, this provides a baseline to begin
the calibration. Keep in mind, all rotation angles are set in software on the JStik and sent to the
IsoPod for PWM timing generation. The IsoPod pulse-width values set in the JStik software
range from approximately 1.0 to 3.5 ms pulse-widths which correspond to similar values as
found on most toy radio controllers. Knowing the maximum rotation range of 180 degrees and
minimum servo angular resolution of 0.5 degree provided by Hitec the servo is rotated to the
predetermined range of 140 degrees [26]. Next, by dividing the pulse-width values set in
software by the number of desired degree steps, 270, an adequate step width can be set in
37

software. These angles are verified through the 3DM-G which is mounted to the bottom of the
SICK laser casing. Once the steps have been determined the servo should not need to be
calibrated again, unless the servo or 3DM-G is removed from their respective mounts.
The last devices to calibrate are the Victor motor controllers which drive IMR. The motor
controllers have a simple built-in calibration procedure that must be followed per the
manufacturers’ instructions. By depressing the controller ‘cal’ button and sending the appropriate
50Hz signal from the IsoPod the Victor writes the maximum, neutral, and minimum values
received from the IsoPod to its EEPROM. These are the same pulse-width values as the servo
calibration in the previous paragraph. However this calibration is only performed at initial robot
startup, after robots initial assembly and luckily does not require recalibration over time. Once
the maximum, neutral, and minimum position PWM signals are set to the controllers they stay
this way until a new calibration is programmed.
38
CHAPTER 4: RESULTS
The following chapter of results describes in detail the sequence of events for obtaining
data which is useful for database creation. Although numerous tests are conducted on IMR with
varying levels of difficulty, only two main categories of scenarios are selected for review.
The first scenario uses a single scan in a relatively empty office building hallway. The
rationale for this scenario is to evaluate the robots performance in a simplistic environment. This
scenario is designed to be simple for the IMR system to evaluate. The last scenario demonstrates
multiple scans of the same long office hallway from scenario one. The idea behind this scenario
is to test the software for multiple data set correlations between system mapping sequences.
4.1 Robotic Platform
The IMR robotic platform testbed is an excellent tool for evaluating various software and
hardware configurations. The range of available, onboard, hardware interfaces allow multiple
system implementation options as well as multiple options for potential future development. The
wide array of hardware options also allows numerous configurations for system control as well
as testing diverse data software algorithms on sensor, image, or range data. Essentially these
options could provide the tools to build a template for database generation, by simply adding
user-defined, database-specific generation definitions. The IMR configuration, as tested, is
pictured in the Figure below.
39
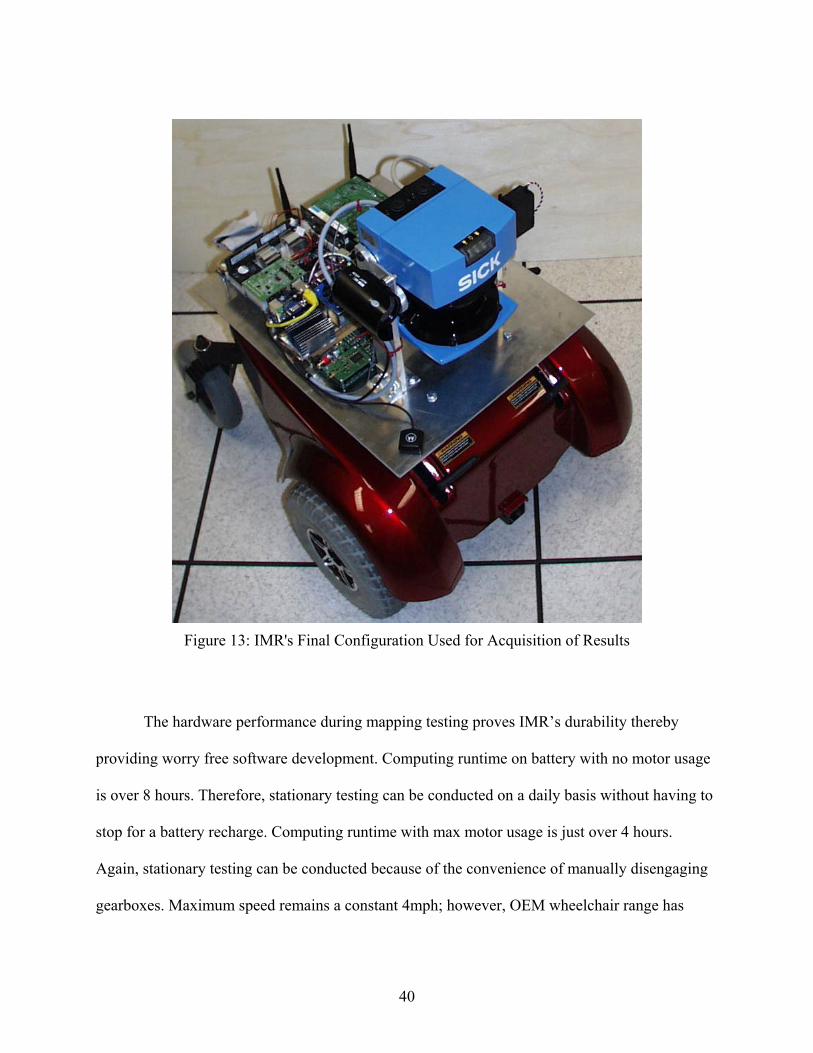
Figure 13: IMR's Final Configuration Used for Acquisition of Results
The hardware performance during mapping testing proves IMR’s durability thereby
providing worry free software development. Computing runtime on battery with no motor usage
is over 8 hours. Therefore, stationary testing can be conducted on a daily basis without having to
stop for a battery recharge. Computing runtime with max motor usage is just over 4 hours.
Again, stationary testing can be conducted because of the convenience of manually disengaging
gearboxes. Maximum speed remains a constant 4mph; however, OEM wheelchair range has
40

fallen from 25 miles to 16 miles due to the current draw of the computing electronics onboard.
Final total assembly weight as tested is 158 lbs.
Range from control station to IMR is exceptional. With indoor LOS wireless, a
connection is maintained at a distance of at least 275 feet. With no LOS a connection is
maintained through multiple concrete walls at a distance of 85 feet. These ranges are measured
using OEM Linksys antennas at OEM transmit power. At 300% OEM transmit power, range
increases to 350 feet and 110 feet respectively. Although transmit power is capable of reaching
900% OEM maximum, the Linksys generates heat at dangerous levels while overlapping and
overpowering neighboring wireless channels, and therefore no tests were conducted at this level.
Cost of the robot falls at just under $11K. The closest comparable mapping system
commercially available for purchase is the Leica HDS-3000. Cost for this system is a staggering
$130K [19]. Even at this enormous cost, the IMR mapping system still has a better vertical field
of view! Even compared to most other research mapping systems, where cost data is provided,
the IMR system remains the least expensive. In the table below is an itemized total budget
required to duplicate this robot. The most obvious cost is the SICK laser which takes up
approximately 50% of the project cost.
41
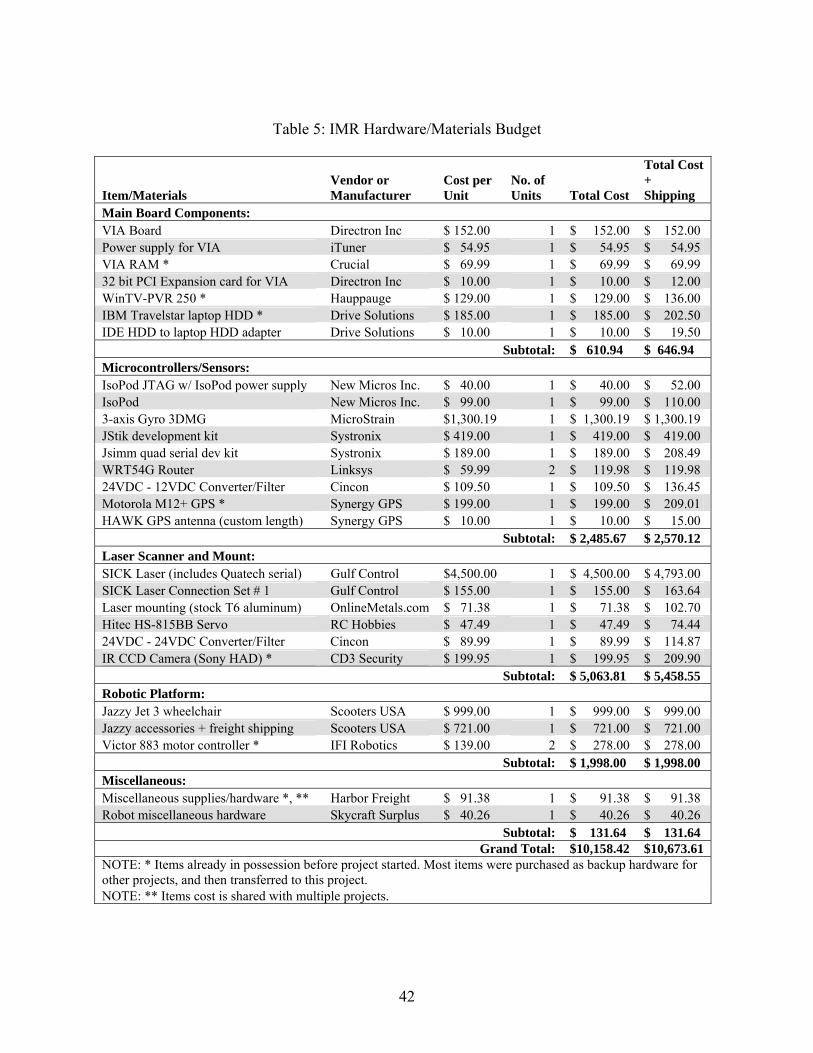
Table 5: IMR Hardware/Materials Budget
Item/Materials Vendor or Manufacturer
Cost per Unit
No. of Units Total Cost
Total Cost + Shipping
Main Board Components: VIA Board Directron Inc $ 152.00 1 $ 152.00 $ 152.00 Power supply for VIA iTuner $ 54.95 1 $ 54.95 $ 54.95 VIA RAM * Crucial $ 69.99 1 $ 69.99 $ 69.99 32 bit PCI Expansion card for VIA Directron Inc $ 10.00 1 $ 10.00 $ 12.00 WinTV-PVR 250 * Hauppauge $ 129.00 1 $ 129.00 $ 136.00 IBM Travelstar laptop HDD * Drive Solutions $ 185.00 1 $ 185.00 $ 202.50 IDE HDD to laptop HDD adapter Drive Solutions $ 10.00 1 $ 10.00 $ 19.50 Subtotal: $ 610.94 $ 646.94 Microcontrollers/Sensors: IsoPod JTAG w/ IsoPod power supply New Micros Inc. $ 40.00 1 $ 40.00 $ 52.00 IsoPod New Micros Inc. $ 99.00 1 $ 99.00 $ 110.00 3-axis Gyro 3DMG MicroStrain $1,300.19 1 $ 1,300.19 $ 1,300.19 JStik development kit Systronix $ 419.00 1 $ 419.00 $ 419.00 Jsimm quad serial dev kit Systronix $ 189.00 1 $ 189.00 $ 208.49 WRT54G Router Linksys $ 59.99 2 $ 119.98 $ 119.98 24VDC - 12VDC Converter/Filter Cincon $ 109.50 1 $ 109.50 $ 136.45 Motorola M12+ GPS * Synergy GPS $ 199.00 1 $ 199.00 $ 209.01 HAWK GPS antenna (custom length) Synergy GPS $ 10.00 1 $ 10.00 $ 15.00 Subtotal: $ 2,485.67 $ 2,570.12 Laser Scanner and Mount: SICK Laser (includes Quatech serial) Gulf Control $4,500.00 1 $ 4,500.00 $ 4,793.00 SICK Laser Connection Set # 1 Gulf Control $ 155.00 1 $ 155.00 $ 163.64 Laser mounting (stock T6 aluminum) OnlineMetals.com $ 71.38 1 $ 71.38 $ 102.70 Hitec HS-815BB Servo RC Hobbies $ 47.49 1 $ 47.49 $ 74.44 24VDC - 24VDC Converter/Filter Cincon $ 89.99 1 $ 89.99 $ 114.87 IR CCD Camera (Sony HAD) * CD3 Security $ 199.95 1 $ 199.95 $ 209.90 Subtotal: $ 5,063.81 $ 5,458.55 Robotic Platform: Jazzy Jet 3 wheelchair Scooters USA $ 999.00 1 $ 999.00 $ 999.00 Jazzy accessories + freight shipping Scooters USA $ 721.00 1 $ 721.00 $ 721.00 Victor 883 motor controller * IFI Robotics $ 139.00 2 $ 278.00 $ 278.00 Subtotal: $ 1,998.00 $ 1,998.00 Miscellaneous: Miscellaneous supplies/hardware *, ** Harbor Freight $ 91.38 1 $ 91.38 $ 91.38 Robot miscellaneous hardware Skycraft Surplus $ 40.26 1 $ 40.26 $ 40.26 Subtotal: $ 131.64 $ 131.64 Grand Total: $10,158.42 $10,673.61 NOTE: * Items already in possession before project started. Most items were purchased as backup hardware for other projects, and then transferred to this project. NOTE: ** Items cost is shared with multiple projects.
42
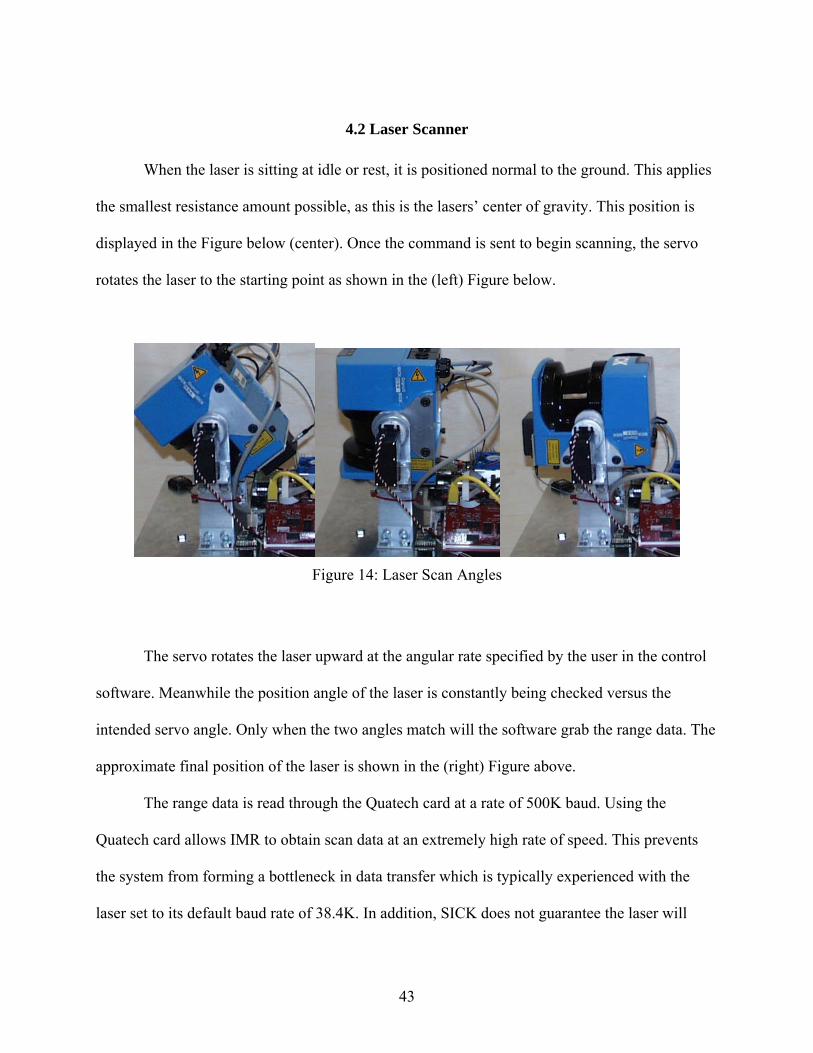
4.2 Laser Scanner
When the laser is sitting at idle or rest, it is positioned normal to the ground. This applies
the smallest resistance amount possible, as this is the lasers’ center of gravity. This position is
displayed in the Figure below (center). Once the command is sent to begin scanning, the servo
rotates the laser to the starting point as shown in the (left) Figure below.
Figure 14: Laser Scan Angles
The servo rotates the laser upward at the angular rate specified by the user in the control
software. Meanwhile the position angle of the laser is constantly being checked versus the
intended servo angle. Only when the two angles match will the software grab the range data. The
approximate final position of the laser is shown in the (right) Figure above.
The range data is read through the Quatech card at a rate of 500K baud. Using the
Quatech card allows IMR to obtain scan data at an extremely high rate of speed. This prevents
the system from forming a bottleneck in data transfer which is typically experienced with the
laser set to its default baud rate of 38.4K. In addition, SICK does not guarantee the laser will
43
output all range data values at speeds less than 500K [18]. The slower the baud rate the more
data is dropped. For purposes of this thesis, this is unacceptable.
The amount of data transferred during each scan differs per resolution selected by the
user. For example, a maximum resolution scan is defined by the following configuration. The
laser uses a field of vision of 180° and an angular resolution of 0.25°. This means the laser
ranges 4 equal divisions every degree, starting at 0°, 180 times, which equals 720 points. Or you
can divide 180 into 0.25 which equals 720 points. Do not forget that the laser also ranges at
degree 180° bringing the total number of points to 721. Thus the laser outputs a total of 721
range points in one scan. Each point consists of one integer value which is represented by 2
bytes. Therefore multiplying 721 scans by 2 bytes produces 1,442 bytes. The servo when
configured for maximum resolution uses a range of motion of 140° and an angular resolution of
0.5°. Dividing 140 into 0.5, and not forgetting to add the extra scan at 140° equals 281 individual
laser scans. Finally by multiplying the 281 scans times the 721 range points per scan generates
202,601 range points per one system mapping. These integer range values when multiplied by 2
bytes per integer equal 405,202 bytes of data per one system mapping. The table below shows all
the possible different combinations of resolutions capable by the scanning system, including the
amount of data bytes each combination generates.
44
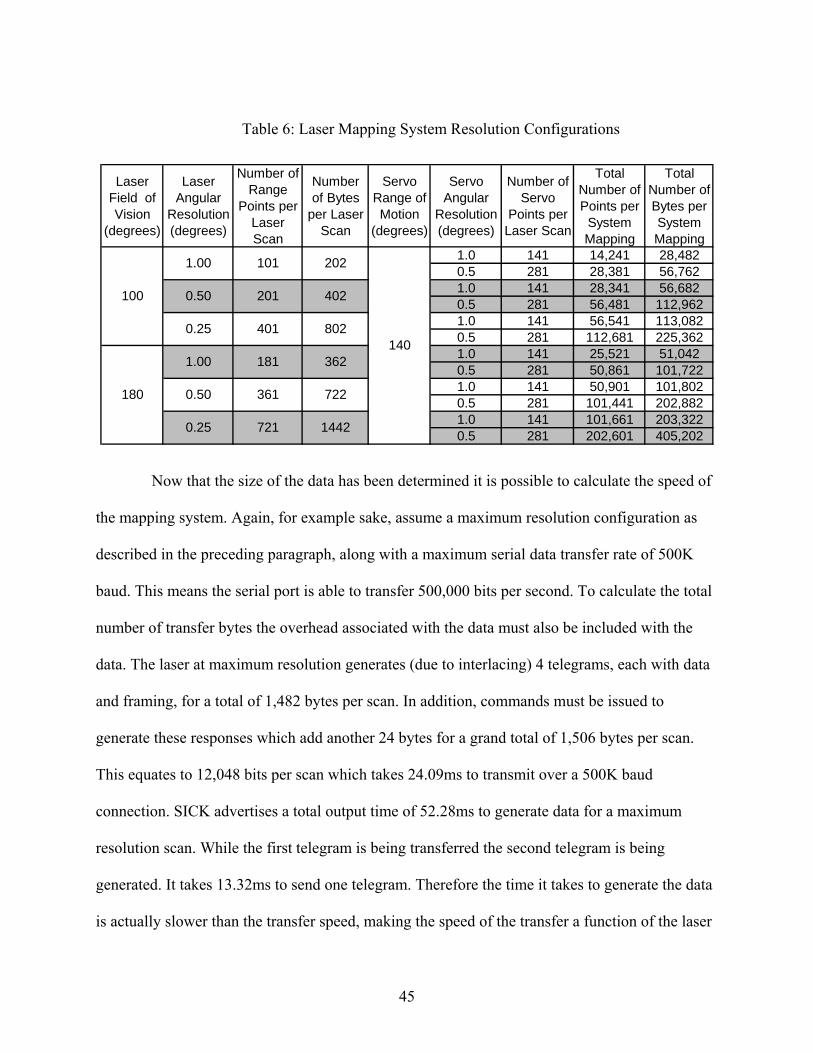
Table 6: Laser Mapping System Resolution Configurations
Laser Field of Vision
(degrees)
Laser Angular
Resolution (degrees)
Number of Range
Points per Laser Scan
Number of Bytes
per Laser Scan
Servo Range of Motion
(degrees)
Servo Angular
Resolution (degrees)
Number of Servo
Points per Laser Scan
Total Number of Points per
System Mapping
Total Number of Bytes per System Mapping
1.0 141 14,241 28,4820.5 281 28,381 56,7621.0 141 28,341 56,6820.5 281 56,481 112,9621.0 141 56,541 113,0820.5 281 112,681 225,3621.0 141 25,521 51,0420.5 281 50,861 101,7221.0 141 50,901 101,8020.5 281 101,441 202,8821.0 141 101,661 203,3220.5 281 202,601 405,202
100
180
362
8020.25 401
7223610.50
1.00 181140
1.00 101 202
0.50 201 402
0.25 721 1442
Now that the size of the data has been determined it is possible to calculate the speed of
the mapping system. Again, for example sake, assume a maximum resolution configuration as
described in the preceding paragraph, along with a maximum serial data transfer rate of 500K
baud. This means the serial port is able to transfer 500,000 bits per second. To calculate the total
number of transfer bytes the overhead associated with the data must also be included with the
data. The laser at maximum resolution generates (due to interlacing) 4 telegrams, each with data
and framing, for a total of 1,482 bytes per scan. In addition, commands must be issued to
generate these responses which add another 24 bytes for a grand total of 1,506 bytes per scan.
This equates to 12,048 bits per scan which takes 24.09ms to transmit over a 500K baud
connection. SICK advertises a total output time of 52.28ms to generate data for a maximum
resolution scan. While the first telegram is being transferred the second telegram is being
generated. It takes 13.32ms to send one telegram. Therefore the time it takes to generate the data
is actually slower than the transfer speed, making the speed of the transfer a function of the laser
45

data generation time, making the laser the bottleneck! Technically, assuming little to no
overhead in the IMR computer, the total transmit time, which includes data generation time, of
52.28ms times the number of scans, 281, equals 14.69 seconds (+ 6 ms for the original data
request telegram).
The IMR scanning system also has processing overhead. When set at full scanning
resolution, the related communication and processing to control servo and the time to physically
rotate the servo equals approximately +10ms per laser scan. There is also minimal software
latency from communication with the 3DM-G to verify servo angle which equals approximately
+4ms per laser scan. This total of 14ms when multiplied by the maximum number of servo
points, 281, equals 4 seconds. Therefore, the total time to perform a full resolution system scan is
data generation time, 14.69 seconds plus scanning overhead of 4 seconds equals approximately
18.69 seconds. This time is the absolute minimum, as periodically laser range data CRC checks
may fail, causing laser data retransmissions. This increases system mapping scan time at a
random and unpredictable rate. The Table below lists the different scan times required by each
different resolution configuration.
46
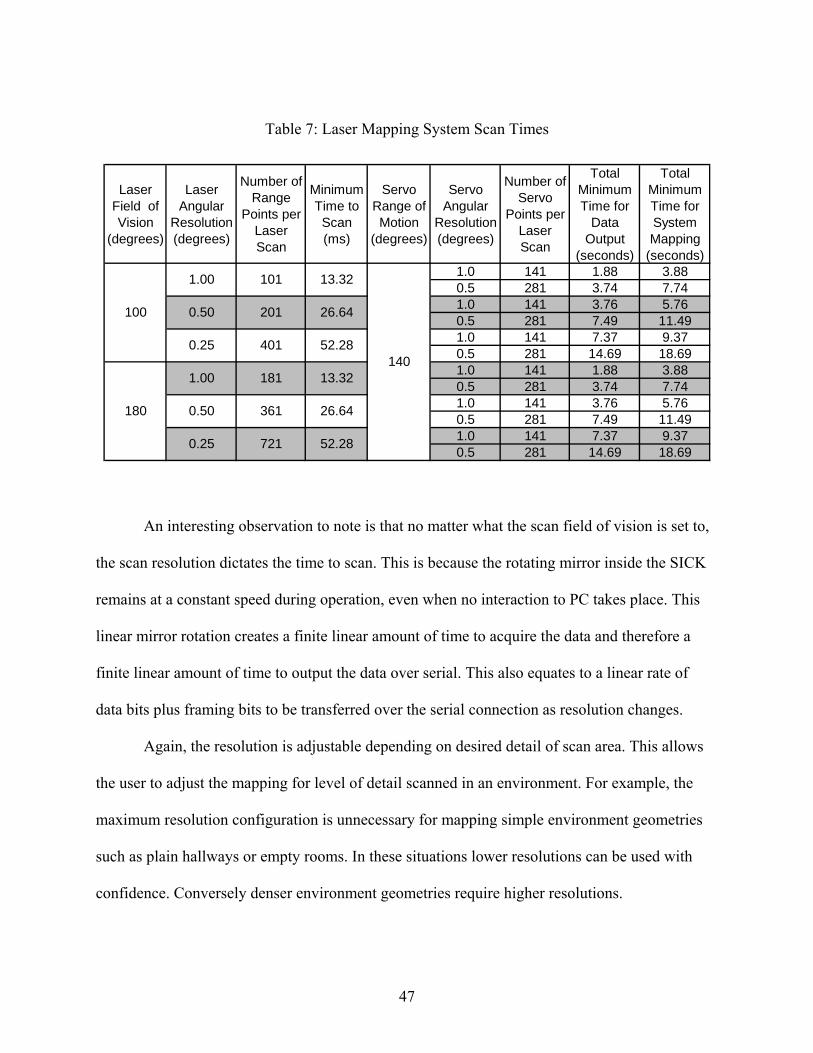
Table 7: Laser Mapping System Scan Times
Laser Field of Vision
(degrees)
Laser Angular
Resolution (degrees)
Number of Range
Points per Laser Scan
Minimum Time to Scan (ms)
Servo Range of Motion
(degrees)
Servo Angular
Resolution (degrees)
Number of Servo
Points per Laser Scan
Total Minimum Time for
Data Output
(seconds)
Total Minimum Time for System Mapping
(seconds)1.0 141 1.88 3.880.5 281 3.74 7.741.0 141 3.76 5.760.5 281 7.49 11.491.0 141 7.37 9.370.5 281 14.69 18.691.0 141 1.88 3.880.5 281 3.74 7.741.0 141 3.76 5.760.5 281 7.49 11.491.0 141 7.37 9.370.5 281 14.69 18.69
1.00
721
100
180
13.32
52.280.25 401
26.643610.50
52.28
181140
1.00 101 13.32
0.50 201 26.64
0.25
An interesting observation to note is that no matter what the scan field of vision is set to,
the scan resolution dictates the time to scan. This is because the rotating mirror inside the SICK
remains at a constant speed during operation, even when no interaction to PC takes place. This
linear mirror rotation creates a finite linear amount of time to acquire the data and therefore a
finite linear amount of time to output the data over serial. This also equates to a linear rate of
data bits plus framing bits to be transferred over the serial connection as resolution changes.
Again, the resolution is adjustable depending on desired detail of scan area. This allows
the user to adjust the mapping for level of detail scanned in an environment. For example, the
maximum resolution configuration is unnecessary for mapping simple environment geometries
such as plain hallways or empty rooms. In these situations lower resolutions can be used with
confidence. Conversely denser environment geometries require higher resolutions.
47
4.3 Image and Range Data Manipulation
In order to effectively map the robots environment into a useable database, images must
be captured in addition to the laser range data. As previously mentioned in Chapter 3.4
Calibration, image data must be captured and mapped to a specific area corresponding to the
range data. Using the measured values above for camera horizontal and vertical fields of view
the area over the range data is calculated. The laser field of view is much higher than the camera.
Therefore to properly map the image data multiple image captures must be performed. By
dividing the total laser field of view of 180° horizontal and 140° vertical by the camera field of
view 78° horizontal and 59° vertical the following solution is developed. To evenly map all
image data in the vertical axis image captures must take place at servo angles θ equaling 28°,
84°, and 140°. This will allow for sufficient overlap at the predefined angles. To evenly map all
image data in the horizontal axis image captures must take place at laser angles φ equaling 45°
and 135°. A small portion of the points will not be mapped towards the outer horizontal edges.
However the system assumes that multiple scans will take place later in which the corresponding
image data would be recorded.
After the images have been captured image manipulations begins. IMR uses the widely
available, opensource software libraries, known as VXL. These libraries allow MPEG2 frame
extraction for image creation, image rotation, image edge detection, and image ‘fisheye’ lens
distortion correction. An example of the type of manipulation VXL is able to perform has been
taken from the first scenario and shown in the Figure below.
48
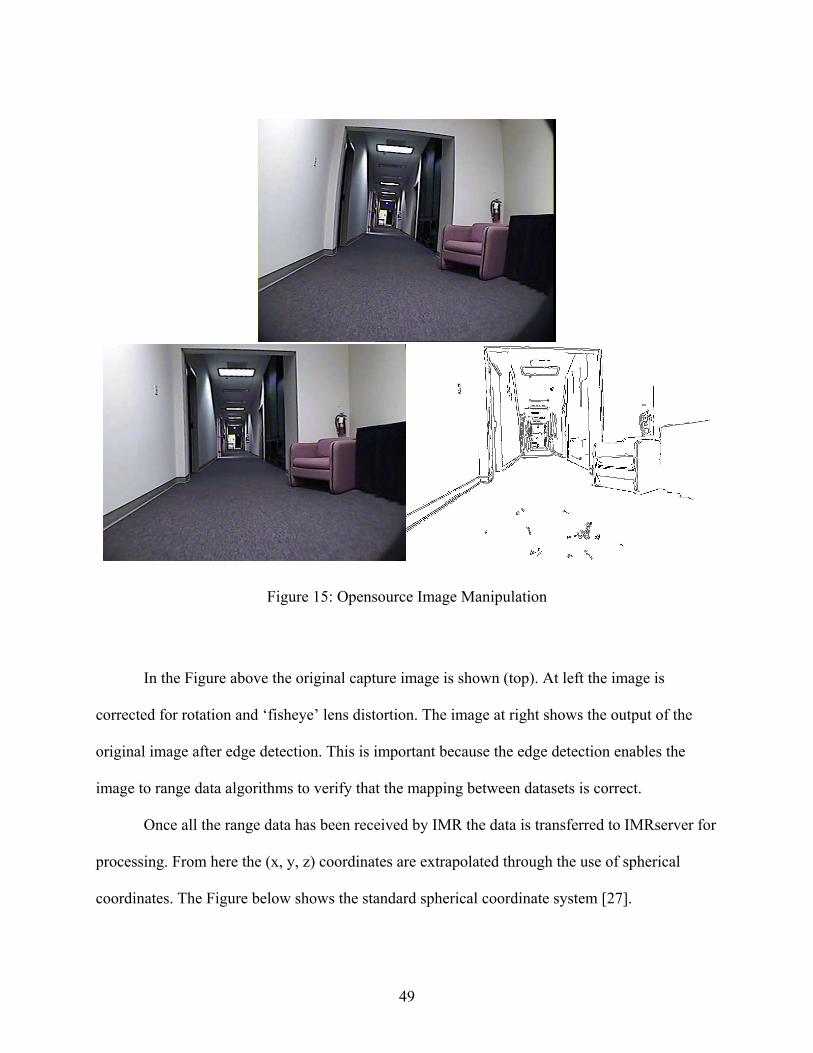
Figure 15: Opensource Image Manipulation
In the Figure above the original capture image is shown (top). At left the image is
corrected for rotation and ‘fisheye’ lens distortion. The image at right shows the output of the
original image after edge detection. This is important because the edge detection enables the
image to range data algorithms to verify that the mapping between datasets is correct.
Once all the range data has been received by IMR the data is transferred to IMRserver for
processing. From here the (x, y, z) coordinates are extrapolated through the use of spherical
coordinates. The Figure below shows the standard spherical coordinate system [27].
49

z
Figure 16: Standard Spherical Coordinate System
The next Figure shows the standard spherical coordinate system as it applies to the IMR mapping
system and conversion software.
x
y θ
r
φ
50

z
θ
Figure 17: Standard Spherical Coordinate System Applied to IMR
In both Figures the range data is converted into the following spherical coordinate system:
x = r sin(φ) cos(θ) (1)
y = r cos(φ) (2)
z = r sin(θ) sin(φ) (3)
where r equals range data, φ equals laser mirror angle, and θ equals servo laser angle. The data
file that contains the laser range values does not explicitly list any angle values for servo or laser
mirror. This reduces the overall size of the data file, thereby eliminating unnecessary overhead
y
x
φ
r
51

and bandwidth. Instead, the range distances are organized in order of angle and written to the file
in that order. The first line in the data file corresponds to the first laser scan at servo angle 0°. On
the first line lists the range data by mirror angle starting from 180° and decreasing to 0°. It starts
at 180° because the laser reads counterclockwise. The resulting equation is:
Line φ = rθ, rθ - v, rθ – 2v, …, rθ – nv (4)
where v represents one of the resolution values, 1.0, 0.5, or 0.25 and where n equals the
number of range values. The second line would correspond to the second laser scan at the next
incremental servo angle which equals the resolution value selected, and so on. Thus the positions
of the lines and values in the lines determine the angles needed to create (x, y, z) points.
To provide a simple representation of the converted points a simple database generation
conversion program is written in C. The program outputs a very basic text file format called a
VECT file. The VECT file format is written specifically for the GPL software called Geomview.
Geomview is a simple 3D viewing program for displaying various formatted geometries in Unix.
In this case the VECT file is used to visualize the points from the mapping systems into a point
cloud.
The first point cloud representation is shown for the first scenario in the Figure below.
52
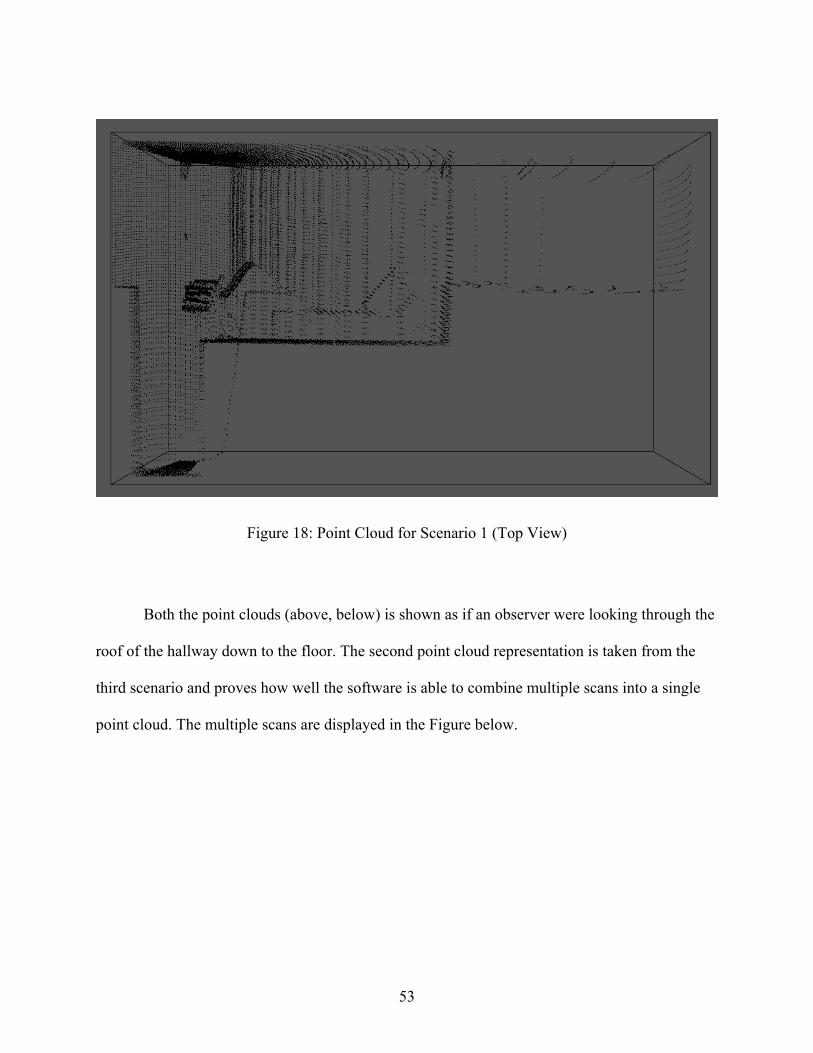
Figure 18: Point Cloud for Scenario 1 (Top View)
Both the point clouds (above, below) is shown as if an observer were looking through the
roof of the hallway down to the floor. The second point cloud representation is taken from the
third scenario and proves how well the software is able to combine multiple scans into a single
point cloud. The multiple scans are displayed in the Figure below.
53
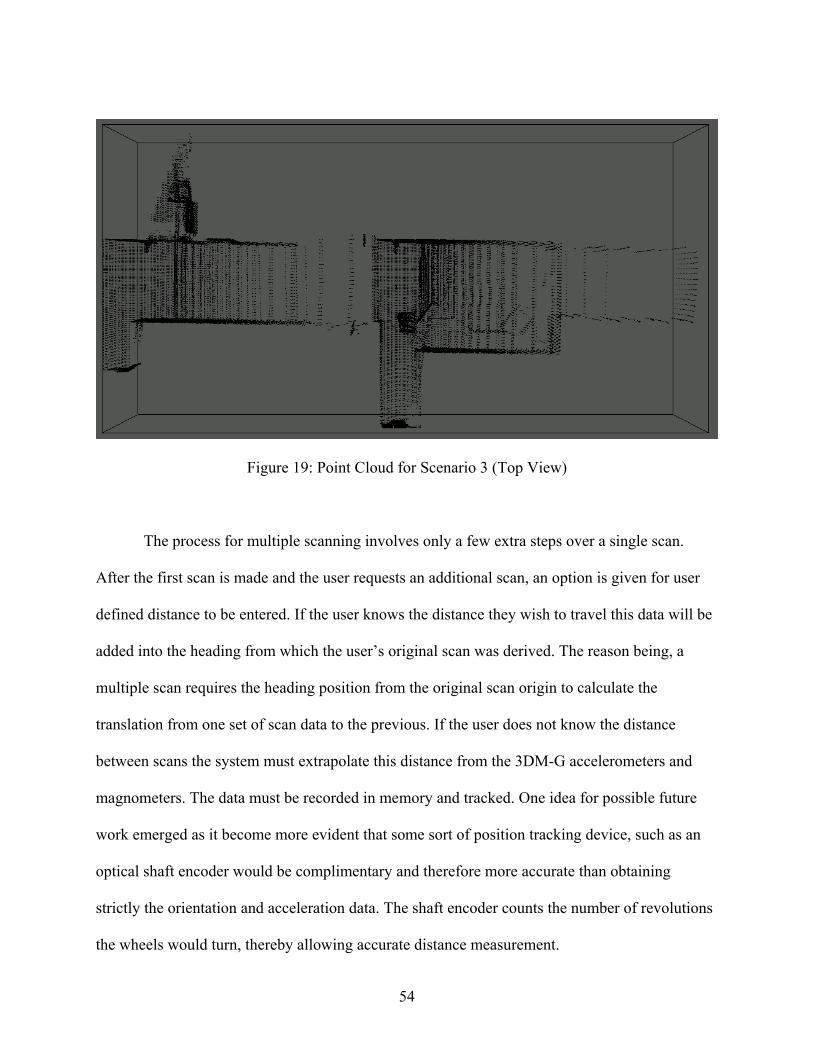
Figure 19: Point Cloud for Scenario 3 (Top View)
The process for multiple scanning involves only a few extra steps over a single scan.
After the first scan is made and the user requests an additional scan, an option is given for user
defined distance to be entered. If the user knows the distance they wish to travel this data will be
added into the heading from which the user’s original scan was derived. The reason being, a
multiple scan requires the heading position from the original scan origin to calculate the
translation from one set of scan data to the previous. If the user does not know the distance
between scans the system must extrapolate this distance from the 3DM-G accelerometers and
magnometers. The data must be recorded in memory and tracked. One idea for possible future
work emerged as it become more evident that some sort of position tracking device, such as an
optical shaft encoder would be complimentary and therefore more accurate than obtaining
strictly the orientation and acceleration data. The shaft encoder counts the number of revolutions
the wheels would turn, thereby allowing accurate distance measurement.
54

Another requirement of multiple scans is the laser resolution setting. As previously stated
in Chapter 3 the lasers internal resolution mode can be set to cm or mm. This has an effect on the
overall length of the distance measured. In mm mode the maximum range of the laser is 8.187
meters and in cm mode the maximum range is 81.87 meters. The decision was made to keep the
laser in default mm mode because of the intended use of the systems which is indoors. If the user
selects a distance of over 8.187 meters the laser will return a barrier of points that will resemble a
wall within the point cloud. This is unacceptable data and must be checked by the software. If
the user does input a distance of greater than or equal to 8.187 meters, the option is given to
reenter the data or reluctantly switch to cm mode.
55

CHAPTER 5: CONCLUSION
This thesis has presented certain problems and challenges to which robotic laser scanner
mapping systems are able to address. It has also successfully surveyed some existing robotic
mapping systems produced by other researchers in the field and how effective these systems are
at mapping.
This thesis has given the design and implementation of a comparatively inexpensive
mobile robotic computing platform for three-dimensional mapping. The design is thorough
enough that it provides adequate detail to allow for replication of the entire robot and laser
scanner systems. In addition it has also shown that with the proper application of tools a mobile
robotic system with modified two-dimensional laser scanner is capable of mapping indoor
environments with high resolution. In cases which take into account scanner system size, weight,
speed, and cost the rotational two-dimensional laser scanner is able to map at resolutions equal
to, and sometimes better than, that of certain types of 3D laser scanners.
This thesis has also shown an effective and efficient robot control system incorporating
multiple microcontrollers for managing robot movement and laser scanner control. All software
is created under the guidelines of widely accepted software engineering principles with all the
appropriate generated metrics and documentation provided. The wide range of hardware
available on the robot makes for a more than adequate testbed for evaluating different software
algorithms and implementations.
56

5.1 Further Research
There are quite a number of potential topics available as possible future research work
involving the IMR and laser scanner. There exists separate opportunities for the robot and laser
scanner individually but also the system as a whole.
Examining opportunities with just the robot itself, the first and foremost application
would be autonomous control of IMR. Current research in this area involves applying
experimental control methods or creating robots that “learn” which we intuitively know is
connected with artificial intelligence. Related topics such as navigation in known or unknown
terrain, search algorithms, and/or best path-to-travel are all potential topics. Localization would
also be an interesting topic to study because of the available sensors already onboard the robot.
Another possible area could be experimenting with multiple robots. What would be the
outcome of having multiple mapping robots perform database generation? How complex would
the system be? Is such a system feasible? Related with this topic are the intercommunication
software techniques between robots. How could mobile ad-hoc networking benefit such a
system, and how secure could it be?
Still another possible area could be mobile monitoring of robots with handhelds devices
or pocket PC’s such as an iPAQ. Other possible applications such as integration or substitution
of a central control station into the handheld as a remote controller interface.
Examining just the possibilities with the laser scanner, possible work could include
refining LADAR scan data to include multilayer extraction and classification in the central
57

control station. Some methods of research in this field examine ways to divide or classify scan
data into separate stages or layer layouts to more efficiently represent data later on.
There are plenty of other possibilities for evaluating scan data such as applying existing
software algorithms and even creating new ones. There are many methods for manipulating scan
data, and yet still many more undiscovered.
Another possible area could include adjusting the height of the laser scanner to
experiment for higher accuracy. There are few studies that take into account the height of the
mapping system from the ground. However, what are the probabilities that a target or
environment can be mapped more accurately as the height increases or decreases. Perhaps
modifying the current laser mount to include a rack and pinion system would allow such studies
to be conducted.
Finally examining the system as a whole, possible future work could include expanding
to outdoor terrain and/or utilization of SONAR sensors for navigation. With the available space
on the robotic platform and existing computing power more sensors could be added to enhance
terrain traversal. Another idea could be to try and process the mapping data onboard the robot,
and/or trying to minimize the electronics required.
Another interesting topic of research involves using Mote sensors. These sensors can be
used for monitoring previously explored environments for intruder detection or for expanding
communication over wireless wide area networks.
Applicable to all aforementioned topics could be concurrently analyzing the application
of various existing software engineering techniques to all systems. Or possibly concurrently
examining and critiquing software engineering management tools and techniques. Another topic
58

of work could be exploring new hybrid software engineering processes for improving the
software of autonomous robotic mapping systems.
Potential future work could also include the implementation of well formed database
creation software which uses predetermined rules defined by database formats such as SEDRIS,
OpenSceneGraph, or OpenFlight to construct an accurate geo-specific visual database.
In conclusion, the IMR platform, with its computing power, 3D laser scanner, and room
for expansion, provides an excellent robot testbed for experiments. It offers a superior starting
point for a number of potential research topics for years to come.
59

APPENDIX A SOFTWARE METRICS
60
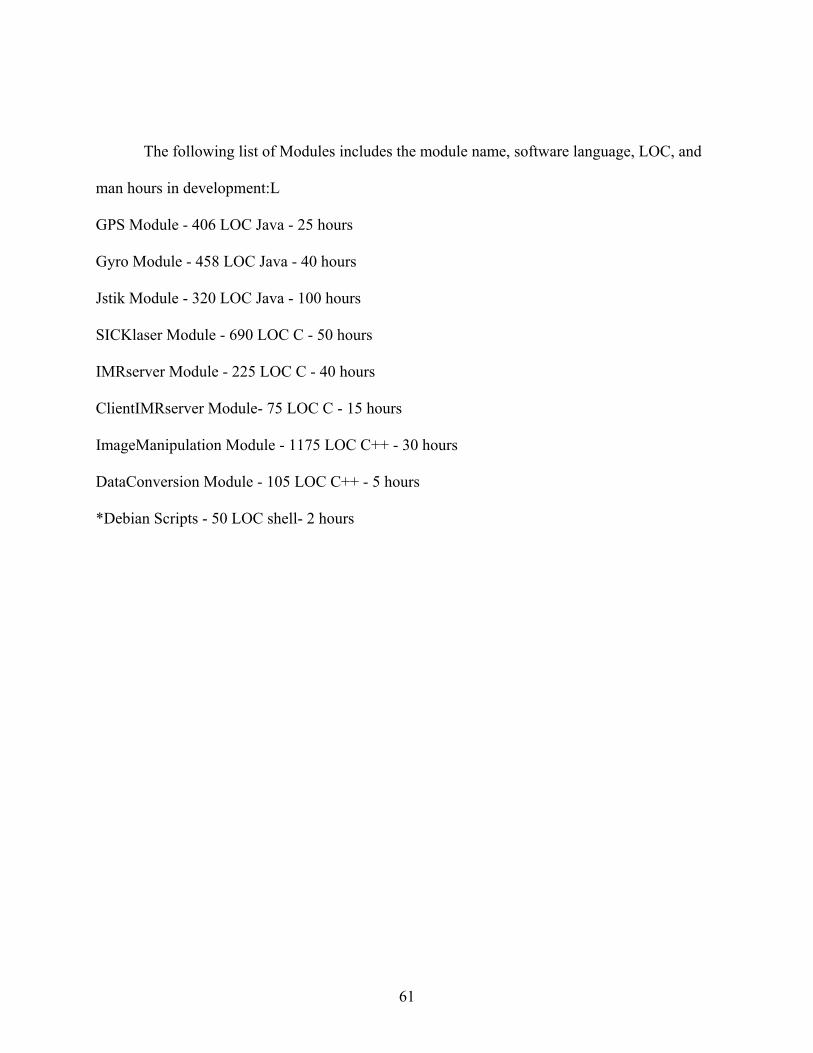
The following list of Modules includes the module name, software language, LOC, and
man hours in development:L
GPS Module - 406 LOC Java - 25 hours
Gyro Module - 458 LOC Java - 40 hours
Jstik Module - 320 LOC Java - 100 hours
SICKlaser Module - 690 LOC C - 50 hours
IMRserver Module - 225 LOC C - 40 hours
ClientIMRserver Module- 75 LOC C - 15 hours
ImageManipulation Module - 1175 LOC C++ - 30 hours
DataConversion Module - 105 LOC C++ - 5 hours
*Debian Scripts - 50 LOC shell- 2 hours
61

LIST OF REFERENCES
[1] H. Surmann, K. Lingemann, A. Nüchter, and J. Hertzberg, “Fast acquiring and analysis
of three dimensional laser range data,” in Proceedings of the 6th International Fall Workshop Vision, Modelling, and Visualization,” 2001, pp. 59-66.
[2] D. Langer, M. Mettenleiter, F. Haertl, and C. Froehlich, “Imaging laser scanner for 3-D
modeling and surveying applications,” in Proceedings IEEE International Conference on Robotics and Automation, 2000, pp. 116-121.
[3] S.P. Fekete, R. Klein, and A. Nuchter, “Searching with an autonomous robot,” in ACM
Symposium on Computational Geometry, 2004. [4] D. Ferguson, A.C. Morris, D. Haehnel, C. Baker, Z. Omohundro, C. Reverte, S. Thayer,
W.L. Whittaker, C. Whittaker, W. Burgard, and S. Thrun, "An autonomous robotic system for mapping abandoned mines," Advances in Neural Information Processing Systems (NIPS 03), 2003.
[5] C. Bergh, B. Kennedy, L. Matthies, and A. Johnson, “A compact, low power two-axis
scanning laser rangefinder for mobile robots,” in The 7th Mechatronics Forum International Conference, 2002.
[6] T. Carrig, and P. Gatt, “Laser Remote Sensing” to be published in Conference on Lasers
and Electro-Optics / Qauntum Electronics and Laser Science Conference, Baltimore, MD 2005.
[7] L. Zalud, L. Kopecny, and T. Neuzil, “Laser proximity scanner correlation based method
for cooperative localization and map building,” in AMC'02 7th International Workshop on Advanced Motion Control, 2002, pp. 484-487.
[8] S. F. El-Hakim, P. Boulanger, F. Blais, and J. Beraldin, “System for indoor 3D mapping
and virtual environments,” National Research Council Canada, pp. 3174-4003. [9] A. Nüchter, H. Surmann, and J. Hertzberg. “Automatic model refinement for 3D
reconstruction with mobile robots,” in Proceedings of the 4th IEEE International Conference on Recent Advances in 3D Digital Imaging and Modeling, 2003, pp. 394 – 401.
62
[10] H. Surmann, K. Lingemann, A. Nüchter, and J. Hertzberg, “A 3D laser range finder for autonomous mobile robots,” in Proceedings of the 32nd International Symposium on Robotics, 2001, pp. 153-158.
[11] A. Nüchter, H. Surmann, K. Lingemann, and J. Hertzberg, “Consistent 3D model
construction with autonomous mobile robots,” KI 2003: Advances in Artificial Intelligence. 26th Annual German Conference on AI, Proceedings Springer LNAI, vol. 2821, pp. 550-564, September 2003.
[12] C. Ye, and J. Borenstein, “Characterization of a 2-D laser scanner for mobile robot
obstacle negotiation,” in Proceedings of the 2002 IEEE International Conference on Robotics and Automation, 2002, pp. 2512-2518.
[13] E. Triendl, and D.J. Kriegman, “Stereo Vision and Navigation within Buildings,” in IEEE
Internation Conference on Robotics and Automation, 1987, pp. 1725-1730.
[14] E.Garcia, H.Lamela, and J.R. Lopez, “A 3-D vision system for autonomous robot applications based on a low power semiconductor laser rangefinder,” in IEEE IECON 1998 Annual Meeting, 1998, pp. 1338-1341.
[15] V. Sequeira, J.G.M. Goncalves, and M.I. Ribeiro, “3D reconstruction of indoor
environments,” in IEEE International Conference on Image Processing: Special Session on Range Image Analysis, 1996, pp. 405-408.
[16] G. Oriolo, G. Ulivi, and M. Vendittelli, "Real-time map building and navigation for
autonomous robots in unknown environments," IEEE Transactions on Systems, Man, and Cybernetics. Part B: Cybernetics, vol. 28, no. 3, pp. 316-333, June 1998.
[17] K.O. Arras and N. Tomatis, “Improving robustness and precision in mobile robot
localization by using laser range finding and monocular vision.” in Proceedings of the Third European Workshop on Advanced Mobile Robots, 1999.
[18] SICK, Inc.; http://www.sickusa.com. [19] Leica Geosystems Inc.; http://www.leica-geosystems.com. [20] H. Saito, S. Baba, and T. Kanade, “Appearance-based virtual view generation from
multicamera videos captured in the 3-D room,” IEEE Trans. on Multimedia, vol. 5, no. 3, pp. 303-316, September 2003.
[21] A. Nüchter, H. Surmann, K. Lingemann, J. Hertzberg, and S. Thrun, “6D SLAM –
preliminary report on closing the loop in six dimensions,” in Proceedings of the 5th IFAC Symposium on Intelligent Autonomous Vehicles, 2004, pp. 1998-2003.
63

[22] A. Scott, L. E. Parker, and C. Touzet, “Quantitative and qualitative comparison of three
laser-range mapping algorithms using two types of laser scanner data,” Proceedings of Systems, Man, and Cybernetics Conference, 2000, pp 1422-1427.
[23] S. Frintrop, A. Nuchter, and H. Surmann, “Visual attention for object recognition in
spatial 3D data,” Workshop on Attention and Performance in Computational Vision. [24] Sveasoft, Inc.; http://www.sveasoft.com. [25] W. Humphrey, “Pathways to Process Maturity: The Personal Software Process and Team
Software Process”, June 1999; http://www.sei.cmu.edu/news-at-sei/features/1999/jun/Background.jun99.pdf
[26] Hitec RCD USA, Inc.; http://www.hitecrcd.com. [27] Eric W. Weisstein, “Spherical Coordinates";
http://mathworld.wolfram.com/SphericalCoordinates.html.
64


![arXiv:1806.10293v3 [cs.LG] 28 Nov 2018 · 2 Related Work Reinforcement learning has been applied in the context of robotic control using both low-dimensional [1,2] and high-dimensional](https://img.pdfslide.us/doc/110x75/5ed3489d91d6e046101ed69e/arxiv180610293v3-cslg-28-nov-2018-2-related-work-reinforcement-learning-has.jpg)