Embed Size (px)
Citation preview
A MOBILE APPLICATION FOR DATA WAREHOUSE COURSEWARE
A Project
Presented to the faculty of the Department of Computer Science
California State University, Sacramento
Submitted in partial satisfaction of
the requirements for the degree of
MASTER OF SCIENCE
in
Computer Science
by
Hetalben Laljibhai Savaliya
SPRING
2015

ii
© 2015
Hetalben Laljibhai Savaliya
ALL RIGHTS RESERVED
iii
A MOBILE APPLICATION FOR DATA WAREHOUSE COURSEWARE
A Project
by
Hetalben Laljibhai Savaliya
Approved by:
__________________________________, Committee Chair
Dr. Meiliu Lu
__________________________________, Second Reader
Dr. Du Zhang
____________________________
Date
iv
Student: Hetalben Laljibhai Savaliya
I certify that this student has met the requirements for format contained in the University
format manual, and that this project is suitable for shelving in the Library and credit is to
be awarded for the project.
__________________________, Graduate Coordinator ___________________
Dr. Jinsong Ouyang Date
Department of Computer Science
v
Abstract
of
A MOBILE APPLICATION FOR DATA WAREHOUSE COURSEWARE
by
Hetalben Laljibhai Savaliya
Data warehouse is the concept of data extracting from resources and made available
for ad-hoc queries and report generation to enable business intelligent activities. Data
warehouse is one of the most important parts of data mining.
The objective of this project is to provide an on-hand information to the beginning
data warehouse designer to reinforce the key concept of data warehouse. Additionally
this mobile application for data warehouse courseware will be a platform for students to
find other related and useful information.
A mobile application for data warehouse also includes case study and quiz for better
understanding of the data warehouse concept. Case study for finding restaurants is
perfectly explained with interactive designs for each approaches of data warehouse. We
use Yelp API for restaurant search data. Along with learning materials, this application
does not required Internet connection for learning data warehouse. Only the case study
requires the Internet connection.
In this courseware, we build the data warehouse systematically using four different
demonstrations, which covers the topics of fundamentals, design principle of data mart
vi
prototype and data mart refinement, building an enterprise data warehouse using an
incremental approach and aggregation. Each demonstration contains case study and quiz
for generating result for the end users upon their request. The courseware is designed to
be a supplementary part of CSC177: Data Warehousing and Data Mining at CSU
Sacramento.
_______________________, Committee Chair
Dr. Meiliu Lu
_______________________
Date
vii
ACKNOWLEDGEMENTS
I do take the opportunity to acknowledge and honor the contribution of my project
advisor, Dr. Meiliu Lu for her support and guidance throughout the project. I thank her
for providing benevolent direction, valuable suggestions and time worthy interactions.
Her elaborated comments were beneficial throughout the project design and
development.
My sincere thanks to Dr. Du Zhang for his detailed review and productive
remarks on the project report. I also thank Dr. Jinsong Ouyang for his review and advice
for the successful completion of this project.
Finally my special thanks and appreciation to my family and friends, without their
love and support I could not complete this difficult endeavor.
viii
TABLE OF CONTENTS
Page
Acknowledgements .................................................................................................... vii
List of Figures ............................................................................................................. ix
Chapter
1. INTRODUCTION ..................………………………………………………….. 1
2. BACKGROUND ................................................................................................... 4
2.1 Purpose and Scope ..................................................................................... 4
2.2 Project Design and Development Process Overview ................................. 5
3. RESEARCH AND ANALYSIS ............................................................................ 8
4. COURSEWARE DESIGN AND DEVELOPMENT ...........................................10
5. DATA WAREHOUSE COURSEWARE IMPLEMENTATION ....................... 21
5.1 Data Mart Prototype ................................................................................. 21
5.2 Data Mart Refinement .............................................................................. 30
5.3 EDW: Enterprise Data Warehouse .......................................................... 36
5.4 Aggregation .............................................................................................. 42
6. EVALUATION .................................................................................................. 51
7. CONCLUSION ..................................................................................................... 53
Appendix A. Web Service Introduction ..................................................................... 54
Appendix B. Source Code ........................................................................................ 57
Bibliography .............................................................................................................. 58
ix
LIST OF FIGURES
Figures Page
1. Figure 1. A KDD Process of Data Mining ……………………………………. 2
2. Figure 2. Use-Case Diagram of Data Warehouse Courseware ……..…………11
3. Figure 3. MVC Design Pattern in IOS ..... …………………………………… 12
4. Figure 4. Courseware Sitemap …………….…………………………………. 13
5. Figure 5. Launch Screen of Application ….……….…………………………. 14
6. Figure 6. Data Warehouse Demonstrations ……………....….………………. 15
7. Figure 7. Demonstration Steps and Detail ….…………………………………16
8. Figure 8. Search Page for Demo ……….……… ..... …………………………17
9. Figure 9. Demo Result Page ……….……… ......... …………………………. 18
10. Figure 10. Sample Quiz Demo ............................................... .……………… 19
11. Figure 11. Sample Quiz Result .... …………………………………………... 19
12. Figure 12. Data Mart Prototype Steps............................................... .……. … 22
13. Figure 13. Dimension Table: Location …….………………………………… 26
14. Figure 14. Dimension Table: Restaurant ….…………………………………. 27
15. Figure 15. Fact Table for Restaurant Data Mart ………………………..……. 28
16. Figure 16. Star Schema for Restaurant Data Mart ….…………………………29
17. Figure 17. New Dimension Table: Customer Geographic . …………………. 32
18. Figure 18. Refined Fact Table ......................................................................... 33
19. Figure 19. Refined Star Schema ...................................................................... 34
x
20. Figure 20. Demo Result after Refinement ....................................................... 35
21. Figure 21. EDW Steps ..................................................................................... 37
22. Figure 22. Review Table .................................................................................. 39
23. Figure 23. Review Fact Table .......................................................................... 40
24. Figure 24. EDW Star Schemas for Restaurant ................................................. 41
25. Figure 25. EDW Steps for Aggregation ........................................................... 43
26. Figure 26. Dimension Table: Location ............................................................ 46
27. Figure 27. Dimension Table: Review .............................................................. 46
28. Figure 28. Aggregation Fact Table .................................................................. 47
29. Figure 29. Aggregation Star Schema ............................................................... 48
30. Figure 30. Courseware Feedback Screen ......................................................... 52
1
Chapter 1
INTRODUCTION
We are living in the world where large amount, Terabytes of megabytes [1], of
data are collected daily from business, science and engineering, medicine and almost all
other perspectives of our daily life. This explosive growing, widely available, gigantic
body of data archives and rarely visited because a direct and complete understanding of
these data has exceeds the human ability. As a result, important decisions are made based
on decision maker’s intuition, which can harm the business. To automatically uncover the
valuable information from the tremendous amount of data and to transform such a data
into organized knowledge, we need powerful and versatile tools [1]. This necessity gives
birth of data mining.
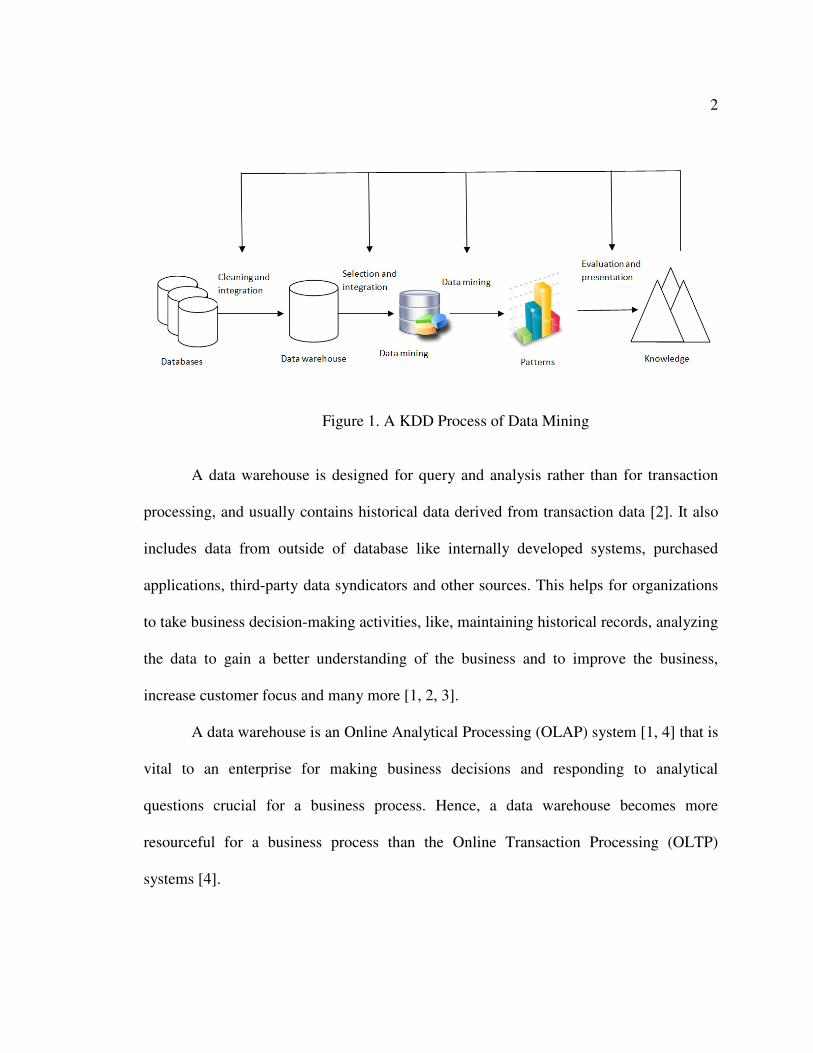
Data mining is the process of extracting data from different source of data and
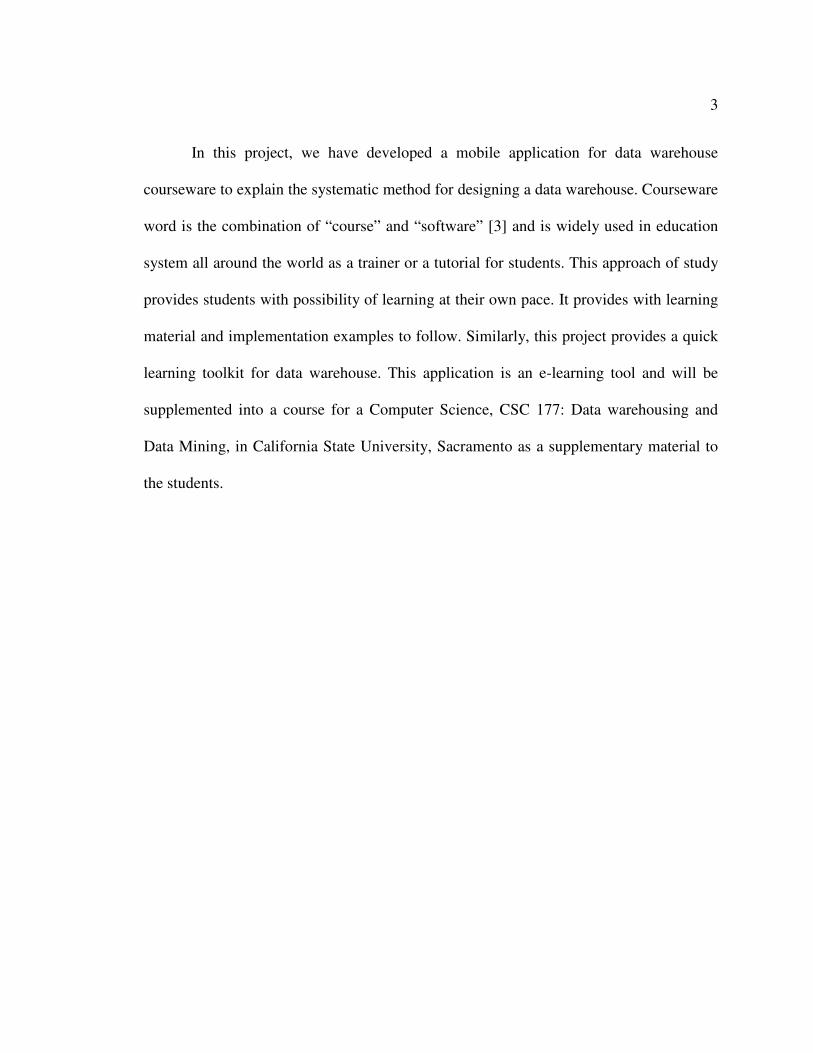
makes that data as a knowledgeable. Data mining process is also treated as a KDD
(knowledge discovery) process, which includes the sequence of steps: Data cleaning, data
integration, data selection, data transformation, data mining, pattern evaluation, and
knowledge presentation. Figure 1 shows the steps of data mining.
Here the data cleaning, data integration and data transformation together work as
data warehousing. Data warehousing is very important part in data mining. Data
warehousing provides architectures and tools for business executives to systematically
organize, understand, and use their data to make strategic decisions [1].
2
A data warehouse is designed for query and analysis rather than for transaction
processing, and usually contains historical data derived from transaction data [2]. It also
includes data from outside of database like internally developed systems, purchased
applications, third-party data syndicators and other sources. This helps for organizations
to take business decision-making activities, like, maintaining historical records, analyzing
the data to gain a better understanding of the business and to improve the business,
increase customer focus and many more [1, 2, 3].
A data warehouse is an Online Analytical Processing (OLAP) system [1, 4] that is
vital to an enterprise for making business decisions and responding to analytical
questions crucial for a business process. Hence, a data warehouse becomes more
resourceful for a business process than the Online Transaction Processing (OLTP)
systems [4].
Figure 1. A KDD Process of Data Mining
3
In this project, we have developed a mobile application for data warehouse
courseware to explain the systematic method for designing a data warehouse. Courseware
word is the combination of “course” and “software” [3] and is widely used in education
system all around the world as a trainer or a tutorial for students. This approach of study
provides students with possibility of learning at their own pace. It provides with learning
material and implementation examples to follow. Similarly, this project provides a quick
learning toolkit for data warehouse. This application is an e-learning tool and will be
supplemented into a course for a Computer Science, CSC 177: Data warehousing and
Data Mining, in California State University, Sacramento as a supplementary material to
the students.
4
Chapter 2
BACKGROUND
Data warehouse is a database designed to enable business intelligence activities: it
exists to help users to understand and enhance their organization’s performance. Data
warehouse is storage of historical data for a business, an experiment or any other
enterprise. It consists of selectively extracted data from a primary source or any other
source inter-related with the primary data [3]. It reduces the cost-per-analysis due to the
simpler and standardized structures in contrast to the application databases.
In first chapter, we introduce concept and significance of data warehouse to the
data mining and business process. In this chapter, we provide the comprehensive
overview of project design and development process.
2.1 Purpose and Scope
Motivation for this project comes from my own experience while studying the
course CSC 177: Data Warehousing and Data Mining at California State University,
Sacramento. While studying this course, we have to implement term project on data
warehouse. Reading the book was not enough for summarizing data warehouse process.
There was already one courseware implemented by a previous student, which explains
steps for designing data warehouse, but that application is browser dependent and
required Internet connection to read. My friend and I were working on campus job and
hoping if there is some way to read and understand without opening computer or internet
connection, it would be helpful and convenient. This incident gives me idea to make
5
mobile application for explaining data warehouse with an interesting example, so student
or beginners of data warehouse designer can learn anywhere anytime.
The purpose of the data warehouse is to provide aggregate data, which is in
suitable format for specific decision-making.
The main purpose of the project is to provide on-hand information in your mobile
for designing data warehouse to audience who is interested in learning concept of data
warehousing. Additionally it serves as a platform for learning database concept.
2.2 Project Design and Development Process Overview
The courseware divides the topics for designing a data warehouse into four
sections. Each section explains step-by-step process with example. There is also final
demo of data warehouse progress after completing the each step to see the progressively
view of resultant view.
Project starts with basic introduction about data warehouse, which includes the
basic concept, and applications where data warehouse is useful, basic architecture and
different data modeling techniques used in data warehousing process.
Section 1 explains how to identify the purpose and the requirements. This section
also explains the information for selecting business process and implement basic data
mart. This section helps the beginner to understand from where we should start data
warehouse once we get data source. The second section helps to recognize the purpose of
refining data mart and demonstrate the refining process using the previous section 1. The
third demonstration shows the method of building an enterprise data warehouse using the
6
data mart design from the former section. This also explains how to merge different data
mart together and get answer of multiple queries of business process. The fourth section,
gives the idea of aggregation technique in amplifying the performance of the data
warehouse.
In addition to the topic explanation, each section also includes case study of
implementing data warehouse for restaurant search. Each demonstration provides
interactive user sessions to generate summary reports as per the user specifications [10].
The idea of using case study is supported by Dr. Meiliu Lu, when I was proposing the
project. She gives me idea of using interactive example which reader loves to read and
easy to understand. Each restaurant has their own data and if some restaurants
have multiple branches, then each branch has its own data. End user or marketing people
needs all data together for better understanding of user interest and business progress to
make future decision. Therefore, we realize that using a restaurant example is easy to
explain and useful for end users for searching restaurant and finding people reviews in
their daily life as well as helpful for marketing people to make business decision.
Restaurant search case study can helps to get answer of searching restaurants near
20 miles of current location or search using area name. The result gives information of
restaurant location, contact number, food category and people review about resultant
restaurants. We use Yelp APIs to get restaurant data source. For more detail about each
restaurant, like map, direction, detail information about each reviews etc. are provided by
redirecting to the yelp website [14].

7
Both courseware and sample implementations will be discussed in later chapters
of this report. In next chapter, we will see what research has done during project design
and development. Additionally I will present courseware coverage details in next chapter.
8
Chapter 3
RESEARCH AND ANALYSIS
Research and analysis are the most import part of any project and it took most of
the time for implementing this project. Research includes market research, product usage
research, product requirements, implementation and many more.
For making product successful, it is very important to research that who will use
this product and how is the future of the product before start implementation [5]. So first,
we understand why we need data warehouse and what future of data warehouse is. Based
on current era of computer, data warehouse is very important in data analysis and in data
mining process. Data warehouse is the foundation for any successful business
intelligence. Although it cost money – big money, it delivers enhanced business
intelligence, enhances data quality and consistency, saves time and provides historical
intelligence. Today all big companies like Google, Apple, eBay, Walmart, Salesforce and
many more use the data warehouse techniques [7]. Based on all these research we come
to the point that the future of the data warehousing is bright. Therefore, if we make
project, which includes basic information about data warehousing, it will helps lot of
people who wants to develop their skills in the process data warehousing [13].
After finalizing the objective, I started the systematic process for implementing
the project. As a first step, I decided the technology to use for this project. For mobile
application, there are many different technologies are used in different smart phones like,
Android, IOS or Window. Selecting the technology is very hard because people are using
all three technologies equally. However, after searching the past analytics and my
9
technical skill, I decided to go with IOS technology. Next step was to finalize the case
study example.
For case study dataset, I have read many articles and online video to understand
the data warehouse concept and process. Then I did internet research for getting best
datasets to understand data warehouse process. I was looking for the data set, which not
only suits for the data warehouse concept but also should be easy to understand for
beginners. After doing lot of research and professor’s help, I decided to go with nearby
restaurants example. Accurate dataset for restaurants based on user’s current location was
very hard and not available in internet. Therefore, I decided to go with yelp or Google
restaurant data set. Doing more research on finding data set helps me to go with Yelp
restaurant APIs, as this is easily available and flexible to implement.
For implementing this technology, I need to have knowledge of technology like,
Objective C, JSON, PHP, MySQL, SQLite and Microsoft office [7, 11]. I was little
familiar with all these technology, but only basic knowledge was not enough for
implementing this project. Therefore, to get deep understanding of these technologies, I
study with Stanford course videos and other related materials from internet.
My research paves the path towards my design and development phase. I
concluded my research with list of topics required to include in courseware, data set and
technology to use for this project. Next task is to come with courseware design and
implementation steps.
10
Chapter 4
COURSEWARE DESIGN AND DEVELOPMENT
Courseware is computer based education software, which helps the students to
self-learn. This online education material sharing system helps to distribute the
knowledge to any corner of the world. Sometimes student or any technical people cannot
go to college to attend the course and understand the new technology because either they
are busy or cannot afford. Attending the course online is also very time consuming.
While courseware is online and helps to understand the basics of technology, beginners
get basic idea and help to decide their interest about the technology whether they want to
deep dive into it or not. In addition, they can learn based on their convenience.
Idea here is to come up with something that helps student learn concept of data
mining specially focused on data warehousing. Along with theoretical concept
description of data warehouse process, some practical example and quiz is very helpful to
understand. Considering this, I have included some examples and quiz for better
understanding.
A courseware is implemented based on the principles of mobile application using
IOs technology. This courseware is compatible to all IOS device including iPod, iPhone
and iPad. To develop the IOS mobile application [13], I use Objective C as programming
language, SQLite as database and Xcode IDE tool. For case study example, I use Yelp
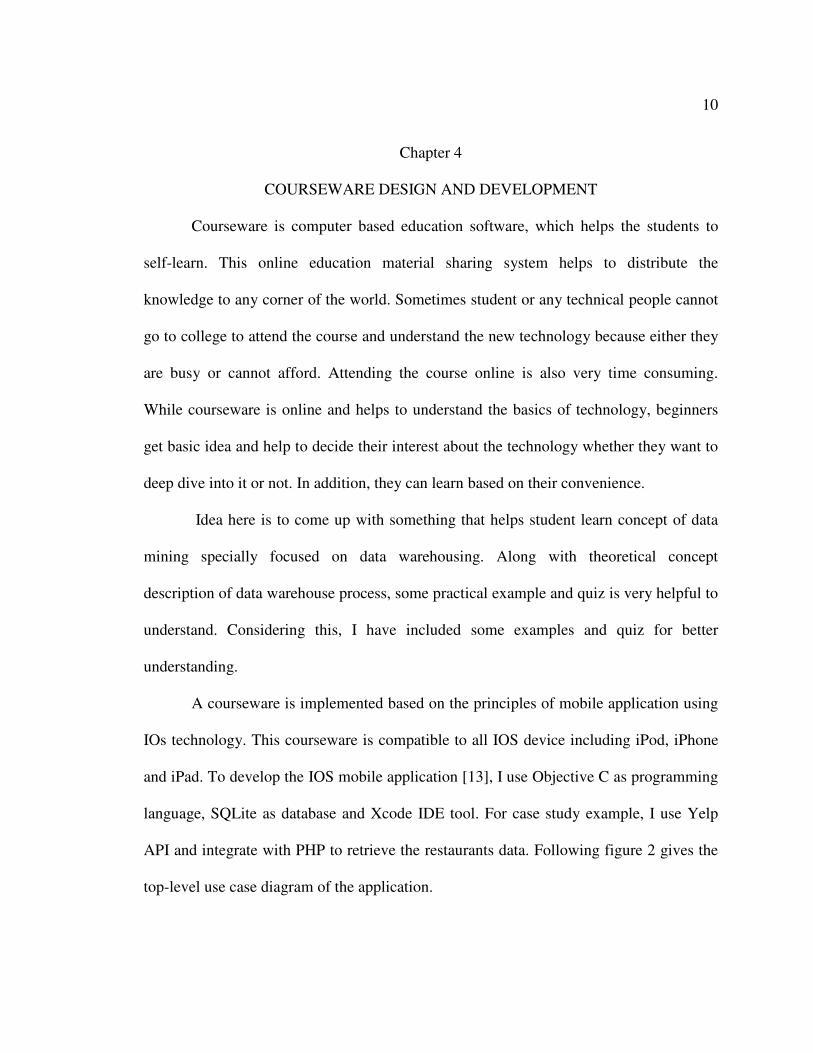
API and integrate with PHP to retrieve the restaurants data. Following figure 2 gives the
top-level use case diagram of the application.
A mobile application is developed using MVC design pattern. MVC refers to
three separate roles: Model, view and controller.
objects play in the application, it
Each of the three types of objects is separated from the others by abstract boundaries and
communicates with objects of the other types across those boundaries
this modular architecture is that the separation of roles allows us to make modification
easily and with fewer bugs.
development.
Model Object: Model
encapsulate the data specific to an application and define the logic and computation that
manipulate and process that data
Figure 2. Use
A mobile application is developed using MVC design pattern. MVC refers to
three separate roles: Model, view and controller. The pattern defines not only the roles
objects play in the application, it defines the way objects communicate with each other.
Each of the three types of objects is separated from the others by abstract boundaries and
communicates with objects of the other types across those boundaries [13
this modular architecture is that the separation of roles allows us to make modification
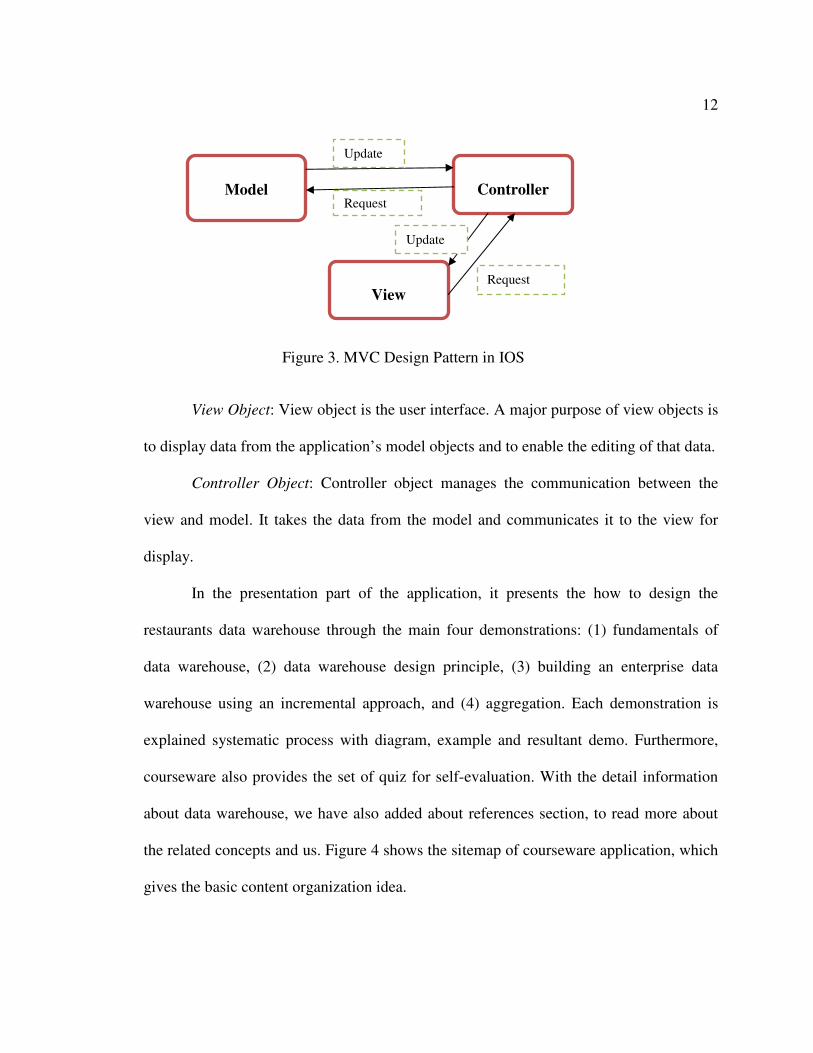
easily and with fewer bugs. Figure 3 shows the MVC design pattern used in IOs
Model represents the data in your application.
encapsulate the data specific to an application and define the logic and computation that
manipulate and process that data.
Data warehouse
courseware
SQLite
DB
Yelp Web
Service
Web service
integration
MySQL
Figure 2. Use-Case Diagram of Data Warehouse Courseware
11
A mobile application is developed using MVC design pattern. MVC refers to
The pattern defines not only the roles
defines the way objects communicate with each other.
Each of the three types of objects is separated from the others by abstract boundaries and
13]. The beauty of
this modular architecture is that the separation of roles allows us to make modification
shows the MVC design pattern used in IOs
represents the data in your application. Model objects
encapsulate the data specific to an application and define the logic and computation that
Yelp Web
ervices
Web service
integration
MySQL
Case Diagram of Data Warehouse Courseware
12
View Object: View object is the user interface. A major purpose of view objects is
to display data from the application’s model objects and to enable the editing of that data.
Controller Object: Controller object manages the communication between the
view and model. It takes the data from the model and communicates it to the view for
display.
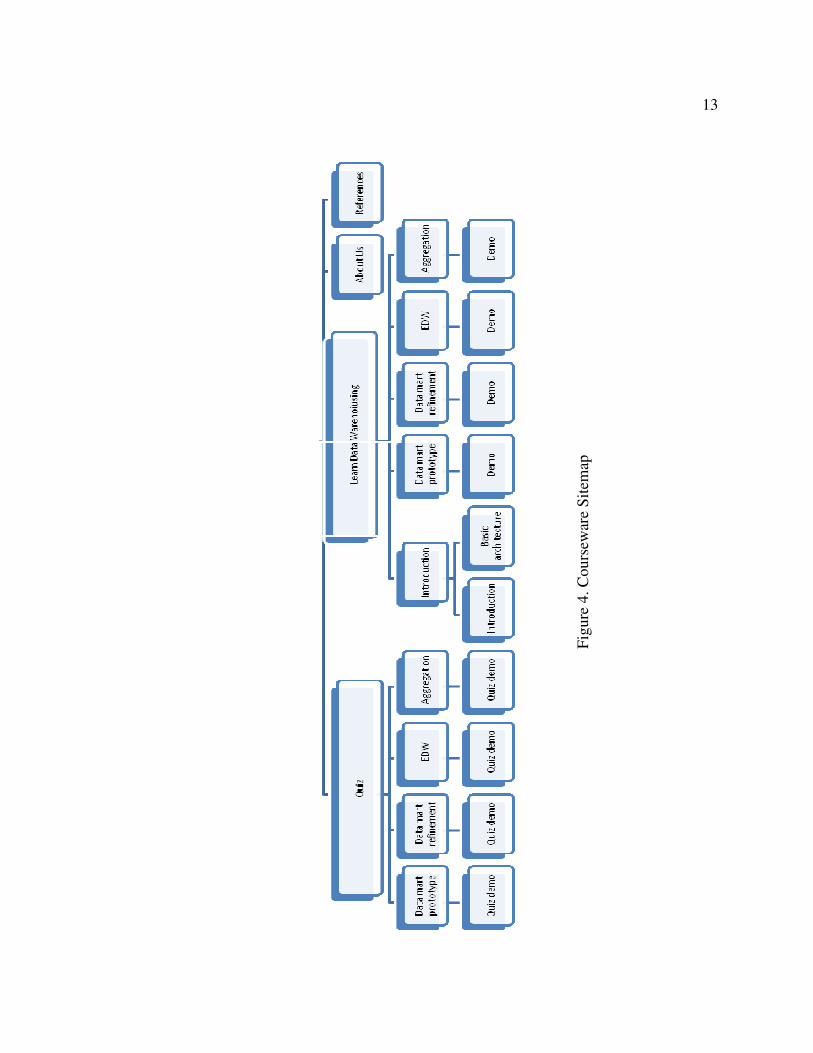
In the presentation part of the application, it presents the how to design the
restaurants data warehouse through the main four demonstrations: (1) fundamentals of
data warehouse, (2) data warehouse design principle, (3) building an enterprise data
warehouse using an incremental approach, and (4) aggregation. Each demonstration is
explained systematic process with diagram, example and resultant demo. Furthermore,
courseware also provides the set of quiz for self-evaluation. With the detail information
about data warehouse, we have also added about references section, to read more about
the related concepts and us. Figure 4 shows the sitemap of courseware application, which
gives the basic content organization idea.
Model
Controller
View Request
Update
Request
Update
Figure 3. MVC Design Pattern in IOS
Fig
ure
4.
Co
urs
ewar
e S
item
ap
13
14
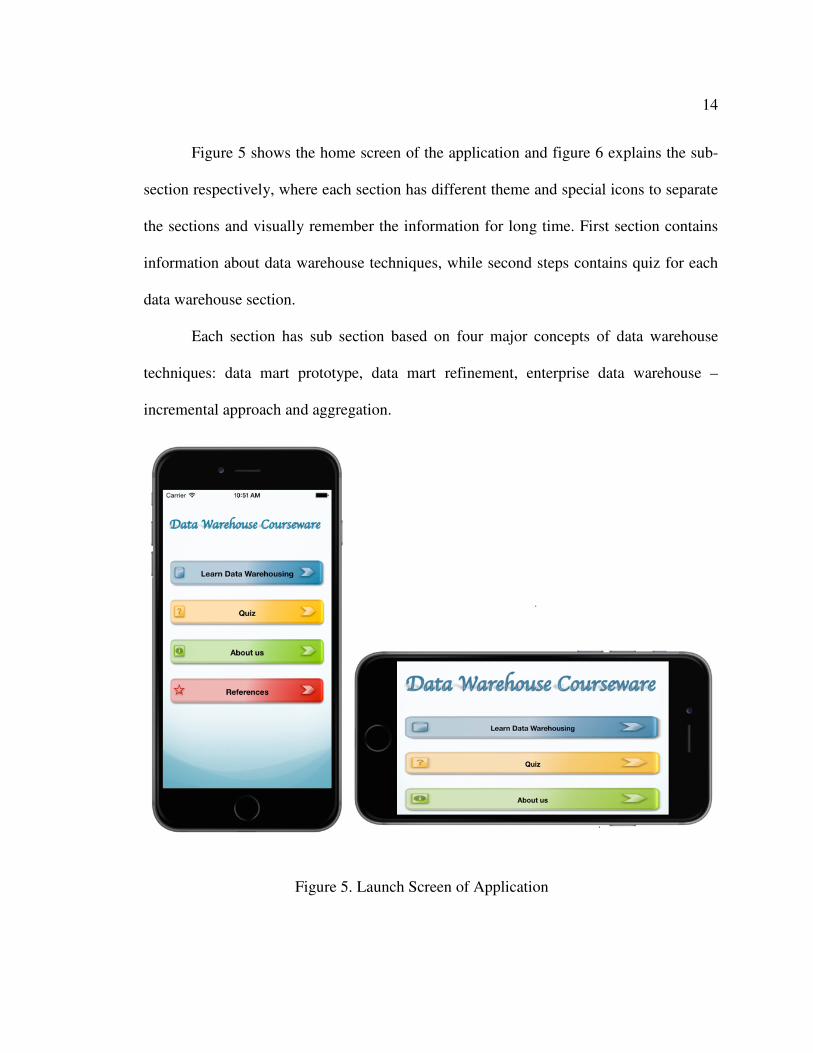
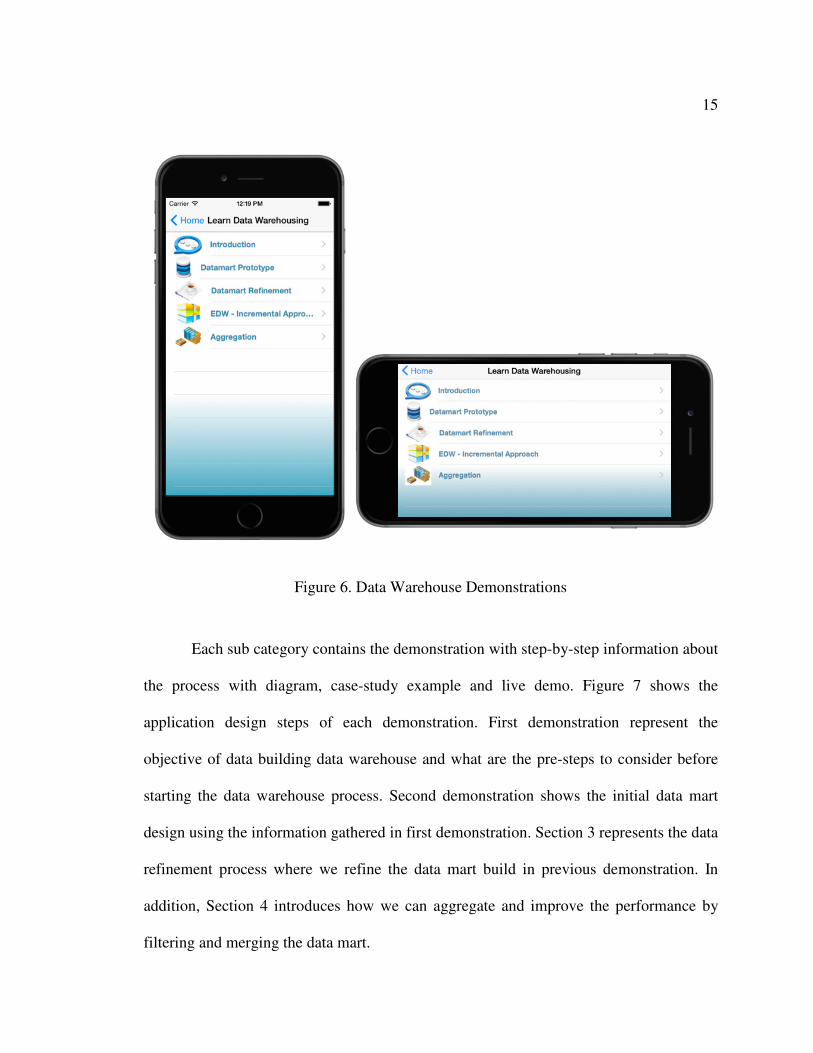
Figure 5 shows the home screen of the application and figure 6 explains the sub-
section respectively, where each section has different theme and special icons to separate
the sections and visually remember the information for long time. First section contains
information about data warehouse techniques, while second steps contains quiz for each
data warehouse section.
Each section has sub section based on four major concepts of data warehouse
techniques: data mart prototype, data mart refinement, enterprise data warehouse –
incremental approach and aggregation.
Figure 5. Launch Screen of Application
15
Each sub category contains the demonstration with step-by-step information about
the process with diagram, case-study example and live demo. Figure 7 shows the
application design steps of each demonstration. First demonstration represent the
objective of data building data warehouse and what are the pre-steps to consider before
starting the data warehouse process. Second demonstration shows the initial data mart
design using the information gathered in first demonstration. Section 3 represents the data
refinement process where we refine the data mart build in previous demonstration. In
addition, Section 4 introduces how we can aggregate and improve the performance by
filtering and merging the data mart.
Figure 6. Data Warehouse Demonstrations
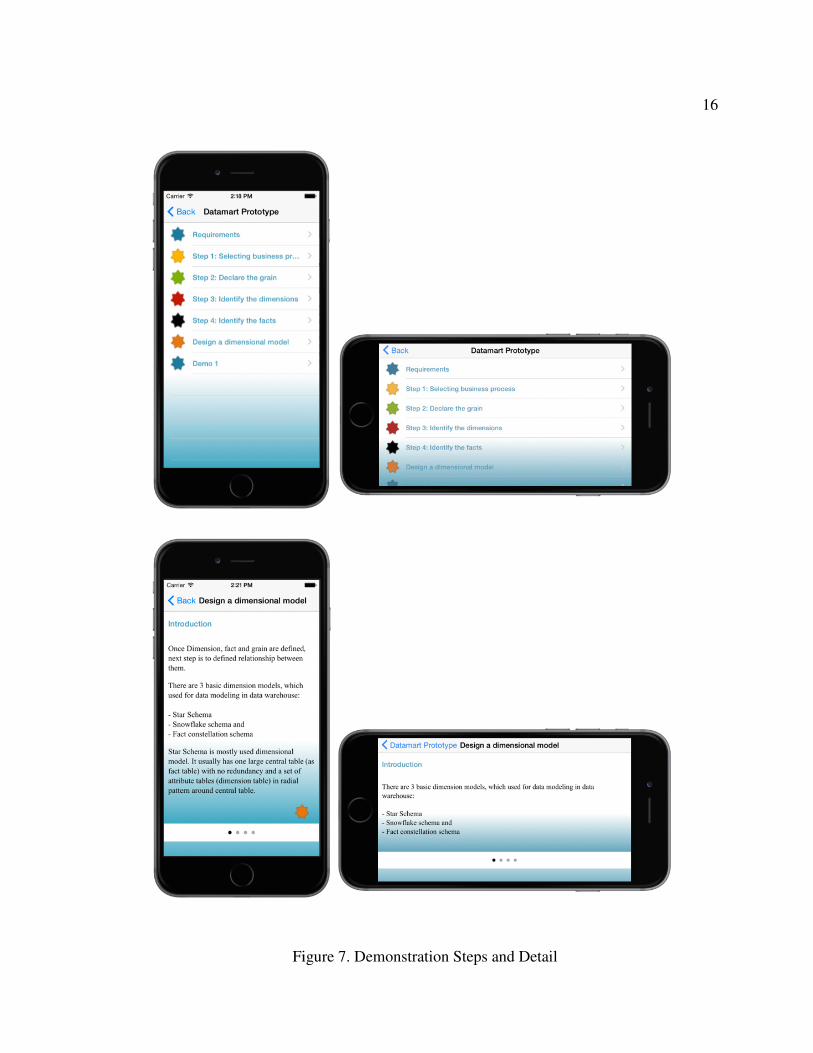
Figure 7.
Figure 7. Demonstration Steps and Detail
16
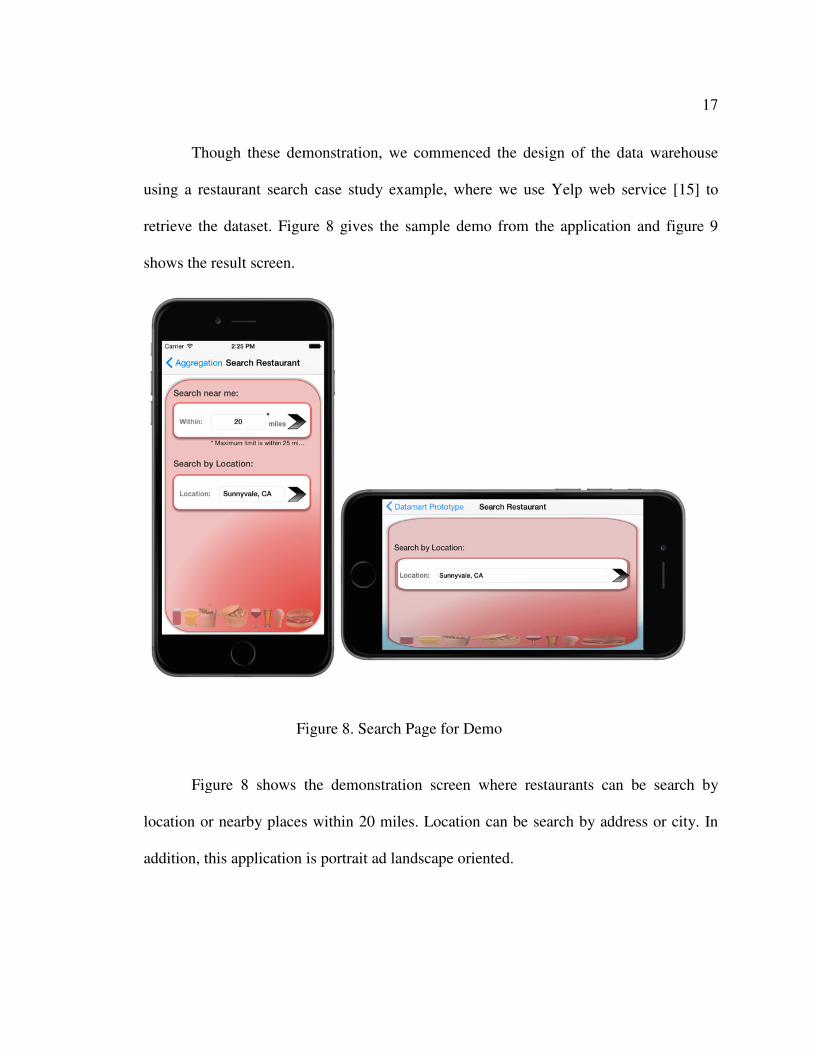
Though these demonstration, we commenced the design of the data warehouse
using a restaurant search case study example, where we use Yelp
retrieve the dataset. Figure 8
shows the result screen.
Figure 8 shows the demonstration screen where restaurants can be search by
location or nearby places within 20 miles. Location can be search by address or city.
addition, this application is portrait ad landscape oriented.
Figure 8. Search Page for Demo
Though these demonstration, we commenced the design of the data warehouse
restaurant search case study example, where we use Yelp web service
retrieve the dataset. Figure 8 gives the sample demo from the application
Figure 8 shows the demonstration screen where restaurants can be search by
location or nearby places within 20 miles. Location can be search by address or city.
this application is portrait ad landscape oriented.
Figure 8. Search Page for Demo
17
Though these demonstration, we commenced the design of the data warehouse
web service [15] to
gives the sample demo from the application and figure 9
Figure 8 shows the demonstration screen where restaurants can be search by
location or nearby places within 20 miles. Location can be search by address or city. In
18
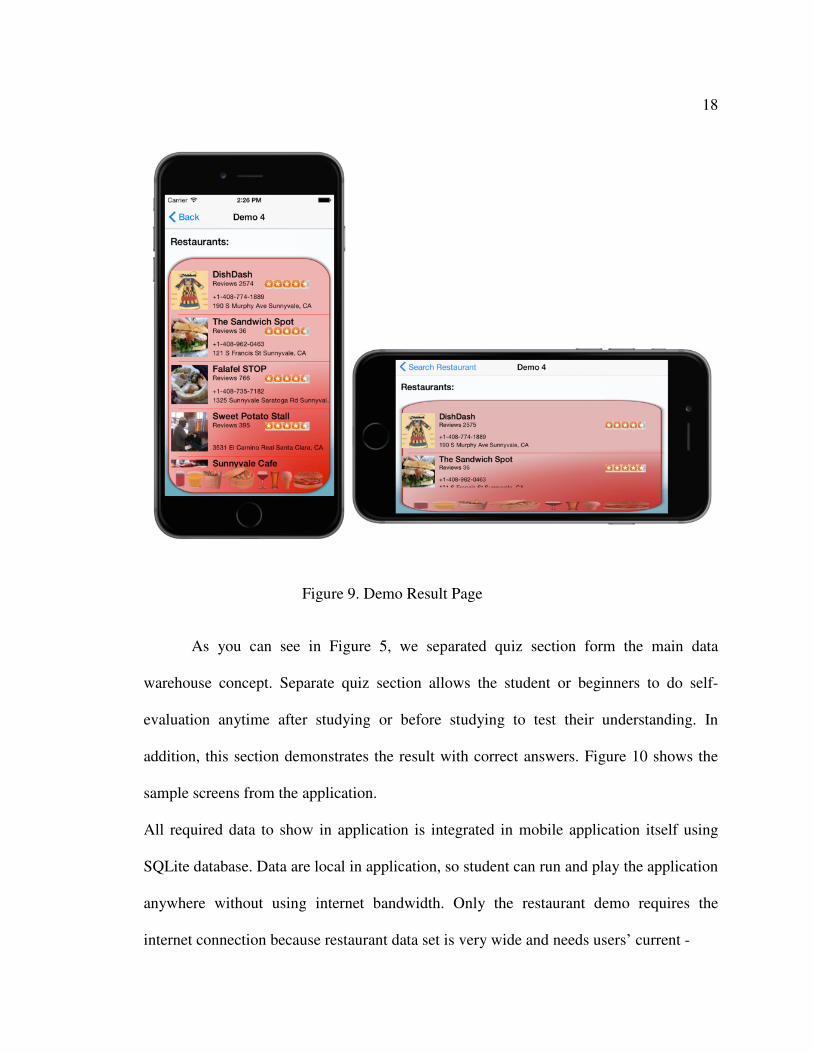
As you can see in Figure 5, we separated quiz section form the main data
warehouse concept. Separate quiz section allows the student or beginners to do self-
evaluation anytime after studying or before studying to test their understanding. In
addition, this section demonstrates the result with correct answers. Figure 10 shows the
sample screens from the application.
All required data to show in application is integrated in mobile application itself using
SQLite database. Data are local in application, so student can run and play the application
anywhere without using internet bandwidth. Only the restaurant demo requires the
internet connection because restaurant data set is very wide and needs users’ current -
Figure 9. Demo Result Page
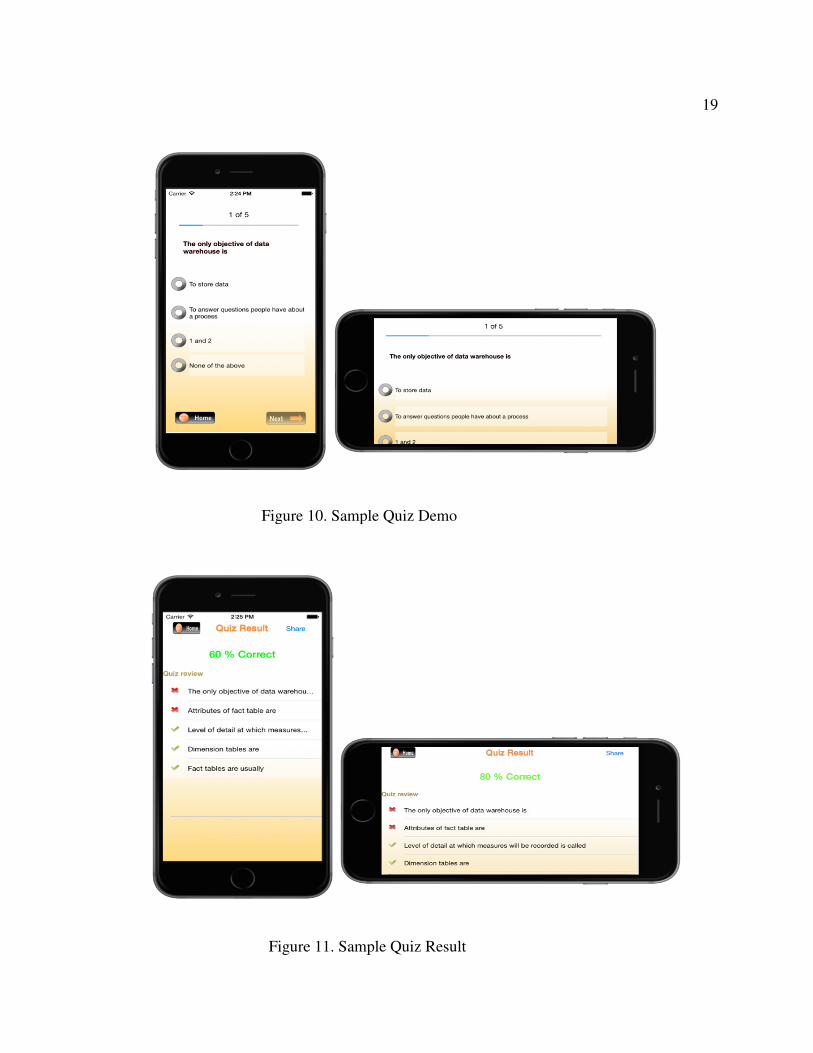
Figure 10. Sample Quiz Demo
Figure 11. Sample Quiz Result
Figure 10. Sample Quiz Demo
Figure 11. Sample Quiz Result
19
20
location to find the restaurants nearby. Restaurant case study web services are
implemented using PHP technology.
We will describe the detail description of each major data warehouse concepts in
next chapter.
21
Chapter 5
DATA WAREHOUSE COURSEWARE IMPLEMENTATION
Data warehouse is defined as the central repository for a business to an enterprise
[5]. To understand the key concept, principle and functionality of the data warehouse, it
is very important to understand major seven topics of the data warehouse. Seven major
steps are: (1) fundamentals of data warehouse, (2) data warehouse design solution, (3)
building enterprise data warehouse, (4) interviewing for data warehouse, (5) data
warehouse aggregates, (6) designing aggregates and (7) using aggregation. This
courseware includes all these seven concepts with examples and demonstration. For
better understanding, we grouped these topics into four demonstrations: data mart
prototype, data mart refinement, EDW: enterprise data warehouse and aggregation. Each
of these demonstrations is described here.
5.1 Data Mart Prototype
In this demonstration, we describe the initial process for designing the data mart.
Before starting the data warehouse, it is very important to understand the requirements
and identify the purpose behind the data warehouse design. Requirements help to
understand the importance of the project. After getting clear concept of business
requirement, next major step is to selecting the process to implement the data warehouse.
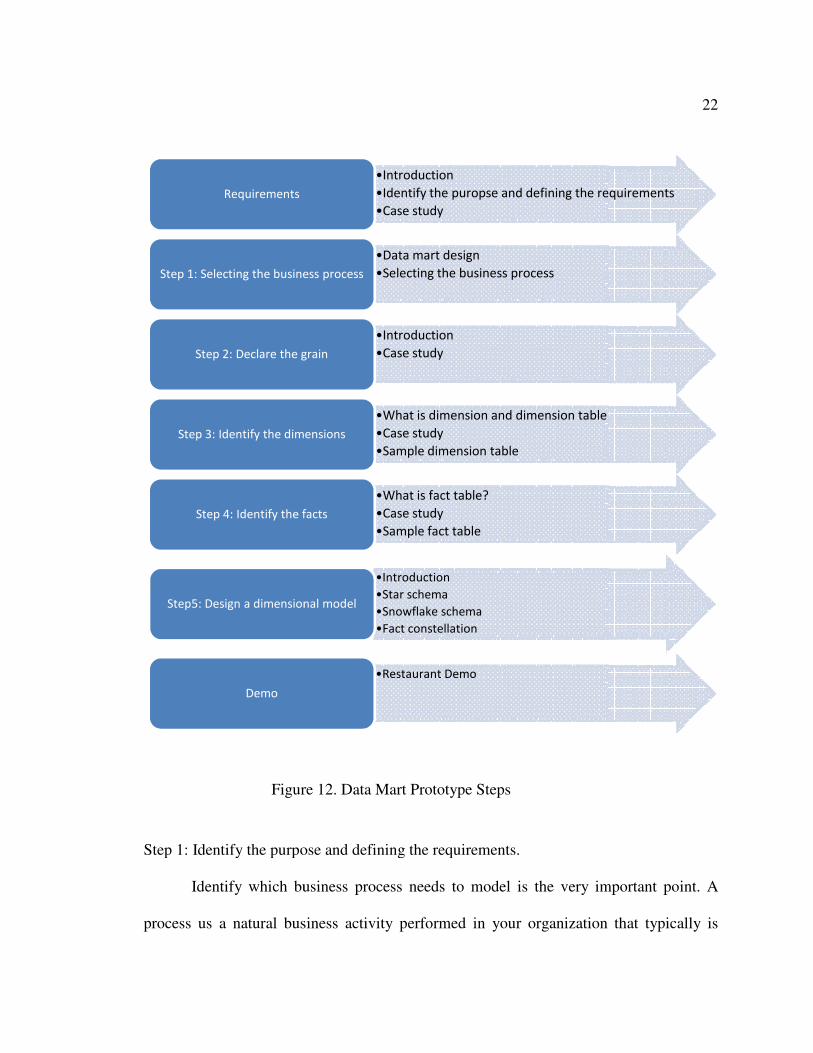
Figure 12 shows the design steps included in demonstration 1.
Step 1: Identify the purpose and defining the requirements.
Identify which business process needs to model is the very important point. A
process us a natural business activity performed in your organization that typically is
Requirements
Step 1: Selecting the business process
Step 2: Declare the grain
Step 3: Identify the dimensions
Step 4: Identify the facts
Step5: Design a dimensional model
Demo
Figure 12. Data Mart Prototype Steps
Step 1: Identify the purpose and defining the requirements.
Identify which business process needs to model is the very important point. A
process us a natural business activity performed in your organization that typically is
•Introduction
•Identify the puropse and defining the requirements
•Case study
•Data mart design
•Selecting the business processStep 1: Selecting the business process
•Introduction
•Case studyStep 2: Declare the grain
•What is dimension and dimension table
•Case study
•Sample dimension table
Step 3: Identify the dimensions
•What is fact table?
•Case study
•Sample fact table
Step 4: Identify the facts
•Introduction
•Star schema
•Snowflake schema
•Fact constellation
Step5: Design a dimensional model
•Restaurant Demo
Figure 12. Data Mart Prototype Steps
22
Identify which business process needs to model is the very important point. A
process us a natural business activity performed in your organization that typically is
Identify the puropse and defining the requirements
23
supported be a source data collection system [7]. Talking to the people who knows the
process helps to gain the deep understanding of the process. Interviewing and listening to
users is the most efficient means for selecting the business process [7, 8]. Interview
shapes the data warehouse.
The end user for this courseware is the student who will use this application and
restaurant search data warehouse. Hence, we started to talk with the students of CSC 177,
data warehousing and data mining, about the concept and their thoughts. We also talk
with the instructor of the course. A few question-answer sessions held between students
and instructor helps to initiate the design of the enrollment data warehouse. Based on the
talk with students and friends, I understand that end users are mostly interested in getting
the answer of the following question:
1. How many restaurants are near to my location or in particular area?
2. What type of food they are serving?
3. How is users review about particular restaurant?
4. How far is the restaurant form the location?
5. Does there any discount coupon or special menu available?
Step 2: Selecting business process
Once the requirements are gathered, next step is to decide the data modeling
technique. Answering the question that ‘how should we design an efficient data
warehouse?’ can helps to decide the modeling technique. Data warehouse contains
mainly two data modeling techniques: ER modeling and Dimensional modeling.
24
ER modeling produces a data model of the specific area of interest, using two
basic concepts: entities and the relationships between those entities. Detailed ER models
also contain attributes, as properties of either the entities or the relationships. The ER
model is an abstraction tool because it can be used to understand and simplify the
ambiguous data relationships in the business world and complex systems environments
[5]. Dimensional modeling uses three basic concepts: measure, facts, and dimensions [5].
Dimensional modeling is powerful in representing the requirements of the business user
in the context of database tables. Both ER and dimensional modeling can be used to
create an abstract model of a specific subject. However, each has its own limited set of
modeling concepts and associated notation conventions.
A dimensional modeling technique is the most useful techniques now a day.
Hence, we also use the same technique here for designing the restaurant data warehouse.
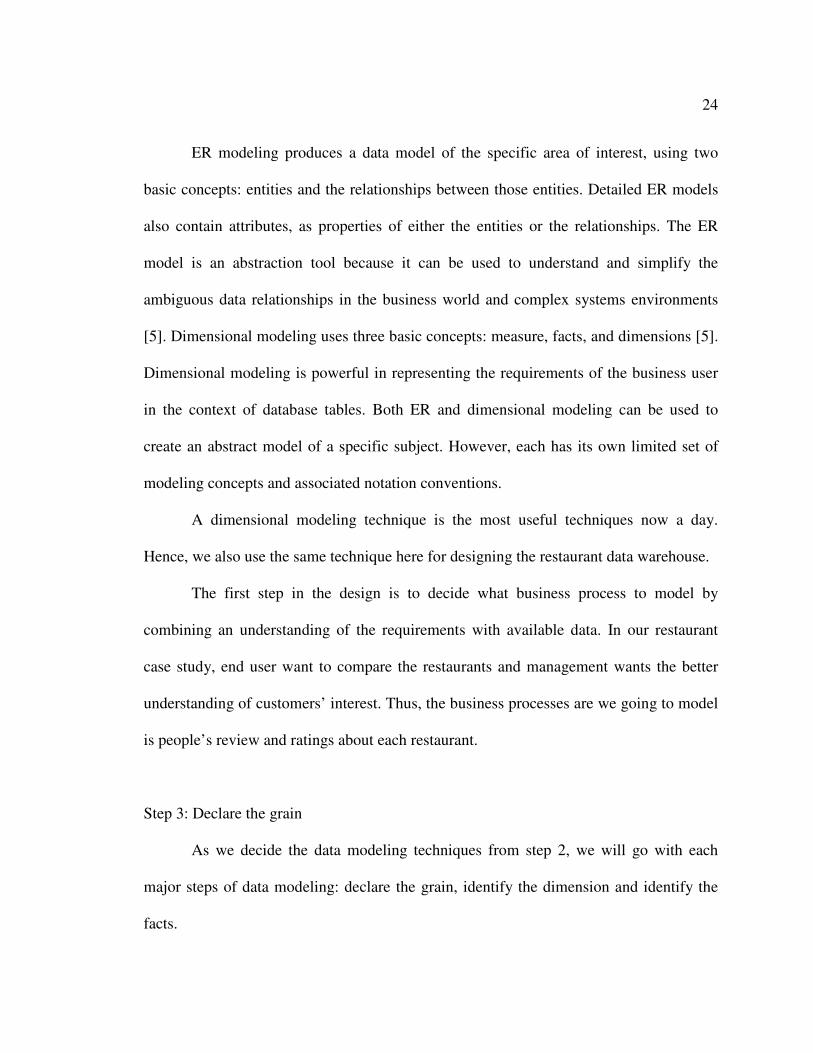
The first step in the design is to decide what business process to model by
combining an understanding of the requirements with available data. In our restaurant
case study, end user want to compare the restaurants and management wants the better
understanding of customers’ interest. Thus, the business processes are we going to model
is people’s review and ratings about each restaurant.
Step 3: Declare the grain
As we decide the data modeling techniques from step 2, we will go with each
major steps of data modeling: declare the grain, identify the dimension and identify the
facts.
25
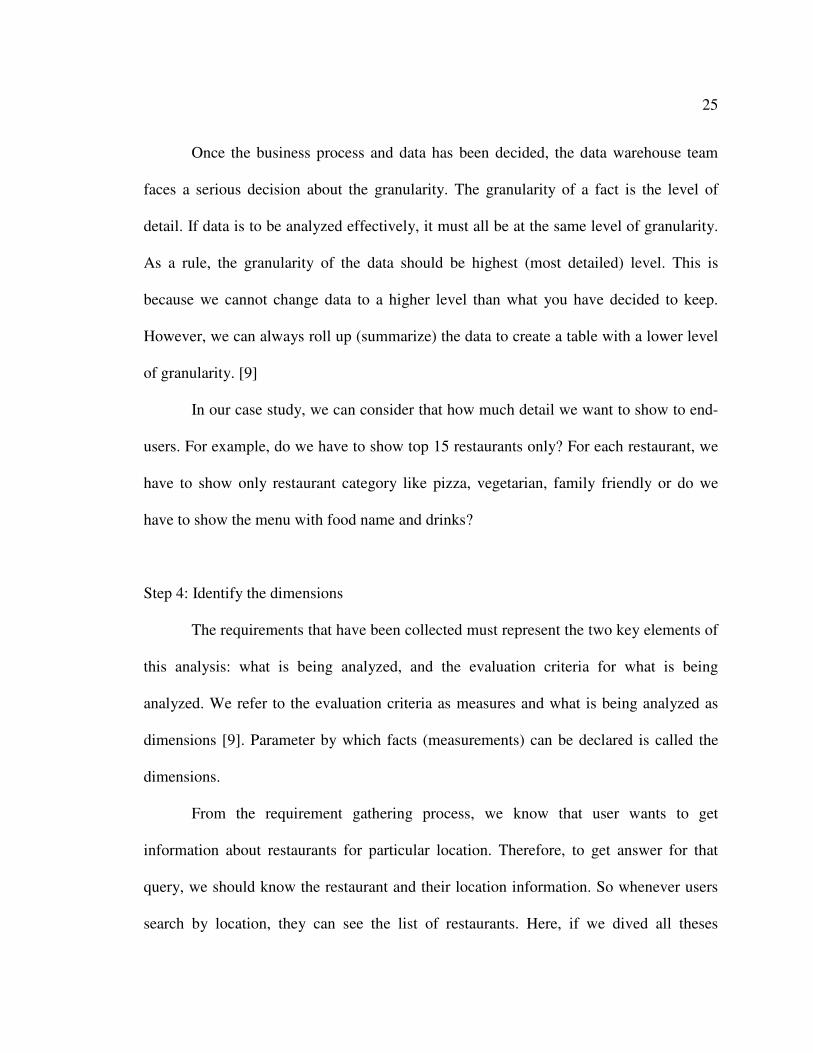
Once the business process and data has been decided, the data warehouse team
faces a serious decision about the granularity. The granularity of a fact is the level of
detail. If data is to be analyzed effectively, it must all be at the same level of granularity.
As a rule, the granularity of the data should be highest (most detailed) level. This is
because we cannot change data to a higher level than what you have decided to keep.
However, we can always roll up (summarize) the data to create a table with a lower level
of granularity. [9]
In our case study, we can consider that how much detail we want to show to end-
users. For example, do we have to show top 15 restaurants only? For each restaurant, we
have to show only restaurant category like pizza, vegetarian, family friendly or do we
have to show the menu with food name and drinks?
Step 4: Identify the dimensions
The requirements that have been collected must represent the two key elements of
this analysis: what is being analyzed, and the evaluation criteria for what is being
analyzed. We refer to the evaluation criteria as measures and what is being analyzed as
dimensions [9]. Parameter by which facts (measurements) can be declared is called the
dimensions.
From the requirement gathering process, we know that user wants to get
information about restaurants for particular location. Therefore, to get answer for that
query, we should know the restaurant and their location information. So whenever users
search by location, they can see the list of restaurants. Here, if we dived all theses
26
information in sub categories, we can say that street address, area name and area code can
be grouped as a location and restaurant information can be considered as a restaurant to
simplify. This subset or group of attributes can be considering as dimensional table like
location, restaurant.
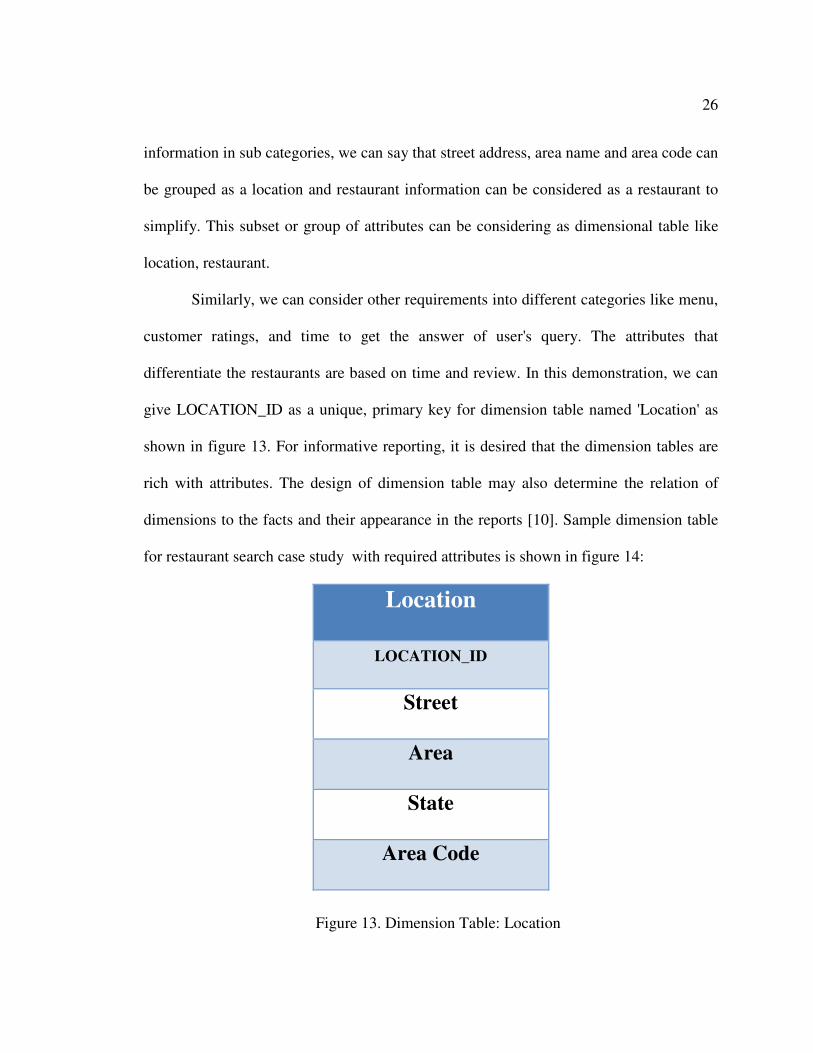
Similarly, we can consider other requirements into different categories like menu,
customer ratings, and time to get the answer of user's query. The attributes that
differentiate the restaurants are based on time and review. In this demonstration, we can
give LOCATION_ID as a unique, primary key for dimension table named 'Location' as
shown in figure 13. For informative reporting, it is desired that the dimension tables are
rich with attributes. The design of dimension table may also determine the relation of
dimensions to the facts and their appearance in the reports [10]. Sample dimension table
for restaurant search case study with required attributes is shown in figure 14:
Location
LOCATION_ID
Street
Area
State
Area Code
Figure 13. Dimension Table: Location
27
Restaurant
RESTAURANT_ID
Name
Phone Number
Rank
Description
Food type
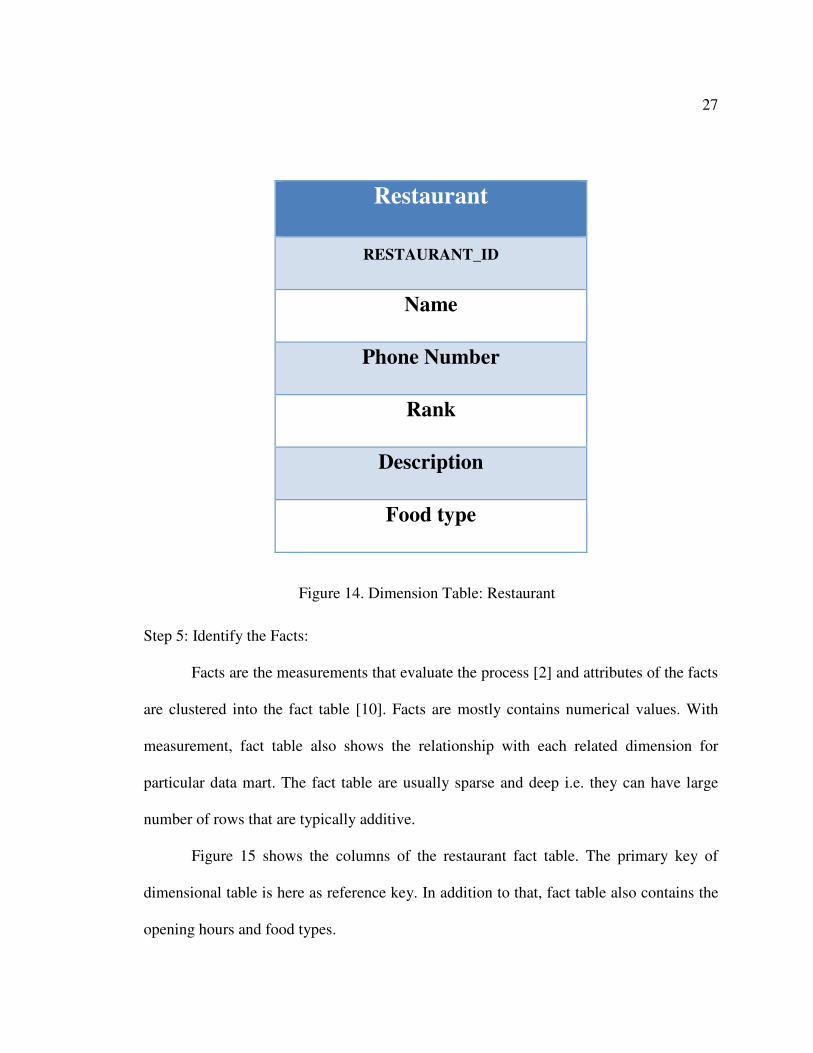
Step 5: Identify the Facts:
Facts are the measurements that evaluate the process [2] and attributes of the facts
are clustered into the fact table [10]. Facts are mostly contains numerical values. With
measurement, fact table also shows the relationship with each related dimension for
particular data mart. The fact table are usually sparse and deep i.e. they can have large
number of rows that are typically additive.
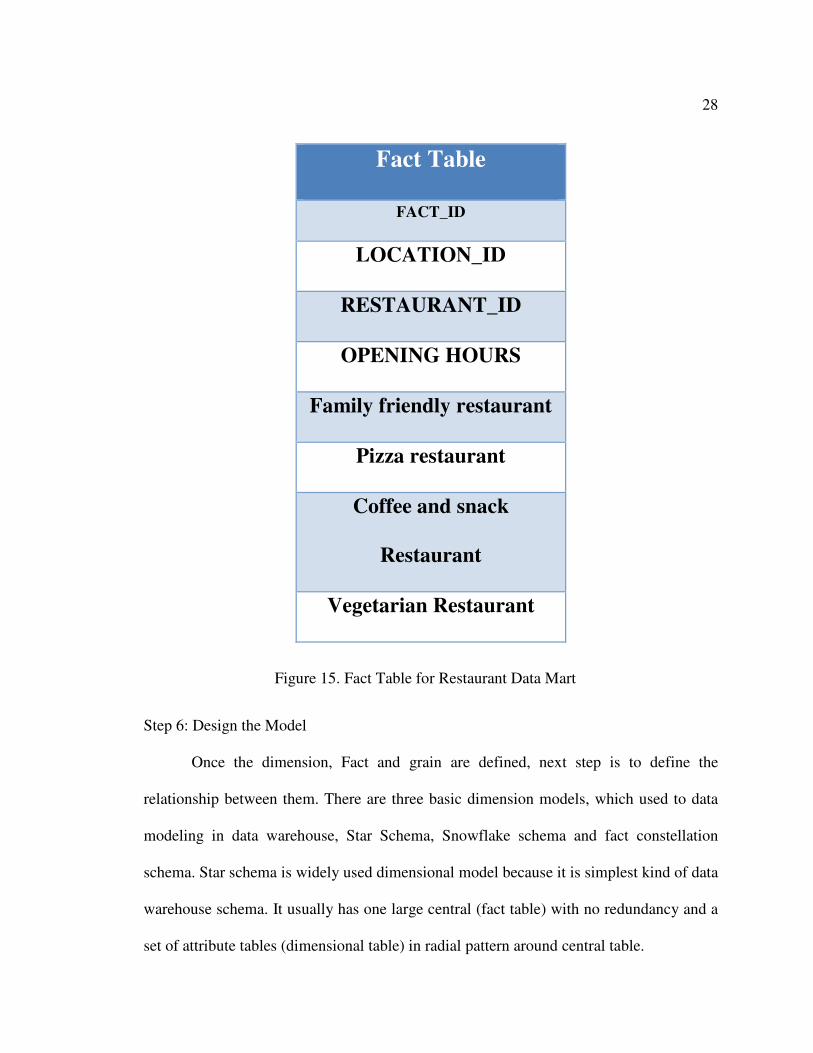
Figure 15 shows the columns of the restaurant fact table. The primary key of
dimensional table is here as reference key. In addition to that, fact table also contains the
opening hours and food types.
Figure 14. Dimension Table: Restaurant
28
Fact Table
FACT_ID
LOCATION_ID
RESTAURANT_ID
OPENING HOURS
Family friendly restaurant
Pizza restaurant
Coffee and snack
Restaurant
Vegetarian Restaurant
Step 6: Design the Model
Once the dimension, Fact and grain are defined, next step is to define the
relationship between them. There are three basic dimension models, which used to data
modeling in data warehouse, Star Schema, Snowflake schema and fact constellation
schema. Star schema is widely used dimensional model because it is simplest kind of data
warehouse schema. It usually has one large central (fact table) with no redundancy and a
set of attribute tables (dimensional table) in radial pattern around central table.
Figure 15. Fact Table for Restaurant Data Mart
29
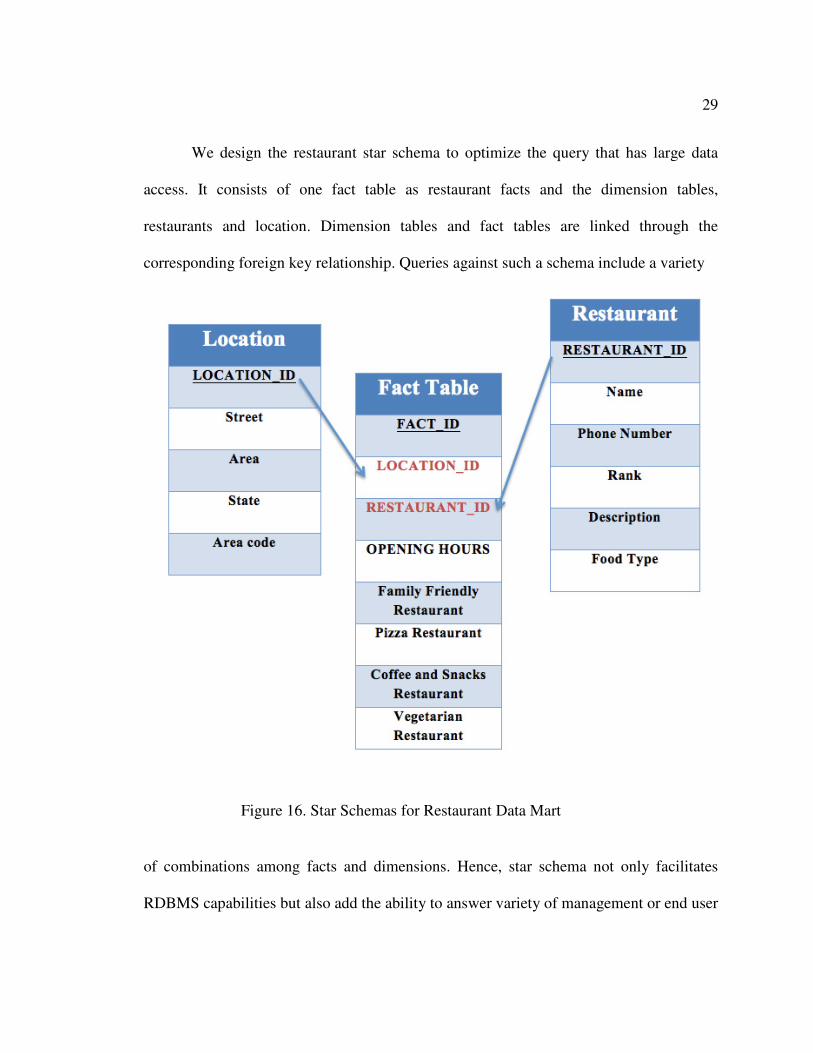
We design the restaurant star schema to optimize the query that has large data
access. It consists of one fact table as restaurant facts and the dimension tables,
restaurants and location. Dimension tables and fact tables are linked through the
corresponding foreign key relationship. Queries against such a schema include a variety
of combinations among facts and dimensions. Hence, star schema not only facilitates
RDBMS capabilities but also add the ability to answer variety of management or end user
Figure 16. Star Schemas for Restaurant Data Mart
30
questions [2].Figure 16 show the initial design of data mart for the restaurant data
warehouse design in the form of star schema.
After designing the star schema, we show the demo to call yelp web services to
get the restaurant data based on the parameter passed. Mobile application integrates with
Yelp dataset by calling web service, which returns the response in JSON format. Mobile
application parses the JSON format data and retrieves the result. The sample response in
JSON format that web service is explained in appendix A.
5.2 Data Mart Refinement
Data warehouse first demonstration gives the end users the facility to extract the
restaurant data according the location name. Now let us suppose the end user wants to get
the data according to restricted miles from their current location. To get same data with
different request, we can use refinement process. Refinement helps meet additional user
requirements such as omission of old data values or integrate of new data source [10].
The main purpose of refinement is to get all the relevant data into the data mart in
conformance to the initially designed mode [5, 10]. Refinement helps to increase the
capability to answer more management questions, include missing data and expand the
model structure [5, 2, 10]. Refinement helps to answer the following user’s query in the
restaurant data mart:
1. How far is the restaurant from his current location?
2. How many restaurants are open in my area?
3. How many restaurants are open within the nearby location?
31
4. How many restaurants are there within specific miles?
Data refinement process is critical because we iterate the steps on the initial
design to refine the model with more relevant subject area. Refinement process includes
the major steps of adding new dimensional table, refining fact table, and refining the data
model, which describes in this chapter in detail.
Step 1: New addition in design
From the refinement process we discuss previous, we learn that capturing
historical data and process of interviewing helps us to get relevant information to subject
area. Here, in our case study, we need to know user's location to get more information
about restaurants as a user perspective and user's feedback as a manager perspective to
improve the management and restaurant rank.
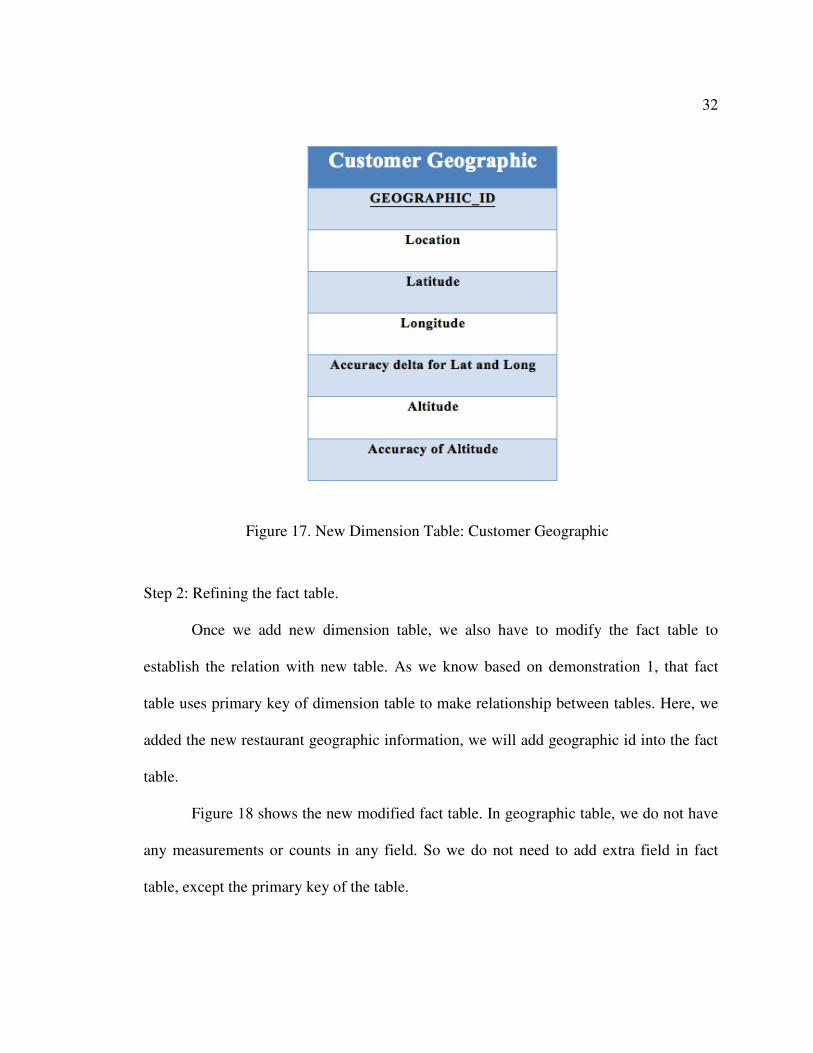
We design the new dimension table for users review the same fashion as we did
for restaurant and location in first demo. A customer geographic dimension may require
the attribute like, location, altitude, latitude, Accuracy of latitude and longitude, Altitude,
Accuracy of altitude, radius filter. Figure 17 shows the new dimension table which we
added for restaurants geographical information.
Geographic location table helps to get restaurant information based on user’s
current location. For our demo, we will retrieve the restaurants in maximum 20 miles
from the user’s location. For that device should have internet access. Here, we add one
dimension table based on our requirements, but sometime it may be required to add
multiple dimension tables.
32
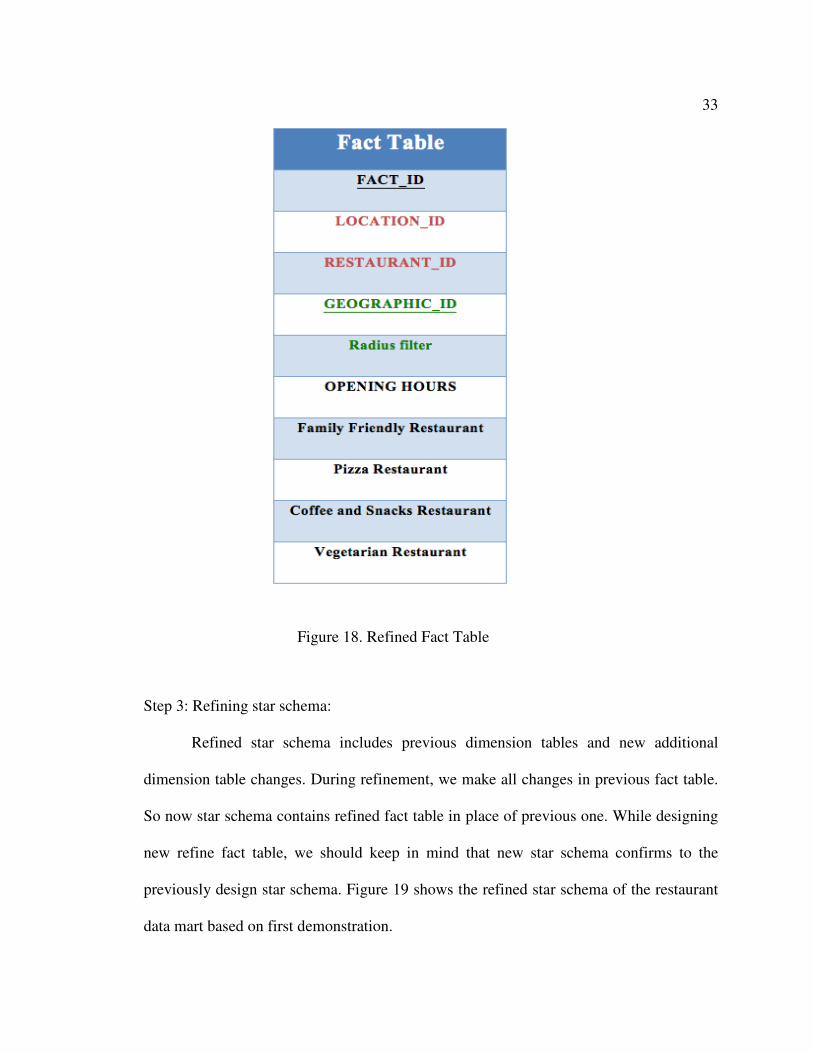
Step 2: Refining the fact table.
Once we add new dimension table, we also have to modify the fact table to
establish the relation with new table. As we know based on demonstration 1, that fact
table uses primary key of dimension table to make relationship between tables. Here, we
added the new restaurant geographic information, we will add geographic id into the fact
table.
Figure 18 shows the new modified fact table. In geographic table, we do not have
any measurements or counts in any field. So we do not need to add extra field in fact
table, except the primary key of the table.
Figure 17. New Dimension Table: Customer Geographic
33
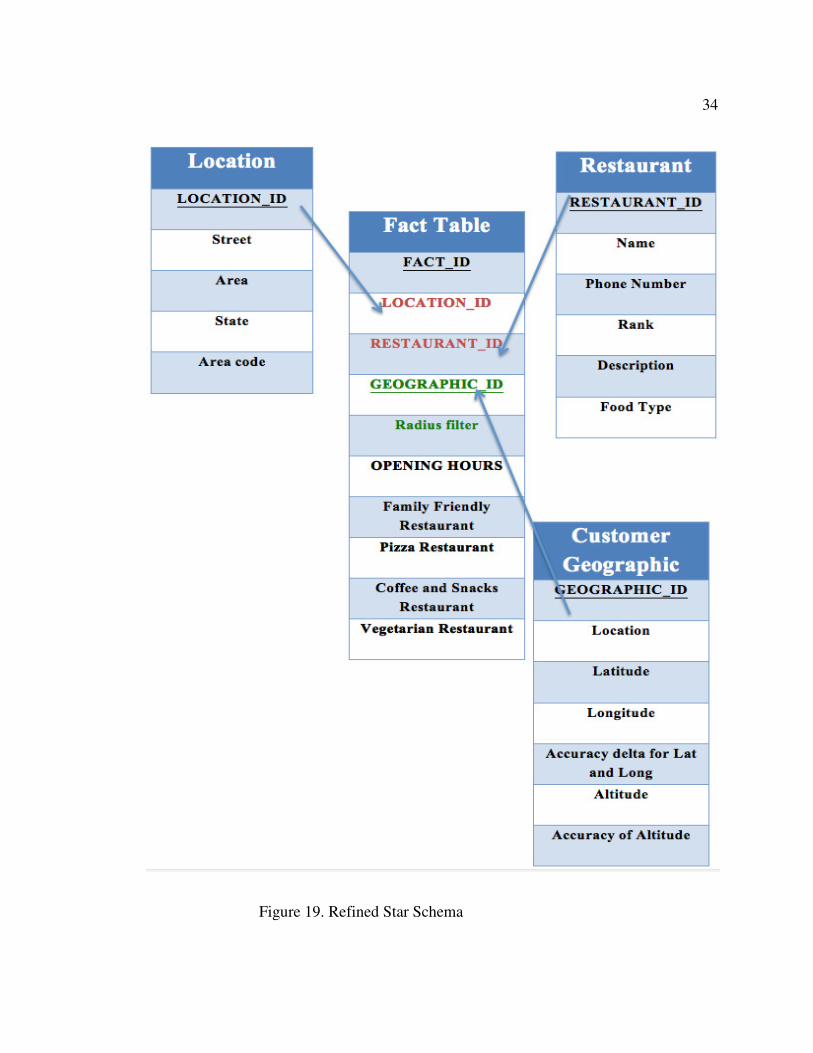
Step 3: Refining star schema:
Refined star schema includes previous dimension tables and new additional
dimension table changes. During refinement, we make all changes in previous fact table.
So now star schema contains refined fact table in place of previous one. While designing
new refine fact table, we should keep in mind that new star schema confirms to the
previously design star schema. Figure 19 shows the refined star schema of the restaurant
data mart based on first demonstration.
Figure 18. Refined Fact Table
34
Figure 19. Refined Star Schema
After refining the data mart, not the data warehouse design can helps the end
users to get restaurant information
particular mile from their current location. This nearby features is very helpful for end
users, because mostly we need restaurant information when we are new to particular are
and we do not have more detail about particular location. This information also helps
management people to keep track of the restaurants if any new is open.
the resultant demo after refinement process.
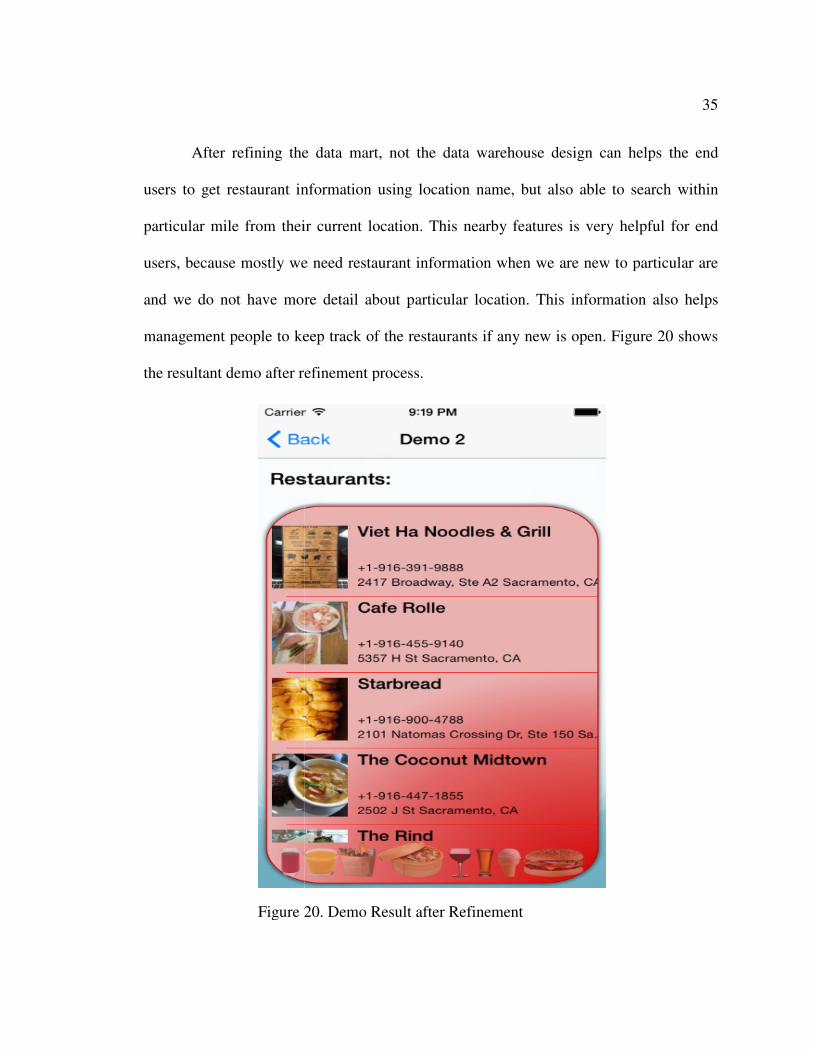
Figure 20. Demo Result after Refinement
refining the data mart, not the data warehouse design can helps the end
get restaurant information using location name, but also able to search within
particular mile from their current location. This nearby features is very helpful for end
because mostly we need restaurant information when we are new to particular are
have more detail about particular location. This information also helps
management people to keep track of the restaurants if any new is open.
e resultant demo after refinement process.
Figure 20. Demo Result after Refinement
35
refining the data mart, not the data warehouse design can helps the end
using location name, but also able to search within
particular mile from their current location. This nearby features is very helpful for end
because mostly we need restaurant information when we are new to particular are
have more detail about particular location. This information also helps
Figure 20 shows
36
5.3 EDW: Enterprise Data Warehouse
Section 5.2 and 5.2 includes the three of the major concept of data warehouse,
fundamentals of data warehouse, interviewing for data warehousing and data warehouse
design solutions. This section will cover another major concept, building the enterprise
data warehouse. EDW consolidates data from multiple sources in support of business
requirements wide decision making and related information needs such as reporting,
analysis, and planning [2, 8, 10]. The design process clarifies how to expand the
dimensional modeling design over an enterprise and conform to the design of restaurant
data warehouse.
The EDW (enterprise data warehouse) mainly integrates data from various
systems. This data in combination is more valuable and can satisfy user queries that are
unanswerable by any other operational system. The EDW updates the data periodically.
Consequently, the underlying architecture of the EDW develops a query processing
support offering efficiency and performance to the data warehouse [10, 2]. The major
steps of the enterprise data warehouse is shows in figure 21.
Step 1: Incremental approach
Initially there was a traditional approach fir EDW design, where a large
comprehensive design be completed before loading the data. Which was mainly the
reason of failure because loading the data in final stage creates major issues and rework if
does not work. Another approach was to build the subject area at a time and load the first
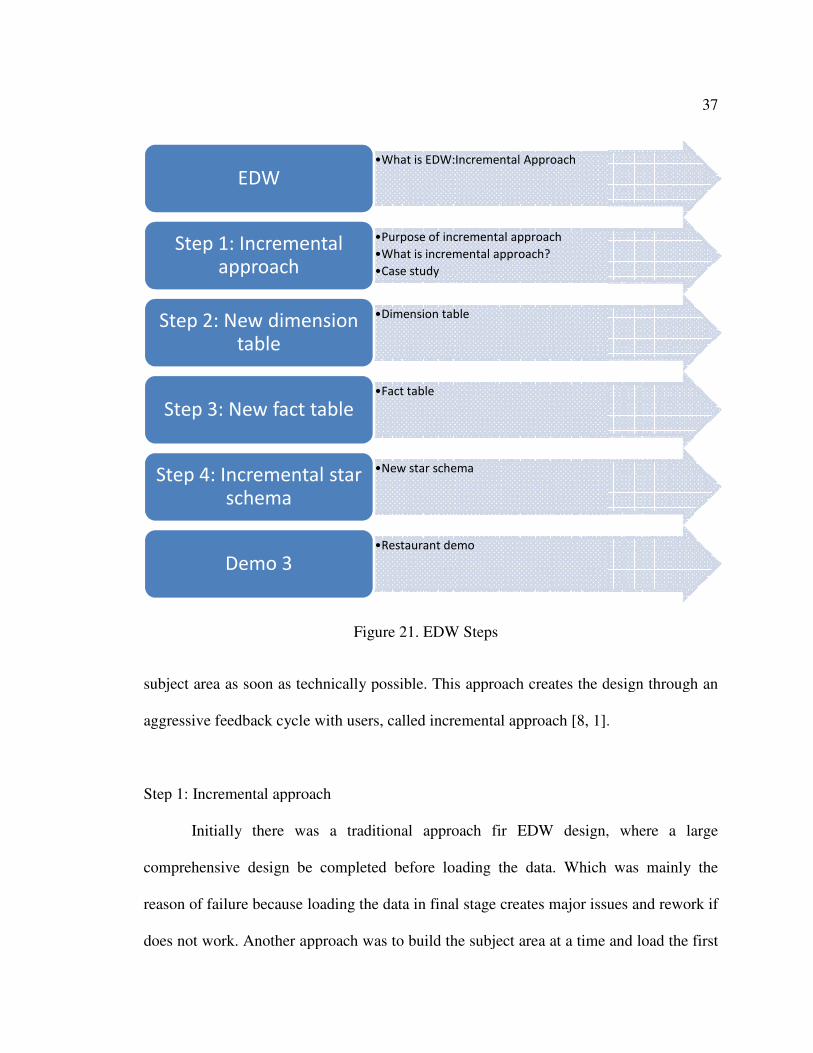
subject area as soon as technically possible. This approach creates the design through an
aggressive feedback cycle with users, called incremental approach [8, 1].
Step 1: Incremental approach
Initially there was a t
comprehensive design be completed before loading the data. Which was mainly the
reason of failure because lo
does not work. Another approach w
EDW
Step 1: Incremental
approach
Step 2: New dimension
table
Step 3: New fact table
Step 4: Incremental star
schema
Demo 3
subject area as soon as technically possible. This approach creates the design through an
aggressive feedback cycle with users, called incremental approach [8, 1].
Step 1: Incremental approach
Initially there was a traditional approach fir EDW design, where a large
comprehensive design be completed before loading the data. Which was mainly the
of failure because loading the data in final stage creates major issues and rework if
Another approach was to build the subject area at a time and load the first
Figure 21. EDW Steps
•What is EDW:Incremental Approach
•Purpose of incremental approach
•What is incremental approach?
•Case study
Step 1: Incremental
•Dimension tableStep 2: New dimension
•Fact table
Step 3: New fact table
•New star schemaStep 4: Incremental star
•Restaurant demo
37
subject area as soon as technically possible. This approach creates the design through an
aggressive feedback cycle with users, called incremental approach [8, 1].
raditional approach fir EDW design, where a large
comprehensive design be completed before loading the data. Which was mainly the
ding the data in final stage creates major issues and rework if
as to build the subject area at a time and load the first
38
subject area as soon as technically possible. This approach creates the design through an
aggressive feedback cycle with users, called incremental approach [8, 1].
Incremental approach merges different subject area in incremental way. If we
consider section 5.1 and 5.2, we took one subject area for searching the restaurant
information. However, when we design the data warehouse, searching for only restaurant
information is not only one main goal behind creating data warehouse. This data
warehouse should also helps the marketing, financial, sales and many more departments
of restaurant, to know summarized information, which can help to increase the
restaurant’s profit. End user is also interested to predict the rank and food review, which
helps to get the answer of following question:
1. How many customers where predicted to visit restaurants in next quarter?
2. What is customer’s review?
3. What are the average ratings of the restaurant?
4. What is the rank of the restaurants?
Adding the new subject area of customer information and review into the 2nd
demonstration helps to get to the incremental approach. Here, we use the dimension
modeling principles to increment the design for the restaurant EDW.
Step 2: New dimension table
To add new subject are into the previously build data mart, we may have to either
add new dimension table or have to make changes in previously designed table. Here, we
need information for restaurant visitors and their review. Here to get answer of the
39
question list mentioned in Step 1 needs restaurant and visitor’s information. Therefore, if
we use the same approach as we used in Section 5.1 and 5.2, we need mainly 3-
dimension table, restaurant, location and visitor’s information.
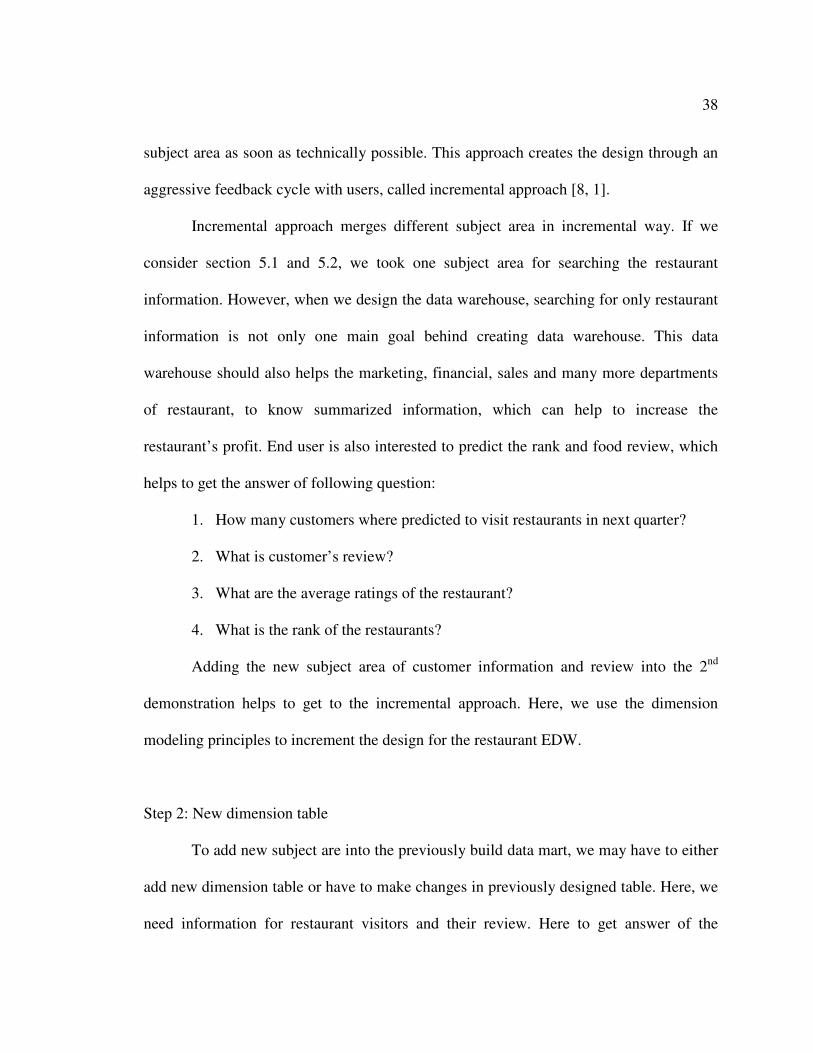
Restaurants and location table should be the same as in demonstration 1 and 2. Additional
review table is as shown in figure 22.
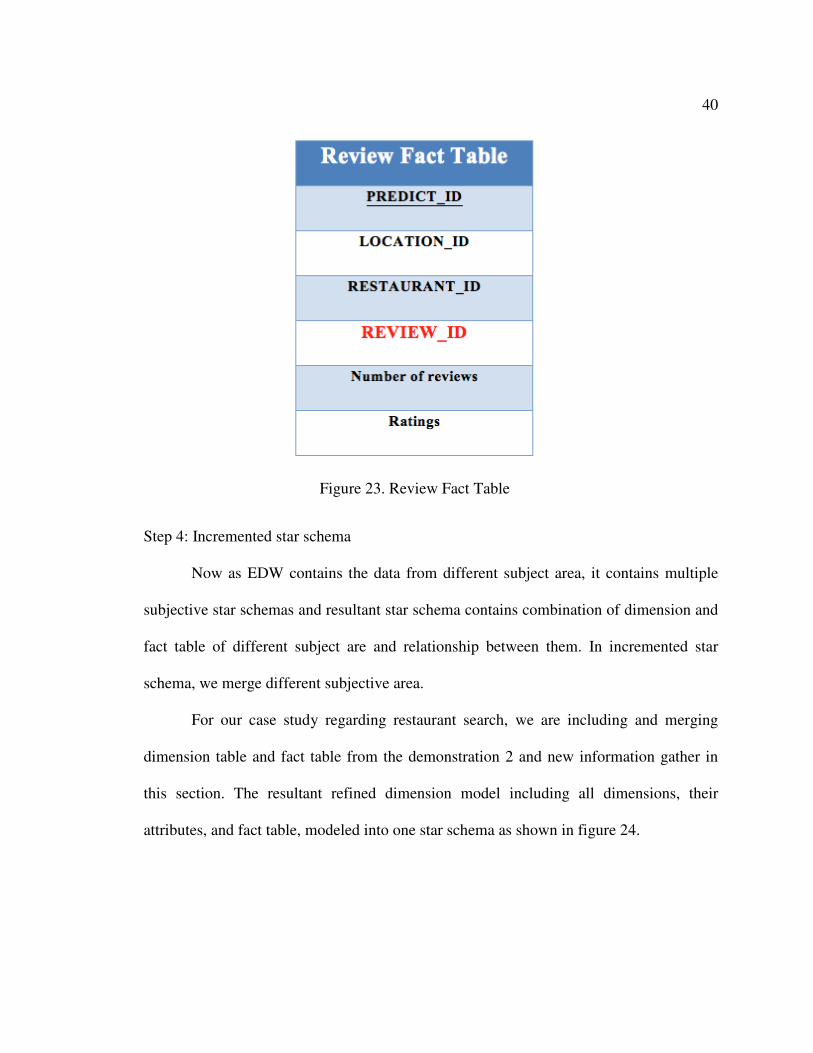
Step 3: New fact table
To predict the answer for different question related to restaurant management may
require creating separate fact table, which contains information like number of reviews,
average ratings, number of reviews of same ratings and many more. This information
also helps the management team to predict the next year profit and restaurants’ rank. In
addition to the fact table mentioned in section 5.2, we need the review fact table as shown
in figure 23.
Figure 22. Review Table
40
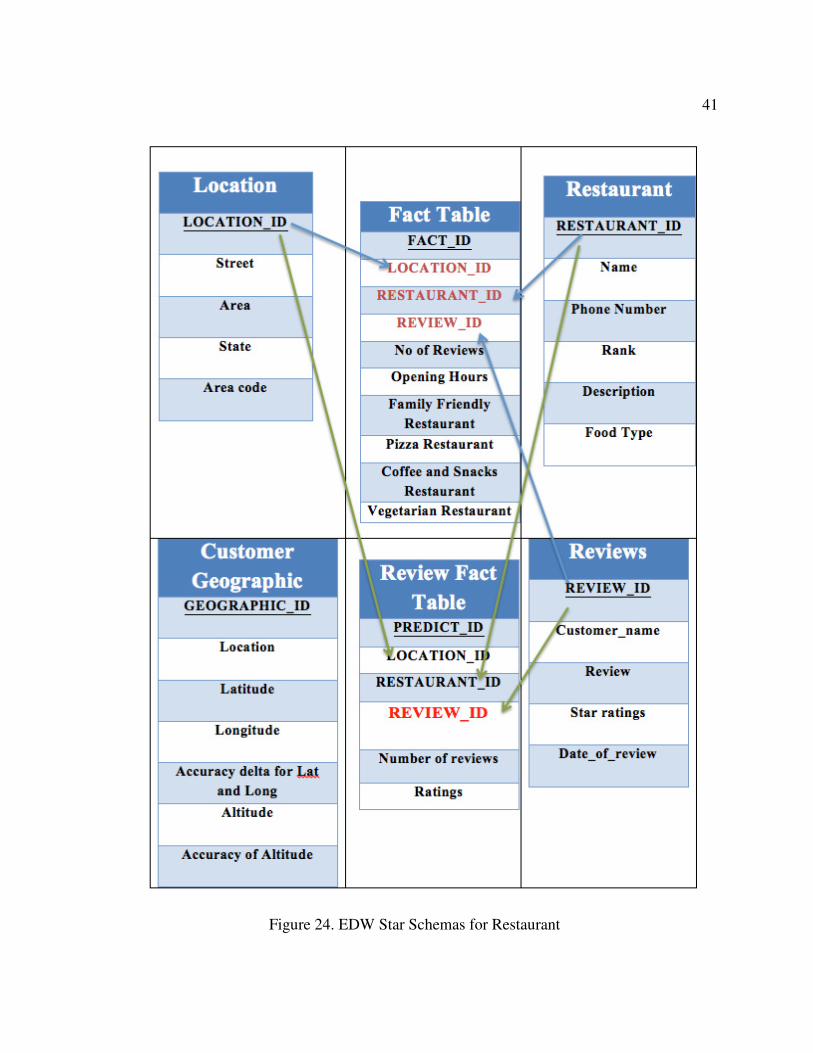
Step 4: Incremented star schema
Now as EDW contains the data from different subject area, it contains multiple
subjective star schemas and resultant star schema contains combination of dimension and
fact table of different subject are and relationship between them. In incremented star
schema, we merge different subjective area.
For our case study regarding restaurant search, we are including and merging
dimension table and fact table from the demonstration 2 and new information gather in
this section. The resultant refined dimension model including all dimensions, their
attributes, and fact table, modeled into one star schema as shown in figure 24.
Figure 23. Review Fact Table
41
Figure 24. EDW Star Schemas for Restaurant
42
This demonstration allows the end users to get visitor’s review with restaurants
information. In this section, we show how to build a series of interlocking star schema [4]
where each star schema corresponding to one subject area [10]. In next section, we
discuss the performance of the data warehouse and describe the performance
improvement techniques called aggregation.
5.4 Aggregation
As we seen from section 5.3, incremental approach is used to improve the data
warehouse. In incremental approach, we seen that fact table is being expanded and
becoming large. If fact table become larger and larger, query performance will get
degraded. Therefore, if we summarize this fact table, we can make tremendous benefits in
performance. This process of summarizing the fact table and getting very significant
effect on performance is called the aggregation. [11] Aggregation is the most powerful
weapon to improve the data warehouse performance. Aggregates are used in dimensional
models of the data warehouse to produce dramatic positive effects on the time it takes to
query large sets of data [1, 11, 13].
When we execute the query, which contains sum, max, total number, average, we
have to execute all rows even though the resultant values of these queries are not used as
a result. Sometime these queries also contain multiple requests, which take a lot of time
to execute the query. However, what if we have one summary table, which has number of
pre-calculated data rows for these types of queries instead of accessing all rows? We can
get better performance, right? This summary table is called the aggregate table. Because
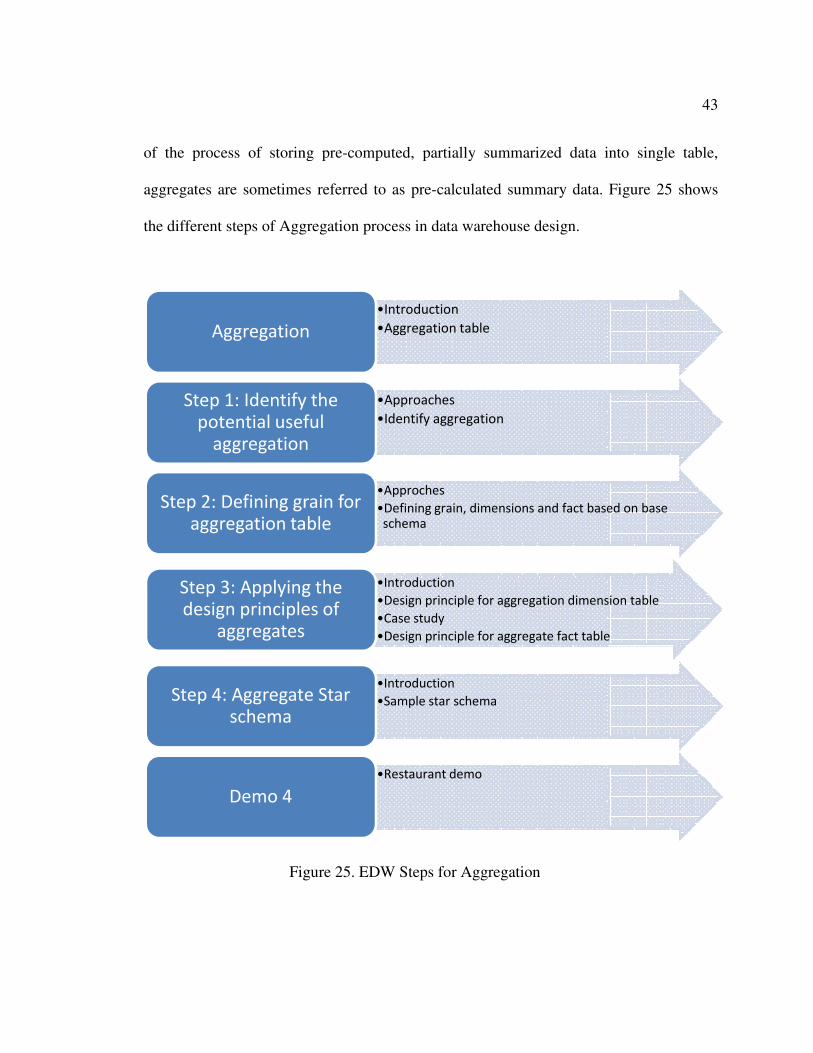
of the process of storing pre
aggregates are sometimes referred
the different steps of Aggregation process in data warehouse design.
Aggregation
Step 1: Identify the
potential useful
aggregation
Step 2: Defining grain for
aggregation table
Step 3: Applying the
design principles of
aggregates
Step 4: Aggregate Star
schema
Demo 4
Figure 25. EDW Steps for Aggregation
of the process of storing pre-computed, partially summarized data into single table,
aggregates are sometimes referred to as pre-calculated summary data.
the different steps of Aggregation process in data warehouse design.
•Introduction
•Aggregation tableAggregation
•Approaches
•Identify aggregation
Step 1: Identify the
potential useful
aggregation
•Approches
•Defining grain, dimensions and fact based on base
schema
Step 2: Defining grain for
aggregation table
•Introduction
•Design principle for aggregation dimension table
•Case study
•Design principle for aggregate fact table
Step 3: Applying the
design principles of
aggregates
•Introduction
•Sample star schemaStep 4: Aggregate Star
•Restaurant demo
Figure 25. EDW Steps for Aggregation
43
computed, partially summarized data into single table,
Figure 25 shows
Defining grain, dimensions and fact based on base
Design principle for aggregation dimension table
Design principle for aggregate fact table
44
Step1: Identify the potential useful aggregates.
There are different approaches for aggregation: no aggregation, selective
aggregation, and exhaustive aggregation. In some cases, the volume of data in the fact
table will be small enough that performance is acceptable without aggregates. That time
we do not need to go through the aggregation process. However, in a typical data
warehousing, the data volumes will be large enough that this will not be the case.
Other approach is exhaustive approach. Though this approach gives optimal query
result, as it requires minimum no. Of rows to execute, this approach is not practically
used because the processing required producing all possible aggregates and the storage
required storing them [11]. For example, if we have two dimension table: Location and
Restaurant, we have total no. of aggregates = no. of columns into Location table * no. of
columns into Restaurant table => 4*5=20.
Creating a large number of aggregates will take a lot of processing time, even on a
large system. So identify the potential useful aggregates are the preferred approach.
Interview and base schema serves the best source for finding the aggregates.
In our case study of restaurant data warehouse, we can find the aggregates into
base schema at different places:
- During the base schema design, different numerous values give clues to
potentially valuable aggregates.
- The next place to look is base schema itself. Looking at fact tables that will
be used together in “drill-across” reports will suggest aggregates that are quite
likely to be among the most valuable [11].
45
- Last, once our base schema is in production, we can consult a large number of
new artifacts as existing reports and their summary pages.
Step2: Defining the grain, fact and dimensions based on the base schema
A more common use of aggregates is to take a dimension and change the
granularity of this dimension. When changing the granularity of the dimension the fact
table has to be partially summarized to fit the new grain of the new dimension, thus
creating new dimensional and fact tables, fitting this new level of grain [14]. Here, we
have seen that the aggregate schema is nothing more than a star schema itself, differing
from the base schema only in terms of its dimensional grain.
Step 3: Applying the design principles of aggregates
When we aggregate dimension, we should keep some of the information in mind
as following:
- Must be a perfect subset of attributes from a base dimension except its key.
- The values taken on by attributes of the aggregate dimension must be identical
to those present in the base dimension.
- There must be exactly one row in the aggregate dimension that corresponds to
each combination of its attribute values in the base dimension, and no others.
In our case study of restaurant data warehouse, we should identify the dimensions
of the aggregate table accordingly. The dimensions are derived from or are same as the
base dimensions: Location, restaurant and review. According to the management
46
requirements of aggregates, we derive these dimensions. For location, if we are doing
aggregates with area code, we need not required to store other information as each
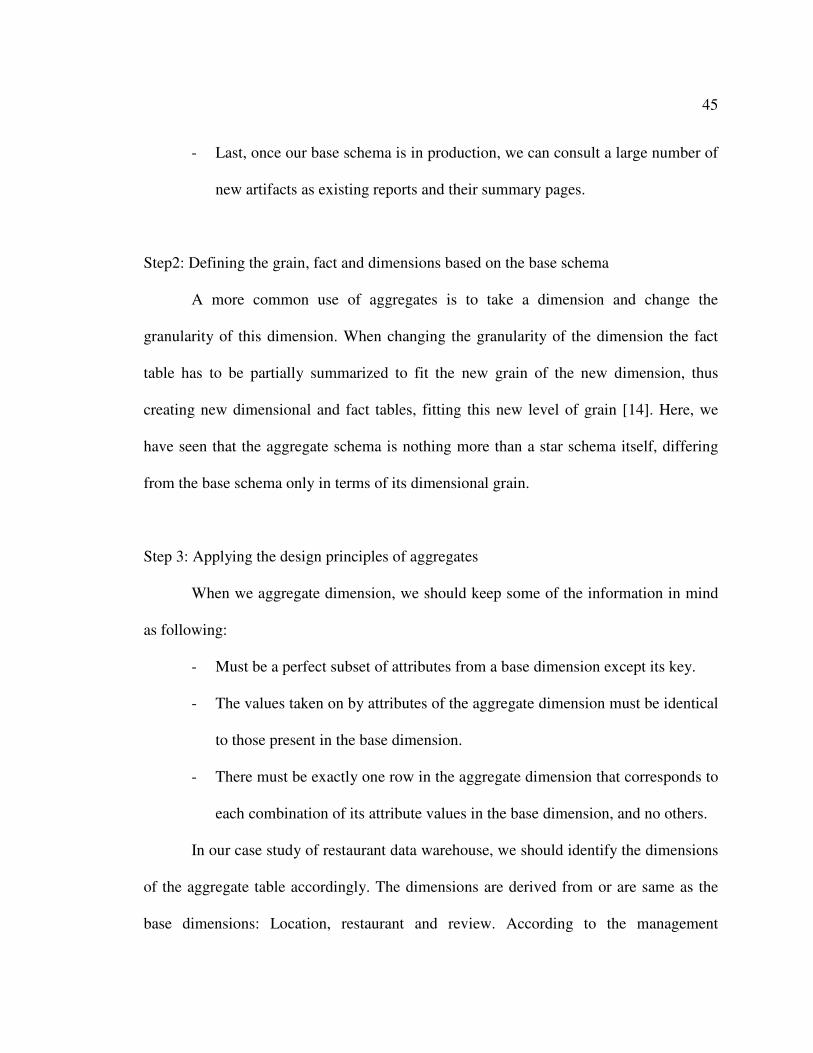
country has unique area code for each area. In review table, we save review and ratings
both. But when we show the list of restaurants, we need only ratings and review. Here,
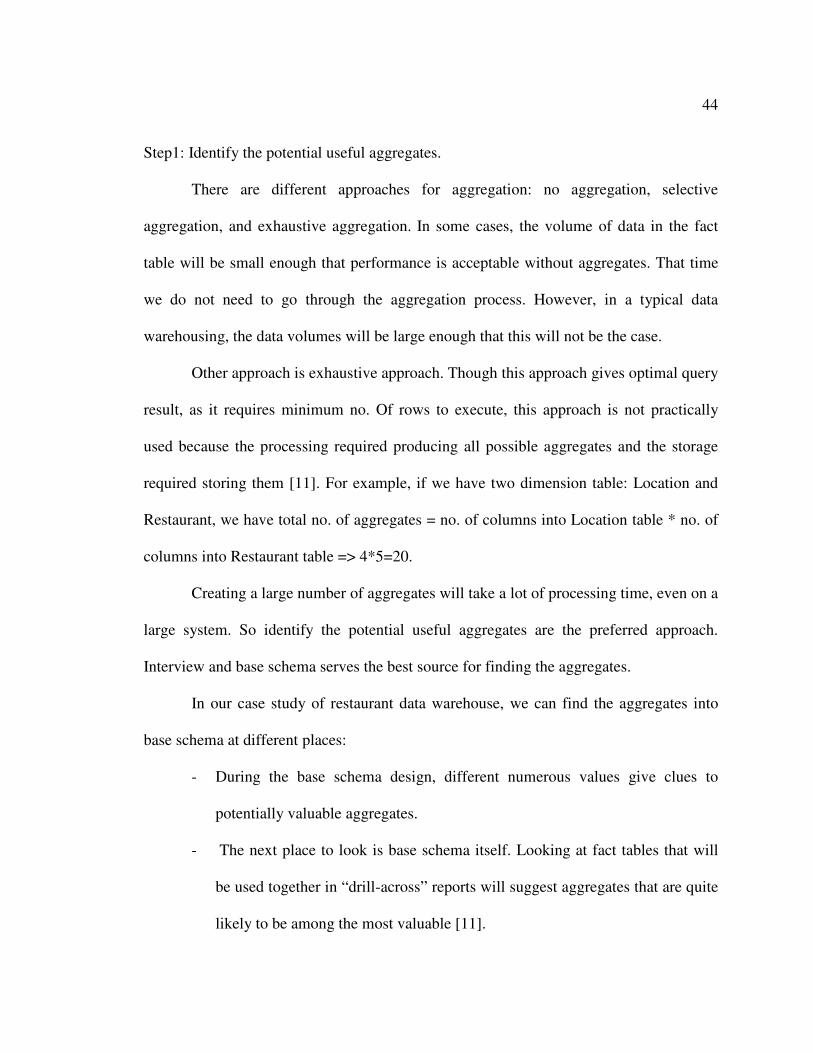
we can remove review content and date. Figure 26 and figure 27 shows the dimension
tables of location and review respectively after applying aggregation principles.
Same way as dimension table, we should also some of the basic principles when
we build aggregate fact table. Aggregate fact table is similar to base fact table except that
the facts are the aggregate values. Some of the points we should consider while designing
the fact table are as following:
- The main attributes present in a fact table are the facts and foreign keys to the
dimensions.
- Grain of the fact table should dictate the dimension key.
- Each aggregate fact should summarize a fact from the base fact table.
Figure 27. Dimension Table: Review Figure 26. Dimension Table: Location
47
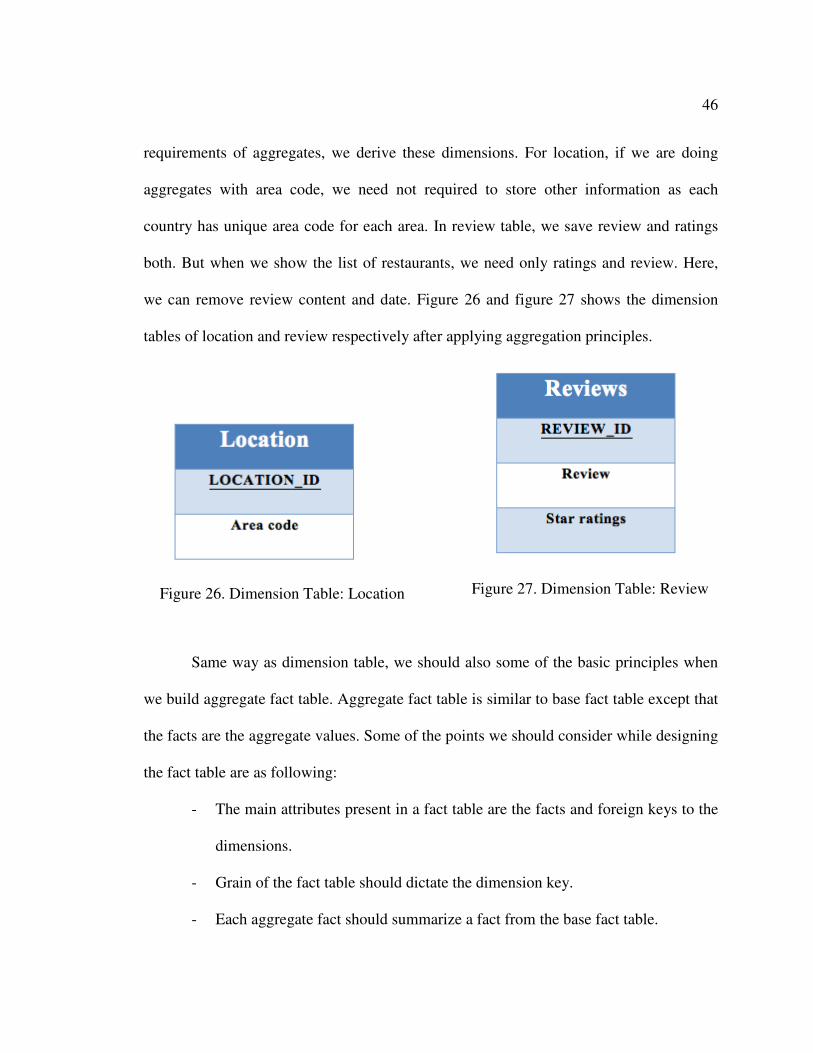
- Unlike dimension table, the aggregate fact may have a different data type that
its counterpart in the base schema (the number may be much larger)
Figure 28 shows the aggregate fact table of restaurant data warehousing.
Step 4: Aggregate star schema
An aggregate star schema is similar to base schema with aggregate fact table and
base or aggregate dimension table. For our case study of restaurant, Figure 28 shows the
aggregate star schema.
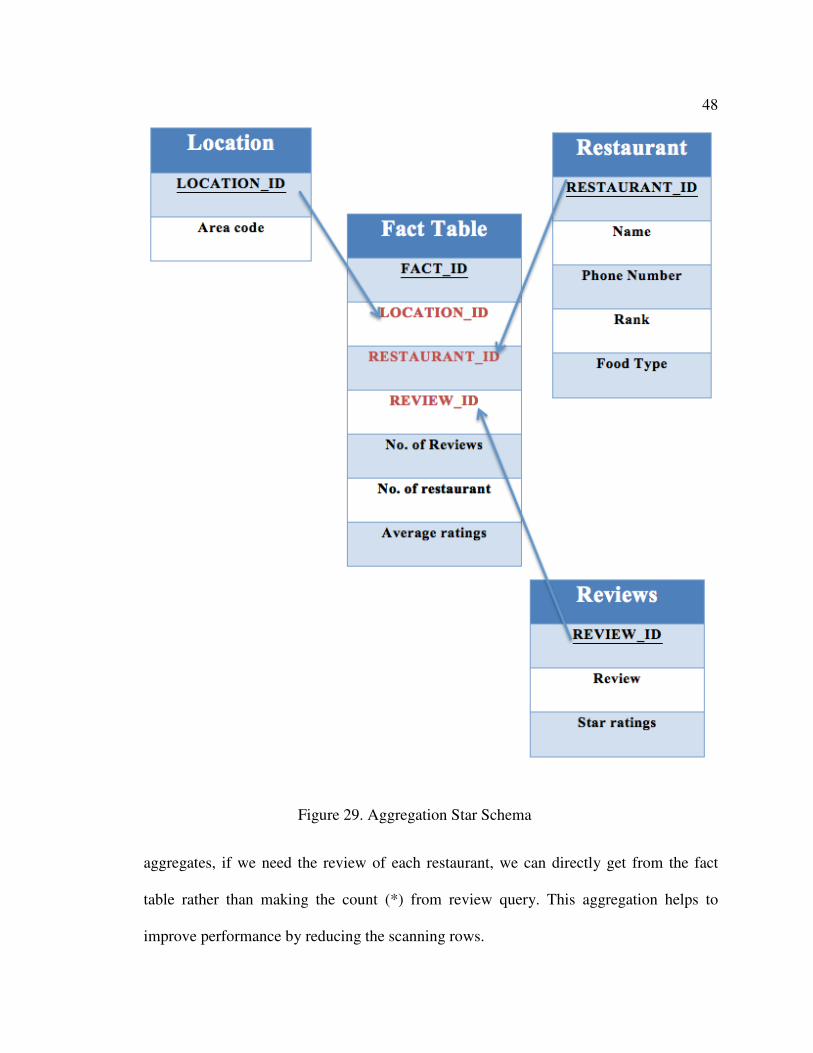
From the resultant schema show in figure 29, we can see that now the number of
review is in fact table rather than counting from review table. Aggregate fact table stores
the pre-aggregated value which otherwise are aggregated during query execution. After -
Figure 28. Aggregation Fact Table
48
aggregates, if we need the review of each restaurant, we can directly get from the fact
table rather than making the count (*) from review query. This aggregation helps to
improve performance by reducing the scanning rows.
Figure 29. Aggregation Star Schema
49
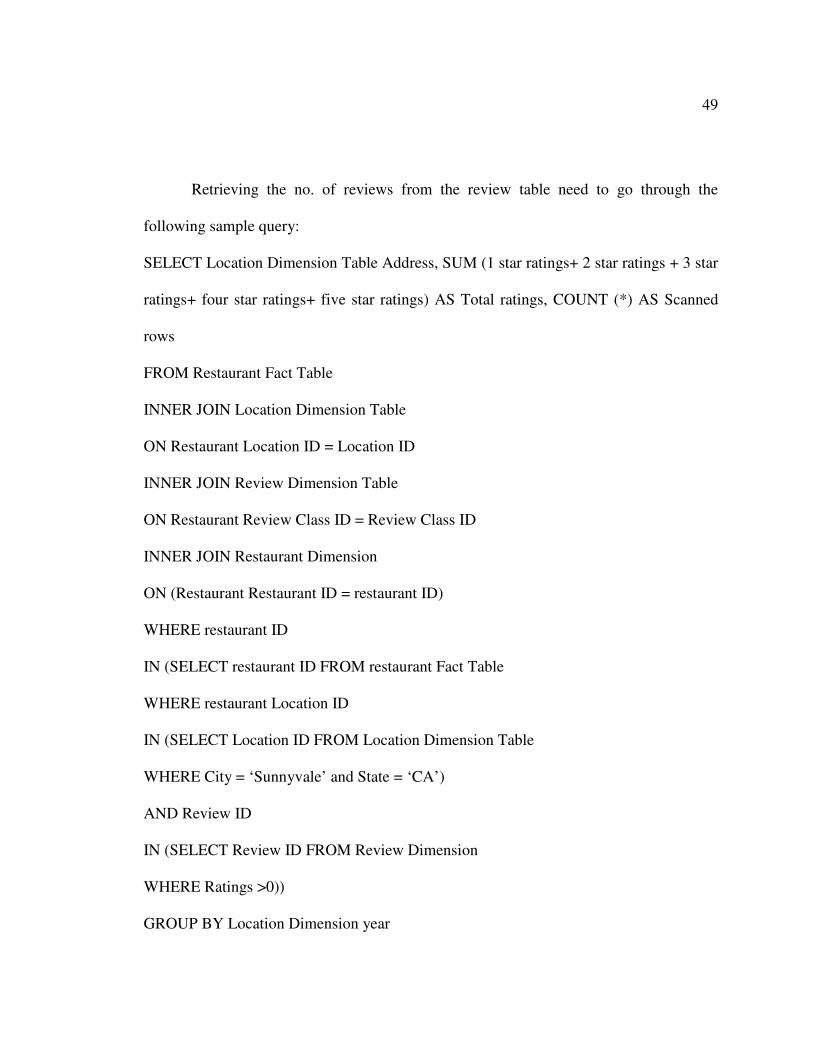
Retrieving the no. of reviews from the review table need to go through the
following sample query:
SELECT Location Dimension Table Address, SUM (1 star ratings+ 2 star ratings + 3 star
ratings+ four star ratings+ five star ratings) AS Total ratings, COUNT (*) AS Scanned
rows
FROM Restaurant Fact Table
INNER JOIN Location Dimension Table
ON Restaurant Location ID = Location ID
INNER JOIN Review Dimension Table
ON Restaurant Review Class ID = Review Class ID
INNER JOIN Restaurant Dimension
ON (Restaurant Restaurant ID = restaurant ID)
WHERE restaurant ID
IN (SELECT restaurant ID FROM restaurant Fact Table
WHERE restaurant Location ID
IN (SELECT Location ID FROM Location Dimension Table
WHERE City = ‘Sunnyvale’ and State = ‘CA’)
AND Review ID
IN (SELECT Review ID FROM Review Dimension
WHERE Ratings >0))
GROUP BY Location Dimension year
50
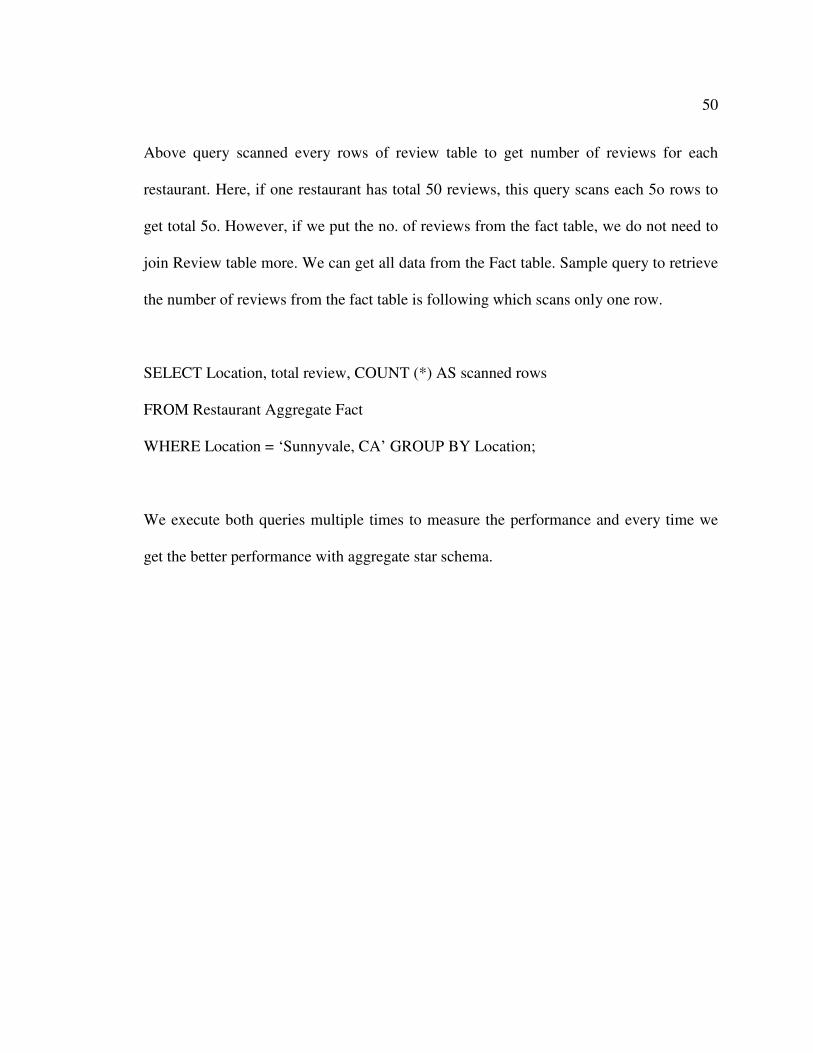
Above query scanned every rows of review table to get number of reviews for each
restaurant. Here, if one restaurant has total 50 reviews, this query scans each 5o rows to
get total 5o. However, if we put the no. of reviews from the fact table, we do not need to
join Review table more. We can get all data from the Fact table. Sample query to retrieve
the number of reviews from the fact table is following which scans only one row.
SELECT Location, total review, COUNT (*) AS scanned rows
FROM Restaurant Aggregate Fact
WHERE Location = ‘Sunnyvale, CA’ GROUP BY Location;
We execute both queries multiple times to measure the performance and every time we
get the better performance with aggregate star schema.
51
Chapter 6
EVALUATION
In the earlier chapter, we describe the complete process of the implementing a
mobile application for data warehouse courseware. In this chapter, we will describe the
assessment result of the project. The success of the project depends on the use of the
application. As a part of this project, we carried out a study on testing the effectiveness of
the courseware tool.
My professor, Dr Meiliu Lu, wants to use this application as supplementary part
into the CSC 177: Data warehousing and data mining at California State University as a
learning tool to implement term project. This class is for the upper division of the
undergrad and graduate students of the computer science department. We show my
projects to some of the graduate students and take their feedback. I also talked to my
friends group, who is not familiar with data warehouse. Their feedback is also very
important because this application is for beginners who do not have basic knowledge of
data warehouse.
We achieved the positive feedback from the students and other technical people.
They found that this courseware is very handy, easy accessible and helpful to understand
the data warehousing process. They are very impressed with the example taken to explain
the process. This project is available in tune: https://itunes.apple.com/us/app/data-
warehouse-courseware/id979090468?ls=1&mt=8.
We did not get chance to take feedback from the students of the class CSC 177,
because this course is not available to register for this spring semester, but the previous
52
application’s, which is already implemented by other students, feedback helps me to
evaluate their interest and needs from this project. I understand that when they start the
data warehouse project, they may understand the project steps, but they do not know form
where to start the project. Once the data set is get, how should we evaluate that data set to
implement the data warehouse technique? This question helps me to improve my
application and add some data pre-processing steps. I add the process of data cleaning
and pre-processing steps to give them answer to their question.
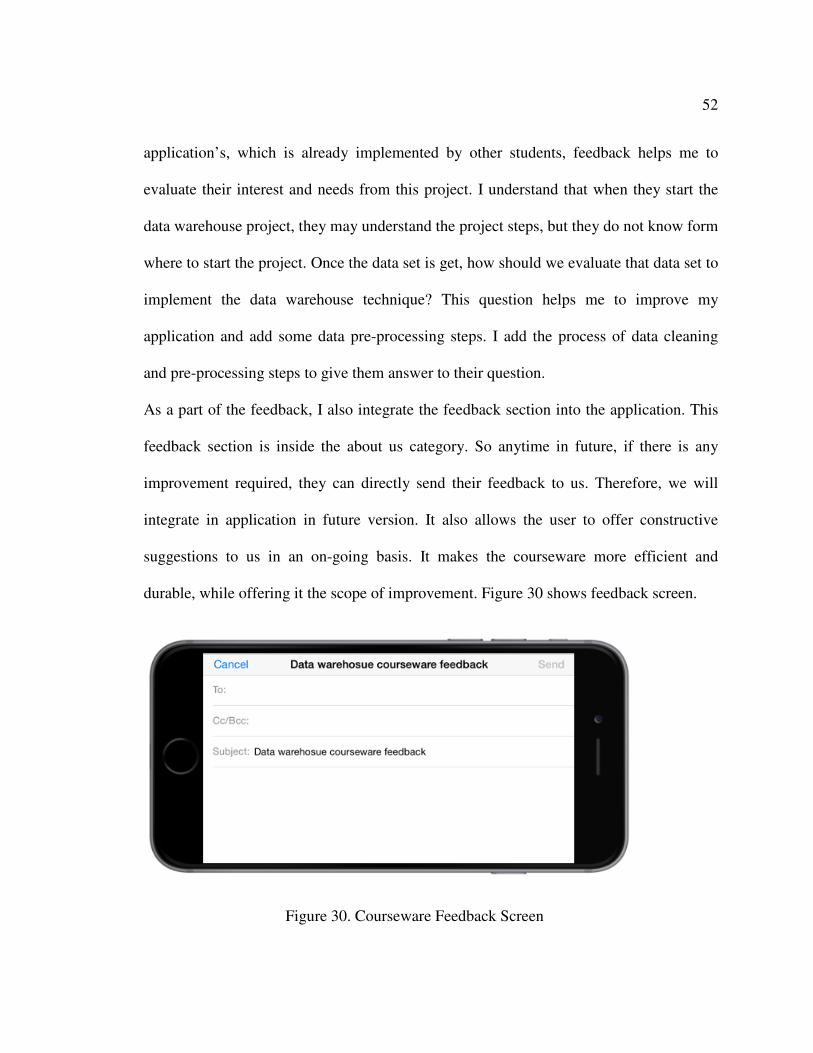
As a part of the feedback, I also integrate the feedback section into the application. This
feedback section is inside the about us category. So anytime in future, if there is any
improvement required, they can directly send their feedback to us. Therefore, we will
integrate in application in future version. It also allows the user to offer constructive
suggestions to us in an on-going basis. It makes the courseware more efficient and
durable, while offering it the scope of improvement. Figure 30 shows feedback screen.
Figure 30. Courseware Feedback Screen
53
Chapter 7
CONCLUSION
The purpose of a courseware is to deliver information related to specific topic and
improve readers learning. In this project, we have seen how this courseware will be
effective for the students learning concepts of data warehouse implementation. Although
there are other web based courseware available for data warehouse, but none of the
courseware is available yet for mobile application [5]. The main advantages of this
mobile-based courseware are the usefulness, accessibility and impressive examples.
Therefore, as a conclusion to this project report, we can say that we have achieved
primary goal defined at the initiation. This courseware provides theoretical concepts
related to data warehouse and implementation phase provides details on how to design
the data warehouse. It offers a systematic method to design a data warehouse using the
case based approach.
The courseware provides enormous amount of opportunity for
development. There are many areas for the future research to extending this project. We
implemented this project for IOS technology, which works on Apple products like iPad,
iPhone and iPod. However, there is not any courseware available for android phones. So
the future researcher can make Android version of this project with stronger case study
examples. In the next version of this project, we can implement the sharing quiz result on
social websites for encourage students to use this application and learn the technology.
54
APPENDIX A
WEB SERVICE INTRODUCTION
Web services describe the standardized way to integrate same business logic with
multiple devices, running on different platform and frameworks, using internet protocols.
On the conceptual level, a service is a software component provided through a network
[14] and uses messages to exchange invocation request and response information using
XML, JSON and html format. Mainly two types of web services are implemented: (1)
SOAP Based web service and (2) Rest full web services. The major difference between
this two web service is in request and reply format. For yelp web services integration
[15], we use Restful web service. The primary purpose of Restful web service is to
manipulate XML or JSON representation of web resources using HTTP stateless
protocol.
Yelp web service is Authentication based web service and have to follow the
required constrains while applying. The complete guide for Yelp web service integration
is written on Yelp developer site. We made the following sample request and reply web
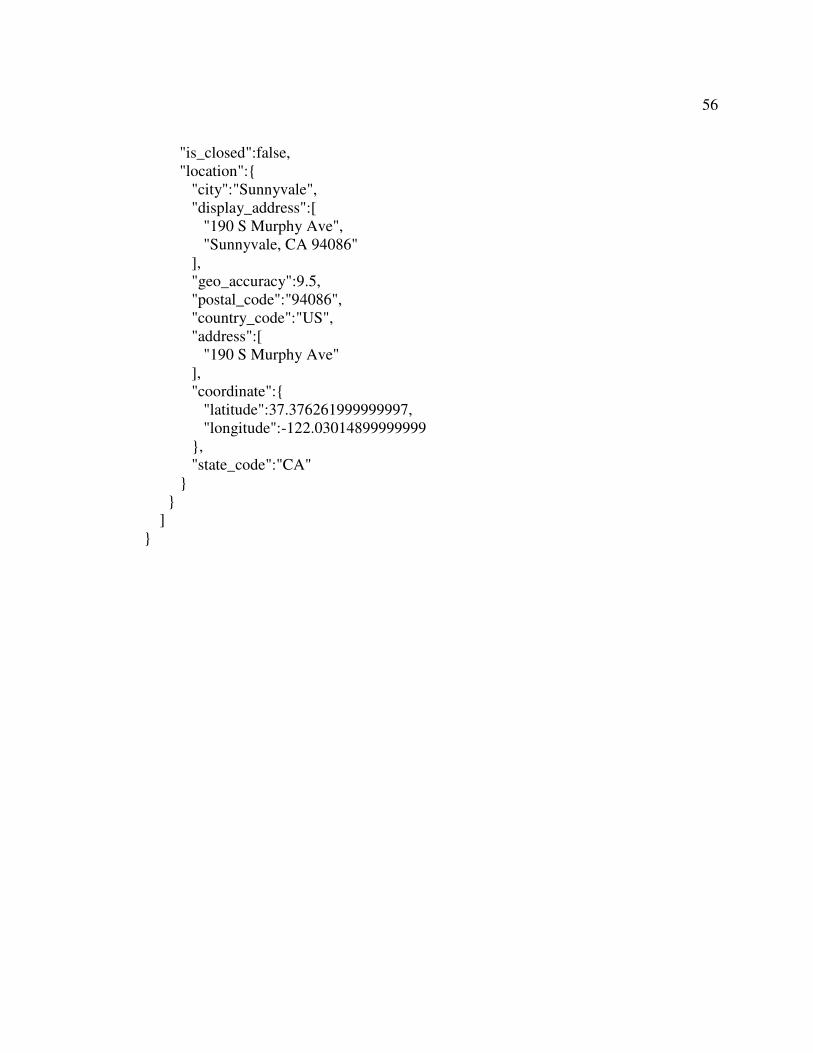
service call. Request is done using URL and Response is in JSON format.
Request:
http://api.yelp.com/v2/search?term=food&location=San+Francisco
Response:
{
"region":{
"span":{
"latitude_delta":0.063848983027611439,
"longitude_delta":0.086716023612893878
},
"center":{
55
"latitude":37.365325464358449,
"longitude":-122.03313362563051
}
},
"total":4941,
"businesses":[
{
"is_claimed":true,
"rating":4.5,
"mobile_url":"http://m.yelp.com/biz/dishdash-sunnyvale",
"rating_img_url":"http://s3-
media2.fl.yelpcdn.com/assets/2/www/img/99493c12711e/ico/stars/v1/stars_4_half.png",
"review_count":2575,
"name":"DishDash",
"snippet_image_url":"http://s3-
media3.fl.yelpcdn.com/photo/X_sitfjvk8ZOBzqikOG3xw/ms.jpg",
"rating_img_url_small":"http://s3-
media2.fl.yelpcdn.com/assets/2/www/img/a5221e66bc70/ico/stars/v1/stars_small_4_half.
png",
"url":"http://www.yelp.com/biz/dishdash-sunnyvale",
"menu_date_updated":1387608734,
"phone":"4087741889",
"snippet_text":"Nom Nom Nom!\n\nMy favorites:\n-
Chicken Shawarma Appetizer \n-
Zahra, either vegetarian or with Cubed Chicken (it comes with Lamb but I'm not a big L
amb...",
"image_url":"http://s3-
media3.fl.yelpcdn.com/bphoto/YZuhZsHC8alkVb47MZMUgg/ms.jpg",
"categories":[
[
"Middle Eastern",
"mideastern"
],
[
"Mediterranean",
"mediterranean"
]
],
"display_phone":"+1-408-774-1889",
"rating_img_url_large":"http://s3-
media4.fl.yelpcdn.com/assets/2/www/img/9f83790ff7f6/ico/stars/v1/stars_large_4_half.p
ng",
"menu_provider":"single_platform",
"id":"dishdash-sunnyvale",
56
"is_closed":false,
"location":{
"city":"Sunnyvale",
"display_address":[
"190 S Murphy Ave",
"Sunnyvale, CA 94086"
],
"geo_accuracy":9.5,
"postal_code":"94086",
"country_code":"US",
"address":[
"190 S Murphy Ave"
],
"coordinate":{
"latitude":37.376261999999997,
"longitude":-122.03014899999999
},
"state_code":"CA"
}
}
]
}
57
APPENDIX B
SOURCE CODE
Source code for the mobile application and web service integration is contained in
attached CD-ROM. The technology used for mobile application is Objective C and
SQLite database. For web service integration, we use PHP.
58
BIBLIOGRAPHY
1. Data Warehousing and Business Intelligent. Introduction to Data Warehousing
Concepts.
Available at:
http://docs.oracle.com/database/121/DWHSG/concept.htm#DWHSG001,
[Accessed 27 April 2015]
2. Jiawei Han. Data Mining: Concepts and Techniques, 3rd Edition, Morgan
Kaufmann, 2011.
3. Data Warehouse. Data Warehouse info.
Available at: http://datawarehouse4u.info/.
[Accessed 01 May 2015]
4. Jenny Tsai. Oracle Business Intelligence Standard Edition One Tutorial Release 10g
(10.1.3.2.1).
Available at: http://docs.oracle.com/cd/E10352_01/doc/bi.1013/e10312.pdf.
[Accessed 01 May 2015]
5. Alejandro Gutiérrez, Adriana Marotta, “An Overview of Data Warehouse Design
Approaches and Techniques”.
Available at:
http://www.fing.edu.uy/inco/grupos/csi/esp/Publicaciones/pub_csi2001/rt1_tecnicas
DisDW.pdf
[Accessed 01 May 2015]
59
6. IBM Redbooks. Data Modeling Techniques for Data Warehousing, 1st Edition, IBM,
1998.
7. Ralph Kimball and Margy Ross. The Data Warehouse Toolkit: The Complete Guide
to Dimensional Modeling, 2 Edition, Wiley, 2002.
8. Michael Venerable and Christopher Adamson. Data Warehouse Design Solutions,
2nd
Edition, Wiley, 1998.
9. IBM Redbooks. Data Modeling Techniques for Data Warehousing, 1st Edition, IBM,
1998.
10. A Courseware for Data Warehousing. A Courseware for Data Warehousing.
Available at: http://athena.ecs.csus.edu/~enroll/enrollDW/Intro.php.
[Accessed 02 May 2015].
11. Prof. Lu, 2014. CSc -177 Lecture Notes.
Available at: http://athena.ecs.csus.edu/~mei/177/csc177.html
[Accessed 02 May 2015].
12. Data Warehousing. Data Warehouse architecture.
Available at: http://www.1keydata.com/datawarehousing/data-warehouse-
definition.html
13. Apple Developer. Development Resources.
Available at: https://developer.apple.com/.
[Accessed 02 May 2015].
14. The Java EE 6 Tutorial. Part III Web Services
Available: http://docs.oracle.com/javaee/6/tutorial/doc/giqsx.html.

60
[Accessed 02 May 2015].
15. Yelp for Developers | Yelp. Yelp API.
Available at: https://www.yelp.com/developers.
[Accessed 02 May 2015].


![IoT 9 - Open CourseWare [CS Open CourseWare]](https://img.pdfslide.us/doc/110x75/61feb6c70c55f426d649252c/iot-9-open-courseware-cs-open-courseware.jpg)