Embed Size (px)
Citation preview
A Mitochondrial Protein CompendiumElucidates Complex I Disease BiologyDavid J. Pagliarini,1,2,3,9 Sarah E. Calvo,1,2,3,4,9 Betty Chang,3 Sunil A. Sheth,1,2,3,4 Scott B. Vafai,1,2
Shao-En Ong,3 Geoffrey A. Walford,1,2 Canny Sugiana,5 Avihu Boneh,5,6 William K. Chen,1,2
David E. Hill,7 Marc Vidal,7 James G. Evans,8 David R. Thorburn,5,6 Steven A. Carr,3,* and Vamsi K. Mootha1,2,3,*1Center for Human Genetic Research, Massachusetts General Hospital, Boston, MA 02114, USA2Department of Systems Biology, Harvard Medical School, Boston, MA 02446, USA3Broad Institute of MIT and Harvard, Cambridge, MA 02142, USA4Harvard-MIT Division of Health Sciences and Technology, Cambridge, MA 02139, USA5Murdoch Childrens Research Institute and Department of Paediatrics, University of Melbourne, Melbourne VIC 3052, Australia6Genetic Health Services Victoria, Royal Children’s Hospital, Melbourne VIC 3052, Australia7Center for Cancer Systems Biology (CCSB) and Department of Cancer Biology, Dana-Farber Cancer Institute,
and Department of Genetics, Harvard Medical School, Boston MA 02115, USA8Whitehead MIT BioImaging Center, Cambridge, MA 02139, USA9These authors contributed equally to this work
*Correspondence: [email protected] (S.A.C.), [email protected] (V.K.M.)
DOI 10.1016/j.cell.2008.06.016
SUMMARY
Mitochondria are complex organelles whose dys-function underlies a broad spectrum of human dis-eases. Identifying all of the proteins resident in thisorganelle and understanding how they integrateinto pathways represent major challenges in cellbiology. Toward this goal, we performed mass spec-trometry, GFP tagging, and machine learning to cre-ate a mitochondrial compendium of 1098 genes andtheir protein expression across 14 mouse tissues.We link poorly characterized proteins in this inven-tory to known mitochondrial pathways by virtue ofshared evolutionary history. Using this approach,we predict 19 proteins to be important for the func-tion of complex I (CI) of the electron transport chain.We validate a subset of these predictions using RNAi,including C8orf38, which we further show harbors aninherited mutation in a lethal, infantile CI deficiency.Our results have important implications for under-standing CI function and pathogenesis and, moregenerally, illustrate how our compendium can serveas a foundation for systematic investigations ofmitochondria.
INTRODUCTION
Mitochondria are dynamic organelles essential for cellular life,
death, and differentiation. Although they are best known for
ATP production via oxidative phosphorylation (OXPHOS), they
house myriad other biochemical pathways and are centers for
apoptosis and ion homeostasis. Mitochondrial dysfunction
causes over 50 diseases ranging from neonatal fatalities to
adult-onset neurodegeneration and is a likely contributor to
112 Cell 134, 112–123, July 11, 2008 ª2008 Elsevier Inc.
cancer and type II diabetes (DiMauro and Schon, 2003; Lowell
and Shulman, 2005; Wallace, 2005). The 13 proteins encoded
by the mitochondrial genome have been known since its se-
quencing (Anderson et al., 1981) and have been linked to a variety
of maternally inherited disorders. However, there may be as
many as 1500 nuclear-encoded mitochondrial proteins (Lopez
et al., 2000), though less than half have been identified with ex-
perimental support. A complete protein inventory for this organ-
elle across tissues would provide a molecular framework for the
investigation of mitochondrial biology and pathogenesis.
Recent progress in defining the mitochondrial proteome has
been driven by large-scale approaches, including mass spec-
trometry (MS)-based proteomics in mammals (Forner et al.,
2006; Foster et al., 2006; Johnson et al., 2007; Kislinger et al.,
2006; Mootha et al., 2003a; Taylor et al., 2003) and yeast (Rein-
ders et al., 2006; Sickmann et al., 2003), epitope tagging com-
bined with microscopy in yeast (Huh et al., 2003; Kumar et al.,
2002), and computation (Calvo et al., 2006; Emanuelsson
et al., 2000; Guda et al., 2004). However, each of these methods
suffers from intrinsic technical limitations. MS-based ap-
proaches struggle with distinguishing genuine mitochondrial
proteins from copurifying contaminants, and published reports
exhibit up to 41% false-positive rates (Table S1 available online).
Additionally, these approaches tend to miss low-abundance
proteins or those expressed only in specific tissues or develop-
mental states, and thus capture only 23%–40% of known
mitochondrial components (Table S1). Other experimental ap-
proaches such as epitope tagging are limited by the availability
of cDNA clones, tag interference, and overexpression artifacts.
Although integrative machine-learning methods can be more
comprehensive (Calvo et al., 2006; Jansen et al., 2003), they
require subsequent experimental validation.
Here, we perform in-depth protein mass spectrometry, mi-
croscopy, and machine learning to construct a protein compen-
dium of the mitochondrion. We perform MS-based proteomics
on both highly purified and crude mitochondrial preparations to
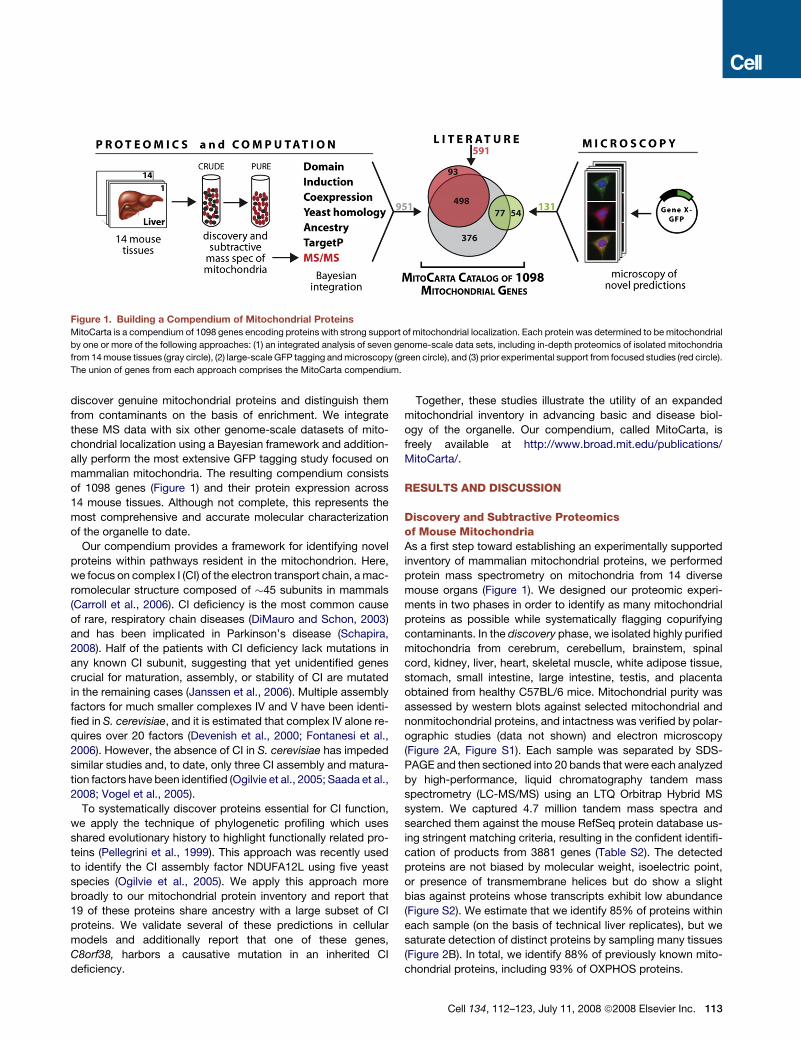
Figure 1. Building a Compendium of Mitochondrial Proteins
MitoCarta is a compendium of 1098 genes encoding proteins with strong support of mitochondrial localization. Each protein was determined to be mitochondrial
by one or more of the following approaches: (1) an integrated analysis of seven genome-scale data sets, including in-depth proteomics of isolated mitochondria
from 14 mouse tissues (gray circle), (2) large-scale GFP tagging and microscopy (green circle), and (3) prior experimental support from focused studies (red circle).
The union of genes from each approach comprises the MitoCarta compendium.
discover genuine mitochondrial proteins and distinguish them
from contaminants on the basis of enrichment. We integrate
these MS data with six other genome-scale datasets of mito-
chondrial localization using a Bayesian framework and addition-
ally perform the most extensive GFP tagging study focused on
mammalian mitochondria. The resulting compendium consists
of 1098 genes (Figure 1) and their protein expression across
14 mouse tissues. Although not complete, this represents the
most comprehensive and accurate molecular characterization
of the organelle to date.
Our compendium provides a framework for identifying novel
proteins within pathways resident in the mitochondrion. Here,
we focus on complex I (CI) of the electron transport chain, a mac-
romolecular structure composed of �45 subunits in mammals
(Carroll et al., 2006). CI deficiency is the most common cause
of rare, respiratory chain diseases (DiMauro and Schon, 2003)
and has been implicated in Parkinson’s disease (Schapira,
2008). Half of the patients with CI deficiency lack mutations in
any known CI subunit, suggesting that yet unidentified genes
crucial for maturation, assembly, or stability of CI are mutated
in the remaining cases (Janssen et al., 2006). Multiple assembly
factors for much smaller complexes IV and V have been identi-
fied in S. cerevisiae, and it is estimated that complex IV alone re-
quires over 20 factors (Devenish et al., 2000; Fontanesi et al.,
2006). However, the absence of CI in S. cerevisiae has impeded
similar studies and, to date, only three CI assembly and matura-
tion factors have been identified (Ogilvie et al., 2005; Saada et al.,
2008; Vogel et al., 2005).
To systematically discover proteins essential for CI function,
we apply the technique of phylogenetic profiling which uses
shared evolutionary history to highlight functionally related pro-
teins (Pellegrini et al., 1999). This approach was recently used
to identify the CI assembly factor NDUFA12L using five yeast
species (Ogilvie et al., 2005). We apply this approach more
broadly to our mitochondrial protein inventory and report that
19 of these proteins share ancestry with a large subset of CI
proteins. We validate several of these predictions in cellular
models and additionally report that one of these genes,
C8orf38, harbors a causative mutation in an inherited CI
deficiency.
Together, these studies illustrate the utility of an expanded
mitochondrial inventory in advancing basic and disease biol-
ogy of the organelle. Our compendium, called MitoCarta, is
freely available at http://www.broad.mit.edu/publications/
MitoCarta/.
RESULTS AND DISCUSSION
Discovery and Subtractive Proteomicsof Mouse MitochondriaAs a first step toward establishing an experimentally supported
inventory of mammalian mitochondrial proteins, we performed
protein mass spectrometry on mitochondria from 14 diverse
mouse organs (Figure 1). We designed our proteomic experi-
ments in two phases in order to identify as many mitochondrial
proteins as possible while systematically flagging copurifying
contaminants. In the discovery phase, we isolated highly purified
mitochondria from cerebrum, cerebellum, brainstem, spinal
cord, kidney, liver, heart, skeletal muscle, white adipose tissue,
stomach, small intestine, large intestine, testis, and placenta
obtained from healthy C57BL/6 mice. Mitochondrial purity was
assessed by western blots against selected mitochondrial and
nonmitochondrial proteins, and intactness was verified by polar-
ographic studies (data not shown) and electron microscopy
(Figure 2A, Figure S1). Each sample was separated by SDS-
PAGE and then sectioned into 20 bands that were each analyzed
by high-performance, liquid chromatography tandem mass
spectrometry (LC-MS/MS) using an LTQ Orbitrap Hybrid MS
system. We captured 4.7 million tandem mass spectra and
searched them against the mouse RefSeq protein database us-
ing stringent matching criteria, resulting in the confident identifi-
cation of products from 3881 genes (Table S2). The detected
proteins are not biased by molecular weight, isoelectric point,
or presence of transmembrane helices but do show a slight
bias against proteins whose transcripts exhibit low abundance
(Figure S2). We estimate that we identify 85% of proteins within
each sample (on the basis of technical liver replicates), but we
saturate detection of distinct proteins by sampling many tissues
(Figure 2B). In total, we identify 88% of previously known mito-
chondrial proteins, including 93% of OXPHOS proteins.
Cell 134, 112–123, July 11, 2008 ª2008 Elsevier Inc. 113
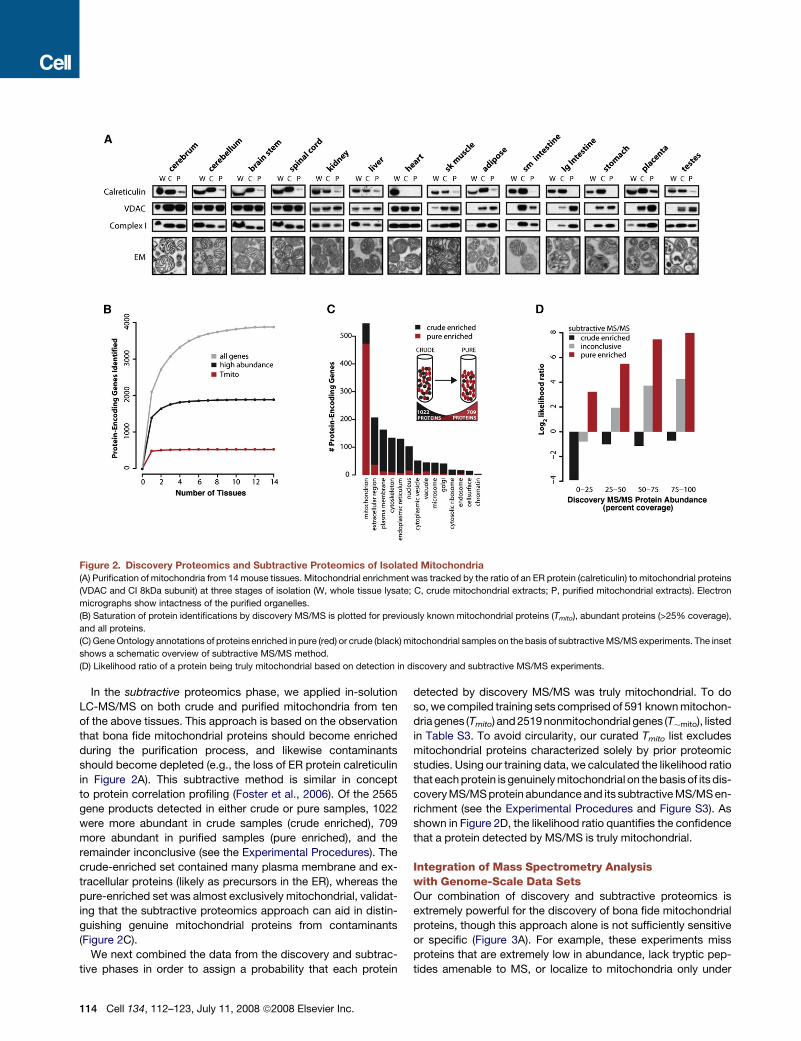
Figure 2. Discovery Proteomics and Subtractive Proteomics of Isolated Mitochondria
(A) Purification of mitochondria from 14 mouse tissues. Mitochondrial enrichment was tracked by the ratio of an ER protein (calreticulin) to mitochondrial proteins
(VDAC and CI 8kDa subunit) at three stages of isolation (W, whole tissue lysate; C, crude mitochondrial extracts; P, purified mitochondrial extracts). Electron
micrographs show intactness of the purified organelles.
(B) Saturation of protein identifications by discovery MS/MS is plotted for previously known mitochondrial proteins (Tmito), abundant proteins (>25% coverage),
and all proteins.
(C) Gene Ontology annotations of proteins enriched in pure (red) or crude (black) mitochondrial samples on the basis of subtractive MS/MS experiments. The inset
shows a schematic overview of subtractive MS/MS method.
(D) Likelihood ratio of a protein being truly mitochondrial based on detection in discovery and subtractive MS/MS experiments.
In the subtractive proteomics phase, we applied in-solution
LC-MS/MS on both crude and purified mitochondria from ten
of the above tissues. This approach is based on the observation
that bona fide mitochondrial proteins should become enriched
during the purification process, and likewise contaminants
should become depleted (e.g., the loss of ER protein calreticulin
in Figure 2A). This subtractive method is similar in concept
to protein correlation profiling (Foster et al., 2006). Of the 2565
gene products detected in either crude or pure samples, 1022
were more abundant in crude samples (crude enriched), 709
more abundant in purified samples (pure enriched), and the
remainder inconclusive (see the Experimental Procedures). The
crude-enriched set contained many plasma membrane and ex-
tracellular proteins (likely as precursors in the ER), whereas the
pure-enriched set was almost exclusively mitochondrial, validat-
ing that the subtractive proteomics approach can aid in distin-
guishing genuine mitochondrial proteins from contaminants
(Figure 2C).
We next combined the data from the discovery and subtrac-
tive phases in order to assign a probability that each protein
114 Cell 134, 112–123, July 11, 2008 ª2008 Elsevier Inc.
detected by discovery MS/MS was truly mitochondrial. To do
so, we compiled training sets comprised of 591 known mitochon-
dria genes (Tmito) and 2519 nonmitochondrial genes (T�mito), listed
in Table S3. To avoid circularity, our curated Tmito list excludes
mitochondrial proteins characterized solely by prior proteomic
studies. Using our training data, we calculated the likelihood ratio
that each protein is genuinely mitochondrial on the basis of its dis-
covery MS/MS protein abundance and its subtractive MS/MS en-
richment (see the Experimental Procedures and Figure S3). As
shown in Figure 2D, the likelihood ratio quantifies the confidence
that a protein detected by MS/MS is truly mitochondrial.
Integration of Mass Spectrometry Analysiswith Genome-Scale Data SetsOur combination of discovery and subtractive proteomics is
extremely powerful for the discovery of bona fide mitochondrial
proteins, though this approach alone is not sufficiently sensitive
or specific (Figure 3A). For example, these experiments miss
proteins that are extremely low in abundance, lack tryptic pep-
tides amenable to MS, or localize to mitochondria only under
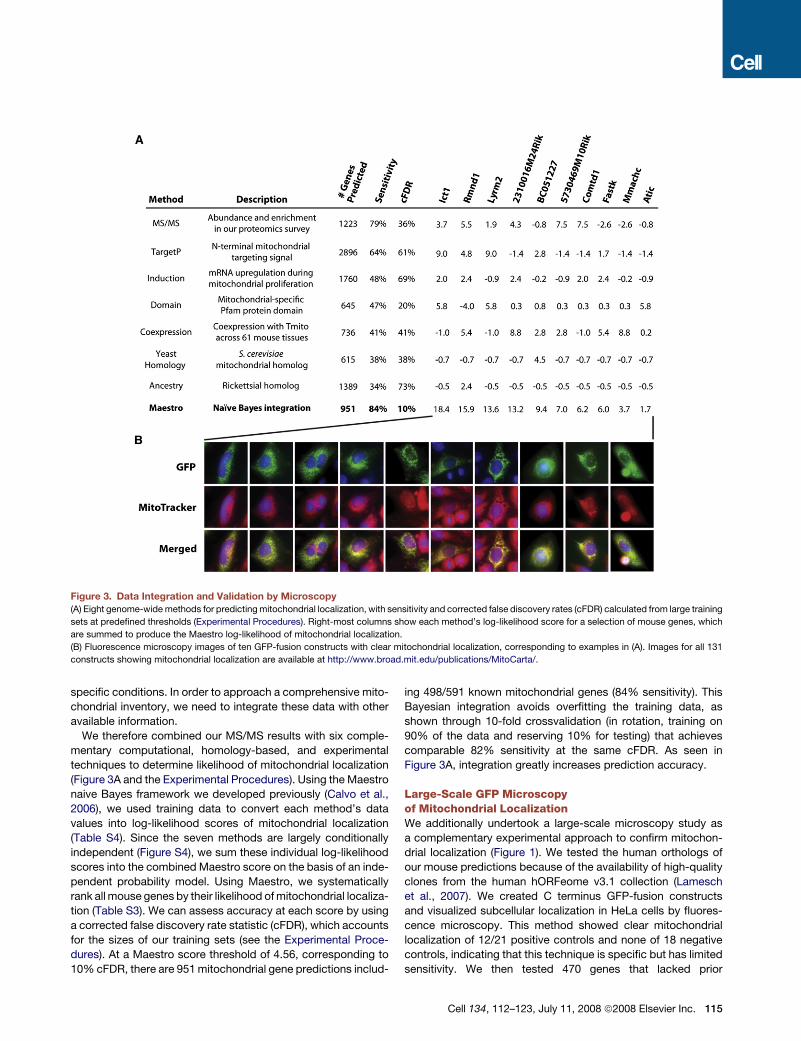
Figure 3. Data Integration and Validation by Microscopy
(A) Eight genome-wide methods for predicting mitochondrial localization, with sensitivity and corrected false discovery rates (cFDR) calculated from large training
sets at predefined thresholds (Experimental Procedures). Right-most columns show each method’s log-likelihood score for a selection of mouse genes, which
are summed to produce the Maestro log-likelihood of mitochondrial localization.
(B) Fluorescence microscopy images of ten GFP-fusion constructs with clear mitochondrial localization, corresponding to examples in (A). Images for all 131
constructs showing mitochondrial localization are available at http://www.broad.mit.edu/publications/MitoCarta/.
specific conditions. In order to approach a comprehensive mito-
chondrial inventory, we need to integrate these data with other
available information.
We therefore combined our MS/MS results with six comple-
mentary computational, homology-based, and experimental
techniques to determine likelihood of mitochondrial localization
(Figure 3A and the Experimental Procedures). Using the Maestro
naive Bayes framework we developed previously (Calvo et al.,
2006), we used training data to convert each method’s data
values into log-likelihood scores of mitochondrial localization
(Table S4). Since the seven methods are largely conditionally
independent (Figure S4), we sum these individual log-likelihood
scores into the combined Maestro score on the basis of an inde-
pendent probability model. Using Maestro, we systematically
rank all mouse genes by their likelihood of mitochondrial localiza-
tion (Table S3). We can assess accuracy at each score by using
a corrected false discovery rate statistic (cFDR), which accounts
for the sizes of our training sets (see the Experimental Proce-
dures). At a Maestro score threshold of 4.56, corresponding to
10% cFDR, there are 951 mitochondrial gene predictions includ-
ing 498/591 known mitochondrial genes (84% sensitivity). This
Bayesian integration avoids overfitting the training data, as
shown through 10-fold crossvalidation (in rotation, training on
90% of the data and reserving 10% for testing) that achieves
comparable 82% sensitivity at the same cFDR. As seen in
Figure 3A, integration greatly increases prediction accuracy.
Large-Scale GFP Microscopyof Mitochondrial LocalizationWe additionally undertook a large-scale microscopy study as
a complementary experimental approach to confirm mitochon-
drial localization (Figure 1). We tested the human orthologs of
our mouse predictions because of the availability of high-quality
clones from the human hORFeome v3.1 collection (Lamesch
et al., 2007). We created C terminus GFP-fusion constructs
and visualized subcellular localization in HeLa cells by fluores-
cence microscopy. This method showed clear mitochondrial
localization of 12/21 positive controls and none of 18 negative
controls, indicating that this technique is specific but has limited
sensitivity. We then tested 470 genes that lacked prior
Cell 134, 112–123, July 11, 2008 ª2008 Elsevier Inc. 115
experimental support of mitochondrial localization. These candi-
dates were selected from an interim Maestro analysis and have
an estimated 59% on the basis of our final Bayesian analysis.
Of the 404 candidates successfully transfected, we identified
131 genes with clear mitochondrial localization (representatives
shown in Figure 3B, with the complete set available at http://
www.broad.mit.edu/publications/MitoCarta/). The success rate
of this approach matches our estimated cFDR and sensitivity
rates—thus validating our Bayesian integration. The 273 con-
structs without clear mitochondrial localization were less infor-
mative because it is possible that the GFP tag interfered with
mitochondrial import, the wrong splice form was tested, or
HeLa cells lacked necessary chaperones and/or modifiers.
MitoCarta: An Inventory of 1098 Genes Encodingthe Mitochondrial Proteome and Their ProteinExpression across 14 TissuesCombining our discovery and subtractive proteomics with
computation, microscopy, and previous literature, we defined
a high-confidence mitochondrial compendium of 1098 genes,
termed MitoCarta (Figure 1). This inventory is estimated to be
over 85% complete and contain �10% false positives (see the
Supplemental Data). It contains 356 genes without previous
mitochondrial annotation in the Gene Ontology (GO) or MitoP2
(Prokisch et al., 2006) databases and distinguishes itself from
other catalogs by providing strong experimental support for
87% of genes on the basis of mass spectrometry (70%), GFP
studies (12%), and/or literature curation (54%). We conserva-
tively estimate that at least 85 of the MitoCarta proteins are
also resident in other cellular locations, on the basis of crossing
MitoCarta with two organelle-based proteomic surveys shown in
Table S5 (Foster et al., 2006; Kislinger et al., 2006).
The MitoCarta collection includes some notable components
and highlights important regulatory features for the organelle.
For example, the inventory includes several kinases, phospha-
tases, RNA-binding proteins, and disease-related proteins
(MMACHC, ATIC) not previously associated with the mitochon-
drion (Table S3B). Interestingly, as a collection, the MitoCarta
genes have significantly shorter UTRs and coding regions and
are more highly expressed than all mouse genes (Table S6). Their
promoters tend to have CpG islands and lack TATA boxes, a fea-
ture shared with other ‘‘housekeeping’’ genes that may account
for their higher expression (Carninci et al., 2006). Additionally,
MitoCarta promoters are enriched for the presence of eight con-
served sequence motifs, including five known mitochondrial
transcription factor binding sites and three newly described
elements (Table S6).
In addition to expanding the number of known mitochondrial
proteins, our inventory provides the opportunity to assess differ-
ences in mitochondrial protein expression across tissues
(Figure 4A). We assessed the relative abundance of each Mito-
Carta protein across our 14 tissues using MS total peak intensity
(see the Experimental Procedures). This metric is highly repro-
ducible across technical replicates (Figure S5) and correlates
quite well with mRNA expression (see the Supplemental Data).
However, because our atlas contains only a single replicate
per tissue, we note two caveats: First, it cannot be used to as-
sess statistically significant differences in abundance across tis-
116 Cell 134, 112–123, July 11, 2008 ª2008 Elsevier Inc.
sues, and second, because of stochastic sampling, we estimate
that we detect approximately 90% of proteins present in each
tissue.
We utilize this protein atlas to investigate the differences in
mitochondrial pathways between tissues. We find that approxi-
mately one-third of MitoCarta genes are core mitochondrial
components present across all sampled tissues, including
most OXPHOS subunits and the TCA cycle (Figure 4B). However,
most MitoCarta genes show some degree of tissue specificity
(Figure 4A). Interestingly, these include much of the mitochondrial
ribosome and half of the subunits of complex IV, several of
which have previous verification of tissue-specific expression
(Huttemann et al., 2003). Additionally, the enzymes of the keto-
genesis and urea cycle pathways are expressed in a broader
set of tissues than expected, including brain and placenta
(Figure S6). Typically, we find that mitochondria express an aver-
age of �760 unique gene products per tissue (range 554–797,
Figure 4C), with pairs of tissues typically sharing �75% of pro-
teins (range 63%–88%). Moreover, using a cytochrome c ELISA,
we estimate that mitochondrial quantity varies by a remarkable
30-fold among a panel of 19 tissues (Figure 4D). Together, these
analyses reveal the tissue diversity of mitochondrial quantity and
composition and demonstrate how our compendium can serve
as a resource for future investigations into tissue-specific mito-
chondrial biology.
Identifying Complex I-Associated Proteinsthrough Phylogenetic ProfilingThe expanded mitochondrial compendium also provides an
opportunity to discover novel components for pathways resident
in the organelle. Nearly 300 genes—26% of our inventory—have
no association with a GO biological process. To associate a sub-
set of these with known pathways, we performed phylogenetic
profiling, which uses shared evolutionary history to identify func-
tionally related proteins (Pellegrini et al., 1999). This approach is
likely to be particularly applicable to the mitochondrion, given its
unique evolutionary history of descending from a Rickettsia-like
endosymbiont early in eukaryotic evolution (Andersson et al.,
1998).
To explore the utility of phylogenetic profiling for mitochondria,
we first identified homologs of mouse MitoCarta proteins in 500
fully sequenced species (Figure 5A, Table S7). We find that 75%
of present-day mitochondrial components have clear bacterial
ancestry (BlastP expect < 1e-3) and that 57% have bacterial
best-bidirectional orthologs, which is more than 3-fold higher
than that of all mouse proteins (Figure 5C). The phylogenetic pro-
files confirm that functionally related mitochondrial proteins tend
to have similar evolutionary histories. For example, most pro-
teins involved in fatty acid metabolism, the citric acid cycle,
and folate metabolism have ancient origins (Figure 5B).
Conversely, the mitochondrial protein import machinery and
mitochondrial carriers are more recent innovations (Figure 5B).
Thus, it may be possible to use shared evolutionary history to as-
sociate unannotated MitoCarta proteins with known pathways.
We focused this strategy on identifying factors essential to
respiratory chain complex I because of its prominent role in
energy metabolism and disease. Currently, there are only three
known assembly factors for this large, macromolecular complex,
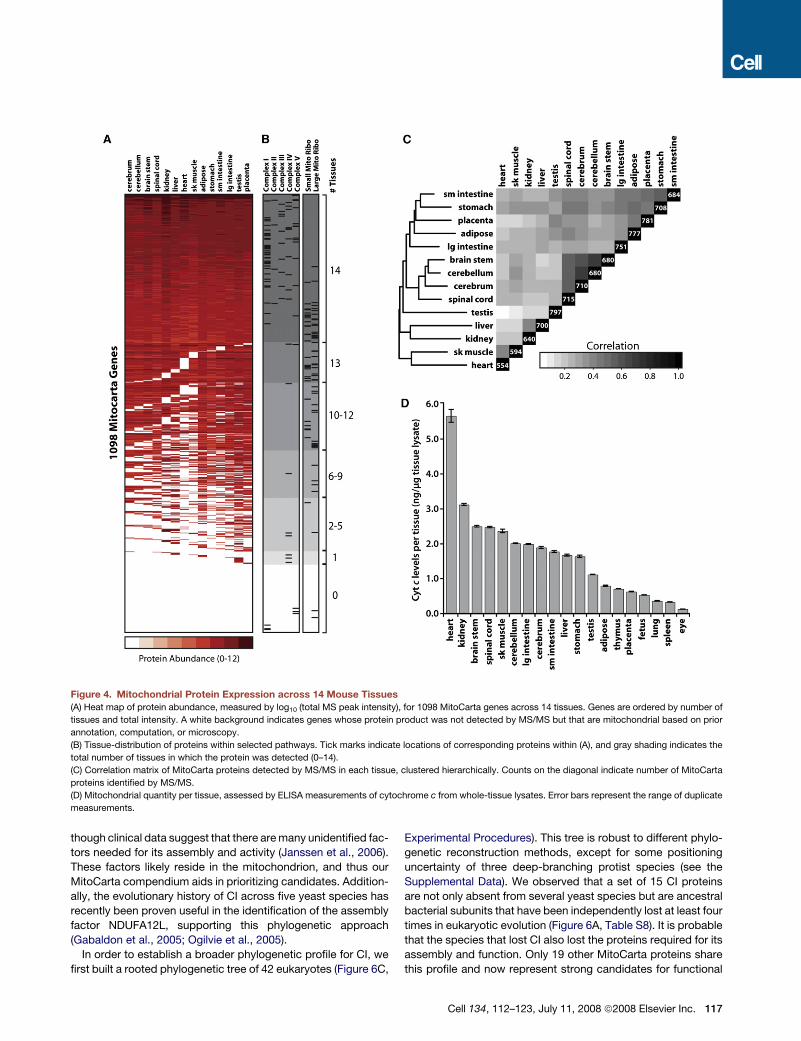
Figure 4. Mitochondrial Protein Expression across 14 Mouse Tissues(A) Heat map of protein abundance, measured by log10 (total MS peak intensity), for 1098 MitoCarta genes across 14 tissues. Genes are ordered by number of
tissues and total intensity. A white background indicates genes whose protein product was not detected by MS/MS but that are mitochondrial based on prior
annotation, computation, or microscopy.
(B) Tissue-distribution of proteins within selected pathways. Tick marks indicate locations of corresponding proteins within (A), and gray shading indicates the
total number of tissues in which the protein was detected (0–14).
(C) Correlation matrix of MitoCarta proteins detected by MS/MS in each tissue, clustered hierarchically. Counts on the diagonal indicate number of MitoCarta
proteins identified by MS/MS.
(D) Mitochondrial quantity per tissue, assessed by ELISA measurements of cytochrome c from whole-tissue lysates. Error bars represent the range of duplicate
measurements.
though clinical data suggest that there are many unidentified fac-
tors needed for its assembly and activity (Janssen et al., 2006).
These factors likely reside in the mitochondrion, and thus our
MitoCarta compendium aids in prioritizing candidates. Addition-
ally, the evolutionary history of CI across five yeast species has
recently been proven useful in the identification of the assembly
factor NDUFA12L, supporting this phylogenetic approach
(Gabaldon et al., 2005; Ogilvie et al., 2005).
In order to establish a broader phylogenetic profile for CI, we
first built a rooted phylogenetic tree of 42 eukaryotes (Figure 6C,
Experimental Procedures). This tree is robust to different phylo-
genetic reconstruction methods, except for some positioning
uncertainty of three deep-branching protist species (see the
Supplemental Data). We observed that a set of 15 CI proteins
are not only absent from several yeast species but are ancestral
bacterial subunits that have been independently lost at least four
times in eukaryotic evolution (Figure 6A, Table S8). It is probable
that the species that lost CI also lost the proteins required for its
assembly and function. Only 19 other MitoCarta proteins share
this profile and now represent strong candidates for functional
Cell 134, 112–123, July 11, 2008 ª2008 Elsevier Inc. 117
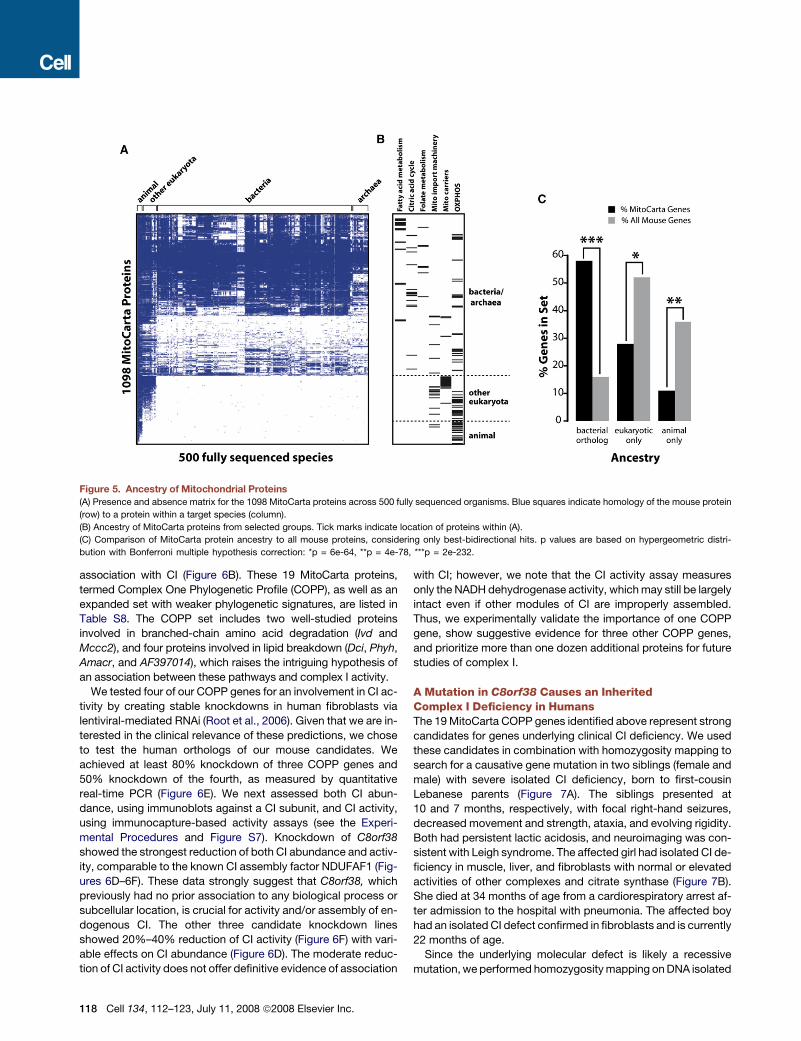
Figure 5. Ancestry of Mitochondrial Proteins
(A) Presence and absence matrix for the 1098 MitoCarta proteins across 500 fully sequenced organisms. Blue squares indicate homology of the mouse protein
(row) to a protein within a target species (column).
(B) Ancestry of MitoCarta proteins from selected groups. Tick marks indicate location of proteins within (A).
(C) Comparison of MitoCarta protein ancestry to all mouse proteins, considering only best-bidirectional hits. p values are based on hypergeometric distri-
bution with Bonferroni multiple hypothesis correction: *p = 6e-64, **p = 4e-78, ***p = 2e-232.
association with CI (Figure 6B). These 19 MitoCarta proteins,
termed Complex One Phylogenetic Profile (COPP), as well as an
expanded set with weaker phylogenetic signatures, are listed in
Table S8. The COPP set includes two well-studied proteins
involved in branched-chain amino acid degradation (Ivd and
Mccc2), and four proteins involved in lipid breakdown (Dci, Phyh,
Amacr, and AF397014), which raises the intriguing hypothesis of
an association between these pathways and complex I activity.
We tested four of our COPP genes for an involvement in CI ac-
tivity by creating stable knockdowns in human fibroblasts via
lentiviral-mediated RNAi (Root et al., 2006). Given that we are in-
terested in the clinical relevance of these predictions, we chose
to test the human orthologs of our mouse candidates. We
achieved at least 80% knockdown of three COPP genes and
50% knockdown of the fourth, as measured by quantitative
real-time PCR (Figure 6E). We next assessed both CI abun-
dance, using immunoblots against a CI subunit, and CI activity,
using immunocapture-based activity assays (see the Experi-
mental Procedures and Figure S7). Knockdown of C8orf38
showed the strongest reduction of both CI abundance and activ-
ity, comparable to the known CI assembly factor NDUFAF1 (Fig-
ures 6D–6F). These data strongly suggest that C8orf38, which
previously had no prior association to any biological process or
subcellular location, is crucial for activity and/or assembly of en-
dogenous CI. The other three candidate knockdown lines
showed 20%–40% reduction of CI activity (Figure 6F) with vari-
able effects on CI abundance (Figure 6D). The moderate reduc-
tion of CI activity does not offer definitive evidence of association
118 Cell 134, 112–123, July 11, 2008 ª2008 Elsevier Inc.
with CI; however, we note that the CI activity assay measures
only the NADH dehydrogenase activity, which may still be largely
intact even if other modules of CI are improperly assembled.
Thus, we experimentally validate the importance of one COPP
gene, show suggestive evidence for three other COPP genes,
and prioritize more than one dozen additional proteins for future
studies of complex I.
A Mutation in C8orf38 Causes an InheritedComplex I Deficiency in HumansThe 19 MitoCarta COPP genes identified above represent strong
candidates for genes underlying clinical CI deficiency. We used
these candidates in combination with homozygosity mapping to
search for a causative gene mutation in two siblings (female and
male) with severe isolated CI deficiency, born to first-cousin
Lebanese parents (Figure 7A). The siblings presented at
10 and 7 months, respectively, with focal right-hand seizures,
decreased movement and strength, ataxia, and evolving rigidity.
Both had persistent lactic acidosis, and neuroimaging was con-
sistent with Leigh syndrome. The affected girl had isolated CI de-
ficiency in muscle, liver, and fibroblasts with normal or elevated
activities of other complexes and citrate synthase (Figure 7B).
She died at 34 months of age from a cardiorespiratory arrest af-
ter admission to the hospital with pneumonia. The affected boy
had an isolated CI defect confirmed in fibroblasts and is currently
22 months of age.
Since the underlying molecular defect is likely a recessive
mutation, we performed homozygosity mapping on DNA isolated

Figure 6. Identification of Complex I-Associated Proteins through Phylogenetic Profiling
(A) Presence and absence matrix for 44 respiratory chain CI subunits and three assembly factors across 42 eukaryotic species. Blue squares indicate homology of
the mouse protein (row) to a protein in a target species (column).
(B) MitoCarta proteins matching the phylogenetic profile of the subset of CI subunits lost independently at least four times in evolution (the names of human
orthologs are in parentheses). Asterisks indicate candidates tested by RNAi in (D)–(F).
(C) Reconstructed phylogenetic eukaryotic tree, with red text indicating species that have lost CI.
(D) Effect of candidate knockdown on CI levels in human fibroblasts. Immunoblots of actin and a CI subunit from whole-cell lysates were performed after lentiviral-
mediated delivery of an empty vector or hairpins targeted against GFP (negative control), NDUFAF1 (known CI assembly factor), and four CI candidates.
(E) Percent knockdown of mRNA expression achieved for controls (gray bars) or CI candidates (blue bars) as measured by real-time qPCR. Error bars represent
the standard deviation of triplicate measurements.
(F) CI activity assays from fibroblast lysates (as in [D]) for controls (gray bars) and four candidates (blue bars). Error bars represent the range of duplicate assays.
from the five family members and identified eight chromosomal
regions of homozygosity shared only by the affected siblings
(Figure 7C and the Experimental Procedures). Collectively, these
regions contain 857 genes, including four CI structural subunits
and one COPP gene, C8orf38 (Figure 7C). Sequencing of two
CI structural subunit genes showed no mutations; however,
sequencing of C8orf38 (NM_152416) revealed a c.296A/G mu-
tation in exon 2 that segregated with the disease in the family
(Figure 7D). This mutation causes a predicted Gln99Arg substitu-
tion in a residue fully conserved across vertebrates and may also
cause a splicing defect because of its position at the 30 end of
exon 2 (Figure 7D). This mutation was not present in EST data-
bases, SNP databases, or in the 100 Lebanese chromosomes
tested. The localization of C8orf38 to the mitochondrion, its
RNAi phenotype of CI deficiency (Figure 6F), and the segregating
C8orf38 mutation at a highly conserved residue together strongly
establish that C8orf38 is a human CI disease gene.
ConclusionWe have constructed a high-quality compendium of mitochon-
drial proteins, used comparative genomics to predict roles for
unannotated proteins in CI biology, and validated these
Cell 134, 112–123, July 11, 2008 ª2008 Elsevier Inc. 119
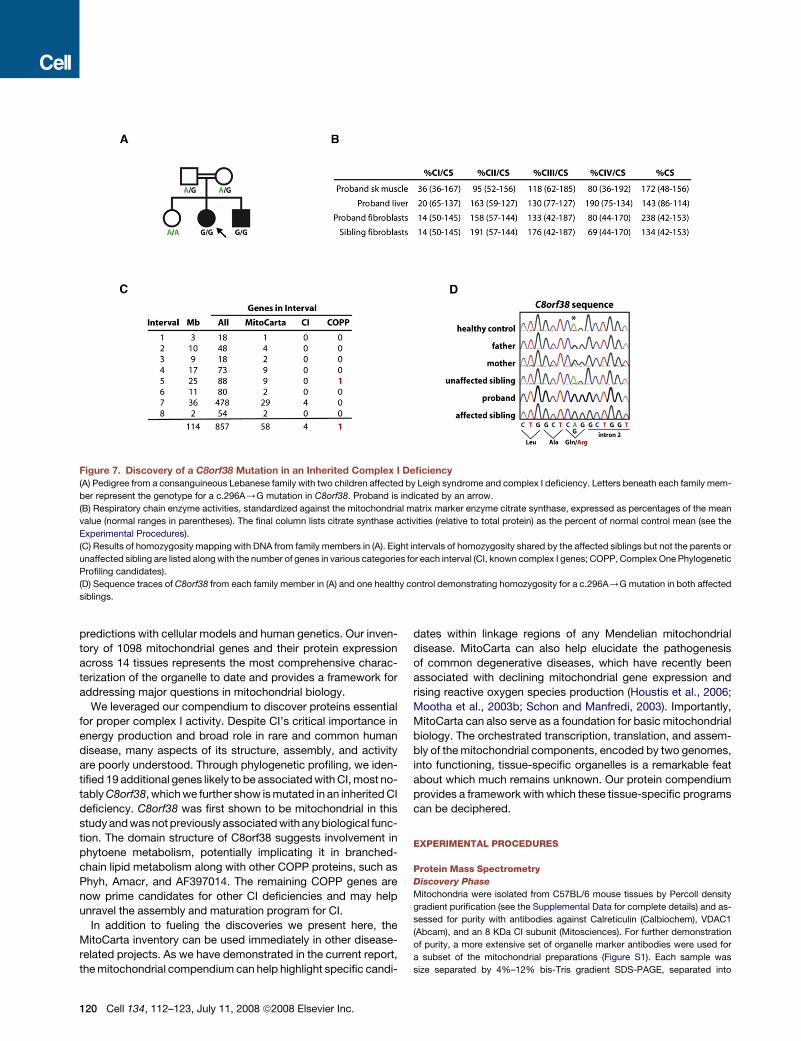
Figure 7. Discovery of a C8orf38 Mutation in an Inherited Complex I Deficiency
(A) Pedigree from a consanguineous Lebanese family with two children affected by Leigh syndrome and complex I deficiency. Letters beneath each family mem-
ber represent the genotype for a c.296A/G mutation in C8orf38. Proband is indicated by an arrow.
(B) Respiratory chain enzyme activities, standardized against the mitochondrial matrix marker enzyme citrate synthase, expressed as percentages of the mean
value (normal ranges in parentheses). The final column lists citrate synthase activities (relative to total protein) as the percent of normal control mean (see the
Experimental Procedures).
(C) Results of homozygosity mapping with DNA from family members in (A). Eight intervals of homozygosity shared by the affected siblings but not the parents or
unaffected sibling are listed along with the number of genes in various categories for each interval (CI, known complex I genes; COPP, Complex One Phylogenetic
Profiling candidates).
(D) Sequence traces of C8orf38 from each family member in (A) and one healthy control demonstrating homozygosity for a c.296A/G mutation in both affected
siblings.
predictions with cellular models and human genetics. Our inven-
tory of 1098 mitochondrial genes and their protein expression
across 14 tissues represents the most comprehensive charac-
terization of the organelle to date and provides a framework for
addressing major questions in mitochondrial biology.
We leveraged our compendium to discover proteins essential
for proper complex I activity. Despite CI’s critical importance in
energy production and broad role in rare and common human
disease, many aspects of its structure, assembly, and activity
are poorly understood. Through phylogenetic profiling, we iden-
tified 19 additional genes likely to be associated with CI, most no-
tably C8orf38, which we further show is mutated in an inherited CI
deficiency. C8orf38 was first shown to be mitochondrial in this
study and was not previously associated with any biological func-
tion. The domain structure of C8orf38 suggests involvement in
phytoene metabolism, potentially implicating it in branched-
chain lipid metabolism along with other COPP proteins, such as
Phyh, Amacr, and AF397014. The remaining COPP genes are
now prime candidates for other CI deficiencies and may help
unravel the assembly and maturation program for CI.
In addition to fueling the discoveries we present here, the
MitoCarta inventory can be used immediately in other disease-
related projects. As we have demonstrated in the current report,
the mitochondrial compendium can help highlight specific candi-
120 Cell 134, 112–123, July 11, 2008 ª2008 Elsevier Inc.
dates within linkage regions of any Mendelian mitochondrial
disease. MitoCarta can also help elucidate the pathogenesis
of common degenerative diseases, which have recently been
associated with declining mitochondrial gene expression and
rising reactive oxygen species production (Houstis et al., 2006;
Mootha et al., 2003b; Schon and Manfredi, 2003). Importantly,
MitoCarta can also serve as a foundation for basic mitochondrial
biology. The orchestrated transcription, translation, and assem-
bly of the mitochondrial components, encoded by two genomes,
into functioning, tissue-specific organelles is a remarkable feat
about which much remains unknown. Our protein compendium
provides a framework with which these tissue-specific programs
can be deciphered.
EXPERIMENTAL PROCEDURES
Protein Mass Spectrometry
Discovery Phase
Mitochondria were isolated from C57BL/6 mouse tissues by Percoll density
gradient purification (see the Supplemental Data for complete details) and as-
sessed for purity with antibodies against Calreticulin (Calbiochem), VDAC1
(Abcam), and an 8 KDa CI subunit (Mitosciences). For further demonstration
of purity, a more extensive set of organelle marker antibodies were used for
a subset of the mitochondrial preparations (Figure S1). Each sample was
size separated by 4%–12% bis-Tris gradient SDS-PAGE, separated into
20 gel slices, and then reduced, alkylated, and subjected to in-gel tryptic di-
gestion. Extracted peptides from each slice were analyzed by reversed-phase
LC-MS/MS with an LTQ-Orbitrap (Thermo Scientific). Data-dependent MS/MS
were collected in the LTQ for the top ten most intense ions observed in the
Orbitrap survey scan, with dynamic exclusion used to exclude resampling of
peaks recently selected for tandem MS/MS (within 60 s intervals). MS/MS
spectra were filtered for spectral quality, pooled from all 14 tissues, and
searched against the RefSeq mouse protein database with the Spectrum
Mill MS Proteomics Workbench. We required proteins to have at least two
unique peptides detected, with at least one peptide that distinguished the
matching gene from all other mouse Entrez genes. Data were aggregated at
the gene level, with the highest MS values for any splice form. Abundance
was measured by coverage (percent of amino acids with MS evidence) for
crossprotein comparisons and by total peak intensity (the sum of MS peak
areas for all sequence identified peptides matching a protein) for crosstissue
comparisons.
Subtractive Phase
Matched crude and highly purified mitochondria were collected from ten tis-
sues. Sample proteins were reduced, alkylated, and then digested with trypsin
in solution. MS/MS spectra were obtained and searched as above, but pro-
teins only required one peptide spectra because these results affected only
proteins detected via discovery MS/MS. Proteins found only in crude extracts,
or found at at least 2-fold higher peak intensity in crude extracts compared to
pure were considered crude enriched (and similarly for pure enriched).
Data Combination
Proteins were assigned integrated MS/MS scores with the likelihood ratio
Lðd; sÞ= Pðd; sjTmitoÞ=Pðd; sjT�mitoÞ, where d is the discovery MS/MS
abundance level (coverage), s is the subtractive MS/MS enrichment category,
and Tmito and T�mito are training sets. See the Supplemental Data for complete
details.
Mouse and Human Data Sets
Mouse RefSeq Release 20 proteins were mapped to 23,640 NCBI Entrez gene
identifiers (ftp://ftp.ncbi.nih.gov/gene/DATA/, 12/12/2006), excluding proteins
mapped to nonreference assemblies or to pseudogenes (Entrez annotation,
6/21/07). Human-mouse orthologs were obtained from Homologene (ftp://ftp.
ncbi.nih.gov/pub/HomoloGene/, 1/26/2007). Training sets (Table S3) included
the following: Tmito, 591 genes with mitochondrial annotations from MitoP2
or GO databases, that additionally had experimental evidence of mitochondrial
localization in mammals, excluding genes with support solely from large-scale
proteomics surveys; and T�mito, all 2519 genes with GO subcellular localization
annotations (type ‘‘inferred by direct assay’’), excluding mitochondrial and un-
informative categories (Calvo et al., 2006). Protein domains from Pfam (ftp://
ftp.sanger.ac.uk/pub/databases/Pfam/, 11/22/2006) were identified with
HMMER (expect parameter = 0.1, trusted threshold cutoffs).
Integration of Genome-Scale Data Sets
Seven methods for determining mitochondrial localization were integrated
with the Maestro naive Bayes classifier (Calvo et al., 2006). Training sets (Tmito
and T�mito) were used to convert each of the individual feature scores (s1..s7)
into a log-likelihood ratio, defined as log2[P(s1..s7j Tmito) / P(s1..s7j T�mito)].
For transcript or protein level scores, the gene inherited the highest score of
any splice form. The scores for the seven genomic features were calculated
at predefined ranges (see Table S4) as follows (see the Supplemental Data
for details):
Proteomics: one of 12 categories shown in Figure 2D, or NA if not
detected.
Targeting sequence: TargetP v1.1 confidence score (Emanuelsson et al.,
2000).
Protein domain: categorical score (M+, M�, M ± , NA) representing pres-
ence of a protein domain that is exclusively mitochondrial, exclusively non-
mitochondrial, ambiguous, or not present in any annotated SwissProt
eukaryotic protein.
Yeast homology: 1 if the best S. cerevisiae homolog (BlastP expect < 1e-3,
coverage > 50% of longer gene) is mitochondrial (Saccharomyces
Genome Database, 12/27/06), 0 otherwise.
Ancestry: BlastP expect value from R. prowazekii homolog, or NA if expect
> 1e-3.
Coexpression: N50 score (number of Tmito genes found within the gene’s
50 nearest transcriptional coexpression neighbors) within the GNF1M atlas
of 61 mouse tissues (Su et al., 2004).
Induction: n-fold change of mRNA expression in cellular models of mito-
chondrial proliferation (overexpression of PGC-1a in mouse myotubes)
compared to controls (Calvo et al., 2006; Mootha et al., 2004).
The corrected false discovery rate was used to assess accuracy of predic-
tions because the sizes of the training sets Tmito and T�mito do not match our
prior expectation of the proportion of mitochondrial to nonmitochondrial cellu-
lar proteins (Calvo et al., 2006). We define cFDR = (1 – SP) / (1 – SP + SN 3
Oprior), where TP, TN, FP, FN represent true positives, true negatives, false
positives, and false negatives, respectively, specificity SP = TN / (TN + FP),
sensitivity SN = TP / (TP + FN), and Oprior = 1500/21000.
To compare performance of each method (Figure 3A), we chose the follow-
ing thresholds: MS/MS pure enriched, or inconclusive with coverage > 25%;
TargetP R 1; Induction R 1.5; Domain M+; Coexpression R 5; Yeast Homol-
ogy 1; Ancestry % 1e-3; and Maestro R 4.56.
Epitope Tagging with GFP and Microscopy
cDNAs from the Human Orfeome collection (Lamesch et al., 2007) were cloned
into the C-terminal GFP vector pcDNA6.2/C-EmGFP-DEST (Invitrogen).
Approximately 4 3 103 HeLa cells were seeded in 100 ml of medium (DMEM
with 10% FBS, 13 GPS) in 96-well imaging plates (Falcon) 24 hr before trans-
fection with Lipofectamine LTX (Invitrogen). Forty-eight hours after transfec-
tion, cells were stained with medium containing 50 nM MitoTracker Red
CMXRos and 1:1000 diluted Hoechst 33258 (Molecular Probes), washed,
fixed, and imaged (see the Supplemental Data). Mitochondrial localization
was determined by overlap of GFP and MitoTracker signals.
Cytochrome c ELISA Assays
Fresh mouse tissues were prepared in ice-cold PBS (see the Supplemental
Data). After homogenization, tissue lysates were resuspended in PBS contain-
ing 0.5% Triton X-100 detergent and protease inhibitors (Roche) and spun at
maximum speed in a table-top centrifuge set to 4�C for 30 min. Supernatant
was drawn off, flash frozen in liquid nitrogen, and stored at �80�C until use.
Cytochrome c levels were measured in duplicate with an ELISA kit (Quantikine)
according to the manufacturer’s protocol.
Phylogenetic Profiling
Homologs of mouse proteins within 500 fully sequenced species (Table S7)
were defined by BlastP expect < 1e-3. Mouse genes with zero or one bacterial
homologs were called ‘‘eukaryotic innovations.’’ We built a rooted phylogenetic
tree of 42 eukaryotic species and a bacterial outgroup (E. coli) with PhyML
(Guindon and Gascuel, 2003) (JTT matrix, four substitution rate categories)
on the basis of ClustalW multiple alignments of six well-conserved mouse pro-
teins (Rps16, Ak2, Drg1, Dpm1, Cct7, and Psmc3) that were concatenated and
manually edited to remove regions of poor alignment. COPP genes were iden-
tified with the following profile: absent in 11 species (S. pombe, A. gossypii,
C. glabrata, S. cerevisiae, C. hominis, C. parvum, P. falciparum 3D7, T. annulata,
T. parva, G. lamblia, and E. cuniculi), present in a bacterial genome, present
in at least one plant-like species (A. thaliana, O. sativa, D. discoideum and
C. merolae), and present in at least two other yeasts (Y. lipolytica, C. albicans,
P. stipitis, and D. hansenii), where presence was defined by BlastP expect <
1e-3. See the Supplemental Data and Table S8 for full details.
Complex I Abundance and Activity Assays
Lentiviral vectors (pLKO.1) encoding short hairpin sequences were obtained
from the Broad RNAi Consortium (TRC) (Root et al., 2006). These vectors
were transfected with a packaging plasmid (pCMV-dR8.91) and VSV-G enve-
lope plasmid (pMD2.G) into 293T cells with Fugene (Roche) according to TRC
protocols (http://www.broad.mit.edu/genome_bio/trc/publicProtocols.html).
Virus-containing medium was harvested 24 and 48 hr after transfection. Ap-
proximately 30,000 MCH58 human fibroblasts were seeded onto 24-well plates
the day prior to infection. For the infection of cells, 150 ml of virus-containing
Cell 134, 112–123, July 11, 2008 ª2008 Elsevier Inc. 121
medium mixed with 350 ml of low antibiotic medium containing 8 mg/ml poly-
brene was added to each well, and the plate was spun at 2250 rpm for
90 min at 37�C. After the spin, medium was replaced with DMEM (5% FBS,
13 GPS) for 12–24 hr and then switched to DMEM with 2 mg/ml puromycin
for 1–2 weeks for selection of stably infected cells. RNA was extracted from
each cell line (QIAGEN RNAeasy) and used for first-strand cDNA synthesis
(Invitrogen). Knockdown efficiency was then assessed via real-time PCR (ABI
Taqman Assays) with HPRT as an endogenous control. For immunoblot
analysis of CI and actin, 10 mg of cleared whole-cell lysate was separated on
a 4%–12% gel (Invitrogen) and transferred to pvdf membrane. Membranes
were probed with antibodies against b-actin (Sigma) and an 8 kDa CI subunit
(Mitosciences). CI activity assays were performed on 15 mg of cell lysate with
immunocapture-based assays according to the manufacturer’s protocol
(Mitosciences). Results were scanned with a BioRad GS-800 scanner and
analyzed with Quantity One software.
Mitochondrial Enzyme Assays
Respiratory chain complexes I, II, III, and IV plus the mitochondrial marker en-
zyme citrate synthase were assayed in skeletal muscle and liver homogenates
and in enriched fibroblast mitochondrial preparations by spectrophotometric
methods as described previously (Kirby et al., 1999; Rahman et al., 1996). Re-
spiratory chain enzyme assays measured NADH:coenzyme Q1 reductase (CI),
succinate:coenzyme Q1 reductase (CII), decylbenzylquinol:cytochrome c re-
ductase (CIII), and cytochrome c oxidase (CIV). Enzyme activities were
expressed as a ratio relative to citrate synthase and then as a percentage of
normal control mean value.
Homozygosity Mapping
DNA from five family members was analyzed with Affymetrix GeneChip Map-
ping 50K XbaI SNP arrays. Loss of heterozygosity regions were detected with
Affymetrix software (GDAS v.3.0.2.8, CNAT v.2.0.0.9, and IGB v.4.56).
SUPPLEMENTAL DATA
Supplemental Data include Supplemental Experimental Procedures, eight
figures, eight tables, and Supplemental References and can be found with
this article online at http://www.cell.com/cgi/content/full/134/1/112/DC1/.
ACKNOWLEDGMENTS
We thank J. Jaffe, K. Clauser, and P. Matsudaira for advice; D. Arlow, S. Silver,
V. Gohil, O. Goldberger, T. Gilbert, and T. Hirozane-Kishikawa for technical as-
sistance; M. McKee for performing electron microscopy; E. A. Shoubridge for
providing MCH58 cell lines; and A. Ting, D. Altshuler, and J. Hirschhorn for
comments on the manuscript. Electron microscopy was performed in the
Microscopy Core of the Center for Systems Biology, which is supported by
Inflammatory Bowel Disease Grant DK43351, and Boston Area Diabetes and
Endocrinology Research Center Award DK57521. This work was supported
by a Principal Research Fellowship from the Australian National Health and
Medical Research Council awarded to D.R.T. and a Burroughs Wellcome
Fund Career Award in the Biomedical Sciences, an Early Career Award from
the Howard Hughes Medical Institute, a Charles E. Culpeper Scholarship in
Medical Science, and a grant from the National Institutes of Health
(GM077465) awarded to V.K.M.
Received: October 31, 2007
Revised: March 6, 2008
Accepted: June 2, 2008
Published: July 10, 2008
REFERENCES
Anderson, S., Bankier, A.T., Barrell, B.G., de Bruijn, M.H., Coulson, A.R.,
Drouin, J., Eperon, I.C., Nierlich, D.P., Roe, B.A., Sanger, F., et al. (1981). Se-
quence and organization of the human mitochondrial genome. Nature 290,
457–465.
122 Cell 134, 112–123, July 11, 2008 ª2008 Elsevier Inc.
Andersson, S.G., Zomorodipour, A., Andersson, J.O., Sicheritz-Ponten, T.,
Alsmark, U.C., Podowski, R.M., Naslund, A.K., Eriksson, A.S., Winkler, H.H.,
and Kurland, C.G. (1998). The genome sequence of Rickettsia prowazekii
and the origin of mitochondria. Nature 396, 133–140.
Calvo, S., Jain, M., Xie, X., Sheth, S.A., Chang, B., Goldberger, O.A., Spinaz-
zola, A., Zeviani, M., Carr, S.A., and Mootha, V.K. (2006). Systematic identifi-
cation of human mitochondrial disease genes through integrative genomics.
Nat. Genet. 38, 576–582.
Carninci, P., Sandelin, A., Lenhard, B., Katayama, S., Shimokawa, K., Pon-
javic, J., Semple, C.A., Taylor, M.S., Engstrom, P.G., Frith, M.C., et al.
(2006). Genome-wide analysis of mammalian promoter architecture and
evolution. Nat. Genet. 38, 626–635.
Carroll, J., Fearnley, I.M., Skehel, J.M., Shannon, R.J., Hirst, J., and Walker,
J.E. (2006). Bovine complex I is a complex of 45 different subunits. J. Biol.
Chem. 281, 32724–32727.
Devenish, R.J., Prescott, M., Roucou, X., and Nagley, P. (2000). Insights into
ATP synthase assembly and function through the molecular genetic manipula-
tion of subunits of the yeast mitochondrial enzyme complex. Biochim.
Biophys. Acta 1458, 428–442.
DiMauro, S., and Schon, E.A. (2003). Mitochondrial respiratory-chain dis-
eases. N. Engl. J. Med. 348, 2656–2668.
Emanuelsson, O., Nielsen, H., Brunak, S., and von Heijne, G. (2000). Predicting
subcellular localization of proteins based on their N-terminal amino acid
sequence. J. Mol. Biol. 300, 1005–1016.
Fontanesi, F., Soto, I.C., Horn, D., and Barrientos, A. (2006). Assembly of
mitochondrial cytochrome c-oxidase, a complicated and highly regulated cel-
lular process. Am. J. Physiol. 291, C1129–C1147.
Forner, F., Foster, L.J., Campanaro, S., Valle, G., and Mann, M. (2006). Quan-
titative proteomic comparison of rat mitochondria from muscle, heart, and
liver. Mol. Cell. Proteomics 5, 608–619.
Foster, L.J., de Hoog, C.L., Zhang, Y., Zhang, Y., Xie, X., Mootha, V.K., and
Mann, M. (2006). A mammalian organelle map by protein correlation profiling.
Cell 125, 187–199.
Gabaldon, T., Rainey, D., and Huynen, M.A. (2005). Tracing the evolution of
a large protein complex in the eukaryotes, NADH:ubiquinone oxidoreductase
(Complex I). J. Mol. Biol. 348, 857–870.
Guda, C., Fahy, E., and Subramaniam, S. (2004). MITOPRED: A genome-scale
method for prediction of nucleus-encoded mitochondrial proteins. Bioinfor-
matics 20, 1785–1794.
Guindon, S., and Gascuel, O. (2003). A simple, fast, and accurate algorithm to
estimate large phylogenies by maximum likelihood. Syst. Biol. 52, 696–704.
Houstis, N., Rosen, E.D., and Lander, E.S. (2006). Reactive oxygen species
have a causal role in multiple forms of insulin resistance. Nature 440, 944–948.
Huh, W.K., Falvo, J.V., Gerke, L.C., Carroll, A.S., Howson, R.W., Weissman,
J.S., and O’Shea, E.K. (2003). Global analysis of protein localization in budding
yeast. Nature 425, 686–691.
Huttemann, M., Jaradat, S., and Grossman, L.I. (2003). Cytochrome c oxidase
of mammals contains a testes-specific isoform of subunit VIb–the counterpart
to testes-specific cytochrome c? Mol. Reprod. Dev. 66, 8–16.
Jansen, R., Yu, H., Greenbaum, D., Kluger, Y., Krogan, N.J., Chung, S., Emili,
A., Snyder, M., Greenblatt, J.F., and Gerstein, M. (2003). A Bayesian networks
approach for predicting protein-protein interactions from genomic data.
Science 302, 449–453.
Janssen, R.J., Nijtmans, L.G., van den Heuvel, L.P., and Smeitink, J.A. (2006).
Mitochondrial complex I: Structure, function and pathology. J. Inherit. Metab.
Dis. 29, 499–515.
Johnson, D.T., Harris, R.A., French, S., Blair, P.V., You, J., Bemis, K.G., Wang,
M., and Balaban, R.S. (2007). Tissue heterogeneity of the mammalian mito-
chondrial proteome. Am. J. Physiol. 292, C689–C697.
Kirby, D.M., Crawford, M., Cleary, M.A., Dahl, H.H., Dennett, X., and Thorburn,
D.R. (1999). Respiratory chain complex I deficiency: An underdiagnosed
energy generation disorder. Neurology 52, 1255–1264.
Kislinger, T., Cox, B., Kannan, A., Chung, C., Hu, P., Ignatchenko, A., Scott,
M.S., Gramolini, A.O., Morris, Q., Hallett, M.T., et al. (2006). Global survey of
organ and organelle protein expression in mouse: combined proteomic and
transcriptomic profiling. Cell 125, 173–186.
Kumar, A., Agarwal, S., Heyman, J.A., Matson, S., Heidtman, M., Piccirillo, S.,
Umansky, L., Drawid, A., Jansen, R., Liu, Y., et al. (2002). Subcellular localiza-
tion of the yeast proteome. Genes Dev. 16, 707–719.
Lamesch, P., Li, N., Milstein, S., Fan, C., Hao, T., Szabo, G., Hu, Z., Venkate-
san, K., Bethel, G., Martin, P., et al. (2007). hORFeome v3.1: A resource of hu-
man open reading frames representing over 10,000 human genes. Genomics
89, 307–315.
Lopez, M.F., Kristal, B.S., Chernokalskaya, E., Lazarev, A., Shestopalov, A.I.,
Bogdanova, A., and Robinson, M. (2000). High-throughput profiling of the mi-
tochondrial proteome using affinity fractionation and automation. Electropho-
resis 21, 3427–3440.
Lowell, B.B., and Shulman, G.I. (2005). Mitochondrial dysfunction and type
2 diabetes. Science 307, 384–387.
Mootha, V.K., Bunkenborg, J., Olsen, J.V., Hjerrild, M., Wisniewski, J.R., Stahl,
E., Bolouri, M.S., Ray, H.N., Sihag, S., Kamal, M., et al. (2003a). Integrated
analysis of protein composition, tissue diversity, and gene regulation in mouse
mitochondria. Cell 115, 629–640.
Mootha, V.K., Lindgren, C.M., Eriksson, K.F., Subramanian, A., Sihag, S.,
Lehar, J., Puigserver, P., Carlsson, E., Ridderstrale, M., Laurila, E., et al.
(2003b). PGC-1alpha-responsive genes involved in oxidative phosphorylation
are coordinately downregulated in human diabetes. Nat. Genet. 34, 267–273.
Mootha, V.K., Handschin, C., Arlow, D., Xie, X., St Pierre, J., Sihag, S., Yang,
W., Altshuler, D., Puigserver, P., Patterson, N., et al. (2004). Erralpha and
Gabpa/b specify PGC-1alpha-dependent oxidative phosphorylation gene ex-
pression that is altered in diabetic muscle. Proc. Natl. Acad. Sci. USA 101,
6570–6575.
Ogilvie, I., Kennaway, N.G., and Shoubridge, E.A. (2005). A molecular chaper-
one for mitochondrial complex I assembly is mutated in a progressive enceph-
alopathy. J. Clin. Invest. 115, 2784–2792.
Pellegrini, M., Marcotte, E.M., Thompson, M.J., Eisenberg, D., and Yeates,
T.O. (1999). Assigning protein functions by comparative genome analysis:
Protein phylogenetic profiles. Proc. Natl. Acad. Sci. USA 96, 4285–4288.
Prokisch, H., Andreoli, C., Ahting, U., Heiss, K., Ruepp, A., Scharfe, C., and
Meitinger, T. (2006). MitoP2: The mitochondrial proteome database–now
including mouse data. Nucleic Acids Res. 34, D705–D711.
Rahman, S., Blok, R.B., Dahl, H.H., Danks, D.M., Kirby, D.M., Chow, C.W.,
Christodoulou, J., and Thorburn, D.R. (1996). Leigh syndrome: Clinical fea-
tures and biochemical and DNA abnormalities. Ann. Neurol. 39, 343–351.
Reinders, J., Zahedi, R.P., Pfanner, N., Meisinger, C., and Sickmann, A.
(2006). Toward the complete yeast mitochondrial proteome: Multidimensional
separation techniques for mitochondrial proteomics. J. Proteome Res. 5,
1543–1554.
Root, D.E., Hacohen, N., Hahn, W.C., Lander, E.S., and Sabatini, D.M. (2006).
Genome-scale loss-of-function screening with a lentiviral RNAi library. Nat.
Methods 3, 715–719.
Saada, A., Edvardson, S., Rapoport, M., Shaag, A., Amry, K., Miller, C., Lorber-
boum-Galski, H., and Elpeleg, O. (2008). C6ORF66 is an assembly factor of
mitochondrial complex I. Am. J. Hum. Genet. 82, 32–38.
Schapira, A.H. (2008). Mitochondria in the aetiology and pathogenesis of Par-
kinson’s disease. Lancet Neurol. 7, 97–109.
Schon, E.A., and Manfredi, G. (2003). Neuronal degeneration and mitochon-
drial dysfunction. J. Clin. Invest. 111, 303–312.
Sickmann, A., Reinders, J., Wagner, Y., Joppich, C., Zahedi, R., Meyer, H.E.,
Schonfisch, B., Perschil, I., Chacinska, A., Guiard, B., et al. (2003). The pro-
teome of Saccharomyces cerevisiae mitochondria. Proc. Natl. Acad. Sci.
USA 100, 13207–13212.
Su, A.I., Wiltshire, T., Batalov, S., Lapp, H., Ching, K.A., Block, D., Zhang, J.,
Soden, R., Hayakawa, M., Kreiman, G., et al. (2004). A gene atlas of the mouse
and human protein-encoding transcriptomes. Proc. Natl. Acad. Sci. USA 101,
6062–6067.
Taylor, S.W., Fahy, E., Zhang, B., Glenn, G.M., Warnock, D.E., Wiley, S.,
Murphy, A.N., Gaucher, S.P., Capaldi, R.A., Gibson, B.W., et al. (2003). Char-
acterization of the human heart mitochondrial proteome. Nat. Biotechnol. 21,
281–286.
Vogel, R.O., Janssen, R.J., Ugalde, C., Grovenstein, M., Huijbens, R.J., Visch,
H.J., van den Heuvel, L.P., Willems, P.H., Zeviani, M., Smeitink, J.A., et al.
(2005). Human mitochondrial complex I assembly is mediated by NDUFAF1.
FEBS J. 272, 5317–5326.
Wallace, D.C. (2005). A mitochondrial paradigm of metabolic and degenerative
diseases, aging, and cancer: A dawn for evolutionary medicine. Annu. Rev.
Genet. 39, 359–407.
Cell 134, 112–123, July 11, 2008 ª2008 Elsevier Inc. 123

![In vivo cardiac phase response curve elucidates human ...mros/pdf/NatCommPRC.pdf · In vivo cardiac phase response curve elucidates human respiratory heart rate ... science [9 {11],](https://img.pdfslide.us/doc/110x75/5b7bc69f7f8b9a474a8d5cf1/in-vivo-cardiac-phase-response-curve-elucidates-human-mrospdfnatcommprcpdf.jpg)