Embed Size (px)
Citation preview

© 2010 O’Brien & Gere. All Rights Reserved.1
A Mitigation Plan for GHG Emissionsat Army Installations
2010 NDIA E2S2 SYMPOSIUM & EXHIBITION - #9821
Aniket Sawant, PhD | O’Brien & Gere
June 17, 2010 | Denver, CO
© 2010 O’Brien & Gere. All Rights Reserved.
Background
Impacts of Climate Change per 2010 QDR
Operating environment, roles, and missions
› An “accelerant of instability or conflict”
Impact on facilities and military capabilities
› Over 30 installations at risk from rising sea levels – 2008 NIC report
Regulations applicable to DOD facilities
USEPA Mandatory GHG Reporting Rule
Executive Order 13514
› 34% reduction in non-combat GHG emissions against 2008 baseline
U.S. Army facilities account for 36% of total DOD facility energy
2

© 2010 O’Brien & Gere. All Rights Reserved.
U.S. Army Base – Fort Eustis
Located in Newport News, VA
Principal Mission:
Train Army personnel in the maintenance and operation of land-based transportation equipment, ocean-going vessels, and helicopters
Transportation Focus:
7th Sustainment Brigade
8th Transportation Brigade
Army Aviation Logistics School
15,526 people; 8,248 acres; 824 buildings; 368 vehicles
3
Richmond66 mi
Wash. DC170 mi
Raleigh226 mi

© 2010 O’Brien & Gere. All Rights Reserved.
Greenhouse Gas (GHG) Emissions – WRI Protocol
Covers the Kyoto Protocol gases from direct & indirect sources
Emissions divided into categories called “scopes:
Scope 1 – direct emissions
Scope 2 – indirect emissions
Scope 3 – other indirect emissions
4
Mobile and Stationary Emissions (MTCO2E)
Fuel Usage: Gallons
(liquid fuels), CF (NG)
Emission Factors:
WRI10,11
Purchased Electricity Emissions (MTCO2E)
Usage: kWh
Emission Factors: EPA eGRID, Subregion-specific12
Solid Waste
Emissions (MTCO2E)
Tonnage: Landfill & WTE
Emission Factors:
EPA Landfill & WTE13
© 2010 O’Brien & Gere. All Rights Reserved.
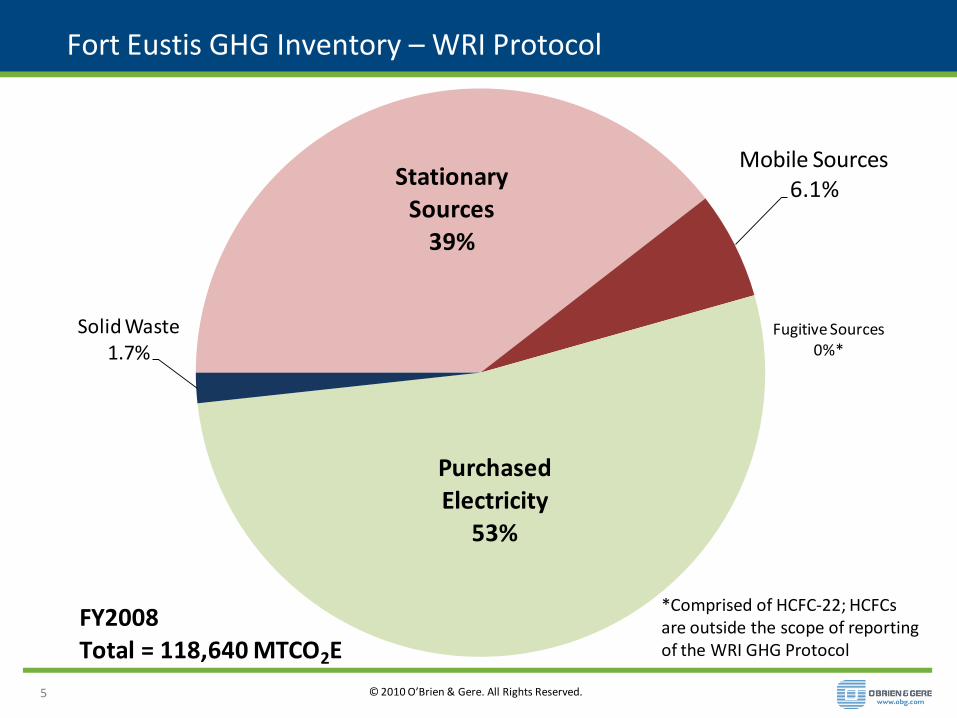
Fort Eustis GHG Inventory – WRI Protocol
5
Stationary Sources
39%
Mobile Sources6.1%
Fugitive Sources0%*
Purchased Electricity
53%
Solid Waste1.7%
FY2008Total = 118,640 MTCO2E
*Comprised of HCFC-22; HCFCs are outside the scope of reporting of the WRI GHG Protocol

© 2010 O’Brien & Gere. All Rights Reserved.
Existing Mitigation Initiatives
Recycling – 9,920 MTCO2E avoided
Waste-to-Energy (WTE)
~50% of non-recycled waste sent to WTE plant instead of landfill; 2,229 MTCO2E avoided
Electricity Usage
Introduction of “Peak Energy Days Mass Notification” Program
› Post-wide emails of higher-cost energy days and conservation tips; 12% reduction in peak kWh consumption for Aug 2009 vs. Aug 2008
Renewable Fuel Capabilities
Eventual replacement of vehicle fleet with flex-fuel capable models; use of biofuels in generators
6
© 2010 O’Brien & Gere. All Rights Reserved.
Mitigation Strategies
Benefits of a mitigation strategy:
Comprehensive, measurable, tangible reductions
Aid in implementation – which sectors to target
Identification of areas of improvement
Questions
WHAT to mitigate?
HOW to implement?
7

© 2010 O’Brien & Gere. All Rights Reserved.
WHAT to mitigate – Stabilization Wedges
8
Overall quantitative strategy
1. Business-as-usual forecast
2. Desired trajectory forecast
3. Subdividing the difference
Use of measures called “wedges”
GH
G E
mis
sio
ns
(M
TC
O2
E)
2010Year
2020
Category Example
Demand-side Conservation
Supply-side Renewables
Offsets/RECs Carbon credits

© 2010 O’Brien & Gere. All Rights Reserved.
HOW to implement – Energy Pyramid
Qualitative representation of strategies for energy conservation and efficiency
Maximum impact is achieved when strategies are implemented from bottom to top of the pyramid
9
Prof. Dennis Buffington, Penn State Univ. (2010)
Idea
l ord
er o
f im
ple
men
tati
on
Strategy Key Factor
1 Conservation Behavior
2 Efficiency Equipment
3 Demand Load Shifting
4 Renewables Technology
© 2010 O’Brien & Gere. All Rights Reserved.
Behavior Change
Survey Development & Distribution
Evaluate stakeholder response to general behavior change methods (beyond Fort Eustis)
Request suggestions for additional measures specific to Fort Eustis
10
Survey Response Analysis
Aggregation of survey responses
Analysis of trends
Respondent comments to be integrated with best practices from other facilities
© 2010 O’Brien & Gere. All Rights Reserved.
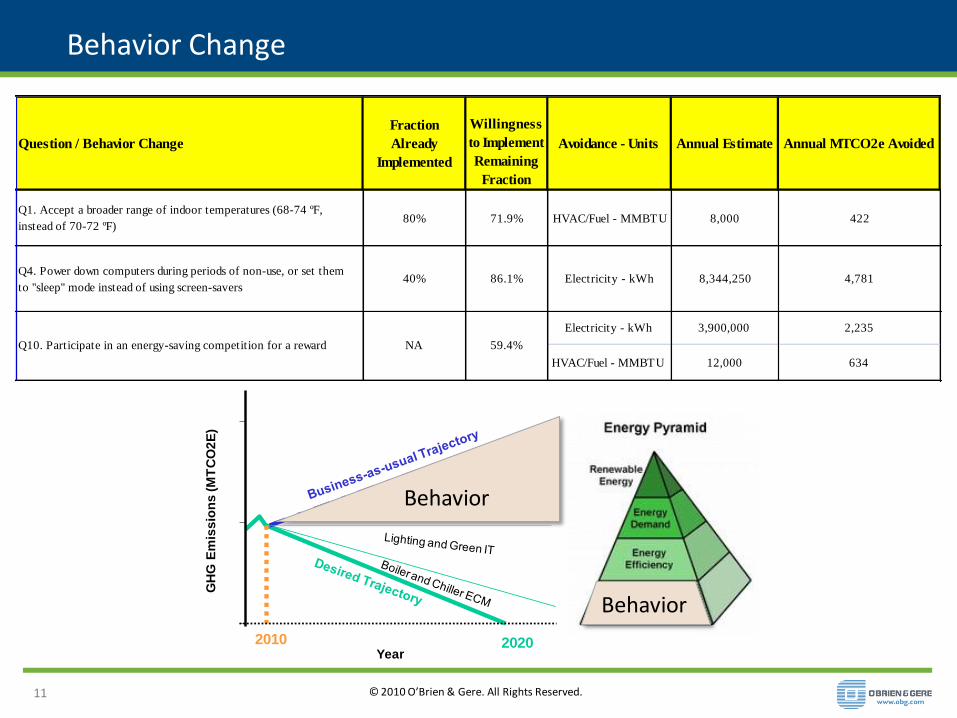
Behavior Change
11
Question / Behavior Change
Fraction
Already
Implemented
Willingness
to Implement
Remaining
Fraction
Avoidance - Units Annual Estimate Annual MTCO2e Avoided
Q1. Accept a broader range of indoor temperatures (68-74 ºF,
instead of 70-72 ºF) 80% 71.9% HVAC/Fuel - MMBTU 8,000 422
Q4. Power down computers during periods of non-use, or set them
to ''sleep'' mode instead of using screen-savers 40% 86.1% Electricity - kWh 8,344,250 4,781
Electricity - kWh 3,900,000 2,235
HVAC/Fuel - MMBTU 12,000 634
NA 59.4%Q10. Participate in an energy-saving competition for a reward
GH
G E
mis
sio
ns
(M
TC
O2
E)
2010Year
2020
Behavior
Behavior

© 2010 O’Brien & Gere. All Rights Reserved.
Plug Loads and Information Technology (IT)
Plug Load / IT Evaluation
Plug load: counts and power draws
IT: counts of physical servers, desktops, laptops, networking, peripherals
Energy Use Evaluation & Analysis
Plug load: Energy reduction, cost, incentives
IT: hours of operation, power management, substitutions e.g., virtualization
12

© 2010 O’Brien & Gere. All Rights Reserved.
Lighting Assessment
Lighting Inventory Development
Sampling of lighting fixtures by type
Development of run-time profiles
Energy Use Evaluation & Analysis
Power reduction analysis – higher efficiency fixtures; lighting controls
Consideration of available finance and tax incentives
13
Existing
Annual Energy
Usage (kWh)
Retrofit
Annual
Energy Usage
(kWh)
Savings
Annual
Energy
(kWh)
Existing
Annual
Energy Cost
($)
Retrofit
Annual
Energy Cost
($)
Savings Annual
Energy (Cost $)
1,082,688 724,362 358,326 $ 101,772.67 $ 68,090.03 $ 33,682.64

© 2010 O’Brien & Gere. All Rights Reserved.
Boiler & Chiller Assessment
Boiler & Chiller Inventory Development
Capacity, function, and energy consumption of each individual plant
› Functions – e.g., heating, cooling, chilled water, power generation
Qualitative listing of energy conservation measures
› Already implemented
› Potential to implement
Energy Use Evaluation & Analysis
Usage
Costs
Emissions
14

© 2010 O’Brien & Gere. All Rights Reserved.
Boiler & Chiller Assessment – Opportunity Matrix
Opportunity matrix provides a visual representation of existing and potential energy conservation measures
15
Potential Energy
Conservation
Measures C
on
den
ser
Wat
er R
eset
Ch
illed
Wat
er R
eset
Pro
per
Pu
mp
Siz
ing
Wat
er-s
ide
Eco
no
miz
er
Ch
iller
Rep
lace
men
t
Var
iab
le S
pee
d C
oo
ling
Tow
er
Fan
s
Var
iab
le F
low
Pu
mp
ing
Building A Chilled Water Plant F F F F F A F
Building B Central Plant F F F F F F F
Building C Central Chilled Water
Plant F F F F F A F
Building D Chilled Water Plant F F F F F F F
Other Locations NA NA NA NA NA NA F
Cooling Plants
Potential Energy
Conservation
Measures
Bo
iler
Rep
lace
men
t
Bo
iler
Stac
k Ec
on
om
izer
s
Blo
w-d
ow
n H
eat
Rec
ove
ry
CH
P
Emer
gen
cy G
ener
atio
n a
nd
Pea
k
Shav
ing
Nat
ura
l Gas
Rat
e Sw
itch
Main Facility Central Steam Plant A F F F NA A
Building DCentral Plant F F F F F A
Secondary Facility Central Steam
Plant F F F F F A
Other Locations NA NA NA F F F
Central Heating Plants
Measures that have already been
adopted are indicated with an " A".
Measures that could be adopted in
the future are indicated with a " F".
© 2010 O’Brien & Gere. All Rights Reserved.
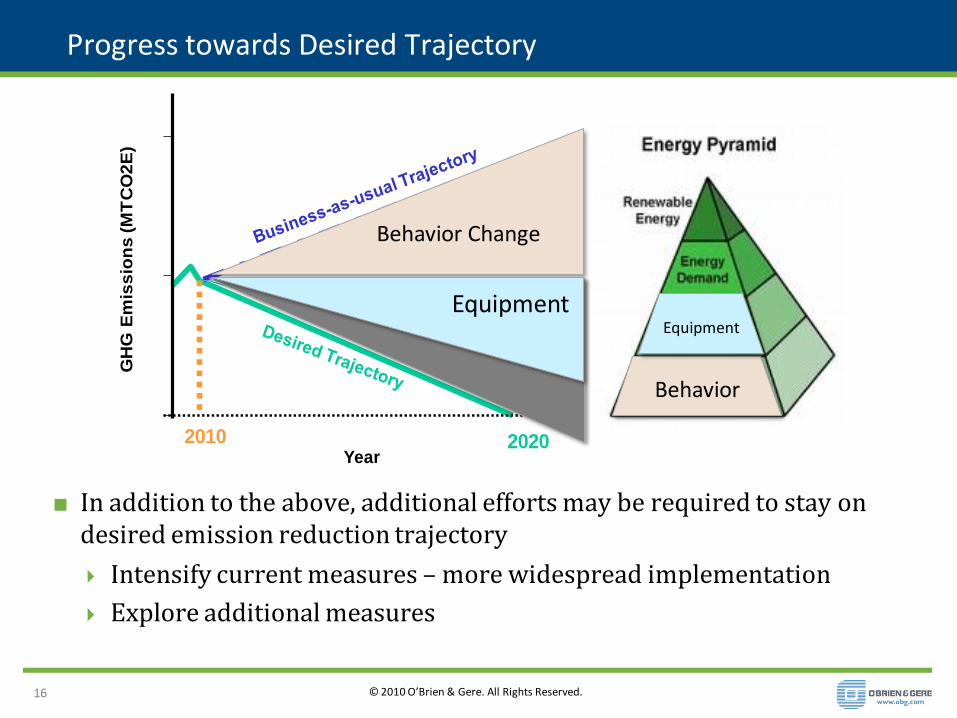
Progress towards Desired Trajectory
In addition to the above, additional efforts may be required to stay on desired emission reduction trajectory
Intensify current measures – more widespread implementation
Explore additional measures
16
GH
G E
mis
sio
ns
(M
TC
O2
E)
2010Year
2020
Behavior Change
Behavior
EquipmentEquipment

© 2010 O’Brien & Gere. All Rights Reserved.
Additional Measures
Measure PyramidCategory
Comments Relevance to Fort Eustis and other installations
PeakShaving
Energy Demand
•Utilities avoid peaking plants•Consumers avoid rate increases
•Potential to time-shift routine base operations to lower peak rates
Solar/ Wind Renewable Energy
•Better use of existing land/building resources•Falling costs and incentives have increased attractiveness
•Potential for use in vacant areas of base, on roofs, in parking lots, etc.
Biofuels Renewable Energy
•“Drop-in” replacement for existing fossil fuels•Less capital-intensive than solar/wind
•Lower change to existing extensive transportation infrastructure compared with e.g., electric powertrains
17

© 2010 O’Brien & Gere. All Rights Reserved.
Summary & Conclusions
Mitigation planning for Army installations involves:
Forecasting business-as-usual emissions trajectory
Developing trajectory towards emission target
Using stabilization wedges to move from the business-as-usual trajectory to the target trajectory
Using the energy pyramid to identify the order of implementation of wedges
Relevant and immediate stabilization wedges include:
Conservation through behavior change
Efficiency through equipment upgrades
Additional measures will include:
Energy demand/load-shifting
Renewables – new and “drop-in” sources of energy
18

© 2010 O’Brien & Gere. All Rights Reserved.1919
Aniket Sawant, PhD
[email protected] | (484) 804-7237