Embed Size (px)
Citation preview
Water Well Investigations in
Nampula Province, Mozambique
- A Minor Field Study
Elin Olsson Engineering Geology Faculty of Engineering Lund University
MSc Thesis, 30 ECTS ISRN LUTVDG/(TVTG-5147)/1-87/(2016) Lund 2016

Thesis work for Master of Science 30 ECTS ISRN LUTVDG/(TVTG-5147)/1-87/(2016) Environmental Engineering
Water Well Investigations in Nampula Province, Mozambique - A Minor Field Study
Undersökning av vattenbrunnar i Nampula provinsen, Moçambique - En Minor Field Study
Elin Olsson Engineering Geology / Teknisk Geologi Faculty of Engineering / Lunds Tekniska Högskola Lund University / Lunds Universitet
Lund 2016 Supervisors/Handledare Torleif Dahlin, Engineering Geology, Lund University Farisse Chirindja, Geology Department, Eduardo Mondlane University Jan-Erik Rosberg, Engineering Geology, Lund University Examiner/Examinator Gerhard Barmen, Engineering Geology, Lund University
Abstract Access to clean water for drinking and sanitation is a human right. Today water scarcity is a
large problem and inequality in access to safe water is a striking truth. In Mozambique, the US
foreign aid agency Millennium Challenge Corporation introduced the Rural Water Point
Installation Program to increase access to safe water and sanitation – a step towards reducing
poverty. 600 water points – including a drilled well, hand pump and washing basin - were
installed in the provinces Nampula and Cabo Delgado. Unfortunately, a high failure rate was
seen and 25% of the wells in Nampula had insufficient yields for communal use.
To investigate the reasons for the failures, geophysical borehole logging was carried out at ten
sites in Nampula during September 2015. Resistivity and natural gamma radiation of the
subsurface in the borehole vicinities was measured to gain knowledge regarding
hydrogeology, capacity and characteristics of the investigated wells. Logging resistivity was
compared to ERT resistivity-depth models with data from previous investigations on the same
boreholes, in order to verify the reliability of using ERT-investigations for borehole siting in
the Nampula area.
The geophysical borehole logging confirmed the ERT-resistivity findings, implying that ERT-
measurements should be carried out before drilling. By doing this less boreholes with
insufficient yields would be drilled – saving time and money. The geophysical borehole logging
gave more detailed information regarding the subsurface, and it is suggested to use borehole
logging to determine placement of screens in order to get a well with as high efficiency as
possible.
Keywords: Geophysical borehole logging, resistivity, natural gamma radiation, Nampula,
Mozambique
Sammanfattning Tillgång till rent dricksvatten och säkra sanitära förhållanden är en mänsklig rättighet. Idag är
brist på vatten ett stort problem och det finns stora skillnader i tillgänglighet mellan olika
grupper av människor. I Moçambique har den amerikanska hjälporganisationen Millennium
Challenge Corporation startat ”the Rural Water Point Installation Program” för att öka
tillgängligheten till säkra vattenförhållanden – ett steg mot att minska fattigdomen. 600
vattenstationer – utrustade med en borrad brunn, handpump och tvättmöjligheter –
installerades i provinserna Nampula och Cabo Delgado. Tyvärr, visade 25 % av brunnarna i
Nampula för låg kapacitet för användning i kommunal skala.
För att undersöka orsaken till den låga kapaciteten utfördes geofysisk borrhålsloggning vid tio
av vattenstationerna i Nampula under september 2015. Jordlagrens resistivitet och naturliga
gammastrålning mättes i borrhålen för att ge förståelse kring områdets hydrogeologi, samt
kapacitet och egenskaper hos brunnarna. Loggningens uppmätta resistivitet jämfördes med
ERT-resistivitetsmodeller baserade på data från tidigare studier av samma borrhål, detta för
att verifiera pålitligheten av att använda ERT-mätningar när man väljer placering för brunnar
i Nampula-området.
Den geofysiska borrhålsloggingen bekräftade resistiviteterna uppmätta med ERT-metoden,
vilket visar på att ERT-undersökningar bör genomföras innan man borrar brunnar. Genom att
göra detta kan man minska andelen borrade brunnar med för låg kapacitet – man sparar då
både tid och pengar. Borrhålsloggingen gav mer detaljerad information om jordlagrens
egenskaper och det är rekommenderat att använda loggning för att bestämma placering av
borrhålsfilter för att få brunnar med en så hög kapacitet som möjligt.
Nyckelord: Geofysisk borrhålsloggning, resistivitet, naturlig gammastrålning, Nampula,
Moçambique
Resumo O acesso à água potável e saneamento do meio é um direito humano. A escassez de água,
hoje, é um grande problema e a desigualdade no acesso à água potável é uma verdade
impressionante. Em Moçambique, a agência de ajuda externa dos EUA, Millennium Challenge
Corporation, lançou o Programa de Instalação de furos de Água Rural para aumentar o acesso
à água potável e saneamento - um passo para a redução da pobreza. 600 furos de água -
incluindo uma bomba de mão e bacia de lavagem - foram instalados nas províncias de
Nampula e Cabo Delgado. Infelizmente, uma elevada taxa de insucesso foi visto (25% dos
poços em Nampula tiveram rendimentos insuficientes para uso comum).
Para investigar as razões para as falhas, perfilagem geofísica foi realizado em dez locais em
Nampula durante o mês de Setembro de 2015. A resistividade e radiação gama natural do
subsolo nas imediações de poços foi medida para se obter um conhecimento sobre a
hidrogeologia, capacidade e características dos poços investigados. Resistividade foi
comparada com a tomografia da resistividade eléctrica (TRE) modelos das investigações
anteriores sobre os mesmos furos, a fim de verificar a confiabilidade do uso de TRE-
melhorando assim a investigações para a localização do poço na área de Nampula e reduzindo
o risco de insucesso.
As perfilagens geofísicas confirmaram as conclusões das medições em TRE, o que implica que
estas devem ser sempre realizadas antes da perfuração. Ao fazer isso menos furos com
rendimentos insuficientes seria perfurados - economizando tempo e dinheiro. A perfilagem
geofísica deu informações mais detalhadas sobre a subsuperfície, e sugere-se para usar a
perfilagem do poço para determinar a colocação de filtros, a fim de obter um furo com alta
eficiência possível.
Palavras-chave: perfilagem geofísica do furo, resistividade, radiação gama natural, Nampula,
Moçambique

This study has been carried out within the framework of the Minor
Field Studies (MFS) Scholarship Programme, which is funded by the
Swedish International Development Cooperation Agency, Sida.
The MFS Scholarship Programme offers Swedish university students an
opportunity to carry out two months’ field work in a developing country
resulting in a graduation thesis work, a Master’s dissertation or a similar
in-depth study. These studies are primarily conducted within subject
areas that are important from an international development perspective
and in a country supported by Swedish international development
assistance.
The main purpose of the MFS Programme is to enhance Swedish
university students’ knowledge and understanding of developing
countries and their problems. An MFS should provide the student with
initial experience of conditions in such a country. A further purpose is to
widen the human resource base for recruitment into international co-
operation. Further information can be reached at the following internet
address: http://www.tg.lth.se/mfs.
The responsibility for the accuracy of the information presented in this
MFS report rests entirely with the authors and their supervisors.
Gerhard Barmen
Local MFS Programme Officer
Postadress Box 118, 221 00 Lund Besöksadress John Ericssons väg 1Telefon dir 046-222 9657, växel 046-222 00 00 Telefax 046-2229127
E-post [email protected]
Lund Un ivers i t y
Facu l ty o f Eng ineer ing, LTH
Depar tments o f Ear th and W ater Eng ineer ing

Preface Working with this thesis has been a great experience and a chance to learn and develop as
person. In addition it has been an opportunity to meet a lot of fantastic people, and without
their help and support, finishing this thesis would not be possible. I would like to give special
thanks to:
Sofia Hallerbäck, who decided to follow me on this great adventure. A better traveling
companion cannot be imagined. Thanks for all mental support and excellent co-work during
the past year.
Professor Torleif Dahlin at Engineering Geology, supervisor in Lund. For guidance and help
during the preparation and execution of the field work and for help during the report writing.
Farisse Chirindja at Geology Departement, Eduardo Mondlane and Lund University, supervisor
in field. For being a great Mozambique guide and for the support throughout the field work.
Without him this project would not have been possible.
Jan-Erik Rosberg at Engineering Geology, Lund University. For all support during the
preparations of the field work and during the execution of the campaign. Thanks for all the
mental support.
Per-Gunnar Alm at Engineering Geology, Lund University. For technical and practical help with
the borehole logging and the quick guide on how to execute borehole logging.
Mr Viagem. For introducing our project to all local water committees and the people
responsible for water handling at the different administrate posts. In addition thanks for the
support and practical help during the field work campaign.
Manuel Alberto, our driver, for driving us safely throughout the whole field campaign, for
adding to the joy in the fieldwork team and for all practical help during the field work.
Faustino and José. For the technical help with the dismounting and resemblance of the
handpumps and for adding to the joy in the field work team.
Staff at Engineering Geology, Lund University. Johan Kullenberg, for help with making the
slugtest equipment and casing to the logging probe.
The geophysical borehole logging equipment that was used in this study was partially funded
by J. Gust. Richert stiftelse which is gratefully acknowledged.
Ali at Alipack AB, for making the case to the logging winch.
Family and friends, for all support from home when being away half around the world and for
encouragement during the thesis writing. All your mental support has been essential
throughout the whole project.
This master thesis study was made possible by the Minor Field Study program scholarship
from SIDA. Also great thanks to utbildningsnämnden, Kävlinge Kommun for the scholarship
from Nils Andreassons memorial fund.

Abbreviations ERT – Electric Resistivity Tomography
MCC – Millennium Challenge Corporation
RWPIP – Rural Water Point Installation Program
WSS – Water and Sanitation Program

Table of Contents 1. Introduction .......................................................................................................................... 1
1.1 Aim ................................................................................................................................... 2
1.2 Limitations ....................................................................................................................... 2
2. Background ........................................................................................................................... 3
2.1 Water as a natural resource ............................................................................................ 3
2.2 Safe drinking water and sanitation – a human right ....................................................... 3
2.3 Water scarcity .................................................................................................................. 4
2.3.1 Water scarcity - the situation in Mozambique ......................................................... 5
2.4 Millennium Challenge Corporation and the Rural Water Point Installation Program .... 5
2.5 The Pumps and Boreholes ............................................................................................... 6
2.6 Geology and hydrogeology .............................................................................................. 8
2.6.1 Geology of Mozambique .......................................................................................... 8
2.6.2 Geology of Nampula ................................................................................................. 8
2.6.3 Weathering ............................................................................................................. 10
2.7 Physical geological properties ....................................................................................... 12
2.7.1 Natural Gamma Radiation ...................................................................................... 13
2.7.2 Resistivity ................................................................................................................ 13
3. Methodology ....................................................................................................................... 16
3.1 Geophysical borehole logging ....................................................................................... 16
3.1.1 Induction logs ......................................................................................................... 16
3.2 Field Methodology ......................................................................................................... 17
3.2.1 Site location ............................................................................................................ 18
3.2.2 Local water committee contact .............................................................................. 19
3.2.3 Start-up in field ....................................................................................................... 19
3.2.4 Experimental Setup ................................................................................................ 19
3.2.5 Conducting measurements .................................................................................... 20
3.3 Data Processing ............................................................................................................. 21
4. Results and Interpretations ................................................................................................ 23
4.1 Logs from the same borehole ........................................................................................ 24
4.2 Camaculo ....................................................................................................................... 25
4.3 Cuhari B ......................................................................................................................... 29
4.4 Incomati Sae "D" (4)/(3) ................................................................................................ 33
4.5 Matibane ....................................................................................................................... 36
4.6 Muriaze .......................................................................................................................... 40
4.7 Murothone .................................................................................................................... 44

4.8 Naholoco Communidade ............................................................................................... 48
4.9 Naholoco EP1-2 ............................................................................................................. 52
4.10 Namiraka ..................................................................................................................... 55
4.11 Nampawa ..................................................................................................................... 59
5. Discussion ............................................................................................................................ 62
5.1 Field Surveying ............................................................................................................... 62
5.2 Results and Geological Interpretation ........................................................................... 63
5.2.1 Anomalies in the borehole logging resistivity log................................................... 63
5.2.2 Geological interpretation and given borehole data ............................................... 64
5.3 Borehole logging vs ERT-measurements ....................................................................... 68
5.3.1 Advantages and disadvantages .............................................................................. 68
5.3.2 Correlation between ERT and borehole logging .................................................... 68
5.4 Participatory approach .................................................................................................. 70
5.5 Economic approach ....................................................................................................... 71
6. Conclusions ......................................................................................................................... 72
7. Recommendations and Future Work ................................................................................. 73
8. References ........................................................................................................................... 74
Appendix 1 – Winlogger System/Cable? Settings ................................................................... 78
Appendix 2 – Summary of Daily Drilling Activity Report: Nampula ........................................ 79
Appendix 3 – Summary of Daily Drillimg Activity Report: Mongicual ..................................... 80
Appendix 4 – ERT-resistivity profiles ....................................................................................... 83
1
1. Introduction Safe drinking water and sanitation is one of our human rights (United Nations Human Rights -
Office of the high commissioner, 2015). However, in many parts of the world this is still not
reality. In 2010, 844 million people lacked access to improved drinking water sources, and 2.5
billion people lacked access to improved sanitation facilities (improved in this case meaning
water sources which are protected from outer contamination sources and sanitation facilities
where hygienic separation of excreta from human contact is ensured) (United Nations - Office
of the high commissioner, 2010). The majority of people lacking access to safe drinking water
and sanitation are poor people living in rural areas (United Nations - Office of the high
commissioner, 2010), and today a large inequality is seen in usage and access to water (Davis,
2014).
There are several organisations, governments and local initiatives working to increase the
access to safe drinking water and sanitation (Scanlon, et al., 2004). Of these, the US foreign
aid agency Millennium Challenge Corporation (MCC), has taken a large initiative in one of the
world’s poorest countries – Mozambique. The aim of the MCC project was to reduce poverty
by promoting sustainable economic growth (Hall, et al., 2014). In Mozambique 48% live
without access to clean drinking water and 80% without safe sanitation (Water Aid, United
Kingdom, 2015). For the Rural Water Point Installation Program (RWPIP) as a part of the water
and sanitation (WSS) program of the MCC initiative, 600 water points were constructed in the
poorest districts of the two Mozambique provinces Nampula and Cabo Delgado (Cowater
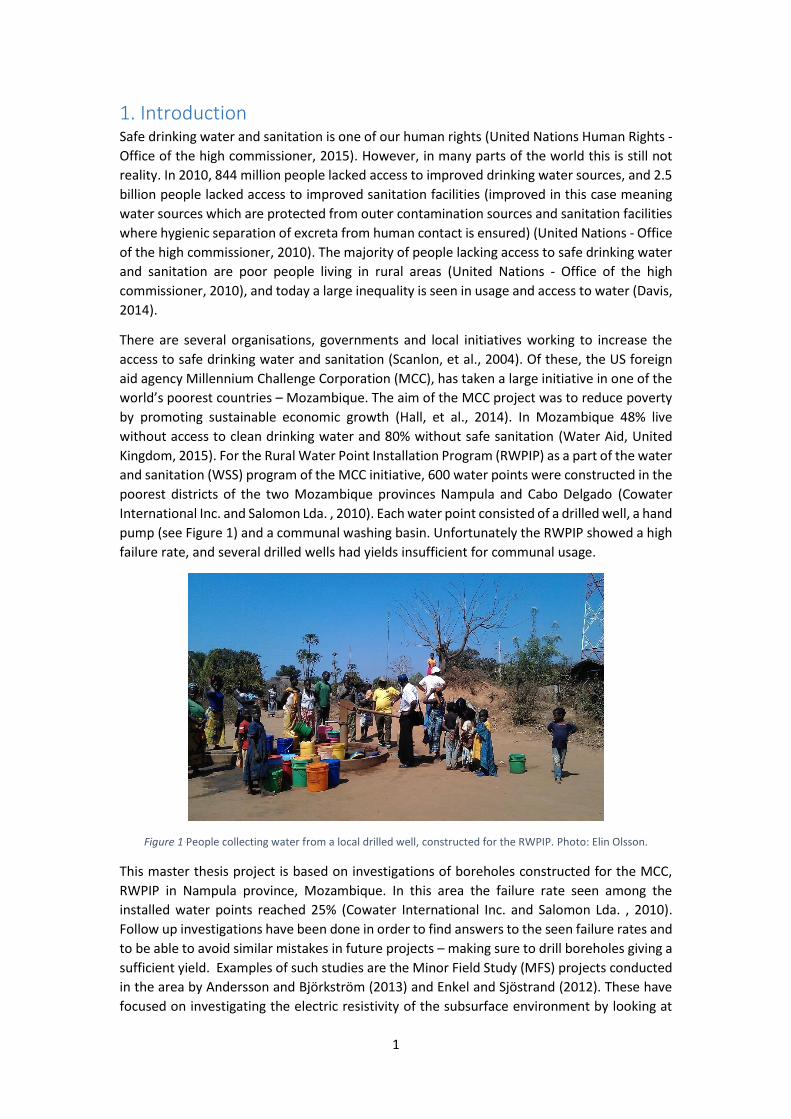
International Inc. and Salomon Lda. , 2010). Each water point consisted of a drilled well, a hand
pump (see Figure 1) and a communal washing basin. Unfortunately the RWPIP showed a high
failure rate, and several drilled wells had yields insufficient for communal usage.
Figure 1 People collecting water from a local drilled well, constructed for the RWPIP. Photo: Elin Olsson.
This master thesis project is based on investigations of boreholes constructed for the MCC,
RWPIP in Nampula province, Mozambique. In this area the failure rate seen among the
installed water points reached 25% (Cowater International Inc. and Salomon Lda. , 2010).
Follow up investigations have been done in order to find answers to the seen failure rates and
to be able to avoid similar mistakes in future projects – making sure to drill boreholes giving a
sufficient yield. Examples of such studies are the Minor Field Study (MFS) projects conducted
in the area by Andersson and Björkström (2013) and Enkel and Sjöstrand (2012). These have
focused on investigating the electric resistivity of the subsurface environment by looking at
2
profiles crossing over the borehole of interest. The main technique used for these studies was
electric resistivity tomography – ERT. By looking at ERT-profiles one can define subsurface
layers with different resistivity, and from this in combination with geological data and drilling
information an interpretation of the subsurface can be done giving a hint of if the borehole
and screens have been placed suitably. In this master thesis project geophysical borehole
logging will be used to register resistivity and natural gamma radiation of the formations in
the vicinity of the borehole. The collected data will be compared to the ERT-data and a
geological interpretation will be done. Hopefully the geophysical borehole logging data can
verify the ERT-data and prove reliability to using ERT-investigations for borehole siting in the
Nampula area.
Further contribution to the project was carried out during the same field study period as the
geophysical borehole logging investigation. Slug tests, giving estimates of hydraulic
conductivity and specific capacity of the investigated aquifers, were performed and have been
analysed and discussed in the report “Water Well Investigations in Nampula Province – Slug
tests in weathered crystalline rock” (Hallerbäck, 2016).
ERT-investigations are carried out above the ground surface, and if the geophysical borehole
logging verifies the reliability of the ERT usage, a lot of money can be saved by avoiding drilling
of boreholes in areas and into subsurface layers that show properties which indicate that a
drilled well will be of insufficient yield.
1.1 Aim The aim of this thesis is to evaluate what hydrogeological interpretations that can be drawn
from resistivity and natural gamma data obtained by the geophysical borehole logging
investigation. Also to, from the same data, gain understanding regarding the capacity and
qualities of the investigated wells.
An additional aim is to compare resistivity profiles from the present borehole logging
investigation with ERT-investigations done as previous MFS-projects on the same boreholes.
This is done to verify the reliability of using ERT-investigations for borehole siting in the
Nampula area.
1.2 Limitations The greatest limitation of this study is the amount of gathered data, which is coupled to the
number of investigated borehole sites. With a limited amount of data the reliability of the
results should be considered. To verify any general conclusions from this study a more
substantial investigation project would need to take place.
Also, the limited amount of drilling activity information, geological information and first hand
borehole information is adding to the uncertainty of the results from this study.
Adding to this is the fact that the used geophysical borehole logging probe had an operational
range limited to 0.3-300Ωm. Resistivity values found in the hydrogeological environment of
Nampula can be expected to reach tenfold amounts.
3
2. Background
2.1 Water as a natural resource Water is one of earth’s vital natural resources needed by all living organisms (Encyclopaedia
Britannica, 2015, a). It is mainly found as saline water in oceans and only about 3% of the
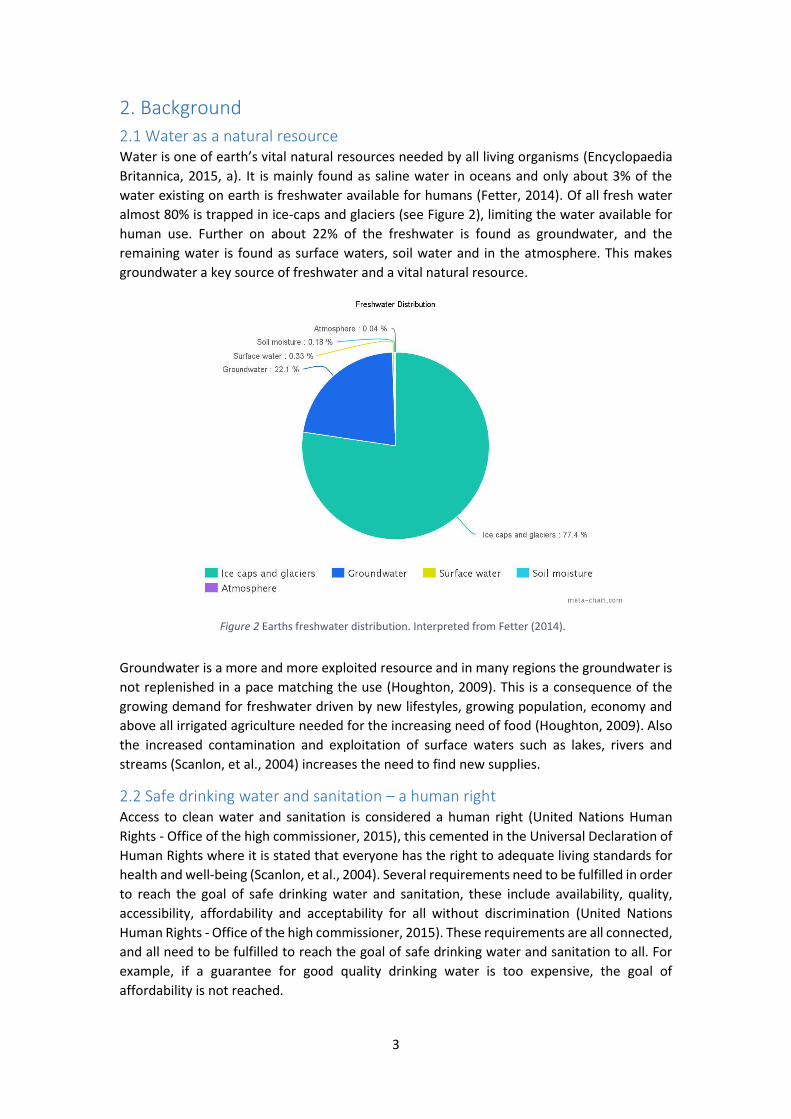
water existing on earth is freshwater available for humans (Fetter, 2014). Of all fresh water
almost 80% is trapped in ice-caps and glaciers (see Figure 2), limiting the water available for
human use. Further on about 22% of the freshwater is found as groundwater, and the
remaining water is found as surface waters, soil water and in the atmosphere. This makes
groundwater a key source of freshwater and a vital natural resource.
Groundwater is a more and more exploited resource and in many regions the groundwater is
not replenished in a pace matching the use (Houghton, 2009). This is a consequence of the
growing demand for freshwater driven by new lifestyles, growing population, economy and
above all irrigated agriculture needed for the increasing need of food (Houghton, 2009). Also
the increased contamination and exploitation of surface waters such as lakes, rivers and
streams (Scanlon, et al., 2004) increases the need to find new supplies.
2.2 Safe drinking water and sanitation – a human right Access to clean water and sanitation is considered a human right (United Nations Human
Rights - Office of the high commissioner, 2015), this cemented in the Universal Declaration of
Human Rights where it is stated that everyone has the right to adequate living standards for
health and well-being (Scanlon, et al., 2004). Several requirements need to be fulfilled in order
to reach the goal of safe drinking water and sanitation, these include availability, quality,
accessibility, affordability and acceptability for all without discrimination (United Nations
Human Rights - Office of the high commissioner, 2015). These requirements are all connected,
and all need to be fulfilled to reach the goal of safe drinking water and sanitation to all. For
example, if a guarantee for good quality drinking water is too expensive, the goal of
affordability is not reached.
Figure 2 Earths freshwater distribution. Interpreted from Fetter (2014).
4
In both urban and rural areas, the majority of the ones who do not have access to safe drinking
water and sanitation are poor (United Nations - Office of the high commissioner, 2010).
Adding to this is the fact that the cost of water for poor people is often higher than for people
with high-income. In the slums safe drinking water can be five to ten times more expensive
than in high-income areas. Since slums are informal settlements, the authorities are reluctant
to connect the slums to the water system. This forces the people living in the slum to buy
water from vendors at high prices or collect it at unsecure water points. However, the majority
of people not having access to safe drinking water and sanitation are poor living in rural areas.
Clean water is considered one of the key factors in combating poverty, and there is an
increasingly important link between social-wellbeing and a healthy environment – not only
considering water (Scanlon, et al., 2004).
Although, access to clean water and sanitation is still not reality in large parts of the world
(Sida, 2013). During the 20th century the global demand for water increased 6 folded while the
population tripled (Scanlon, et al., 2004). Estimates (in 2004) showed that if water usage and
population growth trends from the first years of the 21st century were to continue, two thirds
of the world’s population would live with severe water scarcity by 2025 (Scanlon, et al., 2004).
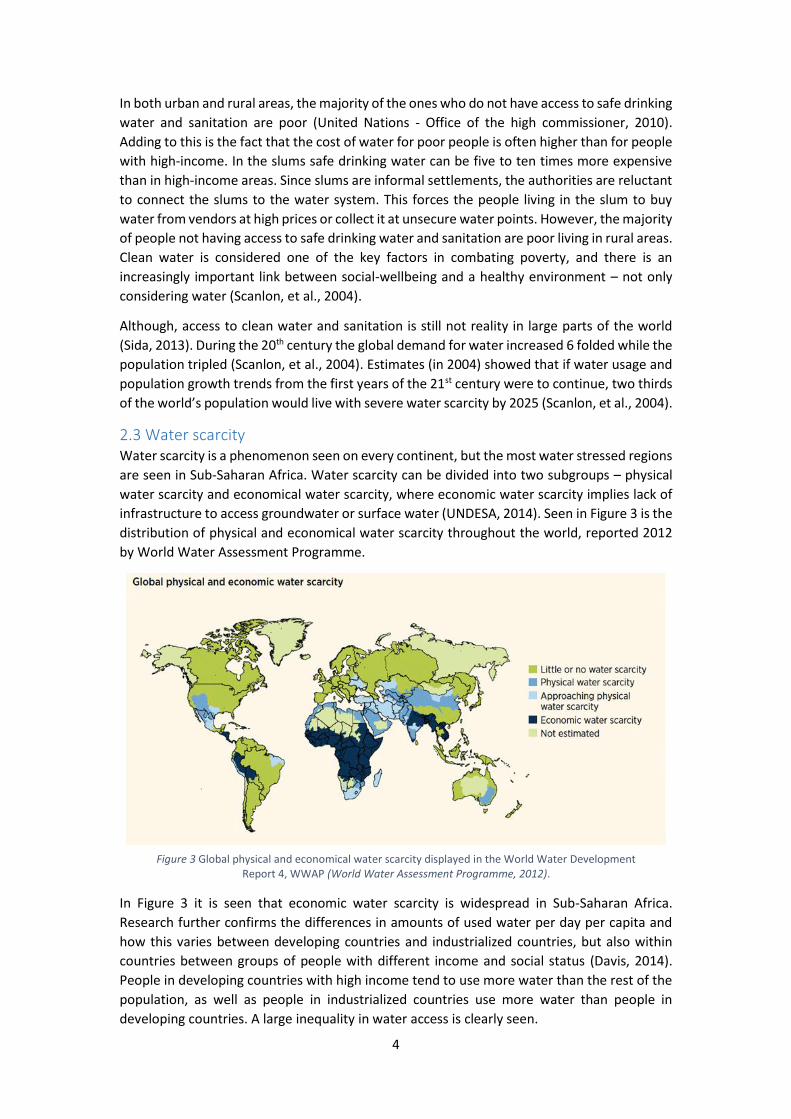
2.3 Water scarcity Water scarcity is a phenomenon seen on every continent, but the most water stressed regions
are seen in Sub-Saharan Africa. Water scarcity can be divided into two subgroups – physical
water scarcity and economical water scarcity, where economic water scarcity implies lack of
infrastructure to access groundwater or surface water (UNDESA, 2014). Seen in Figure 3 is the
distribution of physical and economical water scarcity throughout the world, reported 2012
by World Water Assessment Programme.
In Figure 3 it is seen that economic water scarcity is widespread in Sub-Saharan Africa.
Research further confirms the differences in amounts of used water per day per capita and
how this varies between developing countries and industrialized countries, but also within
countries between groups of people with different income and social status (Davis, 2014).
People in developing countries with high income tend to use more water than the rest of the
population, as well as people in industrialized countries use more water than people in
developing countries. A large inequality in water access is clearly seen.
Figure 3 Global physical and economical water scarcity displayed in the World Water Development Report 4, WWAP (World Water Assessment Programme, 2012).
5
However, there are many organizations working to increase the access to clean water and
sanitation trying to break the seen trends of inequality and shortage of water access. UN´s
Millennium Declaration Goals included both the topics access to clean water and access to
sanitation, and several aid agencies has these goals as kingpin (see for example chapter
“Millennium Challenge Corporation and the Rural Water Point Installation Program”)
(Scanlon, et al., 2004).
2.3.1 Water scarcity - the situation in Mozambique Mozambique is a country with a majority of perennial and transboundary river basins. The
transboundary situation largely affects the river flows negatively, and the flows to
Mozambique are considerably reduced (Ramos, et al., 2002). In addition the perennial
variation of rain and dry seasons affects the country with periods of severe droughts and
equally severe flooding.
According to Water Aid UK 48% of the Mozambique population lacks access to safe water
(Water Aid, United Kingdom, 2015). Additionally 80% live without adequate sanitation
possibilities causing diseases such as diarrhoea, and as a consequence about 7000 children die
each year. Lack of water and sanitation has large impact on health, everyday life and
livelihoods, contributing to the low average life expectancy of 49 years.
Mozambique is far below global benchmarks when looking at water consumption per capita,
and with an average below 10 litres per day Mozambique is one of the countries in the world
with lowest water consumption (Millennium Challenge Account Mozambique , 2013). In 2013
the Millennium Challenge Account stated that in order to reach the Millennium Development
Goals by 2015, the levels of coverage of water and sanitation had to be doubled. The
Mozambique government in turn estimated that to reach the Millennium Development Goals
on water and sanitation the investments in this sector needed to be doubled during the next
10 years.
In 2013 it was estimated that 70% of the Mozambique population lived in rural areas
(Millennium Challenge Account Mozambique , 2013). The largest amount of water in
Mozambique is used for irrigation and agriculture. When rural areas are further developed,
the water demand will increase drastically (Ramos, et al., 2002) - water still used to wide
extent for agriculture and an increase in water usage due to urbanisation.
2.4 Millennium Challenge Corporation and the Rural Water Point Installation
Program In 2007 the U.S. foreign aid agency MCC, signed a contract with the government of
Mozambique (Hall, et al., 2014). The grant was for a 506.9 million dollar, five year (2008-2013)
investment. By promoting sustainable economic growth, the aim of the compact was to
reduce poverty in Mozambique. The project was to cover four major areas which were
rehabilitation/construction of roads, land tenure services, farmer income support and water
supply and sanitation, where the later was given most economic support (ca 45% excluding
costs for evaluation, administration and monitoring).
The project was targeted to six of the poorest districts in the Mozambican provinces Nampula
and Cabo Delgado (Hall, et al., 2014). For the water and sanitation program 600 water points
were installed, increasing the accessibility to safe water and sanitation. Each water point
consisted of a drilled well, a hand pump and a communal washing basin (Chirindja, et al.,
2014). In addition the Rural Water Point Installation Program was introduced, where local
6
water committees were started and trained to insure future maintenance of the new
infrastructure.
2.5 Pumps and Boreholes within the RWPIP For the WSS and RWPIP part of the 2008-2013 MCC project, 600 water points were
constructed. At each water point a well was drilled and a handpump was installed. The siting
of the waterpoints was determined by different hydrogeological surveys and with help from
the local inhabitants.
The Afridev handpump
All waterpoints concerned in this study had the same type of handpumps installed. This type
is called the Afridev Standard and is together with the India Mark II/III and the Zimbabwe Bush
Pump the most successful and widespread handpumps in the world (Baumann & Furey, 2013).
These three pumps are all standardised pumps with freely available international
specifications from the Rural Water Supply Network (RWSN). Standardisation contributes to
keeping any rural water supply program comprehensible and simple, and to make sure pumps
are manufactured according to a certain technical standard and performance.
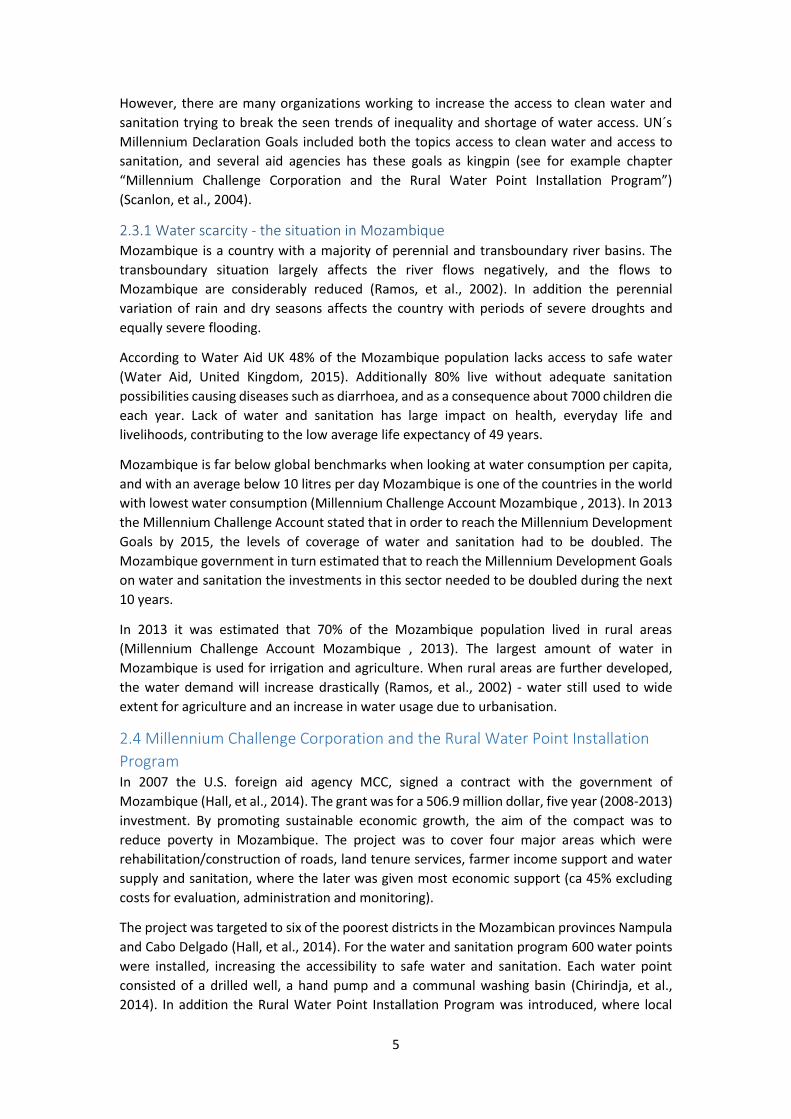
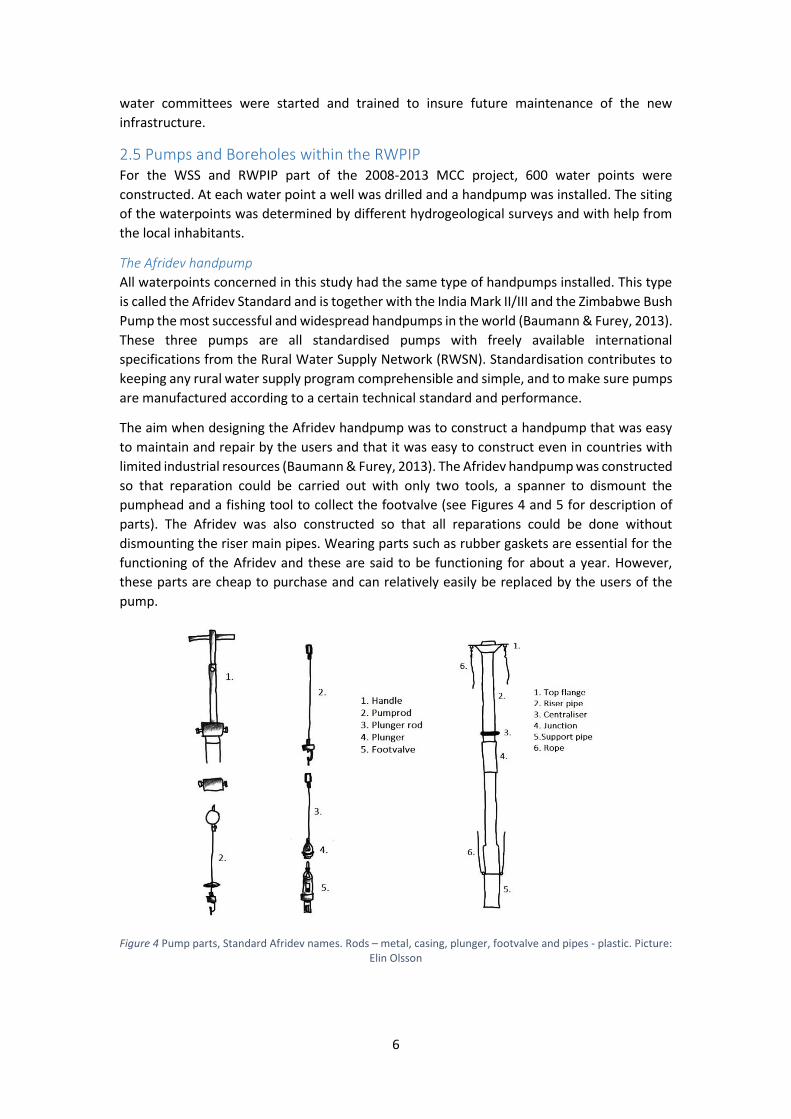
The aim when designing the Afridev handpump was to construct a handpump that was easy
to maintain and repair by the users and that it was easy to construct even in countries with
limited industrial resources (Baumann & Furey, 2013). The Afridev handpump was constructed
so that reparation could be carried out with only two tools, a spanner to dismount the
pumphead and a fishing tool to collect the footvalve (see Figures 4 and 5 for description of
parts). The Afridev was also constructed so that all reparations could be done without
dismounting the riser main pipes. Wearing parts such as rubber gaskets are essential for the
functioning of the Afridev and these are said to be functioning for about a year. However,
these parts are cheap to purchase and can relatively easily be replaced by the users of the
pump.
Figure 4 Pump parts, Standard Afridev names. Rods – metal, casing, plunger, footvalve and pipes - plastic. Picture: Elin Olsson
7
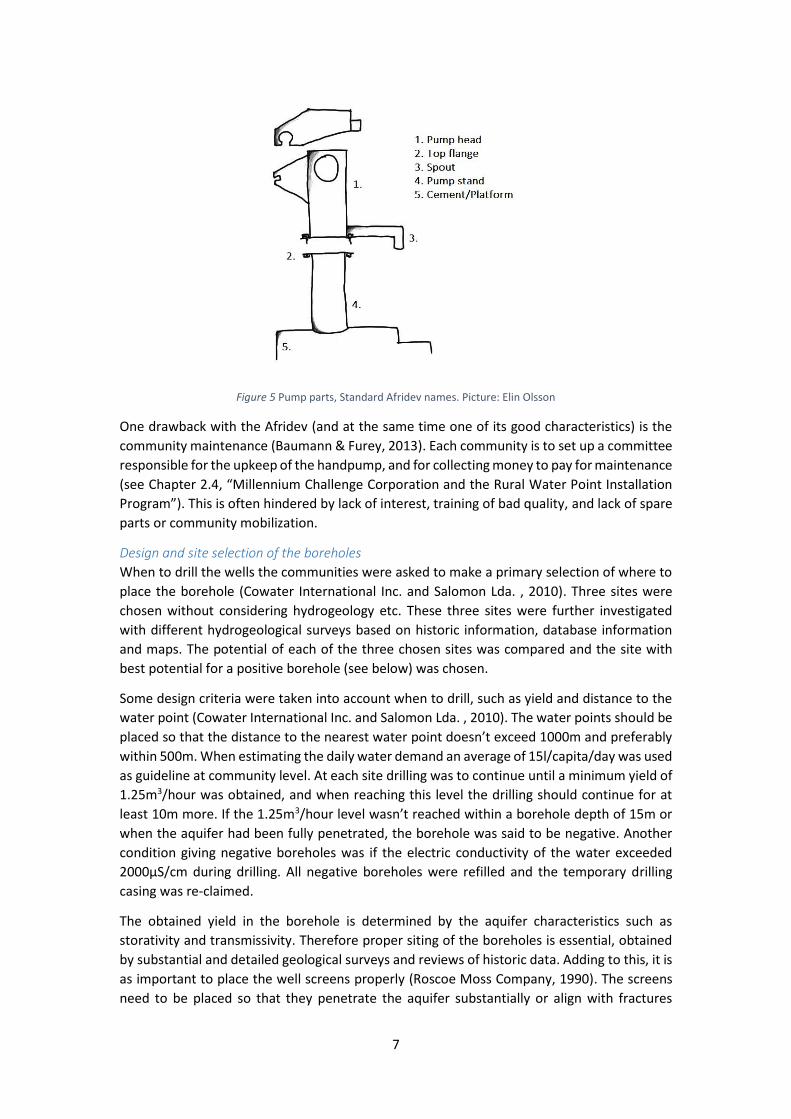
Figure 5 Pump parts, Standard Afridev names. Picture: Elin Olsson
One drawback with the Afridev (and at the same time one of its good characteristics) is the
community maintenance (Baumann & Furey, 2013). Each community is to set up a committee
responsible for the upkeep of the handpump, and for collecting money to pay for maintenance
(see Chapter 2.4, “Millennium Challenge Corporation and the Rural Water Point Installation
Program”). This is often hindered by lack of interest, training of bad quality, and lack of spare
parts or community mobilization.
Design and site selection of the boreholes
When to drill the wells the communities were asked to make a primary selection of where to
place the borehole (Cowater International Inc. and Salomon Lda. , 2010). Three sites were
chosen without considering hydrogeology etc. These three sites were further investigated
with different hydrogeological surveys based on historic information, database information
and maps. The potential of each of the three chosen sites was compared and the site with
best potential for a positive borehole (see below) was chosen.
Some design criteria were taken into account when to drill, such as yield and distance to the
water point (Cowater International Inc. and Salomon Lda. , 2010). The water points should be
placed so that the distance to the nearest water point doesn’t exceed 1000m and preferably
within 500m. When estimating the daily water demand an average of 15l/capita/day was used
as guideline at community level. At each site drilling was to continue until a minimum yield of
1.25m3/hour was obtained, and when reaching this level the drilling should continue for at
least 10m more. If the 1.25m3/hour level wasn’t reached within a borehole depth of 15m or
when the aquifer had been fully penetrated, the borehole was said to be negative. Another
condition giving negative boreholes was if the electric conductivity of the water exceeded
2000µS/cm during drilling. All negative boreholes were refilled and the temporary drilling
casing was re-claimed.
The obtained yield in the borehole is determined by the aquifer characteristics such as
storativity and transmissivity. Therefore proper siting of the boreholes is essential, obtained
by substantial and detailed geological surveys and reviews of historic data. Adding to this, it is
as important to place the well screens properly (Roscoe Moss Company, 1990). The screens
need to be placed so that they penetrate the aquifer substantially or align with fractures
8
allowing outtake of water. In Nampula the RWPIP drilling gave approximately 25% negative
boreholes (Cowater International Inc. and Salomon Lda. , 2010).
2.6 Geology and hydrogeology Groundwater is unavoidably found in geological structures (Fetter, 2014). As formations have
differing characteristics affecting groundwater flow, these are vital to take into consideration
when planning for well construction. The relationship between water processes and geologic
materials is studied within hydrogeology, and hydrogeology and geology are therefore key
factors governing the efficiency and outtake of water from wells.
2.6.1 Geology of Mozambique Generally one can say that Mozambique is divided into two main geological systems (United
Nations, Department of Technical Co-operation for Development, 1989). A Precambrian
crystalline basement, reaching from Archean to Upper Proterozoic, is found in the southwest,
central and eastern parts of the country (BAOBAB Resources, 2014). In the south and east
parts of the country this is most commonly covered by Phanerozoic sedimentary rocks
(BAOBAB Resources, 2014), here young Tertiary and Quaternary sediments and volcanic rocks
are dominant (British Geological Survey, 2002). In turn the Precambrian system can be divided
into two subsystems (United Nations, Department of Technical Co-operation for
Development, 1989). One is a base complex which is more than 2000 million years old
consisting mainly of green schists. The other is called the Mozambique Belt and is an upper
Precambrian complex produced by ongoing orogenies. The Mozambique Belt is a mainly
metamorphic formation consisting dominantly of gneiss.
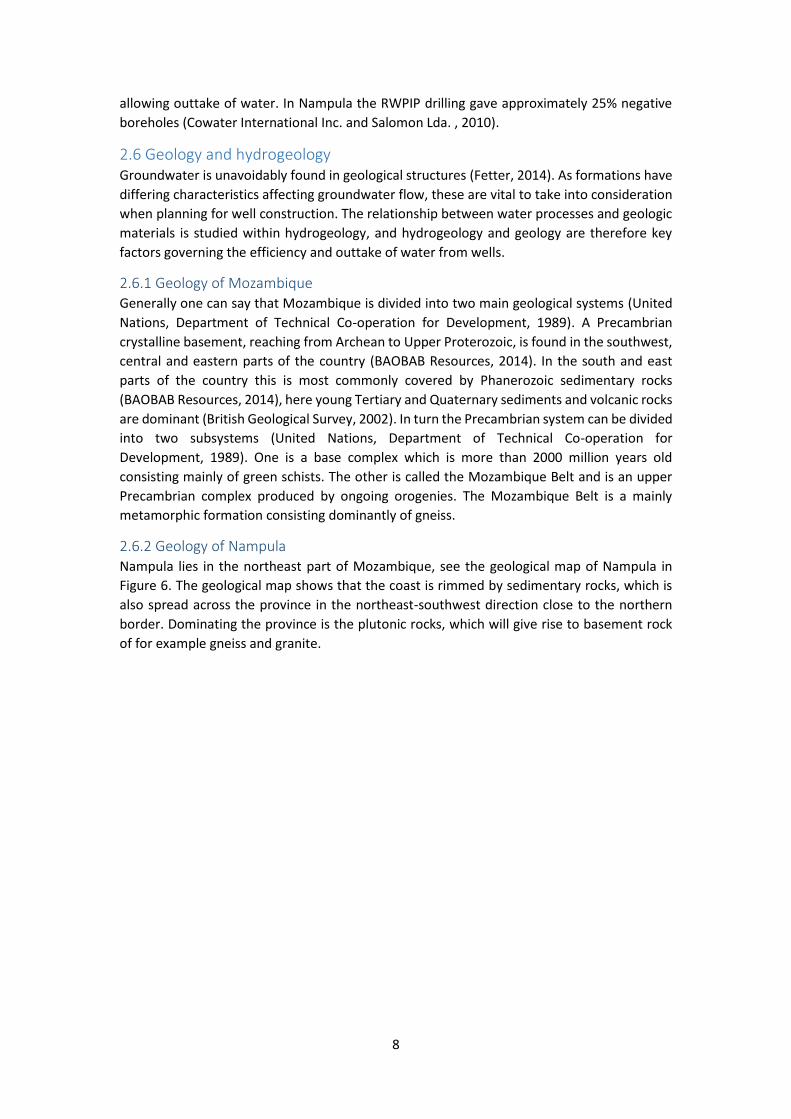
2.6.2 Geology of Nampula Nampula lies in the northeast part of Mozambique, see the geological map of Nampula in
Figure 6. The geological map shows that the coast is rimmed by sedimentary rocks, which is
also spread across the province in the northeast-southwest direction close to the northern
border. Dominating the province is the plutonic rocks, which will give rise to basement rock
of for example gneiss and granite.
9
Figure 6 Geology of Nampula Province, Mozambique. The districts of Mongicual, red outline, and Nampula, black outline, were the districts visited during this study (Chirindja, 2015).
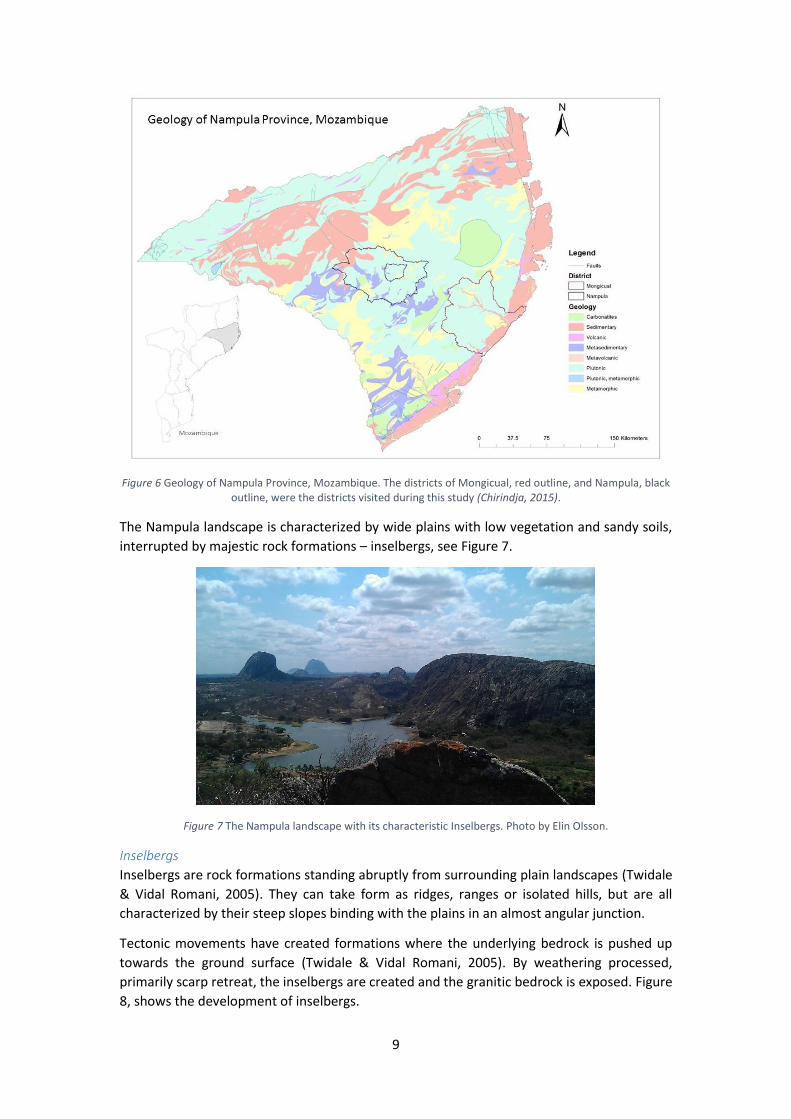
The Nampula landscape is characterized by wide plains with low vegetation and sandy soils,
interrupted by majestic rock formations – inselbergs, see Figure 7.
Figure 7 The Nampula landscape with its characteristic Inselbergs. Photo by Elin Olsson.
Inselbergs
Inselbergs are rock formations standing abruptly from surrounding plain landscapes (Twidale
& Vidal Romani, 2005). They can take form as ridges, ranges or isolated hills, but are all
characterized by their steep slopes binding with the plains in an almost angular junction.
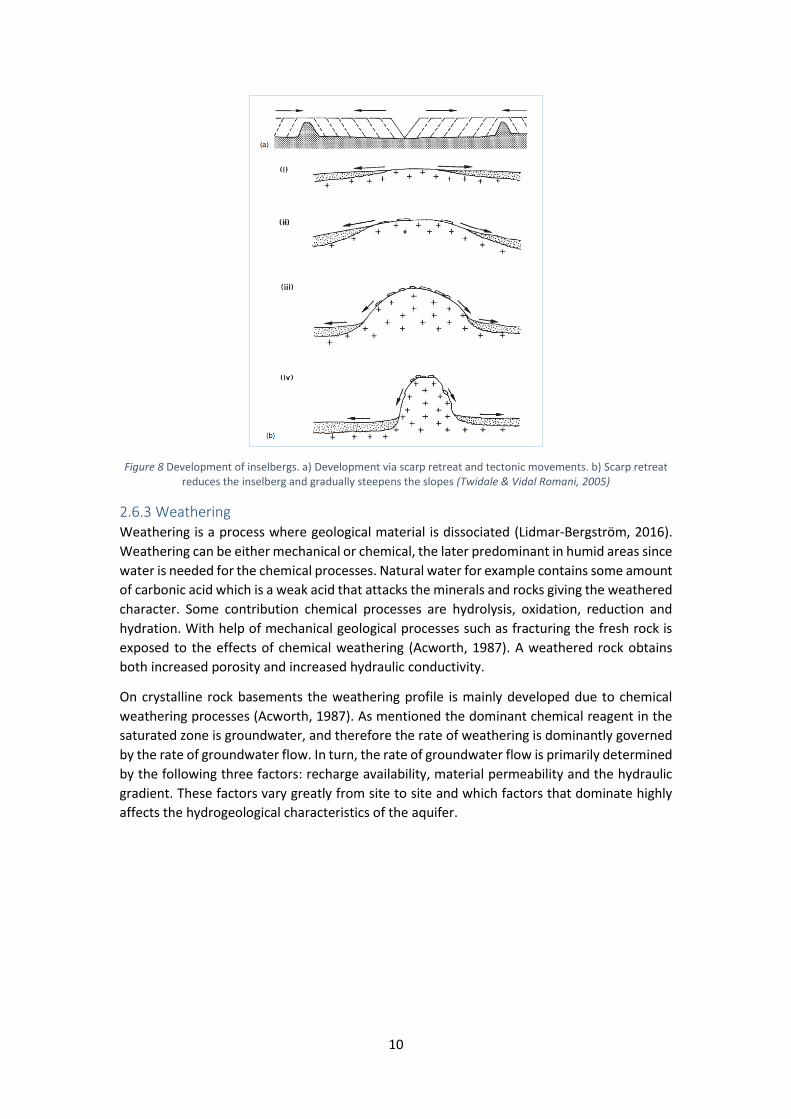
Tectonic movements have created formations where the underlying bedrock is pushed up
towards the ground surface (Twidale & Vidal Romani, 2005). By weathering processed,
primarily scarp retreat, the inselbergs are created and the granitic bedrock is exposed. Figure
8, shows the development of inselbergs.
10
Figure 8 Development of inselbergs. a) Development via scarp retreat and tectonic movements. b) Scarp retreat reduces the inselberg and gradually steepens the slopes (Twidale & Vidal Romani, 2005)
2.6.3 Weathering Weathering is a process where geological material is dissociated (Lidmar-Bergström, 2016).
Weathering can be either mechanical or chemical, the later predominant in humid areas since
water is needed for the chemical processes. Natural water for example contains some amount
of carbonic acid which is a weak acid that attacks the minerals and rocks giving the weathered
character. Some contribution chemical processes are hydrolysis, oxidation, reduction and
hydration. With help of mechanical geological processes such as fracturing the fresh rock is
exposed to the effects of chemical weathering (Acworth, 1987). A weathered rock obtains
both increased porosity and increased hydraulic conductivity.
On crystalline rock basements the weathering profile is mainly developed due to chemical
weathering processes (Acworth, 1987). As mentioned the dominant chemical reagent in the
saturated zone is groundwater, and therefore the rate of weathering is dominantly governed
by the rate of groundwater flow. In turn, the rate of groundwater flow is primarily determined
by the following three factors: recharge availability, material permeability and the hydraulic
gradient. These factors vary greatly from site to site and which factors that dominate highly
affects the hydrogeological characteristics of the aquifer.
11
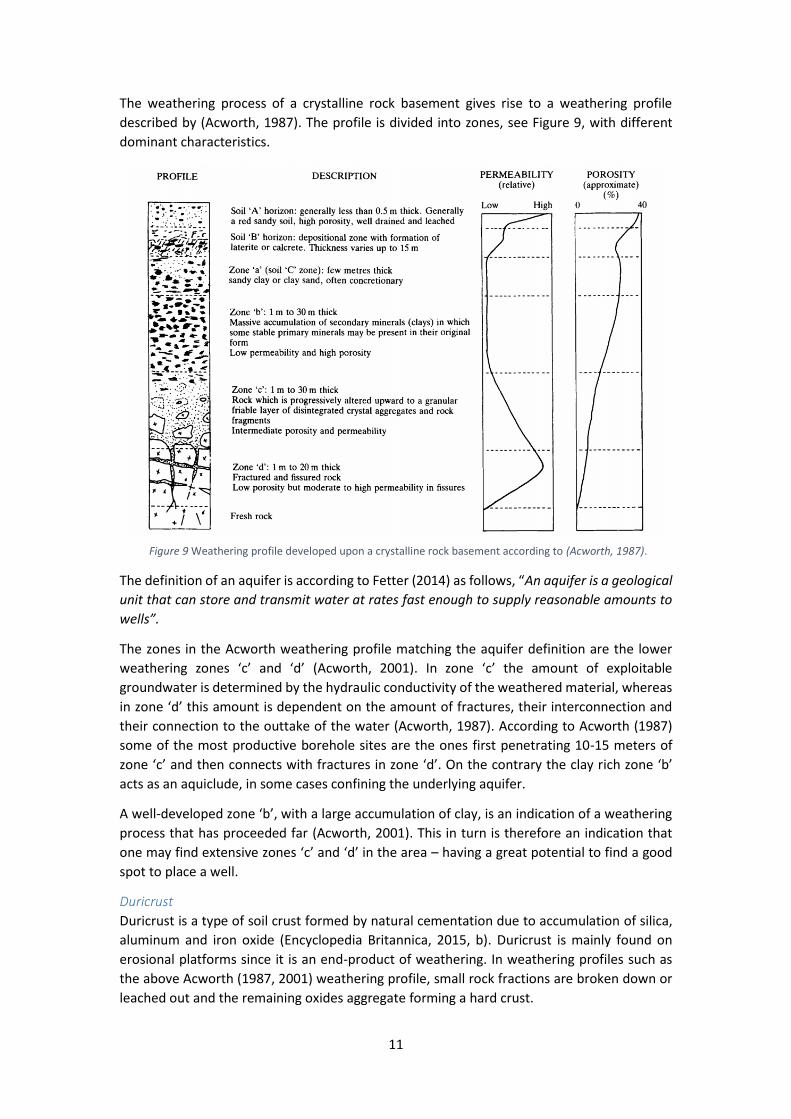
The weathering process of a crystalline rock basement gives rise to a weathering profile
described by (Acworth, 1987). The profile is divided into zones, see Figure 9, with different
dominant characteristics.
The definition of an aquifer is according to Fetter (2014) as follows, “An aquifer is a geological
unit that can store and transmit water at rates fast enough to supply reasonable amounts to
wells”.
The zones in the Acworth weathering profile matching the aquifer definition are the lower
weathering zones ‘c’ and ‘d’ (Acworth, 2001). In zone ‘c’ the amount of exploitable
groundwater is determined by the hydraulic conductivity of the weathered material, whereas
in zone ‘d’ this amount is dependent on the amount of fractures, their interconnection and
their connection to the outtake of the water (Acworth, 1987). According to Acworth (1987)
some of the most productive borehole sites are the ones first penetrating 10-15 meters of
zone ‘c’ and then connects with fractures in zone ‘d’. On the contrary the clay rich zone ‘b’
acts as an aquiclude, in some cases confining the underlying aquifer.
A well-developed zone ‘b’, with a large accumulation of clay, is an indication of a weathering
process that has proceeded far (Acworth, 2001). This in turn is therefore an indication that
one may find extensive zones ‘c’ and ‘d’ in the area – having a great potential to find a good
spot to place a well.
Duricrust
Duricrust is a type of soil crust formed by natural cementation due to accumulation of silica,
aluminum and iron oxide (Encyclopedia Britannica, 2015, b). Duricrust is mainly found on
erosional platforms since it is an end-product of weathering. In weathering profiles such as
the above Acworth (1987, 2001) weathering profile, small rock fractions are broken down or
leached out and the remaining oxides aggregate forming a hard crust.
Figure 9 Weathering profile developed upon a crystalline rock basement according to (Acworth, 1987).
12
Duricrust is found on many different types of rocks, for example granites, basalts and gabbros
(Encyclopedia Britannica, 2015, b). Igneous, metamorphic and sedimentary rock basement
can all show occurrence of duricrust.
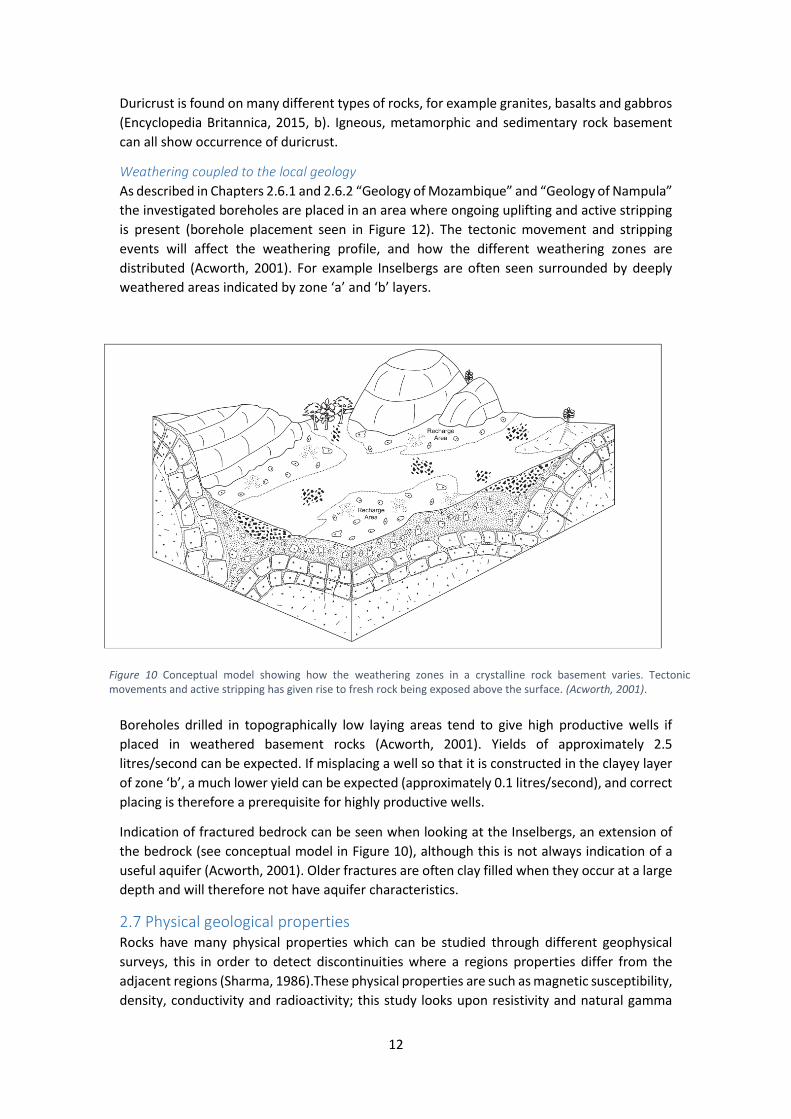
Weathering coupled to the local geology
As described in Chapters 2.6.1 and 2.6.2 “Geology of Mozambique” and “Geology of Nampula”
the investigated boreholes are placed in an area where ongoing uplifting and active stripping
is present (borehole placement seen in Figure 12). The tectonic movement and stripping
events will affect the weathering profile, and how the different weathering zones are
distributed (Acworth, 2001). For example Inselbergs are often seen surrounded by deeply
weathered areas indicated by zone ‘a’ and ‘b’ layers.
Boreholes drilled in topographically low laying areas tend to give high productive wells if
placed in weathered basement rocks (Acworth, 2001). Yields of approximately 2.5
litres/second can be expected. If misplacing a well so that it is constructed in the clayey layer
of zone ‘b’, a much lower yield can be expected (approximately 0.1 litres/second), and correct
placing is therefore a prerequisite for highly productive wells.
Indication of fractured bedrock can be seen when looking at the Inselbergs, an extension of
the bedrock (see conceptual model in Figure 10), although this is not always indication of a
useful aquifer (Acworth, 2001). Older fractures are often clay filled when they occur at a large
depth and will therefore not have aquifer characteristics.
2.7 Physical geological properties Rocks have many physical properties which can be studied through different geophysical
surveys, this in order to detect discontinuities where a regions properties differ from the
adjacent regions (Sharma, 1986).These physical properties are such as magnetic susceptibility,
density, conductivity and radioactivity; this study looks upon resistivity and natural gamma
Figure 10 Conceptual model showing how the weathering zones in a crystalline rock basement varies. Tectonic movements and active stripping has given rise to fresh rock being exposed above the surface. (Acworth, 2001).
13
radiation. Geophysics can be used to study for example internal structures of the earth,
mineral depositions, oil exploitation, or groundwater availability.
2.7.1 Natural Gamma Radiation Radioactivity is the natural phenomenon where atomic nucleus are disintegrated by emissions
of energy and particles of mass (Sharma, 1997). When it comes to gamma radiation, it is
electromagnetic radiation released from an excited nuclei during disintegration. The three
primary elements giving rise to natural gamma radiation are Thorium, Uranium and Potassium
(40) of which potassium is the one dominant in the earth crust (Alm, 2012). These radioactive
elements are found in different minerals and traces of such are present in all sedimentary and
igneous rocks (Parasnis, 1986), but concentrated in organic material, clay and shale (Alm,
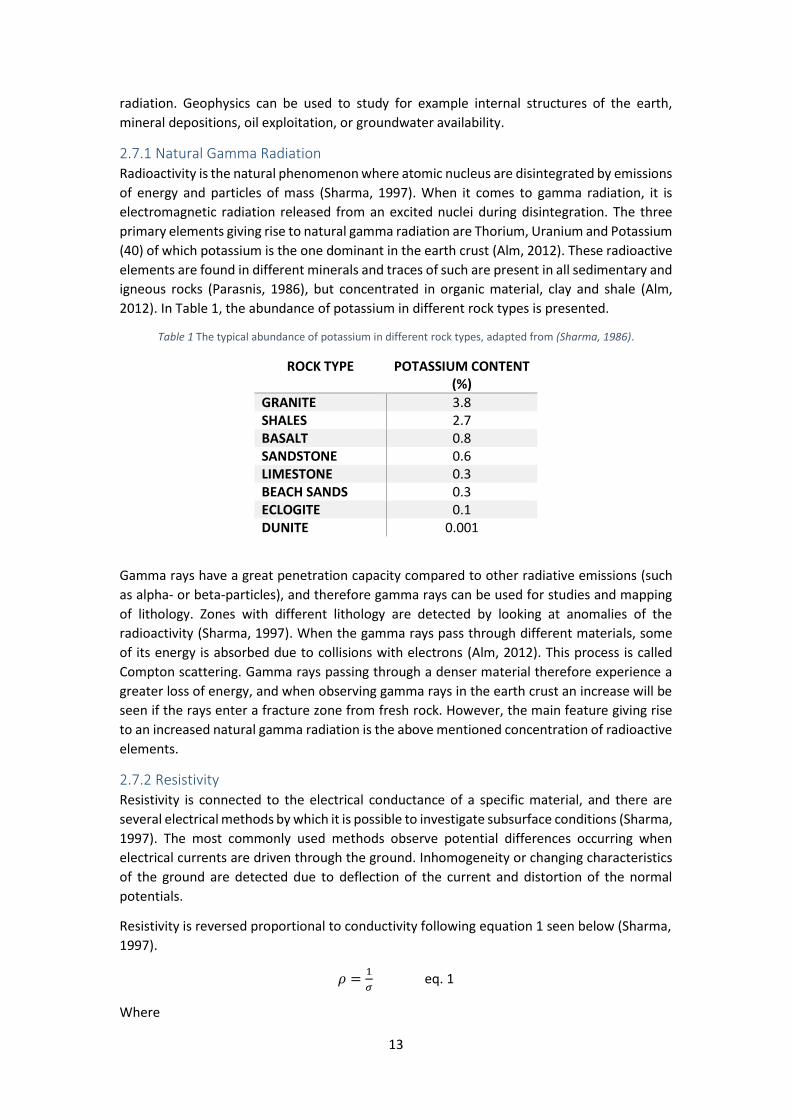
2012). In Table 1, the abundance of potassium in different rock types is presented.
Table 1 The typical abundance of potassium in different rock types, adapted from (Sharma, 1986).
ROCK TYPE POTASSIUM CONTENT (%)
GRANITE 3.8 SHALES 2.7 BASALT 0.8 SANDSTONE 0.6 LIMESTONE 0.3 BEACH SANDS 0.3 ECLOGITE 0.1 DUNITE 0.001
Gamma rays have a great penetration capacity compared to other radiative emissions (such
as alpha- or beta-particles), and therefore gamma rays can be used for studies and mapping
of lithology. Zones with different lithology are detected by looking at anomalies of the
radioactivity (Sharma, 1997). When the gamma rays pass through different materials, some
of its energy is absorbed due to collisions with electrons (Alm, 2012). This process is called
Compton scattering. Gamma rays passing through a denser material therefore experience a
greater loss of energy, and when observing gamma rays in the earth crust an increase will be
seen if the rays enter a fracture zone from fresh rock. However, the main feature giving rise
to an increased natural gamma radiation is the above mentioned concentration of radioactive
elements.
2.7.2 Resistivity Resistivity is connected to the electrical conductance of a specific material, and there are
several electrical methods by which it is possible to investigate subsurface conditions (Sharma,
1997). The most commonly used methods observe potential differences occurring when
electrical currents are driven through the ground. Inhomogeneity or changing characteristics
of the ground are detected due to deflection of the current and distortion of the normal
potentials.
Resistivity is reversed proportional to conductivity following equation 1 seen below (Sharma,
1997).
𝜌 =1
𝜎 eq. 1
Where
14
𝜎, is the conductivity measured in Siemens per meter (S/m).
ρ, is the resistivity measured in Ωm.
Conductivity of geological materials
Mineral grains are most often insulators if one disregards metallic ores and clay minerals
(Sharma, 1997). It is water in fissures and pores that act conducting, and a general rule is that
the more water filled pore space present the better conductivity. Hence, generally one can
say that hard rocks are bad conductors while pores, fissures, jointing and weathering adds
space for water and thereby increases the conductivity. On the contrary precipitation of
minerals, compaction and metamorphism will decrease the pore space and thereby decrease
the conductivity.
Groundwater is a natural electrolyte, with a lot of ions present (Sharma, 1997). If the
concentration or mobility of the ions is increased, the conductivity will increase. Ion mobility
is increased if the water temperature is increased. In clay soils ion exchange processes are
common and by these ions may be released into the pore water increasing the conductivity
further.
Due to all the above factors conductivity and resistivity are highly variable factors depending
on the formation characteristics (Sharma, 1997). There is no direct relationship between
resistivity and lithology but one can make general classifications on how the resistivity varies
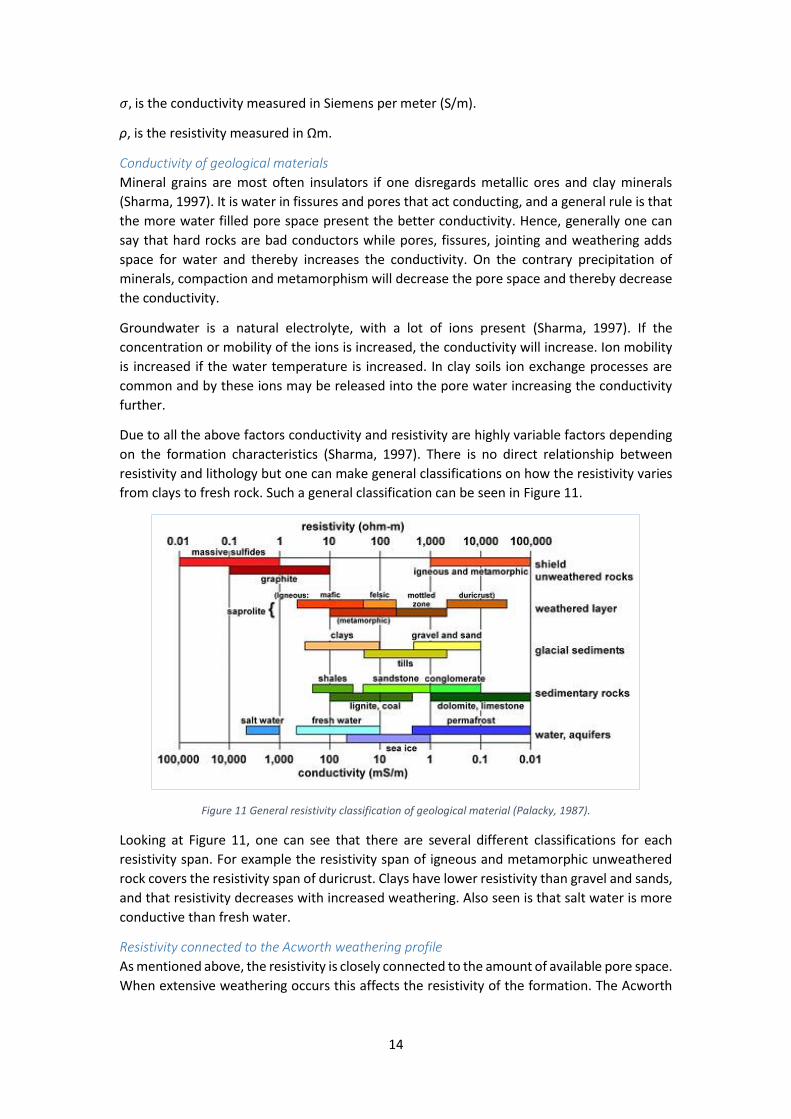
from clays to fresh rock. Such a general classification can be seen in Figure 11.
Figure 11 General resistivity classification of geological material (Palacky, 1987).
Looking at Figure 11, one can see that there are several different classifications for each
resistivity span. For example the resistivity span of igneous and metamorphic unweathered
rock covers the resistivity span of duricrust. Clays have lower resistivity than gravel and sands,
and that resistivity decreases with increased weathering. Also seen is that salt water is more
conductive than fresh water.
Resistivity connected to the Acworth weathering profile
As mentioned above, the resistivity is closely connected to the amount of available pore space.
When extensive weathering occurs this affects the resistivity of the formation. The Acworth
15
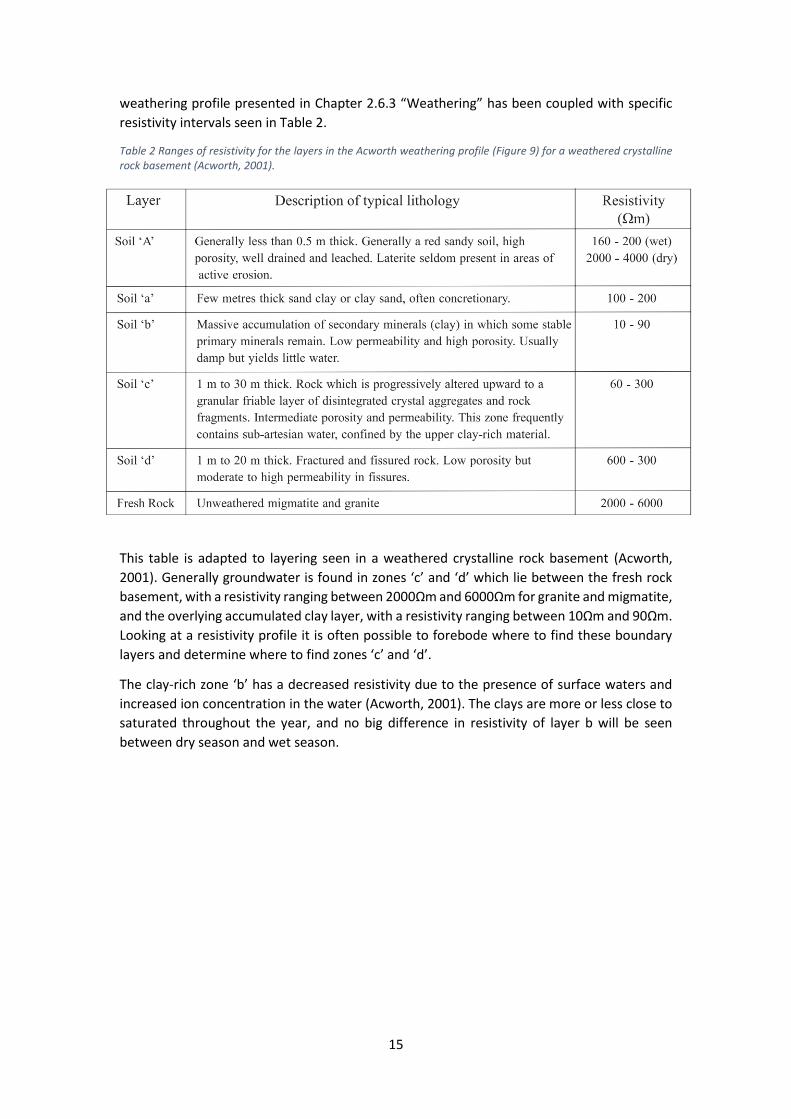
weathering profile presented in Chapter 2.6.3 “Weathering” has been coupled with specific
resistivity intervals seen in Table 2.
Table 2 Ranges of resistivity for the layers in the Acworth weathering profile (Figure 9) for a weathered crystalline rock basement (Acworth, 2001).
This table is adapted to layering seen in a weathered crystalline rock basement (Acworth,
2001). Generally groundwater is found in zones ‘c’ and ‘d’ which lie between the fresh rock
basement, with a resistivity ranging between 2000Ωm and 6000Ωm for granite and migmatite,
and the overlying accumulated clay layer, with a resistivity ranging between 10Ωm and 90Ωm.
Looking at a resistivity profile it is often possible to forebode where to find these boundary
layers and determine where to find zones ‘c’ and ‘d’.
The clay-rich zone ‘b’ has a decreased resistivity due to the presence of surface waters and
increased ion concentration in the water (Acworth, 2001). The clays are more or less close to
saturated throughout the year, and no big difference in resistivity of layer b will be seen
between dry season and wet season.
16
3. Methodology This study can be divided into two major parts of which the first is geophysical borehole data
gathering – the field survey, and the second is data processing and analyse. This methodology
chapter describes the process of execution for both parts separately.
3.1 Geophysical borehole logging Borehole logging is a way of detecting physical properties in the rock surrounding a borehole
(Sharma, 1997). When measuring one creates a so called borehole log or well log which shows
the measured physical property as a function of the depth. The borehole log can in many cases
provide more direct information regarding for example formation thickness, permeability,
temperature and formation fluid content than investigations made above the ground surface.
There are many types of logging systems which all utilize different techniques and measure
different geophysical properties (Sharma, 1997). Such systems include for example caliper logs
measuring the borehole diameter, electrical logs measuring resistivity of the formation and
radiometric logs measuring the radioactivity of the formation. In this study a dual induction
logging probe was used. The measuring device of the logging system is the downhole probe
or sonde, this is often containing a combination of logging tools making it possible to measure
more than one physical property at a time. In addition to the sonde the logging system consists
of a winch raising the probe with a multicore cable, an on surface probe-control module and
a unit for recording of the measured data.
3.1.1 Induction logs Induction probes are coaxial multi-coiled (not all but several) systems, with the axis along the
borehole axis (Sharma, 1997) (Parasnis, 1986). The probe induces current flows in the rock
formation by transmitting an electromagnetic field. The induced currents are homocentric
around the borehole and are loop-shaped. A secondary electromagnetic field is generated due
to the induced currents and this secondary electromagnetic field in turn produces voltages in
the receiver coil. The resistivity of the rock formation is linked to the coil response via
empirical formulas, although in the case with homogeneous formations the resistivity is
approximately proportional to the secondary current (Parasnis, 1986). The used frequencies
lie between 20 and 30 kHz.
When logging it is important to take into consideration the type of casing used in the borehole
(Hallenburg, 1998). A highly conductive casing, made of for example steel or aluminium, will
be the source of virtually all the signal seen from an induction log since the transmitted
electromagnetic field will give resonance in the casing. Induction logging therefore needs to
be carried out in open boreholes, or in boreholes with plastic or glass fibre casing (highly
resistive but transparent to electric magnetic fields).
Negative conductivity values do not occur naturally, however when conducting inductive
logging it is possible to register negative conductivity values (Ellis & Singer, 2008). This mainly
occurs in non-smooth boreholes. It is the nature of the logging probe that gives rise to negative
conductivity values when transmitting and receiving signals interfere. Hence, these
conductivities are not coupled to the geological formations and are therefore ignored in this
study.
Robertson Geologging dual induction logging probe
The Robertson Geologging dual induction logging probe (Robertson Geologging Limited ,
2015a) was used for this study. This probe has capacity to measure electric conductivity of the
17
rock formation, magnetic susceptibility and natural gamma radiation in the vicinity of the
borehole. In addition the inner temperature of the probe is registered.
Electric conductivity and magnetic susceptibility is registered at two measurement points in
the receiver coil. These points are placed 52cm respectively 84cm from the bottom of the
sonde and called short conductivity (SCON) respectively long conductivity (LCON). The
difference between the two is the obtained penetration depth into the rock formation – long
spaced giving a deeper penetration depth.
This dual induction logging probe is limited to the operation resistivity range of 0.3-300Ωm.
This does not cover the whole resistivity span expected in the hydrogeological environment
of the Nampula area, where fresh, fractured and fissured rock is expected to have higher
resistivity reaching up to at least ten fold this value (see Figure 11 and Table 2).
When turning on the power supply to the sonde, there is a start-up period when the probe
needs to stabilise in order to get valid readings. If logging is conducted during this start-up
period, large fluctuations in the conductivity log will be seen. The length of the start-up period
is hard to determine. Further on in this report, fluctuation in the start (bottom) of the
resistivity log will be called start-up or starting errors, if it is believed that logging has started
during this start-up period.
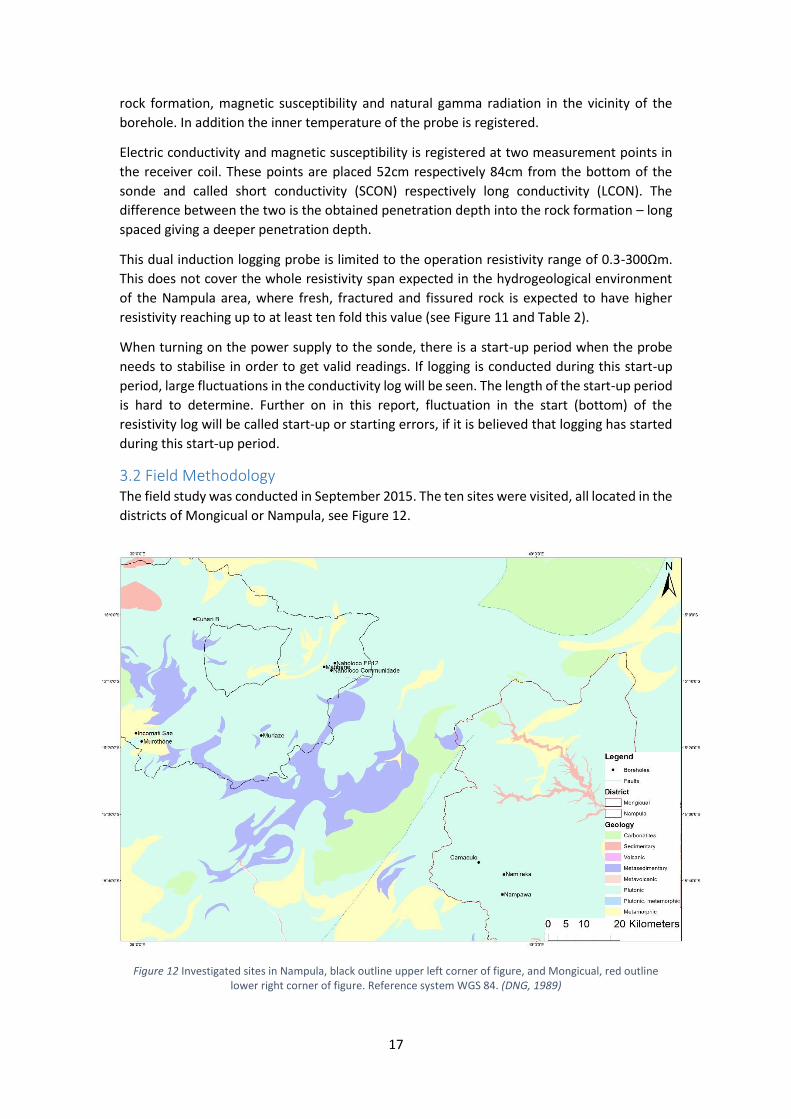
3.2 Field Methodology The field study was conducted in September 2015. The ten sites were visited, all located in the
districts of Mongicual or Nampula, see Figure 12.
Figure 12 Investigated sites in Nampula, black outline upper left corner of figure, and Mongicual, red outline lower right corner of figure. Reference system WGS 84. (DNG, 1989)
18
3.2.1 Site location Sites were chosen based on earlier investigations done in the area by Andersson and
Björkström (May 2013), and Enkel and Sjöstrand (September – October 2012). Since this
investigation required access to open boreholes, only the boreholes regarded as positive and
with sufficient yield for communal use could be investigated. The so called negative boreholes
had all been refilled hindering investigation with the used method.
A substantial data base with information from the drilling, well construction etc. was desired
for each location. When needed to choose between investigation sites, locations with more
than one ERT-profile, good positioning of the profile with regard to the borehole and available
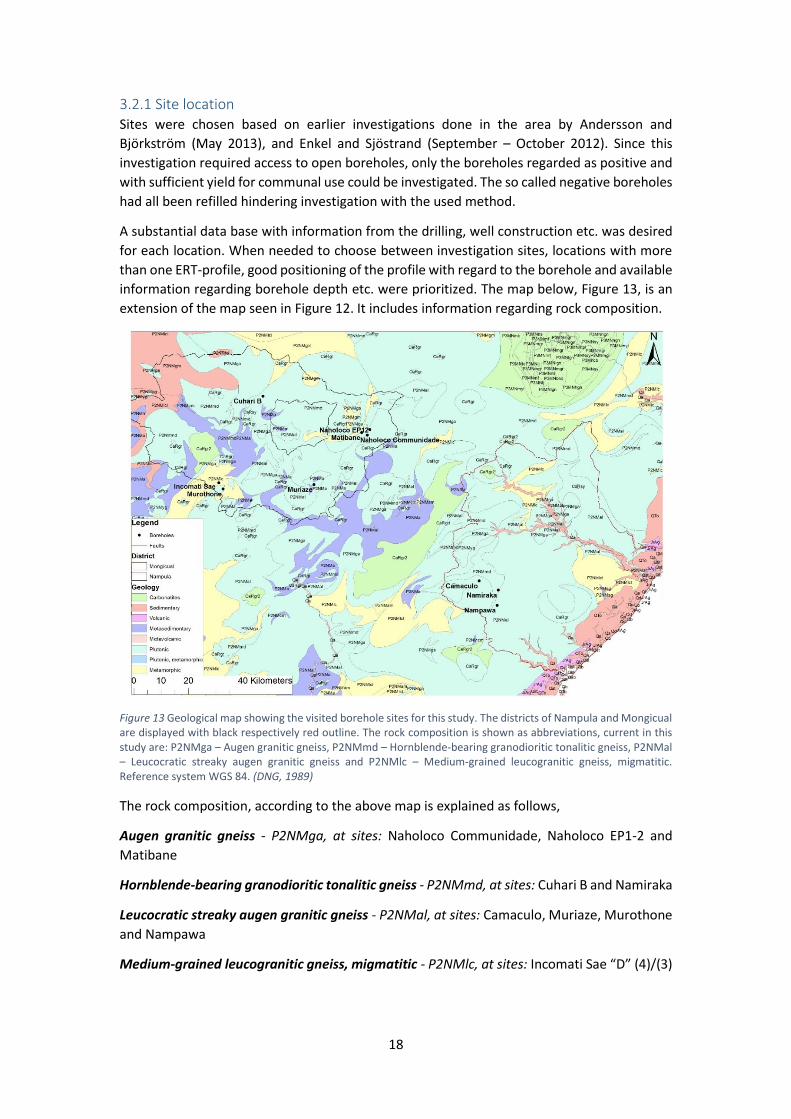
information regarding borehole depth etc. were prioritized. The map below, Figure 13, is an
extension of the map seen in Figure 12. It includes information regarding rock composition.
Figure 13 Geological map showing the visited borehole sites for this study. The districts of Nampula and Mongicual are displayed with black respectively red outline. The rock composition is shown as abbreviations, current in this study are: P2NMga – Augen granitic gneiss, P2NMmd – Hornblende-bearing granodioritic tonalitic gneiss, P2NMal – Leucocratic streaky augen granitic gneiss and P2NMlc – Medium-grained leucogranitic gneiss, migmatitic. Reference system WGS 84. (DNG, 1989)
The rock composition, according to the above map is explained as follows,
Augen granitic gneiss - P2NMga, at sites: Naholoco Communidade, Naholoco EP1-2 and
Matibane
Hornblende-bearing granodioritic tonalitic gneiss - P2NMmd, at sites: Cuhari B and Namiraka
Leucocratic streaky augen granitic gneiss - P2NMal, at sites: Camaculo, Muriaze, Murothone
and Nampawa
Medium-grained leucogranitic gneiss, migmatitic - P2NMlc, at sites: Incomati Sae “D” (4)/(3)
19
3.2.2 Local water committee contact Due to the Rural Water Point Installation Program each water point was expected to have a
local water committee responsible for the water point. In order to access each borehole, this
committee was contacted via persons responsible for the water at each administrative post
in each district.
The local water committee gave information regarding the use of the water points, perceived
quality of the water, if the pump had been in use before initiation of the measurements and
so forth.
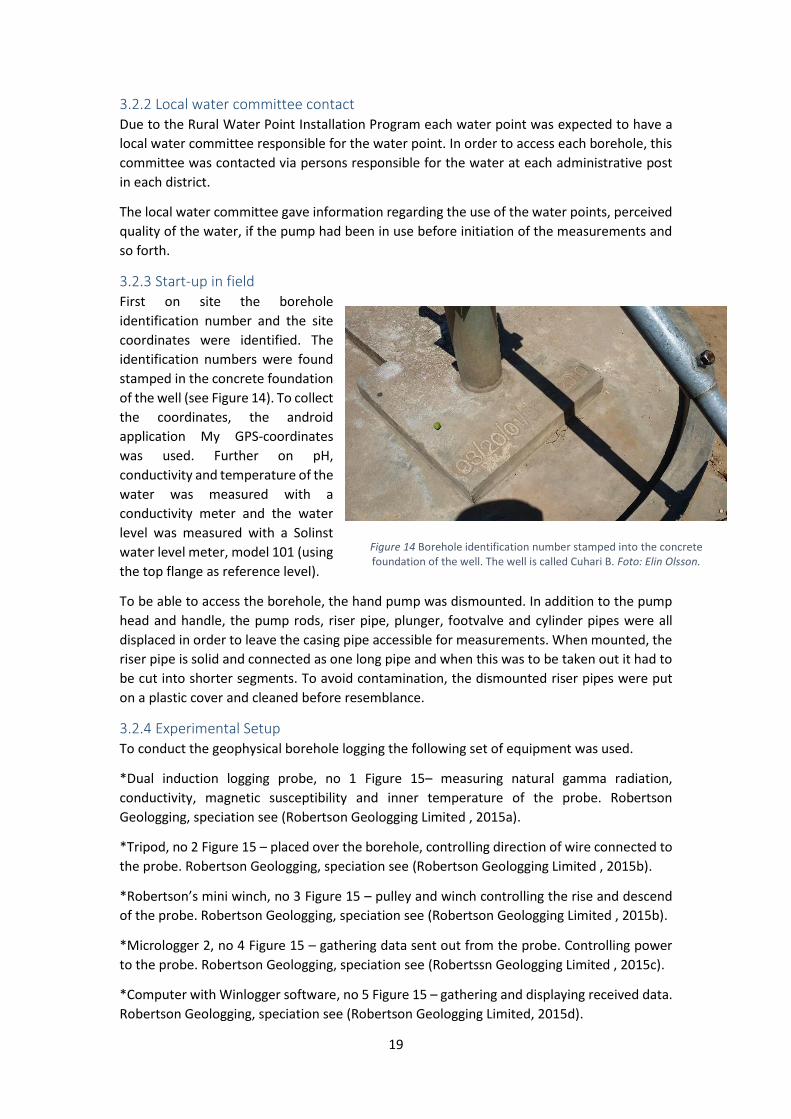
3.2.3 Start-up in field First on site the borehole
identification number and the site
coordinates were identified. The
identification numbers were found
stamped in the concrete foundation
of the well (see Figure 14). To collect
the coordinates, the android
application My GPS-coordinates
was used. Further on pH,
conductivity and temperature of the
water was measured with a
conductivity meter and the water
level was measured with a Solinst
water level meter, model 101 (using
the top flange as reference level).
To be able to access the borehole, the hand pump was dismounted. In addition to the pump
head and handle, the pump rods, riser pipe, plunger, footvalve and cylinder pipes were all
displaced in order to leave the casing pipe accessible for measurements. When mounted, the
riser pipe is solid and connected as one long pipe and when this was to be taken out it had to
be cut into shorter segments. To avoid contamination, the dismounted riser pipes were put
on a plastic cover and cleaned before resemblance.
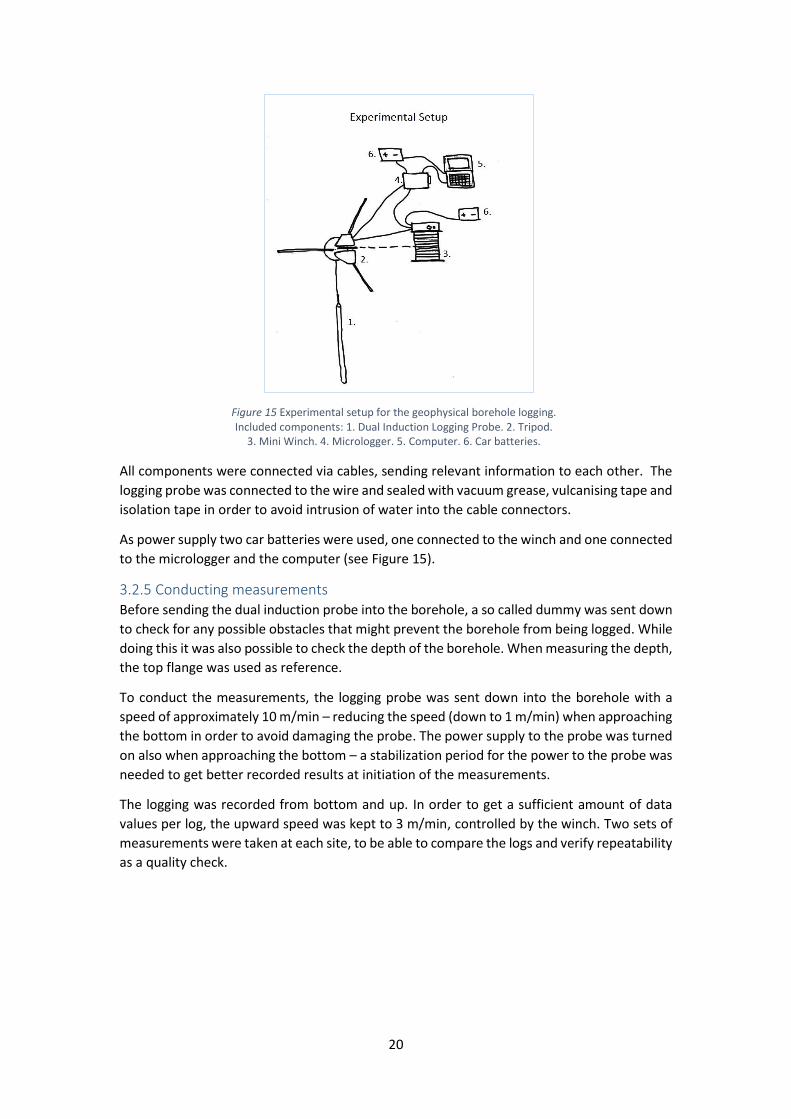
3.2.4 Experimental Setup To conduct the geophysical borehole logging the following set of equipment was used.
*Dual induction logging probe, no 1 Figure 15– measuring natural gamma radiation,
conductivity, magnetic susceptibility and inner temperature of the probe. Robertson
Geologging, speciation see (Robertson Geologging Limited , 2015a).
*Tripod, no 2 Figure 15 – placed over the borehole, controlling direction of wire connected to
the probe. Robertson Geologging, speciation see (Robertson Geologging Limited , 2015b).
*Robertson’s mini winch, no 3 Figure 15 – pulley and winch controlling the rise and descend
of the probe. Robertson Geologging, speciation see (Robertson Geologging Limited , 2015b).
*Micrologger 2, no 4 Figure 15 – gathering data sent out from the probe. Controlling power
to the probe. Robertson Geologging, speciation see (Robertssn Geologging Limited , 2015c).
*Computer with Winlogger software, no 5 Figure 15 – gathering and displaying received data.
Robertson Geologging, speciation see (Robertson Geologging Limited, 2015d).
Figure 14 Borehole identification number stamped into the concrete foundation of the well. The well is called Cuhari B. Foto: Elin Olsson.
20
All components were connected via cables, sending relevant information to each other. The
logging probe was connected to the wire and sealed with vacuum grease, vulcanising tape and
isolation tape in order to avoid intrusion of water into the cable connectors.
As power supply two car batteries were used, one connected to the winch and one connected
to the micrologger and the computer (see Figure 15).
3.2.5 Conducting measurements Before sending the dual induction probe into the borehole, a so called dummy was sent down
to check for any possible obstacles that might prevent the borehole from being logged. While
doing this it was also possible to check the depth of the borehole. When measuring the depth,
the top flange was used as reference.
To conduct the measurements, the logging probe was sent down into the borehole with a
speed of approximately 10 m/min – reducing the speed (down to 1 m/min) when approaching
the bottom in order to avoid damaging the probe. The power supply to the probe was turned
on also when approaching the bottom – a stabilization period for the power to the probe was
needed to get better recorded results at initiation of the measurements.
The logging was recorded from bottom and up. In order to get a sufficient amount of data
values per log, the upward speed was kept to 3 m/min, controlled by the winch. Two sets of
measurements were taken at each site, to be able to compare the logs and verify repeatability
as a quality check.
Figure 15 Experimental setup for the geophysical borehole logging. Included components: 1. Dual Induction Logging Probe. 2. Tripod.
3. Mini Winch. 4. Micrologger. 5. Computer. 6. Car batteries.
21
3.3 Data Processing The geophysical borehole logging equipment was used with the software Win Logger, version
494 distributed by Robertson Geologging Limited, speciation see (Robertson Geologging
Limited, 2015d). It was primarily used for real-time display of the recorded data and to control
the power to the probe but also to control the measurement proceeding and to export the
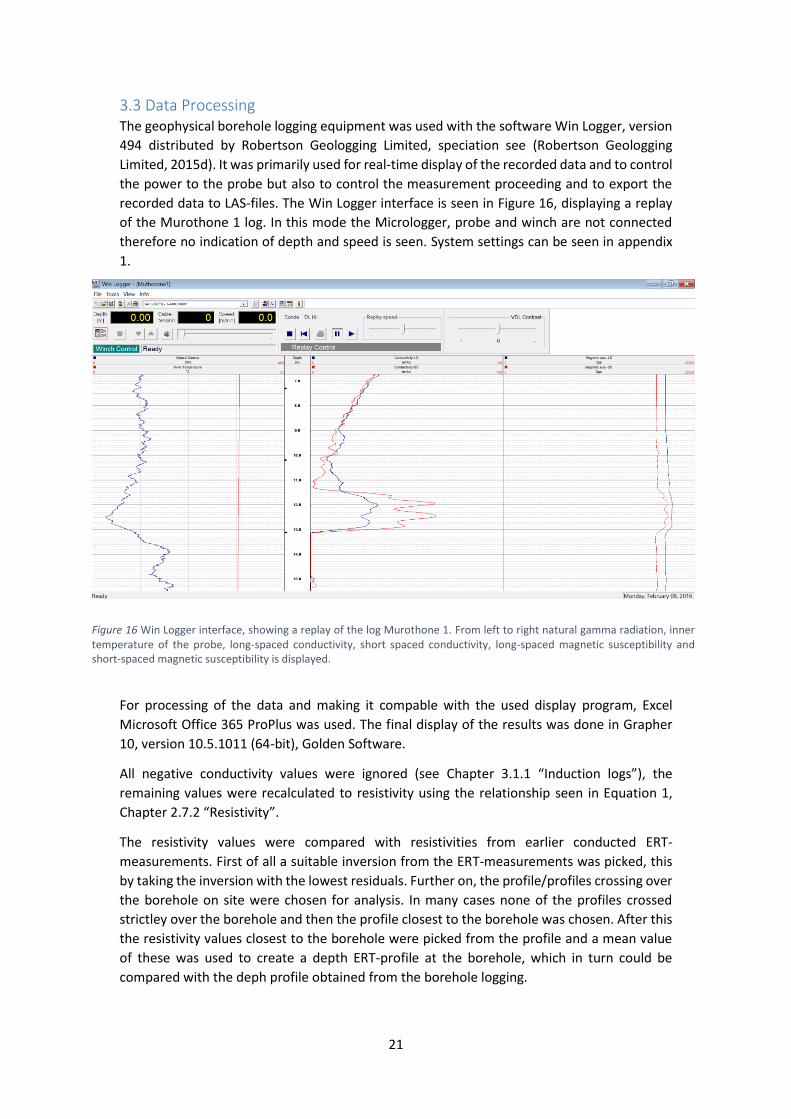
recorded data to LAS-files. The Win Logger interface is seen in Figure 16, displaying a replay
of the Murothone 1 log. In this mode the Micrologger, probe and winch are not connected
therefore no indication of depth and speed is seen. System settings can be seen in appendix
1.
For processing of the data and making it compable with the used display program, Excel
Microsoft Office 365 ProPlus was used. The final display of the results was done in Grapher
10, version 10.5.1011 (64-bit), Golden Software.
All negative conductivity values were ignored (see Chapter 3.1.1 “Induction logs”), the
remaining values were recalculated to resistivity using the relationship seen in Equation 1,
Chapter 2.7.2 “Resistivity”.
The resistivity values were compared with resistivities from earlier conducted ERT-
measurements. First of all a suitable inversion from the ERT-measurements was picked, this
by taking the inversion with the lowest residuals. Further on, the profile/profiles crossing over
the borehole on site were chosen for analysis. In many cases none of the profiles crossed
strictley over the borehole and then the profile closest to the borehole was chosen. After this
the resistivity values closest to the borehole were picked from the profile and a mean value
of these was used to create a depth ERT-profile at the borehole, which in turn could be
compared with the deph profile obtained from the borehole logging.
Figure 16 Win Logger interface, showing a replay of the log Murothone 1. From left to right natural gamma radiation, inner temperature of the probe, long-spaced conductivity, short spaced conductivity, long-spaced magnetic susceptibility and short-spaced magnetic susceptibility is displayed.
22
To correlate the resistivity values from the geophysical borehole logging with the resistivity
values from the ERT-measurements the depth scales had to be adjusted. Since the top of the
casing was used as reference while conducting the borehole logging the height of the casing
(above ground) was subtracted from each depth step in order to match with the ERT depth
scale where ground level was used as reference. Further more the borehole logging probe
registers conductivity and magnetic susceptibility values at the bottom of the probe, ie the
measurements will start at a depth of between 2m and 3m below ground.
For further analysis and geological interpretation, the resistivity logs from the geophysical
borehole logging were divided into layers with similarities in representation. The main
similarities that were looked upon was quantitative values of the resistivity and degree of
fluctuations in the resistivity log. For each layer a mean value of the resistivity was calculated.
For the interpretation, the mean values and the value spans were compared to Figure 11 and
Table 2 seen in Chapter 2.7.2 “Resistivity”. In addition the geological interpretation was
compared to given layering sequences if such were available, in order to validate the
interpretation.
Important to remember is that all values from the geophysical borehole logging are from the
strict vicinity of the borehole and only represent values from the penetration depth of the
logging probe (see Chapter 3.1.1 “Induction logs”). Therefore also the geological
interpretations are restricted to the vicinity of the boreholes.
23
4. Results and Interpretations In this study ten sites were investigated, all presented separately in this chapter in alphabetical
order. For each site both the natural gamma radiation and resistivity obtained from the
borehole logging will be displayed, in addition resistivity values from ERT-measurements in
previous studies will be shown enabling comparison between the obtained resistivity values.
The data from the borehole logging are values representing geophysical properties of the
subsurface, they do not by themselves show the geological environment but need to be
geologically interpreted as stated in the aim (see Chapter 1.1 “Aim”). The geological
interpretation for each site will be presented under each site subchapter and is based on the
Acworth weathering profile and the general resistivity classification of geological materials
seen in Table 2 and Figures 9 and 11, presented in Chapters 2.6.3 “Weathering” and 2.7.2
“Resistivity”. Interpretations have also been made based on information on natural gamma
radiation in Chapter 2.7.1, “Natural gamma radiation”.
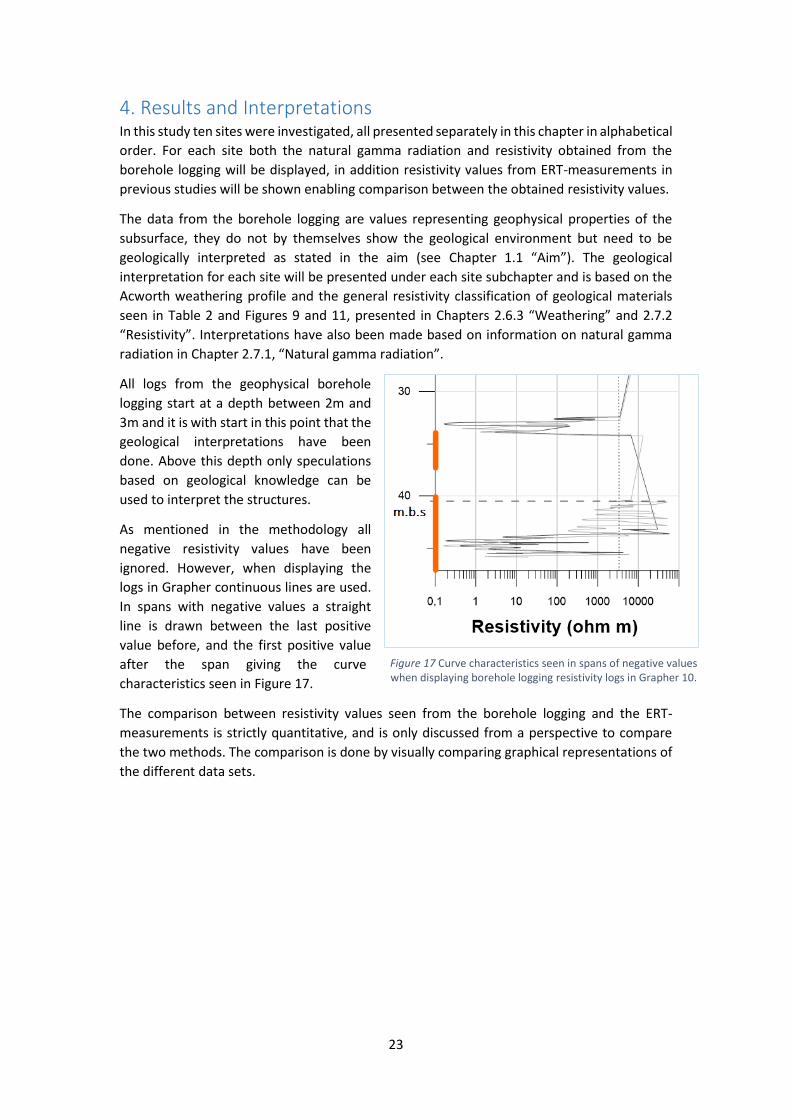
All logs from the geophysical borehole
logging start at a depth between 2m and
3m and it is with start in this point that the
geological interpretations have been
done. Above this depth only speculations
based on geological knowledge can be
used to interpret the structures.
As mentioned in the methodology all
negative resistivity values have been
ignored. However, when displaying the
logs in Grapher continuous lines are used.
In spans with negative values a straight
line is drawn between the last positive
value before, and the first positive value
after the span giving the curve
characteristics seen in Figure 17.
The comparison between resistivity values seen from the borehole logging and the ERT-
measurements is strictly quantitative, and is only discussed from a perspective to compare
the two methods. The comparison is done by visually comparing graphical representations of
the different data sets.
Figure 17 Curve characteristics seen in spans of negative values when displaying borehole logging resistivity logs in Grapher 10.
24
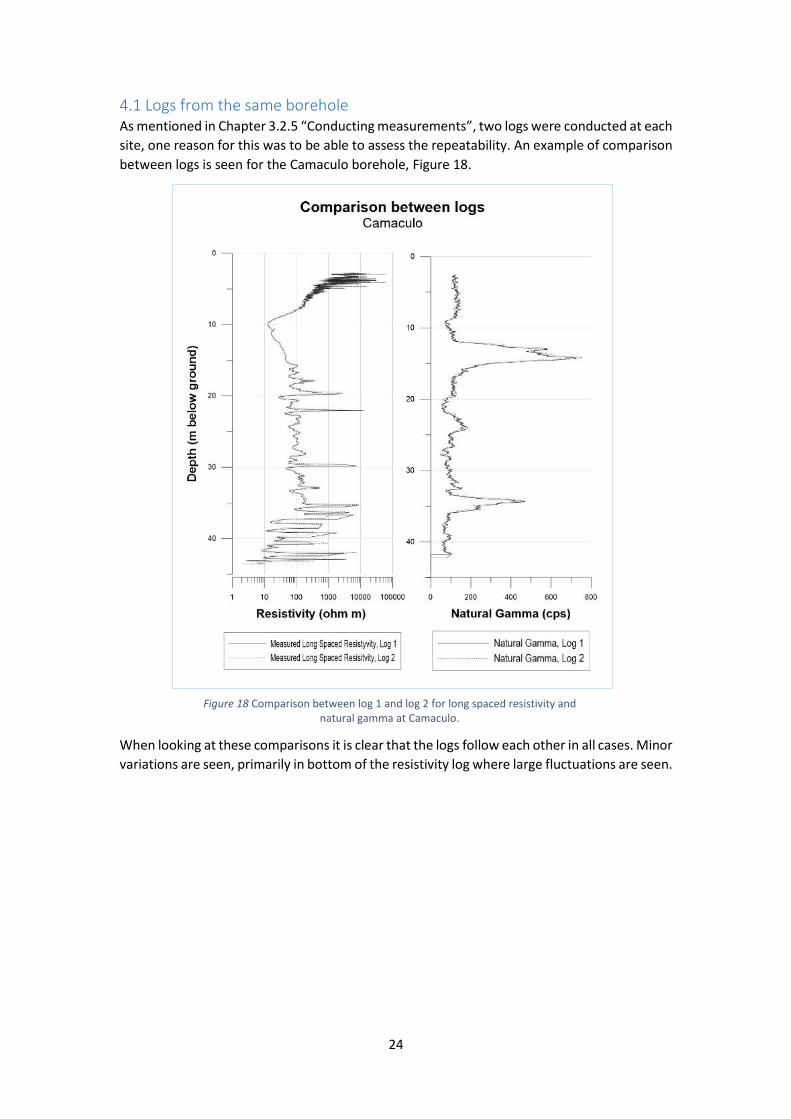
4.1 Logs from the same borehole As mentioned in Chapter 3.2.5 “Conducting measurements”, two logs were conducted at each
site, one reason for this was to be able to assess the repeatability. An example of comparison
between logs is seen for the Camaculo borehole, Figure 18.
When looking at these comparisons it is clear that the logs follow each other in all cases. Minor
variations are seen, primarily in bottom of the resistivity log where large fluctuations are seen.
Figure 18 Comparison between log 1 and log 2 for long spaced resistivity and natural gamma at Camaculo.
25
4.2 Camaculo
4.2.1 Site description and borehole information Camaculo is situated 10 km west of Liúpo, a few km of the main road. The borehole was
denoted status positive saline in the summary of the Daily Drilling Activity Reports (Appendix
3). At Camaculo the borehole lies approximately 6.5m off the ERT-profile used for comparison
of resistivity values. In Table 3 below, general data from Camaculo is displayed.
Table 3 General information from borehole at Camaculo. Denotation given means information from the daily drilling report summary or (Andersson & Björkström, 2013)and measured data means data measured on site at the time of the investigation.
CAMACULO IDENTIFICATION NO: 03/10/05/0038/2012
COORDINATES 15°37’15.85’’S 39°51’20.59’’E 9m precision CONDUCTIVITY 1444µS/cm PH 6.38 WATER TEMPERATURE 27.6°C BOREHOLE DEPTH Given: 45 m Measured: 44.9m WATER LEVEL Given: 19.43m.b.s Measured: 11.75m.b.s (at arrival on site) WELL-SCREEN PLACEMENT Given: 34.5-43.5m YIELD Given: 1.2m3/h
According to the geological map in Figure 13 the borehole is placed in leucocratic streaky
augen granitic gneiss. Further this is classified as plutonic. In Table 4, one can find the
geological information from the borehole, adapted from Andersson and Björkström (2013).
Table 4 Geological information from the Camaculo borehole, adapted from (Andersson & Björkström, 2013)
GEOLOGICAL FORMATION DEPTHS
(M BELOW GROUND)
SOIL 0-1 CLAYEY SAND 1-5 FINE SAND 5-12 QUARTZ 12-15 VERY WEATHERED GNEISS 15-33 FRACTURED GNEISS 33-43 SOLID GNEISS 43-45
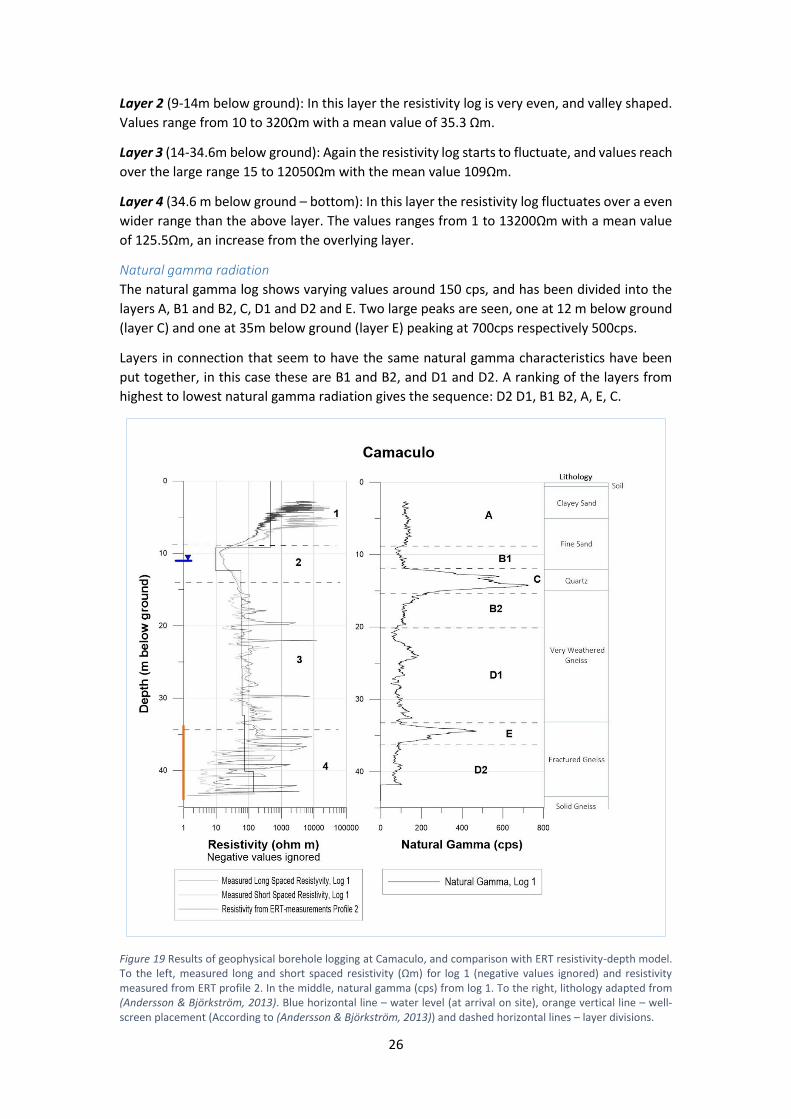
4.2.2 Acquired data The acquired resistivity and natural gamma data from the geophysical borehole logging, is
presented in Figure 19 below. The presented log (log 1) streaches from 2.6m to 44.0m below
ground.
Resistivity
The resistivity logs (long spaced and short spaced) are very fluctuating streaching within the
range 2-58800Ωm, seen in Figure 19. The resistivity log has been divided into 4 different layers
with respect to value and shape of the borehole logging resistivity curve.
Layer 1 (top layer, 0-9m below ground): The resistivity log in this layer shows high frequent
large variations and a large drop towards the bottom of the layer. Values range from 80 to
58800Ωm with a mean value of 1693Ωm.
26
Layer 2 (9-14m below ground): In this layer the resistivity log is very even, and valley shaped.
Values range from 10 to 320Ωm with a mean value of 35.3 Ωm.
Layer 3 (14-34.6m below ground): Again the resistivity log starts to fluctuate, and values reach
over the large range 15 to 12050Ωm with the mean value 109Ωm.
Layer 4 (34.6 m below ground – bottom): In this layer the resistivity log fluctuates over a even
wider range than the above layer. The values ranges from 1 to 13200Ωm with a mean value
of 125.5Ωm, an increase from the overlying layer.
Natural gamma radiation
The natural gamma log shows varying values around 150 cps, and has been divided into the
layers A, B1 and B2, C, D1 and D2 and E. Two large peaks are seen, one at 12 m below ground
(layer C) and one at 35m below ground (layer E) peaking at 700cps respectively 500cps.
Layers in connection that seem to have the same natural gamma characteristics have been
put together, in this case these are B1 and B2, and D1 and D2. A ranking of the layers from
highest to lowest natural gamma radiation gives the sequence: D2 D1, B1 B2, A, E, C.
Figure 19 Results of geophysical borehole logging at Camaculo, and comparison with ERT resistivity-depth model. To the left, measured long and short spaced resistivity (Ωm) for log 1 (negative values ignored) and resistivity measured from ERT profile 2. In the middle, natural gamma (cps) from log 1. To the right, lithology adapted from (Andersson & Björkström, 2013). Blue horizontal line – water level (at arrival on site), orange vertical line – well-screen placement (According to (Andersson & Björkström, 2013)) and dashed horizontal lines – layer divisions.
27
4.2.3 Comparison between ERT and borehole logging resistivity Figure 19 also shows a resistivity profile from an ERT-measurement done by Andersson and
Björkström (2013). In this case the profile crossing closest over the borehole is profile 2, and
the borehole is located approximately 6.5m away from the profile. The resistivity logs from
the borehole logging very well follow the resistivities from the ERT-measurements, this with
a correlating drop in resistivity at 11m below ground and borehole logging mean resistivity
values matching with the ERT-values. Although it is clearley seen that the ERT-measurements
give a mean value over a quite large depth (and width – although not displayed in this report)
since no minor changes and fluctuation can be seen, this in comparison with the borehole
logging which catches and displays changes on a much smaller scale.
4.2.4 Geological interpretation
Based on resistivity
The same layering as above is used for the geological interpretation.
Layer 1: Looking at the general resistivity classification of geological materials in Figure 11,
this layer can be interpreted as dry gravel and sand, even duricrust. This coincides quite well
with the resistivity values of this layer varying within the resistivity range of Soil layer ‘A’ in
the Acworth weathering profile (160-180Ωm – wet, 2000-4000Ωm – dry) (see Table 2),
indicating a well-drained and leached sandy soil, with high porosity.
The cemented material towards the top of the log can be of natural origin, but could also be
an indication of some kind of backfill used to fix the borehole casing after drilling.
Layer 2: This layer is interpreted as clay according to the general resistivity classification, with
a mean resistivity value of 35Ωm. This coincides with the resistivity span of the Acworth
weathering profile layer zone ‘b’ (10-90Ωm) – accumulation of clay, low permeability but high
porosity and large water content.
Layer 3: This layer can be interpreted as wet gravel and sand or as a weathered metamorphic
or felsic layer. In combination with the Acworth profile it is plausible to interpret this layer as
a layer where substantial weathering has occurred, leaving a layer where crystal aggregates
and fragments of rock are still present. This matching the Acworth zone ‘c’ (60-300Ωm).
Layer 4: This layer shows larger variations in resistivity. The mean resistivity value in this layer
coincides with the Acworth zone ‘d’ representing fissured and fractured rock (600-300Ωm).
Low porosity is expected, but moderate to high permeability is experienced in the fissures.
Resistivity in this layer reaches down to levels matching that of fresh water.
Overall this interpretation is strengthened by the geological formation information, with
exception from the quartz layer seen between the depths of 12-15m.
Based on natural gamma radiation
The purity of the material is greatest in the layers with lowest natural gamma radiation and
an increased gamma radiation is most likely to imply increased content of organics, clay, and
shale or to be a granite formation.
The first peak in natural gamma radiation, seen at a depth of 12m, is interpreted as an
indication of a clay layer following the Acworth weathering profile. However since the
borehole lies on a granitic gneiss bottom, it is plausible to believe that peaks in natural gamma
are due to high content of granite (see Table 1). If looking at the geological formation
information a layer of quartz appears at a depth of 12-15m. This coincides precisely with this

28
top most peak in natural gamma radiation. Granite is a rock type containing quartz and due
to data uncertainties it could be possible that the layer between 12-15m depth is a granite
layer (giving rise to the natural gamma peak), containing high amounts of quarts – giving this
denotation in the geological formation information. Although this hypothesis cannot be
strengthen from the resistivity data.
The second peak in natural gamma is also hard to interpret. As mentioned an increase in
gamma is most likely to resemble and increased clay content. However, since the peak is seen
in layer 4 which is interpreted as fissured and fractured rock this might seem odd. A reasonable
interpretation to the seen peak is as a fracture zone filled with clay material. But as likely, this
could also resemble a layer with higher granite content than the surrounding layers.
The interpretation based on the natural gamma radiation quite well follows the interpretation
based on the resistivity. Both lower layers, 4 and D, imply high content of pure rock. However
uncertainties are seen for example for the layer between the depths of 12-15m.
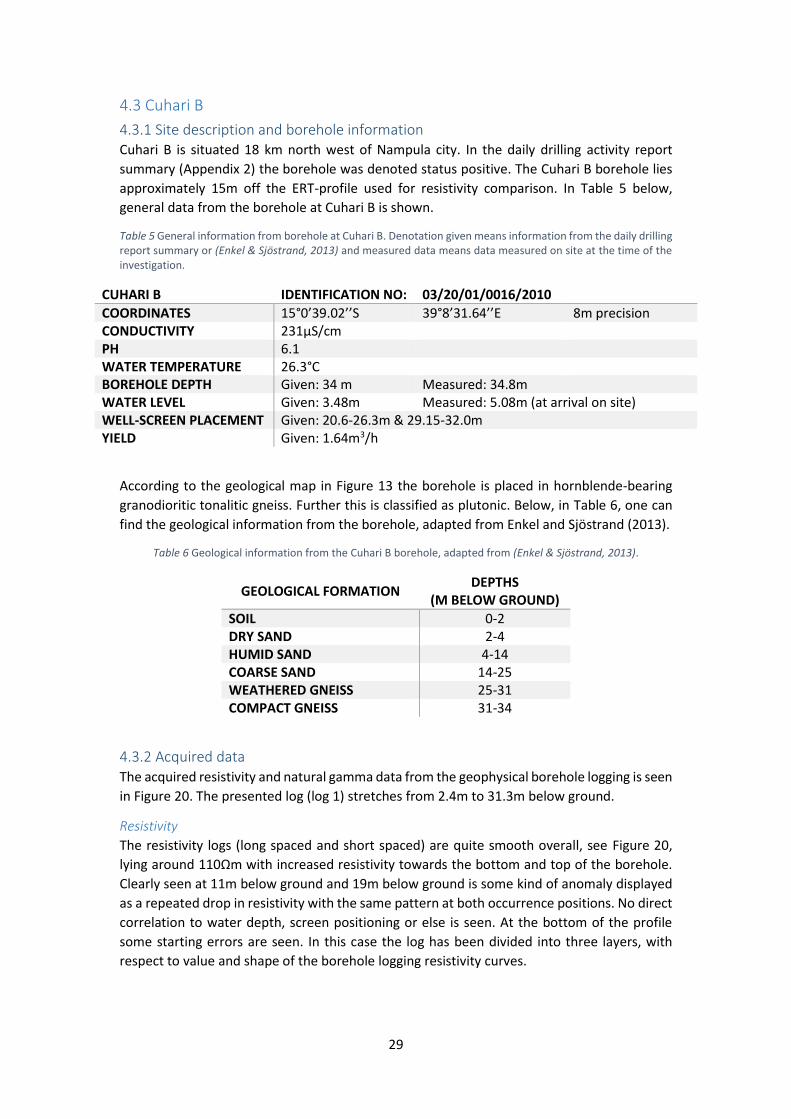
29
4.3 Cuhari B
4.3.1 Site description and borehole information Cuhari B is situated 18 km north west of Nampula city. In the daily drilling activity report
summary (Appendix 2) the borehole was denoted status positive. The Cuhari B borehole lies
approximately 15m off the ERT-profile used for resistivity comparison. In Table 5 below,
general data from the borehole at Cuhari B is shown.
Table 5 General information from borehole at Cuhari B. Denotation given means information from the daily drilling report summary or (Enkel & Sjöstrand, 2013) and measured data means data measured on site at the time of the investigation.
CUHARI B IDENTIFICATION NO: 03/20/01/0016/2010
COORDINATES 15°0’39.02’’S 39°8’31.64’’E 8m precision CONDUCTIVITY 231µS/cm PH 6.1 WATER TEMPERATURE 26.3°C BOREHOLE DEPTH Given: 34 m Measured: 34.8m WATER LEVEL Given: 3.48m Measured: 5.08m (at arrival on site) WELL-SCREEN PLACEMENT Given: 20.6-26.3m & 29.15-32.0m YIELD Given: 1.64m3/h
According to the geological map in Figure 13 the borehole is placed in hornblende-bearing
granodioritic tonalitic gneiss. Further this is classified as plutonic. Below, in Table 6, one can
find the geological information from the borehole, adapted from Enkel and Sjöstrand (2013).
Table 6 Geological information from the Cuhari B borehole, adapted from (Enkel & Sjöstrand, 2013).
GEOLOGICAL FORMATION DEPTHS
(M BELOW GROUND)
SOIL 0-2 DRY SAND 2-4 HUMID SAND 4-14 COARSE SAND 14-25 WEATHERED GNEISS 25-31 COMPACT GNEISS 31-34
4.3.2 Acquired data The acquired resistivity and natural gamma data from the geophysical borehole logging is seen
in Figure 20. The presented log (log 1) stretches from 2.4m to 31.3m below ground.
Resistivity
The resistivity logs (long spaced and short spaced) are quite smooth overall, see Figure 20,
lying around 110Ωm with increased resistivity towards the bottom and top of the borehole.
Clearly seen at 11m below ground and 19m below ground is some kind of anomaly displayed
as a repeated drop in resistivity with the same pattern at both occurrence positions. No direct
correlation to water depth, screen positioning or else is seen. At the bottom of the profile
some starting errors are seen. In this case the log has been divided into three layers, with
respect to value and shape of the borehole logging resistivity curves.

30
Layer 1 (top layer, 0-6.5m below ground): The dominant feature in this layer is the large drop
in resistivity from about 52600Ωm at the top of the log to about 20Ωm at 5m below ground.
The borehole log shows a mean value of 340Ωm.
Layer 2 (6.5-25.3m below ground): In this layer the mean value from the borehole log lies at
108Ωm and smoothly fluctuates a bit up and down. No large peaks are seen although it is in
this layer the anomalies, mentioned above, are seen (disregarded when calculating mean layer
resistivity value).
Layer 3 (25.3-30m below ground): In this layer an increased resistivity is seen. In addition the
resistivity log is seen to have an increased fluctuation with high peaks. The resistivity values
stretch from 80 to 58800Ωm and the mean value is 1436Ωm.
The large drop in resistivity below layer three is seen as starting errors.
Natural gamma radiation
The natural gamma log shows varying values and has been divided into five layers. From about
6m below ground to the bottom of the log the natural gamma varies around a level of 40cps,
this is represented by layers B1 to C2. Above this the natural gamma shows a quick increase
up to about 140cps at the top of the log (layer A), this is correlating with an increase of
resistivity at approximately the same depth.
Layers in connection that seem to have the same natural gamma characteristics have been
put together, in this case these are B1 and B2, and C1 and C2.
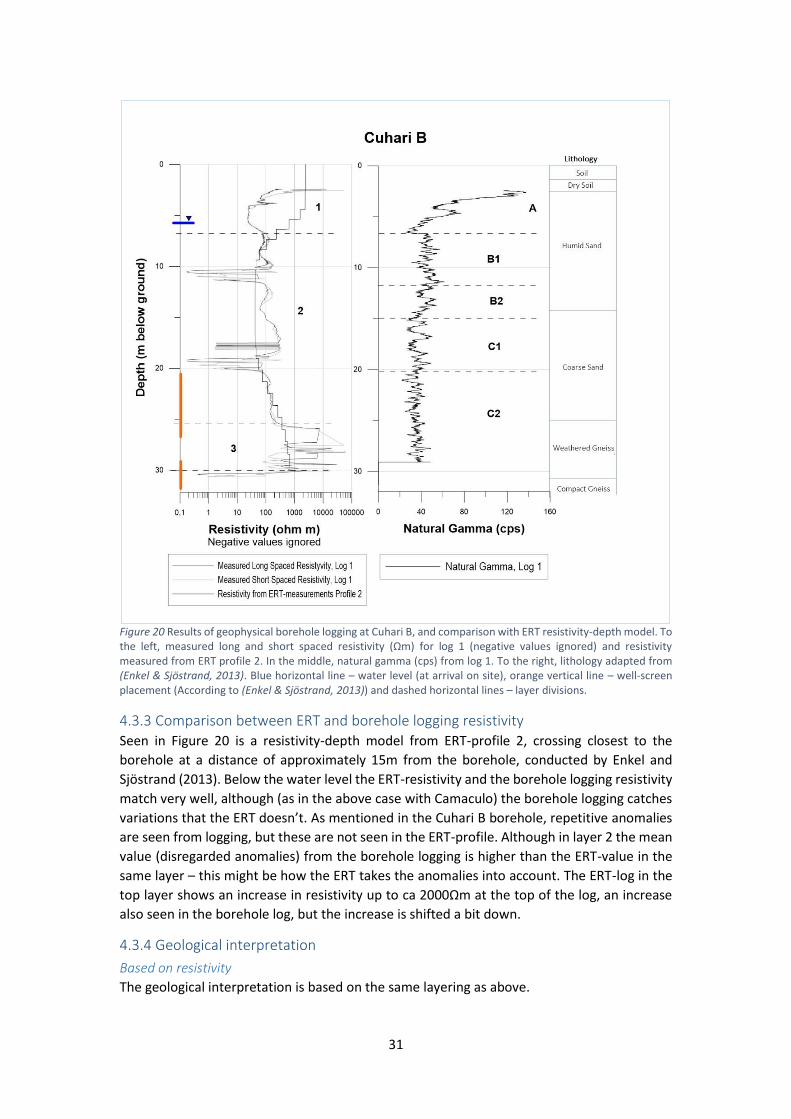
31
Figure 20 Results of geophysical borehole logging at Cuhari B, and comparison with ERT resistivity-depth model. To the left, measured long and short spaced resistivity (Ωm) for log 1 (negative values ignored) and resistivity measured from ERT profile 2. In the middle, natural gamma (cps) from log 1. To the right, lithology adapted from (Enkel & Sjöstrand, 2013). Blue horizontal line – water level (at arrival on site), orange vertical line – well-screen placement (According to (Enkel & Sjöstrand, 2013)) and dashed horizontal lines – layer divisions.
4.3.3 Comparison between ERT and borehole logging resistivity Seen in Figure 20 is a resistivity-depth model from ERT-profile 2, crossing closest to the
borehole at a distance of approximately 15m from the borehole, conducted by Enkel and
Sjöstrand (2013). Below the water level the ERT-resistivity and the borehole logging resistivity
match very well, although (as in the above case with Camaculo) the borehole logging catches
variations that the ERT doesn’t. As mentioned in the Cuhari B borehole, repetitive anomalies
are seen from logging, but these are not seen in the ERT-profile. Although in layer 2 the mean
value (disregarded anomalies) from the borehole logging is higher than the ERT-value in the
same layer – this might be how the ERT takes the anomalies into account. The ERT-log in the
top layer shows an increase in resistivity up to ca 2000Ωm at the top of the log, an increase
also seen in the borehole log, but the increase is shifted a bit down.
4.3.4 Geological interpretation
Based on resistivity
The geological interpretation is based on the same layering as above.
32
Layer 1: This layer is, in line with the general resistivity classification (Figure 11), interpreted
as dry coarse sand or duricrust if looking at the mean value and the top values. However,
towards the bottom of the layer a large decrease in resistivity is seen, and between the depths
of 4-6m a span of very low resistivity (ca 35Ωm) is seen. These features are interpreted as a
top layer of dry, leached sand turning into a thin damp layer with accumulated clay. A
transition from the Acworth zone ‘A’ to zone ‘b’ (see Table 2).
The increased resistivity towards the ground surface can be of natural duricrust
characteristics, but it could also imply that some kind of backfill was used to fix the borehole
after drilling. Common for this purpose is to use clay, bentonite clay or cement. Since an
increase of resistivity is seen, cement was probably used.
Layer 2: If looking at the mean resistivity value of this layer it can be interpreted as a zone of
very wet, clayey sand according to the general resistivity classification. In Acworth zones it
represents zone ‘c’ but with a quite low resistivity.
Layer 3: The third layer can be interpreted as fissured, fractured and even fresh rock. Although
peaks and dips make it hard to interpret and this zone might have been subject to starting
errors since a lot of stretches with negative (ignored values) are seen.
This interpretation is strengthen by the geological formation information. Some differences
are seen for example no clay layer is found in the geological formation information, however
a layer of humid sand is seen at approximately the same depth.
Based on natural gamma radiation
The purity of the material is verified by the natural gamma radiation. A high natural gamma
radiation implies a larger content of clay rich material. In this case this implies a decreased
clay content following the layer order A, B1, B2, C1, C2, increasing the pure rock content
likewise.
If comparing the resistivity log, the natural gamma log and the geological formation
information, a general interpretation between the depths 4m and 15m below ground is that
this layer consists of humid clayey sand. If further comparing this to the natural gamma log
layer A, implying increased clay content, this is contradicted by the resistivity log and the
geological formation information. However, the increase in both resistivity and natural
gamma radiation could be evidence of that cement, with relatively high potassium content,
has been used to backfill the borehole after drilling.
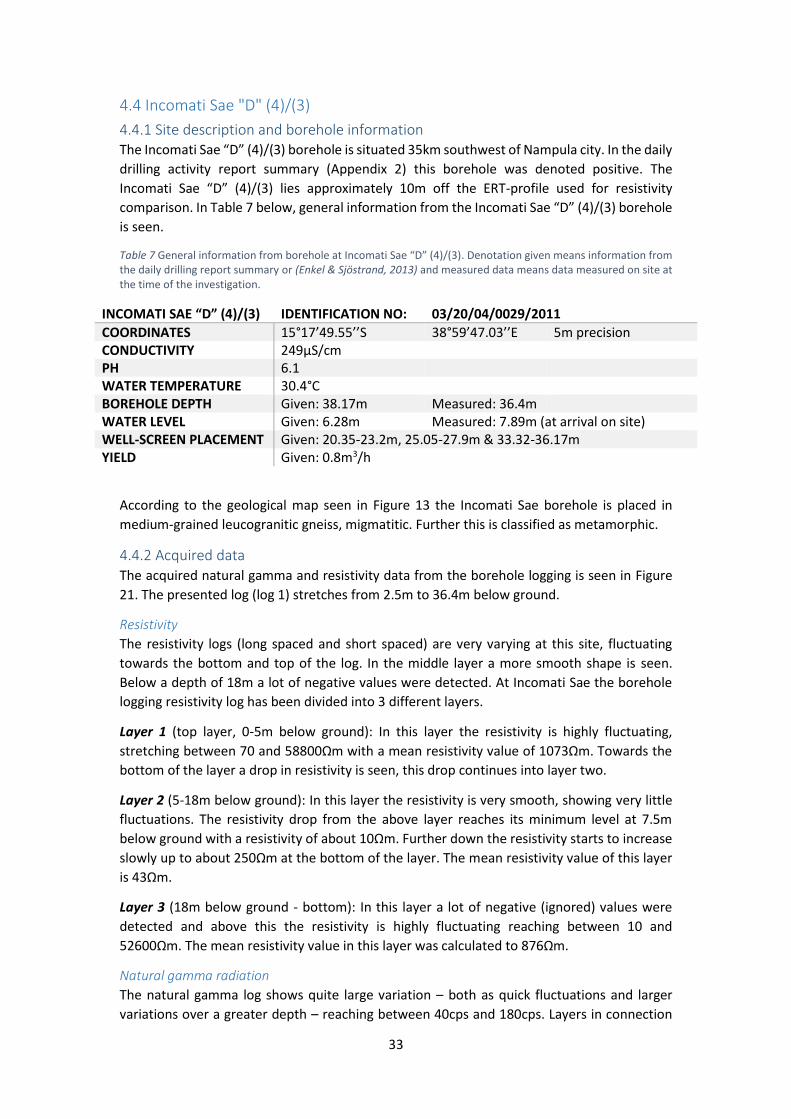
33
4.4 Incomati Sae "D" (4)/(3)
4.4.1 Site description and borehole information The Incomati Sae “D” (4)/(3) borehole is situated 35km southwest of Nampula city. In the daily
drilling activity report summary (Appendix 2) this borehole was denoted positive. The
Incomati Sae “D” (4)/(3) lies approximately 10m off the ERT-profile used for resistivity
comparison. In Table 7 below, general information from the Incomati Sae “D” (4)/(3) borehole
is seen.
Table 7 General information from borehole at Incomati Sae “D” (4)/(3). Denotation given means information from the daily drilling report summary or (Enkel & Sjöstrand, 2013) and measured data means data measured on site at the time of the investigation.
INCOMATI SAE “D” (4)/(3) IDENTIFICATION NO: 03/20/04/0029/2011
COORDINATES 15°17’49.55’’S 38°59’47.03’’E 5m precision CONDUCTIVITY 249µS/cm PH 6.1 WATER TEMPERATURE 30.4°C BOREHOLE DEPTH Given: 38.17m Measured: 36.4m WATER LEVEL Given: 6.28m Measured: 7.89m (at arrival on site) WELL-SCREEN PLACEMENT Given: 20.35-23.2m, 25.05-27.9m & 33.32-36.17m YIELD Given: 0.8m3/h
According to the geological map seen in Figure 13 the Incomati Sae borehole is placed in
medium-grained leucogranitic gneiss, migmatitic. Further this is classified as metamorphic.
4.4.2 Acquired data The acquired natural gamma and resistivity data from the borehole logging is seen in Figure
21. The presented log (log 1) stretches from 2.5m to 36.4m below ground.
Resistivity
The resistivity logs (long spaced and short spaced) are very varying at this site, fluctuating
towards the bottom and top of the log. In the middle layer a more smooth shape is seen.
Below a depth of 18m a lot of negative values were detected. At Incomati Sae the borehole
logging resistivity log has been divided into 3 different layers.
Layer 1 (top layer, 0-5m below ground): In this layer the resistivity is highly fluctuating,
stretching between 70 and 58800Ωm with a mean resistivity value of 1073Ωm. Towards the
bottom of the layer a drop in resistivity is seen, this drop continues into layer two.
Layer 2 (5-18m below ground): In this layer the resistivity is very smooth, showing very little
fluctuations. The resistivity drop from the above layer reaches its minimum level at 7.5m
below ground with a resistivity of about 10Ωm. Further down the resistivity starts to increase
slowly up to about 250Ωm at the bottom of the layer. The mean resistivity value of this layer
is 43Ωm.
Layer 3 (18m below ground - bottom): In this layer a lot of negative (ignored) values were
detected and above this the resistivity is highly fluctuating reaching between 10 and
52600Ωm. The mean resistivity value in this layer was calculated to 876Ωm.
Natural gamma radiation
The natural gamma log shows quite large variation – both as quick fluctuations and larger
variations over a greater depth – reaching between 40cps and 180cps. Layers in connection
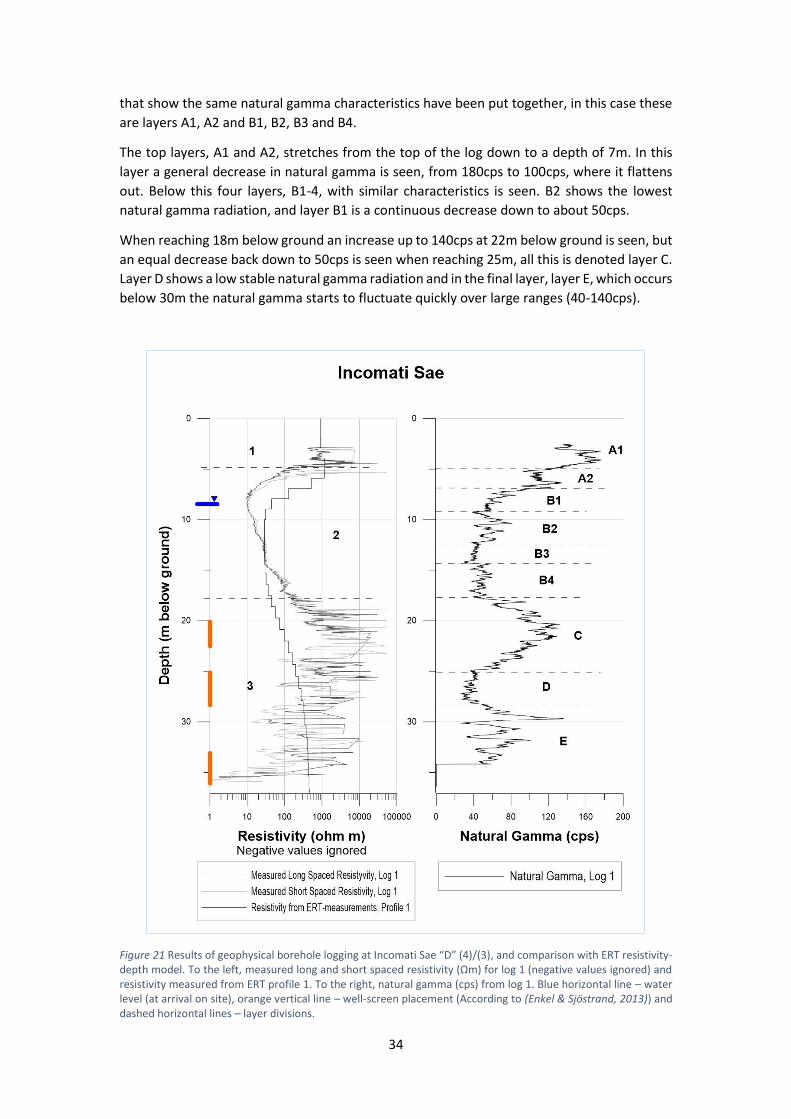
34
that show the same natural gamma characteristics have been put together, in this case these
are layers A1, A2 and B1, B2, B3 and B4.
The top layers, A1 and A2, stretches from the top of the log down to a depth of 7m. In this
layer a general decrease in natural gamma is seen, from 180cps to 100cps, where it flattens
out. Below this four layers, B1-4, with similar characteristics is seen. B2 shows the lowest
natural gamma radiation, and layer B1 is a continuous decrease down to about 50cps.
When reaching 18m below ground an increase up to 140cps at 22m below ground is seen, but
an equal decrease back down to 50cps is seen when reaching 25m, all this is denoted layer C.
Layer D shows a low stable natural gamma radiation and in the final layer, layer E, which occurs
below 30m the natural gamma starts to fluctuate quickly over large ranges (40-140cps).
Figure 21 Results of geophysical borehole logging at Incomati Sae “D” (4)/(3), and comparison with ERT resistivity-depth model. To the left, measured long and short spaced resistivity (Ωm) for log 1 (negative values ignored) and resistivity measured from ERT profile 1. To the right, natural gamma (cps) from log 1. Blue horizontal line – water level (at arrival on site), orange vertical line – well-screen placement (According to (Enkel & Sjöstrand, 2013)) and dashed horizontal lines – layer divisions.
35
4.4.3 Comparison between ERT and borehole logging resistivity Comparing the ERT measured resistivity from (Enkel & Sjöstrand, 2013) profile 1 (borehole
situated 10 meters away from the profile in question), with the resistivity obtained from the
borehole logging, one can see that the ERT is shifted a bit down. The decrease seen between
layer one and two in the borehole log starts about 2 meters above the decrease seen in the
ERT. The same pattern is seen for the increase in resistivity. In layer three there is a quite large
difference between the ERT-measured resistivity and the resistivity obtained from the
borehole logging, where the ERT-resistivity lies around 300Ωm and the mean resistivity from
the borehole logging lies at 870Ωm.
4.4.4 Geological interpretation
Based on resistivity
Layering from above is used for the geological interpretation.
Layer 1: The top layer shows high resistivity and can be interpreted as dry sand and gravel or
duricrust according to the general resistivity classification of geological material seen in Figure
11. Comparing with the Acworth weathering profile it is most plausible that the top layer
consists of dry, leached sandy soil with high porosity – a zone ‘A’ layer.
The increased resistivity towards the top of the log could be due to natural cementation
(duricrust), but it could also be an indication of some kind of cemented backfill used to
stabilise the borehole casing after drilling.
Layer 2: This layer has a much lower resistivity with a mean of 43Ωm, which can be interpreted
as clays with freshwater and is plausibly an Acworth zone ‘b’. Towards the bottom of the layer
the resistivity is increased and it is plausible to believe that a small zone ‘c’ is present in the
border between layers 2 and 3. This being a zone with both rock fragments and crystal
aggregates that has intermediate porosity and permeability.
Layer 3: In this layer the interpretation is complicated by the presence of a lot of stretches
with negative (ignored) resistivity values. The highly variable environment should plausibly
indicate fissure, and fractured rock although the man value of this layer is a bit higher than
the Acworth zone ‘d’ that should resemble these features. The general resistivity classification
varies between values from fresh water up to fresh rock.
Based on natural gamma radiation
A low natural gamma radiation implies purer rock and less clay content, if the fresh rock
doesn’t have high granite content. In the Incomati Sae case layers C and E are interpreted to
consist of rock with high granite content. Layer D is interpreted as a pure rock layer with low
granite content. Further on layer B3 is interpreted to be more pure than layers B2 and B4 –
containing more clay. B2 is a layer with increasing purity further down the log.
As in the Cuhari B case, an increase is seen in both natural gamma and resistivity towards the
top of the log. This is interpreted as that a potassium rich cement has been used as backfill to
stabilise the borehole casing after drilling.
36
4.5 Matibane
4.5.1 Site description and borehole information The borehole at Matibane is situated 22km east of Nampula City. In the summary of the daily
drilling activity report (Appendix 2) the well is denoted positive. The borehole lies
approximately 2m off the ERT-profile used for resistivity comparison. In Table 8 below, general
information regarding the Matibane borehole is seen.
Table 8 General information from borehole at Matibane. Denotation given means information from the daily drilling report summary or (Enkel & Sjöstrand, 2013) and measured data means data measured on site at the time of the investigation.
MATIBANE IDENTIFICATION NO: 03/20/02/0064/2010
COORDINATES 15°7’52.13’’S 39°28’3.38’’E 5m precision CONDUCTIVITY - PH - WATER TEMPERATURE - BOREHOLE DEPTH Given: 47.75m Measured: 46.38m WATER LEVEL Given: 10m Measured: 10.08m (at arrival on site) WELL-SCREEN PLACEMENT Given: 34.35-37.2m & 40.05-47.75m YIELD Given: 0.6m3/h
According to the geological map seen in Figure 13 the Matibane borehole is placed in augen
granitic gneiss. Further this is classified as plutonic. Below, in Table 9, one can find the
geological information from the borehole, adapted from Enkel and Sjöstrand (2013).
Table 9 Geological information from the Matibane borehole, adapted from (Enkel & Sjöstrand, 2013).
GEOLOGICAL FORMATION DEPTHS
(M BELOW GROUND)
SOIL 0-1 YELLOW CLAY 1-6 BROWN CLAY 6-12 MEDIUM SAND 12-28 WEATHERED GNEISS 28-38 COMPACT GNEISS 38-44 GRANITE 44-47.75
4.5.2 Acquired data The acquired natural gamma and resistivity data from the geophysical borehole logging is seen
in Figure 22 below. The presented log (log 1), stretches between 2.46m and 46.37m below
ground.
Resistivity
The main feature of the resistivity measured from the borehole logging at this site is the
repetitive anomalies seen as large dips at 11, 22 and 33m below ground. Unfortunately no
resistivity values (or values below 0) have been detected between these anomalies. Even
though the resistivity from the borehole logging has been divided into different layers.
Layer 1 (top layer, 0-4.2m below ground): Since the top layer is quite thin, an extrapolated
mean is created in this layer giving a mean resistivity value of about 130Ωm. Towards the
bottom of this layer the resistivity is dropping.

37
Layer 2 (4.2-7.3m below ground): In this layer a dip in resistivity is seen, dropping down to
20Ωm at a depth of 5.5m below ground. The mean value in this layer is calculated to 28Ωm.
Layer 3 (7.3-10.3m below ground): In this layer the resistivity keeps increasing and a high
resistivity peak of 26300Ωm is seen at a depth of 8m.
Layer 4 (10.3-40.3m below ground): In this layer the seen features are the anomalies with no
read data in between.
Layer 5 (40.3-43.8m below ground): In this layer the resistivity is very high and fluctuating
around a mean of 4320Ωm.
The highly fluctuating resistivity below the above layer is seen as start-up errors.
Natural gamma radiation
The natural gamma log is fluctuating around a value of about 120cps, with some minor peaks
reaching about 200cps. It has been divided into layers A1-C, where A1-3 have been grouped
together due to similar natural gamma characteristics.
The top layers A1-3 show quite low fluctuating natural gamma radiation, where layer A2 lies
a bit higher than the other two layers (200cps compared to 120cps). Layer B shows a decrease
in both radiation cps and fluctuation. Layer C is similar to layers A1-3 with small fluctuations
and peaks reaching a bit over 200cps. A dominant feature of the log is one large peak seen at
39m below ground reaching a value of about 680cps, this makes up layer D.
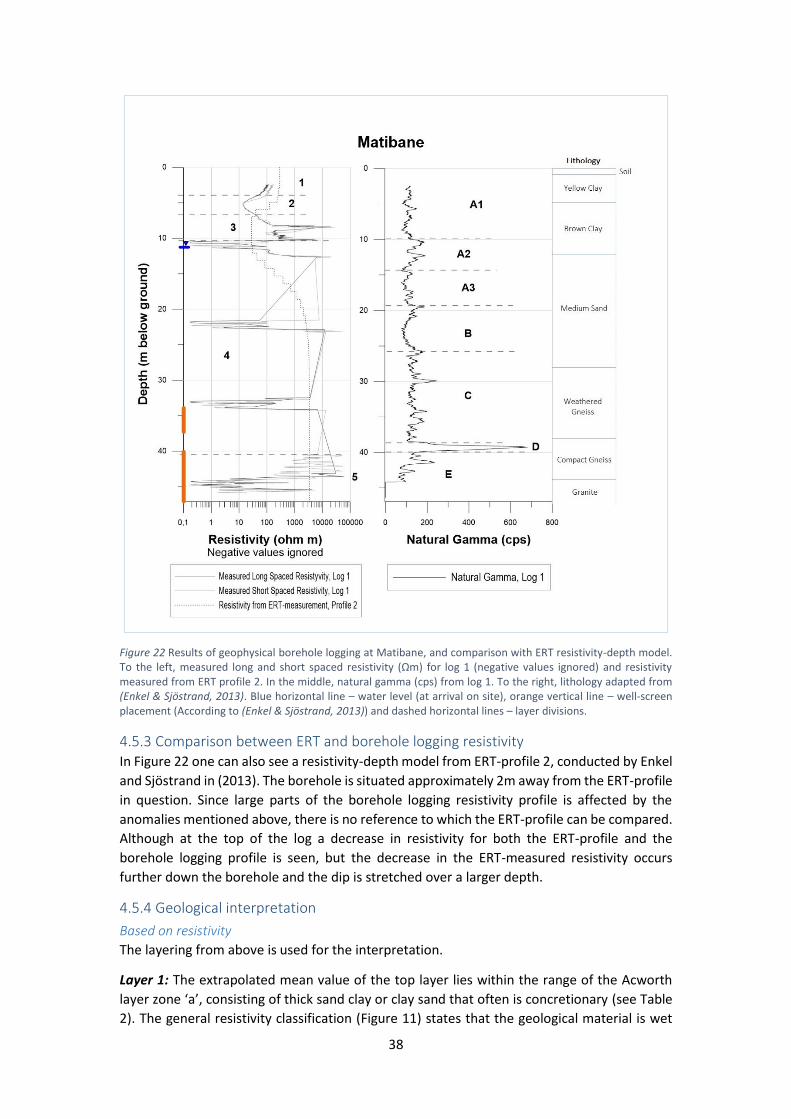
38
Figure 22 Results of geophysical borehole logging at Matibane, and comparison with ERT resistivity-depth model. To the left, measured long and short spaced resistivity (Ωm) for log 1 (negative values ignored) and resistivity measured from ERT profile 2. In the middle, natural gamma (cps) from log 1. To the right, lithology adapted from (Enkel & Sjöstrand, 2013). Blue horizontal line – water level (at arrival on site), orange vertical line – well-screen placement (According to (Enkel & Sjöstrand, 2013)) and dashed horizontal lines – layer divisions.
4.5.3 Comparison between ERT and borehole logging resistivity In Figure 22 one can also see a resistivity-depth model from ERT-profile 2, conducted by Enkel
and Sjöstrand in (2013). The borehole is situated approximately 2m away from the ERT-profile
in question. Since large parts of the borehole logging resistivity profile is affected by the
anomalies mentioned above, there is no reference to which the ERT-profile can be compared.
Although at the top of the log a decrease in resistivity for both the ERT-profile and the
borehole logging profile is seen, but the decrease in the ERT-measured resistivity occurs
further down the borehole and the dip is stretched over a larger depth.
4.5.4 Geological interpretation
Based on resistivity
The layering from above is used for the interpretation.
Layer 1: The extrapolated mean value of the top layer lies within the range of the Acworth
layer zone ‘a’, consisting of thick sand clay or clay sand that often is concretionary (see Table
2). The general resistivity classification (Figure 11) states that the geological material is wet
39
gravel and sand or weathered metamorphic rock. The combination of the both gives the
interpretation that the layer consists of clayey wet sand.
Layer 2: Here a low resistivity value is observed, matching the general classification of clay. It
coincides well with the Acworth layer zone ‘b’ and the layer is therefore interpreted as a layer
of accumulated damp clay with low permeability but high porosity.
Layer 3: Between layers 2 and 3 an increased resistivity is seen and it is plausible to interpret
this as a transition zone corresponding to a Acworth zone ‘c’. This reasoning is further
strengthen by the general classification stating that the geological material here consists of
wet gravel and sand. It is interpreted that in this zone ongoing weathering is altering the rock
upward leaving crystal aggregates and fractures of rock.
Layer 4: This layer is dominated by anomalies that appear to arise from the well installation
due to the seen similar shape and repetitiveness. They leave long stretches where no
resistivity is detected. Therefore it is not possible to interpret any geological structure to this
layer.
Based on natural gamma radiation
The gamma radiation indicates the purity of the rock material. At the top layers this implies
that A layers 1-3 have a higher clay content than layer B which is interpreted as quite pure, an
assumption that is strengthened by the geological formation information. Gneiss – origin from
granite – is assumed to show an increased natural gamma radiation. Layer C is interpreted as
a highly weathered layer with relatively high granite content (the overall natural gamma
radiation is quite high in the vicinity of this borehole so this is a plausible assumption). Further
on, the large peak at a depth of 39m is interpreted as a layer with very high granite content.
This does not quite follow the geological formation information, however known is that this
information contains a lot of uncertainties, and a thin layer such as this could be hard to
determine properly by only looking at drilling residuals (this is how the geological formation
information has been determined).
40
4.6 Muriaze
4.6.1 Site description and borehole information The Muriaze borehole is situated 20km south of Nampula city. This borehole does not exist in
the daily drilling report summary and therefore some information is lacking, such as well-
screen placement, salinity and water depth. Information regarding whether or not the
borehole is positive is also missing, although the borehole is still in use, and not refilled, which
should give the denotation positive. The Muriaze borehole lies almost straight on the ERT-
profile used for resistivity comparison. In Table 10 below, general information regarding the
borehole at Muriaze is presented.
Table 10 General information from borehole at Muriaze. Measured data means data measured on site at the time of the investigation.
MURIAZE IDENTIFICATION NO: 03/20/02/0071/2011
COORDINATES 15°18’10.66’’S 39°18’37.35’’E 6m precision CONDUCTIVITY 344µS/cm PH 6.45 WATER TEMPERATURE 27.8°C BOREHOLE DEPTH Measured: 23.5m WATER LEVEL Measured: 2.68m (at arrival on site) WELL-SCREEN PLACEMENT - YIELD Given: -
According to the geological map in Figure 13, the borehole at Muriaze is placed in leucocratic
streaky augen granitic gneiss. Further this is classified as plutonic.
4.6.2 Acquired data The acquired natural gamma and resistivity data from the geophysical borehole logging is seen
in Figure 23. The presented log (log 1) stretches from 2.53m to 23.97m below ground.
Resistivity
The resistivity from the geophysical borehole logging is highly variable in the Muriaze borehole
with several stretches with negative (ignored) values below the depth of 11m. Besides this a
drop in resistivity is seen in the layer closest to the ground, and a peak in resistivity is seen at
a depth of 7m. The borehole logging resistivity profile has been divided into the 5 layers
described below.
Layer 1 (top layer, 0-3.2m below ground): In this layer one sees a peak in resistivity reaching
1400Ωm at a depth of 2.6m. The resistivity decreases drastically towards the bottom of the
layer, down to approximately 30Ωm.
Layer 2 (3.2-6.0m below ground): In this layer the resistivity log is quite smooth, slowly
increasing and with a mean value of 50Ωm. The highest reached value in this layer is 86.2Ωm.
Layer 3 (6.0-9.6m below ground): The main feature of this layer is a large peak in resistivity
reaching 15151Ωm at a depth of 8m. The mean value in this layer is 372Ωm.
Layer 4 (9.6-11.8m below ground): This layer is similar to layer two with a smooth, quite stable
resistivity. The maximum measured resistivity is 200Ωm and the mean value is calculated to
11Ωm.
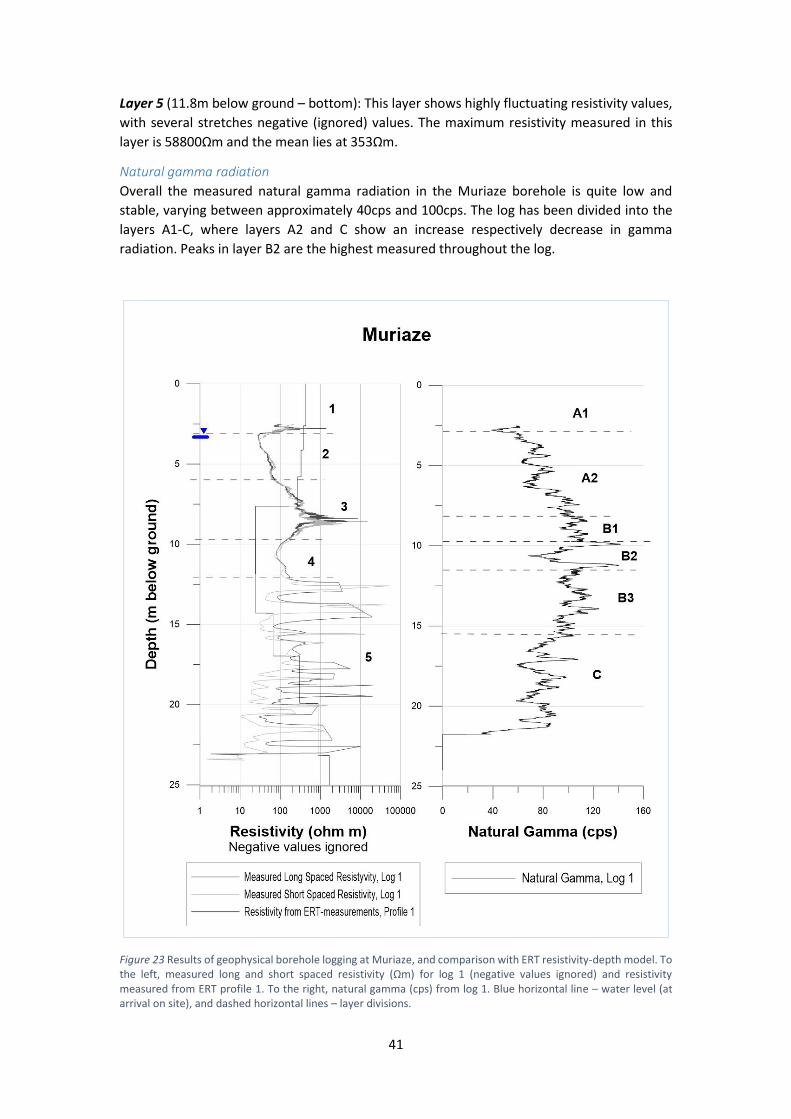
41
Layer 5 (11.8m below ground – bottom): This layer shows highly fluctuating resistivity values,
with several stretches negative (ignored) values. The maximum resistivity measured in this
layer is 58800Ωm and the mean lies at 353Ωm.
Natural gamma radiation
Overall the measured natural gamma radiation in the Muriaze borehole is quite low and
stable, varying between approximately 40cps and 100cps. The log has been divided into the
layers A1-C, where layers A2 and C show an increase respectively decrease in gamma
radiation. Peaks in layer B2 are the highest measured throughout the log.
Figure 23 Results of geophysical borehole logging at Muriaze, and comparison with ERT resistivity-depth model. To the left, measured long and short spaced resistivity (Ωm) for log 1 (negative values ignored) and resistivity measured from ERT profile 1. To the right, natural gamma (cps) from log 1. Blue horizontal line – water level (at arrival on site), and dashed horizontal lines – layer divisions.
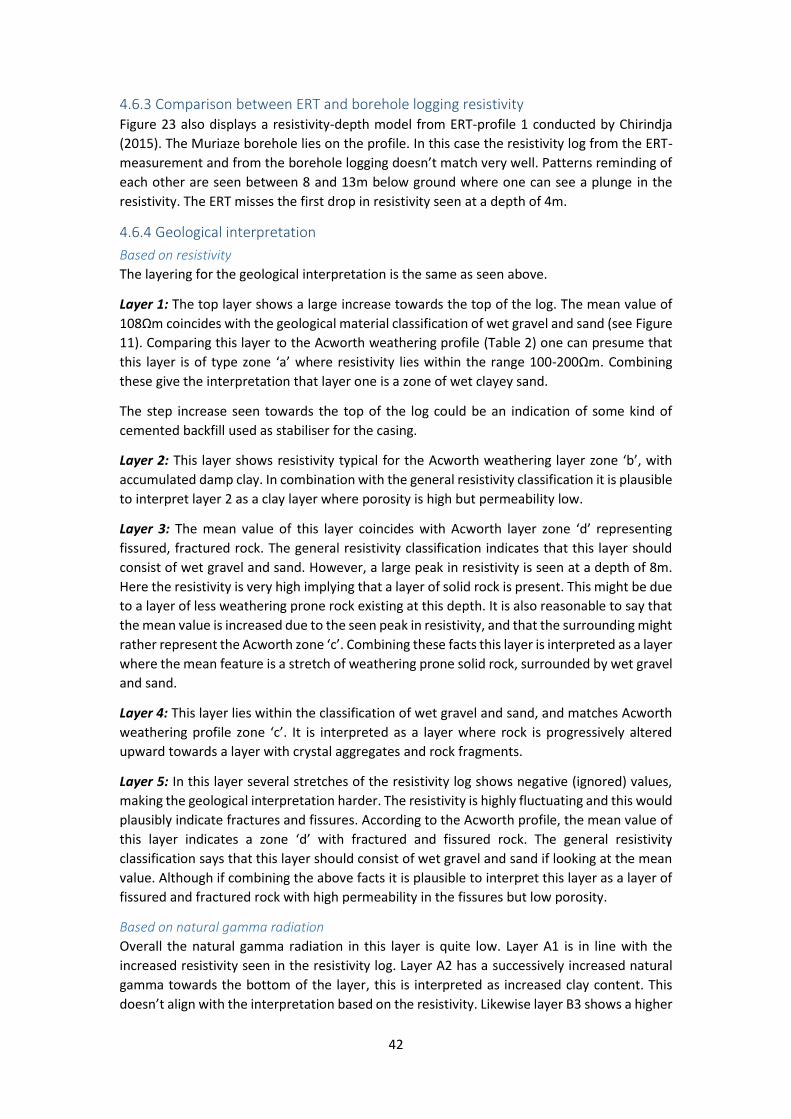
42
4.6.3 Comparison between ERT and borehole logging resistivity Figure 23 also displays a resistivity-depth model from ERT-profile 1 conducted by Chirindja
(2015). The Muriaze borehole lies on the profile. In this case the resistivity log from the ERT-
measurement and from the borehole logging doesn’t match very well. Patterns reminding of
each other are seen between 8 and 13m below ground where one can see a plunge in the
resistivity. The ERT misses the first drop in resistivity seen at a depth of 4m.
4.6.4 Geological interpretation
Based on resistivity
The layering for the geological interpretation is the same as seen above.
Layer 1: The top layer shows a large increase towards the top of the log. The mean value of
108Ωm coincides with the geological material classification of wet gravel and sand (see Figure
11). Comparing this layer to the Acworth weathering profile (Table 2) one can presume that
this layer is of type zone ‘a’ where resistivity lies within the range 100-200Ωm. Combining
these give the interpretation that layer one is a zone of wet clayey sand.
The step increase seen towards the top of the log could be an indication of some kind of
cemented backfill used as stabiliser for the casing.
Layer 2: This layer shows resistivity typical for the Acworth weathering layer zone ‘b’, with
accumulated damp clay. In combination with the general resistivity classification it is plausible
to interpret layer 2 as a clay layer where porosity is high but permeability low.
Layer 3: The mean value of this layer coincides with Acworth layer zone ‘d’ representing
fissured, fractured rock. The general resistivity classification indicates that this layer should
consist of wet gravel and sand. However, a large peak in resistivity is seen at a depth of 8m.
Here the resistivity is very high implying that a layer of solid rock is present. This might be due
to a layer of less weathering prone rock existing at this depth. It is also reasonable to say that
the mean value is increased due to the seen peak in resistivity, and that the surrounding might
rather represent the Acworth zone ‘c’. Combining these facts this layer is interpreted as a layer
where the mean feature is a stretch of weathering prone solid rock, surrounded by wet gravel
and sand.
Layer 4: This layer lies within the classification of wet gravel and sand, and matches Acworth
weathering profile zone ‘c’. It is interpreted as a layer where rock is progressively altered
upward towards a layer with crystal aggregates and rock fragments.
Layer 5: In this layer several stretches of the resistivity log shows negative (ignored) values,
making the geological interpretation harder. The resistivity is highly fluctuating and this would
plausibly indicate fractures and fissures. According to the Acworth profile, the mean value of
this layer indicates a zone ‘d’ with fractured and fissured rock. The general resistivity
classification says that this layer should consist of wet gravel and sand if looking at the mean
value. Although if combining the above facts it is plausible to interpret this layer as a layer of
fissured and fractured rock with high permeability in the fissures but low porosity.
Based on natural gamma radiation
Overall the natural gamma radiation in this layer is quite low. Layer A1 is in line with the
increased resistivity seen in the resistivity log. Layer A2 has a successively increased natural
gamma towards the bottom of the layer, this is interpreted as increased clay content. This
doesn’t align with the interpretation based on the resistivity. Likewise layer B3 shows a higher

43
natural gamma than layer C, interpreted either as higher clay content or larger amount of
granite in the rock. If comparing with the interpretation based on resistivity the last is a more
plausible interpretation.
The distinctive peaks and the drop seen in layer B2 is hard to interpret, but the peaks could
possibly be interpreted as thin layers where the granite content is very high.
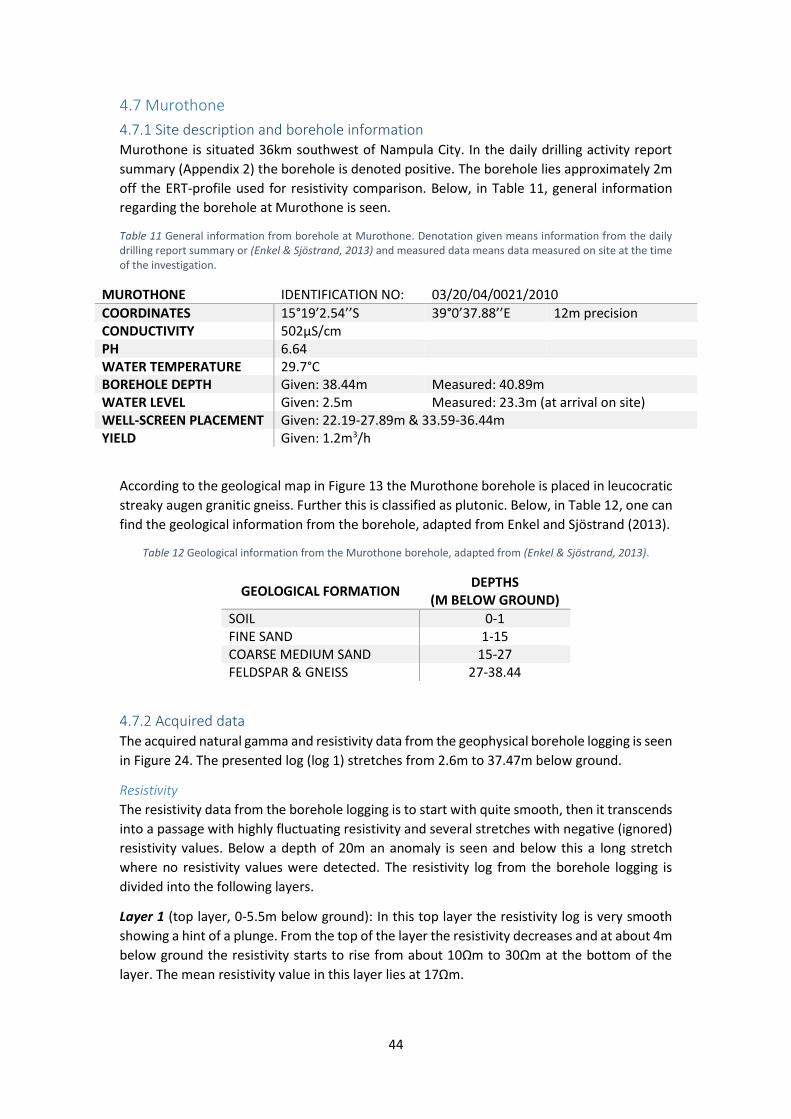
44
4.7 Murothone
4.7.1 Site description and borehole information Murothone is situated 36km southwest of Nampula City. In the daily drilling activity report
summary (Appendix 2) the borehole is denoted positive. The borehole lies approximately 2m
off the ERT-profile used for resistivity comparison. Below, in Table 11, general information
regarding the borehole at Murothone is seen.
Table 11 General information from borehole at Murothone. Denotation given means information from the daily drilling report summary or (Enkel & Sjöstrand, 2013) and measured data means data measured on site at the time of the investigation.
MUROTHONE IDENTIFICATION NO: 03/20/04/0021/2010
COORDINATES 15°19’2.54’’S 39°0’37.88’’E 12m precision CONDUCTIVITY 502µS/cm PH 6.64 WATER TEMPERATURE 29.7°C BOREHOLE DEPTH Given: 38.44m Measured: 40.89m WATER LEVEL Given: 2.5m Measured: 23.3m (at arrival on site) WELL-SCREEN PLACEMENT Given: 22.19-27.89m & 33.59-36.44m YIELD Given: 1.2m3/h
According to the geological map in Figure 13 the Murothone borehole is placed in leucocratic
streaky augen granitic gneiss. Further this is classified as plutonic. Below, in Table 12, one can
find the geological information from the borehole, adapted from Enkel and Sjöstrand (2013).
Table 12 Geological information from the Murothone borehole, adapted from (Enkel & Sjöstrand, 2013).
GEOLOGICAL FORMATION DEPTHS
(M BELOW GROUND)
SOIL 0-1 FINE SAND 1-15 COARSE MEDIUM SAND 15-27 FELDSPAR & GNEISS 27-38.44
4.7.2 Acquired data The acquired natural gamma and resistivity data from the geophysical borehole logging is seen
in Figure 24. The presented log (log 1) stretches from 2.6m to 37.47m below ground.
Resistivity
The resistivity data from the borehole logging is to start with quite smooth, then it transcends
into a passage with highly fluctuating resistivity and several stretches with negative (ignored)
resistivity values. Below a depth of 20m an anomaly is seen and below this a long stretch
where no resistivity values were detected. The resistivity log from the borehole logging is
divided into the following layers.
Layer 1 (top layer, 0-5.5m below ground): In this top layer the resistivity log is very smooth
showing a hint of a plunge. From the top of the layer the resistivity decreases and at about 4m
below ground the resistivity starts to rise from about 10Ωm to 30Ωm at the bottom of the
layer. The mean resistivity value in this layer lies at 17Ωm.
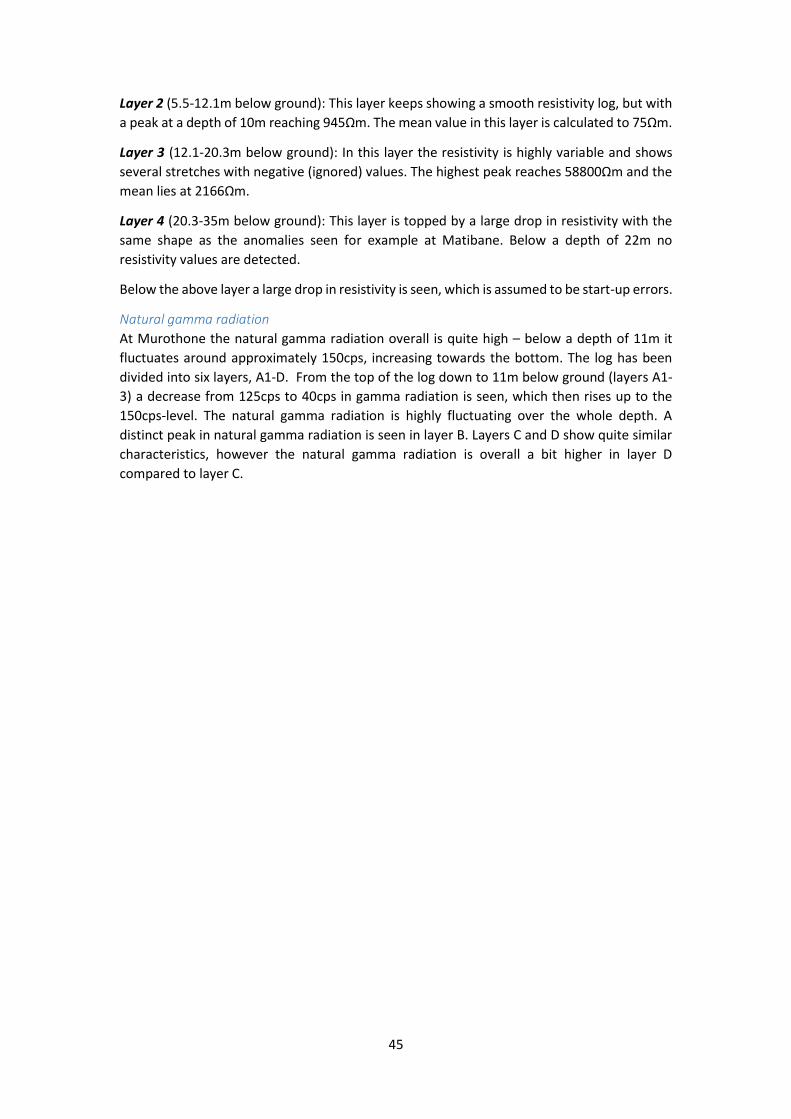
45
Layer 2 (5.5-12.1m below ground): This layer keeps showing a smooth resistivity log, but with
a peak at a depth of 10m reaching 945Ωm. The mean value in this layer is calculated to 75Ωm.
Layer 3 (12.1-20.3m below ground): In this layer the resistivity is highly variable and shows
several stretches with negative (ignored) values. The highest peak reaches 58800Ωm and the
mean lies at 2166Ωm.
Layer 4 (20.3-35m below ground): This layer is topped by a large drop in resistivity with the
same shape as the anomalies seen for example at Matibane. Below a depth of 22m no
resistivity values are detected.
Below the above layer a large drop in resistivity is seen, which is assumed to be start-up errors.
Natural gamma radiation
At Murothone the natural gamma radiation overall is quite high – below a depth of 11m it
fluctuates around approximately 150cps, increasing towards the bottom. The log has been
divided into six layers, A1-D. From the top of the log down to 11m below ground (layers A1-
3) a decrease from 125cps to 40cps in gamma radiation is seen, which then rises up to the
150cps-level. The natural gamma radiation is highly fluctuating over the whole depth. A
distinct peak in natural gamma radiation is seen in layer B. Layers C and D show quite similar
characteristics, however the natural gamma radiation is overall a bit higher in layer D
compared to layer C.
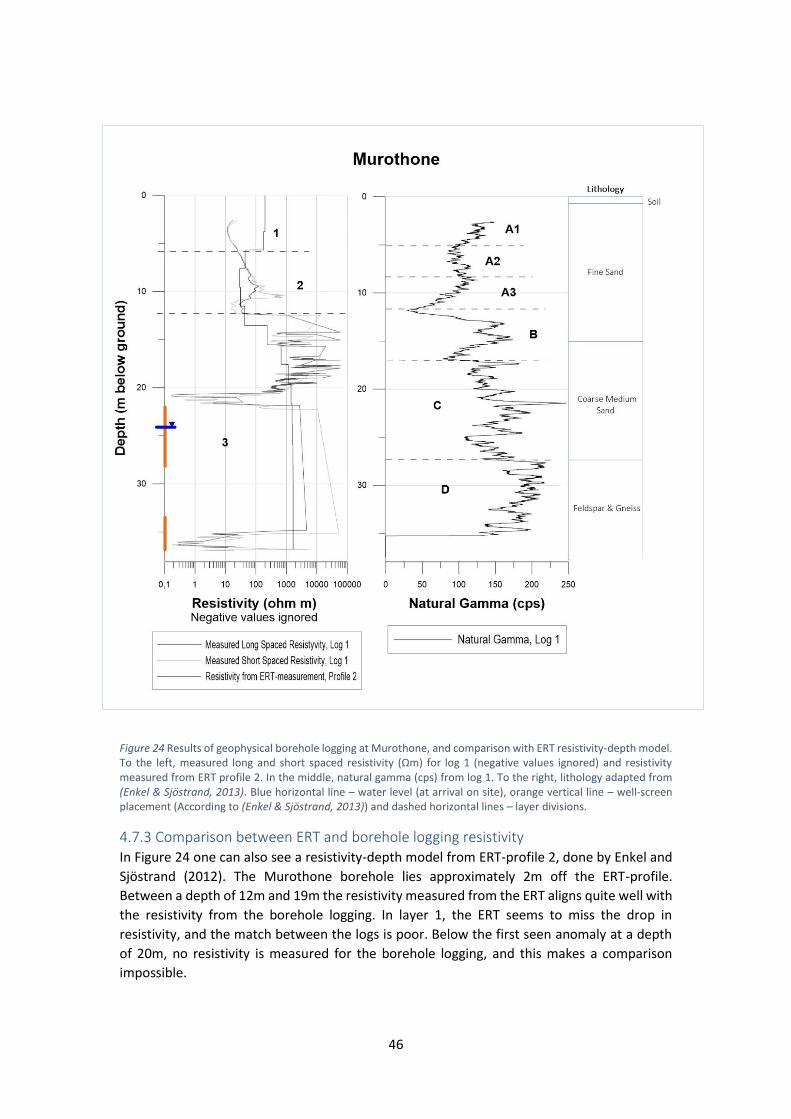
46
Figure 24 Results of geophysical borehole logging at Murothone, and comparison with ERT resistivity-depth model. To the left, measured long and short spaced resistivity (Ωm) for log 1 (negative values ignored) and resistivity measured from ERT profile 2. In the middle, natural gamma (cps) from log 1. To the right, lithology adapted from (Enkel & Sjöstrand, 2013). Blue horizontal line – water level (at arrival on site), orange vertical line – well-screen placement (According to (Enkel & Sjöstrand, 2013)) and dashed horizontal lines – layer divisions.
4.7.3 Comparison between ERT and borehole logging resistivity In Figure 24 one can also see a resistivity-depth model from ERT-profile 2, done by Enkel and
Sjöstrand (2012). The Murothone borehole lies approximately 2m off the ERT-profile.
Between a depth of 12m and 19m the resistivity measured from the ERT aligns quite well with
the resistivity from the borehole logging. In layer 1, the ERT seems to miss the drop in
resistivity, and the match between the logs is poor. Below the first seen anomaly at a depth
of 20m, no resistivity is measured for the borehole logging, and this makes a comparison
impossible.
47
4.7.4 Geological interpretation
Based on resistivity
The layers in the geological interpretation follow the layers seen above.
Layer 1: This layer is a low resistivity layer interpreted as clay with base in the general
resistivity classification (see Figure 11). Looking at the Acworth weathering zones (Table 2),
the resistivity of this layer most closely resembles zone ‘b’. All together this layer is
interpreted as a layer with accumulated damp clay.
Layer 2: The resistivity of this layer matches the general resistivity classification of clay, and
the Acworth profile layer zone ‘b’ or ‘c’. This layer is interpreted as a transition between the
Acworth zones ‘b’ and ‘c’ giving a geological environment consisting of clay, and further down
the rock has been progressively altered leaving a zone with crystalline aggregates and rock
fragments.
Layer 3: Several stretches of negative (ignored) resistivity values are present in this layer
making the geological interpretation harder. The mean resistivity value lies in the lower range
of unweathered rocks and within the Acworth zone ‘fresh rock’, but the resistivity is highly
fluctuating and it is therefore reasonable to believe that fractures and fissures are present.
This layer is interpreted as fractured and fissured rock according to the above reasoning.
Below layer three no resistivity values were registered and it is not possible to make a
geological interpretation.
Based on natural gamma radiation
Overall the natural gamma measured in the Murothone borehole is quite high. This is
explained by the rock consisting of granite. Layers A1-3 show a decrease in natural gamma
(stagnant in layer A2) implying a decrease in clay content towards the bottom of the layer.
This aligns with the interpretation of layers 1 and 2 based on the resistivity log. The geological
formation information doesn’t show any presence of clay, however the difference between
find sand and clay can be very small.
Layers B, C and D are interpreted to be composed of more large crystalline aggregates or solid
granite and therefor they show an increase in gamma radiation compared to the above A
layers. Layer D is interpreted to contain the highest amount of granite.
48
4.8 Naholoco Communidade
4.8.1 Site description and borehole information The borehole at Naholoco Communidade is situated 25km east of Nampula City. In the
summary of the daily drilling activity report (Appendix 2) the borehole is denoted positive. The
borehole lies almost straight on ERT-profile 2 and 5m off ERT-profile 1 use for resistivity
comparison. In Table 13 below, general information regarding the borehole at Naholoco
Communidade is presented.
Table 13 General information from borehole at Naholoco Communidade. Denotation given means information from the daily drilling report summary or (Enkel & Sjöstrand, 2013) and measured data means data measured on site at the time of the investigation.
NAHOLOCO COMMUNIDADE IDENTIFICATION NO: 03/20/02/0069/2011
COORDINATES 15°8’21.67’’S 39°29’11.06’’E 10m precision CONDUCTIVITY 775µS/cm PH 6.6 WATER TEMPERATURE 25.2°C BOREHOLE DEPTH Given: 38.61m Measured: 35.85m WATER LEVEL Given: 11.97m Measured: 13.14m (at arrival on site) WELL-SCREEN PLACEMENT Given: 24.3-30.0m & 33.76-36.61m YIELD Given: 0.6m3/h
The borehole at Naholoco Communidade is according to the geological map in Figure 13
placed in augen granitic gneiss. Further this is classified as plutonic.
4.8.2 Acquired data The acquired natural gamma and resistivity data from the geophysical borehole logging is seen
in Figure 25. The presented log (log 1) stretches from 2.53m to 33.63m below ground.
Resistivity
The observed resistivity is down to 9m below ground very smooth. A large resistivity peak is
seen at 12.5m below ground and below a depth of 20m the resistivity is highly fluctuating with
several stretches of negative (ignored) resistivity. At 24m and 30m below ground, repetitive
anomalies are seen. The resistivity log from the borehole logging is divided into layers seen
below.
Layer 1 (top layer, 0-8.6m below ground): This layer shows a very smooth resistivity log,
decreasing from the top down to 15Ωm at a depth of 6m below ground, then it increases
moving further down the layer. The mean value in this layer lies at 32Ωm.
Layer 2 (8.6-11.5m below ground): Further increase in resistivity is seen, and the log fluctuates
more than in layer 1. The mean value of this layer lies at 150Ωm.
Layer 3 (11.5-13.3m below ground): In this layer the main feature is a peak at the depth of
12m reaching a resistivity of 15150Ωm.
Layer 3 (13.3-21.1m below ground): In this layer the resistivity log no longer is smooth but
fluctuates a bit around the mean value of 185Ωm. A small peak at the top of the layer is seen
and rises to 1960Ωm.
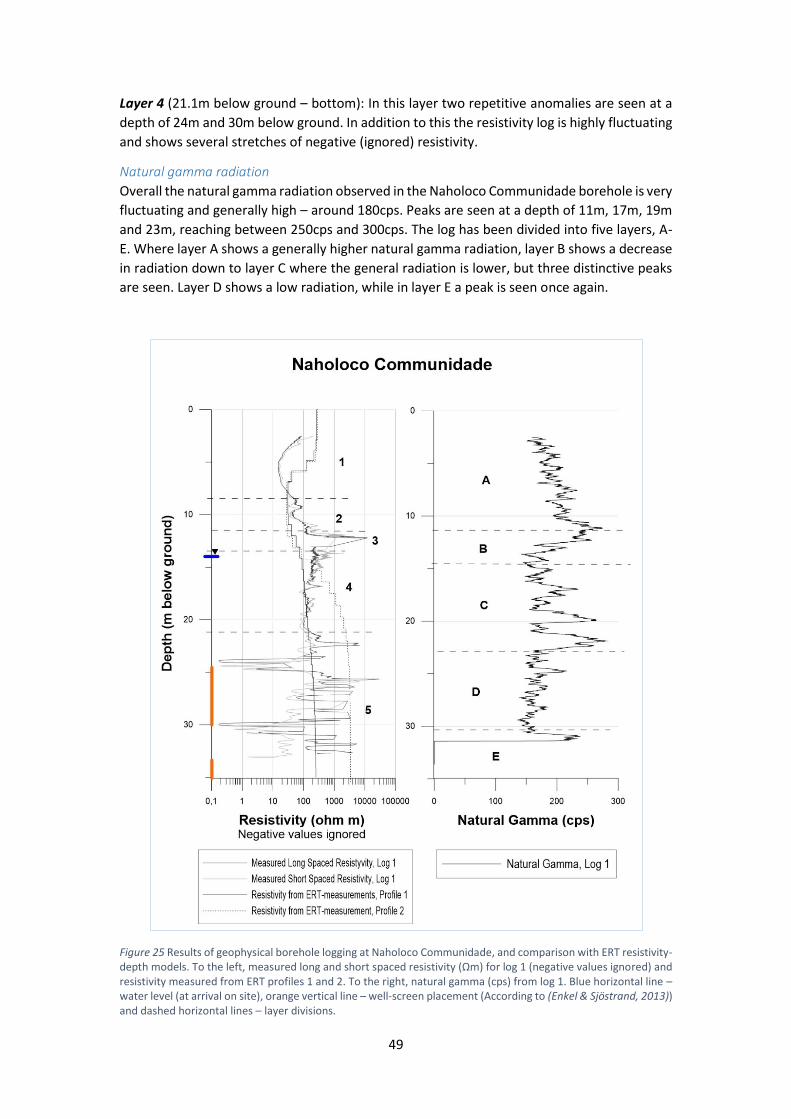
49
Layer 4 (21.1m below ground – bottom): In this layer two repetitive anomalies are seen at a
depth of 24m and 30m below ground. In addition to this the resistivity log is highly fluctuating
and shows several stretches of negative (ignored) resistivity.
Natural gamma radiation
Overall the natural gamma radiation observed in the Naholoco Communidade borehole is very
fluctuating and generally high – around 180cps. Peaks are seen at a depth of 11m, 17m, 19m
and 23m, reaching between 250cps and 300cps. The log has been divided into five layers, A-
E. Where layer A shows a generally higher natural gamma radiation, layer B shows a decrease
in radiation down to layer C where the general radiation is lower, but three distinctive peaks
are seen. Layer D shows a low radiation, while in layer E a peak is seen once again.
Figure 25 Results of geophysical borehole logging at Naholoco Communidade, and comparison with ERT resistivity-depth models. To the left, measured long and short spaced resistivity (Ωm) for log 1 (negative values ignored) and resistivity measured from ERT profiles 1 and 2. To the right, natural gamma (cps) from log 1. Blue horizontal line – water level (at arrival on site), orange vertical line – well-screen placement (According to (Enkel & Sjöstrand, 2013)) and dashed horizontal lines – layer divisions.
50
4.8.3 Comparison between ERT and borehole logging resistivity Figure 25 also shows two resistivity-depth models from ERT-profiles 1 and 2 conducted by
Enkel and Sjöstrand (2013). The borehole lies on profile 2 and 5m away from profile 1. Down
to a depth of 14m the two ERT-depth profiles follow each other very well, below this they
diverge and profile 1 shows lower resistivity then profile 2. The resistivity of profile 1 matches
closest with the mean of the resistivity from the borehole logging. As for example in the
Matibane and Incomati Sae cases the dip of resistivity seen a few meters below ground is
displaced deeper down the borehole in the ERT-measured case compared to the borehole
logging case. At the present borehole the displacement is about 4m.
4.8.4 Geological interpretation
Based on resistivity
The layering seen above is used for the geological interpretation
Layer 1: In this layer the resistivity coincides with the resistivity of clay in the general resistivity
classification seen in Figure 11. Furthermore it aligns with the Acworth weathering layer zone
‘b’, consisting of accumulated damp clay (Table 2). This layer is interpreted as being a clay
layer.
The increased resistivity towards the top of the log is quite smooth and it is assumed that this
is due to natural cementation towards the ground surface.
Layer 2: The mean resistivity value of this layer points at that the layer should be consisting of
wet gravel and sand, and match the Acworth layer zone ‘c’. With the above statements taken
into consideration it is interpreted that this layer consists of crystal aggregates and fragments
of rock due to rock being progressively altered. In addition a layer of hard less weathering-
prone rock is seen.
Layer 3: The main feature of this layer is a resistivity peak reaching values matching
unweathered rock in the general resistivity classification.
Layer 4: This layer is also interpreted as being wet gravel and sand. A layer with crystal
aggregates and rock fragments in line with the Acworth weathering profile zone ‘c’.
Layer 5: This layer is dominated by the anomalies seen at a depth of 24m and 30m. Due to
these anomalies and stretches of negative (ignored) resistivity values, interpretation of the
geology in this layer is difficult. The mean resistivity seen in this layer lies at 256Ωm and this
corresponds to the Acworth weathering zone ‘c’ where crystal aggregates and rock fractures
are present. However, since the resistivity is fluctuation between 10Ωm – corresponding to
fresh water and 58800Ωm corresponding to unweathered rock it is reasonable to interpret
this layer as being a layer where weathering has not proceeded far, and fissures and fractures
are the main features.
Based on natural gamma radiation
The generally high natural gamma radiation is implying that the rock in the area has a high
granite content.
Layer A implies an increased clay content towards the bottom of the layer due to an increased
gamma radiation. Layer B shows a distinctive drop in natural gamma, interpreted as layer B is
consisting of purer rock than layer A. In layer C three distinctive peaks are seen. These can
either be interpreted as fracture zones with fractures filled with clay or as layers where the

51
granite content is higher than in the surrounding layers. The last assumption is probably more
plausible due to the fact that the rock composition shows a high granite content.
52
4.9 Naholoco EP1-2
4.9.1 Site description and borehole information Naholoco EP1-2 is situated 25km east of Nampula City. In the summary of the daily drilling
activity (Appendix 2) report the borehole is denoted positive. The borehole lies approximately
10m off both the ERT-profiles used for resistivity comparison. Below in Table 14 general
information regarding the borehole at Naholoco EP1-2 is presented.
Table 14 General information from borehole at Naholoco EP1-2. Denotation given means information from the daily drilling report summary or (Enkel & Sjöstrand, 2013) and measured data means data measured on site at the time of the investigation.
NAHOLOCO EP1-2 IDENTIFICATION NO: 03/20/02/0068/2011
COORDINATES 15°7’16.69’’S 39°29’40.76’’E 6m precision CONDUCTIVITY 388µS/cm PH 6.2 WATER TEMPERATURE 27.9°C BOREHOLE DEPTH Given: 45.42m Measured: 43.3m WATER LEVEL Given: 14.46m Measured: 13.17m (at arrival on site) WELL-SCREEN PLACEMENT Given: 32.2-38.0m & 40.57-43.42m YIELD Given: 1.9m3/h
According to the geological map seen in Figure 13 the Naholoco EP1-2 borehole is placed in
augen granitic gneiss. Further this is classified as plutonic.
4.9.2 Acquired data The acquired natural gamma and resistivity data from the geophysical borehole logging is seen
in Figure 26. The presented log (log 1) stretches from 2.56m to 43.34m below ground.
Resistivity
The resistivity log from the borehole logging is down to 20m below ground quite smooth and
stable, except showing one large peak at 13m depth. Towards the bottom of the borehole
three repetitive anomalies are seen at 30m, 36m and 42m below ground. The resistivity log
from the borehole logging is divided into three layers described below.
Layer1 (top layer, 0-4.1m below ground): In this top layer the resistivity drastically decreases
down to 30Ωm towards the bottom of the layer from the highest detected value in the layer
which reaches 2500Ωm. The mean value calculated for this layer is 125Ωm.
Layer 2 (4.1-21.4m below ground): In this layer the resistivity log is very smooth and lies quite
stable around 30Ωm. One large peak is seen at a depth of 13m and it reaches up to 6666Ωm.
The mean value in this layer is 43Ωm.
Layer 3 (21.4m below ground – bottom): In this layer the resistivity generally varies between
30Ωm and 330Ωm with a calculated mean at 86Ωm. However there are three repetitive
anomalies seen at the depths 30m, 36m, and 42m below ground.
Natural gamma radiation
The natural gamma radiation is overall high – fluctuating around 180cps down to 20m below
ground, and from here to the bottom it fluctuates around 120cps. The log has been divided
into seven layers where layers in connection and with similar natural gamma characteristics
have been placed together – in this case layers A1-2 and D1-3. Layer A2 shows high natural
gamma radiation, which is decreased in layer B and drastically decreased in layer A1. In layer
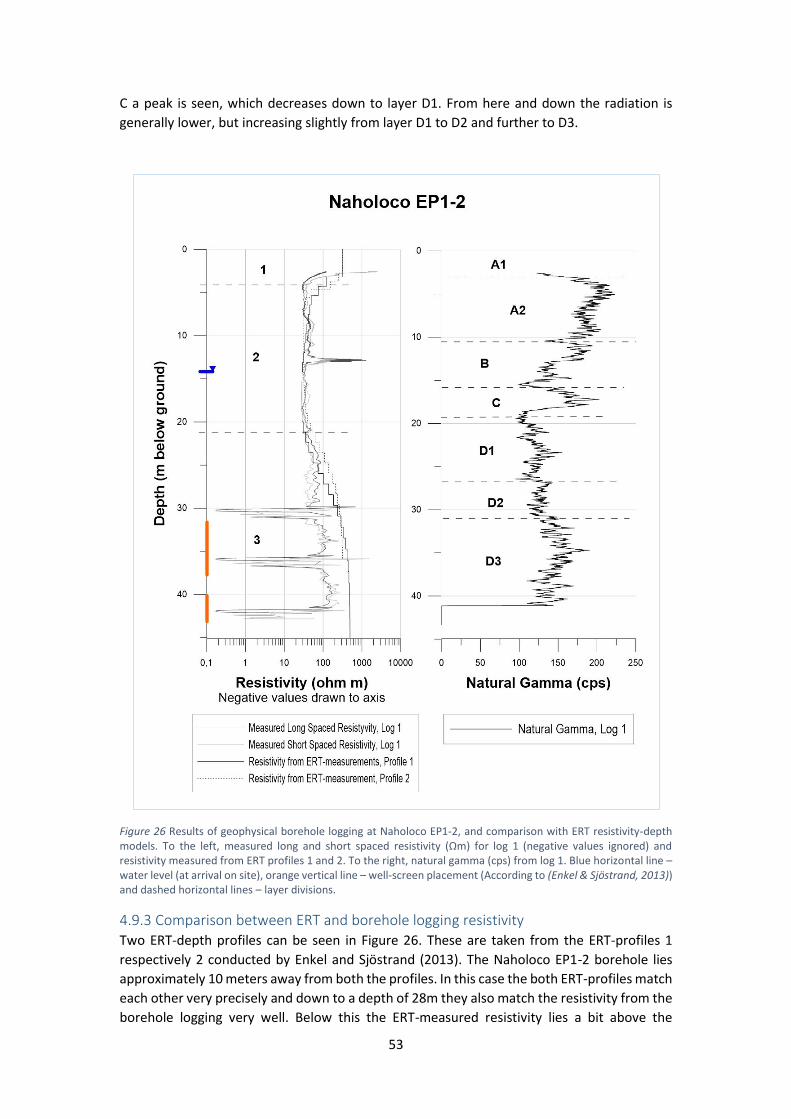
53
C a peak is seen, which decreases down to layer D1. From here and down the radiation is
generally lower, but increasing slightly from layer D1 to D2 and further to D3.
Figure 26 Results of geophysical borehole logging at Naholoco EP1-2, and comparison with ERT resistivity-depth models. To the left, measured long and short spaced resistivity (Ωm) for log 1 (negative values ignored) and resistivity measured from ERT profiles 1 and 2. To the right, natural gamma (cps) from log 1. Blue horizontal line – water level (at arrival on site), orange vertical line – well-screen placement (According to (Enkel & Sjöstrand, 2013)) and dashed horizontal lines – layer divisions.
4.9.3 Comparison between ERT and borehole logging resistivity Two ERT-depth profiles can be seen in Figure 26. These are taken from the ERT-profiles 1
respectively 2 conducted by Enkel and Sjöstrand (2013). The Naholoco EP1-2 borehole lies
approximately 10 meters away from both the profiles. In this case the both ERT-profiles match
each other very precisely and down to a depth of 28m they also match the resistivity from the
borehole logging very well. Below this the ERT-measured resistivity lies a bit above the
54
borehole logging measured resistivity. It is very clear that the ERT misses fine structures for
example the peak seen at a depth of 13m in the borehole logging resistivity log.
4.9.4 Geological interpretation
Based on resistivity
The layering seen in the geological interpretation is the same as the layering seen above.
Layer 1: The top layer should according to the general resistivity classification be interpreted
as dry gravel and sand if looking at the mean resistivity value of the layer (Figure 11). However,
if looking at the resistivity profile one sees that the resistivity increases toward the surface
and the resistivity values stretch towards duricrust. Taking this into consideration this top
layer matches either zone ‘a’ or ‘A’ in the Acworth weathering profile (see Table 2). This layer
is interpreted as duricrust, a well-drained soil of high porosity.
The increase in resistivity towards the top of the log could be due to natural cementation as
stated above, however since the increase is quite steep it is plausible to believe that this is an
indication of some kind of backfill being used to stabilise the casing after drilling. Commonly
used is cement, clay or bentonite clay (clay and bentonite clay would instead give a decreased
resistivity).
Layer 2: The mean resistivity value of layer 2 implies that it lies in an Acworth zone ‘b’, where
clay has accumulated. This is strengthened by the general resistivity classification implying this
layer is a clay layer. One large peak is seen at a depth of 13m, and this reaches resistivity values
corresponding to solid rock. According to the above reasoning, the layer is interpreted as a
layer where clay has been accumulated and a stretch of weathering-prone rock is present
within the layer.
Layer 3: This layer is characterised by the three anomalies seen at a depth of 30m, 36m and
42m below ground. These anomalies are dips in resistivity which will act decreasingly on the
mean resistivity value. However, the calculated mean value lies at 86Ωm suggesting that the
layer should consist of humid gravel and sand according to the general resistivity classification.
Looking at the Acworth weathering profile, the layer should be of zone type ‘b’ or ‘c’. When
summing the above reasoning, layer three is interpreted as a layer of humid gravel and sand,
where crystal aggregates and rock fragments are present due to ongoing weathering.
Based on natural gamma radiation
The gamma radiation indicates the purity of the rock material or on granitic rock basements
as this it can also indicate the relative amount of granite.
Starting from the bottom with layers D1-3 the natural gamma radiation is slightly increased
from the top down, in this case implying an increased amount of granite.
Layers A-C also show a decrease in gamma radiation, which in this case it is plausible to
interpret as a decreased clay content following the reasoning regarding the Acworth
weathering profile. Although a slight clay accumulation is seen at a depth of 18m – layer C.
Layer A1 shows a drastic decrease in natural gamma, this layer matches the top resistivity
layer where an increase in resistivity is seen.
55
4.10 Namiraka
4.10.1 Site description and borehole information The borehole at Namiraka is situated just off the main road, 6km south-west of Liúpo. In the
summary of the daily drilling activity reports (Appendix 3) the borehole was denoted positive.
The borehole lies approximately 4m off the ERT-profile used for resistivity comparison. In
Table 15 below some general information regarding the borehole at Namiraka is presented.
Table 15 General information from borehole at Namiraka. Denotation given means information from the daily drilling report summary or (Andersson & Björkström, 2013) and measured data means data measured on site at the time of the investigation.
NAMIRAKA IDENTIFICATION NO: -
COORDINATES 15°39’4.91’’S 39°55’8.08’’E 6m precision CONDUCTIVITY 1950µS/cm PH 6.62 WATER TEMPERATURE 27.6°C BOREHOLE DEPTH Given: 43m Measured: 41.82m WATER LEVEL Given: 10.07m Measured: 8.97m (at arrival on site) WELL-SCREEN PLACEMENT Given: 32.2-35.2m & 38.0-41.0m YIELD Given: 1.0m3/h
According to the geological map in Figure 13 the Namiraka borehole is placed in hornblende-
bearing granodioritic tonalitic gneiss. Further this is classified as plutonic. Below, in Table 16,
one can find the geological information from the borehole, adapted from Andersson and
Björkström (2013).
Table 16 Geological information from the Namiraka borehole, adapted from (Andersson & Björkström, 2013).
GEOLOGICAL FORMATION DEPTHS
(M BELOW GROUND)
SOIL 0-1 COARSE SAND 1-9 FINE SAND 9-12 FRESH GNEISS 12-18 FRACTURED GNEISS 18-26 QUARTZ 26-44
4.10.2 Acquired data The acquired natural gamma and resistivity data from the geophysical borehole logging is seen
in Figure 27. The presented log (log 1) stretches from 2.6m to 41.81m below ground.
Resistivity
The resistivity log shows plenty of stretches with negative (ignored) resistivity from 12m below
ground down to the bottom of the borehole. The resistivity log from the borehole logging is
divided into the following layers.
Layer 1 (top layer, 0-7m below ground): In this layer the dominant feature is a decrease of
resistivity down to approximately 15Ωm at the bottom of the layer. The resistivity log is very
smooth in this layer.
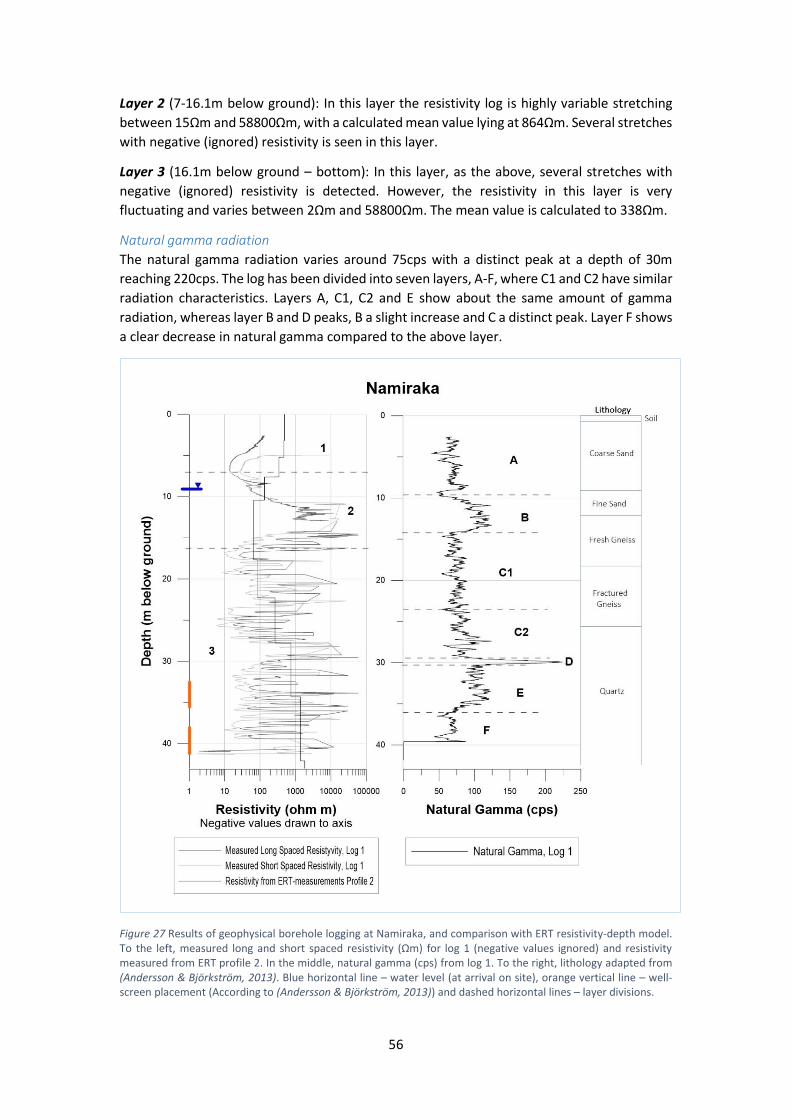
56
Layer 2 (7-16.1m below ground): In this layer the resistivity log is highly variable stretching
between 15Ωm and 58800Ωm, with a calculated mean value lying at 864Ωm. Several stretches
with negative (ignored) resistivity is seen in this layer.
Layer 3 (16.1m below ground – bottom): In this layer, as the above, several stretches with
negative (ignored) resistivity is detected. However, the resistivity in this layer is very
fluctuating and varies between 2Ωm and 58800Ωm. The mean value is calculated to 338Ωm.
Natural gamma radiation
The natural gamma radiation varies around 75cps with a distinct peak at a depth of 30m
reaching 220cps. The log has been divided into seven layers, A-F, where C1 and C2 have similar
radiation characteristics. Layers A, C1, C2 and E show about the same amount of gamma
radiation, whereas layer B and D peaks, B a slight increase and C a distinct peak. Layer F shows
a clear decrease in natural gamma compared to the above layer.
Figure 27 Results of geophysical borehole logging at Namiraka, and comparison with ERT resistivity-depth model. To the left, measured long and short spaced resistivity (Ωm) for log 1 (negative values ignored) and resistivity measured from ERT profile 2. In the middle, natural gamma (cps) from log 1. To the right, lithology adapted from (Andersson & Björkström, 2013). Blue horizontal line – water level (at arrival on site), orange vertical line – well-screen placement (According to (Andersson & Björkström, 2013)) and dashed horizontal lines – layer divisions.
57
4.10.3 Comparison between ERT and borehole logging resistivity In Figure 27 one can also see a resistivity-depth model from ERT-profile 2 conducted by
Andersson and Björkström (2013). The borehole lies approximately 4m away from the profile.
In the above mentioned third layer, the ERT-measured resistivity matches quite well with the
mean of the borehole logging resistivity (even though the ERT doesn’t show any of the
variations seen in the borehole logging log). Contradicting is the resistivity values seen in layer
two, which in the borehole logging case seems to be increased in this layer, but decreased in
the ERT case. In both the ERT- case and borehole logging case the resistivity is increased
towards the ground surface, although this increase is not matched in depth.
4.10.4 Geological interpretation
Based on resistivity
The same layering as above is used for the geological interpretation.
Layer 1: The mean resistivity value of this layer suggests that this layer should consist of clay
according to the general resistivity classification (see Figure 11). However, when looking at
the shape of the resistivity log one sees that the resistivity increases from the bottom to the
top of the layer. The resistivity values at the bottom of the layer correspond to the Acworth
weathering profile zone ‘b’ whereas the resistivity values at the top of the layer rather
correspond to zone ‘A’ (Table 2). This reasoning gives the geological interpretation that this
layer starts as a well-drained and leached sandy soil gradually turning into a layer where clay
is accumulated, porosity is high and permeability is low.
The increased resistivity towards the top of the layer could also be an indication of some kind
of backfill used in order stabilise the casing after drilling.
Layer 2: Layer 2 has a mean resistivity value corresponding to that of gravel and sand. None
of the Acworth layers show a precise match to the mean resistivity value, however, the
resistivity log is highly fluctuating in this area and it is reasonable to interpret this as fractured
and fissured rock. The resistivity at the top of this layer is drastically increasing and this is
interpreted as a transition layer where the rock is progressively altered upward leaving crystal
aggregates and rock fragments corresponding the Acworth layer zone ‘c’.
Layer 3: This layer shows several stretches of negative (ignored) resistivity values, making it
difficult to make a valid geological interpretation. This layer has a lower resistivity mean value
than the above layer, but at the same time the resistivity log fluctuates over a greater
resistivity span reaching from fresh water to unweathered rock. According to this it is
reasonable to interpret this layer as a layer of extensively fractured and fissured rock.
Based on natural gamma radiation
The natural gamma is overall quite low, implying a relatively low granite content. In order C1,
C2, E the natural gamma is increased implying an increased granite content towards the
bottom of the borehole, but the most bottom layer, layer F, shows quite a large decrease in
gamma radiation interpreted as a layer with less granite content. On the contrary layer D (in
between C2 and E) is a large peak implying a layer with large granite content compared to the
surrounding layers.
Comparing layers A and B it is assumed that layer B has a larger clay content than layer A –
natural gamma radiation indicating the purity of the rock. This is strengthened by the general
formation information stating that a fine sand layer is found between the depths 9m and 12m.
Fine sand and clay lie close to each other and can be hard to distinguish between. The

58
interpretation based on resistivity does however contradict the interpretation of layer B being
a fine sand/clay layer.
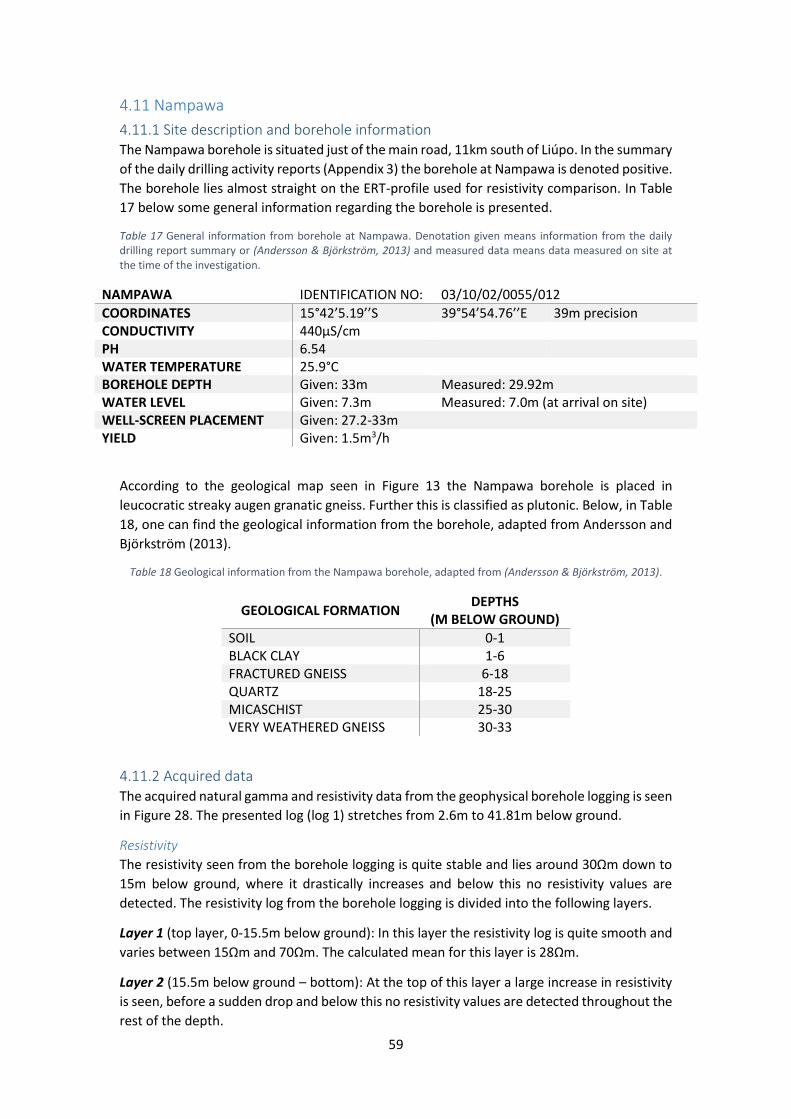
59
4.11 Nampawa
4.11.1 Site description and borehole information The Nampawa borehole is situated just of the main road, 11km south of Liúpo. In the summary
of the daily drilling activity reports (Appendix 3) the borehole at Nampawa is denoted positive.
The borehole lies almost straight on the ERT-profile used for resistivity comparison. In Table
17 below some general information regarding the borehole is presented.
Table 17 General information from borehole at Nampawa. Denotation given means information from the daily drilling report summary or (Andersson & Björkström, 2013) and measured data means data measured on site at the time of the investigation.
NAMPAWA IDENTIFICATION NO: 03/10/02/0055/012
COORDINATES 15°42’5.19’’S 39°54’54.76’’E 39m precision CONDUCTIVITY 440µS/cm PH 6.54 WATER TEMPERATURE 25.9°C BOREHOLE DEPTH Given: 33m Measured: 29.92m WATER LEVEL Given: 7.3m Measured: 7.0m (at arrival on site) WELL-SCREEN PLACEMENT Given: 27.2-33m YIELD Given: 1.5m3/h
According to the geological map seen in Figure 13 the Nampawa borehole is placed in
leucocratic streaky augen granatic gneiss. Further this is classified as plutonic. Below, in Table
18, one can find the geological information from the borehole, adapted from Andersson and
Björkström (2013).
Table 18 Geological information from the Nampawa borehole, adapted from (Andersson & Björkström, 2013).
GEOLOGICAL FORMATION DEPTHS
(M BELOW GROUND)
SOIL 0-1 BLACK CLAY 1-6 FRACTURED GNEISS 6-18 QUARTZ 18-25 MICASCHIST 25-30 VERY WEATHERED GNEISS 30-33
4.11.2 Acquired data The acquired natural gamma and resistivity data from the geophysical borehole logging is seen
in Figure 28. The presented log (log 1) stretches from 2.6m to 41.81m below ground.
Resistivity
The resistivity seen from the borehole logging is quite stable and lies around 30Ωm down to
15m below ground, where it drastically increases and below this no resistivity values are
detected. The resistivity log from the borehole logging is divided into the following layers.
Layer 1 (top layer, 0-15.5m below ground): In this layer the resistivity log is quite smooth and
varies between 15Ωm and 70Ωm. The calculated mean for this layer is 28Ωm.
Layer 2 (15.5m below ground – bottom): At the top of this layer a large increase in resistivity
is seen, before a sudden drop and below this no resistivity values are detected throughout the
rest of the depth.
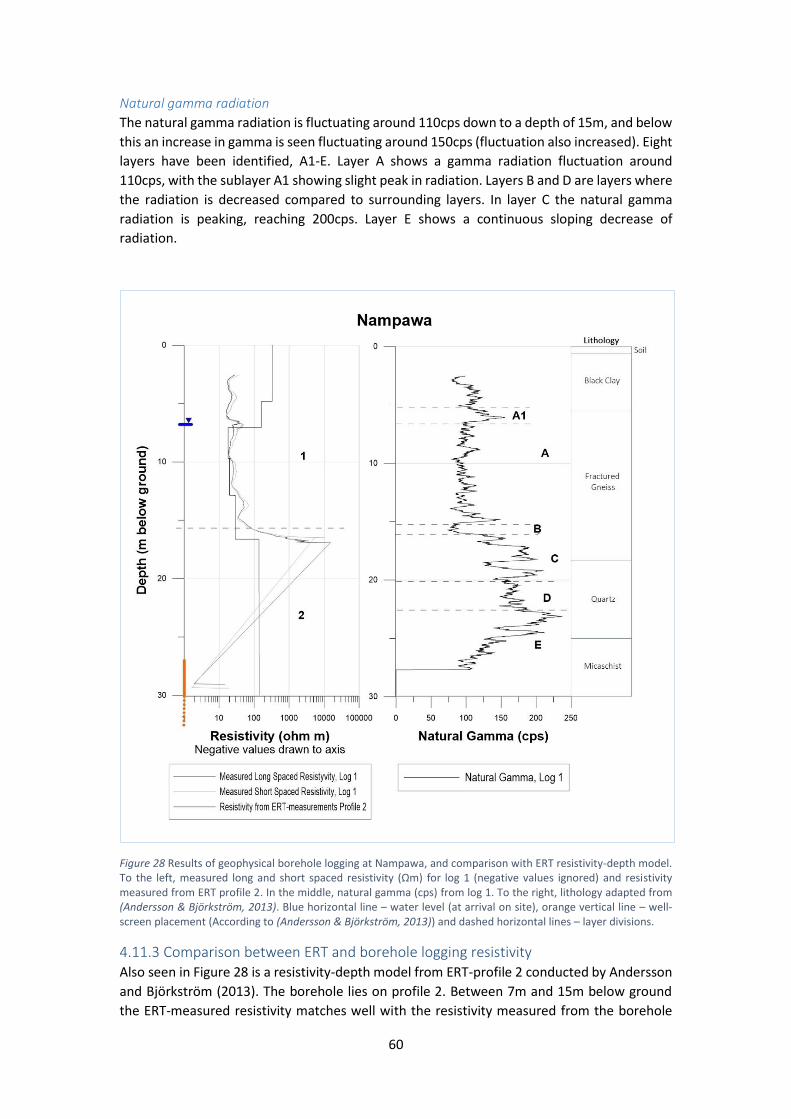
60
Natural gamma radiation
The natural gamma radiation is fluctuating around 110cps down to a depth of 15m, and below
this an increase in gamma is seen fluctuating around 150cps (fluctuation also increased). Eight
layers have been identified, A1-E. Layer A shows a gamma radiation fluctuation around
110cps, with the sublayer A1 showing slight peak in radiation. Layers B and D are layers where
the radiation is decreased compared to surrounding layers. In layer C the natural gamma
radiation is peaking, reaching 200cps. Layer E shows a continuous sloping decrease of
radiation.
Figure 28 Results of geophysical borehole logging at Nampawa, and comparison with ERT resistivity-depth model. To the left, measured long and short spaced resistivity (Ωm) for log 1 (negative values ignored) and resistivity measured from ERT profile 2. In the middle, natural gamma (cps) from log 1. To the right, lithology adapted from (Andersson & Björkström, 2013). Blue horizontal line – water level (at arrival on site), orange vertical line – well-screen placement (According to (Andersson & Björkström, 2013)) and dashed horizontal lines – layer divisions.
4.11.3 Comparison between ERT and borehole logging resistivity Also seen in Figure 28 is a resistivity-depth model from ERT-profile 2 conducted by Andersson
and Björkström (2013). The borehole lies on profile 2. Between 7m and 15m below ground
the ERT-measured resistivity matches well with the resistivity measured from the borehole
61
logging. Below this the borehole logging has detected no resistivity so that no comparison can
be made. In the top layer the resistivity from the ERT-profile increases towards the ground.
From the ground down to 6m below ground there is a large difference between the resistivity
detected by the borehole logging and the ERT.
4.11.4 Geological interpretation
Based on resistivity
The same layering as above is used for the geological interpretation.
Layer 1: This layer has a mean resistivity value corresponding to the general resistivity
classification of clay (see Figure 11). It also corresponds to the Acworth weathering profile
zone ‘b’. It is interpreted that this layer consists of accumulated damp clay.
Layer 2: In this layer no resistivity values are detected and therefore no geological
interpretation can be made. Although at the top of the layer the resistivity is increased in
comparison with the layer above, implying a decrease of clay material and transition towards
Acworth layer ‘c’.
Based on natural gamma radiation
The natural gamma radiation in this borehole is overall quite high, this due to the relatively
high content of granite in the rock.
The purity of the rock or granite content is determined by the natural gamma radiation. Layers
A are interpreted to consist of clay, especially accumulated in layer A1. Layer B is interpreted
as a layer of higher purity due to its decrease in gamma radiation. Layers C-E are interpreted
as rock layers with relatively high granite content – highest content in layer C and at the top
of layer E. Layer E show a decrease in gamma radiation interpreted as a decrease in granite
content towards the bottom of the layer alternatively as a layer turning purer with depth
(correlating with the suspected weathering profile).
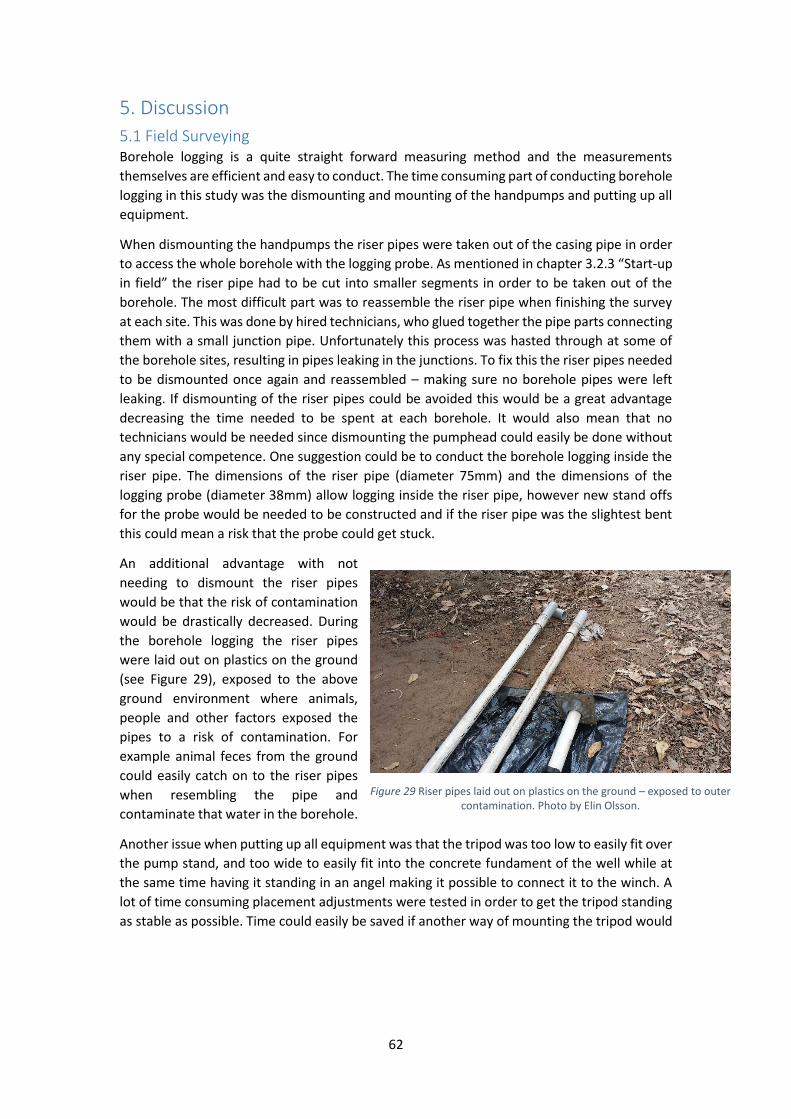
62
5. Discussion
5.1 Field Surveying Borehole logging is a quite straight forward measuring method and the measurements
themselves are efficient and easy to conduct. The time consuming part of conducting borehole
logging in this study was the dismounting and mounting of the handpumps and putting up all
equipment.
When dismounting the handpumps the riser pipes were taken out of the casing pipe in order
to access the whole borehole with the logging probe. As mentioned in chapter 3.2.3 “Start-up
in field” the riser pipe had to be cut into smaller segments in order to be taken out of the
borehole. The most difficult part was to reassemble the riser pipe when finishing the survey
at each site. This was done by hired technicians, who glued together the pipe parts connecting
them with a small junction pipe. Unfortunately this process was hasted through at some of
the borehole sites, resulting in pipes leaking in the junctions. To fix this the riser pipes needed
to be dismounted once again and reassembled – making sure no borehole pipes were left
leaking. If dismounting of the riser pipes could be avoided this would be a great advantage
decreasing the time needed to be spent at each borehole. It would also mean that no
technicians would be needed since dismounting the pumphead could easily be done without
any special competence. One suggestion could be to conduct the borehole logging inside the
riser pipe. The dimensions of the riser pipe (diameter 75mm) and the dimensions of the
logging probe (diameter 38mm) allow logging inside the riser pipe, however new stand offs
for the probe would be needed to be constructed and if the riser pipe was the slightest bent
this could mean a risk that the probe could get stuck.
An additional advantage with not
needing to dismount the riser pipes
would be that the risk of contamination
would be drastically decreased. During
the borehole logging the riser pipes
were laid out on plastics on the ground
(see Figure 29), exposed to the above
ground environment where animals,
people and other factors exposed the
pipes to a risk of contamination. For
example animal feces from the ground
could easily catch on to the riser pipes
when resembling the pipe and
contaminate that water in the borehole.
Another issue when putting up all equipment was that the tripod was too low to easily fit over
the pump stand, and too wide to easily fit into the concrete fundament of the well while at
the same time having it standing in an angel making it possible to connect it to the winch. A
lot of time consuming placement adjustments were tested in order to get the tripod standing
as stable as possible. Time could easily be saved if another way of mounting the tripod would
Figure 29 Riser pipes laid out on plastics on the ground – exposed to outer contamination. Photo by Elin Olsson.
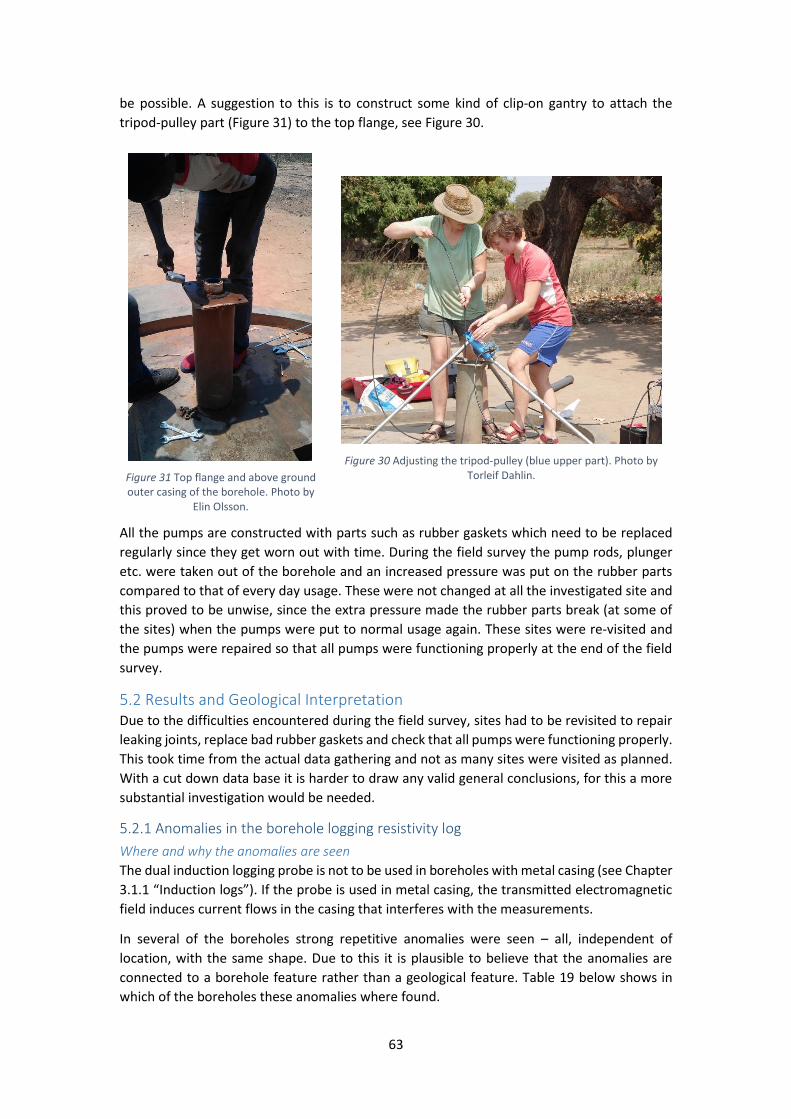
63
be possible. A suggestion to this is to construct some kind of clip-on gantry to attach the
tripod-pulley part (Figure 31) to the top flange, see Figure 30.
All the pumps are constructed with parts such as rubber gaskets which need to be replaced
regularly since they get worn out with time. During the field survey the pump rods, plunger
etc. were taken out of the borehole and an increased pressure was put on the rubber parts
compared to that of every day usage. These were not changed at all the investigated site and
this proved to be unwise, since the extra pressure made the rubber parts break (at some of
the sites) when the pumps were put to normal usage again. These sites were re-visited and
the pumps were repaired so that all pumps were functioning properly at the end of the field
survey.
5.2 Results and Geological Interpretation Due to the difficulties encountered during the field survey, sites had to be revisited to repair
leaking joints, replace bad rubber gaskets and check that all pumps were functioning properly.
This took time from the actual data gathering and not as many sites were visited as planned.
With a cut down data base it is harder to draw any valid general conclusions, for this a more
substantial investigation would be needed.
5.2.1 Anomalies in the borehole logging resistivity log
Where and why the anomalies are seen
The dual induction logging probe is not to be used in boreholes with metal casing (see Chapter
3.1.1 “Induction logs”). If the probe is used in metal casing, the transmitted electromagnetic
field induces current flows in the casing that interferes with the measurements.
In several of the boreholes strong repetitive anomalies were seen – all, independent of
location, with the same shape. Due to this it is plausible to believe that the anomalies are
connected to a borehole feature rather than a geological feature. Table 19 below shows in
which of the boreholes these anomalies where found.
Figure 31 Top flange and above ground outer casing of the borehole. Photo by
Elin Olsson.
Figure 30 Adjusting the tripod-pulley (blue upper part). Photo by Torleif Dahlin.
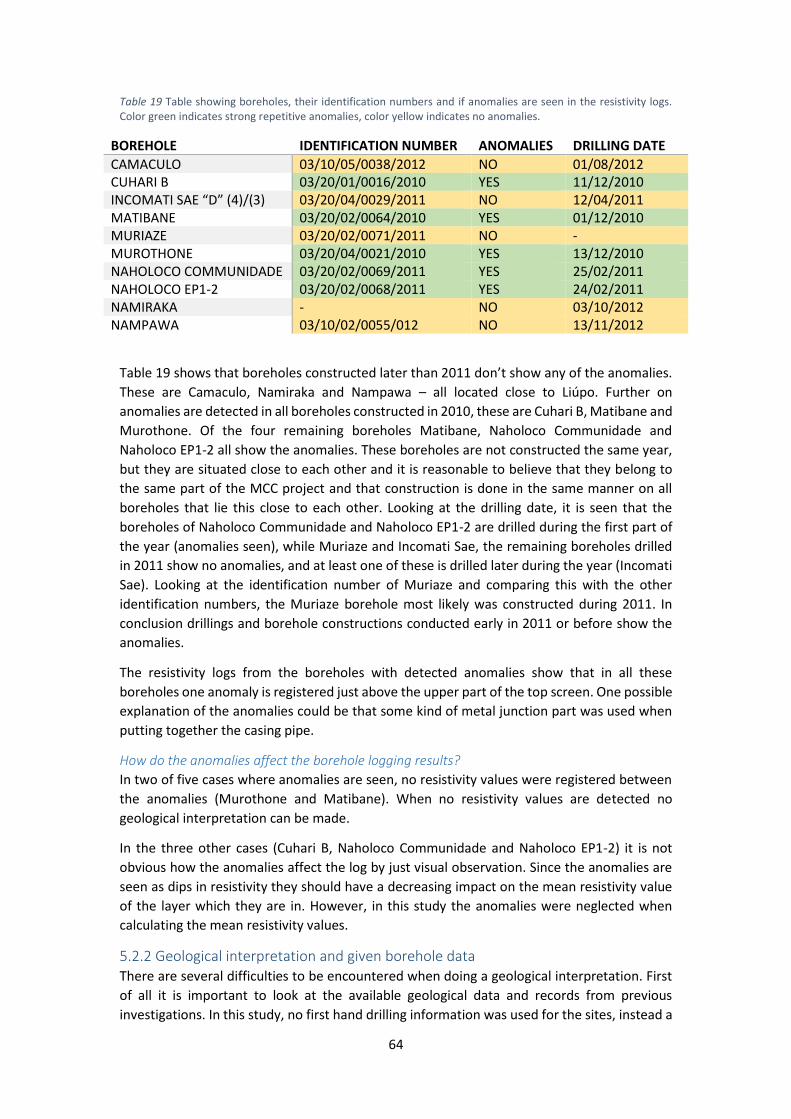
64
Table 19 Table showing boreholes, their identification numbers and if anomalies are seen in the resistivity logs. Color green indicates strong repetitive anomalies, color yellow indicates no anomalies.
BOREHOLE IDENTIFICATION NUMBER ANOMALIES DRILLING DATE
CAMACULO 03/10/05/0038/2012 NO 01/08/2012 CUHARI B 03/20/01/0016/2010 YES 11/12/2010 INCOMATI SAE “D” (4)/(3) 03/20/04/0029/2011 NO 12/04/2011 MATIBANE 03/20/02/0064/2010 YES 01/12/2010 MURIAZE 03/20/02/0071/2011 NO - MUROTHONE 03/20/04/0021/2010 YES 13/12/2010 NAHOLOCO COMMUNIDADE 03/20/02/0069/2011 YES 25/02/2011 NAHOLOCO EP1-2 03/20/02/0068/2011 YES 24/02/2011 NAMIRAKA - NO 03/10/2012 NAMPAWA 03/10/02/0055/012 NO 13/11/2012
Table 19 shows that boreholes constructed later than 2011 don’t show any of the anomalies.
These are Camaculo, Namiraka and Nampawa – all located close to Liúpo. Further on
anomalies are detected in all boreholes constructed in 2010, these are Cuhari B, Matibane and
Murothone. Of the four remaining boreholes Matibane, Naholoco Communidade and
Naholoco EP1-2 all show the anomalies. These boreholes are not constructed the same year,
but they are situated close to each other and it is reasonable to believe that they belong to
the same part of the MCC project and that construction is done in the same manner on all
boreholes that lie this close to each other. Looking at the drilling date, it is seen that the
boreholes of Naholoco Communidade and Naholoco EP1-2 are drilled during the first part of
the year (anomalies seen), while Muriaze and Incomati Sae, the remaining boreholes drilled
in 2011 show no anomalies, and at least one of these is drilled later during the year (Incomati
Sae). Looking at the identification number of Muriaze and comparing this with the other
identification numbers, the Muriaze borehole most likely was constructed during 2011. In
conclusion drillings and borehole constructions conducted early in 2011 or before show the
anomalies.
The resistivity logs from the boreholes with detected anomalies show that in all these
boreholes one anomaly is registered just above the upper part of the top screen. One possible
explanation of the anomalies could be that some kind of metal junction part was used when
putting together the casing pipe.
How do the anomalies affect the borehole logging results?
In two of five cases where anomalies are seen, no resistivity values were registered between
the anomalies (Murothone and Matibane). When no resistivity values are detected no
geological interpretation can be made.
In the three other cases (Cuhari B, Naholoco Communidade and Naholoco EP1-2) it is not
obvious how the anomalies affect the log by just visual observation. Since the anomalies are
seen as dips in resistivity they should have a decreasing impact on the mean resistivity value
of the layer which they are in. However, in this study the anomalies were neglected when
calculating the mean resistivity values.
5.2.2 Geological interpretation and given borehole data There are several difficulties to be encountered when doing a geological interpretation. First
of all it is important to look at the available geological data and records from previous
investigations. In this study, no first hand drilling information was used for the sites, instead a
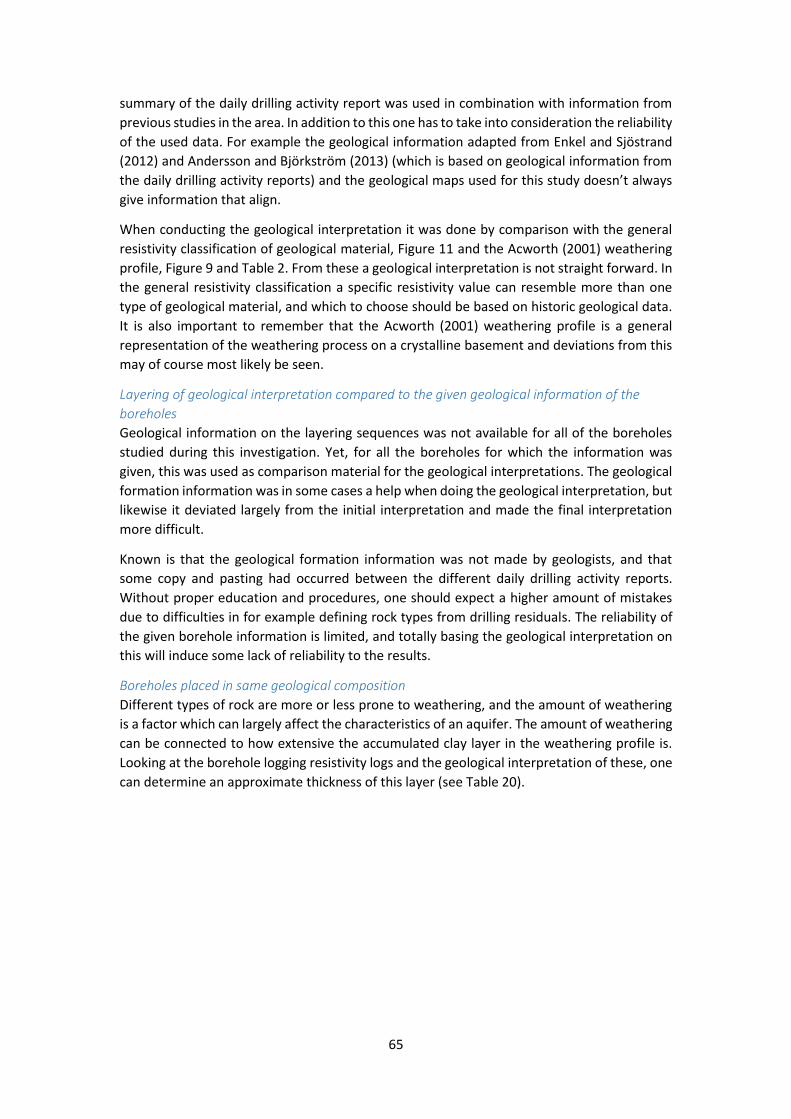
65
summary of the daily drilling activity report was used in combination with information from
previous studies in the area. In addition to this one has to take into consideration the reliability
of the used data. For example the geological information adapted from Enkel and Sjöstrand
(2012) and Andersson and Björkström (2013) (which is based on geological information from
the daily drilling activity reports) and the geological maps used for this study doesn’t always
give information that align.
When conducting the geological interpretation it was done by comparison with the general
resistivity classification of geological material, Figure 11 and the Acworth (2001) weathering
profile, Figure 9 and Table 2. From these a geological interpretation is not straight forward. In
the general resistivity classification a specific resistivity value can resemble more than one
type of geological material, and which to choose should be based on historic geological data.
It is also important to remember that the Acworth (2001) weathering profile is a general
representation of the weathering process on a crystalline basement and deviations from this
may of course most likely be seen.
Layering of geological interpretation compared to the given geological information of the
boreholes
Geological information on the layering sequences was not available for all of the boreholes
studied during this investigation. Yet, for all the boreholes for which the information was
given, this was used as comparison material for the geological interpretations. The geological
formation information was in some cases a help when doing the geological interpretation, but
likewise it deviated largely from the initial interpretation and made the final interpretation
more difficult.
Known is that the geological formation information was not made by geologists, and that
some copy and pasting had occurred between the different daily drilling activity reports.
Without proper education and procedures, one should expect a higher amount of mistakes
due to difficulties in for example defining rock types from drilling residuals. The reliability of
the given borehole information is limited, and totally basing the geological interpretation on
this will induce some lack of reliability to the results.
Boreholes placed in same geological composition
Different types of rock are more or less prone to weathering, and the amount of weathering
is a factor which can largely affect the characteristics of an aquifer. The amount of weathering
can be connected to how extensive the accumulated clay layer in the weathering profile is.
Looking at the borehole logging resistivity logs and the geological interpretation of these, one
can determine an approximate thickness of this layer (see Table 20).
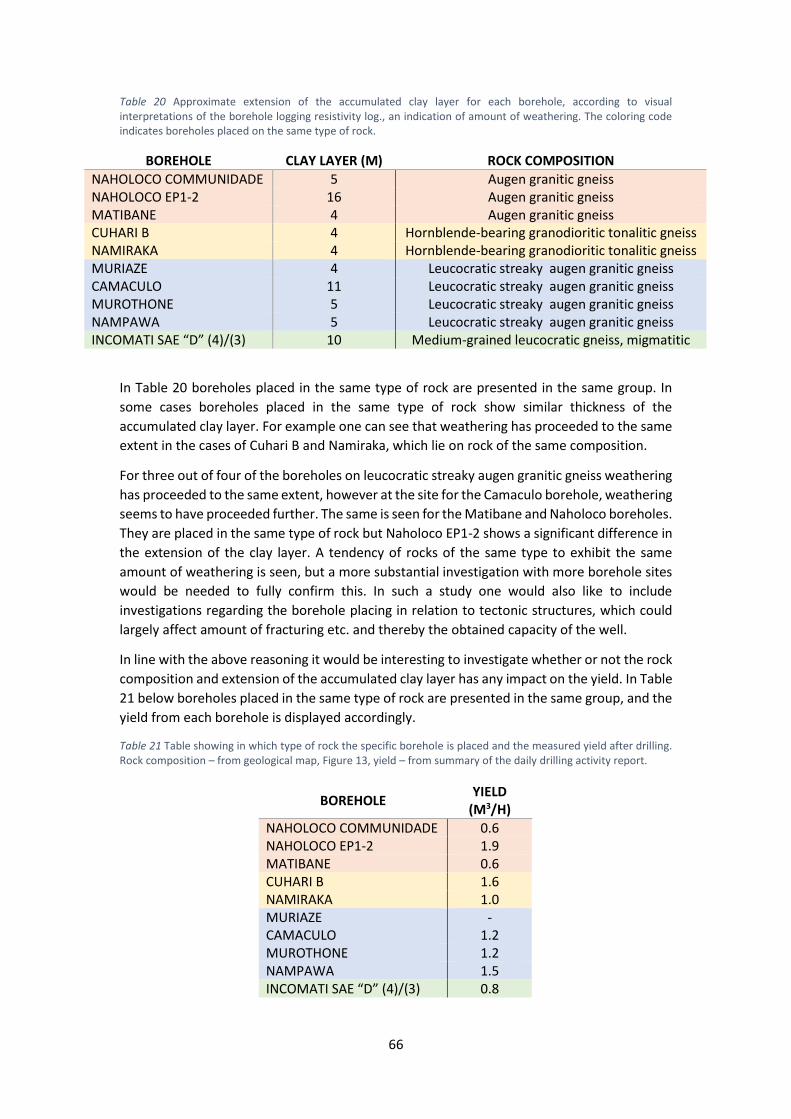
66
Table 20 Approximate extension of the accumulated clay layer for each borehole, according to visual interpretations of the borehole logging resistivity log., an indication of amount of weathering. The coloring code indicates boreholes placed on the same type of rock.
In Table 20 boreholes placed in the same type of rock are presented in the same group. In
some cases boreholes placed in the same type of rock show similar thickness of the
accumulated clay layer. For example one can see that weathering has proceeded to the same
extent in the cases of Cuhari B and Namiraka, which lie on rock of the same composition.
For three out of four of the boreholes on leucocratic streaky augen granitic gneiss weathering
has proceeded to the same extent, however at the site for the Camaculo borehole, weathering
seems to have proceeded further. The same is seen for the Matibane and Naholoco boreholes.
They are placed in the same type of rock but Naholoco EP1-2 shows a significant difference in
the extension of the clay layer. A tendency of rocks of the same type to exhibit the same
amount of weathering is seen, but a more substantial investigation with more borehole sites
would be needed to fully confirm this. In such a study one would also like to include
investigations regarding the borehole placing in relation to tectonic structures, which could
largely affect amount of fracturing etc. and thereby the obtained capacity of the well.
In line with the above reasoning it would be interesting to investigate whether or not the rock
composition and extension of the accumulated clay layer has any impact on the yield. In Table
21 below boreholes placed in the same type of rock are presented in the same group, and the
yield from each borehole is displayed accordingly.
Table 21 Table showing in which type of rock the specific borehole is placed and the measured yield after drilling. Rock composition – from geological map, Figure 13, yield – from summary of the daily drilling activity report.
BOREHOLE CLAY LAYER (M) ROCK COMPOSITION
NAHOLOCO COMMUNIDADE 5 Augen granitic gneiss NAHOLOCO EP1-2 16 Augen granitic gneiss MATIBANE 4 Augen granitic gneiss CUHARI B 4 Hornblende-bearing granodioritic tonalitic gneiss NAMIRAKA 4 Hornblende-bearing granodioritic tonalitic gneiss MURIAZE 4 Leucocratic streaky augen granitic gneiss CAMACULO 11 Leucocratic streaky augen granitic gneiss MUROTHONE 5 Leucocratic streaky augen granitic gneiss NAMPAWA 5 Leucocratic streaky augen granitic gneiss INCOMATI SAE “D” (4)/(3) 10 Medium-grained leucocratic gneiss, migmatitic
BOREHOLE YIELD
(M3/H)
NAHOLOCO COMMUNIDADE 0.6 NAHOLOCO EP1-2 1.9 MATIBANE 0.6 CUHARI B 1.6 NAMIRAKA 1.0 MURIAZE - CAMACULO 1.2 MUROTHONE 1.2 NAMPAWA 1.5 INCOMATI SAE “D” (4)/(3) 0.8

67
There is a slight connection between the obtained yield and the rock composition seen from
Table 21. Most connection is seen between the boreholes Camaculo, Murothone and
Nampawa, otherwise both high and low yields are found connected to the different types of
rock composition (in the cases where comparison is possible). Interesting is that all of these
boreholes have been denoted positive even though at least six of ten have a yield that is lower
than the yield of 1.25m3/h used as design criteria. However, it is possible that in these cases
the estimation that 15l/capita /day is needed has been used. This states that at these sites
less people will be utilizing the well and a lower yield would be sufficient – giving a positive
denotation even if not reaching a yield of 1.25m3/h.
Further on it is not possible to see any distinct correlation between yield and the extent of the
weathered clay layer (comparing Tables 20 and 21). Naholoco EP1-2 shows to have both the
thickest accumulated clay layer, implying extensive weathering, and the highest yield.
However, if looking at all the boreholes no apparent pattern is seen.
Weathering is an important factor affecting the yield, but there are several additional factors
that also affect the yield and therefore from just the reasoning above no direct conclusions
can be drawn. Examples of other factors affecting the yield are the thickness and hydraulic
properties of the aquifer, the interconnection between fractures, and construction properties
such as borehole and screen placement.
If looking at the levels of natural gamma radiation, Incomati Sae “D” (4)/3), Cuhari B and
Namiraka generally show a lower level than the rest of the sites. These are underline by a
gneiss bedrock compared to the other sites which are underline by granitic gneiss. Higher
amount of granite should give a higher natural gamma radiation, and this is clearly seen in this
study.
Well-screen placement and weathering zones
In all ten cases the screens are placed in layers interpreted as the Acworth (2001) layer ‘c’, a
granular friable layer with crystal aggregates and rock fragments and/or layer ‘d’, a layer of
fractured and fissured rock. This is positive since boreholes placed in this type of environment
are likely to be the highest yielding boreholes. However in addition to this it is important that
screens are placed so that they enable extraction of water. In order to extract water from a
fractured layer, the fractures and fissures need to be interconnected with the borehole, this
is done via the screens.
By looking at the resistivity and natural gamma logs from the borehole logging it is not possible
to detect narrow fracture zones in the fissured and fractured bedrock. However there are
other techniques by which this can be done. Focused array logs are constructed so that they
have a very high vertical resolution giving the opportunity to detect very thin layers (Alm,
2012). This could be useful when wanting to detect fractures. Another alternative for finding
optimal placement of the screens is to use a flowmeter log which can determine the flow
variation in the borehole. An increased flow indicates a zone where a large contribution of
water is applied – this is a good placement of screens. Caliper logs are an additional technique
for identifying fracture zones, this by measuring the diameter of the borehole.
Generally large fluctuations are seen in the resistivity log when reaching a bit down the
borehole, and as commonly several stretches with negative resistivity values are detected. A
plausible reason for this is the fact that the used logging probe has an operating span between
0.3 and 300Ωm. When logging in zones with fresh, fissured or fractured rock the resistivity is
expected to reach values ten times higher than the span for the probe. It is reasonable to
68
believe that the large fluctuations and many negative resistivity stretches are seen due to
operation outside the recommended resistivity span. Adding to this, the screens are often
placed in zones where these fluctuations and negative stretches are seen, making it hard to
draw any precise conclusions regarding well-screen placement in comparison with the
resistivity log. In order to avoid this type of error other logging probes could be used, for
example normal and lateral resistivity logs which can operate in higher resistivity ranges (Keys,
1990). However, one drawback with these logs are that they cannot be operated in plastic
casing i.e. such a survey needs to be conducted before installing the casing.
5.3 Borehole logging vs ERT-measurements
5.3.1 Advantages and disadvantages Borehole logging is a quite precise measuring technique where the level of detail is
determined by the logging speed. A slower speed will give higher level of detail. ERT on the
other hand is a technique where resistivity is measured as mean values over different
distances. Both techniques have their own advantages and disadvantages.
With borehole logging specific narrow zones of differing lithology can be detected which the
ERT-technique misses. A clear example of this is seen in the Naholoco EP1-2 case where a
distinct peak in resistivity is seen at a depth of 13m, but the ERT shows no sign of this peak.
Another advantage is that borehole logging instruments can include detectors collecting
information on several different geophysical properties.
A great advantage of the ERT compared to the borehole logging is the fact that ERT can be
carried out before the borehole is drilled. The ERT can give a general representation of the
resistivity in the investigated area, and from this a geological interpretation can be made
giving an indication of if the area is suitable for placement of a well. Therefore ERT-
measurements should always be carried out prior to drilling.
5.3.2 Correlation between ERT and borehole logging Generally the ERT and the borehole logging correlate quite well. In this study comparison was
only done by visually comparing the graphical representations of the logs, and to get a more
valid conclusion regarding the correlation between the two techniques a time series analysis
should be carried out.
The best correlation (observe that comparison is only made visually) was found at the
Camaculo and Naholoco EP1-2 boreholes. Increases and decreases in resistivity are seen at
almost the same depths for the borehole logging as for the ERT, and the mean resistivity values
of the borehole logging match the ERT quite well. Although, as mentioned small variations
seen in the borehole log is not registered by the ERT.
The other logs have been divided into smaller groups according to the characteristics of how
the resistivity from the borehole logging is matching the resistivity from the ERT-
measurements.
Group 1: The first group of boreholes is Muriaze, Murothone and Namiraka. Here the ERT
misses the small layer at the top of the logs that has been interpreted as accumulated clay
layers. This probably since this layer in all cases is quite thin – approximately 4-5m. Below the
increased resistivity, seen at a depth of 7.5m in the Muriaze case and 13m in the Namiraka
and Murothone case, the resistivity logs match each other to a higher extent (disregarding the
Murothone log below a depth of 20m, where anomalies make it impossible to do further
comparison).
69
Group 2: The next pair of boreholes is Cuhari B and Nampawa. In both these cases the
decrease in ERT seen in the top layer is shifted down the borehole – approximately 4m in both
cases. This is when assuming that the small increase in resistivity seen at the top of the
borehole log in the Nampawa case is to increase further towards the ground surface, which is
reasonable since this is a pattern seen in all other boreholes. Unfortunately no resistivity
values are detected below a depth of 16m in the Nampawa case, and further comparison with
the ERT cannot be made. For the Cuhari B case, the resistivity of the borehole log and the ERT-
measurement follow each other very closely below a depth of 9m.
Group 3: The three remaining logs are Naholoco Communidade, Matibane and Incomati Sae.
These ERT-logs generally follow the pattern of the borehole logging logs, but they are shifted
down the borehole about 3-4m. The mean resistivity values from the borehole logging logs do
not match the resistivity values from the ERT very well, but the shapes of the logs coincide.
At many of the sites, the resistivity log shows a steep increase in the top layer, towards the
ground surface. This is generally not registered by the ERT. A plausible reason for this behavior
is, as mentioned in the interpretations, that some kind of backfill was used to stabilise the
casing after drilling. The increased resistivity indicates a cemented layer and probably cement
was used as backfill, since this was available on the drilling site for construction of the concrete
fundaments. The increased resistivity could also be due to the concrete fundaments shielding
the surface layer from rain, and since this is a feature just around the borehole, this will not
be registered by the ERT-measurements.
Generally the ERT and the borehole resistivity log follow each other quite well. It is important
to remember that the ERT-profiles in most cases don’t cross straight over the boreholes, and
due to the highly heterogenic geological environment this could have a large impact on the
results. In Appendix 4, the resistivity profiles from earlier investigations of the boreholes have
been presented in order of resistivity homogeneity in the vicinity of the borehole. It is
plausible to believe that a better match between the ERT and borehole logging resistivity
would be found at boreholes where the homogeneity is high. The Nampawa and Camaculo
boreholes show highest resistivity homogeneity, and Camaculo is one of the boreholes with
best ERT-logging correlation, but beyond this no correlation is seen between homogeneity
and ERT-logging match.
When ERT and logging resistivity differ it is often around the Acworth weathering profile zone
‘b’. However below this the logs often match better and this is where one is to find the zones
that could act as potential aquifers. An increase in the ERT resistivity profile is a good
indication of where the clay rich zone transits to a zone with larger grain fractions. If the
screens are placed a bit below the level of clay accumulation one will hit a more or less yielding
aquifer, based on reasoning regarding the Acworth weathering profile. Although from the ERT
it is not possible to precisely detect the transit between Acworth layers ‘c’ and ‘d’, and to find
a more precise position of this boundary it is recommended to use borehole logging. If this
can be done it is possible that one could find a borehole position that according to Acworth
gives one of the most productive boreholes (see Chapter 2.6.3 “Weathering”) – a borehole
penetrating the zone of altered rock with intermediate permeability and connects to fractures
in the underlying bedrock. Raising the chance of constructing an even more productive
borehole is if the borehole logging could reveal exact position of large fractures so that well-
screens could be placed in connection to these.
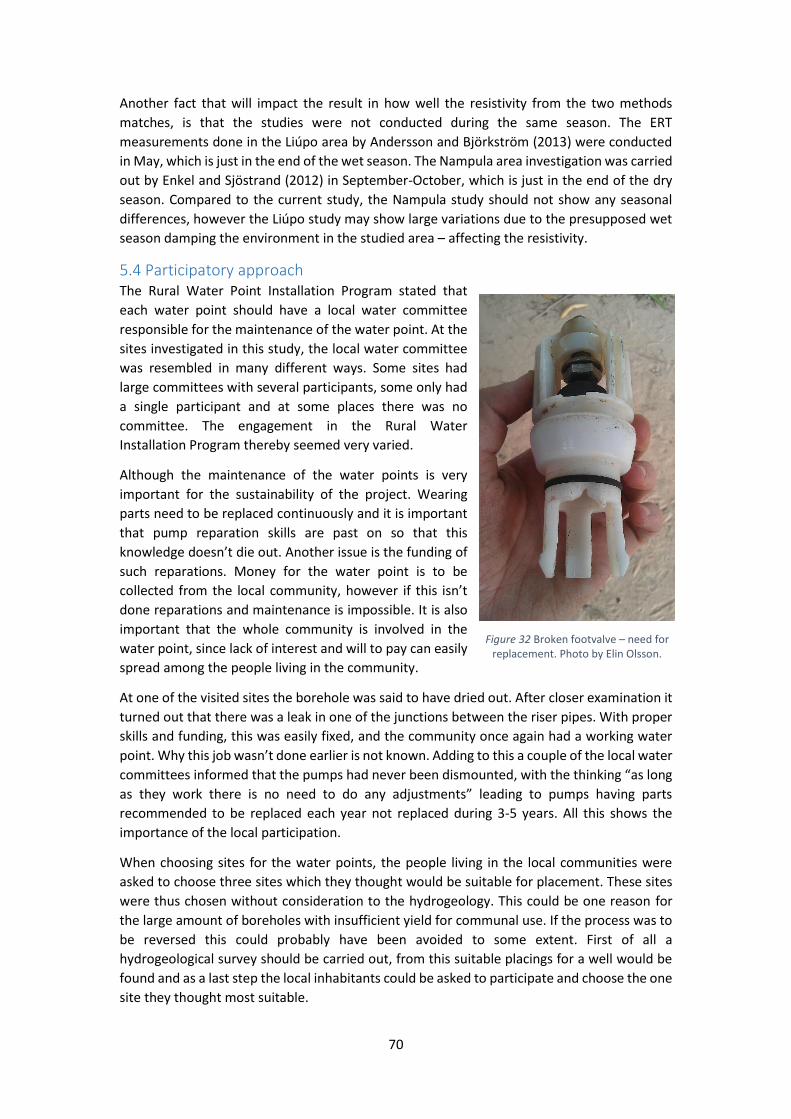
70
Another fact that will impact the result in how well the resistivity from the two methods
matches, is that the studies were not conducted during the same season. The ERT
measurements done in the Liúpo area by Andersson and Björkström (2013) were conducted
in May, which is just in the end of the wet season. The Nampula area investigation was carried
out by Enkel and Sjöstrand (2012) in September-October, which is just in the end of the dry
season. Compared to the current study, the Nampula study should not show any seasonal
differences, however the Liúpo study may show large variations due to the presupposed wet
season damping the environment in the studied area – affecting the resistivity.
5.4 Participatory approach The Rural Water Point Installation Program stated that
each water point should have a local water committee
responsible for the maintenance of the water point. At the
sites investigated in this study, the local water committee
was resembled in many different ways. Some sites had
large committees with several participants, some only had
a single participant and at some places there was no
committee. The engagement in the Rural Water
Installation Program thereby seemed very varied.
Although the maintenance of the water points is very
important for the sustainability of the project. Wearing
parts need to be replaced continuously and it is important
that pump reparation skills are past on so that this
knowledge doesn’t die out. Another issue is the funding of
such reparations. Money for the water point is to be
collected from the local community, however if this isn’t
done reparations and maintenance is impossible. It is also
important that the whole community is involved in the
water point, since lack of interest and will to pay can easily
spread among the people living in the community.
At one of the visited sites the borehole was said to have dried out. After closer examination it
turned out that there was a leak in one of the junctions between the riser pipes. With proper
skills and funding, this was easily fixed, and the community once again had a working water
point. Why this job wasn’t done earlier is not known. Adding to this a couple of the local water
committees informed that the pumps had never been dismounted, with the thinking “as long
as they work there is no need to do any adjustments” leading to pumps having parts
recommended to be replaced each year not replaced during 3-5 years. All this shows the
importance of the local participation.
When choosing sites for the water points, the people living in the local communities were
asked to choose three sites which they thought would be suitable for placement. These sites
were thus chosen without consideration to the hydrogeology. This could be one reason for
the large amount of boreholes with insufficient yield for communal use. If the process was to
be reversed this could probably have been avoided to some extent. First of all a
hydrogeological survey should be carried out, from this suitable placings for a well would be
found and as a last step the local inhabitants could be asked to participate and choose the one
site they thought most suitable.
Figure 32 Broken footvalve – need for replacement. Photo by Elin Olsson.

71
5.5 Economic approach Drilling wells with insufficient yields, which need to be refilled, is a great loss of resources. It
would be an advantage if these resources could be spent on drilling high yielding boreholes
instead. ERT-investigations are quite time consuming and costly, however this study has
showed that they are useful when doing hydrogeological surveys for well placement in the
Nampula area. Sufficient hydrogeological surveys could probably be financed by the drilling of
less boreholes giving an insufficient yield.
72
6. Conclusions This study includes investigations at ten water point sites from the Rural Water Point
Installation Program under the substantial Mozambique Millennium Challenge Cooperation
program. Any conclusions drawn should only be applied to the visited sites, and to be able to
state any general conclusions an extensive investigation including a larger number of water
points would be needed to be carried out. However, for this study some general conclusions
have been drawn which are summarised in this chapter.
One of the aims of this study was to see what geological interpretations that could be drawn
from the collected geophysical borehole logging data. Generally the interpretations, based on
resistivity and natural gamma radiation, followed the Acworth (1987, 2001) weathering profile
for crystalline rock basements very well. No correlation could be seen between the yield of
the boreholes and the depth of the accumulated clay layer (indicating extent of weathering).
However, this is not surprising since there are many other factors which are important for the
yield, for example aquifer thickness, hydraulic properties of the aquifer, borehole location in
relation to fracture zones and well-screen design/placement.
The second aim was to compare the resistivity measured from the geophysical borehole
logging with the resistivity from ERT-measurements conducted in previous MFS-projects on
the same boreholes. In this study the resistivity measured from the different methods
generally matched very well, especially from and below the Acworth weathering profile layer
‘c’. However, disturbances in the logs (anomalies believed to come from constructional
factors, and operation outside the resistivity range of the logging probe) induced difficulties
to the interpretation process and uncertainties to the results.
Finally, the geophysical borehole logging confirmed the resistivity findings from previous ERT
measurements in the investigated boreholes. In the present hydrogeological environment ERT
measurements are suited for identification of different resistivity zones/layers where it is
suitable to place boreholes, and it is good to carry out ERT measurements before drilling. In
addition to proper siting of the borehole it is important to place the well screens correctly in
order to get a highly producing well. The dual induction probe used in this study gave a more
detailed representation of subsurface properties than the ERT-technique. However with the
used probe the level of detail was limited and recommended is to determine screen
placement with help of galvanic resistivity (possibly focused array), caliper (well diameter) or
flow meter logs.
73
7. Recommendations and Future Work To draw any general conclusions regarding boreholes and hydrogeological environment in the
Nampula area, a more substantial investigation needs to be conducted. In order to make such
a substantial investigation in an efficient way, problems detected in this study need to be
avoided. These are primarily the problems encountered with resemblance of the pumps after
investigation. This could possibly be done by a clip-on construction for the pulley to the logging
winch and logging inside the riser pipes of the pumps (see chapter 5.1 “Field Surveying”).
There is also a need to gather and give structure to the data available from different partners
regarding the boreholes in the Rural Water Point Installation Program. Coordinates for the
borehole sites, names, identification numbers and physical and chemical properties need to
be adapted to the same structure in order to facilitate further studies and projects in the area.
Today a large amount of the information is only given in Portuguese, and a translation to
English would also be beneficial for future work. In addition to this it is necessary that when
producing new boreholes reliable geological formation information is gathered by
professional geologists.
To draw further knowledge from this geophysical borehole investigation it is a good
suggestion to couple the findings of this study with the findings from the slug tests performed
during the same field survey (found in “Water Well Investigations in Nampula Province – Slug
tests on a crystalline rock basement” (Hallerbäck, 2016)). By this one could possibly connect
hydrogeological features to the hydraulic properties of the investigated aquifers.
Suggestions for future studies
There are several examples of suggestions of future studies that can be conducted in order to
gain more knowledge regarding the hydrogeology of Nampula and the Rural Water Point
Installation Program. Three of them are presented below.
To gain further knowledge regarding the hydrogeology in the Nampula area
investigations focused on the tectonics of the area could be carried out, e.g. to look
at how the hydrogeology and its effects on the efficiency of boreholes is affected by
nearby fault zones. Tectonic uplifts and changes in geology can largely affect the
amount of fracturing and thereby the weathering profile. In combination with this it
would be suitable to make a conceptual model for each investigated site following the
structure seen in Figure 10, where both specific weathering profile and tectonic
structures could be included for each site.
For further knowledge regarding boreholes with low yields, one could carry out
another geophysical borehole logging investigation using caliper logs (measuring well
diameter and natural gamma radiation). In this way one could compare the placement
of screens with layers detected by the gamma log and see how they correlate.
A suggestion which is less focused on physical properties and more related to the
actual performance of the Rural Water Point Installation Program is to investigate the
participatory part of the project. By interviewing locals using the boreholes,
information regarding maintenance can be obtained. This in combination with looking
at the wearing of the pumps could give an indication of how well implemented the
project has been and if the project has shown to be sustainable.
74
8. References Acworth, I., 2001. The electrical image method compared with resistivity sounding and
electromagnetic profiling for investigation in areas of complex geology: A case study from
groundwater investigation in a weathered crystalline rock environment. Exploration
Geophysics, Volume 32, pp. 119-128.
Acworth, R. I., 1987. The development of crystalline basement aquifers in a tropical
enviroment. Quarterly Journal of Engineering Geology, Volume 20, pp. 265-272.
Alm, P.-G., 2012. "Logging" Geofysisk Borrhålsmätning. Lund: Teknisk Geologi, LTH, Lund
University.
Andersson, B. & Björkström, T., 2013. Geophysical Investigation in Nampula Province,
Mozambique - Rural Water Point Installation Program - part 2. Lund: Engineering Geology,
LTH, Lund University.
Anon., n.d. In: s.l.:s.n.
BAOBAB Resources, 2014. Developing mineral resources in Mozambique, Regional Geology.
[Online]
Available at: http://www.baobabresources.com/mozambique/regional-geology
[Accessed 07 01 2016].
Baumann, E. & Furey, S., 2013. How Three Handpumps Revolutionised Rural Water Supply - A
breif history of the India MArk II/III, Afridev and the Zimbabwe Bush Pump, St.Gallen: Rural
Water Supply Network.
British Geological Survey, 2002. Groundwater Quality: Mozambique, s.l.: Natural
Environment Research Council.
Central Intelligence Agency, 2015. The World Fact Book - Mozambique. [Online]
Available at: https://www.cia.gov/library/publications/the-world-factbook/geos/mz.html
[Accessed 17 11 2015].
Chirindja, F., 2015. Geology Map of Nampula Province. s.l.:s.n.
Chirindja, F., Dahlin, T. & Juizo, D., 2014. Improving Groundwater exploration in Consolidated
Rock Area in Nampula Province, Mozambique. Lilongwe, The International Symposium on
Integrated Water Resources.
Cowater International Inc. and Salomon Lda. , 2010. Design Report No. 1 for 150 Water
Points - Cabo Delgado and Nampula Rural Water Point Installation Program Mozambique,
s.l.: Cowater International Inc. and Salomon Lda. .
Davis, S., 2014. Improve International, How much water is enough? Determining realistic
water use in develpoing countries.. [Online]
Available at: https://improveinternational.wordpress.com/2014/04/27/how-much-water-is-
enough-determining-realistic-water-use-in-developing-countries/
[Accessed 13 11 2015].
DNG, 1989. Base de dados do Mapa geológica de Mocambique escala 1:1000 000.
s.l.:Internal report, not published.
75
Ellis, D. V. & Singer, J. M., 2008. Well Logging for Earth Scientists. Second Edition ed.
Dordrecht: Springer .
Encyclopaedia Britannica, 2015, a. Encyclopedia Britannica Online - Water. [Online]
Available at: http://global.britannica.com/science/water
[Accessed 12 11 2015].
Encyclopedia Britannica, 2015, b. Encyclopedia Britannica Online - Duricrust. [Online]
Available at: http://www.britannica.com/science/duricrust
[Accessed 05 February 2016].
Enkel , O. & Sjöstrand, E., 2013. Geophysical Ivestigations of a Rural Water Point Installation
Program in Nampula Rapale District, Nampula Province, Mozambique - A Minor Field Study.
Lund: Engineering Geology, LTH, Lund University.
Fetter, J. C. W., 2014. Applied Hydrogeology, Pearson New International Edition. Fourth
Edition ed. Essex: Pearson.
Hallenburg, J. K., 1998. Non-HydrocarbonMethods of Geophysical Formation Evaluation.
s.l.:Lewis Publishers.
Hallerbäck, S., 2016. Water Well Investigations in Nampula Province - Slug tests in weathered
crystalline rock, Lund: Division of Engineering Geology, Department of Measurement
Technology and Industrial Electrical Engineering, Lund University, Bachelor Thesis
LUTVDG/(TVTG-5146)/1-72/(2016).
Hall, R. P., Vance, E. A., Seiss, M. & Russel, K., 2014. Impact Evaluation of the Mozambique
Rural Water Supply Activity Acknowledgements, s.l.: Research Gate, Virginia Tech, Stanford
University.
Houghton, J., 2009. Global Warming, The Complete Briefing. Fourth edition ed. Cambridge:
Cambridge University Press.
Keys, W. S., 1990. Borehole Geophysics Applied to Ground-Water Investigations. In:
Techniques of Water-Resources Investigations of the United States Geological Survey.
s.l.:USGS, p. Chapter E2.
Lidmar-Bergström, K., 2016. Nationalencyklopedin, Vittring. [Online]
Available at: http://www.ne.se/uppslagsverk/encyklopedi/l%C3%A5ng/vittring
[Accessed 02 February 2016].
Millennium Challenge Account Mozambique , 2013. MCA-Mozambique, Monitoring and
Evaluation Plan, s.l.: Millennium Challenge Account Mozambique .
Palacky, G. J., 1987. Resistivity Characteristics of Geologic Targets. In: J. D. Corbett, ed.
Electromagnetic Methods in Applied Geophysics: Theory . Tulsa: Society of Exploration
Geophysicists, p. 55.
Parasnis, D., 1986. Principles of Applied Geophysics. 4 ed. s.l.:Chapman & Hall .
Ramos, C. et al., 2002. Water Demand Management Programme for Southern Africa, Phase
II, Country Study Mozambique, Hatfield: IUCN.
76
Robertson Geologging Limited , 2015a. Dual Induction. [Online]
Available at: http://www.geologging.com/slimhole-logging/dual-induction/
[Accessed 30 11 2015].
Robertson Geologging Limited , 2015b. Mini Winch. [Online]
Available at: http://www.geologging.com/slimhole-logging/mini-winch/
[Accessed 30 11 2015].
Robertson Geologging Limited, 2015d. Winlogger Software. [Online]
Available at: http://www.geologging.com/slimhole-logging/winlogger-software/
[Accessed 30 11 2015].
Robertssn Geologging Limited , 2015c. Micrologger. [Online]
Available at: http://www.geologging.com/slimhole-logging/micrologger/
[Accessed 30 11 2015].
Roscoe Moss Company, 1990. Handbook of Ground Water Developement. Los Angeles: John
Wiley and Sons, A Wiley-Intersceince Publication.
Scanlon, J., Cassar, A. & Nemes , N., 2004. Water as a Human Right?, Gland, Switzerland and
Cambridge UK: IUCN.
Sharma, P., 1986. Geophysical Methods in Geology. Second ed. New York: Elsevier Science
Publishing Co..
Sharma, P. V., 1997. Environmental and engineering geophysics. Cambridge: Cambridge
University Press.
Sida, 2013. Realising the Human Right to Water and Sanitation, s.l.: Sida.
Svensson, C., 2011. Kompendium i Teknisk Geologi AK. Lund: Teknisk Geologi, LTH, Lund
University.
Twidale, C. R. & Vidal Romani, J. R., 2005. Landforms and geology of granite terrains. Leiden:
Balkema.
UNDESA, 2014. United Nations, International Decade for Action 'Water for life' 2005-2015.
[Online]
Available at: http://www.un.org/waterforlifedecade/scarcity.shtml
[Accessed 12 11 2015].
United Nations - Office of the high commissioner, 2010. The Right To Water - fact sheet no.
35. [Online]
[Accessed 01 February 2016].
United Nations Human Rights - Office of the high commissioner, 2015. Special Rapporteur on
the human right to safe drinking water and sanitation. [Online]
Available at:
http://www.ohchr.org/EN/Issues/WaterAndSanitation/SRWater/Pages/SRWaterIndex.aspx
[Accessed 01 February 2016].
United Nations, Department of Technical Co-operation for Development, 1989. Ground
Water in Eastern, Central and Southern Africa - Natural Resources/Water Series No.19, New
York: United Nations.

77
Utrikespolitiska Institutet, 2015. Landguiden, Mocambique. [Online]
Available at: http://www.landguiden.se/Lander/Afrika/Moambique
[Accessed 13 11 2015].
Water Aid, United Kingdom, 2015. Water Aid, Where we work, Mozambique. [Online]
Available at: http://www.wateraid.org/uk/where-we-work/page/mozambique
[Accessed 09 12 2015].
World Water Assessment Programme, 2012. World Water Developement Report 4, s.l.:
UNESCO, WWAP, UN-Water.

78
Appendix 1 – Winlogger System Settings
Portable winch 100 m Std 4-core
Threshold: 35
BaudRate: 125000
Pulswidth: 25
Drive: 20
Gain: 0
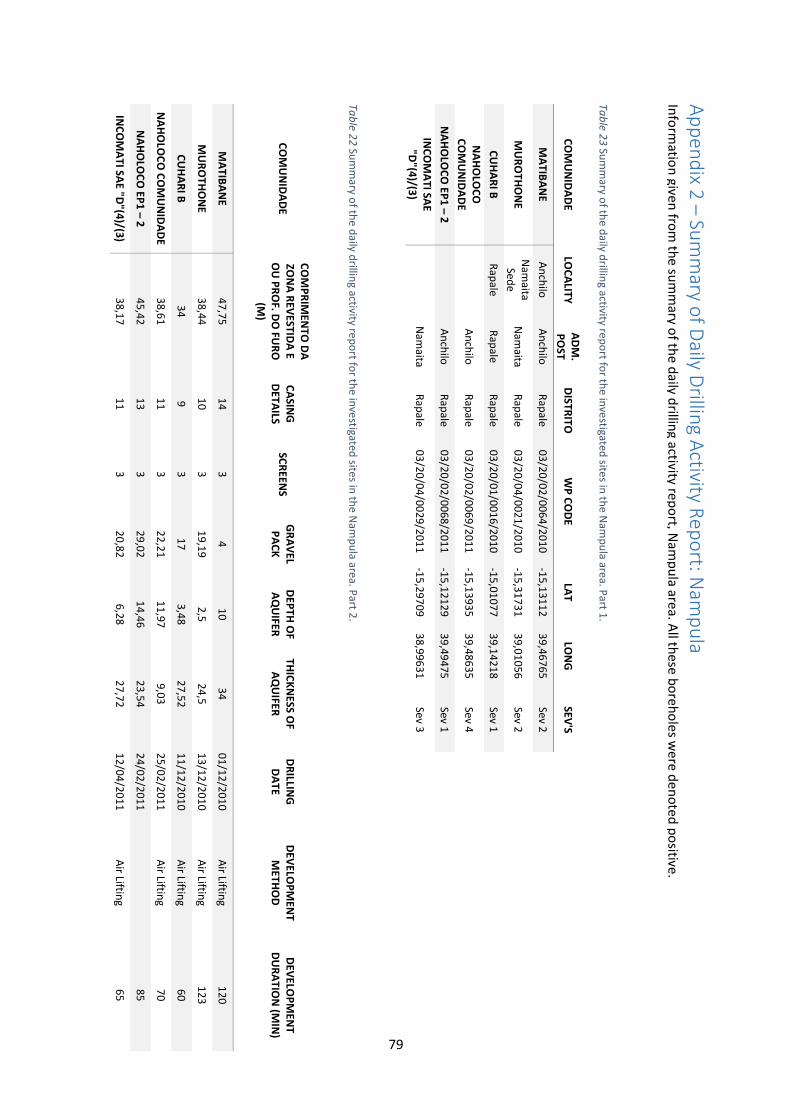
79
Ap
pen
dix 2
– Sum
mary o
f Daily D
rilling A
ctivity Rep
ort: N
amp
ula
Info
rmatio
n given
from
the su
mm
ary of th
e daily d
rilling activity rep
ort, N
amp
ula area. A
ll these
bo
reho
les we
re den
ote
d p
ositive.
Tab
le 23
Sum
mary o
f the d
aily drillin
g activity rep
ort fo
r the in
vestigated
sites in
the N
amp
ula area. P
art 1.
CO
MU
NID
AD
E LO
CA
LITY
AD
M.
PO
ST D
ISTRITO
W
P C
OD
E LA
T LO
NG
SEV
'S
MA
TIBA
NE
A
nch
ilo
An
chilo
R
apale
0
3/2
0/0
2/0
06
4/2
01
0
-15
,13
11
2
39
,46
76
5
Sev 2
MU
RO
THO
NE
Nam
aita Sed
e
Nam
aita R
apale
0
3/2
0/0
4/0
02
1/2
01
0
-15
,31
73
1
39
,01
05
6
Sev 2
CU
HA
RI B
R
apale
R
apale
R
apale
0
3/2
0/0
1/0
01
6/2
01
0
-15
,01
07
7
39
,14
21
8
Sev 1
NA
HO
LOC
O
CO
MU
NID
AD
E
An
chilo
R
apale
0
3/2
0/0
2/0
06
9/2
01
1
-15
,13
93
5
39
,48
63
5
Sev 4
NA
HO
LOC
O EP
1 – 2
An
chilo
R
apale
0
3/2
0/0
2/0
06
8/2
01
1
-15
,12
12
9
39
,49
47
5
Sev 1
INC
OM
ATI SA
E "D
"(4)/(3
)
Nam
aita R
apale
0
3/2
0/0
4/0
02
9/2
01
1
-15
,29
70
9
38
,99
63
1
Sev 3
Tab
le 22
Sum
mary o
f the d
aily drillin
g activity rep
ort fo
r the in
vestigated
sites in
the N
amp
ula area. P
art 2.
CO
MU
NID
AD
E
CO
MP
RIM
ENTO
DA
ZO
NA
REV
ESTIDA
E O
U P
RO
F. DO
FUR
O
(M)
CA
SING
D
ETAILS
SCR
EENS
GR
AV
EL P
AC
K
DEP
TH O
F A
QU
IFER
THIC
KN
ESS OF
AQ
UIFER
D
RILLIN
G
DA
TE D
EVELO
PM
ENT
METH
OD
D
EVELO
PM
ENT
DU
RA
TION
(MIN
)
MA
TIBA
NE
4
7,7
5
14
3
4
1
0
34
0
1/1
2/2
01
0
Air Liftin
g 1
20
MU
RO
THO
NE
38
,44
1
0
3
19
,19
2
,5
24
,5
13
/12
/20
10
A
ir Lifting
12
3
CU
HA
RI B
3
4
9
3
17
3
,48
2
7,5
2
11
/12
/20
10
A
ir Lifting
60
NA
HO
LOC
O C
OM
UN
IDA
DE
3
8,6
1
11
3
2
2,2
1
11
,97
9
,03
2
5/0
2/2
01
1
Air Liftin
g 7
0
NA
HO
LOC
O EP
1 – 2
4
5,4
2
13
3
2
9,0
2
14
,46
2
3,5
4
24
/02
/20
11
85
INC
OM
ATI SA
E "D"(4
)/(3)
38
,17
1
1
3
20
,82
6
,28
2
7,7
2
12
/04
/20
11
A
ir Lifting
65
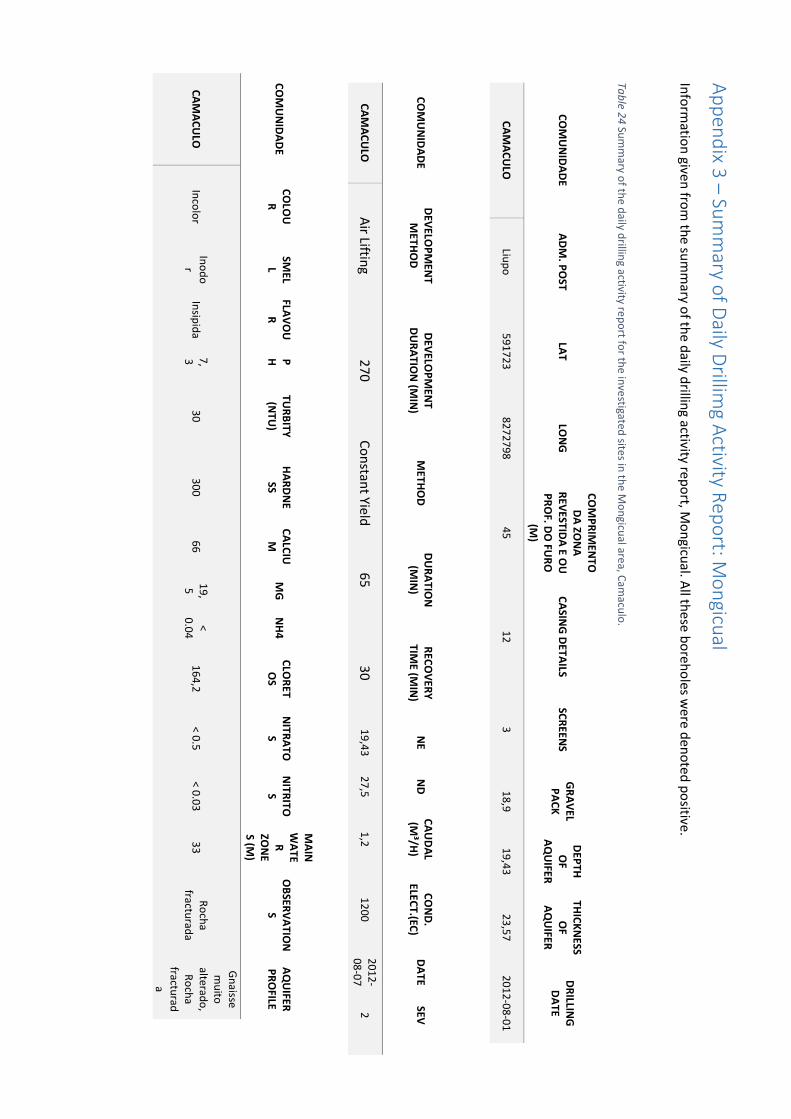
80
Tab
le 24
Sum
mary o
f the d
aily drillin
g activity rep
ort fo
r the in
vestigated
sites in
the M
on
gicual are
a, Cam
aculo
.
CO
MU
NID
AD
E A
DM
. PO
ST
LAT
LON
G
CO
MP
RIM
ENTO
D
A ZO
NA
R
EVESTID
A E O
U
PR
OF. D
O FU
RO
(M
)
CA
SING
DETA
ILS SC
REEN
S G
RA
VEL
PA
CK
DEP
TH
OF
AQ
UIFER
THIC
KN
ESS O
F A
QU
IFER
DR
ILLING
D
ATE
CA
MA
CU
LO
Liup
o
59
17
23
8
27
27
98
4
5
12
3
1
8,9
1
9,4
3
23
,57
2
01
2-0
8-0
1
CO
MU
NID
AD
E D
EVELO
PM
ENT
METH
OD
D
EVELO
PM
ENT
DU
RA
TION
(MIN
) M
ETHO
D
DU
RA
TION
(M
IN)
REC
OV
ERY
TIM
E (MIN
) N
E N
D
CA
UD
AL
(M³/H
) C
ON
D.
ELECT.(EC
) D
ATE
SEV
CA
MA
CU
LO
Air Liftin
g 2
70
C
on
stant Yield
6
5
30
1
9,4
3
27
,5
1,2
1
20
0
20
12
-0
8-0
7
2
CO
MU
NID
AD
E
CO
LOU
R
SM
ELL
FLAV
OU
R
PH
TUR
BITY
(N
TU)
HA
RD
NE
SS C
ALC
IUM
M
G
NH
4
CLO
RET
OS
NITR
ATO
S N
ITRITO
S
MA
IN
WA
TER
ZO
NE
S (M)
OB
SERV
ATIO
NS
AQ
UIFER
P
RO
FILE
CA
MA
CU
LO
In
colo
r
Ino
do
r In
sipid
a 7
,3
30
3
00
6
6
19
,5
<
0.0
4
16
4,2
< 0
.5
< 0.0
3
33
R
och
a fractu
rada
Gn
aisse m
uito
alterad
o,
Ro
cha
fracturad
a
Ap
pen
dix 3
– Sum
mary o
f Daily D
rillimg A
ctivity Rep
ort: M
on
gicual
Info
rmatio
n given
from
the su
mm
ary of th
e daily d
rilling activity rep
ort, M
on
gicual. A
ll these b
oreh
oles w
ere den
ote
d p
ositive.

81
Tab
le 25
Sum
mary o
f the d
aily drillin
g activity rep
ort fo
r the in
vestigated
sites in
the M
on
gicual are
a, Nam
paw
a and
Nam
iraka.
CO
MM
UN
ITY
AD
M.
PO
ST D
ISTRIC
T
LAT
LON
G
SEV'S
BO
REH
OLE
DEP
TH (M
) C
ASIN
G
DETA
ILS SC
REEN
S G
RA
VEL
PA
CK
D
EPTH
OF
AQ
UIFER
TH
ICK
NESS
OF A
QU
IFER
CY
LIND
ER
DEP
TH
DR
ILLING
D
ATE
NA
MP
AU
A 3
Q
uixaxe
M
on
gicual
-1
5,4
21
64
7
34
,24
33
17
sev 2
3
3
10
2
1
0,8
7
,3
22
,7
29
1
3.1
1.1
2
NA
MIR
AK
A
Lúrio
Sed
e
Mo
ngicu
al -
15
,42
16
31
3
4,2
43
03
1
4
3
12
2
1
0,8
1
0,0
7
14
,93
3
8
03
.10
.12
CO
MM
UN
ITY
D
EVELO
PM
ENT
METH
OD
D
EVELO
PM
ENT D
UR
ATIO
N
(MIN
) M
ETHO
D
DU
RA
TION
(M
IN)
REC
OV
ERY
TIME
(MIN
) N
E N
D
CA
UD
AL
(M³/H
) D
ATE
NA
MP
AU
A 3
air lifting
60
co
nstan
t yield
65
4
5
7,3
2
8,3
9
1,5
1
2.1
2.1
2
NA
MIR
AK
A
air liftin
g 6
0
con
stant yield
6
5
22
1
0,0
7
38
,93
1
1
2.1
2.1
2
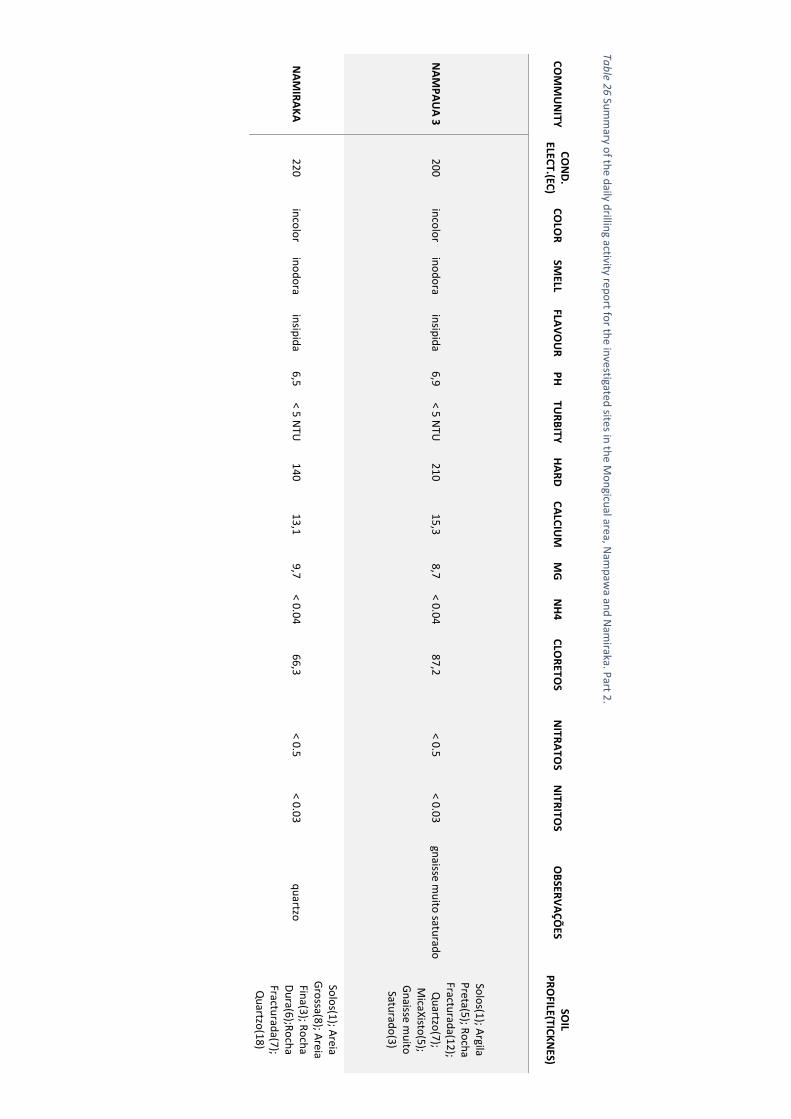
82
Tab
le 26
Sum
mary o
f the d
aily drillin
g activity rep
ort fo
r the in
vestigated
sites in
the M
on
gicual are
a, Nam
paw
a and
Nam
iraka. Part 2
.
CO
MM
UN
ITY
CO
ND
. ELEC
T.(EC)
CO
LOR
SM
ELL FLA
VO
UR
P
H
TUR
BITY
H
AR
D
CA
LCIU
M
MG
N
H4
C
LOR
ETOS
NITR
ATO
S N
ITRITO
S O
BSER
VA
ÇÕ
ES SO
IL P
RO
FILE(TICK
NES)
NA
MP
AU
A 3
2
00
in
colo
r in
od
ora
insip
ida
6,9
< 5
NTU
2
10
1
5,3
8
,7
< 0.0
4
87
,2
< 0.5
< 0
.03
gn
aisse mu
ito satu
rado
Solo
s(1); A
rgila P
reta(5); R
och
a Fractu
rada(1
2);
Qu
artzo(7
); M
icaXisto
(5);
Gn
aisse mu
ito
Saturad
o(3
)
NA
MIR
AK
A
22
0
inco
lor
ino
do
ra in
sipid
a 6
,5
< 5 N
TU
14
0
13
,1
9,7
< 0
.04
6
6,3
< 0.5
< 0
.03
q
uartzo
Solo
s(1); A
reia G
rossa(8
); Areia
Fina(3
); Ro
cha
Du
ra(6);R
och
a Fractu
rada(7
); Q
uartzo
(18
)
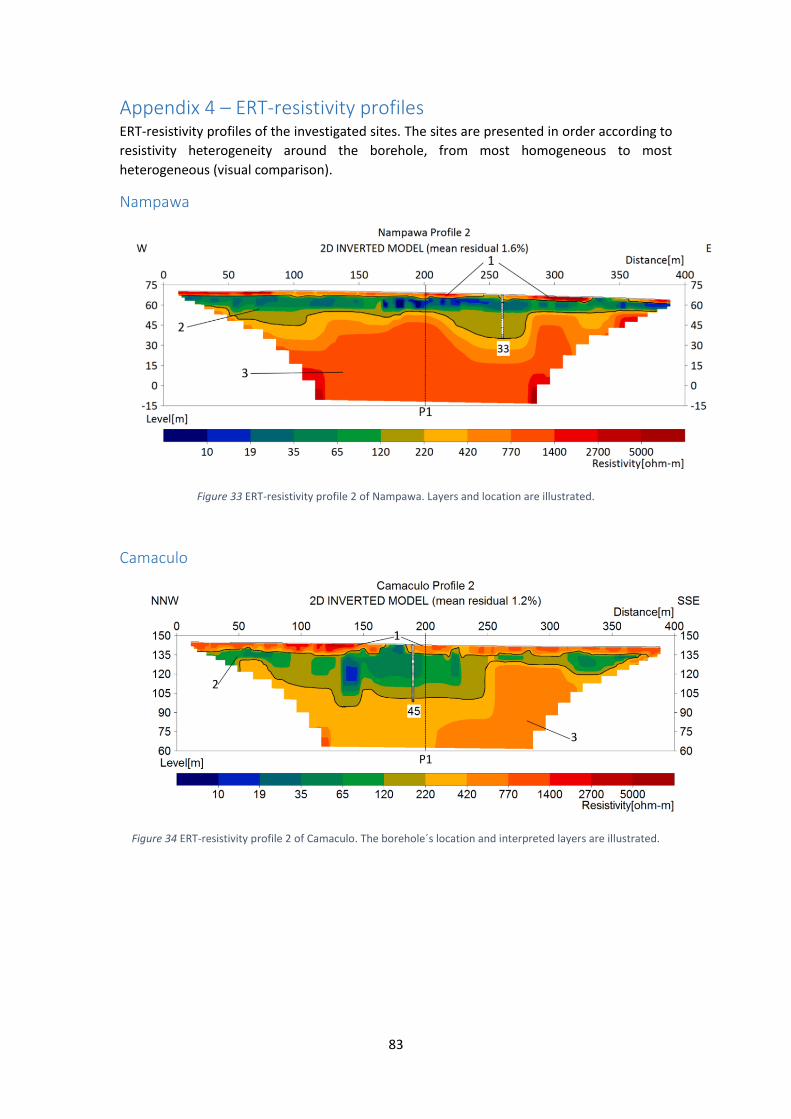
83
Appendix 4 – ERT-resistivity profiles ERT-resistivity profiles of the investigated sites. The sites are presented in order according to
resistivity heterogeneity around the borehole, from most homogeneous to most
heterogeneous (visual comparison).
Nampawa
Figure 33 ERT-resistivity profile 2 of Nampawa. Layers and location are illustrated.
Camaculo
Figure 34 ERT-resistivity profile 2 of Camaculo. The borehole´s location and interpreted layers are illustrated.
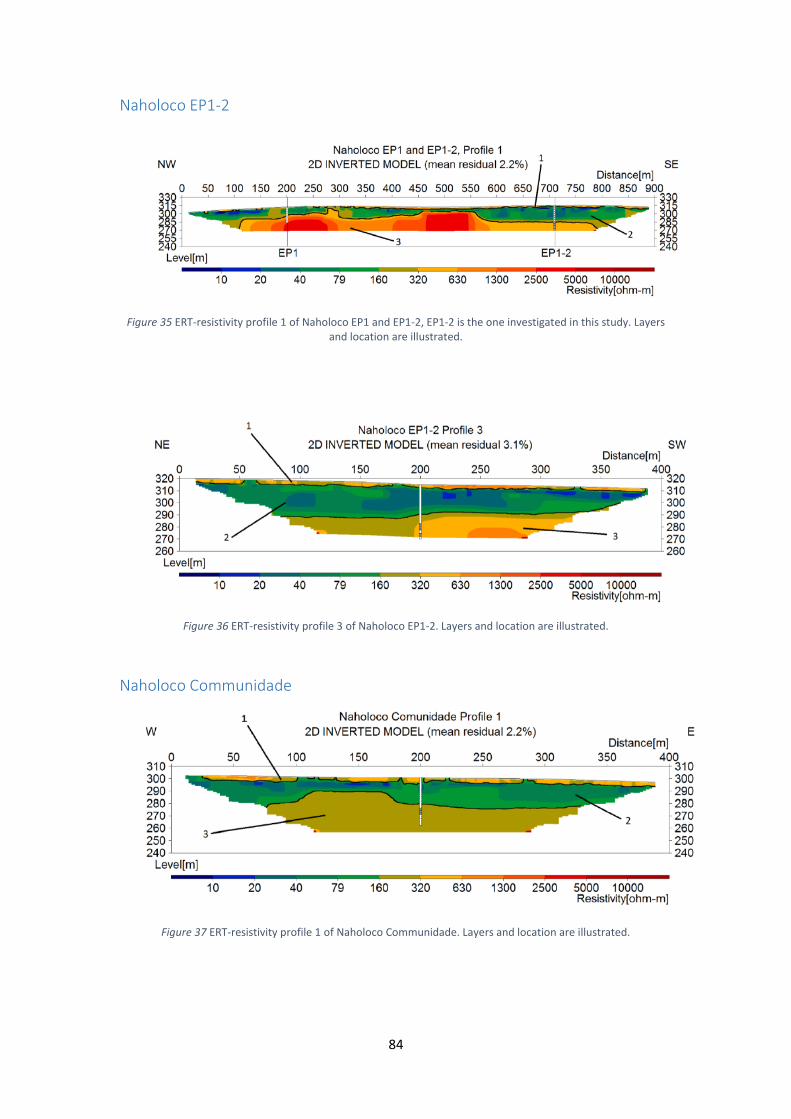
84
Naholoco EP1-2
Figure 35 ERT-resistivity profile 1 of Naholoco EP1 and EP1-2, EP1-2 is the one investigated in this study. Layers and location are illustrated.
Figure 36 ERT-resistivity profile 3 of Naholoco EP1-2. Layers and location are illustrated.
Naholoco Communidade
Figure 37 ERT-resistivity profile 1 of Naholoco Communidade. Layers and location are illustrated.
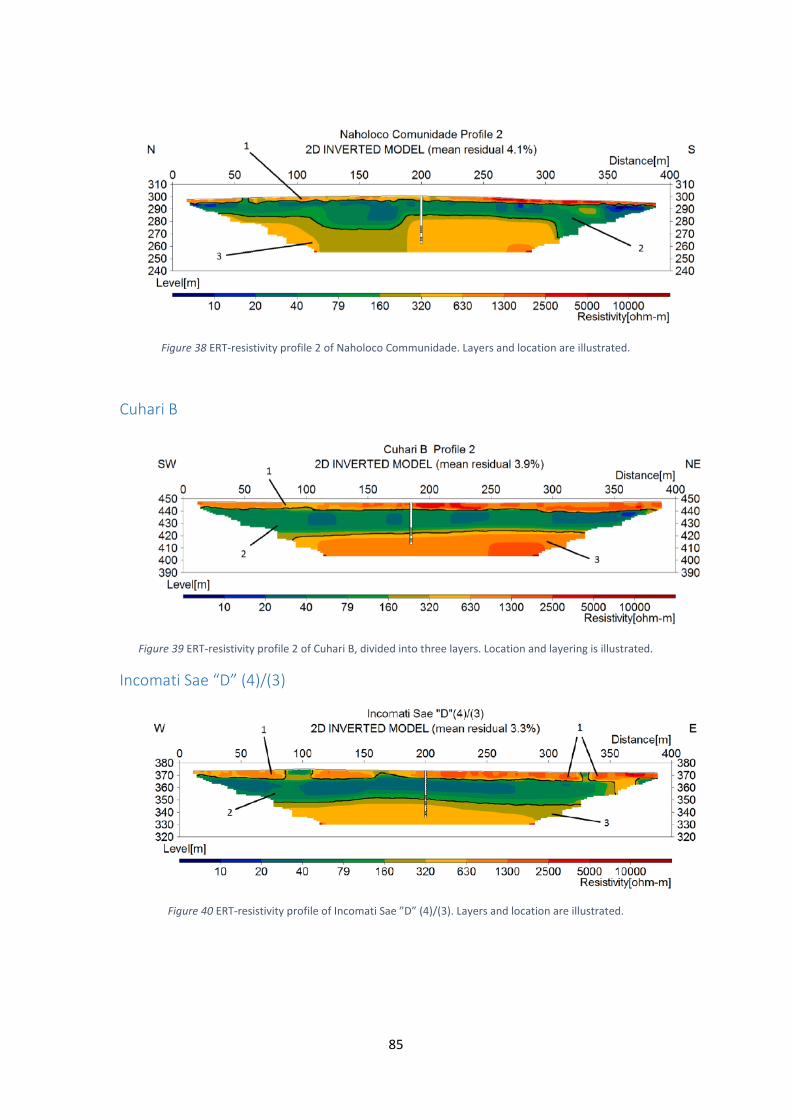
85
Figure 38 ERT-resistivity profile 2 of Naholoco Communidade. Layers and location are illustrated.
Cuhari B
Figure 39 ERT-resistivity profile 2 of Cuhari B, divided into three layers. Location and layering is illustrated.
Incomati Sae “D” (4)/(3)
Figure 40 ERT-resistivity profile of Incomati Sae ”D” (4)/(3). Layers and location are illustrated.
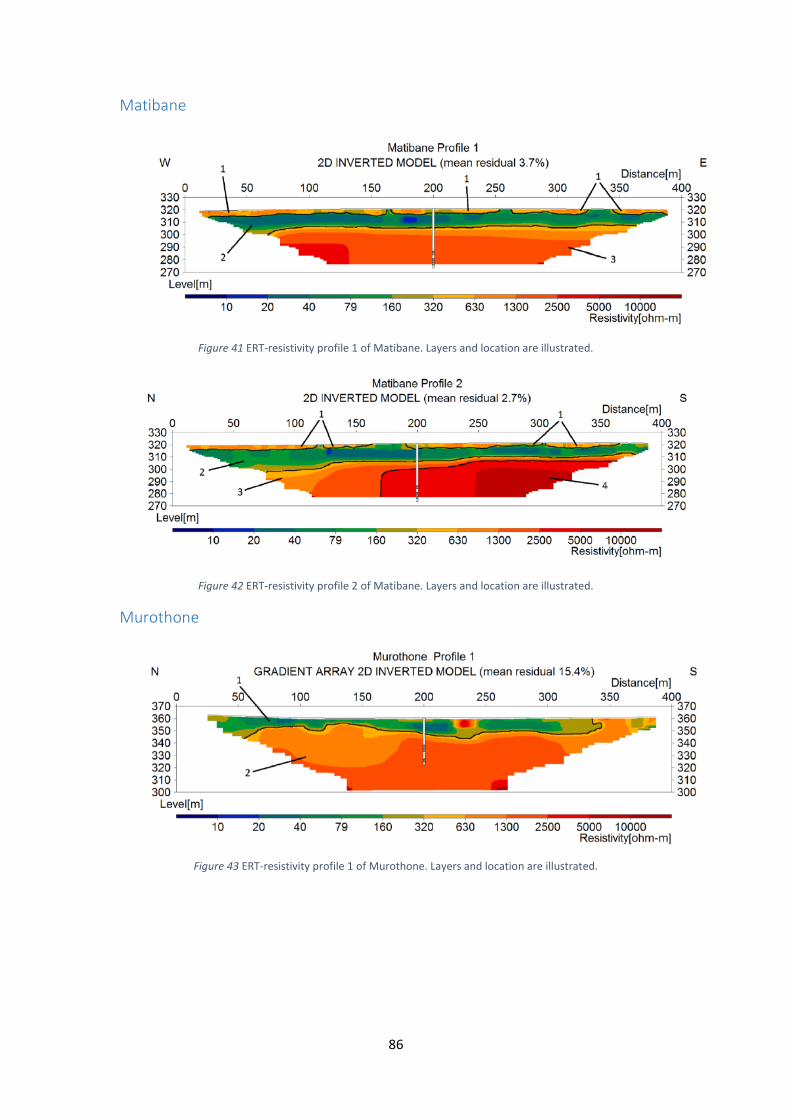
86
Matibane
Figure 41 ERT-resistivity profile 1 of Matibane. Layers and location are illustrated.
Figure 42 ERT-resistivity profile 2 of Matibane. Layers and location are illustrated.
Murothone
Figure 43 ERT-resistivity profile 1 of Murothone. Layers and location are illustrated.
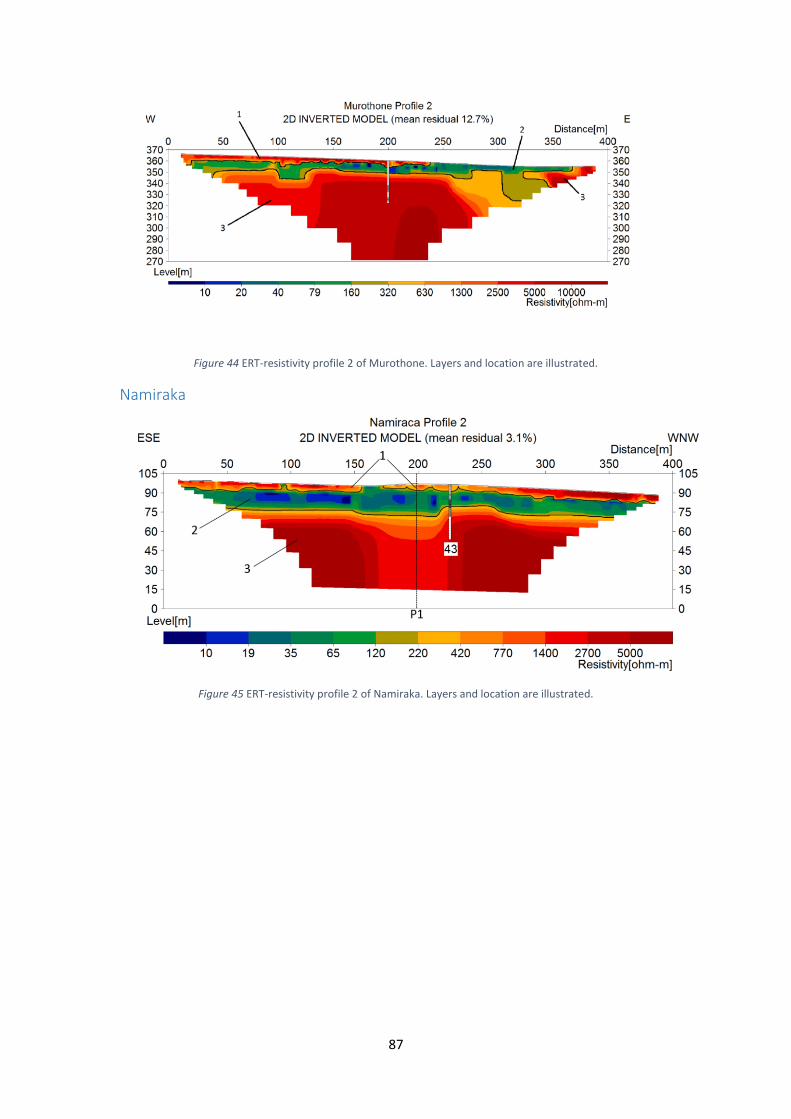
87
Figure 44 ERT-resistivity profile 2 of Murothone. Layers and location are illustrated.
Namiraka
Figure 45 ERT-resistivity profile 2 of Namiraka. Layers and location are illustrated.


![TheSymptomandGeneticDiversityofCassavaBrownStreak ...downloads.hindawi.com/journals/av/2012/795697.pdfCBSV-[MZ:Nam1-1:07] Nampula, Mozambique November 2007 HM346953 CBSV-[TZ:Nal3-1:07]](https://img.pdfslide.us/doc/110x75/5f0e4fb07e708231d43ea076/thesymptomandgeneticdiversityofcassavabrownstreak-cbsv-mznam1-107-nampula.jpg)