Embed Size (px)
Citation preview
October 26, 2018 | 1
A Microgrid configured as a Boiler + a Back Pressure Steam Turbine (Blr. + BPST)
October 26, 2018 | 2
Introduction
Microgrids – what, how and why?
Microgrid plus Combined Heat & Power (CHP) configured as a Boiler + Back Pressure Steam Turbine
Configuration, performance and economics
Project Development
Agenda
October 26, 2018 | 3
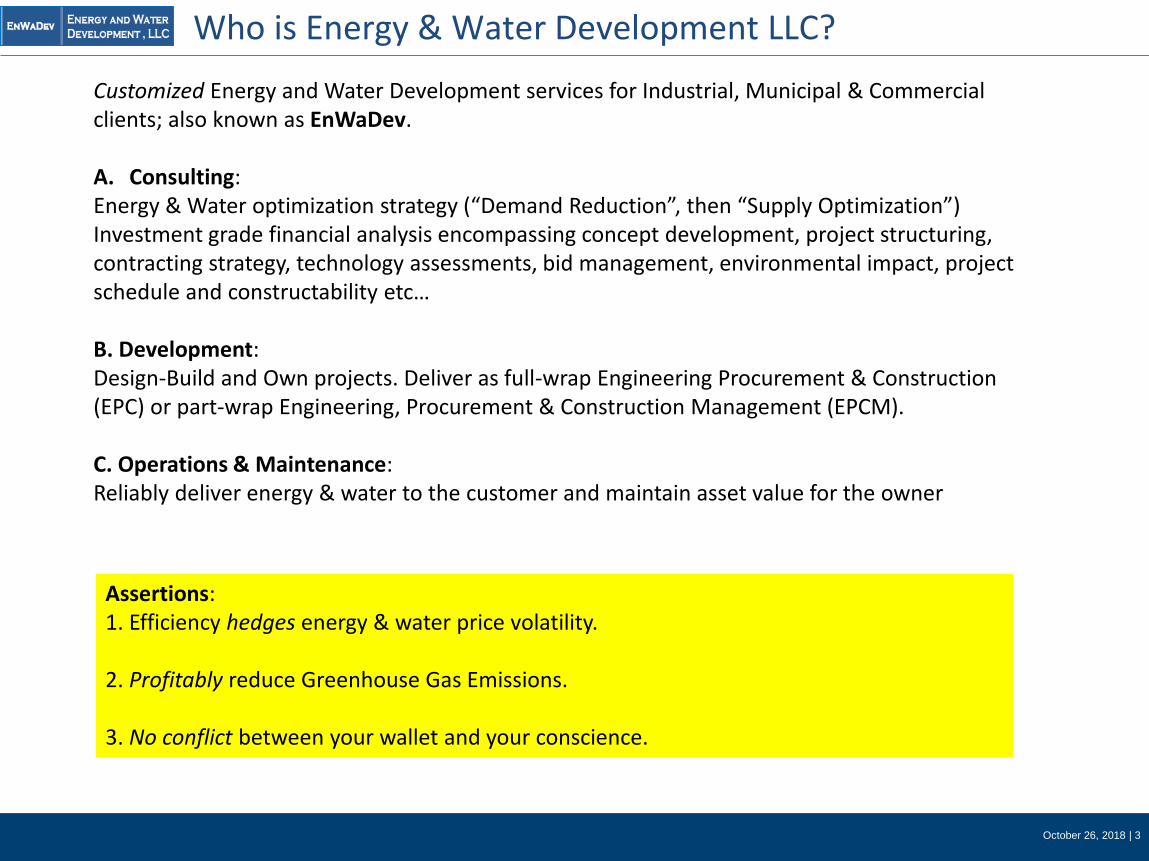
Who is Energy & Water Development LLC?
Customized Energy and Water Development services for Industrial, Municipal & Commercial clients; also known as EnWaDev.
A. Consulting: Energy & Water optimization strategy (“Demand Reduction”, then “Supply Optimization”) Investment grade financial analysis encompassing concept development, project structuring, contracting strategy, technology assessments, bid management, environmental impact, project schedule and constructability etc…
B. Development: Design-Build and Own projects. Deliver as full-wrap Engineering Procurement & Construction (EPC) or part-wrap Engineering, Procurement & Construction Management (EPCM).
C. Operations & Maintenance: Reliably deliver energy & water to the customer and maintain asset value for the owner
Assertions: 1. Efficiency hedges energy & water price volatility.
2. Profitably reduce Greenhouse Gas Emissions.
3. No conflict between your wallet and your conscience.
October 26, 2018 | 4
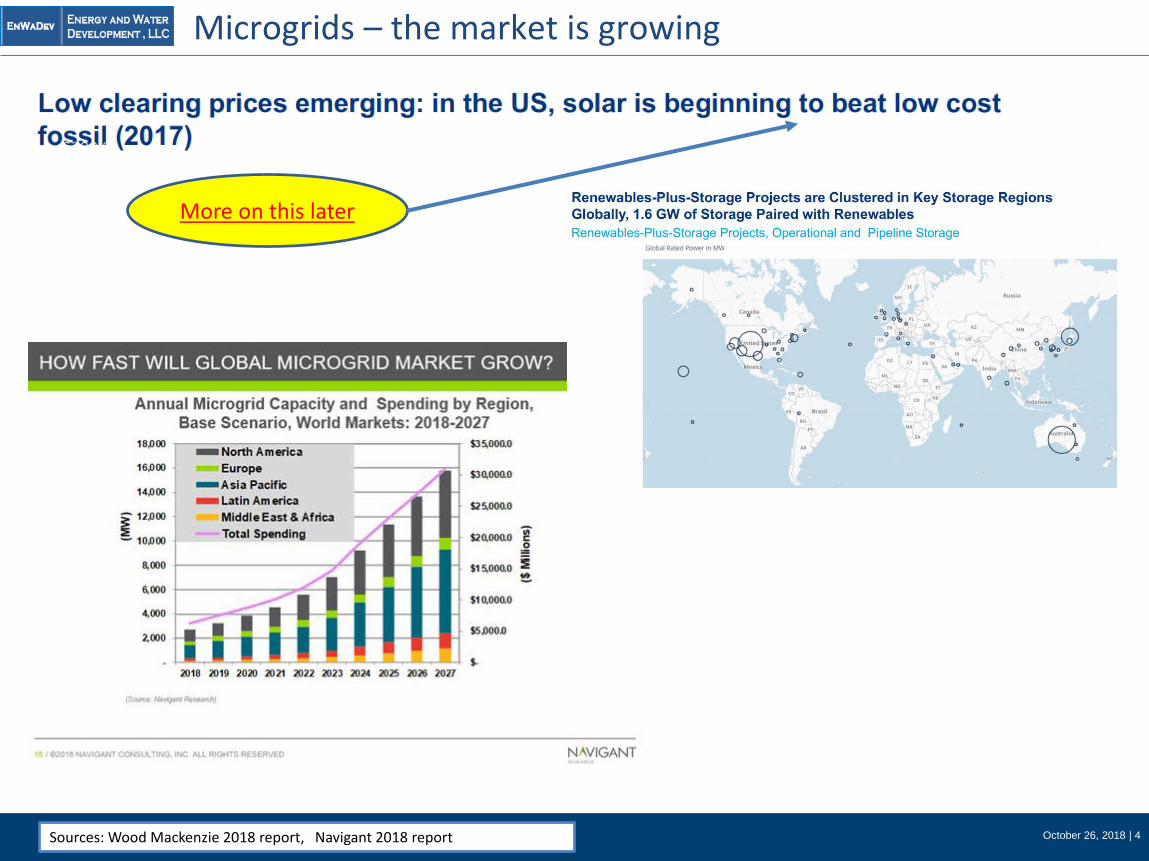
Microgrids – the market is growing
Sources: Wood Mackenzie 2018 report, Navigant 2018 report
October 26, 2018 | 5
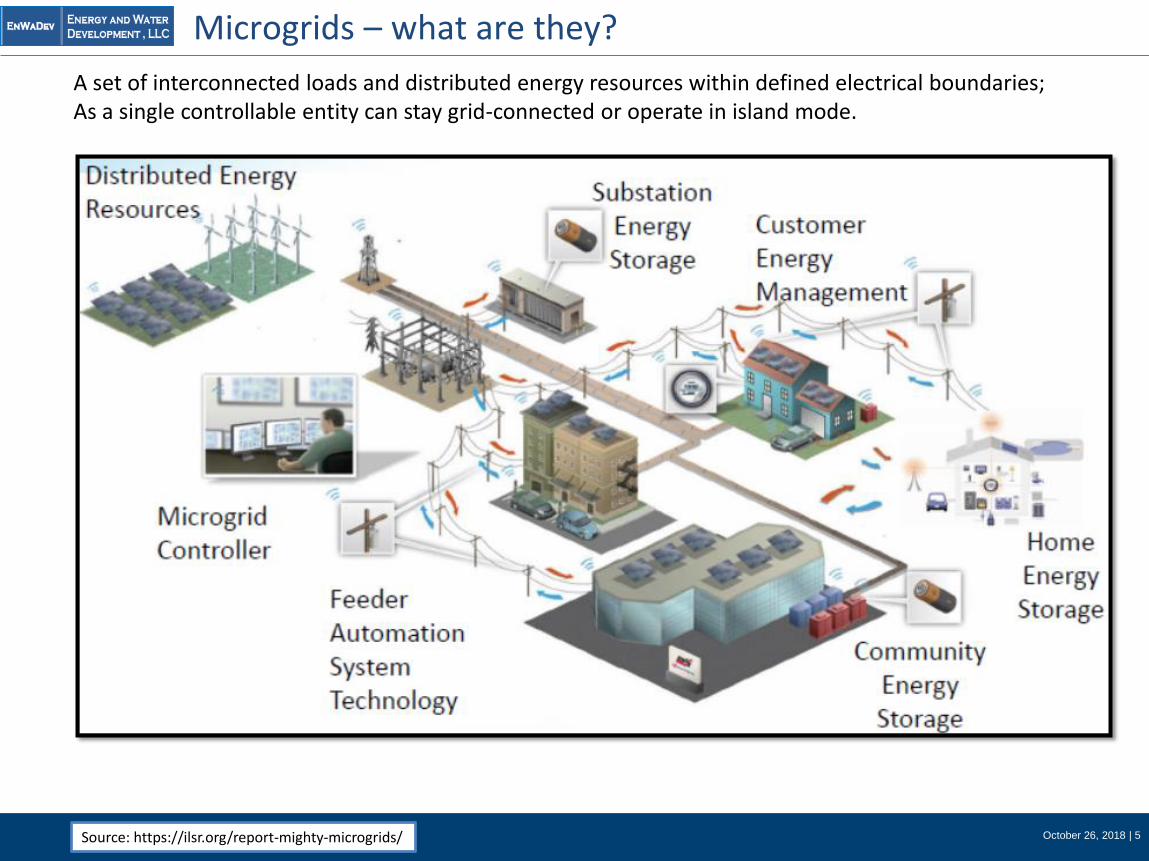
Microgrids – what are they?
Source: https://ilsr.org/report-mighty-microgrids/
A set of interconnected loads and distributed energy resources within defined electrical boundaries; As a single controllable entity can stay grid-connected or operate in island mode.
October 26, 2018 | 6
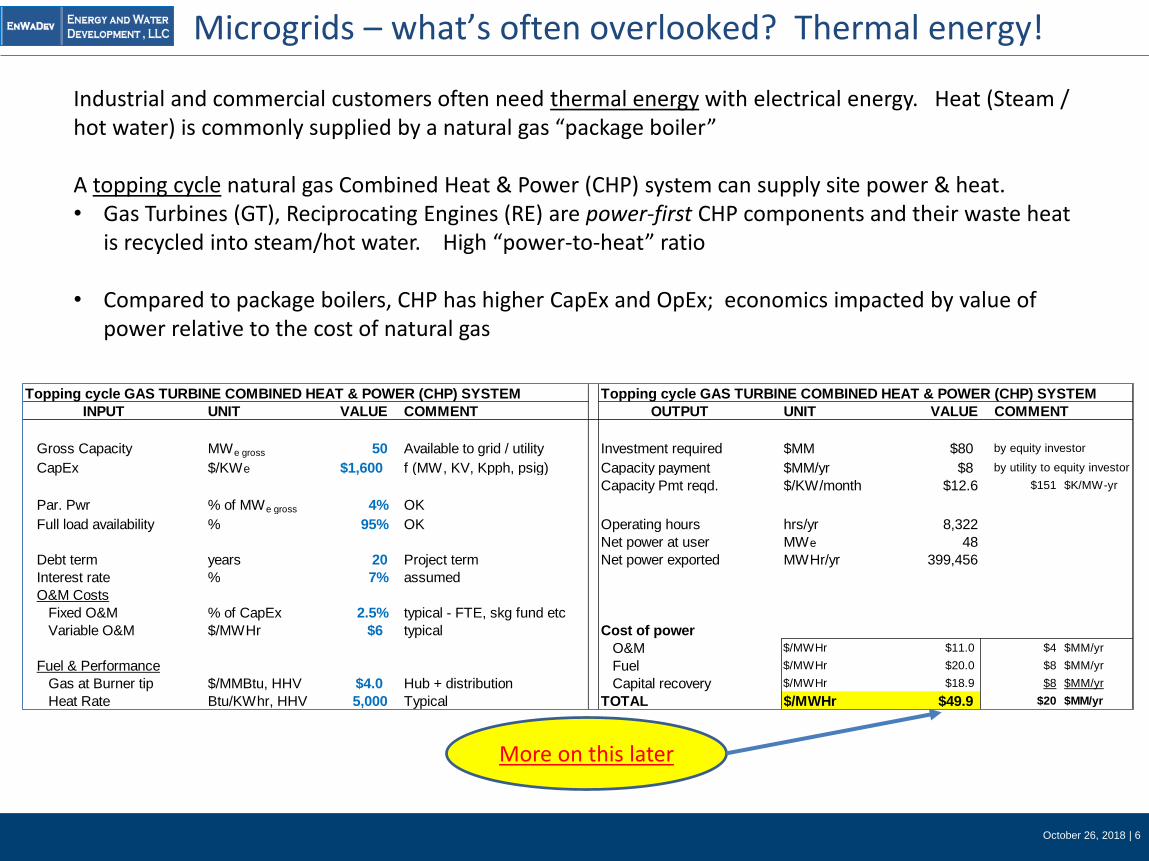
Industrial and commercial customers often need thermal energy with electrical energy. Heat (Steam / hot water) is commonly supplied by a natural gas “package boiler”
A topping cycle natural gas Combined Heat & Power (CHP) system can supply site power & heat.• Gas Turbines (GT), Reciprocating Engines (RE) are power-first CHP components and their waste heat
is recycled into steam/hot water. High “power-to-heat” ratio
• Compared to package boilers, CHP has higher CapEx and OpEx; economics impacted by value of power relative to the cost of natural gas
Microgrids – what’s often overlooked? Thermal energy!
Topping cycle GAS TURBINE COMBINED HEAT & POWER (CHP) SYSTEM Topping cycle GAS TURBINE COMBINED HEAT & POWER (CHP) SYSTEM
INPUT UNIT VALUE COMMENT OUTPUT UNIT VALUE COMMENT
Gross Capacity MWe gross 50 Available to grid / utility Investment required $MM $80 by equity investor
CapEx $/KWe $1,600 f (MW, KV, Kpph, psig) Capacity payment $MM/yr $8 by utility to equity investor
Capacity Pmt reqd. $/KW/month $12.6 $151 $K/MW-yr
Par. Pwr % of MWe gross 4% OK
Full load availability % 95% OK Operating hours hrs/yr 8,322
Net power at user MWe 48
Debt term years 20 Project term Net power exported MWHr/yr 399,456
Interest rate % 7% assumed
O&M Costs
Fixed O&M % of CapEx 2.5% typical - FTE, skg fund etc
Variable O&M $/MWHr $6 typical Cost of power
O&M $/MWHr $11.0 $4 $MM/yr
Fuel & Performance Fuel $/MWHr $20.0 $8 $MM/yr
Gas at Burner tip $/MMBtu, HHV $4.0 Hub + distribution Capital recovery $/MWHr $18.9 $8 $MM/yr
Heat Rate Btu/KWhr, HHV 5,000 Typical TOTAL $/MWHr $49.9 $20 $MM/yr
October 26, 2018 | 7
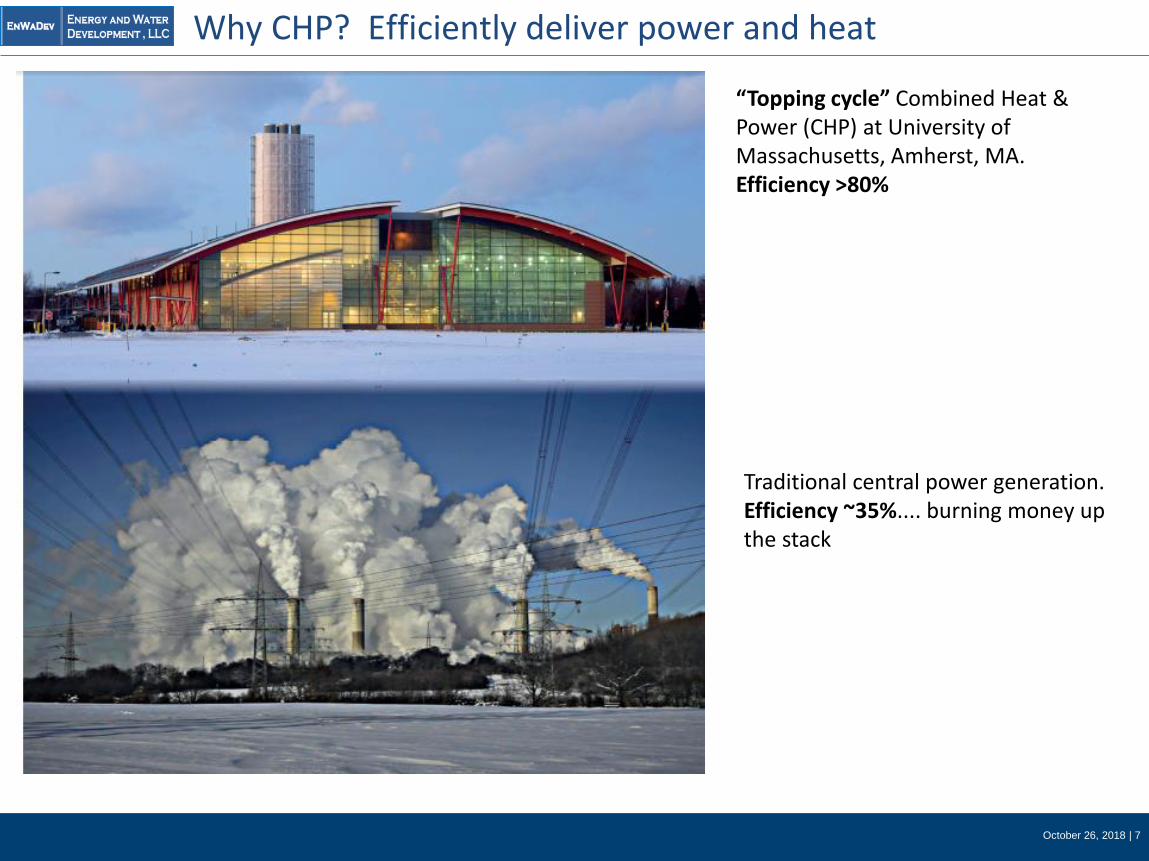
Why CHP? Efficiently deliver power and heat
“Topping cycle” Combined Heat & Power (CHP) at University of Massachusetts, Amherst, MA.Efficiency >80%
Traditional central power generation. Efficiency ~35%.... burning money up the stack
October 26, 2018 | 8
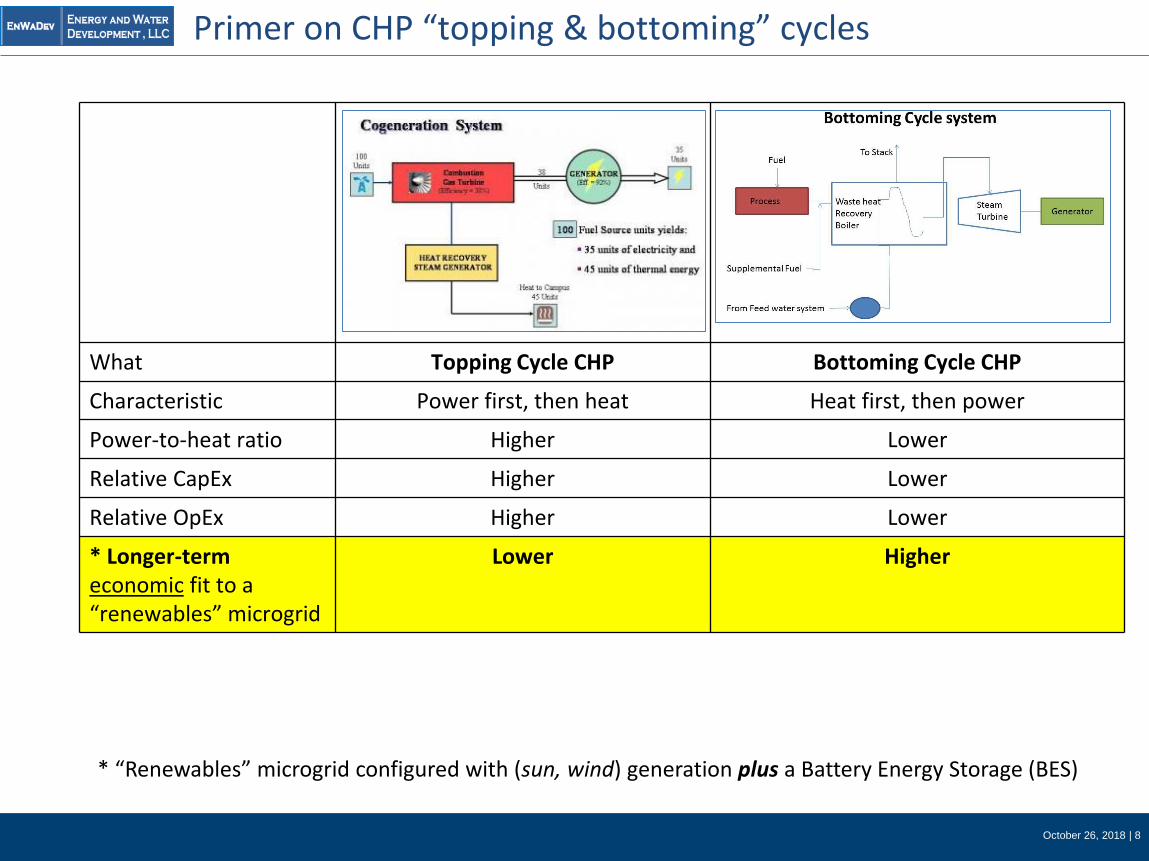
Primer on CHP “topping & bottoming” cycles
What Topping Cycle CHP Bottoming Cycle CHP
Characteristic Power first, then heat Heat first, then power
Power-to-heat ratio Higher Lower
Relative CapEx Higher Lower
Relative OpEx Higher Lower
* Longer-termeconomic fit to a “renewables” microgrid
Lower Higher
* “Renewables” microgrid configured with (sun, wind) generation plus a Battery Energy Storage (BES)
October 26, 2018 | 9
Long-term power price down-trend due to fossil-free renewables (wind, sun) + battery energy storage.
Conventional fossil power (coal, nuclear) are in trouble – uncompetitive even on an operating basis.
Large (500+ MW) Combined Cycle Gas Turbine (CCGT) plants are currently competitive….but for how long?
Topping cycle (“Power first”) CHP is competitive, but……• Good: Efficient (Heat Rate ~5000 btu/kwh).• Bad: Investment gap ($/KW) between fossil-free renewables and fossil-fired CHP is narrowing. • Bad: Operating cost ($/MWh) of topping cycle CHP trending higher than pure renewables.
Bottoming cycle CHP is a natural fit when there is a thermal load (low pressure steam or hot water).
But…. longer-term concern with “topping cycle” CHP?
A Combined Heat & Power (DF-CHP) system can also be configured as a High Pressure Steam Boiler tied to a Back Pressure Steam Turbine (Blr. + BPST)
This low-cost, easily designed & installed CHP configuration improves the economics of a “conventional, renewables only” microgrid
October 26, 2018 | 10
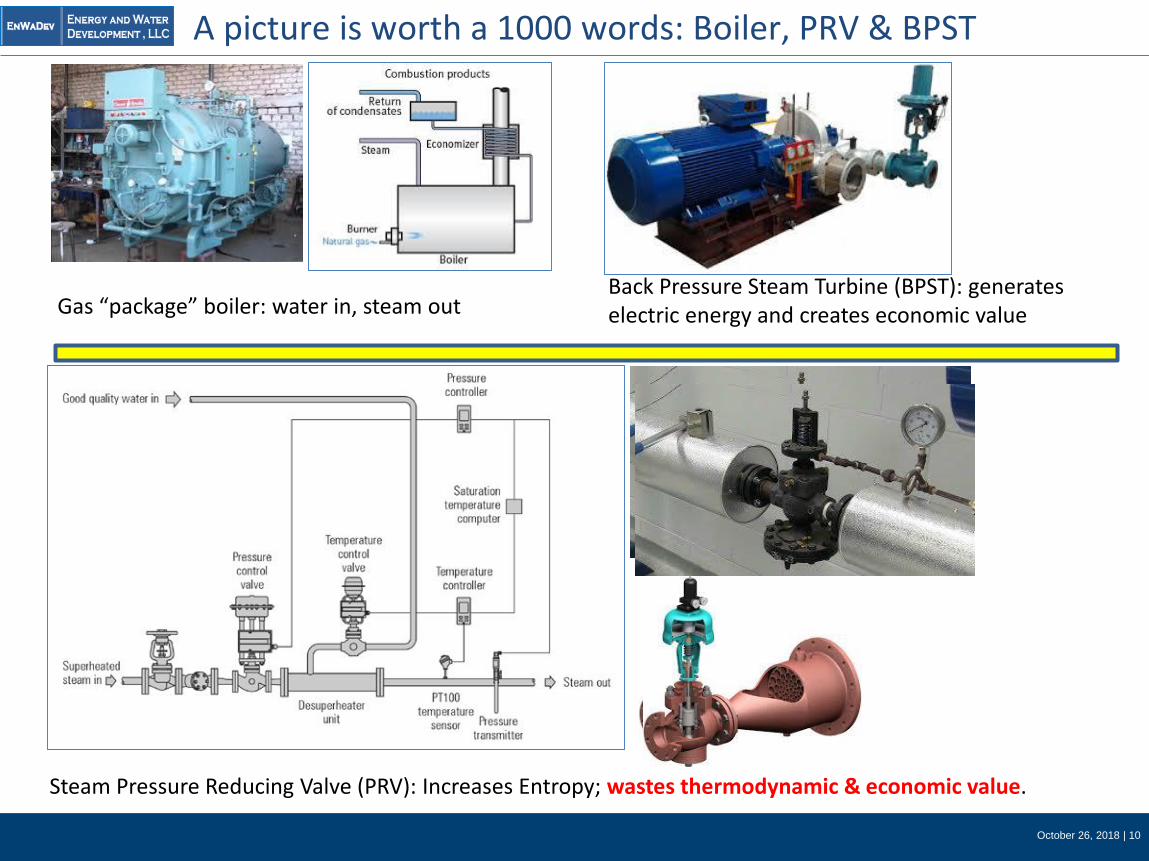
A picture is worth a 1000 words: Boiler, PRV & BPST
Gas “package” boiler: water in, steam out
Steam Pressure Reducing Valve (PRV): Increases Entropy; wastes thermodynamic & economic value.
Back Pressure Steam Turbine (BPST): generates electric energy and creates economic value
October 26, 2018 | 11
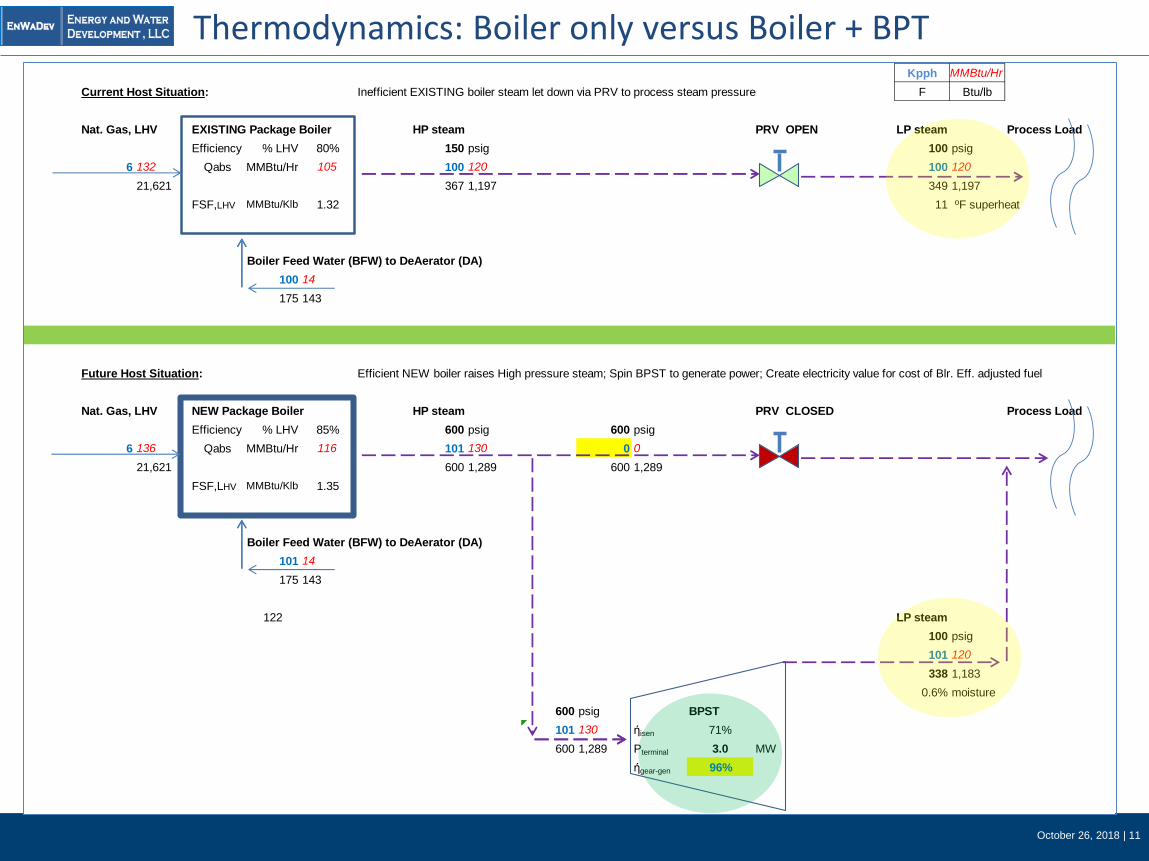
Thermodynamics: Boiler only versus Boiler + BPTKpph MMBtu/Hr
Current Host Situation: Inefficient EXISTING boiler steam let down via PRV to process steam pressure F Btu/lb
Nat. Gas, LHV EXISTING Package Boiler HP steam PRV OPEN LP steam Process Load
Efficiency % LHV 80% 150 psig 100 psig
6 132 Qabs MMBtu/Hr 105 100 120 100 120
21,621 367 1,197 349 1,197
FSF,LHV MMBtu/Klb 1.32 11 ºF superheat
Boiler Feed Water (BFW) to DeAerator (DA)
100 14
175 143
Future Host Situation: Efficient NEW boiler raises High pressure steam; Spin BPST to generate power; Create electricity value for cost of Blr. Eff. adjusted fuel
Nat. Gas, LHV NEW Package Boiler HP steam PRV CLOSED Process Load
Efficiency % LHV 85% 600 psig 600 psig
6 136 Qabs MMBtu/Hr 116 101 130 0 0
21,621 600 1,289 600 1,289
FSF,LHV MMBtu/Klb 1.35
Boiler Feed Water (BFW) to DeAerator (DA)
101 14
175 143
122 LP steam
100 psig
101 120
338 1,183
0.6% moisture
600 psig BPST
101 130 ήisen 71%
600 1,289 Pterminal 3.0 MW
ήgear-gen 96%
October 26, 2018 | 12
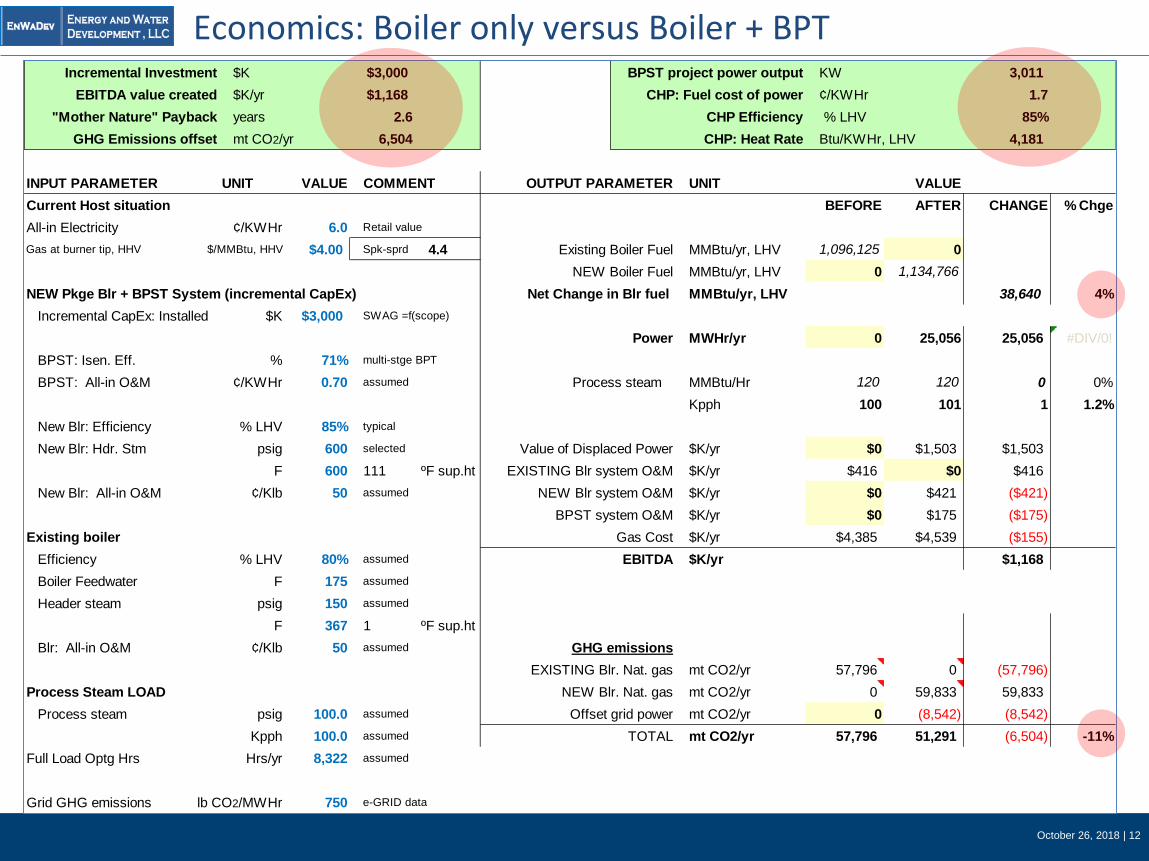
Economics: Boiler only versus Boiler + BPTIncremental Investment $K $3,000 BPST project power output KW 3,011
EBITDA value created $K/yr $1,168 CHP: Fuel cost of power ¢/KWHr 1.7
"Mother Nature" Payback years 2.6 CHP Efficiency % LHV 85%
GHG Emissions offset mt CO2/yr 6,504 CHP: Heat Rate Btu/KWHr, LHV 4,181
INPUT PARAMETER UNIT VALUE COMMENT OUTPUT PARAMETER UNIT VALUE
Current Host situation BEFORE AFTER CHANGE % Chge
All-in Electricity ¢/KWHr 6.0 Retail value
Gas at burner tip, HHV $/MMBtu, HHV $4.00 Spk-sprd 4.4 Existing Boiler Fuel MMBtu/yr, LHV 1,096,125 0
NEW Boiler Fuel MMBtu/yr, LHV 0 1,134,766
NEW Pkge Blr + BPST System (incremental CapEx) Net Change in Blr fuel MMBtu/yr, LHV 38,640 4%
Incremental CapEx: Installed $K $3,000 SWAG =f(scope)
Power MWHr/yr 0 25,056 25,056 #DIV/0!
BPST: Isen. Eff. % 71% multi-stge BPT
BPST: All-in O&M ¢/KWHr 0.70 assumed Process steam MMBtu/Hr 120 120 0 0%
Kpph 100 101 1 1.2%
New Blr: Efficiency % LHV 85% typical
New Blr: Hdr. Stm psig 600 selected Value of Displaced Power $K/yr $0 $1,503 $1,503
F 600 111 ºF sup.ht EXISTING Blr system O&M $K/yr $416 $0 $416
New Blr: All-in O&M ¢/Klb 50 assumed NEW Blr system O&M $K/yr $0 $421 ($421)
BPST system O&M $K/yr $0 $175 ($175)
Existing boiler Gas Cost $K/yr $4,385 $4,539 ($155)
Efficiency % LHV 80% assumed EBITDA $K/yr $1,168
Boiler Feedwater F 175 assumed
Header steam psig 150 assumed
F 367 1 ºF sup.ht
Blr: All-in O&M ¢/Klb 50 assumed GHG emissions
EXISTING Blr. Nat. gas mt CO2/yr 57,796 0 (57,796)
Process Steam LOAD NEW Blr. Nat. gas mt CO2/yr 0 59,833 59,833
Process steam psig 100.0 assumed Offset grid power mt CO2/yr 0 (8,542) (8,542)
Kpph 100.0 assumed TOTAL mt CO2/yr 57,796 51,291 (6,504) -11%
Full Load Optg Hrs Hrs/yr 8,322 assumed
Grid GHG emissions lb CO2/MWHr 750 e-GRID data
October 26, 2018 | 13
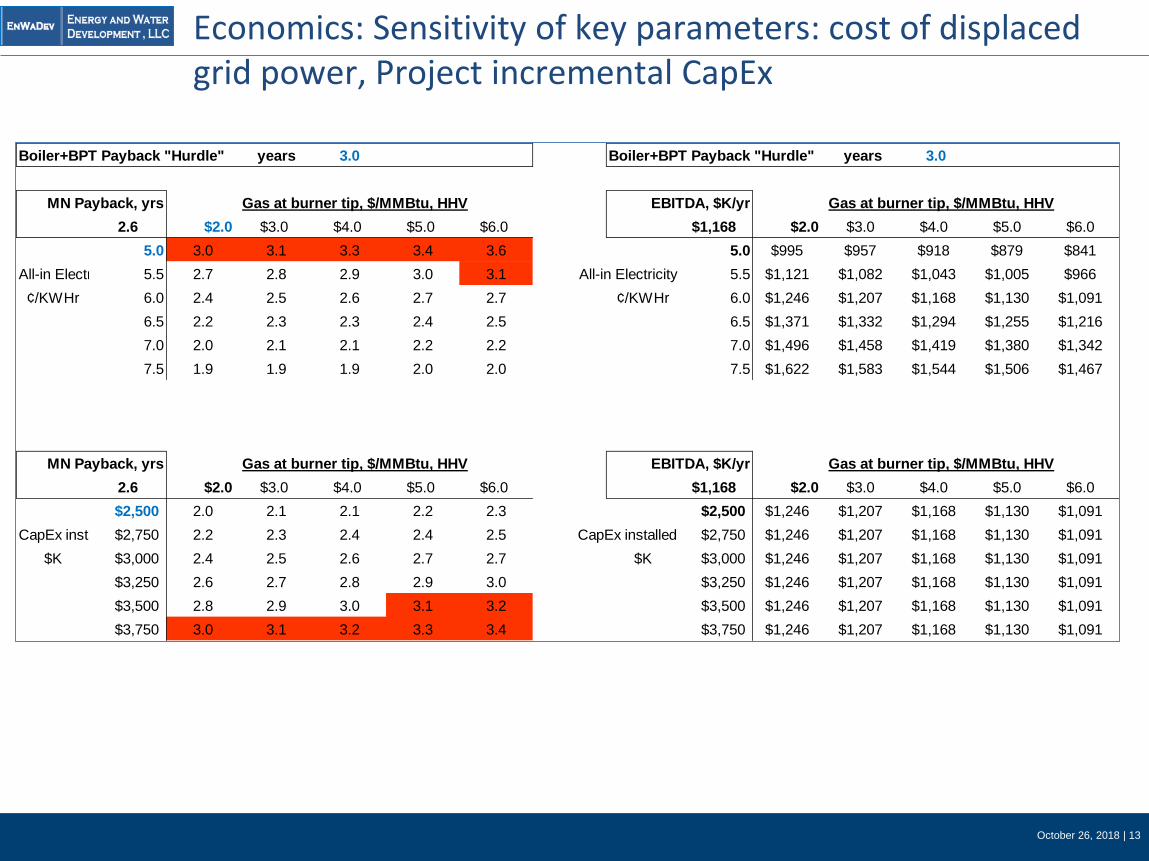
Economics: Sensitivity of key parameters: cost of displaced grid power, Project incremental CapEx
Boiler+BPT Payback "Hurdle" years 3.0 Boiler+BPT Payback "Hurdle" years 3.0
MN Payback, yrs Gas at burner tip, $/MMBtu, HHV EBITDA, $K/yr Gas at burner tip, $/MMBtu, HHV
2.6 $2.0 $3.0 $4.0 $5.0 $6.0 $1,168 $2.0 $3.0 $4.0 $5.0 $6.0
5.0 3.0 3.1 3.3 3.4 3.6 5.0 $995 $957 $918 $879 $841
All-in Electricity 5.5 2.7 2.8 2.9 3.0 3.1 All-in Electricity 5.5 $1,121 $1,082 $1,043 $1,005 $966
¢/KWHr 6.0 2.4 2.5 2.6 2.7 2.7 ¢/KWHr 6.0 $1,246 $1,207 $1,168 $1,130 $1,091
6.5 2.2 2.3 2.3 2.4 2.5 6.5 $1,371 $1,332 $1,294 $1,255 $1,216
7.0 2.0 2.1 2.1 2.2 2.2 7.0 $1,496 $1,458 $1,419 $1,380 $1,342
7.5 1.9 1.9 1.9 2.0 2.0 7.5 $1,622 $1,583 $1,544 $1,506 $1,467
MN Payback, yrs Gas at burner tip, $/MMBtu, HHV EBITDA, $K/yr Gas at burner tip, $/MMBtu, HHV
2.6 $2.0 $3.0 $4.0 $5.0 $6.0 $1,168 $2.0 $3.0 $4.0 $5.0 $6.0
$2,500 2.0 2.1 2.1 2.2 2.3 $2,500 $1,246 $1,207 $1,168 $1,130 $1,091
CapEx installed$2,750 2.2 2.3 2.4 2.4 2.5 CapEx installed $2,750 $1,246 $1,207 $1,168 $1,130 $1,091
$K $3,000 2.4 2.5 2.6 2.7 2.7 $K $3,000 $1,246 $1,207 $1,168 $1,130 $1,091
$3,250 2.6 2.7 2.8 2.9 3.0 $3,250 $1,246 $1,207 $1,168 $1,130 $1,091
$3,500 2.8 2.9 3.0 3.1 3.2 $3,500 $1,246 $1,207 $1,168 $1,130 $1,091
$3,750 3.0 3.1 3.2 3.3 3.4 $3,750 $1,246 $1,207 $1,168 $1,130 $1,091

October 26, 2018 | 14
Economics: Sensitivity of key parameters: site steam load and full load operating hours
Boiler+BPT Payback "Hurdle" years 3.0 Boiler+BPT Payback "Hurdle" years 3.0
MN Payback, yrs Gas at burner tip, $/MMBtu, HHV EBITDA, $K/yr Gas at burner tip, $/MMBtu, HHV
2.6 $2.0 $3.0 $4.0 $5.0 $6.0 $1,168 $2.0 $3.0 $4.0 $5.0 $6.0
80 3.0 3.1 3.2 3.3 3.4 80 $1,246 $1,207 $1,168 $1,130 $1,091
Process steam 88 2.7 2.8 2.9 3.0 3.1 Process steam 88 $1,246 $1,207 $1,168 $1,130 $1,091
Kpph 96 2.5 2.6 2.7 2.8 2.9 Kpph 96 $1,246 $1,207 $1,168 $1,130 $1,091
104 2.3 2.4 2.5 2.6 2.6 104 $1,246 $1,207 $1,168 $1,130 $1,091
112 2.2 2.2 2.3 2.4 2.5 112 $1,246 $1,207 $1,168 $1,130 $1,091
120 2.0 2.1 2.1 2.2 2.3 120 $1,246 $1,207 $1,168 $1,130 $1,091
MN Payback, yrs Gas at burner tip, $/MMBtu, HHV EBITDA, $K/yr Gas at burner tip, $/MMBtu, HHV
2.6 $2.0 $3.0 $4.0 $5.0 $6.0 $1,168 $2.0 $3.0 $4.0 $5.0 $6.0
5,500 3.6 3.8 3.9 4.0 4.2 5,500 $823 $798 $772 $747 $721
Full Load Optg 6,050 3.3 3.4 3.5 3.7 3.8 Full Load Optg 6,050 $906 $878 $849 $821 $793
Hrs/yr 6,600 3.0 3.1 3.2 3.3 3.5 Hrs/yr 6,600 $988 $957 $927 $896 $865
7,150 2.8 2.9 3.0 3.1 3.2 7,150 $1,070 $1,037 $1,004 $971 $938
OK 7,700 2.6 2.7 2.8 2.9 3.0 7,700 $1,153 $1,117 $1,081 $1,045 $1,010
8,250 2.429 2.507 2.590 2.678 2.773 8,250 $1,235 $1,197 $1,158 $1,120 $1,082
October 26, 2018 | 15
Boiler + BPST integrates into a “renewables”” microgrid
Benefit to the investor / ownerBPST payback < 3-yrs (IRR > 30%)
Extremely low “fuel cost of power” makes a bottoming cycle CHP configured as a boiler + BPT another source of power for a thermal customer considering a “renewables” microgrid.
Reliable onsite power supply. BPST maintain their efficiency across the load curve from 100% to 20% of nameplate; hence over/under sizing is less of a concern
Benefit to GridLocal grid stability including power factor support and reduced I2R line lossBalance variable power from wind and solar, thus speed renewable energy deployment
Benefit to societyReduced pollution and profitable lowering of greenhouse gas emissions
October 26, 2018 | 16
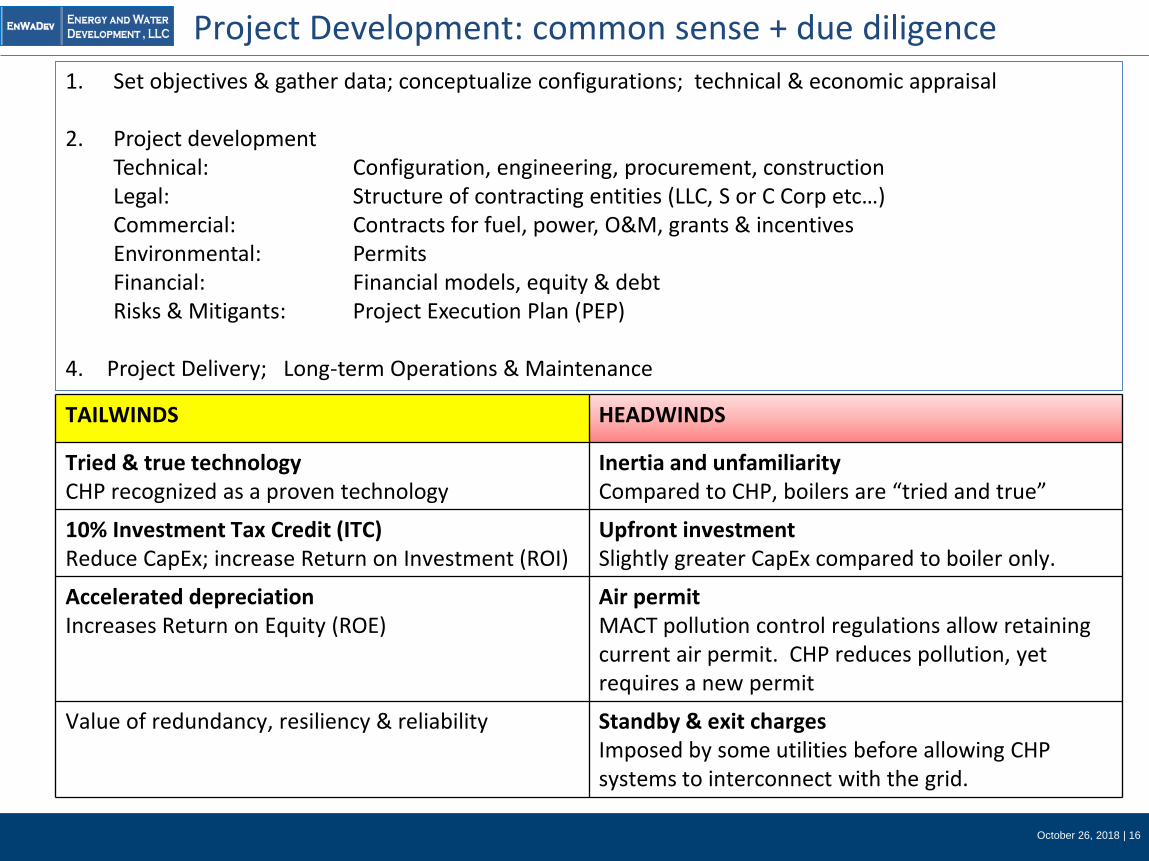
1. Set objectives & gather data; conceptualize configurations; technical & economic appraisal
2. Project developmentTechnical: Configuration, engineering, procurement, constructionLegal: Structure of contracting entities (LLC, S or C Corp etc…)Commercial: Contracts for fuel, power, O&M, grants & incentivesEnvironmental: PermitsFinancial: Financial models, equity & debtRisks & Mitigants: Project Execution Plan (PEP)
4. Project Delivery; Long-term Operations & Maintenance
Project Development: common sense + due diligence
TAILWINDS HEADWINDS
Tried & true technologyCHP recognized as a proven technology
Inertia and unfamiliarityCompared to CHP, boilers are “tried and true”
10% Investment Tax Credit (ITC) Reduce CapEx; increase Return on Investment (ROI)
Upfront investmentSlightly greater CapEx compared to boiler only.
Accelerated depreciationIncreases Return on Equity (ROE)
Air permitMACT pollution control regulations allow retaining current air permit. CHP reduces pollution, yet requires a new permit
Value of redundancy, resiliency & reliability Standby & exit chargesImposed by some utilities before allowing CHP systems to interconnect with the grid.

October 26, 2018 | 17
Questions?
Suresh Jambunathan, Owner & CEOEnergy and Water Development LLCwww.energywaterdev.com
Cell: 630-335-4544E-mail: [email protected]; [email protected]
October 30th 2018Baltimore, MD


![Joint Investment and Operation of Microgrid · 2015-11-09 · and microgrid operation. While in [9]–[12], only microgrid operation is studied under given microgrid facilities. However,](https://img.pdfslide.us/doc/110x75/5f055ca67e708231d412960b/joint-investment-and-operation-of-microgrid-2015-11-09-and-microgrid-operation.jpg)