Embed Size (px)
Citation preview

J. Sens. Sens. Syst., 5, 95–112, 2016
www.j-sens-sens-syst.net/5/95/2016/
doi:10.5194/jsss-5-95-2016
© Author(s) 2016. CC Attribution 3.0 License.
A micro-capacitive pressure sensor
design and modelling
Ali E. Kubba1, Ahmed Hasson1, Ammar I. Kubba2, and Gregory Hall1
1Fusion Innovations Ltd., Research and Innovation Services, Birmingham Research Park, Vincent Drive,
Edgbaston, Birmingham, B15 2SQ, UK2School of Engineering, Mechanical Engineering, University of Birmingham,
Edgbaston, Birmingham, B15 2TT, UK
Correspondence to: Ali E. Kubba ([email protected])
Received: 19 October 2015 – Revised: 5 February 2016 – Accepted: 15 February 2016 – Published: 30 March 2016
Abstract. Measuring air pressure using a capacitive pressure sensor is a robust and precise technique. In addi-
tion, a system that employs such transducers lies within the low power consumption applications such as wireless
sensor nodes. In this article a high sensitivity with an elliptical diaphragm capacitive pressure sensor is proposed.
This design was compared with a circular diaphragm in terms of thermal stresses and pressure and temperature
sensitivity. The proposed sensor is targeted for tyre pressure monitoring system application. Altering the over-
lapping area between the capacitor plates by decreasing the effective capacitance area to improve the overall
sensitivity of the sensor (1C/C), temperature sensitivity, and built-up stresses is also examined in this article.
Theoretical analysis and finite element analysis (FEA) were employed to study pressure and temperature ef-
fects on the behaviour of the proposed capacitive pressure sensor. A MEMS (micro electro-mechanical systems)
manufacturing processing plan for the proposed capacitive sensor is presented. An extra-low power short-range
wireless read-out circuit suited for energy harvesting purposes is presented in this article. The developed read-out
circuitry was tested in terms of sensitivity and transmission range.
1 Introduction
This article presents a proposed design of a MEMS capaci-
tive pressure sensor for tyre inflation pressure measurement
purposes. A diaphragm-based pressure sensing mechanism
is employed and analysed in both analytical and numeri-
cal techniques, including Matlab and finite element analy-
sis (FEA), which are employed to examine the proposed
micro-pressure sensor response under a certain range of pres-
sure and temperature conditions. A low power read-out and
transmission circuit for the capacitive pressure sensor is also
illustrated.
1.1 Motivation
This research is part of a TSB funded project which is led
by Fusion Innovations Ltd. ECORR (Variable Rolling Resis-
tance Tyre System) is an Innovate UK collaborative project
as part of the Low Carbon Vehicles Disruptive technologies
field. This project is currently partnered by Randle Engi-
neering, Potenza Technology, and the University of Birming-
ham1.
According to the Pressure Sensor Market report (Market-
sandMarkets, 2015) published by MarketsandMarkets, the
global pressure sensor market was valued at USD 6.7 billion
in 2014 and is expected to grow to USD 9.48 billion by 2020.
In 2014, around 36.7 % of commercial pressure sensors were
piezoresistive, followed by capacitive pressure sensors as
the second dominant type, accounting for a market share of
27.6 %. The automotive industry is the largest application
market for pressure sensors and accounted for a 25 % share
of the total revenue of 2014 (MarketsandMarkets, 2015). Siz-
able growth of the pressure sensor market in the Asia–Pacific
region, particularly in the automotive industry, is predicted
due to the introduction of new regulations and legislations re-
1Fusion Innovations Ltd, available at: http://www.
fusion-innovations.com/, last access: 30 December 2015.
Published by Copernicus Publications on behalf of the AMA Association for Sensor Technology.

96 A. E. Kubba et al.: A micro-capacitive pressure sensor design and modelling
Figure 1. Typical piezoresistive pressure sensor structure. (a) Top
view of the piezoresistive pressure sensor. Four piezoresistors are
placed on each edge forming a Wheatstone bridge circuit. (b) Cross
section A–A showing deflected diaphragm with piezoresistors at
maximum stress locations (Barlian et al., 2009).
garding the use of such sensors in vehicles. More TPMS (tyre
pressure monitoring system) market analysis can be found in
Technavio (2015).
A listing for pressure sensors, manufacturers, and a tech-
nical comparison between both piezoresistive and capacitive
pressure sensors can be found in Fragiacomo (2012).
1.2 Piezoresistive pressure sensors
Piezoresistive pressure sensors are based on the piezoresis-
tive effect, which is a change in resistance with the ap-
plied stress. By applying piezoresistor(s), with known val-
ues and where a maximum variation of stresses occurs, to
a pressure sensitive diaphragm, and monitoring the change
in that resistor as the applied pressure varies, in most
cases the change in the applied pressure can be detected
by using a Wheatstone bridge circuit. The fact that single-
crystal silicon has a piezoresistive nature, and that sili-
con is mainly used in micro-machining, enabled production
of semi-conductor-based sensors (Eaton and Smith, 1997).
Examples of industrial piezoresistive pressure sensors are
shown in Figs. 1 and 2.
Piezoresistive pressure sensors have the advantages of low
cost, linearity, a simple read-out circuit, and the possibility
of being batch produced. The piezoresistive coefficients of
each mounted resistor depend upon the orientation of the
wafer and diaphragm, the type and amount of doping, and
the temperature (Beeby et al., 2004). The latter is a main
disadvantage in applying piezoresistive pressure sensors to
tyre monitoring systems, as tyre temperature changes over a
wide range. Power consumption is highly related to the sizes
of the mounted resistors’ values, which vary according to
the size of the piezoresistive pressure sensor overall. How-
ever, most existing commercially available TPMSs include a
piezoresistive pressure sensor for their relatively low price. A
typical commercial piezoresistive pressure sensor developed
by Intersema Sensoric, a Measurement Specialties company
(2009), is shown in Fig. 3.
Figure 2. Resistor placement on diaphragm-based piezoresistive
pressure sensors: (a) four resistors placed on the diaphragm edges
and (b) two resistors on the diaphragm edges and the other two at
the centre of the diaphragm. In both cases, the resistors are con-
nected in Wheatstone bridge (c) resistors mounted on the inner and
outer perimeters on a bossed diaphragm (Beeby et al., 2004; Chien-
Hung et al., 2006).
Scaling down the mounted resistors creates an increase in
power consumption – providing the same piezoresistive co-
efficient, mounting accuracy, and noise problems (Cullinan
et al., 2012). In addition, the limitation of the resistors’ size
might reduce the sensitivity of the piezoresistive pressure
sensor by averaging the developed stress on the sensor di-
aphragm. Another problem with piezoresistive pressure sen-
sors is that piezoresistance is susceptible to junction leakage
and surface contamination (Bao, 2000). This is true when us-
ing silicon as the main substrate to fabricate a MEMS pres-
sure sensor, and can be overcome by using SOI (silicon on in-
sulator) instead (Li Sainan et al., 2015), though it would dou-
ble the sensor’s substrate cost. A good review of the work-
ing principles and sensitivity of piezoresistive pressure sen-
sors is explained in Gad-el-Hak (2002). With capacitive and
piezoresistive measurement principles, there are competing
concepts on the market. Whereas the piezoresistive pressure
sensor is found in the vast majority of commercial TPMS
(Fragiacomo, 2012; Nwagboso, 2012), it does not meet the
requirement of battery-less systems anymore due to the fact
that the power consumption is much higher, and since sleep
modes for measurement acquisition are mandatory (Thurau
and Ruohio, 2004).
J. Sens. Sens. Syst., 5, 95–112, 2016 www.j-sens-sens-syst.net/5/95/2016/

A. E. Kubba et al.: A micro-capacitive pressure sensor design and modelling 97
Figure 3. Miniature SMD (surface-mounted device) pressure sen-
sor mounted on a read-out PCB (printed circuit board) developed by
Intersema Sensoric (now Measurement Specialties, Inc., a TE Con-
nectivity company; photo taken with permission from Measurement
Specialties).
Figure 4. A schematic view of a basic capacitive pressure trans-
ducer (Bao, 2000).
1.3 Capacitive pressure sensors
This type of micro-machined pressure sensor was first devel-
oped in the late 1970s and early 1980s (Gad-el-Hak, 2002). It
can be classified as the simplest in principle among all pres-
sure sensing mechanisms. Capacitive pressure sensors pri-
marily consist of two parallel conductive plates, so-called
electrodes, separated by a dielectric material. Usually one of
the electrodes is pressure sensitive, whereas the other elec-
trode is located on a rigid substrate beneath it. However, a
capacitive pressure sensor with two sensitive diaphragms has
been developed (Fonseca et al., 2002). When pressure is ap-
plied onto the sensitive diaphragm, the cavity enclosed be-
tween the two parallel plates reduces in volume as the sen-
sitive diaphragm deflects and approaches the stationary one,
resulting in a detectable change in the capacitance between
the electrodes. A schematic diagram for a typical capacitive
pressure sensor is shown in Fig. 4.
The principle advantages of capacitive pressure sensors
over piezoresistive pressure sensors are lower power con-
sumption, increased pressure sensitivity, and lower tempera-
ture cross-sensitivity (Lee and Wise, 1982; Eaton and Smith,
1997; Eddy and Sparks, 1998; Bever et al., 2003; Beeby et
al., 2004). In addition, because there is no need to mount any
resistors on the sensor diaphragm, scaling down the device
dimensions is easier because concerns about stress averaging
and resistor tolerance are eliminated. Variation of tempera-
ture has a major contribution to the sensitivity of piezore-
sistive pressure sensors, mainly due to the resistance depen-
dence on temperature. This factor is eliminated in capaci-
tive sensors (Gad-el-Hak, 2002). There is virtually no power
consumption in the sensing element in capacitive pressure
sensors due to the dc current component being zero (Gad-
el-Hak, 2002) and the low power capability of the capacitive
measuring principle (Kolle et al., 2004).
Capacitive pressure sensors have been applied to TPMS
devices due to their low power consumption, high accuracy
and low temperature sensitivity (Rudolf and Hoogerwerf,
1997; APOLLO, 2003; Thurau and Ruohio, 2004; Kolle et
al., 2004). Bracke et al. (2007) presented the power consump-
tion of various ultra-low power capacitive sensors’ interfaces
and showed experimentally that it is possible to achieve an
average power consumption of 7.3 µW for a 10 Hz sampling
frequency and 8 bit accuracy in the 100 to 130 kPa pres-
sure range. This amount of power consumption is lower than
the average piezoresistive pressure sensor power consump-
tion if a similar sampling rate and digitalization level is used.
A new patented capacitive sensor measurement chip (Pico-
Cap)2 could be utilized for TPMS devices as it offers signal
digitalization at a high sampling rate (up to 500 k sample s−1)
under an extra low power requirement.
The main limitations of capacitive pressure sensors in
general are nonlinearity between the applied pressure, the
change in capacitance, and the large impedance of the sensor
output signal (Tian et al., 2009), which also affects the in-
terface circuit design, and the parasitic capacitance between
the interface circuit and the device output can have a sig-
nificant negative impact on the read-out, which means that
the circuit must be placed in close proximity to the device
in a hybrid or monolithic implementation. To address the
nonlinearity problem in capacitive pressure sensors, differ-
ent approaches have been used to mitigate this drawback,
e.g. bossed diaphragms, centrally clamped diaphragms and
partial electrode patterned diaphragms; however, these ap-
proaches reduce the overall sensor sensitivity and limit the
measured pressure range. Touch mode capacitive pressure
sensors, as shown in Fig. 5, are commonly used to employ
linearity as regards the nonlinearity problems in ordinary ca-
pacitive pressure sensors. One potential drawback of touch
mode devices is hysteresis arising from friction between the
surfaces as they move together and apart, as well as the risk
of stiction (Beeby et al., 2004).
Another important issue in the making of capacitive pres-
sure sensors is sealing, which is a fabrication process com-
plexity (Tian et al., 2009). Extra care should be taken when
fabricating and packaging absolute pressure sensors and es-
pecially in sealing the vacuum cavity beneath the sensitive
diaphragm, as it is the reference pressure for the sensor (Gad-
2acam messelektronik gmbh, available at: http://www.acam.de/
de/produkte/picocap/, last access: 8 October 2015.
www.j-sens-sens-syst.net/5/95/2016/ J. Sens. Sens. Syst., 5, 95–112, 2016

98 A. E. Kubba et al.: A micro-capacitive pressure sensor design and modelling
Figure 5. A touch mode capacitive pressure sensor (Gad-el-Hak,
2002).
el-Hak, 2002). Proper sealing in absolute capacitive pres-
sure sensors is crucial to achieve long term stability. Due
to cost issues in both wafers and fabrication processes, and
the match between Pyrex glass and silicon thermal expansion
coefficients, Pyrex glass substrate is a common material for
the sensor constraint base when making capacitive pressure
sensors to support the sensor silicon dies. Anodic bonding is
usually used to attach Pyrex glass to silicon wafers, which
is essential to produce a reliable and hermetically sealed
MEMS capacitive pressure sensor under medium bonding
temperature (Frank, 2000; Hsu, 2008). Glass is therefore a
well-known material, but also has some specific characteris-
tics like outgasing and absorption of residual gas on the glass
surface which would lead to a change in the internal pressure.
In order to address this problem, an interesting approach was
used in fabricating a capacitive pressure sensor – which is es-
pecially designed for TPMS applications, as shown in Thu-
rau and Ruohio (2004). In this design, a wet etched vacuum
reservoir, also called a gas pocket, was added and connected
to the reference pressure volume underneath the sensor di-
aphragm enabling good long term stability. A good review
of a MEMS capacitive pressure sensor, using a technology
developed by a group of engineers in Finland who origi-
nally developed pressure sensors targeted for weather mea-
surement application, and which were especially designed to
withstand harsh environment conditions, is explained in de-
tail in Thurau and Ruohio (2004). A comparison of various
high-temperature pressure sensors and passive wireless pres-
sure sensors is well presented by Fonseca (2007).
1.4 Resonant pressure sensors
Resonance micro-machined pressure sensors were first de-
veloped in the early 1980s by Greenwood (1984). The res-
onant sensing mechanism is based on containing a resonant
structure in which its resonance frequency is a function of
a mechanical quantity, such as pressure, strain, temperature,
etc. This type of sensor can be considerably more robust than
the measurement of a resistor or capacitor, and therefore it is
mainly affected by the mechanical qualities rather than elec-
trical qualities of the device (Gad-el-Hak, 2002).
The main advantages of this type of sensing technique over
capacitive and piezoresistive techniques are its high accuracy
and quality factors. In addition, resonant pressure sensors’
output is frequency; therefore, interfacing to a digital system
can be easier. However, the fabrication of such sensors has
some technical challenges. More details about the advantages
and disadvantages are explained in Gad-el-Hak (2002) and
Beeby et al. (2004). Other main issues with resonant pres-
sure sensors are power consumption, which is considerably
higher than conventional capacitive and pressure sensors, and
temperature sensitivity, which affects the resonator structure
material properties and geometry, and therefore changes its
natural frequency.
Having vehicle tyre inflation pressure measurement, pow-
ered by energy harvesting, as the main thrust in this work,
the dynamic environment of the measurement system forces
onto the system a wide range of random vibration excitation,
mainly from tyre rolling (Tsujiuchi et al., 2005; Brusarosco
et al., 2008, 2010), and also from various vehicle compo-
nents or vibrations transferred through the road originating
from other vehicles or nearby machinery and high-impact
and centrifugal acceleration components (APOLLO, 2005),
which means that the pressure measurement system must not
be sensitive to or affected by such conditions. This is particu-
larly a major problem when using a resonant sensing system,
as it is not possible to isolate the tyre pressure sensing sys-
tem from all the vibrations occurring within the tyre struc-
ture. For this reason, and due to the high power consumption
of resonant pressure sensors, this type of sensor is out of the
scope of this research. However, Grossmann (1999) claims
that developing a quartz-based resonant passive tyre pres-
sure sensor, in which its natural frequency lies in the mega-
hertz range, is extremely stable. On the other hand, the sys-
tem is battery free and powered by an RF signal generated
by the read-out system, which has to be mounted within a
short distance from the resonator and is powered by the ve-
hicle battery and consumes 10 mW of power. It is not clear
whether the resonator was tested in a moving vehicle. Han-
nan et al. (2008) state that this type of tyre pressure sensor
has a main disadvantage of low robustness in a harsh envi-
ronment during vehicle operation.
Preliminary resonant devices are rather complex in terms
of design, fabrication, and packaging. In addition, reso-
nant devices contain piezoresistors for strain measurements
and piezoelectric materials for vibration excitation, either
of which can be used directly in the sensing structure for
measuring most mechanical quantities. As such, using the
resonant approach in the sensing mechanism is only justi-
fied in high-performance sensing applications (Beeby et al.,
2004). An example of a commercialized resonant pressure
sensor, developed by Druck Limited, is shown in Fig. 6 be-
low (Beeby et al., 2004; Druck, 2012).
In the previous paragraphs, the three most commercially
available micro-machined pressure sensors were explained
and compared. In the following paragraphs within this sec-
tion, other pressure sensing techniques are briefly covered
(Gad-el-Hak, 2002; Beeby et al., 2004).
J. Sens. Sens. Syst., 5, 95–112, 2016 www.j-sens-sens-syst.net/5/95/2016/

A. E. Kubba et al.: A micro-capacitive pressure sensor design and modelling 99
Figure 6. Druck resonant pressure sensor (Beeby et al., 2004).
1.5 Surface acoustic wave
Surface acoustic wave (SAW) pressure sensors are well
suited for automotive application because they are designed
to be passive, rugged, and extremely small. SAW sensors are
different in their sensing mechanisms compared to other res-
onant sensors in which a mechanical resonating structure is
employed. In SAW sensors, a piezoelectric crystal is used
as the resonating element. This element resonates acoustic
wave resonance by applying an oscillating voltage through
the electrodes due to the inverse piezoelectric effect (Caval-
loni et al., 2002).
SAW technology was originally used in electronic ana-
logue signal processing in the 1970s as filters in the field of
radio transmission in wireless systems (Yurish and Gomes,
2005). However, SAW sensor structure is sensitive to some
physical quantities like strain, temperature, humidity, accel-
eration, etc., and therefore can be applied to measure these
quantities (Reindl et al., 1996; Kalinin, 2004; Chin et al.,
2010; Hew et al., 2011). Figure 7 shows different strain
measurement mechanisms that can be employed when using
SAW sensors.
A SAW measurement system is capable of wirelessly
monitoring applications and acts as a passive sensor in such a
way that the oscillation frequency of the transmission signal
passing through the SAW sensor changes in speed or phase
with the measured value. Consequently, applying SAW sen-
sors in a tyre pressure and temperature monitoring system
has been explored for their advantages in the sense that they
have very small size and weight, can pass signals wirelessly,
receive the required power wirelessly by the energy of the
RF field (and therefore no local battery is needed), and can
resist harsh environment conditions (Pohl et al., 1997, 1998;
Xiangwen et al., 2004; Zhang et al., 2004; Li et al., 2010).
The working principle of SAW sensors is explained in de-
tail in chapter five in Yurish and Gomes (2005). One of the
problems associated with a SAW sensing system is its short
transmission range; therefore, the transmitting and receiving
antennas of the read-out system have to be mounted close to
Figure 7. Reflective delay line sensor (a), resonant sensor (b), im-
pulse responses of the delay line (c), the resonant (d) sensors, and
the spectrum of the resonator response (e) (Kalinin 2004).
the SAW sensors, with a maximum distance for detection of
40 cm (Oh et al., 2008). In the TPMS application, for exam-
ple, cables from the central read-out circuit need to be in-
stalled with antennas in their ends nearby each tyre, which
increases the overall weight and the installation cost of the
system. Although SAW sensors do not need batteries, the
system, particularly the read-out part, is not self powered and
therefore consumes power from the vehicle battery.
Transense, a company based in the UK, has developed a
SAW-based tyre pressure monitoring system (Stack TPMS)
which is supposed to be available on the market for motor-
sport applications3. SAW sensors in this system are attached
to the tyre’s valve and communicate with the read-out cir-
cuit antenna at 433 MHz via a 5 mm diameter antenna with
an optional length to be specified by the customer. Transense
claims that their SAW tyre pressure sensor has 1 m of read-
ing range. The system performance and characteristics are
clearly explained by Dixon et al. (2006).
SAW transponders can also be designed in such a way that
an external sensor, e.g. a capacitive sensor, can be connected
to a reflector within the SAW chip and act as an impedance
load on that reflector. Schimetta et al. (2000) present a SAW
hybrid tyre pressure sensor in which a capacitive pressure
sensor is used for pressure measurement. In this system, the
reflectivity of the impedance loaded reflector will be a func-
tion of the variable sensor impedance, which is a function
of the measured value, e.g. pressure. Such a system has the
advantage of a high signal-to-noise ratio and a larger modu-
lation factor compared to ordinary SAW sensors. However,
this type of sensor is more complex to model and detect. The
3Transense, available at: http://www.transense.co.
uk/technologies/temppressure/motorsport-tpms and http:
//www.stackltd.com/tpms.html, last access: 16 December 2011.
www.j-sens-sens-syst.net/5/95/2016/ J. Sens. Sens. Syst., 5, 95–112, 2016

100 A. E. Kubba et al.: A micro-capacitive pressure sensor design and modelling
Figure 8. Schematic of a general capacitive sensor.
principle and design of a TPMS based on a hybrid SAW sen-
sor are presented in Schimetta et al. (2000).
In a previous publication (Kubba and Jiang, 2014), the au-
thor made a comparison between the above-listed pressure
sensing mechanisms and a justification was made for choos-
ing the capacitance sensing technique. Therefore, the follow-
ing sections focus on capacitive pressure sensors.
2 Transduction mechanism of capacitive pressure
sensor
In this section the capacitive transduction is explained in de-
tail. Traditionally, a basic capacitor consists of two parallel
plates, or electrodes, of equal area A and at a distance of
do apart (Fig. 8), and a dielectric material in-between. The
mathematical expression of the electrical capacitance of the
two plates can be obtained as follows (Beeby et al., 2004):
C = εoεr
A
do, (1)
where εo is the free space permittivity and equals
8.854× 10⁻¹² in Farad per metre (F m−1), εr is the relative
permittivity of the dielectric material in between the capaci-
tor electrodes,A is the area of overlap between the electrodes
in metres squared (m2), and do is the separation between the
electrodes in metres (m).
In order to achieve capacitive transduction, one of the in-
dependent variables in Eq. (1) has to vary with a measured
quantity. This can be done either by moving the dielectric
material or by moving the electrodes linearly with respect to
each other. The latter is quite common in capacitive sensors
due to its simplicity.
A diaphragm-based capacitive sensor has one of the elec-
trodes acting as a diaphragm that is sensitive to pressure,
resulting in a change in the height distribution between the
electrodes when pressure is applied, and therefore change in
the capacitance of the sensor can be detected. The usual way
that capacitive absolute pressure sensors are designed is il-
lustrated in Fig. 9. The lower plate of the capacitive sensor
is rigid and stationary, while the upper one is flexible and
pressure sensitive. When pressure is applied, the upper plate
deforms and the average distance to the stationary plate de-
creases, causing an increase in capacitance. The space be-
tween the two plates is in a vacuum. A schematic diagram of
the proposed capacitive pressure sensor is shown in Fig. 10.
In this design, the lower and upper plates are stationary. The
vacuum cavity is underneath the deformable diaphragm and
Figure 9. Schematic diagram of a general capacitive pressure sen-
sor.
Figure 10. Schematic diagram of the proposed capacitive pressure
sensor.
the upper plate is not sealed, allowing air pressure to transfer
to the diaphragm.
Figure 11. Capacitive sensor’s functional plates of the three de-
signs.
Unlike the conventional capacitive pressure sensors, the
proposed design operates in such a way that the average dis-
tance between the capacitor plates increases when pressure is
applied to the deformable diaphragm. The main advantage of
this design is the avoidance of having one of the sensor elec-
trodes within the sealed vacuum cavity and to avert the need
to transfer the output signal from the inside of the sealed cav-
ity, which can increase the long term leaking rate of the vac-
uum cavity. However, in the proposed design the sensor sen-
sitivity decreases slightly with the increase in applied pres-
sure, while conventional capacitive pressure sensors operate
in the opposite way. For the application of this pressure sen-
sor, higher sensitivity at low pressure is desirable, as in most
cases detecting low tyre inflation pressure is targeted.
The following sections analyse the proposed micro-
pressure sensor in both mechanical and electrical aspects.
3 Sensor geometry
This section examines three possible designs of the
diaphragm-based micro-pressure sensor shown in Fig. 10. It
is assumed that sensors in these designs have the same pres-
sure sensitive diaphragm area in either circular or elliptical
geometries as shown in Fig. 11. The first two designs have
J. Sens. Sens. Syst., 5, 95–112, 2016 www.j-sens-sens-syst.net/5/95/2016/

A. E. Kubba et al.: A micro-capacitive pressure sensor design and modelling 101
their upper capacitor electrode fully covering the lower pres-
sure sensitive electrode, while the third has the upper plate
partially covering the lower capacitor plate. The upper plate
in design 3 has two segments of chords parallel to the ma-
jor axis removed, that is, the area between chords and dashed
lines in design 3 in Fig. 11, making up 70 % of the full ellipse
upper plate area in design 2. The aspect ratio (major to mi-
nor axis ratio) of the elliptical diaphragm in the second and
third designs is 2. These designs are then compared in terms
of pressure sensitivity, temperature dependence, and stress
levels.
In the literature, comparisons between different basic di-
aphragm geometries with equal areas are presented in Wang
and Ko (1999) and Muhammad (2012). The comparisons
show that a circular diaphragm has the lowest maximum
stress and the highest sensitivity among the basic shapes,
that is, square, rectangular and circular diaphragms with con-
stant area. Elliptical diaphragms that have the same area
as a circular diaphragm have higher stiffness, and therefore
cover a higher pressure detection range. In addition, hav-
ing higher stiffness means higher dynamic stability when
included within a dynamic domain (Swett, 2012). In this
section, a comparison between a circular and elliptical di-
aphragm is made in order to determine which is more suited
for the TPMS application.
4 Sensor analysis
4.1 Analytical mechanical analysis
This section focuses on the analytical calculations of the
deformable diaphragm within the micro-capacitive pressure
sensor for both circular and elliptical diaphragms. The ob-
tained analytical diaphragm deformation expressions, for
both the circular and elliptical geometries, can be used to de-
termine the enclosed capacitance between the deformable di-
aphragm and a stationary plate located on top of it, separated
by distance do as illustrated in Figs. 10 and 11.
Despite the lack of accuracy associated with most analyt-
ical calculations usually resulting from assumptions and ap-
proximations, analytical calculations can still offer a rather
nimble and useful way of gaining a valuable answer, or
of comprehending the physical process behind a particular
problem. In the case of designing a pressure sensitive di-
aphragm, analytical techniques can be used to estimate the
deflection response when subjected to uniform pressure. The
analytical formulae applied in this section are quoted from
“Theory of plates and shells” by Timoshenko (1940). These
formulae are based on the following assumptions (Beeby et
al., 2004).
– The diaphragm is not curved when unloaded and has a
uniform thickness.
– The diaphragm substance is homogenous and isotropic.
– The pressure on the diaphragm is uniformly distributed
and perpendicular to the diaphragm plan.
– The applied pressure is within the elastic loading limits
and does not cause any plastic deformation.
– The diaphragm thickness to diameter ratio is less than
20 %.
– All deformation occurring in the diaphragm is due to
bending only, and the neutral axis of the diaphragm
stays at a zero stress level.
The mathematical expression of the deflection of a circular
and elliptical plates under uniform pressure with clamped
edges can be obtained using the expression given in Timo-
shenko (1940).
As mentioned earlier, and in order to compare between
circular and elliptical diaphragms, thickness and surface area
in both geometries are identical.
Hence
Ao = A0, (2)
where Ao is the circular diaphragm area in m2 and A0 the
elliptical diaphragm area in m2. Then
πa2o = πab. (3)
As such, the radii of both geometries can be expressed as
ao =√ab, (4)
where ao is the diaphragm outer radius in m, and a and b are
major and minor axes respectively, both in m.
If
a = 2b, (5)
Eq. (4) can be re-written as
a =√
2ao. (6)
The proposed design uses Eq. (6) to relate between the
circular and elliptical diaphragm diameters.
In terms of the stresses acting on the diaphragm edge as a
result of the diaphragm deflection, the elliptical geometry of-
fers a lower stress level near the major axis edge compared to
the circular diaphragm geometry (Timoshenko, 1940). This
fact can be exploited when bonding the capacitor terminals;
that is, the bonding and isolating substance (SU-8) can be
developed over that low stress area. Feng and Farris (2003)
show that the process of fabricating SU-8 can change its me-
chanical properties. In this research, it is assumed that the
SU-8 mechanical properties and shear bonding strength are
as presented by Pang et al. (2008) and Guerin (2008) respec-
tively. This technique improves the overall sensor robustness
and reduces the temperature sensitivity of the transducer. As
www.j-sens-sens-syst.net/5/95/2016/ J. Sens. Sens. Syst., 5, 95–112, 2016

102 A. E. Kubba et al.: A micro-capacitive pressure sensor design and modelling
Table 1. Circular and elliptical diaphragms’ design parameters.
21
properties and shear bonding strength are as presented by (Pang, Zhao et al. 2008) and Dr
Louis J. Guerin (Guerin) respectively. This technique improves the overall sensor robustness
and reduces the temperature sensitivity of the transducer. As these stresses are rather difficult
to calculate manually, particularly the calculations of the thermal stresses’ effect, numerical
simulations with COMSOL software were used. The numerical results are presented in
section 4.3.
The dimensions and bi-dimensional Silicon elastic properties for plate bending (Hopcroft, Nix
et al. 2010) of the circular and elliptical diaphragms are shown in Table 1. The radii of the
elliptical diaphragm are calculated using equations (5) and (6); where αSi and αSU-8 are the
Silicon’s and SU-8 coefficients of thermal expansion (CTE) respectively. Providing that
Silicon is anisotropic material, and a Silicon wafer orientation of (100) is the most common
case of MEMS fabrication, Silicon mechanical properties presented in (Hopcroft, Nix et al.
2010), which are also proven experimentally by (Boyd and Uttamchandani 2012), were
applied in COMSOL simulations. However, in the analytical calculations, values were used
assuming plate bending for <110> in (100) Silicon to simplify initial design calculations.
Table 1 Circular and elliptical diaphragms’ design parameters.
Parameter Value
ao 1.25 mm
a 1.767767 mm
b 0.883883 mm
h 100 μm
ESi[plate bending]* 170 GPa
ESU-8 4.4 GPa
νSi[plate bending]* 0.064
νSU-8 0.22
αSi 2.6 (ppm °C -1)
αSU-8 52 (ppm °C -1)
(εr)SU-8 3 *
for analytical calculations only.
these stresses are rather difficult to calculate manually, par-
ticularly the calculations of the thermal stresses’ effect, nu-
merical simulations with COMSOL software were used. The
numerical results are presented in Sect. 4.3.
The dimensions and bi-dimensional silicon elastic proper-
ties for plate bending (Hopcroft et al., 2010) of the circular
and elliptical diaphragms are shown in Table 1. The radii of
the elliptical diaphragm are calculated using Eqs. (5) and (6),
where αSi and αSU−8 are the silicon and SU-8 coefficients of
thermal expansion (CTEs) respectively. Provided that silicon
is an anisotropic material, and that a silicon wafer orienta-
tion of (100) is the most common case of MEMS fabrica-
tion, silicon mechanical properties presented in Hopcroft et
al. (2010), which are also proven experimentally by Boyd
and Uttamchandani (2012), were applied in COMSOL simu-
lations. However, in the analytical calculations, values were
used assuming plate bending for <110>in (100) silicon to
simplify initial design calculations.
4.2 Analytical capacitance modelling and calculations
By considering the sensor schematic illustrated in Fig. 10,
the capacitance enclosed between the stationary plate and a
clamped circular deformable diaphragm subjected to a uni-
formly distributed pressure can be obtained:
C(p)= 8πεoεr
√D
doptan−1
(−a2o
8
√p
doD
), (7)
where εo is the free space permittivity and equals
8.854× 10⁻¹² in Farad per metre (F m−1), εr is the relative
permittivity of the dielectric material in between the capaci-
tor electrodes,D is the flexural rigidity in N m2, and p is the
pressure in Pa.
In the case of the elliptical diaphragm, the capacitance ex-
pression can be obtained by defining the diaphragm radius
Figure 12. Ellipse border representation using the polar coordinate
system.
using the polar coordinate system with the origin at the cen-
tre of the ellipse (Fig. 12), and then by integrating over the
whole oval area using double integration. This results in a
rather complicated mathematical expression:
C(p)= εoεr
2π∫0
relp∫0
rdrdθ
do+w0
(1−
(r cosθ )2
a2 −(r sinθ )2
b2
)2, (8)
where r and θ are the polar coordinates at which diaphragm
deflection is calculated in m and rad respectively, relp is the
ellipse radius at a certain angular position θ in m, and w0 is
the central deflection of the diaphragm.
Wolfram Mathematics software4 was used to solve the first
integral of Eq. (8), and it can be seen that a numerical inte-
gration could be a better choice to achieve a useful result (see
Appendix A). Attempts to solve Eq. (8) with MATLAB tools
were not successful for the whole pressure range, and there-
fore FEA tools (COMSOL) were used to evaluate the integral
over a range of pressures. In order to find out COMSOL’s ac-
curacy, the circular diaphragm results from both analytical
and FEA analyses are compared.
Due to the symmetrical nature of the three designs stud-
ied in this research, COMSOL simulation was undertaken
for a quarter of the sensors’ geometries to accelerate sim-
ulation time and to improve simulation accuracy. Three-
dimensional views of a quarter of the three diaphragm de-
signs’ capacitive pressure sensor configurations are shown in
Figs. 13, 14, and 15 respectively.
In order to evaluate the total capacitance of the sensor
shown in Fig. 13, the parasitic capacitance has to be cal-
culated, that is, the capacitance enclosed between the up-
per plate and the sealing plate excluding the deformable di-
aphragm. Details of the analytical calculations of the para-
sitic capacitance, 19.59 pF, are presented in Appendix A. The
elliptical diaphragm design has the same area as the circular
design but with an aspect ratio of 2 : 1 (Fig. 14); therefore,
both designs share the same parasitic capacitance value. The
capacitance–pressure curve of the circular diaphragm pres-
sure sensor presented in Fig. 13 is shown in Fig. 16. These
data were calculated both analytically using MATLAB and
4http://integrals.wolfram.com
J. Sens. Sens. Syst., 5, 95–112, 2016 www.j-sens-sens-syst.net/5/95/2016/

A. E. Kubba et al.: A micro-capacitive pressure sensor design and modelling 103
Figure 13. A three-dimensional view of a quarter of the circular diaphragm pressure sensor.
numerically using COMSOL – to be illustrated in the follow-
ing section. Having the same area in both the elliptical and
the circular diaphragm pressure sensor designs, the initial –
0 Pa – capacitance values are identical and equal to 41.32 pF.
In the elliptical diaphragm design the MATLAB code only
converges at 1.5 MPa applied pressure and results in a ca-
pacitance value of 36.63 pF. This shows that the elliptical
diaphragm design has less change in the capacitance value
within the same pressure range, that is, less sensitivity and
high sensor bias to the output signal range ratio. To increase
the sensor’s output signal range to bias ratio, the area of the
sensor upper electrode can be reduced. That is the case in the
third design, shown in Fig. 15, where only 70 % of the el-
liptical diaphragm is the functional capacitor area. Thermal
response and stress levels in all the designs have to be in-
vestigated. This can be a rather complicated task for manual
calculation, and therefore numerical analysis is employed as
the second best alternative. The following section presents
numerically simulated results, using COMSOL software, of
the mechanical and electrical variables for all three designs’
parameters.
4.3 Numerical analysis
In this section, initially, the first design (Fig. 13) simulation
results are compared with the analytical results to check the
reliability of the FEA results. Then, the second and third de-
signs are simulated using FEA, and all three designs are com-
pared in order to select the most suitable one for the TPMS
application. Having the three designs symmetrically around
x−z and y−z planes, there are two main quantities between
the first design simulation results and the analytical results:
the parasitic capacitance and the diaphragm deflection.
The parasitic capacitance was found analytically to be
equal to 19.59 and 17.46 pF using FEA. This is due to the
approximation made by the software by replacing arcs with
sets of straight lines giving slightly smaller areas for both the
diaphragm and SU-8 layer. This difference can be treated as
bias, or offset, error, and therefore it will not affect the sensor
sensitivity calculations.
Regarding the diaphragm deflection, it is worth mention-
ing that the analytical diaphragm deformation analysis for the
first design is based on a clamped-edge mounting condition,
which might not be the exact case for how the diaphragm
is fixed onto the sensor substrate. Having the diaphragm
bonded from one side, its bending stiffness under uniform
pressure is less than the clamped-edge mounting stiffness.
For this reason, FEA results might give a higher diaphragm
deflection under a certain pressure than that obtained using
the analytical analysis described in Sect. 4.1 (see Fig. 16).
It can be seen that a slightly higher central deflection (wo) is
obtained compared to the calculated one using clamped-edge
mounting, in which higher flexural rigidity exists.
The temperature sensitivity of the sensor-resulting capaci-
tance for the three designs is shown in Fig. 19.
The reasonable agreement between the analytical results
and the numerical results obtained for design 1 supports the
use of FEA simulations for designs 2 and 3. Diaphragm de-
www.j-sens-sens-syst.net/5/95/2016/ J. Sens. Sens. Syst., 5, 95–112, 2016

104 A. E. Kubba et al.: A micro-capacitive pressure sensor design and modelling
Figure 14. A three-dimensional view of a quarter of the elliptical diaphragm pressure sensor.
Figure 15. A three-dimensional view of a quarter of the narrowed elliptical diaphragm pressure sensor.
J. Sens. Sens. Syst., 5, 95–112, 2016 www.j-sens-sens-syst.net/5/95/2016/

A. E. Kubba et al.: A micro-capacitive pressure sensor design and modelling 105
Figure 16. Capacitance–pressure curve of the circular diaphragm
in design 1 using FEA.
Figure 17. A quarter of the elliptical diaphragm displacement in
design 2 using FEA.
formation and the sensor output signal at 20 and 100 ◦C for
designs 1 and 2 are shown in Figs. 17–26. The misalignment
between the analytical and numerical results for design 1 is
attributed to the assumption of isotropic behaviour in the di-
aphragm deflection calculations, whereas COMSOL applies
the actual anisotropic mechanical properties of a (100) plane
oriented silicon wafer as illustrated in Hopcroft et al. (2010).
By comparing the output signal of design 2 with design 3,
it can be seen that design 3 offers lower bias and lower tem-
perature sensitivity on the output capacitance. This is at-
tributed to the smaller parasitic capacitance caused by the
SU-8 layer. In addition, the simulation results listed in Ta-
ble 2 show that design 3 has the lowest stress levels among all
three designs, particularly the bonding shear stress between
Si and SU-8, which should not exceed 17.15 MPa (Pang et
al., 2008). Bonding surface shear stress in the presented de-
signs results from the difference in thermal expansion be-
tween SU-8 and Si. It is determined within the surface using
COMSOL after increasing the temperature by 80 ◦C.
Figure 18. A quarter of the elliptical diaphragm displacement in
design 3 using FEA.
Figure 19. Temperature effect on the output signal in design 3 using
FEA.
5 MEMS capacitive pressure sensor
micro-fabrication
This section presents suggested micro-fabrication processes
for making the designed MEMS pressure sensor, that is, de-
sign 3. However, due to the limited budget of this research
project and the lack of essential micro-fabrication equipment
needed for this design, there were no micro-fabrication pro-
cesses involved in the study. Therefore, the following pro-
cess flow gives only the general, and not detailed, micro-
fabrication steps involved in making the designed micro-
pressure sensor, as it is not the objective of this research.
Silicon is a dominant material in the semi-inductor indus-
try due to its availability, low costs, suitability to the require-
ments of a wide range of mechanical and electrical proper-
ties, readiness of mature batch fabrication techniques, and the
potential for integration with electronic circuitry (Petersen,
1982; Beeby et al., 2004; Hsu, 2008). For these reasons, sili-
con is employed in the proposed micro-pressure sensor in the
diaphragm, the conductive plates (electrodes) of the capaci-
tor, and the vacuum chamber of the sensor.
www.j-sens-sens-syst.net/5/95/2016/ J. Sens. Sens. Syst., 5, 95–112, 2016
106 A. E. Kubba et al.: A micro-capacitive pressure sensor design and modelling
Table 2. A summarized comparison of the three capacitive pressure sensor designs.
Item Design 1 Design 2 Design 3
Property T = 20 ◦C T = 100 ◦C T = 20 ◦C T = 100 ◦C T = 20 ◦C T = 100 ◦CS
U-8
σmax (Von Mises) 1.48 58 2.4 44.44 0.12 40.17
(MPa)
Bonding surface 0.05 9.85 0.11 2.35 0.002 0.827
τmax (MPa)
Si σmax (Von Mises) 171.17 191 111 120.23 113.58 119.86
(MPa)
Average sensitivity 0.558 0.39 0.386
(pF bar−1)a
1C/C −0.22 −0.155 −0.208
a Sensitivity was averaged by considering the slope of the best fitting straight line, i.e. by linear regression.
The photolithography processes required in the proposed
design are mainly etching the vacuum cavity in the lower
part of the sensor structure and etching the upper stationary
plate in order to allow air pressure to pass to the pressure
sensitive diaphragm and to determine the overlapping surface
area between the two capacitor plates.
In order to construct an absolute capacitive pressure sen-
sor, bonding between the sensor layers is essential. The vac-
uum chamber has to be sealed hermitically and be able to
withstand temperature variation. This can be done by first
sealing the vacuum chamber and then isolating the capac-
itive electrodes. From the literature, one reliable bonding
technique is anodic bonding, which is the most suited bond-
ing method for sealing the vacuum chamber in the proposed
micro-pressure sensor. Silicon-to-silicon anodic bonding can
be obtained by applying sputtered borosilicate glass as a thin
film layer on either of the silicon surfaces to be bonded, as
demonstrated in Chapter 9 in Halbo and Ohlckers (1995). In
the proposed design, a cross section is shown in Fig. 20, the
vacuum chamber is sealed hermetically using anodic bond-
ing, and the electrodes are bonded, and isolated, using SU-8
photoresist. SU-8 is low cost, easy to process, and a good
isolation material for capacitive pressure sensor application,
and it can work as an adhesive bonder too (Chang and Allen,
2004; Pang et al., 2008).
The main micro-fabrication steps include wet etching for
Si, Si to Si anodic bonding, and Si to Si adhesive bonding
using SU-8 (see Fig. 20).
6 Sensor read-out circuitry
This section presents a read-out and low power short-range
transmission circuit suited to capacitive sensors. This circuit
is based on a negative resistance lambda diode RF oscillator
which contains a tuned LC circuit for both measurement and
transmission purposes.
Figure 20. A suggested micro-machining process flow of the de-
signed MEMS pressure sensor.
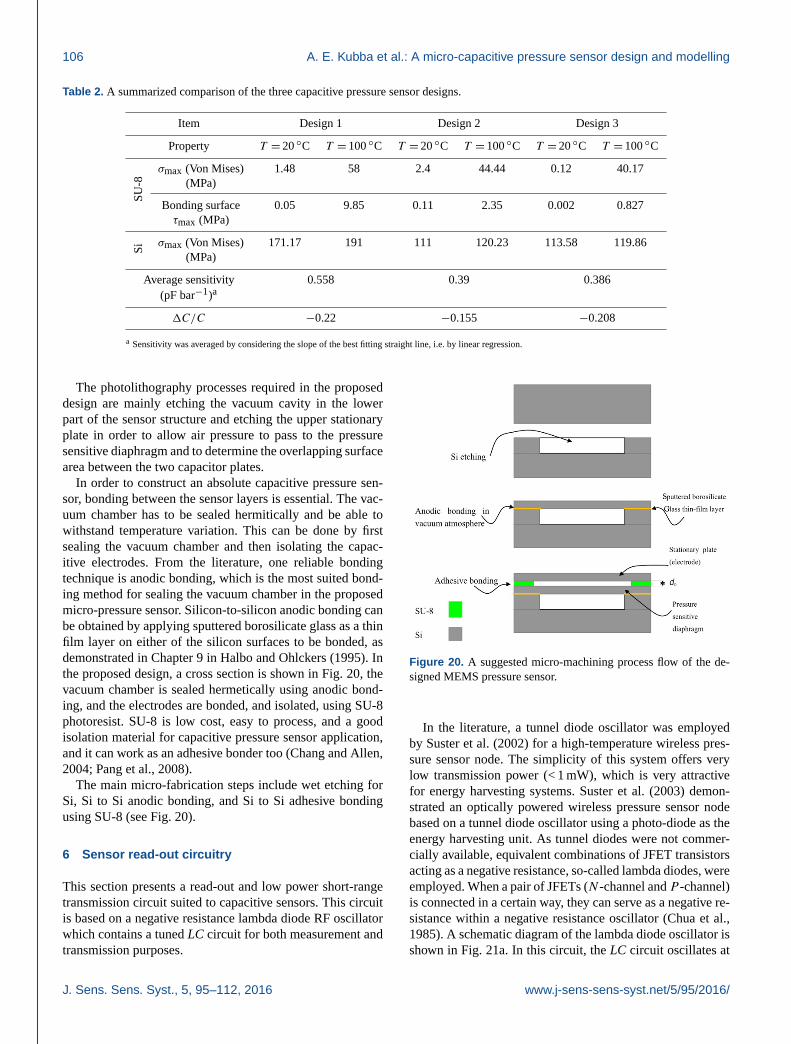
In the literature, a tunnel diode oscillator was employed
by Suster et al. (2002) for a high-temperature wireless pres-
sure sensor node. The simplicity of this system offers very
low transmission power (< 1 mW), which is very attractive
for energy harvesting systems. Suster et al. (2003) demon-
strated an optically powered wireless pressure sensor node
based on a tunnel diode oscillator using a photo-diode as the
energy harvesting unit. As tunnel diodes were not commer-
cially available, equivalent combinations of JFET transistors
acting as a negative resistance, so-called lambda diodes, were
employed. When a pair of JFETs (N -channel and P -channel)
is connected in a certain way, they can serve as a negative re-
sistance within a negative resistance oscillator (Chua et al.,
1985). A schematic diagram of the lambda diode oscillator is
shown in Fig. 21a. In this circuit, the LC circuit oscillates at
J. Sens. Sens. Syst., 5, 95–112, 2016 www.j-sens-sens-syst.net/5/95/2016/
A. E. Kubba et al.: A micro-capacitive pressure sensor design and modelling 107
Figure 21. (a) Negative resistance oscillator schematic; (b) capacitive sensor read-out and transmission circuit. Electronic circuit design
published by Butler (1997).
Figure 22. The 2N3819 and 2N3820 JFET pair lambda diode characteristic. Electronic circuit design published by Butler (1997).
Figure 23. The 2N5462 and BF244B JFET pair lambda diode characteristic. Electronic circuit design published by Butler (1997).
www.j-sens-sens-syst.net/5/95/2016/ J. Sens. Sens. Syst., 5, 95–112, 2016

108 A. E. Kubba et al.: A micro-capacitive pressure sensor design and modelling
Figure 24. Loop antenna schematic.
Figure 25. Predicted first harmonic oscillation frequency of the
lambda diode oscillator when its tuning circuit contains the design 3
capacitive pressure sensor and the loop antenna of Fig. 24.
resonance frequency and its harmonics (multiples), as shown
in the equation below:
f = n1
2π√LC;n= 1,2,3, . . .∞. (9)
When the applied voltage is within the negative resistance
regain of the contained lambda diode, which is in parallel
with the LC circuit, oscillation frequency might not however
follow Eq. (9) exactly. Two JFETs pairs were tested experi-
mentally and their voltage-current characteristics are shown
in Figs. 22 and 23.
A variable capacitor may act as the capacitor in the LC
circuit as shown in Fig. 21b; the tuning frequency will vary
according to the capacitance values and the capacitance value
can be found by measuring the oscillator resonance fre-
quency. The variable capacitor can be a capacitive sensor, and
therefore the oscillation frequency can reflect the measured
pressure value. The second part of the LC tuning circuit is
the inductor, which in this design acts as the antenna of the
oscillator, or the transmitter, and an external receiver with an
identical antenna can detect the oscillation frequency.
The inductance of a circular loop antenna containsN iden-
tical loops, shown in Fig. 24, and can be approximated using
Figure 26. Lambda diode oscillator transmitted and received sig-
nals conducted using a digital storage oscilloscope: (a) transmitted
signal; (b) received signal.
the following formula (Paul, 2010):
LN loops∼=N
2µrµ0D
2
(ln
4D
rw− 2
), (10)
where µr is the relative permeability, in this case essentially
for air, and equals 1, µ0 is the permeability of the free space
and equals 4π × 10−7 (H m−1), D is the loop diameter in m,
and rw is the wire diameter in m.
Given that N equals 2, rw equals 0.6 mm and D equals
80 mm, using Eq. (10), the inductance of the loop antenna
will be approximately 860 (nH).
If the simulated capacitive pressure sensor (design 3) is
substituted as the variable capacitor in the tuning circuit of
the lambda diode oscillator shown in Fig. 21a, and using
the estimated inductance of the loop antenna, that is, 860
(nH), the first harmonic oscillation frequency from Eq. (9)
of the oscillator will be obtained as shown in Fig. 25. This
graph shows an average sensitivity of 1.4 MHz pF−1, mean-
ing a sensitivity of 0.543 MHz bar−1 for the simulated (de-
J. Sens. Sens. Syst., 5, 95–112, 2016 www.j-sens-sens-syst.net/5/95/2016/

A. E. Kubba et al.: A micro-capacitive pressure sensor design and modelling 109
sign 3) MEMS capacitive pressure sensor. It is worth men-
tioning that the parasitic capacitance of the loop antenna was
neglected.
Figure 26 shows the lambda diode oscillator output signal
as measured using a digital storage oscilloscope (DSO), man-
ufactured by TENMA model no. 72-7240. The tuning circuit
contains a trimmer capacitor (approximate range 10–50 pF)
to simulate the variable capacitance of the MEMS pressure
sensor and the loop antenna shown in Fig. 24. The condi-
tions at which these results were obtained were that both the
transmitting and receiving antennas were identical (0.6 mm
wire diameter, 80 mm coil diameter, two turns) and mounted
coaxially and separated by 110 mm. The receiver antenna
was connected directly to the DSO probes with no ampli-
fication or filtering circuits.
Despite the approximate value of the trimmer capacitor
capacitance range, it was observed that the oscillation fre-
quency changes noticeably, approximately by 10 MHz over
the trimmer capacitor capacitance range, and can be em-
ployed for measuring the variable capacitor value and ulti-
mately the pressure value when a capacitive pressure trans-
ducer is employed. It was also noticed that there is a fre-
quency difference of approximately 900 kHz between the
transmitted and received signals, which can be treated as an
offset in the very basic receiver unit.
7 Conclusions
In this article, three different micro-capacitive pressure sen-
sors are compared and a read-out and transmission circuit for
a capacitive transducer are presented.
The comparison between the three simulated diaphragm-
based pressure transducers shows that although a circular
shaped diaphragm has higher pressure sensitivity than an el-
liptical one, an elliptical shaped diaphragm can offer higher
thermal stability and less bonding stresses compared to a cir-
cular diaphragm, which can be a useful property for a pres-
sure sensor, particularly when employed in a harsh environ-
ment, e.g. tyre pressure monitoring.
The presented read-out circuit is selected for its simplicity
and its extremely low power consumption is suitable as part
of a wireless sensor node powered by energy harvesting.
In a separate article (Kubba and Jiang, 2013), the au-
thor developed a vibration-based energy harvester which was
eventually used to power the presented lambda diode read-
out and transmission unit.
www.j-sens-sens-syst.net/5/95/2016/ J. Sens. Sens. Syst., 5, 95–112, 2016

110 A. E. Kubba et al.: A micro-capacitive pressure sensor design and modelling
Appendix A: Analytical integration formulae
The following integrations were solved with the aid of an
open-access online integral solver5.
∫e x
d +w(
1−(x cos(t))2
a2 −(x sin(t))2
b2
)2dx =
(e a2 b2 tan−1
( (2 a2 b2
√d((b2−a2
)cos2t+a2
+ b2))√
w ((b2−a2)cos2t+a2+ b2)2(x2(a2− b2)cos2t+ a2(2b2− x2)−b2 x2)
))(√d
√w((b2− a2
)cos2t + a2+ b2
)2)where e is the permittivity of free space, x = r , d is the ca-
pacitance initial air gap, w =w max, t = theta, and a and b
are the major and minor radii respectively.
Appendix B: Calculations for the parasitic
capacitance and its surface areas
Figure B1.
Cp = CSU−8+Cair+= εfreespaceεSU−8 (ASU−8/10µm)+εair (Aair/10µm)= 19.59pF
Csensor = εair (Aair/2µm)= 21.7pF
Co = Csensor+Cp = 41.3pF
5Wolfram, available at: http://integrals.wolfram.com/index.jsp,
last access: 12 April 2012.
J. Sens. Sens. Syst., 5, 95–112, 2016 www.j-sens-sens-syst.net/5/95/2016/
A. E. Kubba et al.: A micro-capacitive pressure sensor design and modelling 111
Acknowledgements. The author would like to show his appreci-
ation for all research and staff members at Mechanical Engineering
for their valuable assistance and guidance towards accomplishing
this project.
Edited by: R. Kirchner
Reviewed by: two anonymous referees
References
A Measurement Specialties company Sensoric, Miniature SMD
pressure sensor, Series Datasheet, available at: http://www.
nickbelsondesign.co.uk/MS5401-AM.pdf (last access: 18 April
2012), 2009.
APOLLO: Intelligent Tyre Systems – State of the Art and Potential
Technologies, IST-2001-34372, Deliverable D7, 2003.
APOLLO: Final Report, Intelligent Tyre for Accident–Free Traffic,
Technical Research Centre of Finland (VTT), IST-2001–3437,
Deliverable 22/23, 2005.
Bao, M. H.: Micro mechanical transducers: pressure sensors, ac-
celerometers, and gyroscopes, Elsevier, Amsterdam, the Nether-
lands, 2000.
Barlian, A. A., Park, W. T., Mallon, J. R., Rastegar, A. J., and Pruitt,
B. L.: Review: Semiconductor Piezoresistance for Microsystems,
Proceedings of the IEEE, 97, 513–552, 2009.
Beeby, S., Ensell, G., Kraft, M., and White, N.: MEMS Mechanical
Sensors, Artech House Publishers, Norwood, MA, USA, 2004.
Bever, T., Kandler, M., and Valldorf, J.: Solutions for tire pressure
monitoring systems, 7th Int. Conf. Adv. Microsyst. Automot.
Appl., 22–23 May 2003, Teltow/Berlin, Springer, Berlin, Ger-
many, 2003.
Boyd, E. J. and Uttamchandani, D.: Measurement of the Anisotropy
of Young’s Modulus in Single-Crystal Silicon, J. Microelec-
tromech. S., 21, 243–249, 2012.
Bracke, W., Puers, R., and Hoof, C. V.: Ultra Low Power Capacitive
Sensor Interfaces, Springer, Dordrecht, the Netherlands, 2007.
Brusarosco, M., Cigada, A., and Manzoni, S.: Experimental investi-
gation of tyre dynamics by means of MEMS accelerometers fixed
on the liner, Vehicle Syst. Dynam., 46, 1013–1028, 2008.
Brusarosco, M., Cigada, A., and Manzoni, S.: Measurement and
analysis of tyre and tread block dynamics due to contact phe-
nomena, Vehicle Syst. Dynam., 49, 855–869, 2010.
Butler, L.(VK5BR) – A Dip Meter Using the Lambda Nega-
tive Resistance Circuit – Amateur Radio, January 1997, avail-
able at: http://users.tpg.com.au/users/ldbutler/NegResDipMeter.
htm (last access: 30 December 2015), 1997.
Cavalloni, C., Berg, J., Krueger, S., and Gessner, W.: Overview:
Principles and Technologies for Pressure Sensors for Automotive
Applications, in: Advanced Microsystems for Automotive Appli-
cations Yearbook 2002, edited by: Krueger, S. and Gessener, W.,
Springer, Berlin-Heidelberg, Germany, 232–276, 2002.
Chang, S.-P. and Allen, M. G.: Demonstration for integrating ca-
pacitive pressure sensors with read-out circuitry on stainless steel
substrate, Sensor. Actuat. A-Phys., 116, 195–204, 2004.
Chien-Hung, W., Zorman, C. A., and Mehregany, M.: Fabrication
and testing of bulk micromachined silicon carbide piezoresistive
pressure sensors for high temperature applications, IEEE Sens.
J., 6, 316–324, 2006.
Chin, T.-L., Irving, P. Z., Oppenheim, J., and Greve, D. W.: Surface
acoustic wave devices for wireless strain measurement, Sensors
and Smart Structures Technologies for Civil, Mechanical, and
Aerospace Systems 2010, Masayoshi Tomizuka, SPIE, 2010.
Chua, L., Juebang, Y., and Youying, Y.: Bipolar – JFET – MOSFET
negative resistance devices, IEEE T. Circuits Syst., 32, 46–61,
1985.
Cullinan, M. A., Panas, R. M., DiBiasio, C. M., and Culpepper,
M. L.: Scaling electromechanical sensors down to the nanoscale,
Sensor. Actuat. A-Phys., 187, 162–173, 2012.
Dixon, B., Kalinin, V., Beckley, J., and Lohr, R.: A Second Genera-
tion In-Car Tire Pressure Monitoring System Based on Wireless
Passive SAW Sensors, International Frequency Control Sympo-
sium and Exposition, June 2006, Miami, FL, USA, 374–380,
2006.
Druck: Resonant Pressure Transducer, RPT Series Datasheet, avail-
able at: http://www.druck.com/, last access: 19 January 2012.
Eaton, W. P. and Smith, J. H.: Micromachined pressure sensors: re-
view and recent developments, Smart Mater. Struct., 6, 530–539,
1997.
Eddy, D. S. and Sparks, D. R.: Application of MEMS technology in
automotive sensors and actuators, Proceedings of the IEEE, 86,
1747–1755, 1998.
Feng, R. and Farris, R. J.: Influence of processing conditions on the
thermal and mechanical properties of SU8 negative photoresist
coatings, J. Micromech. Microeng., 13, 80–88, 2003.
Fonseca, M. A.: Polymer/ceramic wireless mems pressure sensors
for harsh environments: high temperature and biomedical ap-
plications, PhD, Georgia Institute of Technology, Atlanta, GA,
USA, 2007.
Fonseca, M. A., English, J. M., von Arx, M., and Allen, M.
G.: Wireless micromachined ceramic pressure sensor for high-
temperature applications, J. Microelectromech. S., 11, 337–343,
2002.
Fragiacomo, G.: Micromachined capacitive pressure sensor with
signal conditioning electronics, PhD, Technical University of
Denmark, Copenhagen, Denmark, 2012.
Frank, R.: Understanding smart sensors, Artech House, Norwood,
MA, USA, 2000.
Gad-el-Hak, M.: The MEMS handbook, CRC Press LLC, FL, USA,
2002.
Greenwood, J. C.: Etched silicon vibrating senso, J. Phys. E Sci.
Instrum., 17, 650–652, 1984.
Grossmann, R.: Wireless measurement of tire pressure with passive
quartz sensors, P. Soc. Photo-Opt. Ins., 3670, 214–222, 1999.
Guerin, L. J.: The SU8 homepage, available at: http://www.oocities.
org/guerinlj/, last access: 10 July 2008.
Halbo, L. and Ohlckers, P.: Electronic Components, Packaging and
Production, University of Oslo, Oslo, Norway, 1995.
Hannan, M. A., Hussain, A., Mohamed, A., and Samad, S. A.:
TPMS Data Analysis for Enhancing Intelligent Vehicle Perfor-
mance, J. Appl. Sci., 8, 1926–1938,
Hew, Y., Deshmukh, S., and Huang, H.: A wireless strain sensor
consumes less than 10 mW, Smart Mater. Struct., 20, 10, 2011.
Hopcroft, M. A., Nix, W. D., and Kenny, T. W.: What is the Young’s
Modulus of Silicon?, J. Microelectromech. S, 19, 229–238, 2010.
Hsu, T.-R.: MEMS & Microsystems: Design, Manufacture, and
Nanoscale Engineering, John Wiley & Sons Inc., Hoboken, NJ,
USA, 2008.
www.j-sens-sens-syst.net/5/95/2016/ J. Sens. Sens. Syst., 5, 95–112, 2016

112 A. E. Kubba et al.: A micro-capacitive pressure sensor design and modelling
Kalinin, V.: Passive wireless strain and temperature sensors based
on SAW devices, Radio and Wireless Conference, IEEE, 2004.
Kolle, C., Scherr, W., Hammerschmidt, D., Pichler, G., Motz,
M., Schaffer, B., Forster, B., and Ausserlechner, U.: Ultra low-
power monolithically integrated, capacitive pressure sensor for
tire pressure monitoring, Sensors, 2004, Proceedings of IEEE,
2004.
Kubba, A. and Jiang, K.: Efficiency Enhancement of a Cantilever-
Based Vibration Energy Harvester, Sensors, 14, 188–211, 2013.
Kubba, A. and Jiang, K.: A Comprehensive Study on Technologies
of Tyre Monitoring Systems and Possible Energy Solutions, Sen-
sors, 14, 10306–10345, 2014.
Lee, Y. S. and Wise, K. D.: A batch-fabricated silicon capacitive
pressure transducer with low temperature sensitivity, IEEE T.
Electron. Dev., 29, 42–48, 1982.
Li, T., Hu, H., Xu, G., Zhu, K., and Fang, L.: Pressure and Temper-
ature Microsensor Based on Surface Acoustic Wave in TPMS,
Acoustic Waves, D. Dissanayake, InTech, 341–357, 2010.
Li Sainan, L. T., Wei, W., Yingping, H., Tingli, Z., and Jijun, X.:
A novel SOI pressure sensor for high temperature application,
Journal of Semiconductors, 36, 14014–14018, 2015.
MarketsandMarkets: Pressure Sensor Market – Global Forecast to
2020, Vancouver, WA, USA, 2015.
Muhammad, H. B.: Development of a bio-inspired MEMS based
tactile sensor array for an artificial finger, PhD, University of
Birmingham, Birmingham, UK, 2012.
Nwagboso, C.: Automotive Sensory Systems, Springer, Dordrecht,
the Netherlands, 2012.
Oh, J.-G., Choi, B., and Lee, S.-Y.: SAW based passive sensor with
passive signal conditioning using MEMS A/D converter, Sens.
Actuat. A-Phys., 141, 631–639, 2008.
Pang, C., Zhao, Z., Du, L., and Fang, Z.: Adhesive bonding with
SU-8 in a vacuum for capacitive pressure sensors, Sens. Actuat.
A-Phys., 147, 672–676, 2008.
Paul, C. R.: Inductance: Loop and Partial, John Wiley & Sons Inc.,
Hoboken, NJ, USA, 2010.
Petersen, K. E.: Silicon as a mechanical material, Proceedings of
the IEEE, 70, 420–457, 1982.
Pohl, A., Ostermayer, G., Reindl, L., and Seifert, F.: Monitoring
the tire pressure at cars using passive SAW sensors, Ultrasonics
Symposium, 5–8 October 1997, Toronto, ON, Canada, 1, 471–
474, 1997.
Pohl, A., Springer, A., Reindl, L., Seifert, F., and Weigel, R.: New
applications of wirelessly interrogable passive SAW sensors,
IEEE MTT-S., 7–12 June 1998, Baltimore, MD, USA, 2, 503–
506, 1998.
Reindl, L., Scholl, G., Ostertag, T., Ruppel, C. C. W., Bulst, W.
E., and Seifert, F.: SAW devices as wireless passive sensors, Ul-
trasonics Symposium, 3–6 November 1996, San Antonio, TX,
USA, 1, 363–367, 1996.
Rudolf, S. S. F. and Hoogerwerf, A.: Components for battery-
powered wireless tire pressure and temperature monitoring sys-
tems, in Proc. SensorExpo, Detroit, USA, 15–20, 1997.
Schimetta, G., Dollinger, F., and Weigel, R.: A wireless pressure-
measurement system using a SAW hybrid sensor, IEEE T. Mi-
crow. Theory., 48, 2730–2735, 2000.
Suster, M., Young, D. J., and Ko, W. H.: Micro-power wireless
transmitter for high-temperature MEMS sensing and communi-
cation applications, The Fifteenth IEEE International Conference
on Micro Electro Mechanical Systems, 24 January 2002, Las Ve-
gas, NV, USA, 641–644, 2002.
Suster, M., Ko, W. H., and Young, D. J.: Optically-powered wire-
less transmitter for high-temperature MEMS sensing and com-
munication, TRANSDUCERS, 12th International Conference on
Solid-State Sensors, Actuators and Microsystems, 8–12 June
2003, Boston, MA, USA, 2, 1703–1706, 2003.
Swett, D. W.: Apparatus and method for generating broad band-
width acoustic energy, US Patent 0069708A1, 2012.
Technavio: Global Tire Pressure Monitoring System (TPMS) Mar-
ket 2015–2019, London, UK, 68 pp., 2015.
Thurau, J. and Ruohio, J.: Silicon Capacitive Absolute Pressure
Sensor Elements for Battery-less and Low Power Tire Pressure
Monitoring, Advanced Microsystems Automotive Applications,
Springer, New York, USA, 2004.
Tian, B., Zhao, Y., Jiang, Z., Zhang, L., Liao, N., Liu, Y., and Meng,
C.: Fabrication and Structural Design of Micro Pressure Sen-
sors for Tire Pressure Measurement Systems (TPMS), Sensors,
9, 1382–1393, 2009.
Timoshenko, S.: Theory of plates and shells, McGraw-Hill, New
York, USA, 1940.
Tsujiuchi, N., Koizumi, T., Oshibuchi, A., and Shima, I.: Rolling
Tire Vibration Caused by Road Roughness, SAE Technical pa-
pers, Grand Traverse, MI, USA, 2005.
Wang, Q. and Ko, W. H.: Modeling of touch mode capacitive sen-
sors and diaphragms, Sens. Actuat. A-Phys., 75, 230–241, 1999.
Xiangwen, Z., Zhixue, W., Leifu, G., Yunfeng, A., and Feiyue, W.:
Design considerations on intelligent tires utilizing wireless pas-
sive surface acoustic wave sensors, Fifth World Congress on In-
telligent Control and Automation, 15–19 June 2004, Hangzhou,
China, WCICA, 4, 3696–3700, 2004.
Yurish, S. Y. and Gomes, M. T. S. R.: Smart sensors and MEMS,
Kluwer Academic in cooperation with NATO Scientific Affairs
Division, Dordrecht, the Netherlands, 2005.
Zhang, X., Wang, F., Wang, Z., Wei, L., and He, D.: Intelligent tires
based on wireless passive surface acoustic wave sensors, The
7th International IEEE Conference on Intelligent Transportation
Systems, 3–6 October 2004, Washington DC, USA, 960–964.
2004.
J. Sens. Sens. Syst., 5, 95–112, 2016 www.j-sens-sens-syst.net/5/95/2016/


![Design of MEMS Capacitive Pressure Sensor for Continuous ...piezoresistive sensing technique [1, 2]. Piezoresistive pressure sensor is preferred because the properties of silicon material](https://img.pdfslide.us/doc/110x75/60e791e2d9071929211c8912/design-of-mems-capacitive-pressure-sensor-for-continuous-piezoresistive-sensing.jpg)