Embed Size (px)
Citation preview
389
Publications of the Astronomical Society of the Pacific, 115:389–409, 2003 March� 2003. The Astronomical Society of the Pacific. All rights reserved. Printed in U.S.A.
A Method of Correcting Near-Infrared Spectra for Telluric Absorption1
William D. Vacca,2 Michael C. Cushing, and John T. Rayner
Institute for Astronomy, University of Hawaii, Honolulu, HI 96822; [email protected], [email protected], [email protected]
Received 2002 October 29; accepted 2002 November 8
ABSTRACT. We present a method for correcting near-infrared medium-resolution spectra for telluricabsorption. The method makes use of a spectrum of an A0 V star, observed near in time and close in air massto the target object, and a high-resolution model of Vega, to construct a telluric correction spectrum that is freeof stellar absorption features. The technique was designed specifically to perform telluric corrections on spectraobtained with SpeX, a 0.8–5.5mm medium-resolution cross-dispersed spectrograph at the NASA InfraredTelescope Facility, and uses the fact that for medium resolutions there exist spectral regions uncontaminated byatmospheric absorption lines. However, it is also applicable (in a somewhat modified form) to spectra obtainedwith other near-infrared spectrographs. An IDL-based code that carries out the procedures is available fordownloading via the World Wide Web.
1. INTRODUCTION
Ground-based near-infrared spectroscopy (∼1–5 mm) hasalways been hampered by the strong and variable absorptionfeatures due to the Earth’s atmosphere. Even within the well-established photometric bands such asJ, H, and K,so-called telluric absorption features are present. The commonmethod used to correct for such absorption features, and toretrieve the signal of the object under observation, is to observea “telluric standard star,” near in both time and sky position(air mass) to the object, and subsequently to divide the object’sspectrum by the standard star’s spectrum during the final phasesof the reduction process.
Early A-type stars are frequently used as such telluric stan-dards, as their spectra contain relatively few metal lines, withstrengths that are generally only a few percent of the continuum.Furthermore, for A stars with little reddening, the magnitudesat all wavelengths can be deduced from a single (usuallyV-band) measurement. In addition, the near-infrared continua ofA stars can be reasonably well approximated by a blackbodywith a temperature of∼10,000 K. These latter two propertiesmake A-type stars very useful for determining the absolute fluxcalibration of the observations. However, the strong intrinsicphotospheric hydrogen (H) absorption features in the spectraof A-type stars present a substantial problem for their use astelluric standards, particularly if one is working in theI, z, Y,or H bands (where the numerous higher level lines of thePaschen and Brackett series are located), or if the observations
1 Based on observations obtained with the Infrared Telescope Facility, whichis operated by the University of Hawaii under contract to the National Aero-nautics and Space Administration.
2 Currently at the Max-Planck-Institut fu¨r Extraterrestrische Physik, Gies-senbachstrasse, 85741 Garching, Germany.
are designed to study the H lines in the spectrum of the objectof interest. One technique commonly adopted in order to pre-serve the other desirable qualities of A stars as telluric and fluxstandards is to simply interpolate over the H absorption linesin their observed spectra. However, since atmospheric absorp-tion features are certainly present at the locations of most ofthese lines, this method can lead to uncertainties in the realityof any features subsequently detected in the corrected object’sspectrum at or near the wavelengths of the stellar H lines.Furthermore, A-type stars can have rather large rotationalvelocities (upwards of 300 km s ; e.g., Abt & Morrell 1995;�1
Royer et al. 2002), which broaden the absorption lines. Thelarge number of such broad lines renders the interpolationmethod infeasible near the various H series limits.
Maiolino, Rieke, & Rieke (1996) developed a correctionmethod using G2 V stars, rather than A-type stars, as telluricstandards. Their method makes use of the high signal-to-noiseratio (S/N), high-resolution spectrum of the Sun, obtained usinga differential air mass technique at the McMath Telescope atKitt Peak National Observatory by Livingston & Wallace(1991; see also Wallace, Hinkle, & Livingston 1993), to gen-erate a telluric correction spectrum, which is then applied tothe spectrum of the object of interest. The correction spectrumis derived from the ratio of the solar spectrum (shifted to theappropriate radial velocity and convolved to the resolution ofthe observations) to the observed G2 V star spectrum. Thisratio should, in principle, remove any intrinsic stellar featuresfrom the telluric correction spectrum. Although Maiolino et al.(1996) demonstrated that this method can be reasonably suc-cessful in performing telluric corrections on moderate S/N andresolution data, there are several practical problems with it,especially when applying it to higher quality and resolutionspectra. First, the number of reasonably bright G2 V stars avail-

390 VACCA, CUSHING, & RAYNER
2003 PASP,115:389–409
TABLE 1A0 V and G2 V Stars in
SIMBAD Database
V (mag) N(A0 V) N(G2 V)
!7 . . . . . . . 364 50!8 . . . . . . . 740 171!9 . . . . . . . 1687 459!10 . . . . . . 3633 993!11 . . . . . . 4557 1165
Note.—Cumulative number ofA0 V and G2 V stars listed in theSIMBAD database as of 2000 July,as a function ofV-band magnitude.
able for use as telluric standards near any given object is lessthan the number of A-type stars, simply because G stars areinherently less luminous than A stars and catalogs of stars withwell-defined spectral classifications are based on magnitude-limited samples. This is demonstrated in Table 1, in which wehave compiled the numbers of stars listed with A0 V andG2 V spectral types in the SIMBAD database as a function ofV magnitude. The intrinsic (V�K ) color of a G2 V star is about1.5 mag; therefore, even in theK band, bright A0 V starsoutnumber G2 V stars in the database. Second, G-type starshave a large number of (relatively weak) metal lines throughouttheir spectra. Hence, the accuracy of the resulting correctionsdepends on how well the observed spectrum of the G starmatches that of the Sun; the higher the S/N and resolution ofthe data, the closer the spectral match must be for a desiredlevel of accuracy. As the strengths of the metal lines varyconsiderably with spectral type and stellar parameters, any mis-match, such as might be caused by spectral classificationinaccuracies, metal abundance differences, anomalous linestrengths, etc., will introduce spurious features into the telluriccorrection spectrum. Third, the reference solar spectrum wasobtained at a relatively low site and has large wavelength gapswhere the intrinsic spectrum could not be recovered using thedifferential air mass method. Because the depths of atmosphericabsorption features vary with elevation, this solar spectrumwould not provide a useful correction template for spectra, suchas those obtained at a high site such as Mauna Kea, whichhave recoverable flux in the regions of strong absorptionbetween the photometric passbands.
An alternative method, used, for example, by Hanson, Conti,& Rieke (1996), combines the A-star technique with that ofMaiolino et al. (1996) and involves the following steps: observeboth an A-type star and a G2 V star, normalize the spectra ofboth stars, “correct” the normalized G2 V star spectrum bydividing it by the solar spectrum, replace the regions centeredon the H lines in the normalized A-star spectrum by the cor-rected G-star spectrum, and finally divide the result into theobject’s spectrum. This is equivalent to dividing the objectspectrum by that of the A star and multiplying the result by aline-correction spectrum generated from the G2 V star and the
solar spectrum. Since the solar spectrum is used only in theregions of the H lines, the resulting correction template shouldbe more accurate than one based on the G2 V star/solar spec-trum ratio alone. Because the normalization process removesthe signature of the instrumental throughput from the observedstellar spectra, the object must be flux-calibrated separately,after the correction process, usually by multiplying the nor-malized, corrected spectrum by a blackbody with a temperatureappropriate for an A star. While this method might seem at-tractive in principle, in practice it requires observations of twosets of standards (a suitable one of which may be difficult tofind, as explained above) for each object of interest (ideally)and involves a somewhat tedious and complicated reductionprocedure, particularly if the wavelength range of interest in-cludes several absorption lines of the Pa or Br series.
Clearly, the ideal telluric standard would be one whose spec-trum is completely featureless and precisely known. In addition,such objects should be reasonably bright, fairly common, andwidely distributed on the sky, so one can be found close toany particular object of interest. While few objects satisfyingthe first criterion are known in nature, there are a limited num-ber of objects for which precise and accurate theoretical modelsare available. Vega is one such object. In this paper, we describea new method of generating a telluric correction spectrum usingobservations of A0 V stars and a high-resolution model ofVega’s intrinsic spectrum. Through a process somewhat similarto that described by Maiolino et al. (1996), this technique pre-serves the desirable qualities of A-type stars, while avoidingthe problems with the intrinsic stellar absorption lines, and doesnot require observations of G2 V stars.
The method outlined below was developed for the reductionof spectra obtained with SpeX at the NASA Infrared TelescopeFacility (IRTF) on Mauna Kea. SpeX is a medium-resolution( –2500) cross-dispersed spectrograph equippedl/Dl ∼ 200with a InSb array that provides simultaneous1024# 1024wavelength coverage over 0.8–2.4mm in one grating settingand 2.4–5.5mm in another grating setting (see Rayner et al.1998, 2003 for a full description of SpeX and its various sci-entific observing modes). Because the entire Paschen seriesand most of the Brackett series of H absorption lines are si-multaneously detected in a spectrum of any A0 V star observedwith SpeX, it was important to devise a technique that couldbe applied easily and rapidly to accurately remove all of thesefeatures from a telluric correction spectrum generated from theA0 V star spectrum. With high-quality spectra of an A0 V star,a telluric correction spectrum accurate to better than about 2%across the H lines can be quickly constructed with this tech-nique. Although designed specifically for SpeX data, themethod can also be used to correct spectra obtained with most-medium resolution ( ) near-infrared spectro-l/Dl ! 50,000graphs. A set of IDL-based routines (Spextool_extension, ver-sion 2.0), specifically designed for application to SpeX data,implements the telluric correction method described below andforms an extension to Spextool (version 2.3), a package of

TELLURIC CORRECTIONS IN NEAR-INFRARED 391
2003 PASP,115:389–409
routines written for the basic reduction of spectra obtained withSpeX (M. C. Cushing, W. D. Vacca, & J. T. Rayner 2003, inpreparation). Both sets of programs are available from the SpeXWeb page at the IRTF Web site.3 Finally, a third set of IDLroutines, constituting a general version (i.e., not specific toSpeX data) of the telluric correction code, is also availablefrom this Web page.
2. DESCRIPTION OF METHOD
We assume that the observed spectrum of any objectO(l)is given by
O(l) p [I(l) 7 T(l)] ∗ P(l) 7 Q(l), (1)
where is the intrinsic spectrum of the object, is theI(l) T(l)atmospheric (telluric) absorption spectrum, is the instru-P(l)mental profile, is the instrumental throughput, and theQ(l)asterisk denotes a convolution. Because the convolution rep-resents a smoothing of the intrinsic stellar and telluric spectra,the above equation can be rewritten as
O(l) p [I(l) ∗ P(l)] 7 [T(l) ∗ P(l)] 7 Q(l) (2)
or
O(l) p I (l) 7 R(l), (3)instr
where
I (l) p I(l) ∗ P(l) (4)instr
is the spectrum of the object observed above the atmospherewith an instrument with perfect throughput and
R(l) p [T(l) ∗ P(l)] 7 Q(l) (5)
is the telluric absorption spectrum convolved with the instrumentprofile and multiplied by the instrumental throughput. The latterrepresents the overall throughput, or response, of the atmos-phere�instrument system. We assume that is a smooth,Q(l)featureless function and therefore any observed high-frequencyvariations in must be due to either or .O(l) I(l) T(l)
The immediate objective is to determineIinstr of a specificobject from . Conversely, if for any particularO(l)/R(l) I(l)source is known a priori, and of the instrument is knownP(l)or can be determined, then the system throughput can beR(l)determined from equations (3) and (4). This factor can be sub-sequently used to determineIinstr(l) of another (target) objectfrom the observed spectrum, provided that the telluric absorp-tion spectrum does not vary substantially between the twoT(l)sets of observations. This forms the basis of both our methodand that of Maiolino et al. (1996): observations of a “telluric
3 http://irtfweb.ifa.hawaii.edu/Facility/spex.
standard,” whose intrinsic spectrum is known, to derive a sys-tem throughput curve that can then be applied to a target objectspectrum observed nearby in the sky and close in time. Since
varies with air mass and on timescales of the order ofT(l)several to tens of minutes (depending on the atmospheric con-ditions), it is clearly best to observe a telluric standard at anair mass as close as possible to that of the target object andwithin a few minutes of the observations of the target.
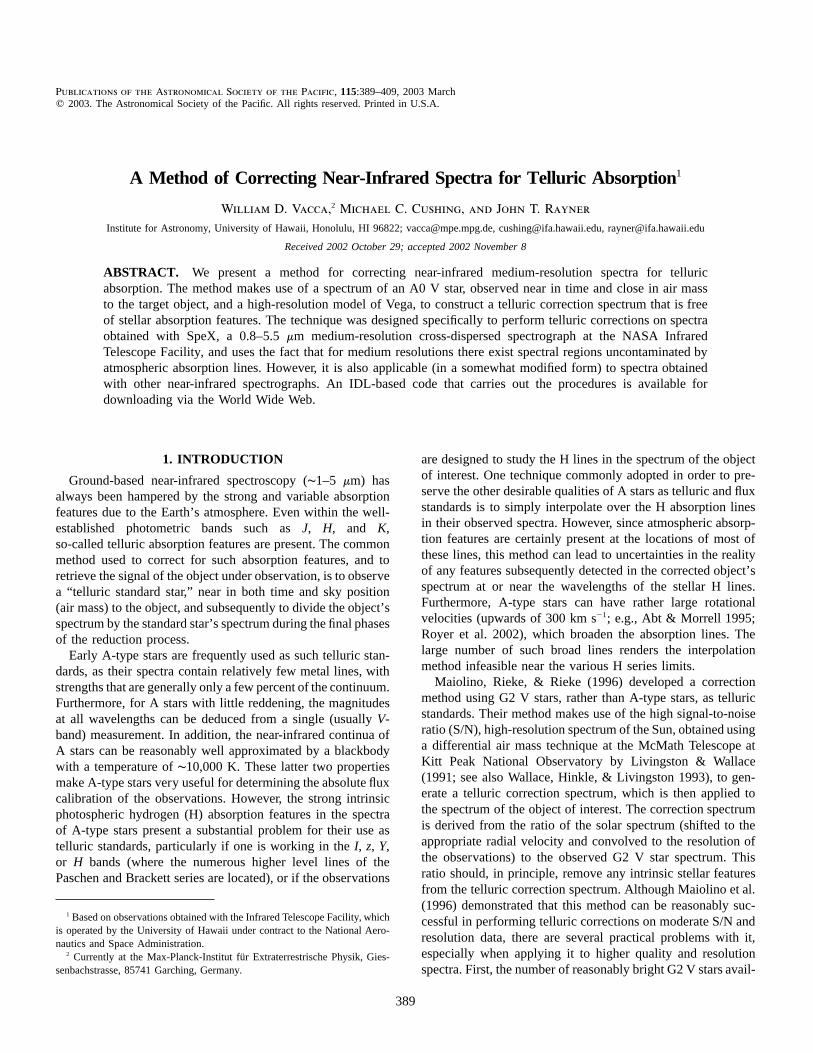
Because the metal lines in A0 V spectra are relatively in-frequent and weak (on the order of a few percent of the con-tinuum level in the near-infrared at the resolution of SpeX; see,for example, Fig. 1), the intrinsic near-infrared spectra of suchobjects consist essentially of H absorption lines and a smooth,featureless (blackbody) continuum. Thus, metal abundance var-iations do not strongly affect the appearance of the observedspectra and, except for possible differences in the widths anddepths of some of the H lines (due to different rotational ve-locities or slightly different values of the surface gravity), thespectra of all A0 V stars can be considered nearly identical toone another. It is a fortunate circumstance that Vega, the objectthat defines the zero point of the magnitude system, is also abright A0 V star whose spectrum has been accurately modeled.Assuming that the model provides an accurate representationof the intrinsic spectrum of Vega and that Vega is a goodrepresentative (an archetypal example) of the class of A0 Vstars, we can use the theoretical model to determineIinstr(l) ofany A0 V star. Hence, if each observation of a given targetobject is preceded and/or followed by an observation of anA0 V star, and if the model spectrum of Vega can be scaledand reddened to match the near-infrared magnitudes of theobserved A0 V star and modified to account for the differencesin line strengths, radial and rotational velocities, and spectralresolution, we will be in the happy situation of having at handboth the observed spectrum and intrinsic spectra andO(l) I(l)Iinstr(l) of the A0 V star. The system response functionR(l)can then be determined immediately and used to correct thetarget object’s spectrum. The difficulty then lies “only” in prop-erly modifying the model spectrum of Vega.
Modifying the model Vega spectrum involves shifting it tothe radial velocity of the observed A0 V star, scaling and red-dening it to reproduce the known magnitudes of the observedA0 V star, convolving it with a function (kernel) that broadensthe lines to the observed widths and smooths it to the observedresolution, resampling the result to the observed wavelengthscale, and altering the depths of various H lines to match thoseof the observed A0 V star. The convolution kernel is given bythe instrument profile (IP) and a (rotational) broadeningP(l)function (see below). There are at least three ways ofV(l)constructing : (1) assume a theoretical profile whose prop-P(l)erties are defined by the instrument parameters (e.g., slit width),(2) construct an empirical profile using observations of unre-solved arc lines (similar to those used to perform the wave-length calibration of the spectra), and (3) construct a profileusing the observations of the A0 V star itself. We discuss the
392 VACCA, CUSHING, & RAYNER
2003 PASP,115:389–409
Fig. 1.—Normalized model spectrum of Vega, smoothed to a resolving power of 2000 (thick line, left-hand axis).The theoretical atmospheric transmissionaround the Pad line (1.00494mm) at air mass 1.2 for typical conditions on Mauna Kea, smoothed to a resolving power of 2000 (thin line, right-hand axis). Notethat the Pad line is located in a region where atmospheric absorption is negligible.
last method in detail here and describe below a set of routinesthat implement this method for use in the reduction of dataobtained with SpeX. (The routines also allow users to adoptempirical or theoretical instrument profiles.)
We begin by selecting a wavelength region centered on anintrinsic absorption line in the observed and model A0 V spec-tra. The observed spectrum is normalized in the region of theline by fitting a low-order polynomial or a spline to the con-tinuum; a good representation of the observed continuum canbe obtained once bad pixels and the regions around any strongabsorption features are excluded from the fitting process. Thenormalization removes the signature of the instrumentalthroughput as well as the shape of the stellar continuum. Oncethe observed stellar spectrum has been normalized, the wave-length region around the absorption feature can be cross-cor-related with that from the normalized model of Vega, using atechnique similar to that described by Tonry & Davis (1979),to determine the observed radial velocity of the A0 V star. Thefull (i.e., unnormalized) model is then shifted by the estimatedradial velocity and scaled and reddened to match the observedmagnitudes of the A0 V star.
We now wish to construct a convolution kernel that, whenapplied to the model spectrum of Vega, will produce a closeapproximation of the intrinsic spectrum of the observed A0 Vstar, as measured by an instrument with perfect throughput.That is, we assume that the intrinsic spectrum of the A0 V star
is given by
I (l) p I (l) ∗ V(l), (6)A0 V Vega
whereIVega(l) is the scaled and shifted model spectrum of Vegaand is a function that accounts for the differences inV(l)rotational velocity and any other line-broadening factorsbetween the Vega model and the observed A0 V star. Theobserved A0 V spectrumOA0 V(l) is then given by
O (l) p {[ I (l) ∗ V(l)] 7 T(l)} ∗ P(l) 7 Q(l) (7)A0 V Vega
or
O (l) p [I (l) ∗ K(l)] 7 R(l), (8)A0 V Vega
where
K(l) p V(l) ∗ P(l), (9)
I p I (l) ∗ K(l). (10)instr,A0 V Vega
For the moment, let us simply assume we can find an intrinsicstellar absorption line in the observed A0 V spectrum acrosswhich both the atmospheric absorption and the instrumentalthroughput are either constant or only smoothly varying. Usingthe normalized observed and model spectra in the vicinity of

TELLURIC CORRECTIONS IN NEAR-INFRARED 393
2003 PASP,115:389–409
the line, we then have
′ ′O (l) p I (l) ∗ K(l), (11)A0 V Vega
where primes denote the normalized spectra (divided by therespective continua). The convolution kernel can then beK(l)determined by selecting a small region around the observedabsorption line and performing a deconvolution.
Once has been determined, it is convolved with theK(l)shifted, scaled, and reddened Vega model spectrum andR(l)is determined from equation (8). Under the assumptions thatall A0 V stars are identical to Vega and that the model of Vegaprovides a highly accurate representation of Vega’s intrinsicspectrum, the convolution and subsequent division
should yield a response spectrum inO (l)/[I (l) ∗ K(l)]A0 V Vega
which the intrinsic stellar absorption lines are absent. In prac-tice, we find that some small residual features at the locationsof the H lines are discernible in this response spectrum becauseof differences in the strengths of these lines between the modeland the observed A0 V spectra. Some of these differences mayin fact be real, due to different values of between thelog gstandard star and the Vega or misclassification of the observedstandard star and hence a slight spectral mismatch between thestandard and Vega. However, the model H line strengths (equiv-alent widths) can be easily adjusted to minimize, or eliminate,these residuals. Furthermore, since any metal lines are fairlyweak and do not vary strongly among late B-type and earlyA-type stars, the effects of spectral mismatches and misclas-sifications on the resulting telluric correction spectrum can beminimized to a large extent by simply modifying the H linestrengths in the model. For the resolving power and typicalS/N levels achieved with SpeX, minor misclassifications shouldhave a negligible effect on the final corrected spectra.
The intrinsic spectrum of the target objectIinstr(l) is thendetermined from equation (3), rewritten as
I (l) p O(l) 7 [I (l) ∗ K(l)/O (l)]. (12)instr Vega A0 V
We refer to the quantity as[I (l) ∗ K(l)]/O (l) p 1/R(l)Vega A0 V
the “telluric correction spectrum.” One advantage of thismethod is that the resulting spectrumIinstr(l) is automaticallyplaced on the proper flux scale if the slit losses during the twosets of observations (standard star and target object) were thesame.
In summary, the method of constructing a telluric correctionspectrum consists of an observation of an A0 V star and severalsteps designed to modify the model spectrum of Vega appro-priately:
1. normalization of the observed A0 V star spectrum in thevicinity of a suitable absorption feature (as defined below);
2. determination of the radial velocity shift of the A0 V star;3. shifting the Vega model spectrum to the radial velocity
of the A0 V star;
4. scaling and reddening the Vega model spectrum to matchthe observed magnitudes of the A0 V star;
5. construction of a convolution kernel from a small regionaround an absorption feature in the normalized observed A0 Vand model Vega spectra;
6. convolution of the kernel with the shifted, scaled, andreddened model of Vega;
7. scaling the equivalent widths of the various H lines tomatch those of the observed A0 V star.
Finally, the convolved model is divided by the observedA0 V spectrum and the resulting telluric correction spectrumis multiplied by the observed target spectrum.
3. PRACTICAL CONSIDERATIONS
For the method described above to work properly, the con-volution kernel must be determined accurately. IfK(l) P(l)and are known in advance, can be constructed usingV(l) K(l)equation (9). If is to be generated from the observationsK(l)themselves, it is necessary to find a region of the observedA0 V spectrum that contains a strong intrinsic stellar absorptionline (so that the radial and rotational velocities and IP can bedetermined) but is free from atmospheric absorption or instru-mental features. The latter requirement arises from our as-sumption that and either are constant or vary onlyT(l) Q(l)slowly and smoothly across the width of the line. Fortunately,for observations with SpeX, the atmosphere has cooperated inproviding such a wavelength region and stellar atmospheres havecooperated in providing a suitable absorption line. Figure 1 pres-ents a model of the atmospheric transmission between 0.9 and1.2 mm, computed with the ATRAN program (Lord 1992) foran air mass of 1.2 and standard conditions on Mauna Kea andsmoothed to a resolving power of 2000. The normalized modelspectrum of Vega obtained from R. Kurucz,4 also smoothed toresolving power of 2000, is overplotted. It can be seen that thePad (1.00494mm) absorption line in the Vega spectrum is lo-cated in a region where, at this resolution, atmospheric ab-sorption is almost completely negligible. Therefore, this linecan be used to determine the convolution kernel in theK(l)procedure described above.
In addition to the lack of telluric contamination, the Pad linealso lies in a wavelength region where the throughput ofQ(l)SpeX is relatively high and does not change dramatically acrossthe width of the line. The throughput around the Pag (1.0938mm) line, for example, drops quickly across the line (due tothe grating blaze function) and atmospheric absorption affectsthe shape of the long-wavelength wing, making the determi-nation of the continuum near the wings difficult. Nevertheless,although the Pad line is ideal for our purposes, we have suc-cessfully generated telluric correction spectra using the methoddescribed in § 2 with kernels built from other H lines in thespectra of A0 V stars (e.g., Brg). For spectrographs that do not
4 http://kurucz.harvard.edu/stars.html.
394 VACCA, CUSHING, & RAYNER
2003 PASP,115:389–409
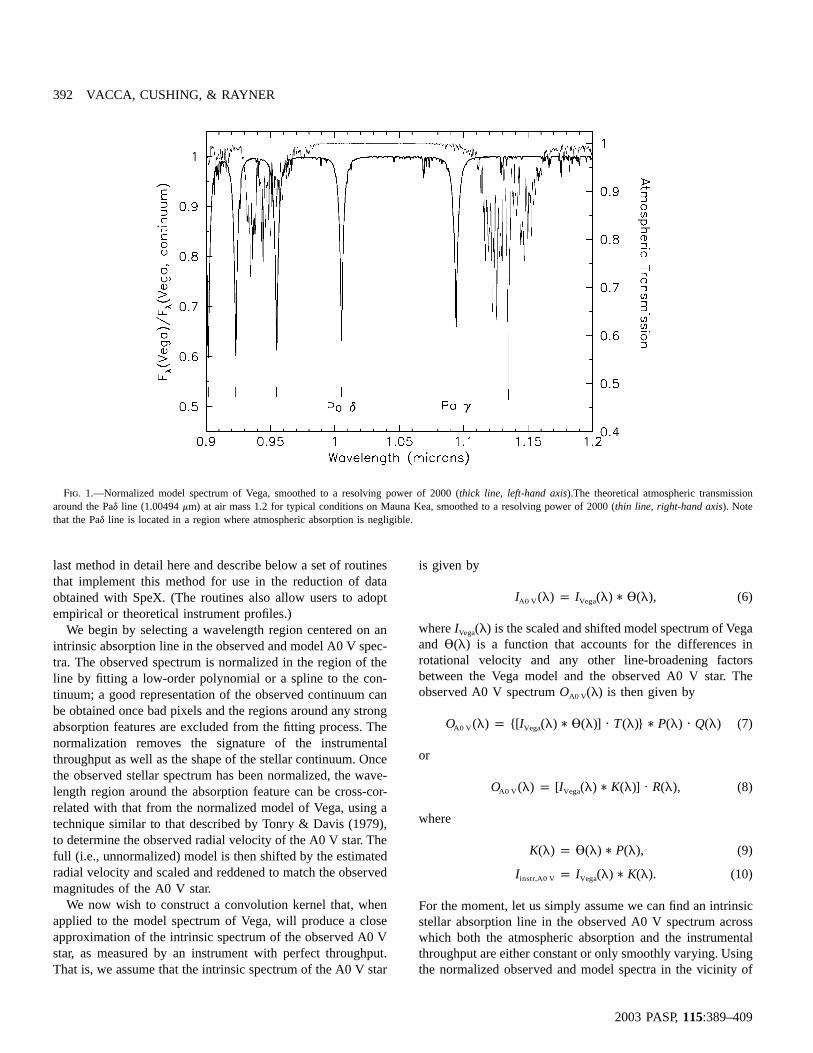
Fig. 2.—Control panel widget forxtellcor.
contain cross-dispersers and/or yield only a limited wavelengthrange, the observed A0 V spectra may not contain a line that issuitable for constructing . In these cases, the convolutionK(l)kernel can be generated from the IP and some estimate of therotational velocity of the A0 V star (eq. [9]). At resolving powerssimilar to those of SpeX, the latter generally has a negligibleeffect on the resulting telluric correction spectrum.
The model of Vega we use for our telluric correction pro-cedure has a resolving power ( ) of 500,000, binned byl/Dl
five (giving an effective resolving power of 100,000), and hasbeen scaled to match the observed Vega flux at 5556 A˚ givenby Megessier (1995). (A higher resolution model is also avail-able from the Kurucz Web page; however, the array lengthsnecessary to store these data and the subsequent intermediateproducts become inordinately large and unwieldy.) The prop-erties of the model are as follows:Teff p 9550 K, logg p
3.950, rot p 25 km s�1, turb p 2 km s�1, and a metal abun-v vdance somewhat below solar. The model also has an associatedcontinuum spectrum; using the full spectrum and the contin-uum, we generated a normalized line spectrum. The continuumspectrum contains sharp jumps due to the abrupt increases/decreases in the opacity at the limits of the H (Pa and Br)series. The strengths of these jumps must be modified alongwith the line strengths. To account for this, we have normalizedthe continuum spectrum by dividing it by a spline fitted to thespectrum far from the jumps. The fit passes approximatelythrough the flux midpoints between the continuum levels oneither side of the jumps. Scaling this normalized continuum byan appropriate value then has the effect of scaling the heightsof the jumps.
Note that because the Vega model spectrum has such a largeresolving power, the method we have outlined should work
TELLURIC CORRECTIONS IN NEAR-INFRARED 395
2003 PASP,115:389–409
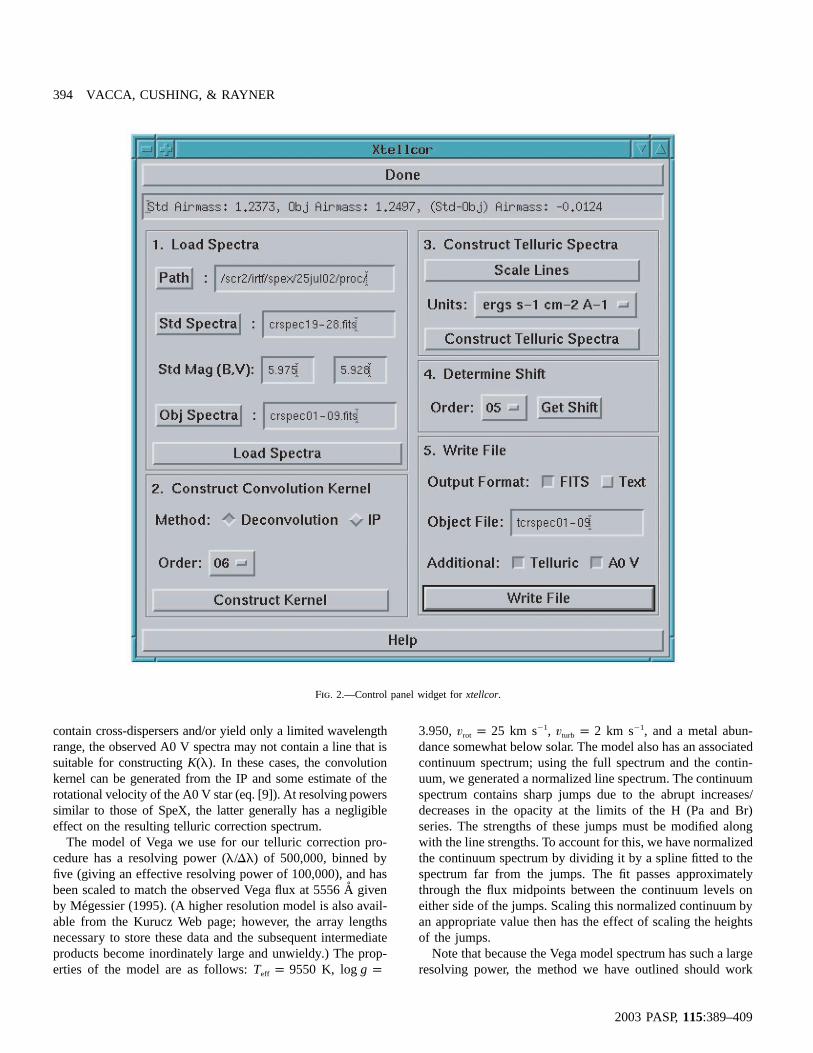
Fig. 3.—Determination of the convolution kernel from the Pad line in the normalized spectrum of an A0 V star. The vertical dashed lines denote the region ofthe spectrum used in the deconvolution to generate the kernel. Note that the residuals (seen in the bottom panel) have an rms deviation of much less than1%.
successfully for spectral data with considerably larger resolvingpowers than that of SpeX ( –2500). In principle,l/Dl p 200use of the routines described below (§ 4) is limited to data with
, although data with higher resolving powersl/Dl ! 50,000could be corrected if a model with higher resolving power wereincorporated into the code. We have used a more general ver-sion of the code described below to successfully perform tel-luric corrections on data with resolving power of 5000, andwe routinely use the code, with an empirical instrument profile
, to successfully correct prism data ( ) obtainedP(l) l/Dl ∼ 200with SpeX. At low resolving powers, the possibility of findingisolated H lines that are uncontaminated by atmospheric ab-sorption is greatly diminished and precludes the constructionof the convolution kernel from the observed data. AtK(l)
, for example, even the Pad line is affected by tel-l/Dl ∼ 200luric absorption in the wings.
The calculations described above (§ 2) are easiest to carryout in velocity coordinates, which is appropriate for a spectrumwith constant spectral resolving power. In addition, the Vegamodel has a constant resolving power. However, in most spec-trograph designs, the resolving power varies across the spectralrange. SpeX is no exception, and the resolving power varieslinearly by about 20% across each order (Rayner et al. 2003).Fortunately, the spectral resolutionDl of SpeX is constant toa high degree across each order, although the specific valuevaries from order to order. However, in pixel coordinates it isthe same value for all orders, given approximately by the pro-jected slit width. This implies that, in pixel coordinates, a kernel

396 VACCA, CUSHING, & RAYNER
2003 PASP,115:389–409
Fig. 4.—Determination of the H line scale factors for the Vega model in order 4 of SpeX. The upper panel shows the scale factors for each of the H absorptionlines, while the bottom panel shows the response spectrum. The yellow curve is the theoretical atmospheric transmission for an air mass of 1.2 and standardconditions on Mauna Kea.
built from a line in one order can be applied to all otherK(l)orders. Therefore, the code described below carries out thedeconvolution in wavelength coordinates in order to constructthe kernel, converts the resulting to pixel coordinates, andK(l)then applies this kernel to each order. This saves the user fromthe tedious task of building kernels specific to each order.
Deconvolution procedures are notoriously sensitive to noise.To minimize the effects of noise on the deconvolution neededto construct , we multiply the ratio of theFourier trans-K(l)forms of and by a tapered window function of′ ′O (l) I (l)A0 V Vega
the form 1/[ ], wherenmax is a reference frequency101 � (n/n )max
given by a multiple of the width of a Gaussian fit to the Fouriertransforms. This has the effect of suppressing high-frequencynoise.
Clearly, as the response spectrum will be divided intoR(l)the observed target spectrum, it is also important to acquirehigh S/N values in the observed spectrum of the A0 V star in
order to achieve accurate and reliable telluric corrections. Ingeneral, we have found that an S/N of≥100 is needed in orderto obtain telluric-corrected spectra that are limited by the flat-fielding errors and the S/N of the observed target spectrum.Of course, the accuracy of the final corrected spectra also de-pends on the stability of the atmospheric conditions, the prox-imity (in both time and air mass) of the A0 V observations tothose of the target object, and the degree to which the A0 Vspectrum matches the model spectrum of Vega. However, aswe have argued above, small spectral mismatches should havea minor effect on the generated telluric correction spectrum.Fortunately, S/N values of 100 are rather easy to achieve atresolving powers of≤2500 on 3 m class telescopes. UsingSIMBAD, we have compiled a list of A0 V stars that aresuitable for carrying out the method described above. The SpeXWeb page includes a Web form that will generate a listingof the known A0 V stars within a specified angular distance

TELLURIC CORRECTIONS IN NEAR-INFRARED 397
2003 PASP,115:389–409
Fig. 5.—Same as Fig. 4, but for order 6 of SpeX. Note the small residual features in the response spectrum at the locations of Pa12 and Pa13.
and/or air mass difference from any target object. Our expe-rience using SpeX on Mauna Kea indicates that on particularlydry and stable nights, accurate corrections can be achievedwhen the air mass differences and time intervals between thetarget and standard observations are as large as 0.1 and 30–60minutes, respectively. However, for typical conditions, goodtelluric corrections require closer matches in air mass andshorter time separations.
Accurate flux calibrations require knowledge of the near-infrared fluxes or magnitudes of a set of A0 V stars. Unfor-tunately, an accurate and comprehensive set of fluxes and/ormagnitude measurements for A0 V stars at these wavelengthsis currently not available. Therefore, we have chosen to adoptthe optical (B andV) magnitudes given by SIMBAD and thereddening curve given by Rieke & Lebofsky (1985; see alsoRieke, Rieke, & Paul 1989) to estimate the flux as a functionof wavelength for a given A0 V star. In order to achieve anS/N of about 100 without inordinately long exposure times,
the A0 V star must be reasonably bright; for SpeX observations,A0 V stars with V magnitudes of∼5–8 have been found towork best. SIMBAD provides highly accurate magnitudes fora large number of A0 V stars in this brightness range. In ad-dition, the reddening of such objects is necessarily small, evenin the visible. Hence, the precise reddening curve adopted hasa minor effect on the results. However, we point out that ac-curate spectroscopic flux calibrations at near-infrared wave-lengths would clearly benefit from a dedicated program of care-ful J, H, and K observations of a set of A0 V stars. Such aprogram could also serve as the basis for establishing a set ofnear-infrared “spectroscopic flux standards” similar to thoseavailable in the optical regime.
Proper flux calibration also requires that the seeing and otherslit losses do not change substantially between the observationsof the target and the A0 V star. If the apertures used for thespectral extraction are wide, moderate changes in seeing shouldnot affect the resulting flux calibrations greatly. In practice, we
398 VACCA, CUSHING, & RAYNER
2003 PASP,115:389–409
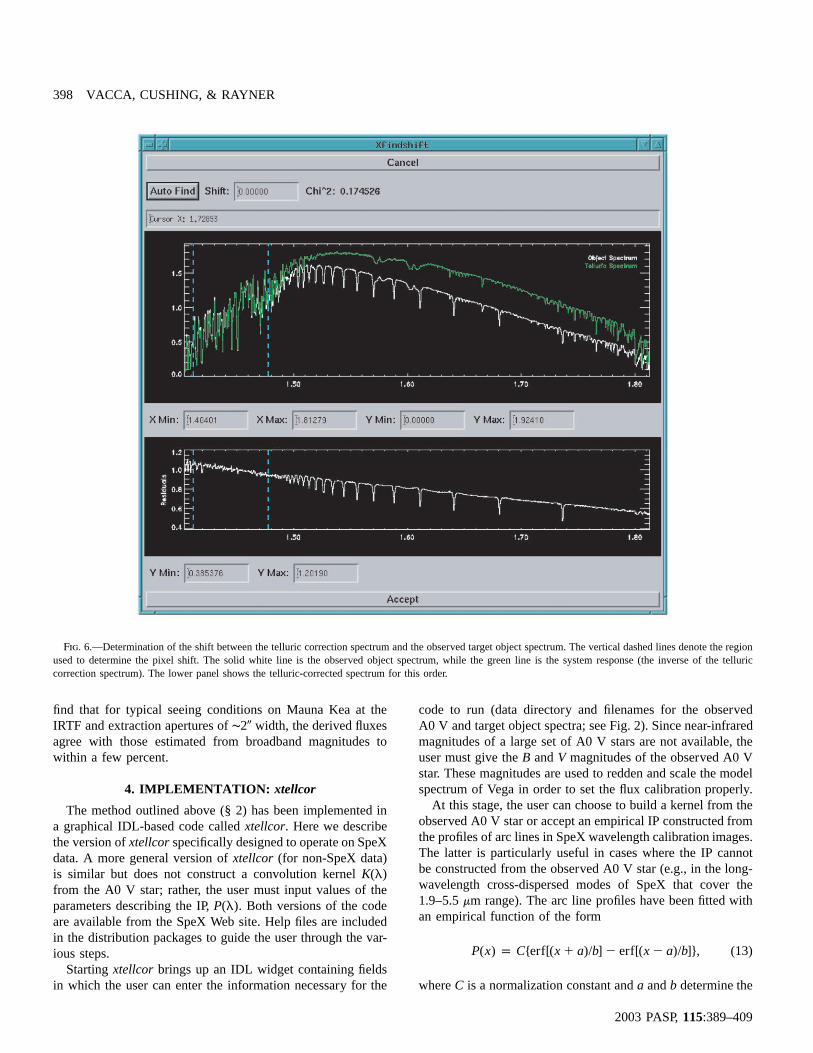
Fig. 6.—Determination of the shift between the telluric correction spectrum and the observed target object spectrum. The vertical dashed lines denote the regionused to determine the pixel shift. The solid white line is the observed object spectrum, while the green line is the system response (the inverse of the telluriccorrection spectrum). The lower panel shows the telluric-corrected spectrum for this order.
find that for typical seeing conditions on Mauna Kea at theIRTF and extraction apertures of∼2� width, the derived fluxesagree with those estimated from broadband magnitudes towithin a few percent.
4. IMPLEMENTATION: xtellcor
The method outlined above (§ 2) has been implemented ina graphical IDL-based code calledxtellcor. Here we describethe version ofxtellcor specifically designed to operate on SpeXdata. A more general version ofxtellcor (for non-SpeX data)is similar but does not construct a convolution kernelK(l)from the A0 V star; rather, the user must input values of theparameters describing the IP, . Both versions of the codeP(l)are available from the SpeX Web site. Help files are includedin the distribution packages to guide the user through the var-ious steps.
Startingxtellcor brings up an IDL widget containing fieldsin which the user can enter the information necessary for the
code to run (data directory and filenames for the observedA0 V and target object spectra; see Fig. 2). Since near-infraredmagnitudes of a large set of A0 V stars are not available, theuser must give theB andV magnitudes of the observed A0 Vstar. These magnitudes are used to redden and scale the modelspectrum of Vega in order to set the flux calibration properly.
At this stage, the user can choose to build a kernel from theobserved A0 V star or accept an empirical IP constructed fromthe profiles of arc lines in SpeX wavelength calibration images.The latter is particularly useful in cases where the IP cannotbe constructed from the observed A0 V star (e.g., in the long-wavelength cross-dispersed modes of SpeX that cover the1.9–5.5mm range). The arc line profiles have been fitted withan empirical function of the form
P(x) p C{erf[( x � a)/b] � erf[(x � a)/b]}, (13)
whereC is a normalization constant anda andb determine the

TELLURIC CORRECTIONS IN NEAR-INFRARED 399
2003 PASP,115:389–409
Fig. 7.—Final telluric-corrected spectrum of HD 223385 (A3 Ia).
width of the profile in pixel ( ) coordinates. This functionalxform provides an excellent fit to the observed profiles of thearc lines over all the orders of SpeX and for slit widths of 0�.3,0�.5, 0�.8, and 1�.6. By adopting a fit, rather than the observedline profiles themselves, errors in the IP resulting from under-sampling, low S/N, etc., are minimized. The best-fit values ofa andb for each slit width are stored in a separate data file.
If the user chooses to build the kernel from the A0 V star,a second window is generated containing the observed spec-trum in the requested order. The Pad line is located in order 6of the 0.8–2.4mm cross-dispersed mode of SpeX. The user canthen interactively select continuum regions to be fitted with apolynomial of a desired degree. Once an adequate fit to thecontinuum in the vicinity of the spectral line is obtained, thenormalized spectrum (observed divided by the continuum fit)is displayed (Fig. 3). The user then selects the region of thenormalized spectrum to use in the deconvolution, and the code
proceeds to scale both the model line spectrum and the nor-malized model continuum spectrum by the ratio of the observedequivalent width to the model equivalent width of the selectedline (Fig. 3). The relative velocity shift between the observedspectrum and the model is determined and the kernel is gen-erated via deconvolution after the model has been shifted. Ourexperience has shown that with careful choice of the normali-zation and deconvolution regions, a kernel can be routinely con-structed that yields maximum deviations of the convolved modelfrom the observed line profile of less than 2% over the selectedwavelength range. We typically achieve maximum deviations ofless than 1.5% and rms deviations of less than 0.75% across thePad line for data with and S/N≥ 100.l/Dl p 2000
The observed spectrum of the A0 V star is divided by thefull scaled and shifted model after the latter has been convolvedwith the kernel (either the semiempirical IP or one built fromthe observed A0 V star) and the result is displayed for each

400 VACCA, CUSHING, & RAYNER
2003 PASP,115:389–409
Fig. 8a
Fig. 8b
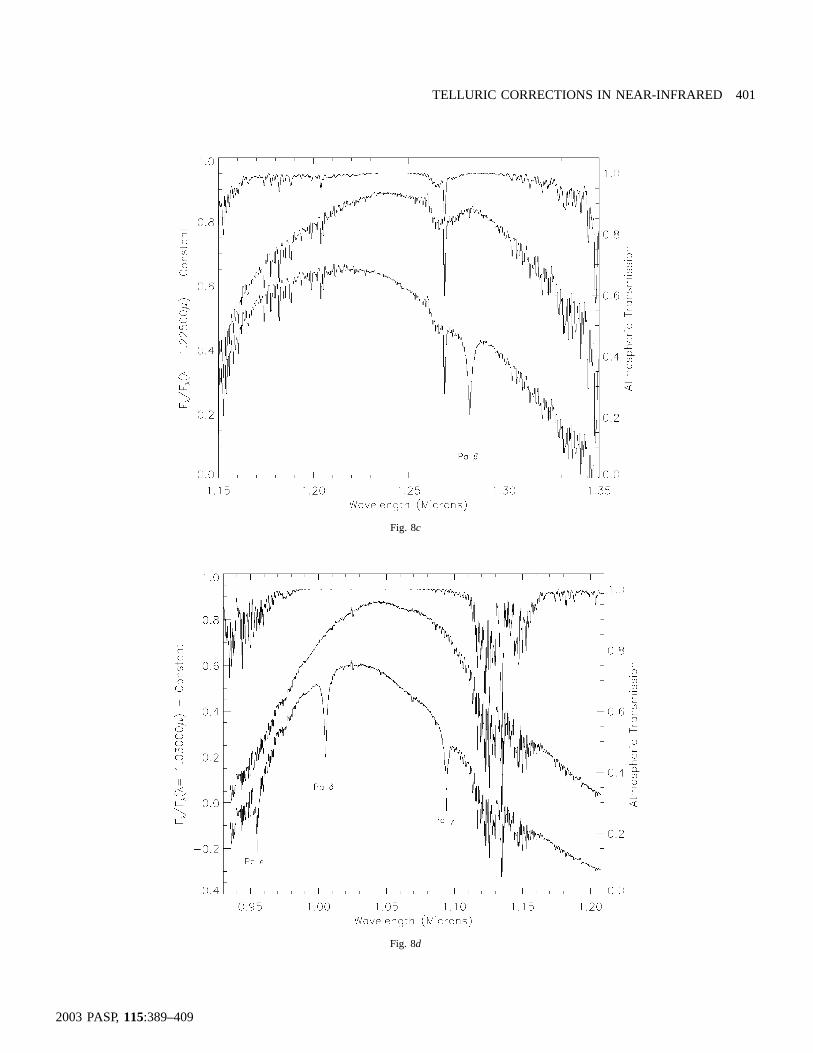
Fig. 8.—Response curves generated byxtellcor for the various short-wavelength cross-dispersed orders of SpeX (a: order 3;b: order 4;c: order 5;d: order 6;e: order 7;f: order 8). In each plot, the curves shown (bottom to top) are the observed spectrum of an A0 V star (HD 223386, ), the response curveV p 6.328generated withxtellcor, and a theoretical atmospheric transmission spectrum computed for typical conditions on Mauna Kea, an air mass similar to that of theobservations, and a resolving power of 2000. The instrinsic stellar H lines of the Paschen and Brackett series are identified. Small residuals are seenin the responsecurves at the locations of the Pa11–Pa15 lines. Note that the theoretical atmosphere curve does not extend below 0.85mm.
TELLURIC CORRECTIONS IN NEAR-INFRARED 401
2003 PASP,115:389–409
Fig. 8c
Fig. 8d

402 VACCA, CUSHING, & RAYNER
2003 PASP,115:389–409
Fig. 8e
Fig. 8f

TELLURIC CORRECTIONS IN NEAR-INFRARED 403
2003 PASP,115:389–409
Fig. 9a
Fig. 9b
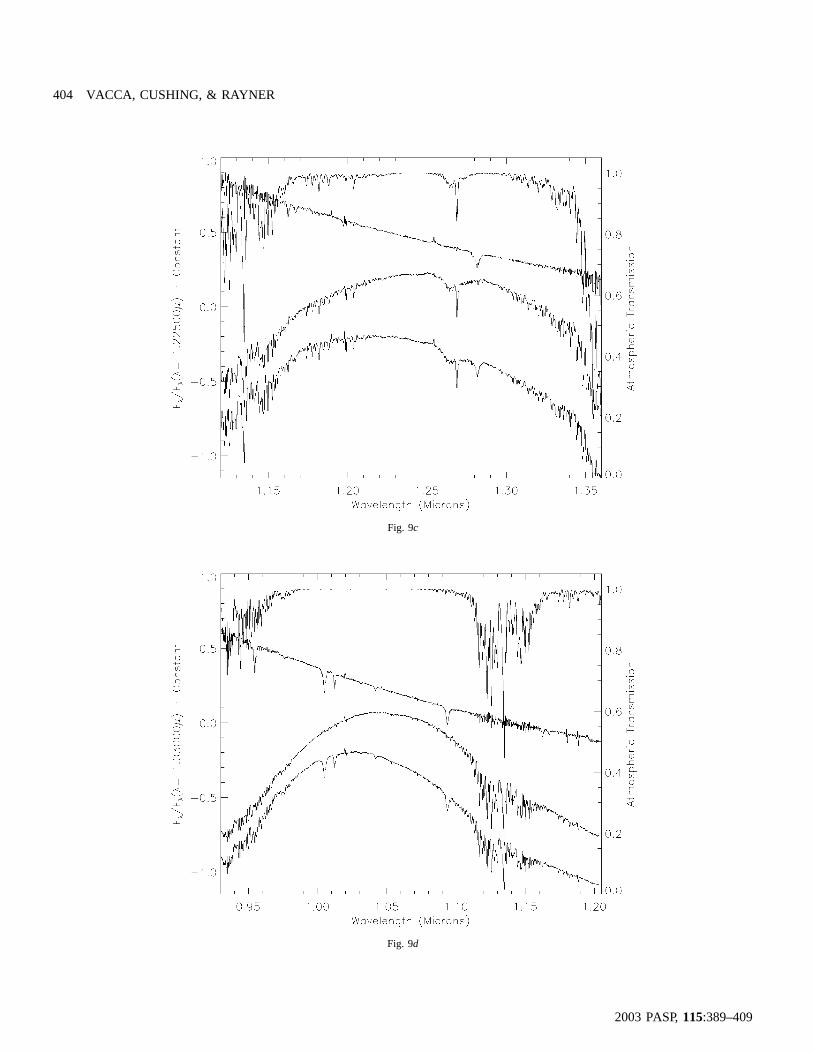
Fig. 9.—Final telluric-corrected spectra of an O6.5 V((f)) star (HD 206267), generated byxtellcor for the various short-wavelength cross-dispersed ordersof SpeX (a: order 3;b: order 4;c: order 5;d: order 6;e: order 7). In each plot, the spectra are ordered from bottom to top as follows: the observed stellarO6.5 V((f)) spectrum, the response curve constructed byxtellcor from the A0 V telluric standard, the telluric-corrected O6.5 V((f)) spectrum, and the representativetheoretical atmospheric transmission spectrum (for reference, right-hand axis).
404 VACCA, CUSHING, & RAYNER
2003 PASP,115:389–409
Fig. 9c
Fig. 9d

TELLURIC CORRECTIONS IN NEAR-INFRARED 405
2003 PASP,115:389–409
Fig. 9e
order (Figs. 4 and 5). This is the first version of the responsespectrum. At this stage, the user can adjust the velocity shiftof the model and modify the strengths of the various H linesto better match those of the observed A0 V star. Mismatchesin line strengths and velocities are easily seen in the telluriccorrection spectrum as “absorption” or “emission” features atthe location of the H lines. The user can adjust the individualH line strengths of the model by varying the scale factorsapplied to the model line equivalent widths until residual fea-tures are minimized in the response spectrum in the regionsaround the lines (see Figs. 4 and 5). This can be done graph-ically using the mouse. A representative spectrum of the atmo-spheric transmission is displayed to guide the user in this task.(As an additional aid to the user, this atmospheric transmissioncurve can be multiplied by the estimated throughput curve ofSpeX.) The code also includes a procedure to determine thescale factor for a single isolated line automatically. This pro-cedure requires two points on either side of a line, fits a Gaus-sian plus a continuum to the response spectrum, and adjuststhe strength of the model line until the height of the Gaussianis minimized. Most of the H lines can be easily removed fromthe response/telluric correction spectrum at this stage. However,we have found that the Pa12, Pa13, and Pa14 lines (and oc-casionally the Pa11 and Pa15 lines) almost always leave re-sidual features in the telluric correction spectrum that cannotbe eliminated, no matter how the line strengths are scaled. This
indicates that the Vega model we are using does not providea good match to the profiles of these lines in the spectra ofreal A0 V stars. Once an improved Vega model is available,we will incorporate it into the code. Fortunately, even in thevicinity of these discrepant lines, the residual features are gen-erally less than a few percent and therefore do not result inlarge errors in the final spectrum.
The resulting set of line-strength scale factors are joined witha spline fit to generate a line scaling spectrum that is multipliedby the line model. The normalized continuum (divided by thespline fit) is also multiplied by this line scaling curve. This hasthe effect of modifying the jumps seen in the continuum model.Since the highest order lines rarely require modification of theirstrengths, the jumps are normally scaled by the equivalent-width ratio determined from the line used to build the kernel.The full, scaled and shifted, model is then used to regeneratethe response spectrum. When the user is satisfied with themodifications to the model, the final telluric correction spec-trum is generated. This can then be shifted in pixels in orderto align the telluric absorption features with those seen in thetarget object spectrum. This procedure should minimize anywavelength shifts due to flexure between the observations ofthe target object and the standard star. The code automaticallycomputes the best pixel shift using a region of the spectraselected by the user (Fig. 6). The shifts are usually less than0.5 pixel for standard stars observed within 10� of the target

406 VACCA, CUSHING, & RAYNER
2003 PASP,115:389–409
Fig. 10a
Fig. 10b
Fig. 10.—Final telluric-corrected spectra of a G8 IIIa star (HD 16139), generated byxtellcor for the various short-wavelength cross-dispersed orders of SpeX(a: order 3;b: order 4;c: order 5;d: order 6;e: order 7). In each plot, the spectra are ordered from bottom to top as follows: the observed stellar G8 IIIa spectrum,the response curve constructed byxtellcor from the A0 V telluric standard, the telluric-corrected G8 IIIa spectrum, and the representative theoretical atmospherictransmission spectrum (for reference, right-hand axis).

TELLURIC CORRECTIONS IN NEAR-INFRARED 407
2003 PASP,115:389–409
Fig. 10c
Fig. 10d

408 VACCA, CUSHING, & RAYNER
2003 PASP,115:389–409
Fig. 10e
object. The shift value is then applied to all the orders of thetelluric correction spectrum. Finally, the observed target objectspectrum is multiplied by the shifted telluric correction spec-trum, order by order, and the final corrected object spectrumis generated (Fig. 7). The user has a choice of units for thefinal output spectrum. The user can also choose to save boththe telluric correction spectrum itself and the modified Vegaspectrum. The former is useful if a single A0 V star has beenobserved as a telluric standard for multiple target objects; aseparate routine allows this previously constructed telluric cor-rection spectrum to be read in and used to correct the observedspectra of other objects.
5. APPLICATION AND EXAMPLES
The response spectra generated byxtellcor for the variousshort-wavelength cross-dispersed orders of SpeX are shown inFigures 8a–8f and Figure 1 of Cushing et al. (2003). As canbe seen from these figures, the features seen in the responsespectra match extremely well with those seen in the theoreticalatmospheric spectrum, and the stellar H lines seen in the ob-served A0 V spectra are removed to a very high accuracy.Small residuals can be seen in Figure 8e at the locations of thePa11–Pa15 lines. Aside from these features, however, the ac-curacy of the telluric corrections is limited only by the S/N of
the input A0 V spectrum. The latter is determined by the ex-posure time, flat-fielding errors, instrument throughput, and theatmospheric transmission itself. (Clearly, the derived telluriccorrection spectrum will be highly uncertain in those wave-length regions where the atmosphere is so opaque that theobserved spectra have S/N close to zero.) Of course, as ex-plained above, the accuracy of the final corrected target spectraalso depends on the differences in time and air mass betweenthe observations of the A0 V star and the target object, as wellas the S/N of the target spectrum.
Examples of typical output spectra generated byxtellcor canbe seen in Figure 7 (for HD 223385, A3 Ia), Figure 9 [for HD206267, O6.5 V((f))], and Figure 10 (for HD 16139, G8 IIIa),as well as in the papers by Cushing et al. (2003) and Rayneret al. (2003). The differences in air mass and time of obser-vations between the objects shown in these figures and theirtelluric A0 V standards were≤0.05 and≤20 minutes, respec-tively, in all cases. However, the atmospheric conditions (hu-midity, seeing, transparency) were variable during the obser-vations. The S/N values of the A0 V spectra were always≥100.As the figures demonstrate, the method enables us to recoverthe target spectrum even in regions of relatively low atmo-spheric transmission. We note that the equivalent widths of theintrinsic stellar absorption and emission features seen in thespectra in Figures 7 and 9 agree well with those measured forthese spectral classes by Hanson et al. (1996) in theK band.

TELLURIC CORRECTIONS IN NEAR-INFRARED 409
2003 PASP,115:389–409
6. SUMMARY
We have described a technique for correcting observed near-infrared medium-resolution spectra for telluric absorption. De-signed specifically for data obtained with SpeX at the IRTF,the method makes use of a high S/N (≥100) spectrum of anA0 V star observed near in time and close in air mass to theobject of interest and uses a theoretical model of Vega to re-move the intrinsic H absorption features seen in the stellarspectrum. The method can regularly generate telluric correctionspectra accurate to better than 2% in the vicinity of the intrinsicstellar H lines and significantly better than that at otherwavelengths.
We have demonstrated the application of this method onspectra obtained with SpeX. A set of graphical, easy-to-use,IDL-based routines (part of a general SpeX spectral reductionpackage called Spextool_extension version 1.1), implementsthe procedures described in this paper and can be found on the
SpeX Web page at the IRTF Web site.5 A general version ofthe code, useful for performing telluric corrections on spectraobtained with other near-infrared spectrographs (withl/Dl !
), is also available. In addition, a form that generates a50,000list of the A0 V stars listed in the SIMBAD database near aset of specified coordinates is also posted on the Web site.
We thank R. Kurucz for providing the high-resolution modelof Vega and J. Tonry for suggestions regarding the form of theinstrument profiles. We also thank the SpeX team for theirexpert construction of an invaluable instrument and the staffat the IRTF for their assistance at the telescope. This researchhas made use of the SIMBAD database, operated at CDS,Strasbourg, France.
5 http://irtfweb.ifa.hawaii.edu/Facility/spex.
REFERENCES
Abt, H. A., & Morrell, N. I. 1995, ApJS, 99, 135Cushing, M. C., Rayner, J. T., Davis, S. P., & Vacca, W. D. 2003,
ApJ, 582, 1066Hanson, M. M., Conti, P. S., & Rieke, M. J. 1996, ApJS, 107, 281Livingston, W., & Wallace, L. 1991, An Atlas of the Solar Spectrum
in the Infrared from 1850 to 9000 cm (1.1 to 5.4 microns) (NSO�1
Tech. Rep. 91-001; Kitt Peak: NSO)Lord, S. D. 1992, NASA Tech. Memo. 103957Maiolino, R., Rieke, G. H., & Rieke, M. J. 1996, AJ, 111, 537Megessier, C. 1995, A&A, 296, 771Rayner, J. T., Toomey, D. W., Onaka, P. M., Denault, A. J., Stahlberger,
W. E., Vacca, W. D., Cushing, M. C., & Wang, S. 2003, PASP, inpress
Rayner, J. T., Toomey, D. W., Onaka, P. M., Denault, A. J., Stahlberger,W. E., Watanabe, D. Y., & Wang, S. 1998, Proc. SPIE, 3354, 468
Rieke, G. H., & Lebofsky, M. J. 1985, ApJ, 288, 618Rieke, G. H., Rieke, M. J., & Paul, A. E. 1989, ApJ, 336, 752Royer, F., Gerbaldi, M., Faraggiana, R., & Go´mez, A. E. 2002, A&A,
393, 897Tonry, J., & Davis, M. 1979, AJ, 84, 1511Wallace, L., Hinkle, K., & Livingston, W. 1993, An Atlas of the
Photospheric Spectrum from 8900 to 13600 cm (7350 to 11230�1
A) (NSO Tech. Rep. 93-001; Kitt Peak: NSO)