Embed Size (px)
Citation preview
www.elsevier.com/locate/still
Soil & Tillage Research 93 (2007) 412–419
A method for prediction of soil penetration resistance
A.R. Dexter *, E.A. Czyz, O.P. Gate
Institute of Soil Science and Plant Cultivation (IUNG-PIB), ul. Czartoryskich 8, 24-100 Pulawy, Poland
Received 2 January 2006; received in revised form 24 April 2006; accepted 27 May 2006
Abstract
A new equation for predicting penetration resistance of soil is presented. The equation contains two main additive terms: the first
is a measure of the degree of compactness of the soil and the second gives the contribution of pore water to the soil strength. It is
proposed that these terms are applicable to soils of different texture, at different bulk densities and at different water contents. The
equation is calibrated and tested using values of penetrometer resistance measured in the field at a range of locations in Poland.
Predictions from the equation are compared with predictions from two other published equations. It is shown that the performance
of the proposed equation is superior to the other two, at least for the Polish data set used in this work. On the basis of the assumption
that the proposed equation is correct, predictions of penetrometer resistance are made using pedotransfer functions to illustrate
typical effects of soil texture, bulk density and water content.
# 2006 Elsevier B.V. All rights reserved.
Keywords: Effective stress; Pedotransfer functions; Penetrometer resistance; S-theory
1. Introduction
Penetration resistance of soil is usually measured
with a penetrometer. Penetrometer resistance is widely
measured because it provides an easy and rapid method
of assessing soil strength. The theory of penetrometers
is presented in several publications (e.g. Bengough
et al., 2001). In these publications it may be seen that the
resistance to penetration is governed by several more
basic properties including soil shear strength, soil
compressibility and soil/metal friction. Unfortunately,
each of these factors is difficult to measure or predict,
and so approaches using these factors do not facilitate
the use of penetrometers.
The penetration resistance is itself of little value.
However, it correlates with several other properties that
are themselves of direct practical importance. For
example, the draught force (and hence the energy
* Corresponding author.
E-mail address: [email protected] (A.R. Dexter).
0167-1987/$ – see front matter # 2006 Elsevier B.V. All rights reserved.
doi:10.1016/j.still.2006.05.011
requirements) of tillage implements (e.g. Dawidowski
et al., 1988), vehicle trafficability (e.g. Dexter and
Zoebisch, 2002) and the growth (or elongation rate) of
plant roots (e.g. Taylor and Ratliff, 1969) in the soil.
These practical aspects are extremely difficult and time
consuming to measure and to study directly. Therefore,
penetration resistance is often used as a surrogate
measurement.
There is a need to be able to predict penetrometer
resistance from basic soil properties such as the soil
composition, bulk density and water content. It is
generally found that for any one soil, it is quite easy to
produce an empirical equation that accounts for
differences in bulk density and water content. However,
the predictions are often not so good when different
soils are being compared.
A typical equation used for prediction of penet-
rometer resistance, Q, is that used by da Silva and Kay
(1997):
Q ¼ aubDc (1a)
A.R. Dexter et al. / Soil & Tillage Research 93 (2007) 412–419 413
which may also be written in terms of natural logarithms
as
ln Q ¼ ln aþ b ln qþ c ln D (1b)
where, D is the bulk density of the soil, u is some
measure of the soil water content and a, b and c are
adjustable parameters. Eqs. (1) can work quite well for
any one soil. When a range of soils is considered, then
additional pedotransfer functions (PTFs) are often used
with the form
a ¼ A1 þ A2 ðclayÞ þ A3ðOMÞ þ � � �b ¼ B1 þ B2 ðclayÞ þ B3ðOMÞ þ � � �c ¼ C1 þ C2 ðclayÞ þ C3ðOMÞ þ � � �
(2)
where, clay is the soil clay content, OM the organic
matter content, and the coefficients Ai, Bi and Ci are
determined by experiment and regression. This
approach typically uses at least nine different coeffi-
cients.
However, it cannot really be expected that an
equation such as Eq. (2) based on D and u could be
very successful. Common experience shows that bulk
density is not a good measure of the ‘‘degree of
compactness’’ of soil. For example, a bulk density of
1.4 Mg m�3 is a high value for a clay but is a low
value for a sand. Similarly a water content of a clay
that feels ‘‘dry’’ may be sufficient to make a sand feel
‘‘wet’’. Therefore, bulk density and water content do
not seem to form a very sound basis for a prediction
equation.
Canarache (1990a, 1990b) produced a method and a
computer program called PENETR for predicting Q.
This uses more complex relationships for the effects of
water content, clay content, bulk density, etc.
Another prediction equation has been proposed
recently by To and Kay (2005). This takes the form
Q ¼ ahb � ch (3)
Here, h is the pore water suction which is numerically
equal to the modulus of C (the matric water potential)
and the terms a, b and c (which do not have the same
values as those given in Eqs. (1) and (2)) are determined
as PTFs using equations of similar type to those shown
in Eq. (2), in this case having a total of up to 13
coefficients. The values of h were adjusted in the
laboratory. To and Kay (2005) obtained a value of
r2 = 0.47 when Eq. (3) was applied to undisturbed
samples of Canadian soils of all textures. However,
the value of r2 could be increased if the equation was
applied only to soils having a limited range of texture.
Practical application of Eq. (3) requires either measure-
ment of water potential (e.g. using tensiometers) or the
prediction of water potential using measurements of soil
water content in combination with a water-retention
curve that has been measured on the same soil at the
same density.
It should be noted that Canarache (1990a, 1990b)
and To and Kay (2005) did their measurements in the
laboratory on soil samples collected from the field. With
this approach, the values of penetration resistance, bulk
density and water content were all measured on the
same samples that were contained in steel cylinders.
This approach is not possible with measurements of
penetration resistance made in the field.
Dexter (2004a, 2004b, 2004c) defined a quantity S as
the slope, du/d (ln h), of the water retention curve at its
inflection point. He noted that values of S appeared to
have the same physical meaning in soils of all textures.
For example, it was observed that growth of plant roots
ceased at around S = 0.02, probably because of
mechanical impedance as can be measured with a
penetrometer. This led to the idea that S may be related
to penetrometer resistance and this is the subject of this
paper.
In this paper, we propose and test the equation
Q ¼ aþ b
�1
S
�þ cs0 (4)
where S is from Dexter (2004a, 2004b, 2004c) and s0 isthe effective stress. S was identified as an index of soil
physical quality and 1/S is a measure of the degree of
compactness of soil. It should be noted that this is
different from the measure of degree of compactness
used by Hakansson (1990). However, the term ‘‘degree
of compactness’’ is also used here because it conveys
exactly the meaning of (1/S).
The effective stress term, s0, gives the contribution of
the pore water to soil strength. This term has two
components: a pore water pressure term and a term due
to the surface tension in water menisci between the soil
mineral particles (Towner and Childs, 1972). Vepraskas
(1984) showed that the water menisci term could be
ignored for degrees of saturation, x > 0.4. The resulting
simplified equation was used successfully by Mullins
and Panayiotopoulos (1984) and by Whalley et al.
(2005), and will also be used here.
Because the evidence suggests that values of S and s0
have the same physical meanings in all soils, it seemed
possible that Eq. (4) may be applicable to widely
different soils with only its three coefficients a, b and c.
It should be noted that the effects of clay and organic
matter contents (and other factors) are already included
A.R. Dexter et al. / Soil & Tillage Research 93 (2007) 412–419414
in Eq. (4) through the two terms S and s0. The purposes
of this paper were to test Eq. (4) and to compare its
performance with that of the Canarache (1990a, 1990b)
and the To and Kay (2005) models.
2. Materials and methods
2.1. Soils
The measurements were made and samples were
collected from agricultural fields in different locations
in Poland. The positions of the locations were measured
by GPS for reference purposes and will enable the same
positions to be studied again in future, if required. The
samples represented soils with several genetic origins
including: glacial till, loess and alluvium. Penetration
resistance was measured and soil samples were
collected at depths of 10, 20, 30, 40 and 50 cm as
much as possible. In some cases, the soil was too dry
and strong below the normal depth of tillage (around
25 cm) for penetrations and sample collection to be
carried out. In these cases, only the plough layer was
measured and sampled.
A total of 85 different soil layers are represented.
Samples of these soils were all measured, collected,
stored and analysed by the same people and in the same
way. They, therefore, comprise a rather reliable data set
having consistent measurement errors.
The particle size distributions of the soils were
determined by sieving and sedimentation and the organic
matter contents were measured by wet oxidation.
The samples were not collected in the period
immediately following tillage in the spring when the
spatial variability of soil physical properties is high,
but mostly in late June, July or early August which is
just before or just after harvest. At the time of sample
collection, the soil had settled to a quasi-equilibrium
state. The crops in the fields were mostly barley or
wheat. Although visible wheel tracks were avoided,
it is possible that earlier wheel tracks, that were no
longer visible, may have contributed to spatial hetero-
geneity.
Sample collection for measurement of particle size
distribution, bulk density, water content, and water
retention characteristics were made from an area of
approximately 1 m2 in each field. Penetrometer
penetrations were made in an area of about 2 m radius
from the centre of the sample collection area. Therefore,
all samples and all measurements were made as nearly
as practically possible from a single point in each field.
This was in an attempt to reduce the effects of spatial
variability to a minimum.
2.2. Penetrometer resistance
A model CP20 cone penetrometer (Agridry RIMIK
Pty. Ltd., Toowoomba, Australia) was used in the field
at all locations. This measures the mean vertical stress
required for penetration of a steel cone of 12.8 mm
diameter and 308 total included angle. The maximum
value of stress that can be recorded is Q = 5000 kPa.
The penetrometer records electronically the value of Q
at intervals of 2.5 cm. The data were subsequently
down-loaded to a computer for analysis. We used every
fourth value to give the values of Q at 10, 20, 30, 40 and
50 cm depth.
Ten replicate penetrations were done for each
location. In some cases, penetration into the sub-soil
was not possible because of the high soil strength.
However, these ‘‘missing data’’ were not ignored but
were taken into account. To do this, the value 9999 was
written into the data file where data were ‘‘missing’’.
Then we did not use mean values of Q but median
values. Therefore, if 1, 2, 3 or 4 of the 10 replicate data
were ‘‘missing’’ then the median value was unaffected
and was used to represent the soil strength. If five or
more values were ‘‘missing’’, then the remaining values
were not used. For normally distributed values, the
median and the mean are similar.
2.3. Soil bulk density and water content
Bulk density was measured on soil samples collected
in 100 cm3 stainless steel cylinders of approximately
5 cm height. Each cylinder was then closed at both ends
with metal caps and was then placed in a polythene bag
that was closed tightly. This ensured that the samples
would remain at their field water content. Usually, four
replicate samples were taken from each layer although
in a few cases there were more (e.g. 8). These were dried
at 105 8C for 48 h in an oven. The dry mass of the soil
divided by the cylinder volume gave the bulk density, D
(g cm�3 = Mg m�3). The gravimetric water content, u(kg kg�1) was calculated as the mass of water in the soil
sample divided by the mass of the dry soil.
2.4. Water retention characteristics
Soil water retention was measured as follows.
Samples were collected in 100 cm3 stainless steel
cylinders of approximately 5 cm height. Each cylinder
was then closed at both ends with metal caps and was
then placed in a polythene bag that was closed tightly.
This ensured that the samples would remain at their
field water content. The importance of preventing
A.R. Dexter et al. / Soil & Tillage Research 93 (2007) 412–419 415
samples from drying has been shown by Baumgartl
(2003). He showed that drying a soil to water contents
drier than it has experienced before can cause
irreversible shrinkage with corresponding changes to
the pore size distribution and the water retention
characteristic. Samples were not collected from every
10 cm depth layer, but usually only from three depth
layers: the middle of the plough layer (e.g. 10–15 cm
depth), the compaction pan (e.g. at 30 cm depth), and
from the sub-soil (at 40 or 50 cm depth). All samples
were from well-defined soil layers.
The water retention characteristic for each layer
was measured at 11 different pore water suctions:
h = 10, 20, 40, 80, 250, 500, 1000, 2000, 4000, 8000
and 15,000 hPa. Sample height was approximately
5 cm for the first four suctions, 2.5 cm at 250 hPa and
1 cm for the higher suctions. The 2.5 cm samples were
prepared by removing the top half of the soil from
cylinders with a spoon. The 1 cm samples were
prepared by crumbling the soil into small aggregates.
These aggregates were still very large compared with
the size-scale of the soil features being investigated at
those suctions. The use of aggregates ensures that
there are many points of contact between the soil and
the ceramic pressure plates. Larger samples were used
at the lower suctions in order to have samples that
were large compared with the sizes of the structural
features being investigated (i.e. ‘‘representative
samples’’). Smaller samples (i.e. samples of lower
height) were used at the higher suctions in order to
reduce the time for equilibration of the soil water.
Sample size is always a compromise between these
two conflicting requirements. Two different replicates
were measured at each suction, therefore, 22 samples
were used to generate each water retention curve. It
should be noted that ‘‘suctions’’ are used here because
they are necessary in the van Genuchten (1980)
equation (suction = �matric water potential, where
the matric water potential is negative in unsaturated
soils). However, the van Genuchten equation works
only with positive numbers.
The sets of (u, h) data were fitted to the van
Genuchten (1980) water retention equation:
u ¼ ðusat � uresÞ½1þ ðahÞn��m þ ures (5)
where, u (kg kg�1) is the gravimetric water content at a
suction h, usat and ures, are the saturated and residual
water contents, respectively, h (hPa) is the pore water
suction, a (hPa�1) is a reciprocal suction that is char-
acteristic for the soil, and m and n are dimensionless
variables that describe the shape of the curve.
However, m and n were not considered as
independent variables but were assumed to be related
by the Mualem (1976) constraint:
m ¼ 1� 1
n(6)
The non-linear Eq. (5) was fitted iteratively to the
experimental data for each soil using the Levenberg–
Marquardt method (Marquardt, 1963).
Because not every depth layer was characterized,
the van Genuchten parameters for 15 cm depth were
used with the penetration resistance at both 10 and
20 cm depth. Similarly, the parameters for 40 or 50 cm
depth were used to characterize both the 40 and 50 cm
depths.
2.5. S and effective stress
The value of S was calculated as described by Dexter
(2004a) from the parameters of the fitted van Genuchten
(1980) equation using
S ¼ �nðusat � uresÞ�
1þ 1
m
��ð1þmÞ(7)
The value of the effective stress was calculated from
s0 ¼ xh (8)
where x is the degree of saturation (=(u � ures)/
(umax � ures)) and h (hPa) is the prevailing pore water
suction calculated using the inverted form of Eq. (5):
hðxÞ ¼ 1
a½x�1=m � 1�1=n
(9)
3. Results and discussion
The soils used had clay contents in the range from 2
to 25% with an arithmetic mean of 9.9%. Organic
matter (OM) contents ranged from 0.03 to 2.4% with a
mean of 1.21%, and bulk density (D) values ranged
from 1.24 to 1.81 g cm�3 with a mean of 1.54 g cm�3.
The values of bulk density in any one soil had a mean
standard deviation of 0.044 g cm�3. The mean gravi-
metric water content of the soils was 0.15 kg kg�1.
In a few locations, the penetrometer was able to
penetrate to its full working depth with every replicate.
Tests on these data using the Shapiro-Wilk normality
test show that in the majority of cases, the values of
penetrometer resistance, Q, at a given depth were
normally distributed to a level of statistical significance
of P = 0.05. We took this as justification of the use of
A.R. Dexter et al. / Soil & Tillage Research 93 (2007) 412–419416
median values for locations where there were missing
values.
Although 15 out of the total of 85 soil layers had
degrees of saturation less than 0.4, we decided to use
Eq. (8) in every case because of its simplicity and ease
of use.
Measured values of penetration resistance, Q, were
regressed against 1/S and s0. This resulted in the
equation
Q ¼ 328ð�319Þ
þ 37:39ð�6:05Þ
�1
S
�þ 1:615ð�0:399Þ
s0 kPa;
r2 ¼ 0:375; p< 0:001
(10)
The three coefficients in Eq. (10) were different from
zero at the p = 0.2, p < 0.001 and p < 0.001 levels of
significance, respectively. In principle, the equation
could have been fitted without the constant term
because it is not significantly different from zero.
However, it was decided to keep it in order to have
residual values that were normally distributed. Interest-
ingly, when an interaction term (s0/S), was included it
was found to be not statistically significant (T = �0.17),
and did not increase the value of r2.
The low value of r2 requires some comment and
explanation. It is at least in part due to the spatial
variation of soil properties in the field. As discussed
above, the penetration resistance, water content and
bulk density, and the water retention characteristics
were all made using different soil samples. The extent to
which these all used ‘‘representative soil’’ is unknown.
Similarly, the water retention characteristics were not
determined for every soil layer as described at the end of
Section 2.4.
Table 1 provides some information about the
variability of key physical properties of soils of
different genetic origin used in the experiments. The
Table 1
Representative values of the coefficients of variation (COVs) found for
the measurements of bulk density, D, gravimetric water content, u, and
penetrometer resistance, Q
Genetic origin Plough layer Subsoil
D u Q D u Q
Alluvium 0.023 0.023 0.39 0.047 0.035 0.14
Loess 0.028 0.024 0.29 0.039 0.024 0.19
Glacial till 0.027 0.071 0.38 0.012 0.051 0.35
Separate values are given for the plough layer and for the subsoil
layers for soils of the three different genetic origins used in the
experiments. The values are for a single depth at a single point and
on a single measurement date. They do not include between-site
variation.
variabilities are expressed as mean values of the
coefficient of variation (standard deviation divided by
the mean). There were no statistically significant
correlations between the values of D and u even though
these were measured on the same samples. It can readily
be shown that the variations in D and u do not fully
account for the observed variations in Q. For example, if
the value of D is set 1 standard deviation higher and the
value of u is set 1 standard deviation lower than some
measured value (both of which would tend to increase
Q), then the predicted value of Q increases by only
about 6%. We, therefore, conclude that factors other
than D and u contribute to the values of Q measured in
the field.
The Pearson correlation coefficient between mea-
sured values of Q and those predicted using Eq. (10) is:
R ¼ 0:612; p< 0:001 (11)
This may be compared with that between measured
values of Q and those predicted using the Canarache
(1990a, 1990b) method for the same set of Polish soils:
R ¼ 0:532; p< 0:001 (12)
Although Eq. (11) shows a higher correlation
coefficient for Eq. (10), this is partly to be expected
because Eq. (10) was tested using the Polish soil data
used in its development. However, the Canarache
equations were developed using data for Romanian soils
having on average higher clay contents.
When we compared the measured values of Q with
those predicted using Eq. (3) using To and Kay’s
coefficients for loam for all the soils, we obtained only
R ¼ 0:274; p ¼ 0:21 (13)
When their coefficients for sand were used, R was
smaller.
We attribute the small value of R in Eq. (13) to the
fact that pore water suctions, h, were here estimated
from measured water contents in combination with the
inverted van Genuchten equation (Eq. (9)). This is in
contrast with the work of To and Kay (2005) who were
able to control the values of h in the laboratory. Another
factor is that To and Kay’s equations were developed
using Canadian soils, but were tested here on Polish
soils.
The fit of Eq. (10), as measured by r2, is low. We
believe that this is largely due to the spatial variation of
the soil physical properties in the field and because the
water content, bulk density and water retention
characteristics were measured on different soil samples.
Additionally, values of pore water suction, h, must be
estimated from measured soil water contents in
A.R. Dexter et al. / Soil & Tillage Research 93 (2007) 412–419 417
Table 2
Typical values of S for the 12 FAO/USDA soil texture classes together with the parameters used in their calculation
FAO/USDA texture class % Clay % Silt OM (%) D (Mg m�3) usat (kg kg�1) a (hPa�1) n S
cl 60 20 4.47 1.249 0.395 0.0217 1.103 0.0296
sa cl 42 7 3.61 1.334 0.335 0.0616 1.139 0.0317
si cl 47 47 3.85 1.309 0.362 0.0220 1.104 0.0273
cl l 34 34 3.22 1.376 0.324 0.0400 1.127 0.0285
si cl l 34 56 3.22 1.376 0.325 0.0226 1.129 0.0290
sa cl l 27 13 2.89 1.414 0.299 0.0727 1.169 0.0326
l 17 41 2.41 1.474 0.278 0.0314 1.208 0.0354
si l 14 66 2.26 1.492 0.269 0.0134 1.245 0.0385
si 5 87 1.83 1.552 0.243 0.0045 1.392 0.0485
sa l 10 28 2.07 1.518 0.258 0.0400 1.278 0.0405
1 sa 4 13 1.78 1.559 0.239 0.0534 1.406 0.0488
sa 3 3 1.73 1.566 0.226 0.0671 1.581 0.0594
Values of organic matter content (OM) and bulk density, r, were obtained as described in Dexter (2004a). The values of the parameters usat, a and n of
Eq. (5) were calculated using the values for clay, silt, OM and r in the pedotransfer functions of Wosten et al. (1999). Notes: sa = sand, si = silt,
l = loam, cl = clay.
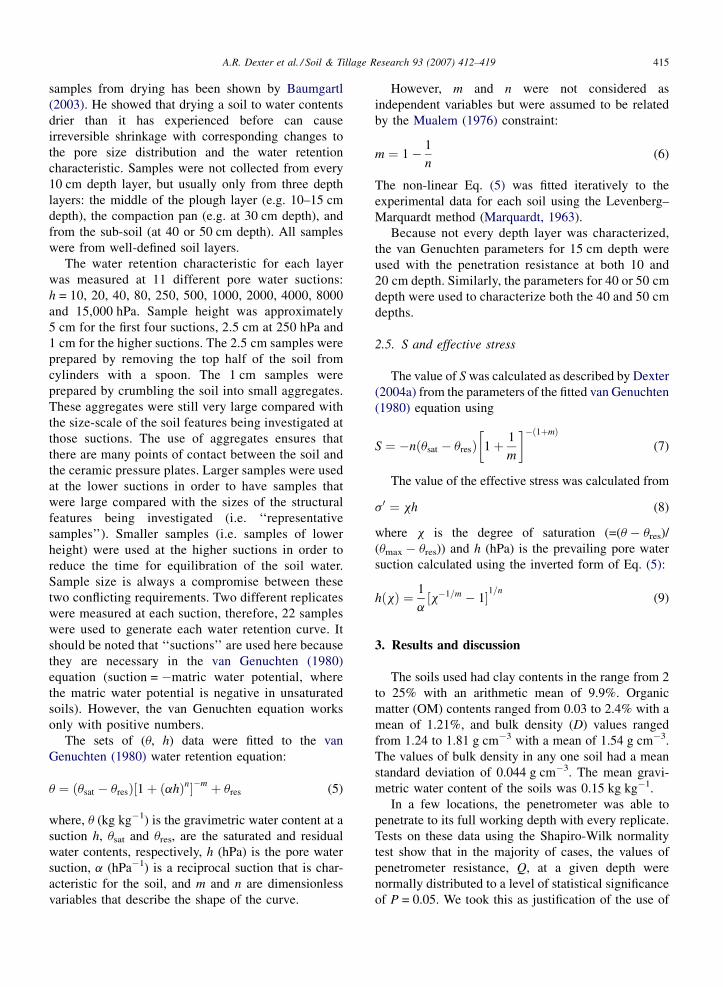
Fig. 1. Predicted values of the index of soil physical quality, S, that
correspond with values of penetrometer resistance, Q, for two differ-
ent values of soil water suction, h.
combination with the inverted form of the van
Genuchten equation (Eq. (9)) the parameters of which
also have associated measurement errors and spatial
variability.
One of the main assumptions that has been made is
that penetrometer resistance is directly proportional to
effective stress. No account has been taken of the fact
that soil shear strength increases with the product of the
effective stress and the coefficient of internal friction,
tan w, of the soil. Although a value of w of around 358 is
typical for agricultural soils, the actual range varies
from 0 to 458. The value of w tends to be larger with
increasing particle size and with increasing particle
angularity (Dexter and Tanner, 1972). It is also true that
neither friction between the penetrometer cone and the
soil nor possible cementation between soil particles is
accounted for in the approach used here.
The effects of soil/penetrometer friction could be
removed by the use of a rotating penetrometer, as used
by Whalley et al. (2005). Those authors found that
effective stress alone could be used to predict
penetrometer resistance in soils of low density, but
not in soils of high density. This is exactly what is
predicted by Eq. (10): at low densities, S is large and the
effective stress term dominates; however, at high
densities, S is small and effective stress alone is not
sufficient for prediction of Q.
4. Examples of some predictions
For the purposes of these predictions we use the data
for different soil textural classes presented in Table 2.
We also use the PTFs of Wosten et al. (1999) which give
the parameters of the van Genuchten water retention
equation in terms of soil composition and bulk density.
These are the same data that were used for illustrative
purposes in Dexter (2004a, 2004b, 2004c). This enables
derived results to be compared directly.
Fig. 1 shows the values of S that correspond to
different values of penetrometer resistance, Q, at two
values of water matric suction, h. Both values of h
correspond to ‘‘field capacity’’. However, h = 100 hPa
is the value used in most countries for the suction to
which saturated soil will drain, whereas, h = 330 hPa is
the value used in the USA. The values were calculated
by setting the value of h and then calculating the
corresponding values of u for the different soil texture
classes. Then the value of D was iterated until the value
of Q was 1000, 1250, 1500, etc. (kPa). The values in the
graph are the means for all the 12 FAO/USDA soil
texture classes shown in Table 2.
A.R. Dexter et al. / Soil & Tillage Research 93 (2007) 412–419418
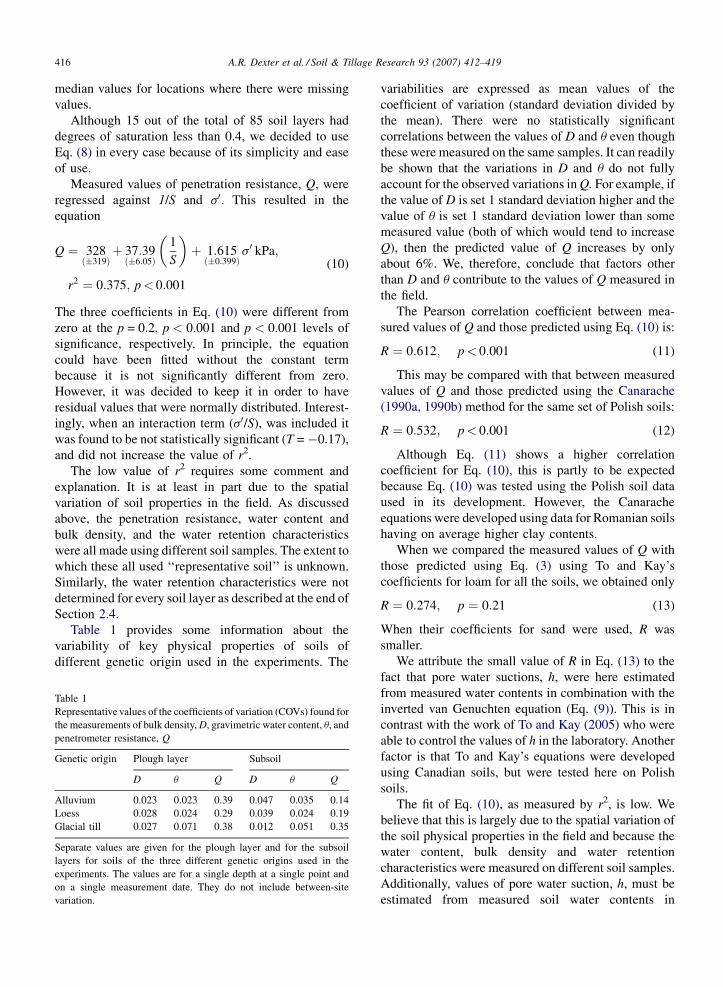
Fig. 2. Values of bulk density, D, for different values of soil clay
content that are predicted to give various values of penetration
resistance, Q, at a soil water suction of h = 100 hPa.
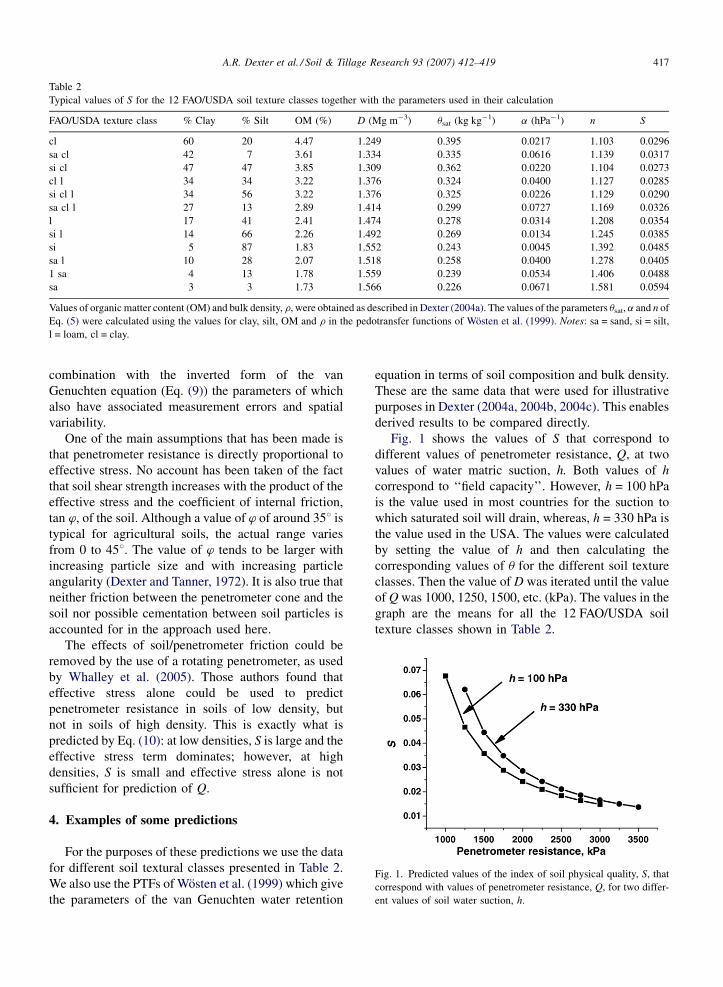
Fig. 3. Predictions of how penetrometer resistance, Q, varies with
gravimetric water content, u, for three soil texture classes.
By iteration, it is also possible to estimate the values
of soil bulk density for soils with different clay contents
(as given in Table 2) that will give various values of
penetrometer resistance, Q, when the soil is at field
capacity (defined as h = 100 hPa). The results are shown
in Fig. 2. These curves were fitted to the following
equations:
� F
or Q = 1500 kPa when h = 100 hPa:D ¼ 1:107þ 0:774 exp
��clay
22:47
�; r2 ¼ 0:989
(14)
� F
or Q = 2000 kPa when h = 100 hPa:D ¼ 1:203þ 0:785 exp
��clay
32:75
�; r2 ¼ 0:989
(15)
� F
or Q = 2500 kPa when h = 100 hPa:D ¼ 1:282þ 0:777 exp
��clay
39:38
�; r2 ¼ 0:991
(16)
� F
or Q = 3000 kPa when h = 100 hPa:D ¼ 1:348þ 0:762 exp
��clay
43:61
�; r2 ¼ 0:991
(17)
Predicted values of penetrometer resistance, Q, as a
function of gravimetric water content, u, are shown for
three soil texture classes in Fig. 3. This was calculated
using the representative soil properties as given in
Table 2. It should be noted that the effect of water
content occurs entirely through the effective stress.
As explained above, the results presented in
Figs. 1–3 are based on predictions using the
pedotransfer functions of Wosten et al. (1999). They,
therefore, represent predictions based on the average
properties of European soils of the given texture
classes. It must not be assumed that these predictions
are accurate for any particular soil. However, it may be
assumed that the trends and effects that they illustrate
are typical.
5. Conclusions
The equation (Eq. (10)) that has been proposed for
penetrometer resistance is the sum of two simple terms:
one represents the degree of compactness of the soil,
whereas, the other represents the effect of water. The
first term is the reciprocal of Dexter’s (2004) index of
soil physical quality. The second is the effective stress
due to pore water pressure.
We conjecture that this equation is applicable to all
soil types and texture classes without any change in
equation parameters. However, this needs to be tested in
future research.
The equation that is proposed (Eq. (10)) is both
logical and physically meaningful. Future research
should be aimed at testing this proposed equation in a
wider range of soil types. The equation could perhaps be
improved by taking account of friction.
Acknowledgement
Ms. O.P. Gate would like to thank the European
Commission Proland project (contract number QLK4-
CT-2002-30663) for the support that enabled this work
to be done.
A.R. Dexter et al. / Soil & Tillage Research 93 (2007) 412–419 419
References
Baumgartl, T., 2003. Kopplung von mechanischen und hydraulischen
Bodenzustandsfunktionen zur Bestimmung und Modellierung von
Zugspannungen und Volumenanderungen in porosen Medien.
Schriftenreihe Nr. 62, Institut fur Pflanzenernahrung und Boden-
kunde, Universitat Kiel, 133 pp.
Bengough, A.G., Campell, D.J., O’Sullivan, M.F., 2001. Penetrometer
techniques in relation to soil compaction and root growth. In:
Smith, K.A., Mullins, C.E. (Eds.), Soil and Environmental Ana-
lysis. 2nd ed. Marcel Dekker, New York, pp. 377–403.
Canarache, A., 1990a. Fizica Solurilor Agricole. Ceres Press, Bucar-
est, pp. 268.
Canarache, A., 1990b. PENETR-a generalized semi-empirical model
estimating soil resistance to penetration. Soil Till. Res. 16, 51–70.
da Silva, A.P., Kay, B.D., 1997. Estimating the least limiting water
range of soils from properties and management. Soil Sci. Soc. Am.
J. 61, 877–883.
Dawidowski, J.B., Worona, M., Hencel, A., 1988. The determination
of plow draft from soil penetration resistance. In: Proceedings of
the 11th International Conference on Soil Tillage Research Orga-
nisation, vol. 2, Edinburgh, Scotland, pp. 457–462.
Dexter, A.R., 2004a. Soil physical quality. Part I: Theory, effects of
soil texture, density and organic matter, and effects on root growth.
Geoderma 120, 201–214.
Dexter, A.R., 2004b. Soil physical quality. Part II: Friability, tillage,
tilth and hard-setting. Geoderma 120, 215–226.
Dexter, A.R., 2004c. Soil physical quality. Part III: Unsaturated
hydraulic conductivity and general conclusions about S-theory.
Geoderma 120, 227–239.
Dexter, A.R., Tanner, D.W., 1972. Penetration of Spheres Into Soil.
Part II: Correlations and Conclusions. Report DN/ER/245/1162,
National Institute of Agricultural Engineering, Silsoe, England, 19
pp.
Dexter, A.R., Zoebisch, M.A., 2002. Critical limits of soil properties
and irreversible soil degradation. In: Lal, R. (Ed.), Encyclopedia
of Soil Science. Marcel Dekker, New York, pp. 272–276.
Hakansson, I., 1990. A method for characterizing the state of com-
pactness of the plough layer. Soil Till. Res. 16, 105–120.
Marquardt, D.W., 1963. An algorithm for least squares estimation of
non-linear parameters. J. Soc. Ind. Appl. Math. 11, 431–441.
Mualem, Y., 1976. A new model for predicting the hydraulic con-
ductivity of unsaturated porous media. Water Resour. Res. 12,
513–522.
Mullins, C.E., Panayiotopoulos, K.P., 1984. The strength of unsatu-
rated mixtures of sand and kaolin and the concept of effective
stress. J. Soil Sci. 35, 459–468.
Taylor, H.M., Ratliff, L.F., 1969. Root elongation rates of cotton and
peanuts as a function of soil strength and soil water content. Soil
Sci. 108 (2), 113–119.
To, J., Kay, B.D., 2005. Variation in penetrometer resistance with soil
properties: the contribution of effective stress and implications for
pedotransfer functions. Goederma 126, 261–276.
Towner, G.D., Childs, E.C., 1972. The mechanical strength of unsa-
turated porous granular materials. J. Soil Sci. 23, 481–498.
van Genuchten, M.Th., 1980. A closed-form equation for predicting
the hydraulic conductivity of unsaturated soils. Soil Sci. Soc. Am.
J. 44, 892–898.
Vepraskas, M.J., 1984. Cone index of loamy sands as influenced by
pore size distribution and effective stress. Soil Sci. Soc. Am. J. 48,
1220–1225.
Whalley, W.R., Leeds-Harrison, P.B., Clark, L.J., Gowing, D.J.G.,
2005. Use of effective stress to predict the penetrometer resistance
of unsaturated agricultural soils. Soil Till. Res. 84, 18–27.
Wosten, J.H.M., Lilly, A., Nemes, A., Le Bas, C., 1999. Development
and use of a database of hydraulic properties of European soils.
Geoderma 90, 169–185.


![Lunar Surface Systems Concept Study Innovative Low ...2. Penetration resistance gradient, G [Pa/mm] • Compact the soil to match the penetration resistance gradient of the Apollo](https://img.pdfslide.us/doc/110x75/5fed1d002ae03915723e6b34/lunar-surface-systems-concept-study-innovative-low-2-penetration-resistance.jpg)