Embed Size (px)
Citation preview
A Method for Design and PerformanceModeling of Client/Server Systems
Daniel A. Menasce , Member, IEEE Computer Society, and
Hassan Gomaa, Member, IEEE Computer Society
AbstractÐDesigning complex distributed client/server applications that meet performance requirements may prove extremely difficult
in practice if software developers are not willing or do not have the time to help software performance analysts. This paper advocates
the need to integrate both design and performance modeling activities so that one can help the other. We present a method developed
and used by the authors in the design of a fairly large and complex client/server application. The method is based on a software
performance engineering language developed by one of the authors. Use cases were developed and mapped to a performance
modeling specification using the language. A compiler for the language generates an analytic performance model for the system.
Service demand parameters at servers, storage boxes, and networks are derived by the compiler from the system specification. A
detailed model of DBMS query optimizers allows the compiler to estimate the number of I/Os and CPU time for SQL statements. The
paper concludes with some results of the application that prompted the development of the method and language.
Index TermsÐSoftware performance engineering, performance models, client/server systems, queuing networks, database query
optimization, UML, CLISSPE.
æ
1 INTRODUCTION
AN increasing number of organizations are movingmission-critical applications from mainframe environ-
ments to client/server (C/S) systems. Designing distributedC/S applications that meet performance requirements is nota trivial task for complex and distributed C/S systems.There are often a large number of software and hardwarearchitectural choices to be made when designing a C/Ssystem. It is usually not clear what the impact onperformance is of the various choices. Examples of thesechoices include the distribution of work between client andserver, use of three-tiered C/S architectures, distribution offunctions among servers, distribution of database tablesamong servers, type of client and servers, and networkconnectivity. Waiting until the application is ready to gointo production is not a viable option, since poor perfor-mance may require major code redesign and rewrite. This isusually very expensive in terms of development cost andcost incurred by a delayed deployment of the newapplication.
To ensure that the new application will meet the
performance requirements, software performance engineer-
ing (SPE) [11], [22], [27], [41] techniques have to be
employed during the software design and development
process. These techniques estimate the demands of the new
application and use performance models to predict the
performance of the new system.
This paper advocates the need to integrate both designand performance modeling activities, so that one can helpthe other. We describe an iterative approach for designing asystem and modeling its performance before it is imple-mented. The goal is to analyze the design from aperformance perspective, to compare alternative designs,and to compare the design executing on different systemconfigurations. To do this, it is necessary to model thedesign at the level of granularity of message communica-tion between client and server and model the applicationfunctionality at the client and server side to capture theapplication logic and pattern of access to the systemresources. In a relational database intensive C/S applica-tion, it is necessary to explicitly model the relations usedand the access patterns to these relations by the application.
The design method described in this paper is an object-oriented approach based on use cases, a structural viewusing object models, and a dynamic view using objectcollaboration diagrams and is based on the concepts ofJacobson and Rumbaugh. When the project was carried out,we used the earlier notations given in [15], [36]. For thepurposes of this paper, we have used the newer UMLnotation [1], [14], [35], [10].
The performance modeling aspect of the method is basedon a language, called CLISSPE (Client/Server SoftwarePerformance Evaluation) [22], that can be used by softwaredevelopers to specify use cases and by performanceanalysts for software performance prediction. The needfor this method was prompted by the involvement of theauthors in the redesign and capacity planning of a verylarge mission-critical application.
The CLISSPE language allows designers of C/S systems todescribe different kinds of objects such as servers, clients,databases, relational database tables, transactions, and net-works, as well as the relationship between them. Examples of
1066 IEEE TRANSACTIONS ON SOFTWARE ENGINEERING, VOL. 26, NO. 11, NOVEMBER 2000
. D.A. Menasce is with the Department of Computer Science, George MasonUniversity, Fairfax, VA 22030-4444. E-mail: [email protected].
. H. Gomaa is with the Information and Software Engineering Department,George Mason University, Fairfax, VA 22030-4444.E-mail: [email protected].
Manuscript received 6 Apr. 1999; revised 7 Oct. 1999; accepted 15 Mar. 2000.Recommended for acceptance by A. Cheng, P. Clements, and M. Woodside.For information on obtaining reprints of this article, please send e-mail to:[email protected], and reference IEEECS Log Number 111941.
0098-5589/00/$10.00 ß 2000 IEEE
relationships include mappings of servers and clients tonetworks and mappings of database tables to servers. Thelanguage also allows the designer to specify the actionsexecuted by each transaction. A CLISSPE specificationcompiles into an analytic queuing network model for theC/S system allowing for the capacity planning of theapplication under development. Service demand parametersat servers, storage boxes, and networks are derived by thecompiler from the system specification. A detailed model ofDBMS query optimizers allows the compiler to estimate thenumber of I/Os and CPU time for SQL statements.
The rest of this paper is organized as follows: Section 2presents a brief overview of SPE and the elements of theCLISSPE language. Section 3 discusses the application thatmotivated the development of the method presented hereand the design of the CLISSPE language. Section 4 providesan overview of the method. Sections 5 through 12 providedetails of each step of the method. Section 13 provides theanalytic models used by the CLISSPE compiler to determineservice demands due to database accesses. Section 14discusses the parameter gathering activity for the projectthat motivated this study. A few results of this study arediscussed in Section 15. Section 16 presents a discussion ofour approach and elaborates on future work. Finally, someconcluding remarks are given in Section 17.
2 SPE AND CLISSPE
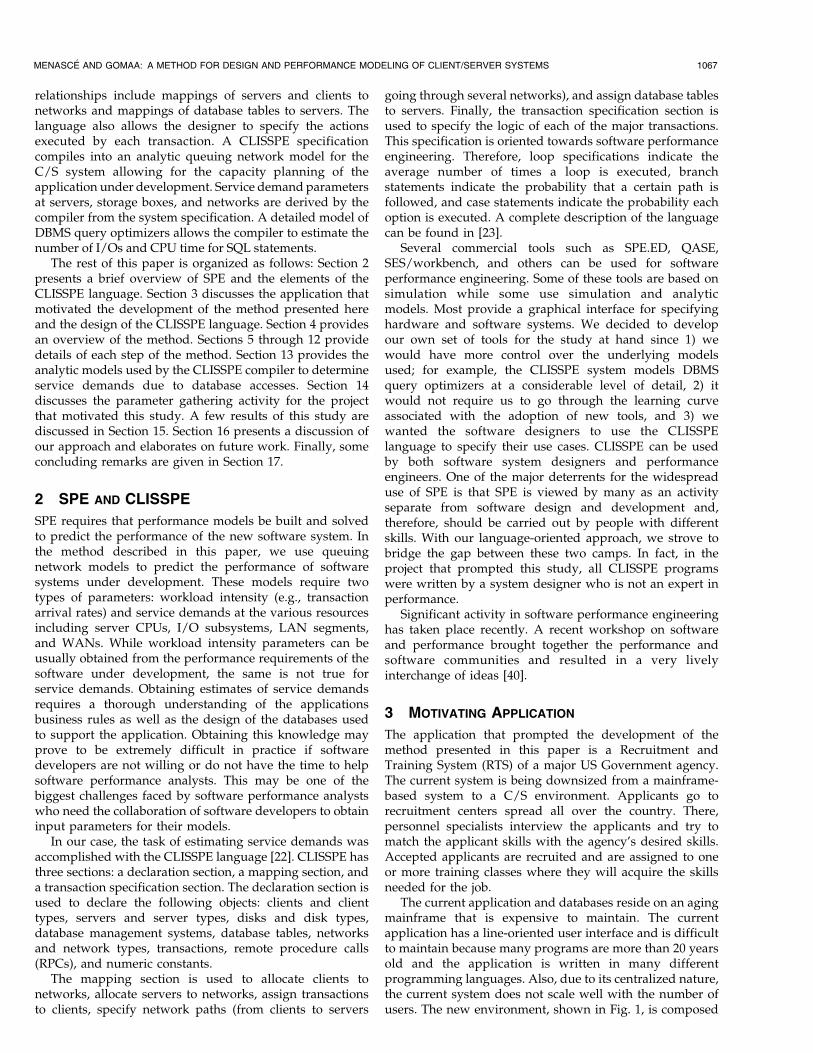
SPE requires that performance models be built and solvedto predict the performance of the new software system. Inthe method described in this paper, we use queuingnetwork models to predict the performance of softwaresystems under development. These models require twotypes of parameters: workload intensity (e.g., transactionarrival rates) and service demands at the various resourcesincluding server CPUs, I/O subsystems, LAN segments,and WANs. While workload intensity parameters can beusually obtained from the performance requirements of thesoftware under development, the same is not true forservice demands. Obtaining estimates of service demandsrequires a thorough understanding of the applicationsbusiness rules as well as the design of the databases usedto support the application. Obtaining this knowledge mayprove to be extremely difficult in practice if softwaredevelopers are not willing or do not have the time to helpsoftware performance analysts. This may be one of thebiggest challenges faced by software performance analystswho need the collaboration of software developers to obtaininput parameters for their models.
In our case, the task of estimating service demands wasaccomplished with the CLISSPE language [22]. CLISSPE hasthree sections: a declaration section, a mapping section, anda transaction specification section. The declaration section isused to declare the following objects: clients and clienttypes, servers and server types, disks and disk types,database management systems, database tables, networksand network types, transactions, remote procedure calls(RPCs), and numeric constants.
The mapping section is used to allocate clients tonetworks, allocate servers to networks, assign transactionsto clients, specify network paths (from clients to servers
going through several networks), and assign database tablesto servers. Finally, the transaction specification section isused to specify the logic of each of the major transactions.This specification is oriented towards software performanceengineering. Therefore, loop specifications indicate theaverage number of times a loop is executed, branchstatements indicate the probability that a certain path isfollowed, and case statements indicate the probability eachoption is executed. A complete description of the languagecan be found in [23].
Several commercial tools such as SPE.ED, QASE,SES/workbench, and others can be used for softwareperformance engineering. Some of these tools are based onsimulation while some use simulation and analyticmodels. Most provide a graphical interface for specifyinghardware and software systems. We decided to developour own set of tools for the study at hand since 1) wewould have more control over the underlying modelsused; for example, the CLISSPE system models DBMSquery optimizers at a considerable level of detail, 2) itwould not require us to go through the learning curveassociated with the adoption of new tools, and 3) wewanted the software designers to use the CLISSPElanguage to specify their use cases. CLISSPE can be usedby both software system designers and performanceengineers. One of the major deterrents for the widespreaduse of SPE is that SPE is viewed by many as an activityseparate from software design and development and,therefore, should be carried out by people with differentskills. With our language-oriented approach, we strove tobridge the gap between these two camps. In fact, in theproject that prompted this study, all CLISSPE programswere written by a system designer who is not an expert inperformance.
Significant activity in software performance engineeringhas taken place recently. A recent workshop on softwareand performance brought together the performance andsoftware communities and resulted in a very livelyinterchange of ideas [40].
3 MOTIVATING APPLICATION
The application that prompted the development of themethod presented in this paper is a Recruitment andTraining System (RTS) of a major US Government agency.The current system is being downsized from a mainframe-based system to a C/S environment. Applicants go torecruitment centers spread all over the country. There,personnel specialists interview the applicants and try tomatch the applicant skills with the agency's desired skills.Accepted applicants are recruited and are assigned to oneor more training classes where they will acquire the skillsneeded for the job.
The current application and databases reside on an agingmainframe that is expensive to maintain. The currentapplication has a line-oriented user interface and is difficultto maintain because many programs are more than 20 yearsold and the application is written in many differentprogramming languages. Also, due to its centralized nature,the current system does not scale well with the number ofusers. The new environment, shown in Fig. 1, is composed
MENASC�E AND GOMAA: A METHOD FOR DESIGN AND PERFORMANCE MODELING OF CLIENT/SERVER SYSTEMS 1067
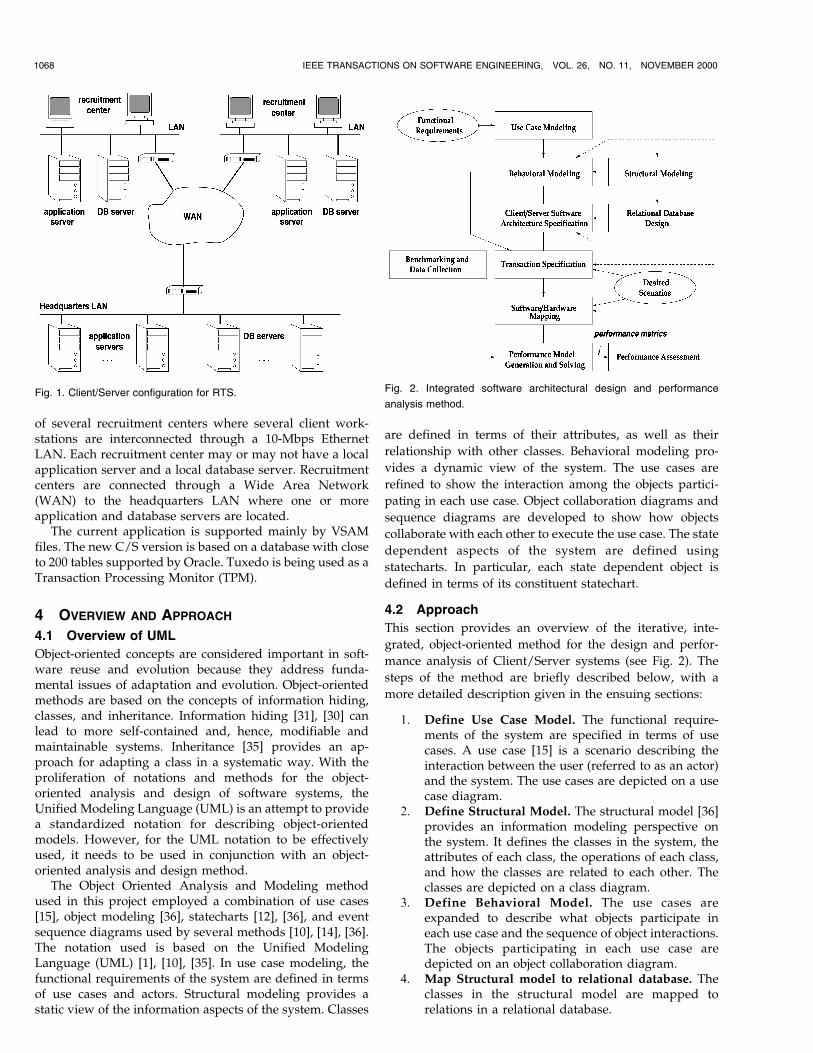
of several recruitment centers where several client work-stations are interconnected through a 10-Mbps EthernetLAN. Each recruitment center may or may not have a localapplication server and a local database server. Recruitmentcenters are connected through a Wide Area Network(WAN) to the headquarters LAN where one or moreapplication and database servers are located.
The current application is supported mainly by VSAMfiles. The new C/S version is based on a database with closeto 200 tables supported by Oracle. Tuxedo is being used as aTransaction Processing Monitor (TPM).
4 OVERVIEW AND APPROACH
4.1 Overview of UML
Object-oriented concepts are considered important in soft-ware reuse and evolution because they address funda-mental issues of adaptation and evolution. Object-orientedmethods are based on the concepts of information hiding,classes, and inheritance. Information hiding [31], [30] canlead to more self-contained and, hence, modifiable andmaintainable systems. Inheritance [35] provides an ap-proach for adapting a class in a systematic way. With theproliferation of notations and methods for the object-oriented analysis and design of software systems, theUnified Modeling Language (UML) is an attempt to providea standardized notation for describing object-orientedmodels. However, for the UML notation to be effectivelyused, it needs to be used in conjunction with an object-oriented analysis and design method.
The Object Oriented Analysis and Modeling methodused in this project employed a combination of use cases[15], object modeling [36], statecharts [12], [36], and eventsequence diagrams used by several methods [10], [14], [36].The notation used is based on the Unified ModelingLanguage (UML) [1], [10], [35]. In use case modeling, thefunctional requirements of the system are defined in termsof use cases and actors. Structural modeling provides astatic view of the information aspects of the system. Classes
are defined in terms of their attributes, as well as their
relationship with other classes. Behavioral modeling pro-
vides a dynamic view of the system. The use cases are
refined to show the interaction among the objects partici-
pating in each use case. Object collaboration diagrams and
sequence diagrams are developed to show how objects
collaborate with each other to execute the use case. The state
dependent aspects of the system are defined using
statecharts. In particular, each state dependent object is
defined in terms of its constituent statechart.
4.2 Approach
This section provides an overview of the iterative, inte-
grated, object-oriented method for the design and perfor-
mance analysis of Client/Server systems (see Fig. 2). The
steps of the method are briefly described below, with a
more detailed description given in the ensuing sections:
1. Define Use Case Model. The functional require-ments of the system are specified in terms of usecases. A use case [15] is a scenario describing theinteraction between the user (referred to as an actor)and the system. The use cases are depicted on a usecase diagram.
2. Define Structural Model. The structural model [36]provides an information modeling perspective onthe system. It defines the classes in the system, theattributes of each class, the operations of each class,and how the classes are related to each other. Theclasses are depicted on a class diagram.
3. Define Behavioral Model. The use cases areexpanded to describe what objects participate ineach use case and the sequence of object interactions.The objects participating in each use case aredepicted on an object collaboration diagram.
4. Map Structural model to relational database. Theclasses in the structural model are mapped torelations in a relational database.
1068 IEEE TRANSACTIONS ON SOFTWARE ENGINEERING, VOL. 26, NO. 11, NOVEMBER 2000
Fig. 1. Client/Server configuration for RTS. Fig. 2. Integrated software architectural design and performance
analysis method.
5. Develop the Client/Server Software Architecture.The C/S software architecture is designed. The goalis to have a configurable message based design thatallows objects to be mapped to client or servernodes.
6. Develop the Transaction Specification. The trans-actions are specified in the CLISSPE language.
7. Define Software/Hardware Mapping. The C/Ssoftware architecture is mapped to a specific systemconfiguration.
8. Performance Modeling and Assessment. The per-formance model is based on queuing networkmodels [27]. A discussion on analytic models ofsoftware systems is outside the scope of this paper.Several methods such as Layered Queuing Models[34], the Rendez-vouz method [43], and approxima-tions to simultaneous resource possession [20], [25]for Mean Value Analysis [33] can be used. Othermodels of C/S systems can be found in [3], [32]. Theoutputs of the performance model include responsetimes and throughputs for each type of requestsubmitted to the system. An analysis of the results ofthe performance model reveals the possible bottle-necks. If the C/S configuration does not meet theperformance objectives, architectural changes at thehardware and/or software level have to take place.These changes, guided by the outputs of theperformance model, may be applied to the C/Ssoftware software architecture, the transaction spe-cification, the software/hardware mapping, or pos-sibly even the refined use cases. Successive iterationsensure that the final design meets the performanceobjectives.
5 STEP 1: USE CASE MODELING
The functional requirements of the system are specified interms of use cases. A use case is a scenario describing theinteraction between the user (referred to as an actor) and thesystem. In the requirements phase, the use case considersthe system as a black box and describes the interactionsbetween the user and the system in a narrative formconsisting of user inputs and system responses. Use casesmay be structured using the Uses and Extends concepts tomaximize extensibility and reuse. This step follows Jacob-son's use-case driven approach [14], [15].
Abstract use cases reflect functionality that is common tomore than one use case. Analysis of several use cases canreveal common parts among these use cases. By separatingout this common functionality into an abstract use case, theabstract use case and the objects that participate in it, can bereused by several concrete (executable) use cases.
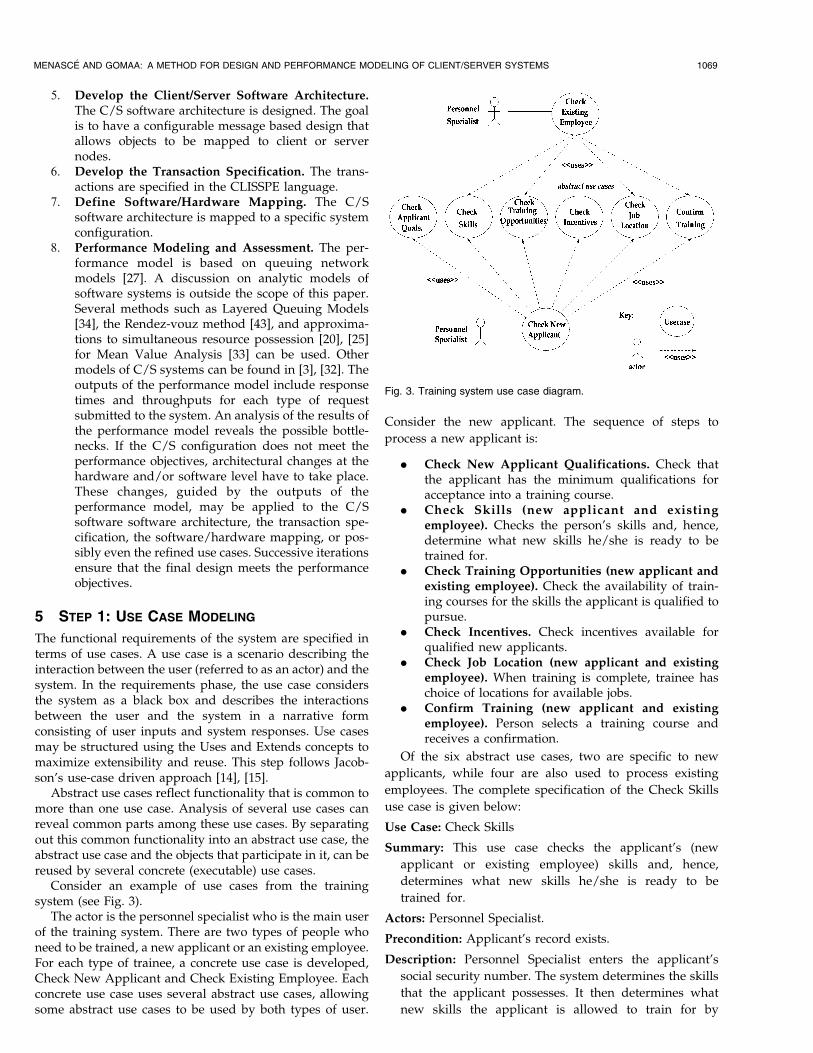
Consider an example of use cases from the trainingsystem (see Fig. 3).
The actor is the personnel specialist who is the main userof the training system. There are two types of people whoneed to be trained, a new applicant or an existing employee.For each type of trainee, a concrete use case is developed,Check New Applicant and Check Existing Employee. Eachconcrete use case uses several abstract use cases, allowingsome abstract use cases to be used by both types of user.
Consider the new applicant. The sequence of steps to
process a new applicant is:
. Check New Applicant Qualifications. Check thatthe applicant has the minimum qualifications foracceptance into a training course.
. Check Skills (new applicant and existingemployee). Checks the person's skills and, hence,determine what new skills he/she is ready to betrained for.
. Check Training Opportunities (new applicant andexisting employee). Check the availability of train-ing courses for the skills the applicant is qualified topursue.
. Check Incentives. Check incentives available forqualified new applicants.
. Check Job Location (new applicant and existingemployee). When training is complete, trainee haschoice of locations for available jobs.
. Confirm Training (new applicant and existingemployee). Person selects a training course andreceives a confirmation.
Of the six abstract use cases, two are specific to new
applicants, while four are also used to process existing
employees. The complete specification of the Check Skills
use case is given below:
Use Case: Check Skills
Summary: This use case checks the applicant's (new
applicant or existing employee) skills and, hence,
determines what new skills he/she is ready to be
trained for.
Actors: Personnel Specialist.
Precondition: Applicant's record exists.
Description: Personnel Specialist enters the applicant's
social security number. The system determines the skills
that the applicant possesses. It then determines what
new skills the applicant is allowed to train for by
MENASC�E AND GOMAA: A METHOD FOR DESIGN AND PERFORMANCE MODELING OF CLIENT/SERVER SYSTEMS 1069
Fig. 3. Training system use case diagram.
checking whether the applicant's skills match theprerequisite skills of the new skill. The system displaysall skills the applicant is qualified to train for.
Alternatives: Applicant does not qualify for training for anynew skills.
Postcondition: List of skills displayed to PersonnelSpecialist.
6 STEP 2: STRUCTURAL MODELING
The Structural Model (also known as the Object Model)addresses the static structural aspects of a problem bymodeling classes in the real world [36]. A Structural Modeldescribes the static structure of the system being modeled,which is considered less likely to change then the functionsof the system. The origins of the Structural Model are ininformation modeling, in particular entity-relationshipmodeling, as used in logical database design.
A Structural Model defines the classes in the system, theattributes of the classes, the relationships between classes,and the operations of each class. Three types of relation-ships are possible: associations, composition/aggregation,and generalization/specialization.
In the analysis phase, a conceptual structural model isdeveloped, which concentrates on the entity classes thatwill eventually be mapped to a database. Entity classes arepersistent long-lasting classes that store information. Anentity object is typically accessed by many use cases. Theinformation maintained by an entity object persists overaccess by several use cases.
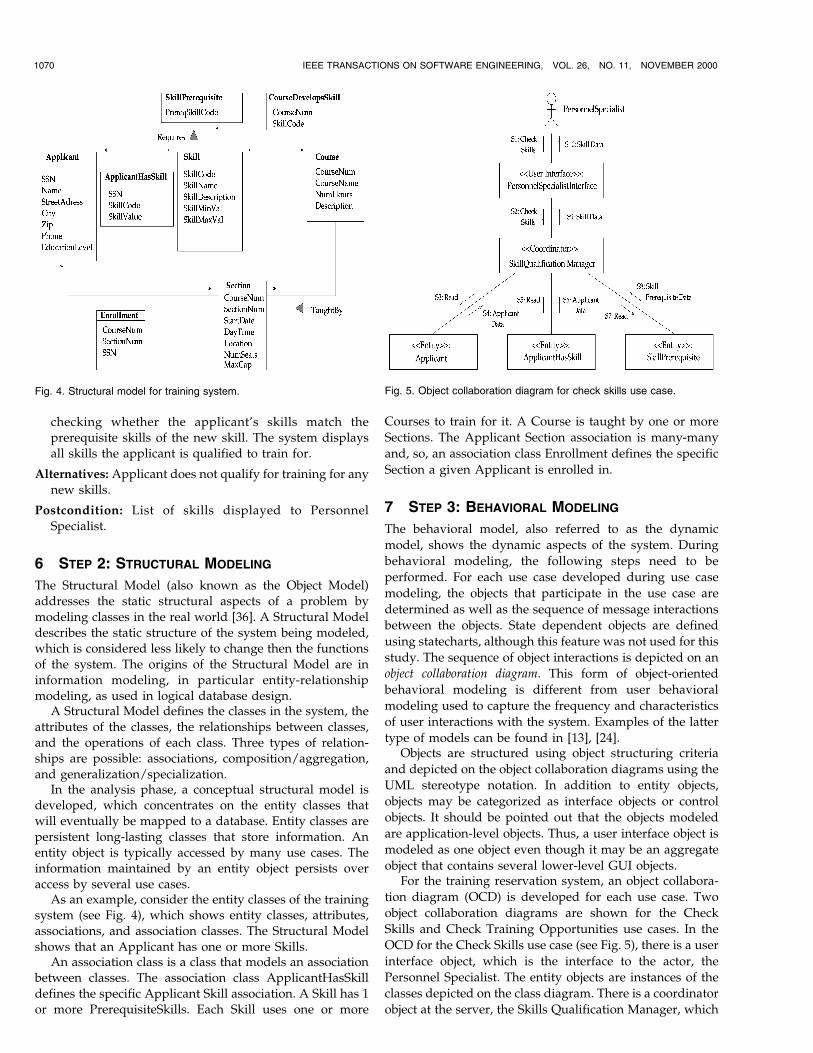
As an example, consider the entity classes of the trainingsystem (see Fig. 4), which shows entity classes, attributes,associations, and association classes. The Structural Modelshows that an Applicant has one or more Skills.
An association class is a class that models an associationbetween classes. The association class ApplicantHasSkilldefines the specific Applicant Skill association. A Skill has 1or more PrerequisiteSkills. Each Skill uses one or more
Courses to train for it. A Course is taught by one or more
Sections. The Applicant Section association is many-many
and, so, an association class Enrollment defines the specific
Section a given Applicant is enrolled in.
7 STEP 3: BEHAVIORAL MODELING
The behavioral model, also referred to as the dynamic
model, shows the dynamic aspects of the system. During
behavioral modeling, the following steps need to be
performed. For each use case developed during use case
modeling, the objects that participate in the use case are
determined as well as the sequence of message interactions
between the objects. State dependent objects are defined
using statecharts, although this feature was not used for this
study. The sequence of object interactions is depicted on an
object collaboration diagram. This form of object-oriented
behavioral modeling is different from user behavioral
modeling used to capture the frequency and characteristics
of user interactions with the system. Examples of the latter
type of models can be found in [13], [24].Objects are structured using object structuring criteria
and depicted on the object collaboration diagrams using the
UML stereotype notation. In addition to entity objects,
objects may be categorized as interface objects or control
objects. It should be pointed out that the objects modeled
are application-level objects. Thus, a user interface object is
modeled as one object even though it may be an aggregate
object that contains several lower-level GUI objects.For the training reservation system, an object collabora-
tion diagram (OCD) is developed for each use case. Two
object collaboration diagrams are shown for the Check
Skills and Check Training Opportunities use cases. In the
OCD for the Check Skills use case (see Fig. 5), there is a user
interface object, which is the interface to the actor, the
Personnel Specialist. The entity objects are instances of the
classes depicted on the class diagram. There is a coordinator
object at the server, the Skills Qualification Manager, which
1070 IEEE TRANSACTIONS ON SOFTWARE ENGINEERING, VOL. 26, NO. 11, NOVEMBER 2000
Fig. 4. Structural model for training system. Fig. 5. Object collaboration diagram for check skills use case.
is the overall decision maker that provides the sequencingfor the other objects participating in the use case.
Each object collaboration diagram has an associatedmessage sequence description, which describes the se-quence of messages. The message sequence description is arefinement of the black box description given in Section 5.For the Check Skills object collaboration diagram (see Fig. 5),the message sequence description is given next:
S1: Personnel Specialist enters the applicant's social securitynumber and requests to check the applicant's skills.
S2: The Skills Qualification Manager receives the clientrequest and uses the social security number to retrievethe applicant's data.
S3, S4: The Entity Applicant receives a Query request fromthe Skills Qualification Manager and responds byreturning the applicant data.
S5, S6: The Skills Qualification Manager queries theApplicant Has Skill association object to determine theapplicant's skills.
S7, S8: The Skills Qualification Manager queries the SkillPrerequisite object to determine what new skills theapplicant is allowed to train for, by checking whether theapplicant's skills match the prerequisite skills of the newskill.
S9: The Skills Qualification Manager returns a list of skillsthat the applicant is qualified to train for.
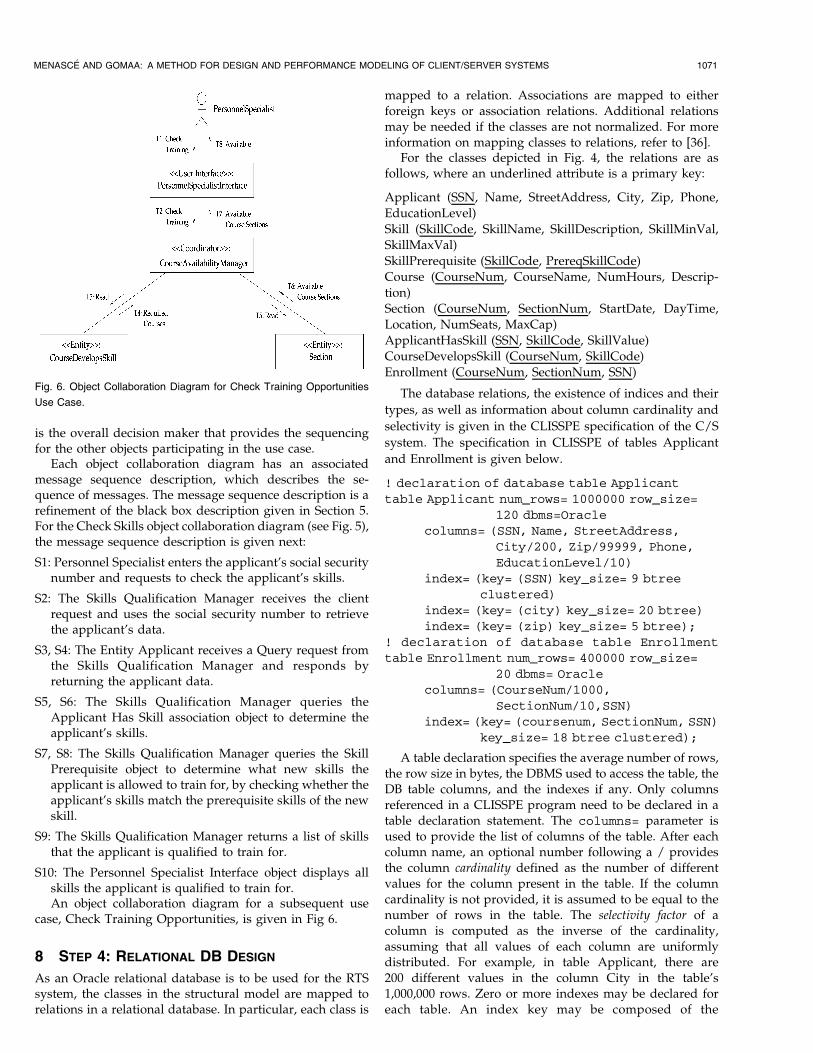
S10: The Personnel Specialist Interface object displays allskills the applicant is qualified to train for.An object collaboration diagram for a subsequent use
case, Check Training Opportunities, is given in Fig 6.
8 STEP 4: RELATIONAL DB DESIGN
As an Oracle relational database is to be used for the RTSsystem, the classes in the structural model are mapped torelations in a relational database. In particular, each class is
mapped to a relation. Associations are mapped to eitherforeign keys or association relations. Additional relationsmay be needed if the classes are not normalized. For moreinformation on mapping classes to relations, refer to [36].
For the classes depicted in Fig. 4, the relations are asfollows, where an underlined attribute is a primary key:
Applicant (SSN, Name, StreetAddress, City, Zip, Phone,EducationLevel)Skill (SkillCode, SkillName, SkillDescription, SkillMinVal,SkillMaxVal)SkillPrerequisite (SkillCode, PrereqSkillCode)Course (CourseNum, CourseName, NumHours, Descrip-tion)Section (CourseNum, SectionNum, StartDate, DayTime,Location, NumSeats, MaxCap)ApplicantHasSkill (SSN, SkillCode, SkillValue)CourseDevelopsSkill (CourseNum, SkillCode)Enrollment (CourseNum, SectionNum, SSN)
The database relations, the existence of indices and their
types, as well as information about column cardinality and
selectivity is given in the CLISSPE specification of the C/S
system. The specification in CLISSPE of tables Applicant
and Enrollment is given below.
! declaration of database table Applicant
table Applicant num_rows= 1000000 row_size=
120 dbms=Oracle
columns= (SSN, Name, StreetAddress,
City/200, Zip/99999, Phone,
EducationLevel/10)
index= (key= (SSN) key_size= 9 btree
clustered)
index= (key= (city) key_size= 20 btree)
index= (key= (zip) key_size= 5 btree);
! declaration of database table Enrollment
table Enrollment num_rows= 400000 row_size=
20 dbms= Oracle
columns= (CourseNum/1000,
SectionNum/10,SSN)
index= (key= (coursenum, SectionNum, SSN)
key_size= 18 btree clustered);
A table declaration specifies the average number of rows,the row size in bytes, the DBMS used to access the table, theDB table columns, and the indexes if any. Only columnsreferenced in a CLISSPE program need to be declared in atable declaration statement. The columns= parameter isused to provide the list of columns of the table. After eachcolumn name, an optional number following a / providesthe column cardinality defined as the number of differentvalues for the column present in the table. If the columncardinality is not provided, it is assumed to be equal to thenumber of rows in the table. The selectivity factor of acolumn is computed as the inverse of the cardinality,assuming that all values of each column are uniformlydistributed. For example, in table Applicant, there are200 different values in the column City in the table's1,000,000 rows. Zero or more indexes may be declared foreach table. An index key may be composed of the
MENASC�E AND GOMAA: A METHOD FOR DESIGN AND PERFORMANCE MODELING OF CLIENT/SERVER SYSTEMS 1071
Fig. 6. Object Collaboration Diagram for Check Training Opportunities
Use Case.
concatenation of one or more columns. The key size in bytesis given by the parameter key_size=. The type of index,hash or btree, has to be specified. The optional keywordclustered indicates whether a b-tree index is clustered or not.At most one clustered index may be declared per table. See[29] for a good discussion on basic database concepts andquery optimization.
9 STEP 5: C/S SOFTWARE ARCHITECTURE
MAPPING SPECIFICATION
The client/server software architecture is designed. The
goal is to have a configurable message-based design that
allows objects to be mapped to client or server nodes. This
approach provides the flexibility of mapping the software
architecture to different C/S configurations including two-
tier or three-tier C/S configurations. In the two-tier
configuration, user interface and application functionality
is provided on the client nodes and the server node is a
database server. In the three-tier configuration, the client
nodes have the user interface functionality, while the
application functionality is supported on an application
server. The third tier is a database server, which can be
configured to be on the same node as the application server
or on a separate node. Furthermore, the database server
may be configured to reside on one node or be distributed
among multiple nodes. This flexible software architecture
provides a framework for experimenting with different
client/server system configurations, which can then be
analyzed from a performance perspective.For the objects depicted in Figs. 5 and 6, in a two-tier
client/server configuration, all the objects would reside at
the client and the server is the database server. In a three-tier
client/server configuration, the user interface objects reside
at the client node while the coordinator and entity objects
reside at the application server node. The third tier is the
database server node. The actual mapping from the
client/server software architecture to a specific system
configuration is done in the Software/Hardware Mapping
step.
10 STEP 6: TRANSACTION SPECIFICATION
The transaction business logic is specified in the CLISSPElanguage. The logic for the transaction is derived from thesequence of interactions depicted on the object collaborationdiagram for a given use case and described in the messagesequence description. The transaction references the rela-tions defined in Step 4 of the method. The transaction has aclient part and a server part to it as given by the Client/Server Software Architecture Mapping.
The client part of the transaction corresponds to the userinterface object shown on the object collaboration diagram.The server part of the transaction corresponds to the otherobjects, namely the control and entity objects.
An example of the transaction specification for the CheckSkills transaction is given next, which determines the skillsthat the applicant is qualified to train for. First is the
specification for the client, which issues a remote procedurecall to the application server.
transaction CheckSkills running_on client
! Actor enters applicant SSN
! check applicant skills
rpc check_skills to_server ApplicServer;
! Display skills applicant is qualified to
train for
end_transaction;
The application server follows the sequence of stepsdescribed in the object collaboration diagram for CheckSkills (see Fig. 5). First the applicant relation is accessed andthen a join is performed on the ApplicantHasSkill andSkillPrequisites relations. The value of the constant#ProbabilityApplicantWithMinSkills gives the probabilitythat this branch is taken.
transaction CheckSkills running_on
server ApplicServer
! retrieve applicant's data
select from Applicant where SSN;
! if applicant exists check applicant skills
if #ProbabilityApplicantWithMinSkills
then! find all skills applicant qualifies
! to train for
selectfrom ApplicantHasSkill
where SSN
from SkillPrequisites
where PrereqSkillCode
joined_by
ApplicantHasSkill.SkillCode =
SkillPrequisites.
PrereqSkillCode;
end_if;
! Return skills applicant is qualified to train
for
end_transaction; ! CheckSkills
A second transaction is the CheckTraining, which alsohas client and server modules. This transaction is executedafter the Check Skills.
transaction CheckTraining running_on client
! check training opportunities
! Actor enters skills applicant qualified
! to train for
rpc check_training to_server ApplicServer;
end_transaction;
The server loops for each skill and for the averagenumber of courses per skill, then determines the coursesrequired for this skill, loops on the average number ofsections that must be checked for the course before a courseis found. This corresponds to the OCD in Fig. 6.
transaction CheckTraining running_on
server ApplicServer
! Loop for training opportunities
loop #average_skill_count
!Determine courses required for this skill
loop #average_num_courses
1072 IEEE TRANSACTIONS ON SOFTWARE ENGINEERING, VOL. 26, NO. 11, NOVEMBER 2000
select from CourseDevelopsSkill
where SkillCode;
! Check sections for this course
select from Section where CourseNum;
loop #avg_sections_count
! Check if section is available
end_loop;
if #ProbSectionAvailable
then !add to list of available opportunities
end_if;
end_loop;
end_loop;
end_transaction; ! CheckTraining;
The transactions shown above contain examples of
constants (e.g., #average_skill_count). Constants in
CLISSPE start with a ª#º character and are defined in the
declaration section.
11 STEP 7: SOFTWARE HARDWARE MAPPING
Given the desired client/server system configuration
scenarios, the client/server software architecture is mapped
to a specific system configuration that assigns software
components to physical elements such as processors and
network segments. The components of the system archi-
tecture are assigned performance characteristics (e.g., net-
work segment speeds, router latencies, I/O subsystem
bandwidth, processor speeds).A few examples of how this type of mapping is specified
in CLISSPE are given in what follows: In the declaration
section of a CLISSPE C/S system specification, elements
such as servers, client groups, database management
systems, database tables, networks, and transaction types
are declared. In the mapping section of the language, these
elements are mapped to one another. For example, servers
and client groups are mapped to networks, database tables
are mapped to servers and disks within the servers, and
database tables are assigned to database management
systems.Consider an example of a database server declaration and
its mapping to a network. The example shows that server
DBServer is declared as being of type IBM-RS-6000-M43P133
(this type has to be previously declared). The declaration of
the DB Server indicates that Oracle is the DBMS running on
it with a buffer size of 8,192 KBytes and configured to run on
two CPUs and two disks. A network type HQType is
defined as being a 100-Mbps Fast Ethernet. The Head-
quarters LAN, HQLan, is declared as being of this type.
! this goes in the declaration section
server DBServer type= IBM-RS-6000-M43P133
dbms= Oracle DB_BuffSize= 8192 num_CPUs= 2
disk dsk01 type= ServerDisk
disk dsk02 type= ServerDisk;
network_type HQType bandwidth= 100
type= Fast_Ethernet;
network HQLan type= HQType;
In the mapping section, the server DBserver is mapped
to the network HQLan and table Applicant to the server
DBServer. Sixty percent of the table Applicant is declared as
being stored on disk one at that server and the remaining
40 percent at disk two.
! this goes in the mapping section
server DBServer is_in network HQLan;
table Applicant is_in server DBServer
(dsk01: 0.6, dsk02: 0.4);
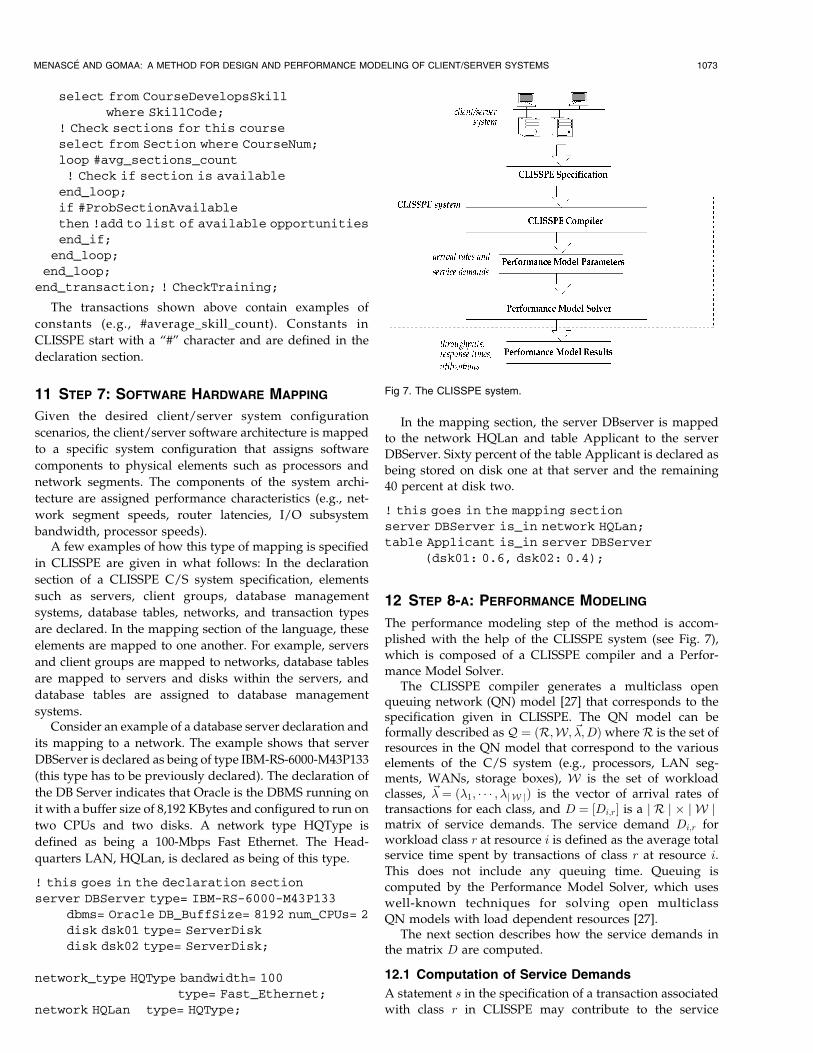
12 STEP 8-A: PERFORMANCE MODELING
The performance modeling step of the method is accom-
plished with the help of the CLISSPE system (see Fig. 7),
which is composed of a CLISSPE compiler and a Perfor-
mance Model Solver.The CLISSPE compiler generates a multiclass open
queuing network (QN) model [27] that corresponds to thespecification given in CLISSPE. The QN model can beformally described as Q � �R;W; ~�;D�whereR is the set ofresources in the QN model that correspond to the variouselements of the C/S system (e.g., processors, LAN seg-ments, WANs, storage boxes), W is the set of workloadclasses, ~� � ��1; � � � ; �j W j� is the vector of arrival rates oftransactions for each class, and D � �Di;r� is a j R j � j W jmatrix of service demands. The service demand Di;r forworkload class r at resource i is defined as the average totalservice time spent by transactions of class r at resource i.
This does not include any queuing time. Queuing is
computed by the Performance Model Solver, which uses
well-known techniques for solving open multiclass
QN models with load dependent resources [27].The next section describes how the service demands in
the matrix D are computed.
12.1 Computation of Service Demands
A statement s in the specification of a transaction associated
with class r in CLISSPE may contribute to the service
MENASC�E AND GOMAA: A METHOD FOR DESIGN AND PERFORMANCE MODELING OF CLIENT/SERVER SYSTEMS 1073
Fig 7. The CLISSPE system.
demand of various resources. For example, a select
statement includes CPU demands at the DB server, at the
storage box of the database server and at the various
networks that connect the application server that issues the
select statement and the database server. In general, we
can write that
Di;r �Xs2Si;r
ns � ps �Dsi;r; �1�
where
. Si;r is the set of all statements that contribute to theservice demand of transactions of class r atresource i,
. ns is the average number of times that statement s isexecuted,
. ps is the probability that statement s is executed, and
. Dsi;r is the average service demand at resource i for
class r due a single execution of statement s.
Let us first describe how ns and ps are obtained. If a
statement s is not within any loop statement, then ns � 1.
The value of ns can be modified by the loop statement in
CLISSPE. This statement has the form loop < number >
< statement1 >; . . . ; < statementm >; end loop; w h e r e
<number> is the average number of times that the sequence
of m�m � 1� statements is executed. If a loop statement is
not nested within any other loop statement, then ns =
number for all statements s in the sequence of statements
within the loop. In general,
ns �YKs
j�1
NLoopj; �2�
where Ks is the number of nested loops in which statement
s is part of and NLoopj is the average number of times loop
j is executed.The probability ps that a statement s is executed can be
modified by three CLISSPE statements: the if-then, theif-then-else, and the switch statements. The if thenstatement is of the form if < prob > then < statement1 >
; . . . ;< statementm >; end if; ; where <prob> is a numberin the range �0; 1� that indicates the probability thestatements in the then clause are executed. If the if-thenstatement is the outermost statement in the transaction,then ps = <prob> for all statements s in the then
clause. In general, the probability ps that a statement sin a then clause is executed can be written asps � < prob >� pifÿthen, where pifÿthen is the probabilitythat the if-then statement is executed.
The if-then-else statement is of the form
if <prob> then
< statementt1 >; :::; < statementtm > ;
else < statemente1 >; :::;< statementen > ;
end_if;.
The probability ps that a statement s in the then clause isexecuted can be written as ps �< prob > � pifÿthenÿelse,where pifÿthenÿelse is the probability that the if-then-
else statement is executed. The probability ps that a
statement s in the else clause is executed can be written asps � �1ÿ < prob >� � pifÿthenÿelse.
The switch statement is of the form
switch
case <prob1>:
<statement11>; ...; <statement1m>;
...;
case <probk>:
<statementk1>; ...; <statementkn>;
end_switch;}
wherePk
j�1 probj � 1. Then, the probability that a state-ment s in the jth case clause is executed is given byprobj � pswitch, where pswitch is the probability that theswitch statement is executed.
One of the major challenges in estimating the servicedemands Ds
i;r, is when s is a database statement such asselect. The next section describes in detail the modelsused by the CLISSPE compiler to estimate the number ofI/Os and the disk time and CPU times associated witheach database access.
13 STEP 8-B: DB MODELING
This section discusses how the CLISSPE compiler com-putes the estimated CPU and I/O costs associated withselect statements. The performance of a database selectstatement is a function of the number of I/Os generatedby the statement. The number of I/Os is a function of theaccess plan (e.g., nested loop join, merge join, hybrid join)chosen by the query optimizer of the DBMS to performthe select, of the existence of indexes and type of accessmethod (e.g., b-tree, hashing) used in each table, the buffersize and buffer management policies (e.g., LRU), and ofparameters such as page sizes, data and index page fillfactors, and others. For relevant previous work on accessplans, join processing, and query optimization see [2], [5],[29], [37], [38], [42], [44], [45]. Some of these papers describethe operation of access plans and others concentrate onestimating the resulting size of joins between relations, forvarious types of joins. We build on existing work andpresent an integrated view that is aimed at computing thetotal cost, including access to indices, of a given databaseaccess.
13.1 Indexing
An index on a database table T is a table with two columns.Each row is of the form (IndexKey, RowPointer), where anIndexKey is either a value found in one or more rows of Tfor a single column, or a concatenation of column values ina specified order. A RowPointer (called rowid in Oracle, ridin DB2, and tid in Ingres) uniquely identifies a row in T .Rows are stored in specific slots within database pages.Pages are stored within operating system files (more aboutpage formats will be given later).
All commercial DBMSs support indexes based on b-trees.Some, like ORACLE [3], support other methods such ashash clusters and index sequential access methods (isam).
Indexes may be clustered or unclustered. A clusteredindex is one in which the rows are referenced in the index inthe same order as they are stored in the database. Only one
1074 IEEE TRANSACTIONS ON SOFTWARE ENGINEERING, VOL. 26, NO. 11, NOVEMBER 2000
index may be clustered for each table. Thus, when rowswith a common index key value are clustered together andone reads in the data page from disk containing one of therows with a given key value, other rows with the same keyvalue are likely to lie on the same data page. The CLISSPEcompiler assumes that if the index is nonclustered, rowswith the same key value require one I/O each, while forclustered indexes, the number of I/Os is roughly equal tothe number of rows to be read divided by the number ofrows per page.
13.1.1 B-Tree Index
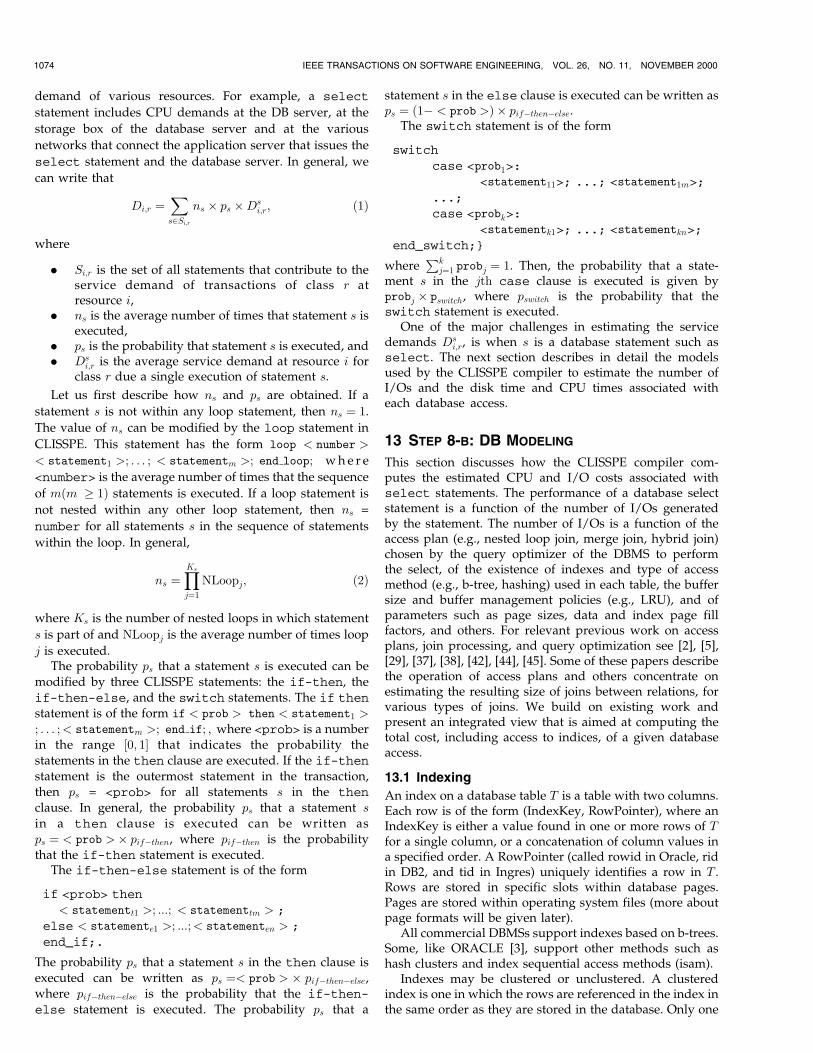
The format of a page of a b-tree index is [Header,( KeyValue1;RowPointer1�; � � � ; �KeyValuek;RowPointerk�,FreeSpace]. The height of a b-tree with fanout k and Lentries is given by
h � dlogk Le: �3�The fanout kI for a b-tree index I can be computed as
kI � �P ÿ hi� � fiksI � rp
� �; �4�
where
. P : size in bytes of an index page (the same as the sizeof a data page).
. hi: size in bytes of the header field of an index page.
. fi: percentage of the useful space of an index pagethat can be used to store keys and row pointers. Inan active b-tree, this value can be shown to be71 percent on the average for nodes below theroot [29].
. ksI : size in bytes of a key for index I.
. rp: size in bytes of a row pointer.
In most cases of practical interest, the height of the b-treewill be at most three. The root of the tree will always be inmemory. Depending on the number of indexes and buffersize, it is quite likely that all level-two blocks will also be inmain memory. So, the number of I/Os to access a b-treeindex will be one in most cases.
Consider the function g�T; I�, shown in Fig. 8, thatreturns the number of I/Os needed to reach a leaf node for ab-tree structured index I on table T . The term NRowsTrepresents the number of rows of table T .
13.1.2 Hash Index
In this case, rows are stored at a location pointed by a rowpointer determined by applying a hash function to theindex key. Hash primary indexes are available in INGRESand ORACLE version 7. The average number of accesses toa hash index for table T, nhT , is given by
nhT � 1
1ÿ �fd�nrpT ; �5�
where
. nrpT : number of rows of table T that fit in a databasepage. This is computed in Subsection 13.2 and
. fd: percentage of the useful space of a page that canbe used to store rows and row directory entries.
The above result assumes that rehashing is done on thesame page. Only when the data page is full, rehashing isdone on another page. The derivation of (5) is beyond thescope of this paper, but it is based on deriving theprobability distribution of the number of hash misses andthen computing the expected value of this distribution [29].
13.2 Data Pages
The format of a data page may vary slightly from DBMS toDBMS. We assume the following format as an adequateabstraction of a page layout: [Header, RowDirectory,FreeSpace, RowN; � � � ;Row1].
The row directory is a table with as many entries as thenumber of rows in the page. An entry in this directorycontains the byte offset of the row within the page. The slotnumber of a row in a page is the number of its entry in therow directory. To allow for row size expansion, the space ona data page is not fully used. A fill factor, fd, is assumed thatindicates the percentage of the page's useful space used tostore rows. Thus, the number nrpT of rows in a pagecontaining rows for table T can be computed as
nrpT � �P ÿ hd� � fd�rsT � rd�
� �; �6�
where
. P : size in bytes of a data page,
. hd: size in bytes of the header field,
. rsT : size in bytes of a row of table T , and
. rd: size in bytes of an entry in the row directory.
Equation 6 assumes that a data page only stores rows of asingle table. The number of data pages, ndT , needed to storeall pages of table T is then given by
ndT � NRowsTnrpT
� �: �7�
13.3 Access Plans
In estimating the cost of an access plan, we assume that theCPU cost is a linear function of the number of I/Osgenerated by the access plan. Thus,
CCPU�AcessPlan� � a�NI=O�AccessPlan� � b; �8�where NI=O�AccessPlan� is the number of I/Os incurred bythe access plan and a and b are constants to be determined
MENASC�E AND GOMAA: A METHOD FOR DESIGN AND PERFORMANCE MODELING OF CLIENT/SERVER SYSTEMS 1075
Fig. 8. Function g.
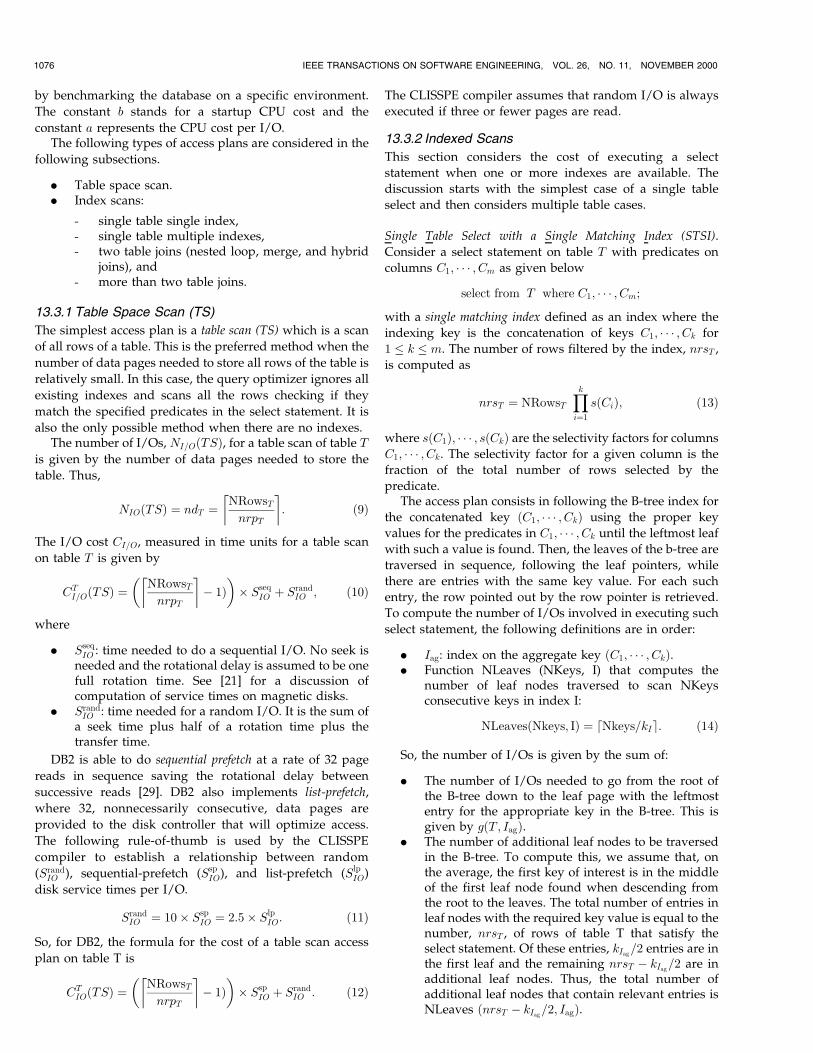
by benchmarking the database on a specific environment.
The constant b stands for a startup CPU cost and the
constant a represents the CPU cost per I/O.The following types of access plans are considered in the
following subsections.
. Table space scan.
. Index scans:
- single table single index,- single table multiple indexes,- two table joins (nested loop, merge, and hybrid
joins), and- more than two table joins.
13.3.1 Table Space Scan (TS)
The simplest access plan is a table scan (TS) which is a scan
of all rows of a table. This is the preferred method when the
number of data pages needed to store all rows of the table is
relatively small. In this case, the query optimizer ignores all
existing indexes and scans all the rows checking if they
match the specified predicates in the select statement. It is
also the only possible method when there are no indexes.The number of I/Os, NI=O�TS�, for a table scan of table T
is given by the number of data pages needed to store the
table. Thus,
NIO�TS� � ndT � NRowsTnrpT
� �: �9�
The I/O cost CI=O, measured in time units for a table scan
on table T is given by
CTI=O�TS� �
NRowsTnrpT
� �ÿ 1�
� �� Sseq
IO � SrandIO ; �10�
where
. SseqIO : time needed to do a sequential I/O. No seek is
needed and the rotational delay is assumed to be onefull rotation time. See [21] for a discussion ofcomputation of service times on magnetic disks.
. SrandIO : time needed for a random I/O. It is the sum of
a seek time plus half of a rotation time plus thetransfer time.
DB2 is able to do sequential prefetch at a rate of 32 page
reads in sequence saving the rotational delay between
successive reads [29]. DB2 also implements list-prefetch,
where 32, nonnecessarily consecutive, data pages are
provided to the disk controller that will optimize access.
The following rule-of-thumb is used by the CLISSPE
compiler to establish a relationship between random
(SrandIO ), sequential-prefetch (Ssp
IO), and list-prefetch (SlpIO)
disk service times per I/O.
SrandIO � 10� Ssp
IO � 2:5� SlpIO: �11�
So, for DB2, the formula for the cost of a table scan access
plan on table T is
CTIO�TS� �
NRowsTnrpT
� �ÿ 1�
� �� Ssp
IO � SrandIO : �12�
The CLISSPE compiler assumes that random I/O is always
executed if three or fewer pages are read.
13.3.2 Indexed Scans
This section considers the cost of executing a select
statement when one or more indexes are available. The
discussion starts with the simplest case of a single table
select and then considers multiple table cases.
Single Table Select with a Single Matching Index (STSI).
Consider a select statement on table T with predicates on
columns C1; � � � ; Cm as given below
select from T where C1; � � � ; Cm;
with a single matching index defined as an index where the
indexing key is the concatenation of keys C1; � � � ; Ck for
1 � k � m. The number of rows filtered by the index, nrsT ,
is computed as
nrsT � NRowsTYki�1
s�Ci�; �13�
where s�C1�; � � � ; s�Ck� are the selectivity factors for columns
C1; � � � ; Ck. The selectivity factor for a given column is the
fraction of the total number of rows selected by the
predicate.The access plan consists in following the B-tree index for
the concatenated key �C1; � � � ; Ck� using the proper key
values for the predicates in C1; � � � ; Ck until the leftmost leaf
with such a value is found. Then, the leaves of the b-tree are
traversed in sequence, following the leaf pointers, while
there are entries with the same key value. For each such
entry, the row pointed out by the row pointer is retrieved.
To compute the number of I/Os involved in executing such
select statement, the following definitions are in order:
. Iag: index on the aggregate key �C1; � � � ; Ck�.
. Function NLeaves (NKeys, I) that computes thenumber of leaf nodes traversed to scan NKeysconsecutive keys in index I:
NLeaves�Nkeys; I� � Nkeys=kId e: �14�
So, the number of I/Os is given by the sum of:
. The number of I/Os needed to go from the root ofthe B-tree down to the leaf page with the leftmostentry for the appropriate key in the B-tree. This isgiven by g�T; Iag�.
. The number of additional leaf nodes to be traversedin the B-tree. To compute this, we assume that, onthe average, the first key of interest is in the middleof the first leaf node found when descending fromthe root to the leaves. The total number of entries inleaf nodes with the required key value is equal to thenumber, nrsT , of rows of table T that satisfy theselect statement. Of these entries, kIag
=2 entries are inthe first leaf and the remaining nrsT ÿ kIag
=2 are inadditional leaf nodes. Thus, the total number ofadditional leaf nodes that contain relevant entries isNLeaves �nrsT ÿ kIag
=2; Iag�.
1076 IEEE TRANSACTIONS ON SOFTWARE ENGINEERING, VOL. 26, NO. 11, NOVEMBER 2000
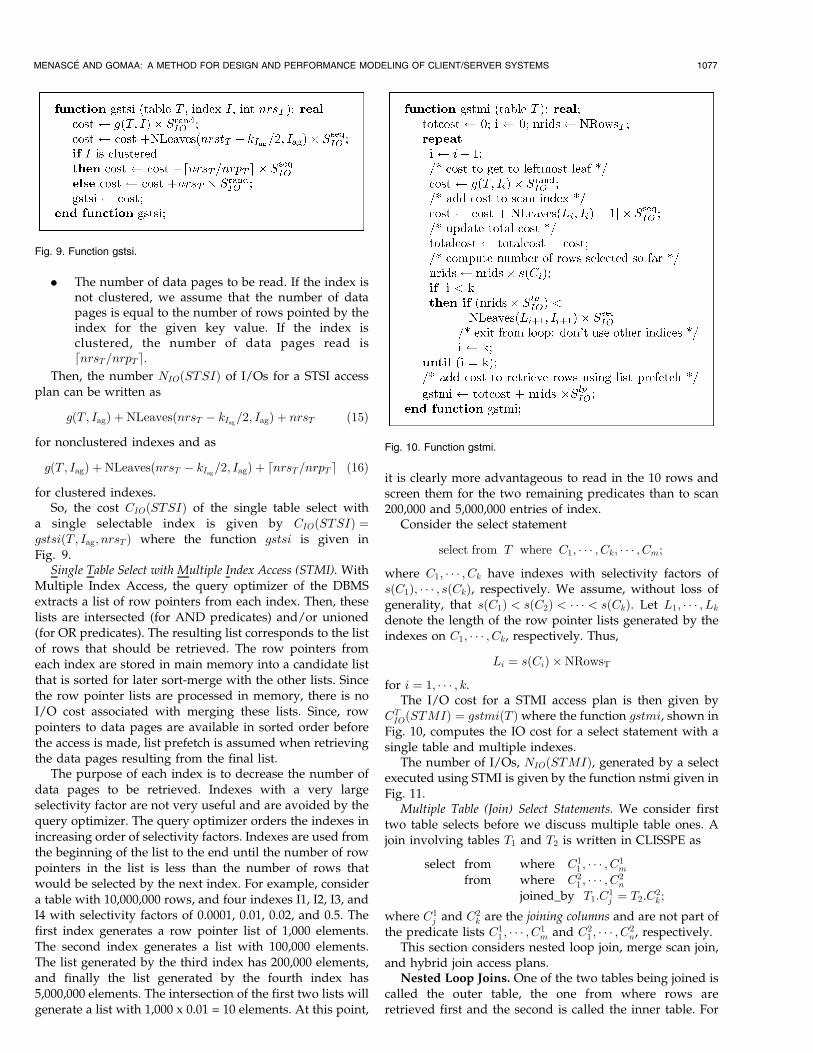
. The number of data pages to be read. If the index isnot clustered, we assume that the number of datapages is equal to the number of rows pointed by theindex for the given key value. If the index isclustered, the number of data pages read isdnrsT=nrpT e.
Then, the number NIO�STSI� of I/Os for a STSI accessplan can be written as
g�T; Iag� �NLeaves�nrsT ÿ kIag=2; Iag� � nrsT �15�
for nonclustered indexes and as
g�T; Iag� �NLeaves�nrsT ÿ kIag=2; Iag� � dnrsT=nrpT e �16�
for clustered indexes.So, the cost CIO�STSI� of the single table select with
a single selectable index is given by CIO�STSI� �gstsi�T; Iag; nrsT � where the function gstsi is given inFig. 9.
Single Table Select with Multiple Index Access (STMI). WithMultiple Index Access, the query optimizer of the DBMSextracts a list of row pointers from each index. Then, theselists are intersected (for AND predicates) and/or unioned(for OR predicates). The resulting list corresponds to the listof rows that should be retrieved. The row pointers fromeach index are stored in main memory into a candidate listthat is sorted for later sort-merge with the other lists. Sincethe row pointer lists are processed in memory, there is noI/O cost associated with merging these lists. Since, rowpointers to data pages are available in sorted order beforethe access is made, list prefetch is assumed when retrievingthe data pages resulting from the final list.
The purpose of each index is to decrease the number ofdata pages to be retrieved. Indexes with a very largeselectivity factor are not very useful and are avoided by thequery optimizer. The query optimizer orders the indexes inincreasing order of selectivity factors. Indexes are used fromthe beginning of the list to the end until the number of rowpointers in the list is less than the number of rows thatwould be selected by the next index. For example, considera table with 10,000,000 rows, and four indexes I1, I2, I3, andI4 with selectivity factors of 0.0001, 0.01, 0.02, and 0.5. Thefirst index generates a row pointer list of 1,000 elements.The second index generates a list with 100,000 elements.The list generated by the third index has 200,000 elements,and finally the list generated by the fourth index has5,000,000 elements. The intersection of the first two lists willgenerate a list with 1,000 x 0.01 = 10 elements. At this point,
it is clearly more advantageous to read in the 10 rows andscreen them for the two remaining predicates than to scan200,000 and 5,000,000 entries of index.
Consider the select statement
select from T where C1; � � � ; Ck; � � � ; Cm;
where C1; � � � ; Ck have indexes with selectivity factors ofs�C1�; � � � ; s�Ck�, respectively. We assume, without loss ofgenerality, that s�C1� < s�C2� < � � � < s�Ck�. Let L1; � � � ; Lkdenote the length of the row pointer lists generated by theindexes on C1; � � � ; Ck, respectively. Thus,
Li � s�Ci� �NRowsT
for i � 1; � � � ; k.The I/O cost for a STMI access plan is then given by
CTIO�STMI� � gstmi�T � where the function gstmi, shown in
Fig. 10, computes the IO cost for a select statement with asingle table and multiple indexes.
The number of I/Os, NIO�STMI�, generated by a selectexecuted using STMI is given by the function nstmi given inFig. 11.
Multiple Table (Join) Select Statements. We consider firsttwo table selects before we discuss multiple table ones. Ajoin involving tables T1 and T2 is written in CLISSPE as
select from where C11 ; � � � ; C1
m
from where C21 ; � � � ; C2
n
joined_by T1:C1j � T2:C
2k ;
where C1j and C2
k are the joining columns and are not part ofthe predicate lists C1
1 ; � � � ; C1m and C2
1 ; � � � ; C2n, respectively.
This section considers nested loop join, merge scan join,and hybrid join access plans.
Nested Loop Joins. One of the two tables being joined iscalled the outer table, the one from where rows areretrieved first and the second is called the inner table. For
MENASC�E AND GOMAA: A METHOD FOR DESIGN AND PERFORMANCE MODELING OF CLIENT/SERVER SYSTEMS 1077
Fig. 9. Function gstsi.
Fig. 10. Function gstmi.
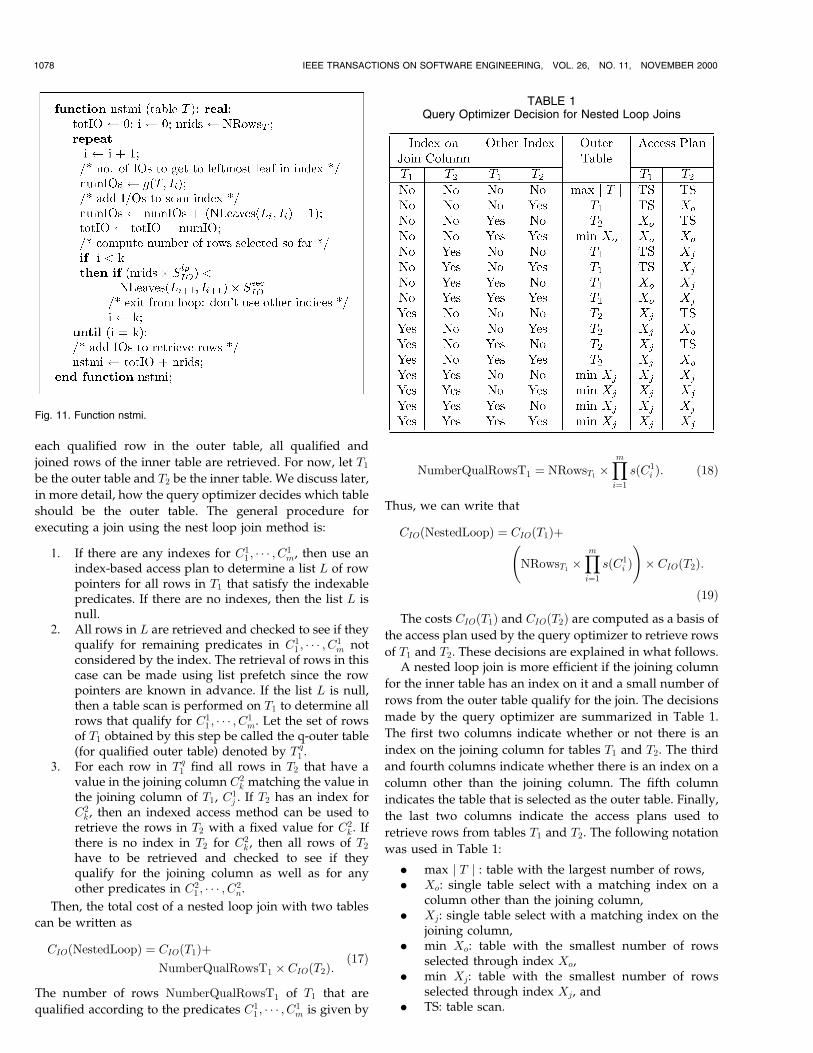
each qualified row in the outer table, all qualified and
joined rows of the inner table are retrieved. For now, let T1
be the outer table and T2 be the inner table. We discuss later,
in more detail, how the query optimizer decides which table
should be the outer table. The general procedure for
executing a join using the nest loop join method is:
1. If there are any indexes for C11 ; � � � ; C1
m, then use anindex-based access plan to determine a list L of rowpointers for all rows in T1 that satisfy the indexablepredicates. If there are no indexes, then the list L isnull.
2. All rows in L are retrieved and checked to see if theyqualify for remaining predicates in C1
1 ; � � � ; C1m not
considered by the index. The retrieval of rows in thiscase can be made using list prefetch since the rowpointers are known in advance. If the list L is null,then a table scan is performed on T1 to determine allrows that qualify for C1
1 ; � � � ; C1m. Let the set of rows
of T1 obtained by this step be called the q-outer table(for qualified outer table) denoted by Tq1 .
3. For each row in Tq1 find all rows in T2 that have avalue in the joining column C2
k matching the value inthe joining column of T1, C1
j . If T2 has an index forC2k , then an indexed access method can be used to
retrieve the rows in T2 with a fixed value for C2k . If
there is no index in T2 for C2k , then all rows of T2
have to be retrieved and checked to see if theyqualify for the joining column as well as for anyother predicates in C2
1 ; � � � ; C2n.
Then, the total cost of a nested loop join with two tables
can be written as
CIO�NestedLoop� � CIO�T1��NumberQualRowsT1 � CIO�T2�:
�17�
The number of rows NumberQualRowsT1 of T1 that are
qualified according to the predicates C11 ; � � � ; C1
m is given by
NumberQualRowsT1 � NRowsT1�Ymi�1
s�C1i �: �18�
Thus, we can write that
CIO�NestedLoop� � CIO�T1��
NRowsT1�Ymi�1
s�C1i �
!� CIO�T2�:
�19�The costs CIO�T1� and CIO�T2� are computed as a basis of
the access plan used by the query optimizer to retrieve rows
of T1 and T2. These decisions are explained in what follows.A nested loop join is more efficient if the joining column
for the inner table has an index on it and a small number of
rows from the outer table qualify for the join. The decisions
made by the query optimizer are summarized in Table 1.
The first two columns indicate whether or not there is an
index on the joining column for tables T1 and T2. The third
and fourth columns indicate whether there is an index on a
column other than the joining column. The fifth column
indicates the table that is selected as the outer table. Finally,
the last two columns indicate the access plans used to
retrieve rows from tables T1 and T2. The following notation
was used in Table 1:
. max j T j : table with the largest number of rows,
. Xo: single table select with a matching index on acolumn other than the joining column,
. Xj: single table select with a matching index on thejoining column,
. min Xo: table with the smallest number of rowsselected through index Xo,
. min Xj: table with the smallest number of rowsselected through index Xj, and
. TS: table scan.
1078 IEEE TRANSACTIONS ON SOFTWARE ENGINEERING, VOL. 26, NO. 11, NOVEMBER 2000
Fig. 11. Function nstmi.
TABLE 1Query Optimizer Decision for Nested Loop Joins
If the inner table is small enough so that its index and
data pages fit into the buffer after the first time they are
referenced, then, the IO cost becomes zero when these
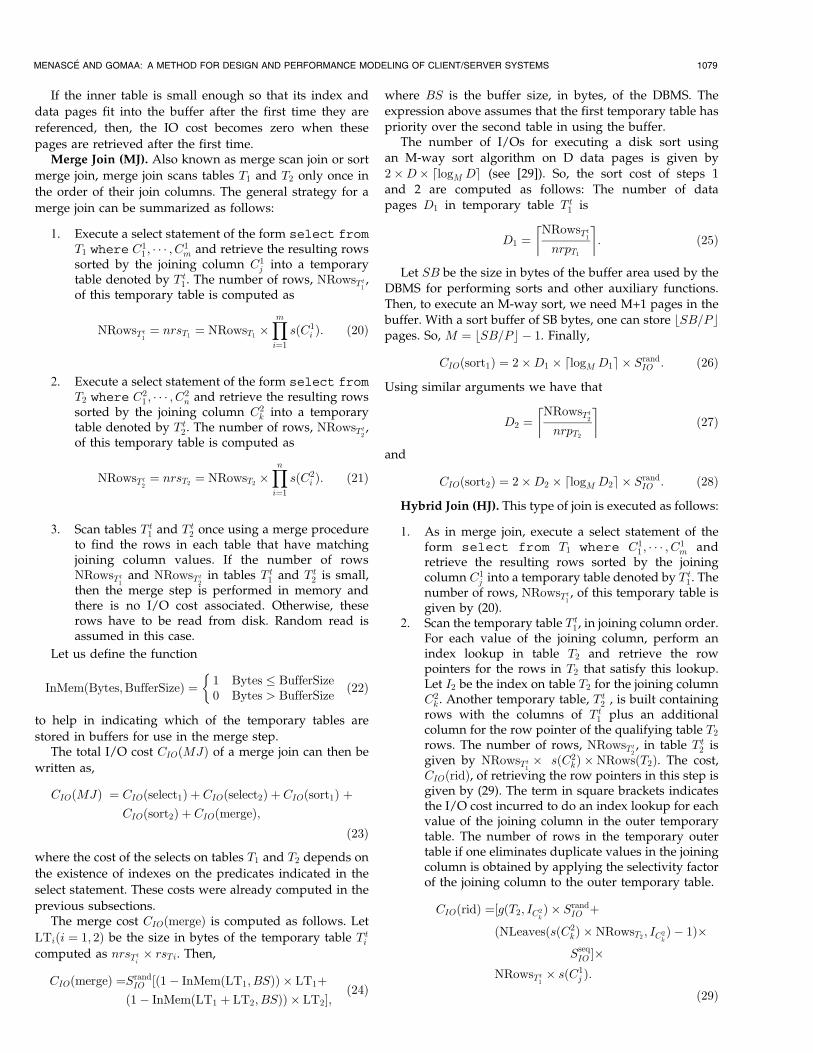
pages are retrieved after the first time.Merge Join (MJ). Also known as merge scan join or sort
merge join, merge join scans tables T1 and T2 only once in
the order of their join columns. The general strategy for a
merge join can be summarized as follows:
1. Execute a select statement of the form select from
T1 where C11 ; � � � ; C1
m and retrieve the resulting rowssorted by the joining column C1
j into a temporarytable denoted by Tt1 . The number of rows, NRowsT t
1,
of this temporary table is computed as
NRowsT t1� nrsT1
� NRowsT1�Ymi�1
s�C1i �: �20�
2. Execute a select statement of the form select from
T2 where C21 ; � � � ; C2
n and retrieve the resulting rowssorted by the joining column C2
k into a temporarytable denoted by Tt2 . The number of rows, NRowsT t
2,
of this temporary table is computed as
NRowsT t2� nrsT2
� NRowsT2�Yni�1
s�C2i �: �21�
3. Scan tables Tt1 and Tt2 once using a merge procedureto find the rows in each table that have matchingjoining column values. If the number of rowsNRowsT t
1and NRowsTt
2in tables Tt1 and Tt2 is small,
then the merge step is performed in memory andthere is no I/O cost associated. Otherwise, theserows have to be read from disk. Random read isassumed in this case.
Let us define the function
InMem�Bytes;BufferSize� � 1 Bytes � BufferSize0 Bytes > BufferSize
��22�
to help in indicating which of the temporary tables are
stored in buffers for use in the merge step.The total I/O cost CIO�MJ� of a merge join can then be
written as,
CIO�MJ� � CIO�select1� � CIO�select2� � CIO�sort1� �CIO�sort2� � CIO�merge�;
�23�where the cost of the selects on tables T1 and T2 depends on
the existence of indexes on the predicates indicated in the
select statement. These costs were already computed in the
previous subsections.The merge cost CIO�merge� is computed as follows. Let
LTi�i � 1; 2� be the size in bytes of the temporary table Tticomputed as nrsTti � rsTi. Then,
CIO�merge� �SrandIO ��1ÿ InMem�LT1; BS�� � LT1��1ÿ InMem�LT1 � LT2; BS�� � LT2�;
�24�
where BS is the buffer size, in bytes, of the DBMS. Theexpression above assumes that the first temporary table haspriority over the second table in using the buffer.
The number of I/Os for executing a disk sort usingan M-way sort algorithm on D data pages is given by2�D� dlogM De (see [29]). So, the sort cost of steps 1and 2 are computed as follows: The number of datapages D1 in temporary table Tt1 is
D1 �NRowsTt
1
nrpT1
� �: �25�
Let SB be the size in bytes of the buffer area used by theDBMS for performing sorts and other auxiliary functions.Then, to execute an M-way sort, we need M+1 pages in thebuffer. With a sort buffer of SB bytes, one can store bSB=Pcpages. So, M � bSB=Pc ÿ 1. Finally,
CIO�sort1� � 2�D1 � dlogM D1e � SrandIO : �26�
Using similar arguments we have that
D2 �NRowsT t
2
nrpT2
� ��27�
and
CIO�sort2� � 2�D2 � dlogM D2e � SrandIO : �28�
Hybrid Join (HJ). This type of join is executed as follows:
1. As in merge join, execute a select statement of theform select from T1 where C1
1 ; � � � ; C1m and
retrieve the resulting rows sorted by the joiningcolumn C1
j into a temporary table denoted by Tt1 . Thenumber of rows, NRowsT t
1, of this temporary table is
given by (20).2. Scan the temporary table Tt1 , in joining column order.
For each value of the joining column, perform anindex lookup in table T2 and retrieve the rowpointers for the rows in T2 that satisfy this lookup.Let I2 be the index on table T2 for the joining columnC2k . Another temporary table, Tt2 , is built containing
rows with the columns of Tt1 plus an additionalcolumn for the row pointer of the qualifying table T2
rows. The number of rows, NRowsT t2, in table Tt2 is
given by NRowsTt1� s�C2
k� �NRows�T2�. The cost,CIO�rid�, of retrieving the row pointers in this step isgiven by (29). The term in square brackets indicatesthe I/O cost incurred to do an index lookup for eachvalue of the joining column in the outer temporarytable. The number of rows in the temporary outertable if one eliminates duplicate values in the joiningcolumn is obtained by applying the selectivity factorof the joining column to the outer temporary table.
CIO�rid� ��g�T2; IC2k� � Srand
IO ��NLeaves�s�C2
k� �NRowsT2; IC2
k� ÿ 1��
SseqIO ��
NRowsTt1� s�C1
j �:�29�
MENASC�E AND GOMAA: A METHOD FOR DESIGN AND PERFORMANCE MODELING OF CLIENT/SERVER SYSTEMS 1079
Following the same arguments presented in the Merge
Join section, the cost of performing step 1 for a hybrid join is
given by CIO�select1� � CIO�sort1�.So, the cost CIO�HJ� of a hybrid join is given by
CIO�HJ� � CIO�select1� � CIO�sort1� � CIO�rid�: �30�More than Two Table Joins. When more than two tables are
joined, the query optimizer has to decide the order in which
joins are performed. Given a specific order, tables are joined
pairwise, using the methods described in the previous
subsections, and the temporary table generated is joined
with the other tables. For example, in the three-table join
below, tables T1, T2, and T3 are joined. The query optimizer
may decide to join T1 and T2 to generate a temporary table
Tt which is then joined to T3, or join T2 and T3 first to
generate Tt which is then joined to T1.
select from T1 where C11 ; � � � ; C1
m
from T2 where C21 ; � � � ; C2
n
from T3 where C31 ; � � � ; C3
p
joined_by T1:C1j � T2:C
2k;
T2:C2i � T3:C
3k ;
In general, the number of possible join order alternatives
may be quite large and the computational effort of the
query optimizer may be nontrivial if one takes into account
all possible join methods that can be used for each join. The
approach taken by the CLISSPE compiler is to consider join
order alternatives only. If n tables are being joined, the
number of possible join orders is less than or equal to n!=2
and greater than or equal to nÿ 1. Thus, if a select
statement joins four tables, there are at most 12 alternatives
to consider. For five tables there are at most 60. The actual
number of alternative join orders depends on the joins
specified in the joined_by clause. CLISSPE, performs an
exhaustive search of all possible join orders since it is not
expected that CLISSPE programs will have select state-
ments that join more than five tables.The CLISSPE compiler uses the following algorithm to
compute the cost, CIO�MTJ�, of a multitable join:
1. Build a list of join alternative (LJA) orders takinginto account the joins specified in the joined_by
clause.2. For each element a � �T1; � � � ; Tn� in the list LJA,
compute the I/O cost CIO�a� of the alternative a as
CIO�a� � CIO�T1 � T2� � CIO��T1 � T2� � T3� �� � � � CIO��T1 � � � �Tnÿ1� � Tn�;
�31�where � stands for the join operator. The I/O costcomputed for each individual join is obtained byselecting the join method (i.e., nested loop, mergejoin, and hybrid join) that provides the minimal costfor that join. From (31), it is clear that one needs to beable to derive all the needed parameters for a tableresulting from a join so that one can compute thecost of joining this table with the next one in the list.This implies that one needs to compute the sizeSJ�Ti; Tj� of a table resulting from the join of tablesTi and Tj. The derivation of SJ�Ti; Tj� is given belowafter the algorithm to compute the list LJA ispresented.
3. The cost CIO�MTJ� is computed as the minimumcost among all costs CIO�a� for all elements in the listLJA.
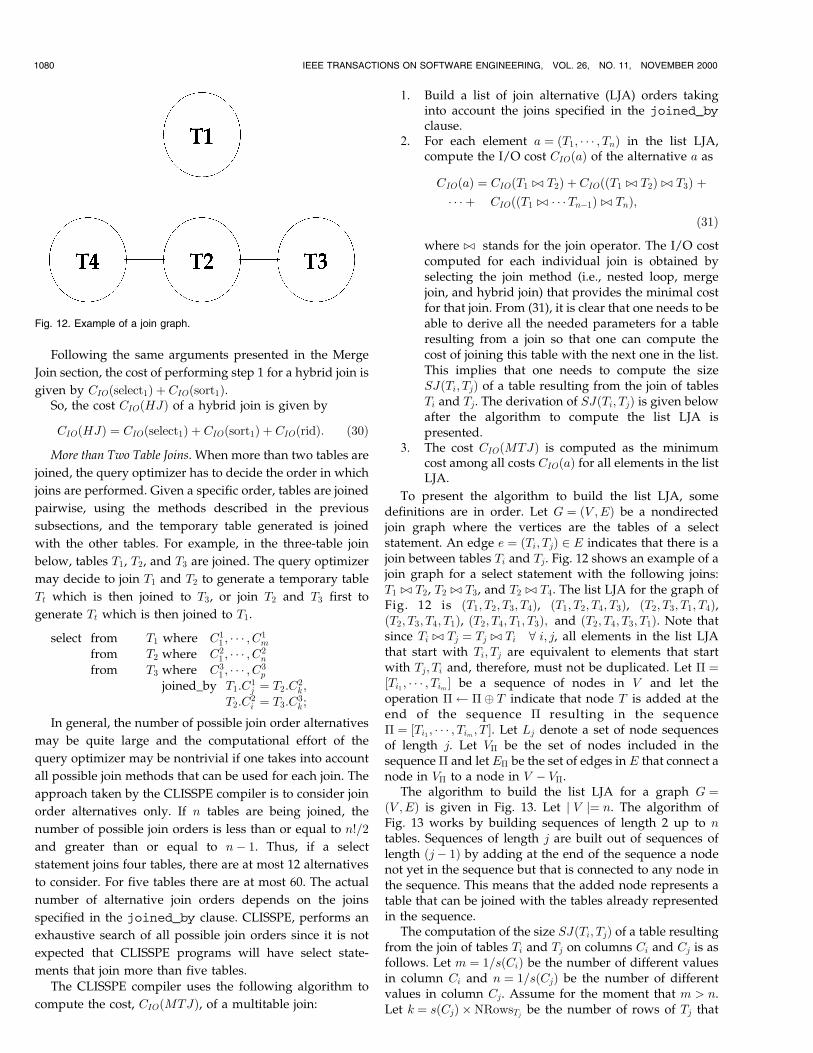
To present the algorithm to build the list LJA, somedefinitions are in order. Let G � �V ;E� be a nondirectedjoin graph where the vertices are the tables of a selectstatement. An edge e � �Ti; Tj� 2 E indicates that there is ajoin between tables Ti and Tj. Fig. 12 shows an example of ajoin graph for a select statement with the following joins:T1 � T2, T2 � T3, and T2 � T4. The list LJA for the graph ofFig. 12 is �T1; T2; T3; T4�, �T1; T2; T4; T3�, �T2; T3; T1; T4�,�T2; T3; T4; T1�, �T2; T4; T1; T3�; and �T2; T4; T3; T1�. Note thatsince Ti � Tj � Tj � Ti 8 i; j, all elements in the list LJAthat start with Ti; Tj are equivalent to elements that startwith Tj; Ti and, therefore, must not be duplicated. Let � ��Ti1 ; � � � ; Tim � be a sequence of nodes in V and let theoperation � �� T indicate that node T is added at theend of the sequence � resulting in the sequence� � �Ti1 ; � � � ; Tim ; T �. Let Lj denote a set of node sequencesof length j. Let V� be the set of nodes included in thesequence � and let E� be the set of edges in E that connect anode in V� to a node in V ÿ V�.
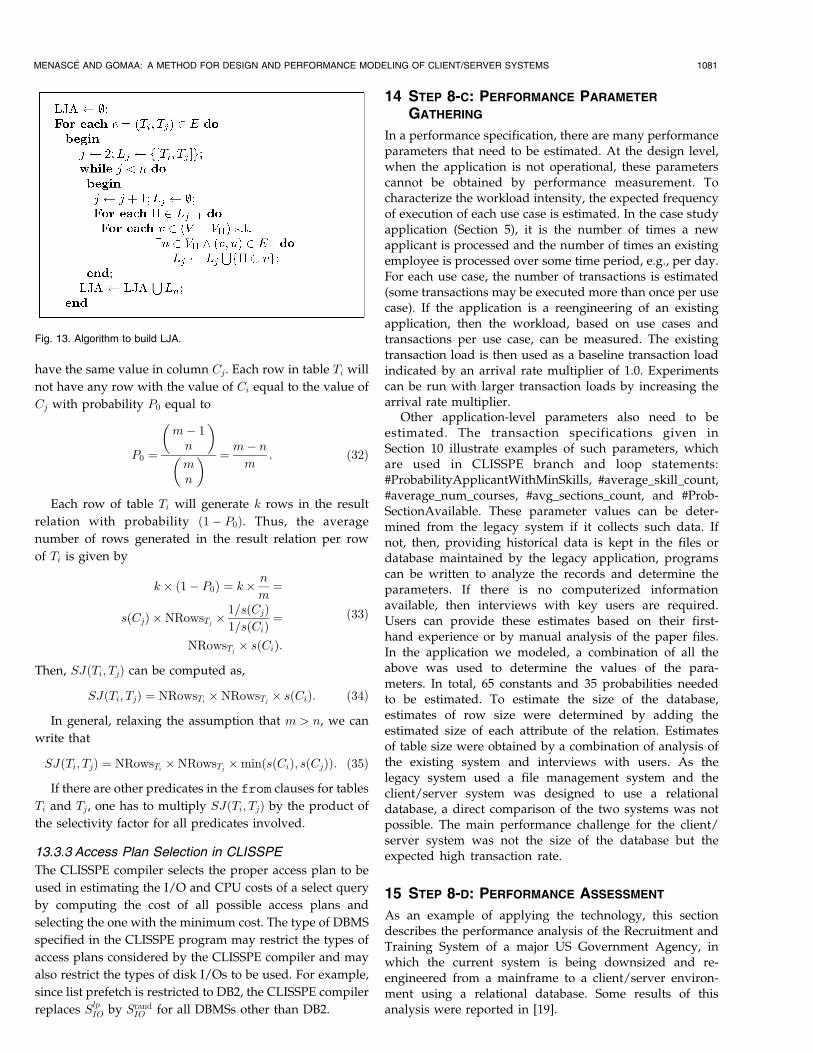
The algorithm to build the list LJA for a graph G ��V ;E� is given in Fig. 13. Let j V j� n. The algorithm ofFig. 13 works by building sequences of length 2 up to ntables. Sequences of length j are built out of sequences oflength �jÿ 1� by adding at the end of the sequence a nodenot yet in the sequence but that is connected to any node inthe sequence. This means that the added node represents atable that can be joined with the tables already representedin the sequence.
The computation of the size SJ�Ti; Tj� of a table resultingfrom the join of tables Ti and Tj on columns Ci and Cj is asfollows. Let m � 1=s�Ci� be the number of different valuesin column Ci and n � 1=s�Cj� be the number of differentvalues in column Cj. Assume for the moment that m > n.Let k � s�Cj� �NRowsTj be the number of rows of Tj that
1080 IEEE TRANSACTIONS ON SOFTWARE ENGINEERING, VOL. 26, NO. 11, NOVEMBER 2000
Fig. 12. Example of a join graph.
have the same value in column Cj. Each row in table Ti will
not have any row with the value of Ci equal to the value of
Cj with probability P0 equal to
P0 �mÿ 1n
� �mn
� � � mÿ nm
: �32�
Each row of table Ti will generate k rows in the result
relation with probability �1ÿ P0�. Thus, the average
number of rows generated in the result relation per row
of Ti is given by
k� �1ÿ P0� � k� n
m�
s�Cj� �NRowsTj �1=s�Cj�1=s�Ci� �
NRowsTj � s�Ci�:
�33�
Then, SJ�Ti; Tj� can be computed as,
SJ�Ti; Tj� � NRowsTi �NRowsTj � s�Ci�: �34�In general, relaxing the assumption that m > n, we can
write that
SJ�Ti; Tj� � NRowsTi �NRowsTj �min�s�Ci�; s�Cj��: �35�If there are other predicates in the from clauses for tables
Ti and Tj, one has to multiply SJ�Ti; Tj� by the product of
the selectivity factor for all predicates involved.
13.3.3 Access Plan Selection in CLISSPE
The CLISSPE compiler selects the proper access plan to be
used in estimating the I/O and CPU costs of a select query
by computing the cost of all possible access plans and
selecting the one with the minimum cost. The type of DBMS
specified in the CLISSPE program may restrict the types of
access plans considered by the CLISSPE compiler and may
also restrict the types of disk I/Os to be used. For example,
since list prefetch is restricted to DB2, the CLISSPE compiler
replaces SlpIO by SrandIO for all DBMSs other than DB2.
14 STEP 8-C: PERFORMANCE PARAMETER
GATHERING
In a performance specification, there are many performanceparameters that need to be estimated. At the design level,when the application is not operational, these parameterscannot be obtained by performance measurement. Tocharacterize the workload intensity, the expected frequencyof execution of each use case is estimated. In the case studyapplication (Section 5), it is the number of times a newapplicant is processed and the number of times an existingemployee is processed over some time period, e.g., per day.For each use case, the number of transactions is estimated(some transactions may be executed more than once per usecase). If the application is a reengineering of an existingapplication, then the workload, based on use cases andtransactions per use case, can be measured. The existingtransaction load is then used as a baseline transaction loadindicated by an arrival rate multiplier of 1.0. Experimentscan be run with larger transaction loads by increasing thearrival rate multiplier.
Other application-level parameters also need to beestimated. The transaction specifications given inSection 10 illustrate examples of such parameters, whichare used in CLISSPE branch and loop statements:#ProbabilityApplicantWithMinSkills, #average_skill_count,#average_num_courses, #avg_sections_count, and #Prob-SectionAvailable. These parameter values can be deter-mined from the legacy system if it collects such data. Ifnot, then, providing historical data is kept in the files ordatabase maintained by the legacy application, programscan be written to analyze the records and determine theparameters. If there is no computerized informationavailable, then interviews with key users are required.Users can provide these estimates based on their first-hand experience or by manual analysis of the paper files.In the application we modeled, a combination of all theabove was used to determine the values of the para-meters. In total, 65 constants and 35 probabilities neededto be estimated. To estimate the size of the database,estimates of row size were determined by adding theestimated size of each attribute of the relation. Estimatesof table size were obtained by a combination of analysis ofthe existing system and interviews with users. As thelegacy system used a file management system and theclient/server system was designed to use a relationaldatabase, a direct comparison of the two systems was notpossible. The main performance challenge for the client/server system was not the size of the database but theexpected high transaction rate.
15 STEP 8-D: PERFORMANCE ASSESSMENT
As an example of applying the technology, this sectiondescribes the performance analysis of the Recruitment andTraining System of a major US Government Agency, inwhich the current system is being downsized and re-engineered from a mainframe to a client/server environ-ment using a relational database. Some results of thisanalysis were reported in [19].
MENASC�E AND GOMAA: A METHOD FOR DESIGN AND PERFORMANCE MODELING OF CLIENT/SERVER SYSTEMS 1081
Fig. 13. Algorithm to build LJA.
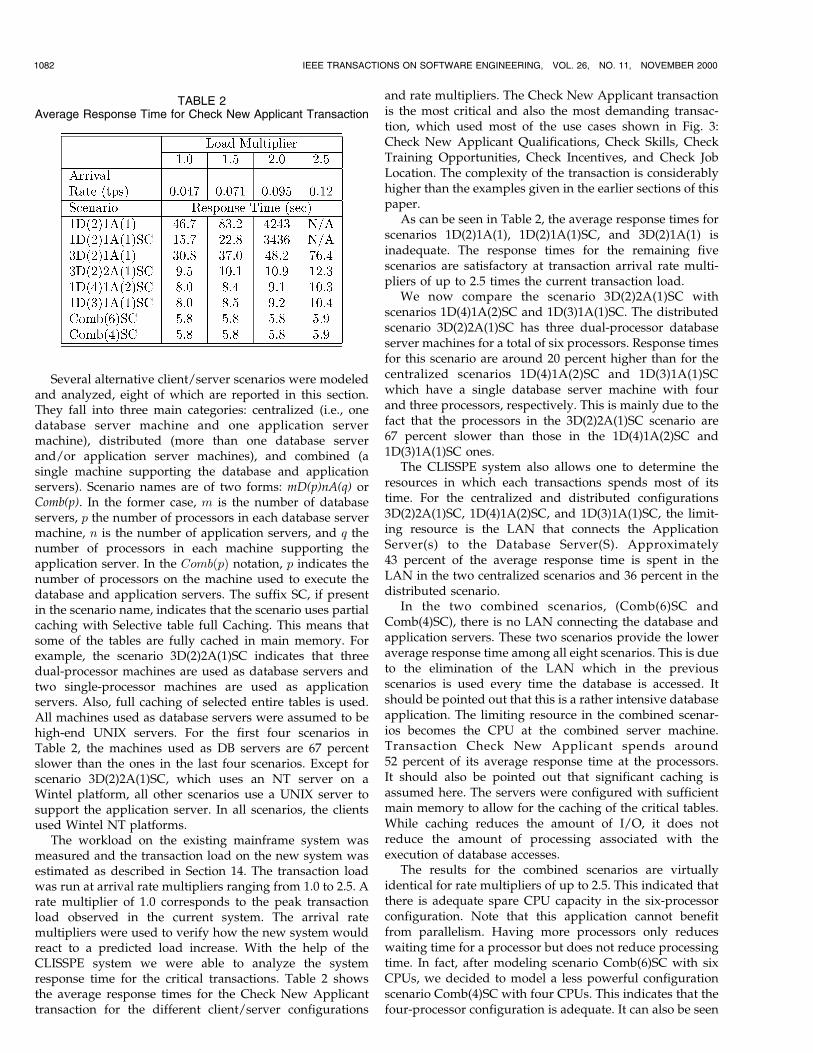
Several alternative client/server scenarios were modeledand analyzed, eight of which are reported in this section.They fall into three main categories: centralized (i.e., onedatabase server machine and one application servermachine), distributed (more than one database serverand/or application server machines), and combined (asingle machine supporting the database and applicationservers). Scenario names are of two forms: mD(p)nA(q) orComb(p). In the former case, m is the number of databaseservers, p the number of processors in each database servermachine, n is the number of application servers, and q thenumber of processors in each machine supporting theapplication server. In the Comb�p� notation, p indicates thenumber of processors on the machine used to execute thedatabase and application servers. The suffix SC, if presentin the scenario name, indicates that the scenario uses partialcaching with Selective table full Caching. This means thatsome of the tables are fully cached in main memory. Forexample, the scenario 3D(2)2A(1)SC indicates that threedual-processor machines are used as database servers andtwo single-processor machines are used as applicationservers. Also, full caching of selected entire tables is used.All machines used as database servers were assumed to behigh-end UNIX servers. For the first four scenarios inTable 2, the machines used as DB servers are 67 percentslower than the ones in the last four scenarios. Except forscenario 3D(2)2A(1)SC, which uses an NT server on aWintel platform, all other scenarios use a UNIX server tosupport the application server. In all scenarios, the clientsused Wintel NT platforms.
The workload on the existing mainframe system wasmeasured and the transaction load on the new system wasestimated as described in Section 14. The transaction loadwas run at arrival rate multipliers ranging from 1.0 to 2.5. Arate multiplier of 1.0 corresponds to the peak transactionload observed in the current system. The arrival ratemultipliers were used to verify how the new system wouldreact to a predicted load increase. With the help of theCLISSPE system we were able to analyze the systemresponse time for the critical transactions. Table 2 showsthe average response times for the Check New Applicanttransaction for the different client/server configurations
and rate multipliers. The Check New Applicant transactionis the most critical and also the most demanding transac-tion, which used most of the use cases shown in Fig. 3:Check New Applicant Qualifications, Check Skills, CheckTraining Opportunities, Check Incentives, and Check JobLocation. The complexity of the transaction is considerablyhigher than the examples given in the earlier sections of thispaper.
As can be seen in Table 2, the average response times forscenarios 1D(2)1A(1), 1D(2)1A(1)SC, and 3D(2)1A(1) isinadequate. The response times for the remaining fivescenarios are satisfactory at transaction arrival rate multi-pliers of up to 2.5 times the current transaction load.
We now compare the scenario 3D(2)2A(1)SC withscenarios 1D(4)1A(2)SC and 1D(3)1A(1)SC. The distributedscenario 3D(2)2A(1)SC has three dual-processor databaseserver machines for a total of six processors. Response timesfor this scenario are around 20 percent higher than for thecentralized scenarios 1D(4)1A(2)SC and 1D(3)1A(1)SCwhich have a single database server machine with fourand three processors, respectively. This is mainly due to thefact that the processors in the 3D(2)2A(1)SC scenario are67 percent slower than those in the 1D(4)1A(2)SC and1D(3)1A(1)SC ones.
The CLISSPE system also allows one to determine theresources in which each transactions spends most of itstime. For the centralized and distributed configurations3D(2)2A(1)SC, 1D(4)1A(2)SC, and 1D(3)1A(1)SC, the limit-ing resource is the LAN that connects the ApplicationServer(s) to the Database Server(S). Approximately43 percent of the average response time is spent in theLAN in the two centralized scenarios and 36 percent in thedistributed scenario.
In the two combined scenarios, (Comb(6)SC andComb(4)SC), there is no LAN connecting the database andapplication servers. These two scenarios provide the loweraverage response time among all eight scenarios. This is dueto the elimination of the LAN which in the previousscenarios is used every time the database is accessed. Itshould be pointed out that this is a rather intensive databaseapplication. The limiting resource in the combined scenar-ios becomes the CPU at the combined server machine.Transaction Check New Applicant spends around52 percent of its average response time at the processors.It should also be pointed out that significant caching isassumed here. The servers were configured with sufficientmain memory to allow for the caching of the critical tables.While caching reduces the amount of I/O, it does notreduce the amount of processing associated with theexecution of database accesses.
The results for the combined scenarios are virtuallyidentical for rate multipliers of up to 2.5. This indicated thatthere is adequate spare CPU capacity in the six-processorconfiguration. Note that this application cannot benefitfrom parallelism. Having more processors only reduceswaiting time for a processor but does not reduce processingtime. In fact, after modeling scenario Comb(6)SC with sixCPUs, we decided to model a less powerful configurationscenario Comb(4)SC with four CPUs. This indicates that thefour-processor configuration is adequate. It can also be seen
1082 IEEE TRANSACTIONS ON SOFTWARE ENGINEERING, VOL. 26, NO. 11, NOVEMBER 2000
TABLE 2Average Response Time for Check New Applicant Transaction
that there is very little contention in the combinedconfigurations. The response time is almost flat in the rangeof load multipliers going from 1.0 to 2.5.
Due to space constraints, we cannot elaborate on theanalysis of all major transactions and the various tradeoffs.However, we give a brief idea of the major recommendations.Two configurations were selected as being acceptable:1D(3)1A(1)SC and Comb(4)SC. Both use high-end UNIXservers for the database and application server machines.The CPUs in each machine are of the faster type. The firstscenario provides a higher degree of reliability than thesecond since it can be reconfigured as a combined scenariowith somewhat degraded performance if one machine goesdown.
In both cases, sufficient main memory was recom-mended to cache critical database tables. One of the outputsof the CLISSPE system is the number of I/Os executed byeach select statement as well as the average number oftimes it is executed. This allowed for transaction redesign toimprove performance and for the determination of thetables to be cached. In fact, the analysis revealed that,without full caching of the most critical tables (over100Mbytes in total), a satisfactory level of performancecould not be achieved with the configurations modeled.
The design and performance analysis carried out for theRTS system was very thorough. It consisted of roughly10,000 lines of CLISSPE code and provided applicationprogrammers with detailed guidelines on how to imple-ment the transactions. The analysis also provided aspecification of the system configuration to be procuredby the agency.
16 DISCUSSION AND FUTURE WORK
In the current version of the system, the mapping from theobject collaboration diagram (and its documentation in themessage sequence descriptions) to the CLISSPE transactionspecification is done by hand. Initially, the transactionspecification was specified in two procedures, one for theclient and one for the application server. The clientspecification corresponds to the user interface object shownin Figs. 5 and 6. However, the server objects, e.g., thecoordinator and entity objects shown in Figs. 5 and 6, aremapped to the server procedure.
The CLISSPE specification of each transaction wasdeveloped from the use case and object collaborationdiagram for the transaction. At the pseudocode level, thelogic of the transaction, in terms of the relations accessedand processing required for each business rule, wasreviewed with the users and developers. Based on earlyresults of the performance analysis, the transactions withthe greatest resource demands were determined andanalyzed in more detail. Alternative algorithms wereconsidered involving a different order for executing thebusiness rules and, hence, a different access pattern to thedatabase relations. Each alternative algorithm was modeledand compared with other candidate algorithms. Using thisapproach, significant performance improvements wereobtained in key algorithms.
As we applied the initial version of CLISSPE to the real-world Recruiting and Training System, it became apparent
that for long transactions, having one nonmodular serverprocedure, resulted in lengthy procedures, which did notexploit the benefits of the use case and object structuringcarried out in the OO analysis and design. To address thisproblem, a macro capability with parameters was intro-duced into CLISSPE, which allows a long transactionspecification to be decomposed into smaller macros, whichcorrespond to the objects and/or operations depicted in theobject collaboration diagrams. This meant that macros couldbe reused in different transaction specifications just asobjects are reused in different use cases and objectcollaborations.
In the future, we are planning to provide a closer linkbetween the UML model for use cases and object collabora-tion diagrams and the CLISSPE specification. Thus, eachclass would have a corresponding CLISSPE specification.An object collaboration diagram for a transaction would bemapped to a transaction specification by creating instancesof the classes and binding the instances into a transactionspecification. We are also investigating using a componentbased model of a distributed software architecture [6], [18],specified in an Architecture Description Language [17], [39],with the specification of each component to include adescription of its performance characteristics.
Another issue is that in changing from one client/serverconfiguration to a different one, some amount of recodingneeds to be done. Although the main change is in themapping section of the specification, other changes are alsoneeded in the transaction specification, in particular whereit specifies which node the transaction executes on. With theADL approach outlined above, the configuration of theapplication could be separated from the transactionspecifications, making it easier to specify and experimentwith different configurations.
17 CONCLUDING REMARKS
Software design and development in a C/S environmentoffers a very large number of design alternatives to thedesigner. These alternatives range from software architec-tural issues to the choice of proper system configurationand platforms to be used. Predicting the performance of asystem under development requires that service demandsbe estimated for resources such as CPU, disks, andnetworks.
For I/O intensive applications, a good estimate of theCPU time of a transaction can be obtained as a function ofthe number of I/Os. The challenge then is to estimate thenumber of I/Os. Most SPE studies and packages require thesoftware performance engineer to provide these estimatesby analyzing the transaction logic. This may lead to quiteinaccurate estimates. In this paper, we modeled the workperformed by the query optimizer of the DBMS in order togenerate more accurate estimates on the number of I/Os fordifferent query types and different types of indices on thetables being queried. The models we developed are basedon analytic formulas that capture the traversal of indicesand processing of various types of joins. In our studies, wewere able to see clearly the effects of changing databaseconfigurations. For example, adding or removing indices
MENASC�E AND GOMAA: A METHOD FOR DESIGN AND PERFORMANCE MODELING OF CLIENT/SERVER SYSTEMS 1083
from critical relations had a major impact on the number
of I/Os.Our understanding of the operation of the query
optimizer for commercial databases such as Oracle and
DB2 was limited to what is known in the published
literature. Proprietary aspects of the query optimizers were
not modeled. Therefore, discrepancies between the model
estimates and actual measurements may arise. However, in
SPE at the early stage of the system development, one is
interested in relative performance and not necessarily in
absolute performance values.Our work shows that these early performance models,
which are developed before the system exists, have an
important role to play. These models may be used for
comparative studies of alternative hardware and software
architectures, even though they are not expected to be as
accurate as more detailed models that use measurements
from a real system. As the system is developed, it is possible
to refine the model by including measurements from the
real system.SPE requires the collaboration of the software developers
who are usually too busy to get the system running on
schedule. Performance is usually an afterthought. This
paper presents a method that blends software design with
performance modeling. The method is based on the
CLISSPE language that can be used to specify use cases
and also as a basis for generating predictive performance
models and its parameters.CLISSPE can be used by both software system designers
and performance engineers. One of the major deterrents for
the widespread use of SPE is that it is viewed by many as an
activity separate from software design and development,
and, therefore, should be carried out by people with
different skills. With our integrated method, we hope to
bridge the gap between these two camps.
ACKNOWLEDGMENTS
This work was partially supported by the US National
Science Foundation under grant CCR-9804113. The authors
would like to thank the anonymous reviewers for their
thoughtful suggestions which helped improve the quality of
the paper.
REFERENCES
[1] G. Booch, J. Rumbaugh, and I. Jacobson, The Unified ModelingLanguage User Guide. Reading, Mass.: Addison Wesley, 1999.
[2] S. Christodoulakis, ªEstimating Block Transfers and Join Sizes,ºProc. ACM 1983 SIGMOD Conf., pp. 40-54, May, 1983.
[3] G. Franks and M. Woodside, ªPerformance of Multi-Level Client-Server Systems with Parallel Service Operations,º Proc. First Int'lWorkshop Software and Performance, Oct. 1998.
[4] G. Franks, A. Hubbard, S. Majumdar, D. Petriu, J. Rolia, andC.M. Woodside, ªA Toolset for Performance Engineering andSoftware Design of Client-Server Systems,º Performance EvaluationJ., vol. 24, no. 1-2, pp. 117-135, Nov. 1995.
[5] D. Gardy and C. Puech, ªOn the Effect of Join Operations onRelation Sizes,º ACM Transactions on Database Systems, vol. 14,no. 4, pp. 574-603, Dec. 1989.
[6] H. Gomaa and G. Farrukh, ªComposition of Software Architec-tures from Reusable Architecture Patterns,º Proc. IEEE Int'lWorkshop Software Architectures, Nov. 1998.
[7] H. Gomaa, ªUse Cases for Distributed Real-Time SoftwareArchitectures,º J. Parallel and Distributed Computing Practices, June1998.
[8] H. Gomaa and G. Farrukh, ªAutomated Configuration ofDistributed Applications from Reusable Software Architectures,ºProc. IEEE Int'l Conf. Automated Software Engineering, Nov. 1997.
[9] H. Gomaa, D.A. MenasceÂ, and L. Kerschberg, ªA SoftwareArchitectural Design Method for Large-Scale Distributed DataIntensive Information Systems,º Journal of Distributed SystemsEngineering, vol. 3, pp. 162-172, 1996.
[10] H. Gomaa, Designing Concurrent, Distributed, and Real-TimeApplications with UML. Addison Wesley, 1993.
[11] A Grummitt, ªA Performance Engineer's View of SystemDevelopment and Trials,º Proc. 1991 Computer Measurement GroupConf., pp. 455-463, Dec. 1991.
[12] D. Harel, ªOn Visual Formalisms,º Comm. ACM, vol. 31, no. 5,pp. 514-530, May 1988.
[13] H. Hlavacs and G. Kotsis, ªModeling User Behavior: A LayeredApproach,º Proc. Seventh Int'l Symp. Modeling, Oct. 1999.
[14] G. Jacobson, G. Booch, J. Rumbaugh, The Unified SoftwareDevelopment Process. Reading, Mass.: Addison Wesley, 1999.
[15] I. Jacobson, M. Christerson, P. Jonsson, and G. Overgaard, Object-Oriented Software Engineering. Reading, Mass.: Addison Wesley,1992.
[16] G. Koch and K. Loney, Oracle: The Complete Reference ElectronicEdition. Oracle Press, 1996.
[17] D.C. Luckham, J.J. Kenney, L.M. Augustin, J. Vera, D. Bryan, andW. Mann, ªSpecification and Analysis of System Architectureusing Rapide,º IEEE Trans. Software Eng., vol. 21, no. 4, Apr. 1995.
[18] J. Magee, N. Dulay, and J. Kramer, ªRegis: A ConstructiveDevelopment Environment for Parallel and Distributed Pro-grams,º J. Distributed Systems Eng., pp. 304-312, 1994.
[19] D.A. Menasce and H. Gomaa, ªOn a Language Based Method forSoftware Performance Engineering of Client/Server Systems,ºProc. First Int'l Workshop Software and Performance, Oct. 1998.
[20] D.A. Menasce and V.A.F. Almeida, ªPerformance of Client/ServerSystems,º Performance EvaluationÐOrigins and Directions,G. Haring, C. Lindemann, and M. Reiser, eds. Springer-Verlag,2000.
[21] D.A. Menasce and V.A.F. Almeida, ªCapacity Planning for WebPerformance: Metrics, Methods, and Models.º Upper Saddle River,N.J.: Prentice Hall, 1998.
[22] D.A. MenasceÂ, ªA Framework for Software Performance En-gineering of Client/Server Systems,º Proc. 1997 Computer Measure-ment Group Conf., Dec. 1997.
[23] D.A. MenasceÂ, ªCLISSPE: A Language for Client/Server SoftwarePerformance Engineering,º technical report, Dept. of ComputerScience, George Mason Univ., Jan. 1997, http://www.cs.gmu.edu/~menasce/clisspe.
[24] D.A. MenasceÂ, V. Almeida, R. Fonseca, and M.A. Mendes, ªAMethodology for Workload Characterization of E-CommerceSites,º Proc. ACM Conf. Electronic Commerce, Nov. 1999
[25] D.A. MenasceÂ, O. Pentakalos, and Y. Yesha, ªAn Analytic Modelof Hierarchical Mass Storage Systems with Network-AttachedStorage Devices,º Proc. ACM Sigmetrics Conf., May 1996.
[26] D.A. MenasceÂ, H. Gomaa, and L. Kerschberg, ªA Performance-Oriented Design Methodology for Large-Scale Distributed DataIntensive Information Systems,º Proc. First IEEE Int'l Conf. Eng. ofComplex Computer Systems, Nov. 1995.
[27] D.A. MenasceÂ, V.A.F. Almeida, and L.W. Dowdy, CapacityPlanning and Performance Modeling: from Mainframes to Client-ServerSystems. Upper Saddle River, N.J.: Prentice Hall, 1994.
[28] J.E. Neilson, C.M. Woodside, D.C. Petriu, and S. Majumdar,ªSoftware Bottlenecking in Client-Server Systems and Rendez-vous Networks,º IEEE Trans. Software Eng., vol. 21, no. 9, pp. 776-782, Sept. 1995.
[29] P. O'Neil, Database Principles, Programming, Performance. SanFrancisco: Morgan Kauffman, 1994.
[30] D. Parnas, ªDesigning Software for Ease of Extension andContraction,º IEEE Trans. Software Eng., Mar. 1979.
[31] D. Parnas, ªOn the Criteria for Decomposing a System intoModules,º Comm. ACM, Dec. 1972.
[32] S. Ramesh and H.G. Perros, ªA Multi-Layer Client-ServerQueuing Network Model with Synchronous and AsynchronousMessages,º Proc. First Int'l Workshop Software and Performance, Oct.1998.
1084 IEEE TRANSACTIONS ON SOFTWARE ENGINEERING, VOL. 26, NO. 11, NOVEMBER 2000
[33] M. Reiser and S. Lavenberg, ªMean-Value Analysis of ClosedMulti-Chain Queuing Networks,º J. ACM, vol. 27, no. 2, 1980.
[34] J.A. Rolia and K.C. Sevcik, ªThe Method of Layers,º IEEE Trans.Software Eng., vol. 21, no. 8, pp. 689-700, Aug. 1995.
[35] J. Rumbaugh, I. Jacobson, and G. Booch, The Unified ModelingLanguage Reference Manual. Reading, Mass.: Addison Wesley, 1999.
[36] J. Rumbaugh, M. Blaha, W. Premerlani, F. Eddy, and W. Lorensen,Object-oriented Modeling and Design. Upper Saddle River, N.J.:Prentice Hall, 1991.
[37] S. Salza and M. Terranova, ªEvaluating the Size of Queries onRelational Databases with Non-Uniform Distribution and Sto-chastic Dependence,º Proc. ACM SIGMOD Conf., pp. 8-14, June1989.
[38] L. Shapiro, ªJoin Processing in Database Systems with Large MainMemories,º ACM Trans. Database Systems, vol. 11, no. 3, pp. 239-264, Sept. 1986.
[39] M. Shaw and D. Garlan, Software Architecture: Perspectives on anEmerging Discipline. Prentice Hall, 1996
[40] C. Smith, P. Clements, and M. Woodside, Proc. First Int'l WorkshopSoftware and Performance, Oct. 1998.
[41] C. Smith, Performance Engineering of Software Systems. Reading,Mass.: Addison Wesley, 1990.
[42] A. Swami and K.B. Schiefer, ªEstimating Page Fetches for IndexScans with Finite LRU Buffers,º Proc. ACM SIGMOD Conference,pp. 173-184, 1994.
[43] C.M. Woodside, J.E. Neilson, D.C. Petriu, and S. Majumdar, ªTheStochastic Rendezvous Network Model for Performance ofSynchronous Client-Server-like Distributed Software,º IEEE Trans.Computers, vol. 44, no. 1, Jan. 1995.
[44] S.B. Yao, ªOptimization of Query Evaluation Algorithms,º ACMTrans. Database Systems, vol. 4, no. 2, pp. 133-155 Sept. 1979.
[45] C.T. Yu, ªDistributed Database Query Processing,º Query Proces-sing in Database Systems, W. Kim, D. Reiner and D. Batory, eds.Springer-Verlag, 1985.
[46] M. Woodside, C. Hrischuck, B. Selic, and S. Bayarov, ªAWideband Approach to Integrating Performance Prediction intoa Software Design Environment,º Proc. First Int'l WorkshopSoftware and Performance, Oct. 1998.
Daniel A. Menasce received the PhD degree incomputer science from UCLA (1978), the MScdegree in computer science, and the BSEEdegree both from the Pontifical Catholic Uni-versity in Rio de Janeiro (PUC-RIO), Brazil(1975 and 1974, respectively). He is a professorof computer science at George Mason Univer-sity, Fairfax, Virginia. He held visiting facultypositions at UMIACS, University of Maryland atCollege Park (1991-1992), and at the University
of Rome, Italy (1983). He was a full time faculty member of theDepartment of Computer Science at PUC-RIO, Brazil, for 14 years,where he was also chair of CS (1981-1983). Menasce is an ACM Fellowand a member of IFIP's Working Group 7.3. He has published more than110 technical papers and was the chief author of five books, includingScaling for E-Business: Technologies, Models, Performance, andCapacity Planning, Capacity Planning for Web Performance: Metrics,Models, and Methods, and Capacity Planning and PerformanceModeling: From Mainframes to Client-Server Systems, published byPrentice Hall in 2000, 1998, and 1994, respectively. His research hasbeen funded by DARPA, NASA, NSF, Virginia's Center for InnovativeTechnology, OPNET Technologies, Hughes Applied Information Sys-tems, Brazilian Telecommunications Company, Brazilian ResearchCouncil (CNPq), Brazilian Ministry of Science and Technology, andIBM Brazil. Menasce was the recipient of various prizes, teachingawards, and best paper awards. Menasce was general chair of ACMSigmetrics 1999 and program co-chair of the 2000 ACM Workshop onSoftware Performance. His areas of interest include performancemodelling, web and e-commerce technologies, and software perfor-mance engineering. He is a member of the IEEE Computer Society.
Hassan Gomaa received the BSc degree withfirst class honors in electrical engineering fromUniversity College, London University, and theDIC and PhD degrees in computer science fromImperial College of Science and Technology,London University. He is a professor in theDepartment of Information and Software Engi-neering and associate director of the Center forInformation Systems Integration and Evolutionat George Mason University, Fairfax, Virginia.
He has more than 25 years experience in software engineering, both inindustry and academia, and has published more than 100 technicalpapers. His book, Software Design Methods for Concurrent and Real-Time Systems, was published by Addison Wesley as part of the SEISeries on Software Engineering and had its fourth printing in 1999. Hisnew book entitled Designing Concurrent, Distributed, and Real-TimeApplications with UML, was also published by Addison Wesley in August2000. His current research interests include object-oriented analysis anddesign for concurrent, real-time, and distributed systems, softwarearchitecture, domain analysis and design, software reuse, softwareperformance engineering, intelligent software agents, client/serversystems, software engineering environments, software prototyping,and software process models. A recent paper he co-authored withD.A. Menasce on the design of large-scale information intensive client/server systems received an outstanding paper award at the IEEEInternationall Conference on the Engineering of Complex ComputerSystems in November, 1995. He has served on the program committeesof several international conferences and was program co-chair of the1997 IEEE International Conference on the Engineering of ComplexComputer Systems and was program co-chair of the 2000 ACMWorkshop on Software Performance. He is a member of the IEEEComputer Society.
MENASC�E AND GOMAA: A METHOD FOR DESIGN AND PERFORMANCE MODELING OF CLIENT/SERVER SYSTEMS 1085