Embed Size (px)
Citation preview

Journal of Soft Computing in Civil Engineering 1-1 (2017) 65-85
journal homepage: http://www.jsoftcivil.com/
A Method for Constructing Non-Isosceles Triangular
Fuzzy Numbers using Frequency Histogram and
Statistical Parameters
Amin Amini1*
and Navid Nikraz2
1. Ph.D. Student, Faculty of Science and Engineering, Curtin University, Kent St, Bentley WA 6102, Australia
2. Senior lecturer, Faculty of Science and Engineering, Curtin University, Kent St, Bentley WA 6102, Australia
Corresponding author: [email protected]
ARTICLE INFO
ABSTRACT
Article history:
Received: 08 July 2017
Accepted: 12 July 2017
The philosophy of fuzzy logic was formed by introducing the
membership degree of a linguistic value or variable instead
of divalent membership of 0 or 1. Membership degree is
obtained by mapping the variable on the graphical shape of
fuzzy numbers. Because of simplicity and convenience,
triangular membership numbers (TFN) are widely used in
different kinds of fuzzy analysis problems. This paper
suggests a simple method using statistical data and frequency
chart for constructing non-isosceles TFN, when we are using
direct rating for evaluating a variable in a predefined scale.
In this method the relevancy between assessment
uncertainties and statistical parameters such as mean value
and standard deviation is established in a way that presents
an exclusive form of triangle number for each set of data.
The proposed method with regard to the graphical shape of
the frequency chart distributes the standard deviation around
the mean value and forms the TFN with the membership
degree of 1 for mean value. In the last section of the paper
modification of the proposed method is presented through a
practical case study.
Keywords:
Triangular fuzzy number,
Non-isosceles,
Membership function
construction,
Direct rating,
Statistical.
1. Introduction
One of the most important steps in solving the problems and analyzing the systems by using
fuzzy logic is defining the fuzzy membership functions of the data set. Fuzzy control systems,
fuzzy inference engines, fuzzy multi-criteria decision making models and ranking system based
on fuzzy logic use fuzzy membership functions as input. So a more accurate defined membership
function results in a more accurate outputs and higher efficiency of fuzzy analysis systems. This
paper proposed a novel and simple method for constructing the triangular membership function

66 A. Amini and N. Nikraz/ Journal of Soft Computing in Civil Engineering 1-1 (2017) 65-85
using frequency chart of a certain set of statistical data when the average point of data is
considered the most possible value. This set can be the collected information from a survey using
linguistic judgments or qualitative assessments expressed in a numerical defined scale to find an
answer to the question: “ How F is a?” where ‘F’ is a fuzzy concept and ‘a’ is a parameter which
is being assessed. In different sections of this paper, after a short review of basic fuzzy logic
concepts and membership function construction methods, we introduced the proposed method
through some numerical examples.
2. Fuzzy and classic logic
In the classical logic, a simple proposition ‘P’ is a linguistic, or declarative statement contained
within a universe of elements, X, that can be identified as being a collection of elements in X that
are strictly true or strictly false [1]. In classical logic, a binary truth value is assigned to the
veracity of an element in the proposition ‘P’, which is a value of 1 (truth) or 0 (false). For
example, consider the ‘P’ statement as: “water with the temperature over 60 centigrade degree is
hot”, based on classical logic, water to 59.9 degrees is not considered hot water at all. So there is
a crisp boundary between true and false in classical logic, which causes making decisions about
processes that contain nonrandom uncertainty, such as the uncertainty in natural language, be
less than perfect. Treating truth as a linguistic variable leads to a fuzzy linguistic logic, or simply
fuzzy logic [2]. The original fuzzy logic founded by Lotfi Zadeh as a key to decision-making
when faced with linguistic and non-random uncertainty. Fuzzy logic is a precise logic of
imprecision and approximate reasoning [3]. It may be viewed as an attempt at
formalization/mechanization of two remarkable human capabilities; First, the capability to
converse, reason and make rational decisions in an environment of imprecision, uncertainty,
incompleteness of information, conflicting information, partiality of truth and partiality of
possibility - in short, in an environment of imperfect information- and second, the capability to
perform a wide variety of physical and mental tasks without any measurements and any
computation [4].
In Fuzzy logic, a statement can be either true or false and also can be neither true nor false.
Fuzzy logic is non-monotonic logic. It is a superset of conventional logic that has been extended
to handle the concept of partial truth, the truth values between ‘completely true’ and ‘completely
false’. It is a type of logic that recognizes more than simple true and false values. With fuzzy
logic, propositions can be represented with degrees of truthfulness and falsehood. For example,
the statement “today is sunny” might be 100% true if there are no clouds, 80% true if there are a
few clouds, 50% true if it's hazy and 0% true if it rains all day.
3. Fuzzy set vs crisp set
In contrast to classical set theory, each element, either fully belongs to the set or is completely
excluded from the set. In other words, classical set theory represents a special case of the more
general fuzzy set theory. In crisp set, membership of element X, µA(X) of set A is defined as:
𝜇𝐴(𝑋) = {1 𝑋 ∈ 𝐴0 𝑋 ∉ 𝐴
(1)
A. Amini and N. Nikraz/ Journal of Soft Computing in Civil Engineering 1-1 (2017) 65-85 67
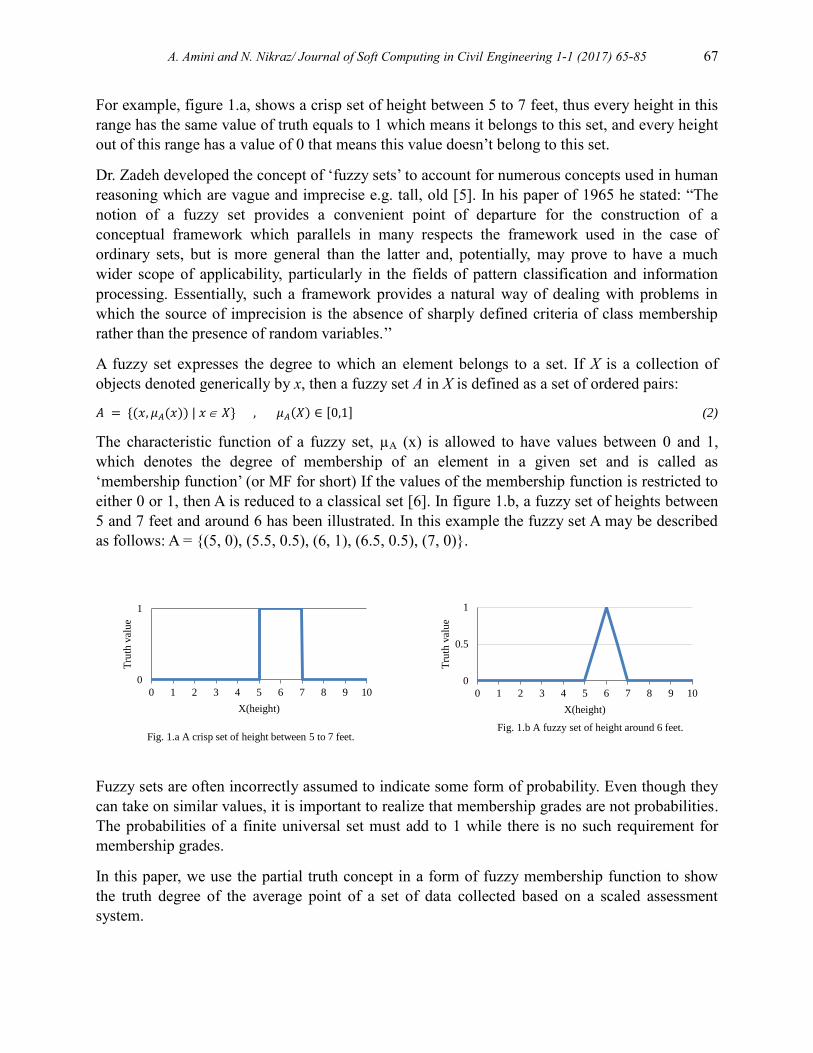
For example, figure 1.a, shows a crisp set of height between 5 to 7 feet, thus every height in this
range has the same value of truth equals to 1 which means it belongs to this set, and every height
out of this range has a value of 0 that means this value doesn’t belong to this set.
Dr. Zadeh developed the concept of ‘fuzzy sets’ to account for numerous concepts used in human
reasoning which are vague and imprecise e.g. tall, old [5]. In his paper of 1965 he stated: “The
notion of a fuzzy set provides a convenient point of departure for the construction of a
conceptual framework which parallels in many respects the framework used in the case of
ordinary sets, but is more general than the latter and, potentially, may prove to have a much
wider scope of applicability, particularly in the fields of pattern classification and information
processing. Essentially, such a framework provides a natural way of dealing with problems in
which the source of imprecision is the absence of sharply defined criteria of class membership
rather than the presence of random variables.’’
A fuzzy set expresses the degree to which an element belongs to a set. If X is a collection of
objects denoted generically by x, then a fuzzy set A in X is defined as a set of ordered pairs:
𝐴 = {(𝑥, 𝜇𝐴(𝑥)) | 𝑥 𝑋} , 𝜇𝐴(𝑋) ∈ [0,1] (2)
The characteristic function of a fuzzy set, µA (x) is allowed to have values between 0 and 1,
which denotes the degree of membership of an element in a given set and is called as
‘membership function’ (or MF for short) If the values of the membership function is restricted to
either 0 or 1, then A is reduced to a classical set [6]. In figure 1.b, a fuzzy set of heights between
5 and 7 feet and around 6 has been illustrated. In this example the fuzzy set A may be described
as follows: A = {(5, 0), (5.5, 0.5), (6, 1), (6.5, 0.5), (7, 0)}.
Fuzzy sets are often incorrectly assumed to indicate some form of probability. Even though they
can take on similar values, it is important to realize that membership grades are not probabilities.
The probabilities of a finite universal set must add to 1 while there is no such requirement for
membership grades.
In this paper, we use the partial truth concept in a form of fuzzy membership function to show
the truth degree of the average point of a set of data collected based on a scaled assessment
system.
0
1
0 1 2 3 4 5 6 7 8 9 10
Tru
th v
alu
e
X(height)
Fig. 1.a A crisp set of height between 5 to 7 feet.
0
0.5
1
0 1 2 3 4 5 6 7 8 9 10
Tru
th v
alu
e
X(height)
Fig. 1.b A fuzzy set of height around 6 feet.
68 A. Amini and N. Nikraz/ Journal of Soft Computing in Civil Engineering 1-1 (2017) 65-85
4. Fuzzy set vs fuzzy number
A fuzzy number is a fuzzy set on the real numbers. It represents information such as ‘about m’. A
fuzzy number must have a unique modal value ‘m’, be convex, normal and piecewise continuous
[7]. Fuzzy numbers generalize classical real numbers and roughly speaking a fuzzy number is a
fuzzy subset of the real line that has some additional properties. They are capable of modelling
epistemic uncertainty and its propagation through calculations. The fuzzy number concept is
basic for fuzzy analysis and fuzzy differential equations, and a very useful tool in several
applications of fuzzy sets and fuzzy logic [8].
A fuzzy set is not a fuzzy number since it is not fuzzy convex and normal. An alternative and
more direct definition of convexity is the following [5]: A is convex if and only if for all x1 and
x2 in X and all λ in [0, 1]:
𝑓𝐴[𝜆𝑥1 + (1 − 𝜆)𝑥2] ≥ 𝑀𝑖𝑛[𝑓𝐴(𝑥1), 𝑓𝐴(𝑥2)] (3)
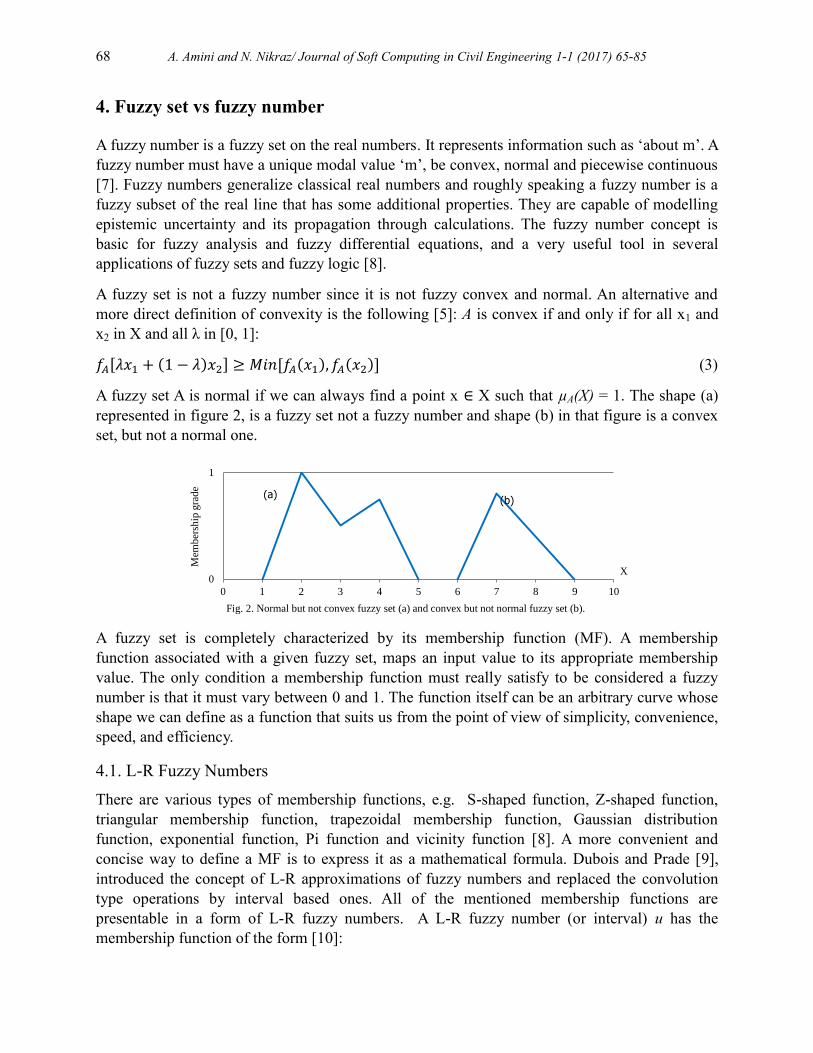
A fuzzy set A is normal if we can always find a point x ∈ X such that µA(X) = 1. The shape (a)
represented in figure 2, is a fuzzy set not a fuzzy number and shape (b) in that figure is a convex
set, but not a normal one.
A fuzzy set is completely characterized by its membership function (MF). A membership
function associated with a given fuzzy set, maps an input value to its appropriate membership
value. The only condition a membership function must really satisfy to be considered a fuzzy
number is that it must vary between 0 and 1. The function itself can be an arbitrary curve whose
shape we can define as a function that suits us from the point of view of simplicity, convenience,
speed, and efficiency.
4.1. L-R Fuzzy Numbers
There are various types of membership functions, e.g. S-shaped function, Z-shaped function,
triangular membership function, trapezoidal membership function, Gaussian distribution
function, exponential function, Pi function and vicinity function [8]. A more convenient and
concise way to define a MF is to express it as a mathematical formula. Dubois and Prade [9],
introduced the concept of L-R approximations of fuzzy numbers and replaced the convolution
type operations by interval based ones. All of the mentioned membership functions are
presentable in a form of L-R fuzzy numbers. A L-R fuzzy number (or interval) u has the
membership function of the form [10]:
0
1
0 1 2 3 4 5 6 7 8 9 10
Mem
ber
ship
gra
de
X
Fig. 2. Normal but not convex fuzzy set (a) and convex but not normal fuzzy set (b).
(a) (b)

A. Amini and N. Nikraz/ Journal of Soft Computing in Civil Engineering 1-1 (2017) 65-85 69
µ𝑢(𝑥) =
{
𝑓𝐿 (
𝑥−𝑎
𝑏−𝑎) 𝑖𝑓 𝑥 ∈ [𝑎, 𝑏]
1 𝑖𝑓 𝑥 ∈ [𝑏, 𝑐]
𝑓𝑅 (𝑑−𝑥
𝑑−𝑐) 𝑖𝑓 𝑥 ∈ [𝑐, 𝑑]
0 𝑜𝑡ℎ𝑒𝑟𝑤𝑖𝑠𝑒
(4)
Where fL, fR: [0, 1] → [0, 1] are two continuous, increasing functions, fulfilling fL(0)=fR(0)=0, fL
(1)=fR (1)=1. The compact interval [a, d] is the support and the core is [b, c]. The usual notation
is u = (a, b, c, d), fL, fR for an interval and u = (a, b, c) for a number.
L-R fuzzy numbers are considered important in the theory of fuzzy sets and their particular cases
as triangular and trapezoidal fuzzy numbers, when the functions fL and fR are linear, are very
useful in applications. These straight line membership functions have the advantage of
simplicity.
The trapezoidal membership function has a flat top and really is just a truncated triangle curve. A
‘trapezoidal MF’ is specified by four parameters {a, b, c, d} as follows: (a ≤ b ≤ c ≤ d) [11].
Figure 3, illustrates a trapezoidal MF defined by trapezoid (x; 1, 3, 6, 9).
Trapezoid (x; a, b, c, d) =
{
0 𝑥 ≤ 𝑎(𝑥−𝑎)
(𝑏−𝑎) a ≤ x ≤ b
1 𝑏 ≤ 𝑥 ≤ 𝑐(𝑑−𝑥)
(𝑑−𝑐) c ≤ x ≤ d
0 𝑑 ≤ 𝑥
(5)
4.2. Triangular membership function
The simplest MF is the triangular membership function. A triangular MF is specified by three
parameters {a, b, c} as follows:

70 A. Amini and N. Nikraz/ Journal of Soft Computing in Civil Engineering 1-1 (2017) 65-85
Triangular (x; a, b, c) =
{
0 𝑥 ≤ 𝑎(𝑥−𝑎)
(𝑏−𝑎) a ≤ x ≤ b
(𝑐−𝑥)
(𝑐−𝑏) b ≤ x ≤ c
0 𝑐 ≤ 𝑥
(6)
The parameters {a, b, c} (with a < b< c) determine the x coordinates of the three corners of the
underlying triangular MF. Figure 4, illustrates a triangular MF defined by a triangle (x; 1, 3, 7)
on a 10 grade scale which can be based on 10 fuzzy linguistic values or 10 pre-defined
conditions such as effectiveness grade, importance degree, agreement level, etc.
A fuzzy uncertain quantity has a range of values between the lowest possible limit (below which
there are no possible values) and highest possible limit (beyond which there are no possible
values). The membership grades represent the degrees of belief in the truth levels of the values in
the range of the fuzzy number. The three corners of a TFN present the lowest possible value (a),
the most possible value (b), and the highest possible value (c). The values in the range between
the lowest and highest possible values have a membership grade between 0 and 1, with the most
possible value having a membership grade of 1. The lowest and highest possible values have
membership grades of 0 because they represent the lower and upper limits of the fuzzy range
outside which no values belong to the fuzzy number. The membership grade for a given value in
the range between the lowest possible value and the highest possible value is evaluated using
linear interpolation by finding the membership grade on the straight line corresponding to a
given value in the fuzzy range.
5. Membership value assignments
By summarizing subjective versus objective on one dimension and individual versus group on
the other hand, Biligic and Turksen [12] considered five categories of interpretations for
production of membership functions. They discussed these interpretations for the meaning of
µT(x) = 0.7, represented for the vague expression: “John (x) is tall (T)”, where µT(x) is the
membership degree of x defined on a fuzzy set tall (T), as:
1. Likelihood view: 70% of a given population consider John as a tall person.
2. Random set view: 70% of a given population described ‘tall’ as an interval containing
John’s height.
3. Similarity view (typicality view): to the degree 0.3 (a normalized distance), John’s height is
away from the prototypical object, which is truly “tall”.
4. Utility view: the utility of confidence that John is tall is 0.7.
5. Measurement view: when compared to others, John is taller than some and this privilege is
0.7.
After introducing eight methods: polling, direct rating (point estimation), reverse rating, interval
estimation (set valued statistics), membership function exemplification, clustering methods and
neural-fuzzy methods for constructing the membership function in their paper (See [13] for

A. Amini and N. Nikraz/ Journal of Soft Computing in Civil Engineering 1-1 (2017) 65-85 71
details and original references) they discussed measurement theory [14] as a framework which
can find the appropriate method for each type of interpretation. Where in direct rating [12] the
parameter or variable is being classified according to a fuzzy concept (like importance degree,
tallness, darkness,…) and the question is: “How F is a?”, in polling technique we find the
membership functions values proportional to positive answers to a presented subject. The
question in this method is: “Do you consider a as F?” where ‘a’ is the parameter and ‘F’ is a
fuzzy concept. In such kind of indirect way, we can define an interval scale and generate the
membership value based on the frequencies that each interval gets when the scale is being
questioned by a group of experts. In other words, each interval gets a weight equal to the number
of agreement [15].
In [16] Saaty proposed a pairwise comparison matrix for computing the membership values. The
entries of this matrix were relative preference defined on a rational scale. Introducing the
possibility theory against the probability theory by Zadeh [17] opened a new vision for many
authors to study the conversion problem of probability distribution to possibility distribution
when membership functions are considered numerically equivalent to possibility distribution.
Two famous transformation methods are: bijective transformation by Dubois and Prade [18] and
the conservation of the uncertainty method by Klir [19].
In [20] Civanlar and Trussell proposed a membership function generation method for statistically
based data. They believed that the membership function has a relationship to some physical
property of the set so they considered two properties for membership functions derived from
statistics: making some allowance for deviation from the value obtained by the measurement and
being naturally quantitative. The produced membership functions using their method are optimal
with respect to a set of reasonable criteria and also adjustable to possibility-probability
consistency principle.
Valliappan and Pham [21] discussed a membership function construction method using
subjective and objective information. The subjective part is experts’ opinions and judgments and
the objective part are statistical date and their known probability density function (pdf). In the
proposed framework assumptions of the “program-evaluation and review technique” (PERT) was
used to derive the normalized subjective measures through the beta distribution. Then, by using
the kernel of the fuzzification, the subjective part is transformed into a fuzzy set.
In [22] Chen and Otto suggested a method using measurement theory and constrained
interpolation for constructing the membership function in a way that they used a measurement
scale construction for a given finite set of determined membership values and determined the
remaining membership values using interpolation. Witold Pedrycz [23] has shown that the
routinely used triangular membership functions provide an immediate solution to the
optimization problems emerging in fuzzy modelling.
Whereas describing all the methods and efforts done in constructing the membership functions is
beyond the scope of this paper, most famous methods and techniques have been summarized in
Table 1. The major part of this table is based on studies done by Medasani et al. [24], Sancho-

72 A. Amini and N. Nikraz/ Journal of Soft Computing in Civil Engineering 1-1 (2017) 65-85
Royo and Verdegay [25] and Sivanandam and Sumathi [26] about different methods and
techniques for membership functions generation.
Many of these techniques are not applicable to many practical problems involved prevailing
uncertainty or in multi-attribute decision making problems where we need to have convex and
normal fuzzy numbers as input weights to form the decision making matrix. However, the
technique proposed in this paper is categorized as a subjective/direct rating method and use the
frequency histogram of a parameter which has been evaluated by a group of experts on a graded
scale; it tries to utilize the objective data in a way to emphasize the principle of uncertainty and
imprecise judgment and generate unique triangular fuzzy numbers. In a numerical example the
discussed method is compared to other subjective methods of polling and direct rating for a
better understanding of the differences.
Table 1. Different methods and techniques for membership functions construction Membership Function Generating Methods Applied Techniques
Subjective perception based methods
Interval estimation
Continues direct valuation
Direct rating
Reverse rating
Polling
Pairwise comparison(Relative preference)
Parameterized MF( Based on distance from ideal state or
deductive reasoning)
Heuristic methods
Piecewise linear functions( linearly increasing, linearly
decreasing or a combination of these)
Piecewise monotonic functions(S-functions, Sin(x), ᴨ-
Functions, exponential functions,…)
Histogram based methods Modeling multidimensional histogram using a combination
of parameterized functions
Transformation of probability distributions to
possibility distributions
Bijective transformation method
Conservation of uncertainty method
Fuzzy nearest neighbor method K-nearest neighbors(K-NN)
Neural network based methods Feed forward multilayer neural networks
Clustering based methods
Fuzzy C-Means(FCM)
Robust agglomerative Gaussian mixture
decomposition(RAGMD)
Self-Organizing feature map(SOFM)
Genetic Algorithm Fitness function evaluation
Inductive Reasoning Entropy minimization(Clustering the parameters
corresponding to the output classes)
6. The proposed method for constructing a non-isosceles triangular fuzzy
number
In recent decades using fuzzy theory in management and engineering has increased significantly. Fuzzy
science is able to construct models which can process qualitative information intelligently almost
like a human.
The first step of every fuzzy analysis is fuzzification. Fuzzification [26] is the process of
converting a real scalar value into a fuzzy value. This is achieved with the different types of

A. Amini and N. Nikraz/ Journal of Soft Computing in Civil Engineering 1-1 (2017) 65-85 73
fuzzifiers or membership functions. In a multi-criteria decision making problem, decision matrix
entries and weight vectors are fuzzy rather crisp numbers. In Fuzzy ranking problems the items
or options introduced in the form of fuzzy numbers are being prioritized using different fuzzy
ranking methods. In fuzzy management, knowledge and skills needed to manage the systems can
be obtained from experts in natural language and create models and computer programs easily by
using fuzzy inference engines. In this case, natural language often uses the attributes and
constraints, such as ‘very’, ‘little’, ‘some’ and ‘approximately’ that can be shown by
membership functions and give as input to computer programs [27]. As mentioned before,
triangular fuzzy numbers are very useful in all kinds of problems using fuzzy theory because of
simplicity and ease.
Now we need to answer this question that “What’s new with our proposed method?” Ordinary
methods which use statistical data to generate triangular fuzzy numbers usually use the normal
distribution of data for this purpose. The normal distribution is a continuous probability
distribution that shows the probability that any real observation will fall between any two real
limits or real numbers (Fig. 5.a). The ordinary method of converting a normal distribution
function to a TFN results in an isosceles triangular fuzzy number. (Fig. 5.b.)
This paper suggests a simple method for constructing non-isosceles triangular fuzzy number
(TFN) of an item, parameter, value or concept which has been surveyed statistically via
questionnaire, interview or other investigating methods based on utility view for constructing the
membership degree using a pre-defined scale for converting the linguistic judgments or cluster
distances to quantitative values. In other word the proposed method converts the data of a
frequency chart to corresponding TFN. The origin or main idea for generating fuzzy membership
function by this method is the deviation of the responses from average value when a fuzzy
concept is judged or rated. Applying this method in a practical case study will be discussed later
for the verification.
The triangular fuzzy number could not be in a form of a simple isosceles triangle with two equal
sides when the data statistical distribution around the mean point is not homogenous. Thus, for
constructing the TFN that can represent the judgment deviations, we try to determine the left and
right boundaries about the average value of data by proposing the following steps:
Computing the average or mean value of frequency chart data using equation (7) that is
presented by point ‘M’ and standard deviation of data ‘σ’using equation (8).
0
1
0
Mem
ber
ship
deg
ree
M
Fig. 5.b. An isosceles TFN with an interval of 2
standard deviations
M+2σ M-2σ
-5
Pro
bab
ilit
y d
ensi
ty
Fig. 5.a. Normal distribution function with
mean value of M and standard deviation of σ
M M+σ
95% within
2 standard
deviations
M-σ M-2σ M+2σ
74 A. Amini and N. Nikraz/ Journal of Soft Computing in Civil Engineering 1-1 (2017) 65-85
𝑀 =1
𝑛∑ (𝑥𝑖
𝑛
𝑖=1) (7)
𝜎 = √1
𝑛
2∑ (𝑥𝑖
𝑛
𝑖=1−𝑀)2 (8)
Forming the histogram of the frequency chart in the form of a continuous graph which
introduced by f(x), where the X-axis indicates the scale degrees and Y-axis indicates the
frequency data.
Introducing and computing the following parameters with regard to f(x) for a ‘0 to k’ graded X-
axis:
𝐿𝑀 = ∫ 𝑓(𝑥)𝑑𝑥𝑀
0 (9)
𝑅𝑀 = ∫ 𝑓(𝑥)𝑑𝑥𝑘
𝑀 (10)
𝑆 =𝐿𝑀
𝑅𝑀 (11)
𝜎𝑅 (𝑀) =𝜎
(1+𝑆) (12)
𝜎𝐿 (𝑀) =𝜎.𝑠
(1+𝑠) (13)
Finding the lower limit (LL) and the upper limit (UL): So that the lower limit is obtained by
subtracting the σL(M) from the mean value and the upper limit is obtained by adding the σR(M) to
the mean value. In the presentation of a TFN in equation (6), (LL) and (UL) are point ‘a’ and
point ‘c’ respectively.
(𝐿𝐿) = 𝑀 − 𝜎𝐿(𝑀) (14)
(𝑈𝐿) = 𝑀 + 𝜎 𝑅(𝑀) (15)
Scaling the data in the form of fuzzy number membership function with a membership degree of
1 for the mean point and the membership degree of zero for the lower limit (LL) and upper limit
(UL).
𝑡𝑟𝑖𝑎𝑛𝑔𝑢𝑙𝑎𝑟 (𝑥; 𝐿𝐿,𝑀, 𝑈𝐿) =
{
0 𝑥 ≤ 𝐿𝐿(𝑥−𝐿𝐿)
(𝑀−𝐿𝐿) 𝐿𝐿 ≤ 𝑥 ≤ 𝑀
(𝑈𝐿−𝑥)
(𝑈𝐿−𝑀) 𝑀 ≤ 𝑥 ≤ 𝑈𝐿
0 𝑈𝐿 ≤ 𝑥
(16)
Referred to the equation (9) and (10), ‘LM’ is the area under the frequency graph for the left side
of the mean point and ‘RM’ is the area under this diagram on the right side of the mean point.
σL(M) and σR(M) are left and right boundaries of the fuzzy number. These values are obtained by
distributing the standard deviation value (σ) of data regarding the ratio ‘S’ using the direct

A. Amini and N. Nikraz/ Journal of Soft Computing in Civil Engineering 1-1 (2017) 65-85 75
proportion. In this way the side with bigger area due to more scattered responses, leads to a
bigger boundary around the average value, which represents less certainty and more vagueness.
6.1 Numerical example 1:
Through a numerical example, we try to show the described method steps clearer. Table 2 shows
the frequency chart of a rated parameter evaluated by 80 experts in a 10 grade scale that can be
the importance degree or weight or degree of impact of a parameter so the question is: “How
important is parameter i (Pi) ?” Values from 0 to 10 can define 10 different fuzzy states or
linguistic expressions. Where the score (0) indicates the unimportance of being, (1) too little
importance, (2) the relatively low importance, (3) low importance, (4) the low average, (5) the
average, (6) the upper average, (7) the relatively high, (8) high importance, (9) very high
importance and (10) is the special importance [28].
In the conversion of statistical data into fuzzy numbers, Continuous fuzzy numbers are used.
Thus, the distances between these 10 points become meaningful.
Table 2. Frequency chart for the importance degree of a surveyed parameter
Rating scale 0 1 2 3 4 5 6 7 8 9 10 Total
Frequency of Responses 2 4 5 10 24 16 5 8 3 1 2 80
If the rating scale represents the importance degree of the parameter, data of table 2 shows that 5
experts realized that this parameter has the importance degree 2 (the relatively low importance)
whereas 2 out of 80 inquired experts considered a 10 importance degree (special importance) for
this parameter. The corresponding diagram for the parameter is obtained from the frequency
chart. The graph represents the frequency of values for the sample parameter has been illustrated
in figure 6. The sum of total frequencies is equal to the number of the inquired experts, which are
80 people.
The result of the proposed algorithm for obtaining the membership function for the sample
parameter has been shown in table 3. The related membership function has been illustrated in
figure 7.
2
4 5
10
24
16
5 8
3 1 2
0
5
10
15
20
25
30
0 1 2 3 4 5 6 7 8 9 10
Fre
qu
ency
X (Parameter importance degree)
Fig. 6. Continuous diagram of frequency for parameter importance degree based on a ten grade scale.
Mean Index (point M)
M=4.4
9
f(x
)
76 A. Amini and N. Nikraz/ Journal of Soft Computing in Civil Engineering 1-1 (2017) 65-85
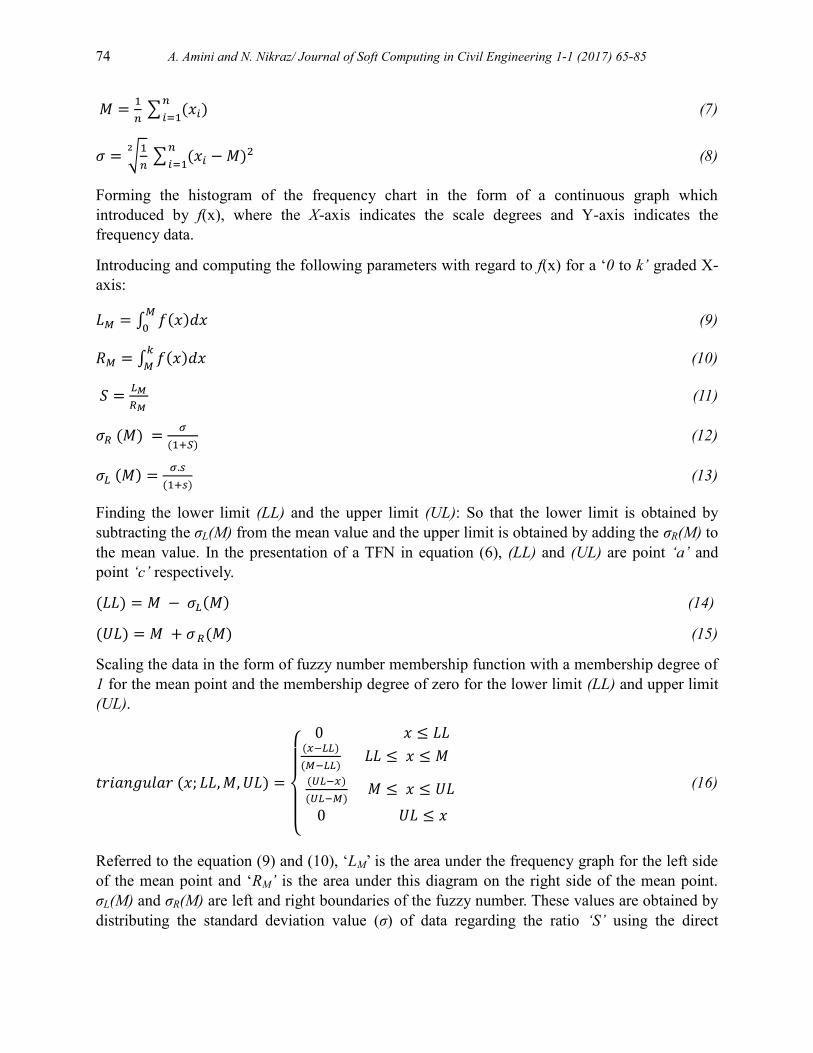
Table 3. The results of the proposed algorithm for calculating the lower and upper limits of the sample
parameter
Parameter Mean
(M)
Standard deviation
(σ)
S=(La/Ra) σR(M) σL(M) Lower
limit (LL)
Upper
limit (UL)
Value 4.49 2.04 1.38 0.86 1.188 3.30 5.35
This method reflects the uncertainty of qualitative judgments because it is exclusive for each set
of evaluation. For example, two sets of data with the same average value won’t have the same
TFN because of different standard deviations and also different distribution of frequency
histogram around the mean point. In this method a smaller standard deviation indicated a more
certain set of assessment or judgment that results in narrower boundaries of the fuzzy number
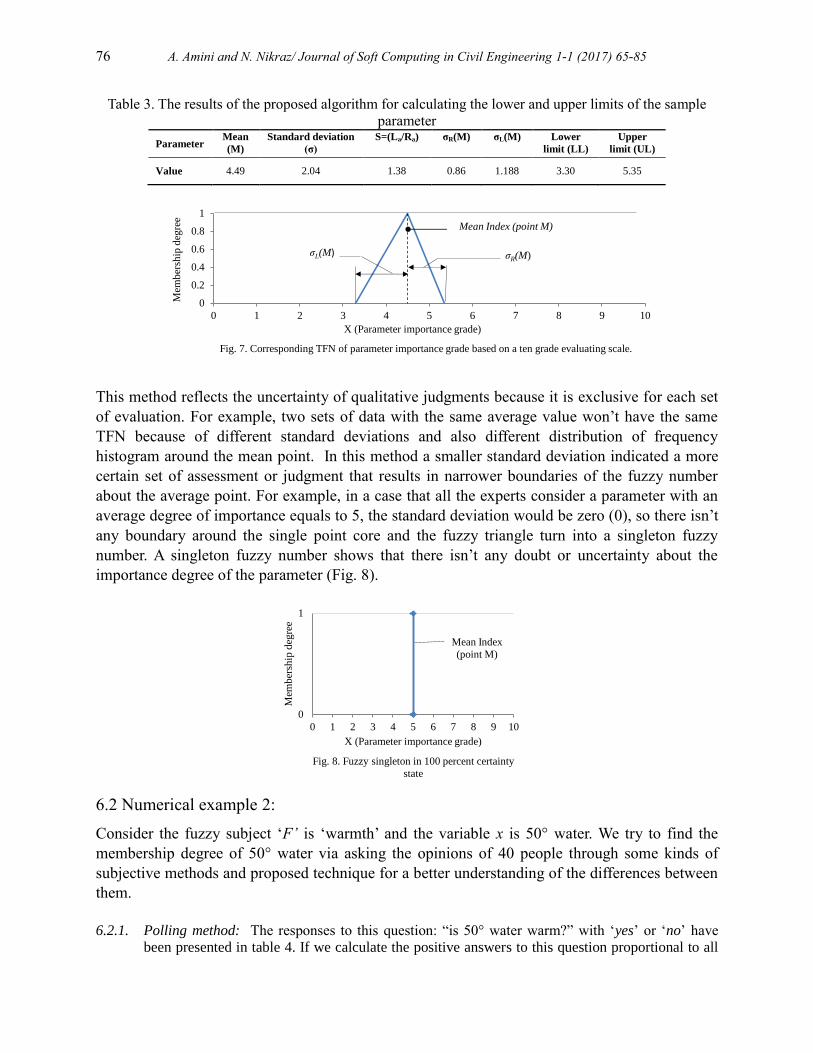
about the average point. For example, in a case that all the experts consider a parameter with an
average degree of importance equals to 5, the standard deviation would be zero (0), so there isn’t
any boundary around the single point core and the fuzzy triangle turn into a singleton fuzzy
number. A singleton fuzzy number shows that there isn’t any doubt or uncertainty about the
importance degree of the parameter (Fig. 8).
6.2 Numerical example 2:
Consider the fuzzy subject ‘F’ is ‘warmth’ and the variable x is 50° water. We try to find the
membership degree of 50° water via asking the opinions of 40 people through some kinds of
subjective methods and proposed technique for a better understanding of the differences between
them.
6.2.1. Polling method: The responses to this question: “is 50° water warm?” with ‘yes’ or ‘no’ have
been presented in table 4. If we calculate the positive answers to this question proportional to all
0
0.2
0.4
0.6
0.8
1
0 1 2 3 4 5 6 7 8 9 10
Mem
ber
ship
deg
ree
X (Parameter importance grade)
Fig. 7. Corresponding TFN of parameter importance grade based on a ten grade evaluating scale.
Mean Index (point M)
σR(M) σL(M)
0
1
0 1 2 3 4 5 6 7 8 9 10
Mem
ber
ship
deg
ree
X (Parameter importance grade)
Fig. 8. Fuzzy singleton in 100 percent certainty
state
Mean Index
(point M)

A. Amini and N. Nikraz/ Journal of Soft Computing in Civil Engineering 1-1 (2017) 65-85 77
responses, the membership degree for “warmth” of 50° would be 0.875. Repeating this question
for a range of temperatures may lead to a membership function for warmth illustrated in figure 9.
Table 4. Polling frequency chart for warmth of 50° water
“Is 50° water
warm?” Yes No
Membership
degree of ‘Yes’
Frequency 35 5 (35/40) = 0.875
Total 40
6.2.2. Direct rating: we can assign a number from 1 to 10 to “How 50° water is warm?” and rate the degree of
warmth of 50° water. We reach to a fuzzy function for “How 50° water is warm” by assigning the
membership degree of 1 for the maximum frequency and finding the other grades proportional to the
largest frequency these results are summarized in table 5.
Table 5. Frequency chart for a sample surveyed parameter “How is 50° water warm?”
Rating scale 0 1 2 3 4 5 6 7 8 9 10
Frequency 0 0 0 0 0 0 0 0 5 15 20
Membership
degree 0 0 0 0 0 0 0 0 0.25 0.75 1
So how should we use direct rating for forming the diagram of a fuzzy concept (warmth in this
example) for a range of variables (different temperature degrees) when many experts are being
asked to express their opinion? Turksen and Norwich in [29] described a method for constructing
0
0.2
0.4
0.6
0.8
1
0 10 20 30 40 50 60 70 80 90 100
µ
Temperature (°c)
Fig. 9. MF of warmth for different temperature degrees
using polling method.
0
0.2
0.4
0.6
0.8
1
0 1 2 3 4 5 6 7 8 9 10
µ
Rating scale
Fig. 10.b. MF of "how 50° water is warm".
0
5
10
15
20
0 1 2 3 4 5 6 7 8 9 10
Fre
qu
ency
Rating scale
Fig. 10.a. Frequency histogram of direct rating
of 50° water' warmth.

78 A. Amini and N. Nikraz/ Journal of Soft Computing in Civil Engineering 1-1 (2017) 65-85
the diagram for a linguistic variable (pleasing and tallness) using direct rating. They defined
three diagrams, one based on the mean value of rating and two others by adding and deducting
the double value of standard deviation to mean point value in a way that all the membership
grades are greater than 0 and smaller than the maximum scale rate. Consider the table 6; the
information of this table shows the rating of ‘warmth’ fuzzy concept for water by 40 people
using a ten grade scale for temperature degrees between 0° to 100°. If we form the diagrams
using the mentioned method we reach to diagrams of figure 11.a, due to direct rating of this
range of temperature degrees and figure 11.b for corresponding fuzzy sets diagrams.
Table 6. Frequency chart of warmth rating scale for a set of temperature degrees
Rating scale 0° 20° 40° 50° 60° 80° 100°
0 40 1 0 0 0 0 35
1 0 2 0 0 0 0 5
2 0 20 0 0 0 5 0
3 0 10 0 0 0 10 0
4 0 5 0 0 0 20 0
5 0 2 2 0 0 5 0
6 0 0 11 0 0 0 0
7 0 0 16 0 4 0 0
8 0 0 10 5 10 0 0
9 0 0 1 15 16 0 0
10 0 0 0 20 10 0 0
Mean 0 2.55 6.93 9.38 8.80 3.63 0.13
Std. Dev. 0 1.04 0.92 0.70 0.94 0.87 0.33
Mean-2Stdv. 0 0.48 5.09 7.98 6.92 1.89 0
Mean+2Stdv. 0 4.62 8.76 10.78 10.68 5.36 0.79
0
2
4
6
8
10
12
0 20 40 60 80 100
Rat
ing
Temperature
Fig. 11.a. Warm water rating diagrams using
direct rating method.
Mean
Mean - 2 Stdev.
Mean + 2Stdev.
0.0
0.2
0.4
0.6
0.8
1.0
0 20 40 60 80 100
µ
Temperature
Fig. 11.b. Fuzzy sets of warm water using direct
reting method.
Mean
Mean - 2 Stdev.
Mean + 2Stdev.

A. Amini and N. Nikraz/ Journal of Soft Computing in Civil Engineering 1-1 (2017) 65-85 79
6.2.3. The proposed method approach: By using the frequency chart data of table 6, we can summarize the
proposed method parameters as shown in table 7.
Table 7. Proposed method parameters for a set of temperature degrees using the frequency chart of “warm
water rating scale” Method
Parameters 0° 20° 40° 50° 60° 80° 100°
Mean of rating 0 2.55 6.93 9.38 8.80 3.63 0.13
Std. Dev. 0 1.04 0.92 0.70 0.94 0.87 0.33
AL 0 20.49 18.81 15.98 16.92 15.70 4.14
AR 0 16.51 19.47 11.52 16.08 19.30 15.86
S=(AL/AR) 0 1.24 0.97 1.39 1.05 0.81 0.26
ϬL 0 0.57 0.45 0.41 0.48 0.39 0.07
ϬR 0 0.46 0.47 0.30 0.46 0.48 0.27
LL (µ=0) 0 1.98 6.47 8.97 8.32 3.24 0.06
Mean (µ=1) 0 2.55 6.93 9.38 8.80 3.63 0.13
UL (µ=0) 0 3.01 7.39 9.67 9.26 4.10 0.39
We calculate the sub areas segregated on the frequency histogram by indicating the mean point
of assessment on the rating scale axis (Fig. 12.a) and after determining the upper and lower limits
we can form the triangular fuzzy number of each temperature degree that represents: “how that
temperature degree is warm” (Fig. 12.b).
When a utility view of a fuzzy concept for different types of variables is considered, using this
method is very appropriate, especially when we want to determine the fuzzy multi-attribute
decision making matrix (FMADM) weights; where each decision making factor is different and
has its own weight and impact factor. For example, imagine we want to form the decision
making matrix for evaluating several projects to different risk factors (cost, political and
technical) where each risk factor impact or importance degree is needed to enter to the decision
making matrix as a triangular fuzzy number which represents how that factor is important.
Figure 13.a illustrates the diagrams of the calculated boundaries (mean, LL and UL) presented in
table 7, for ‘warmth’ fuzzy concept for a range of temperature degrees from 0° to 100° and figure
13.b is the scaled corresponding diagrams to [0,1]. In this case, we can determine the
membership degree of each temperature degree in three states of most possible values (mean),
highest possible values (Upper Limits) and lowest possible values (Lower Limits).
0
5
10
15
20
0 1 2 3 4 5 6 7 8 9 10
Fre
qu
ency
Rating Scale
Fig. 12.a. Frequency histogram of 50° warmth
rating scale.
0
0.2
0.4
0.6
0.8
1
8 8.5 9 9.5 10
µ
Rating scale (8 to 10)
Fig. 12.b. TFN of "how 50°water is warm" using
the proposed method.
M=9.3
8
AL AR
M=9.38
LL=8.97 UL=9.67

80 A. Amini and N. Nikraz/ Journal of Soft Computing in Civil Engineering 1-1 (2017) 65-85
From the perspective of fuzzy logic, the space between the diagrams is the space arisen from
vagueness and uncertainty. In the 100 percent certainty state we only have one value for each
variable, which is equal to the average value of ratings. In this case, the standard deviation of
data will be zero (0) and these three diagrams coincide.
The fuzzy sets illustrated in figure 13.b may not be fuzzy numbers because as we mentioned in
later sections the fuzzy set must be convex and normal to be considered a fuzzy number as well.
However, using the linear regression and finding the trend line is not part of the introduced
method in this paper, it can be used as a solution for forming the triangular fuzzy number out of
three sets of data (lower limit, mean and upper limit) produced by this method.
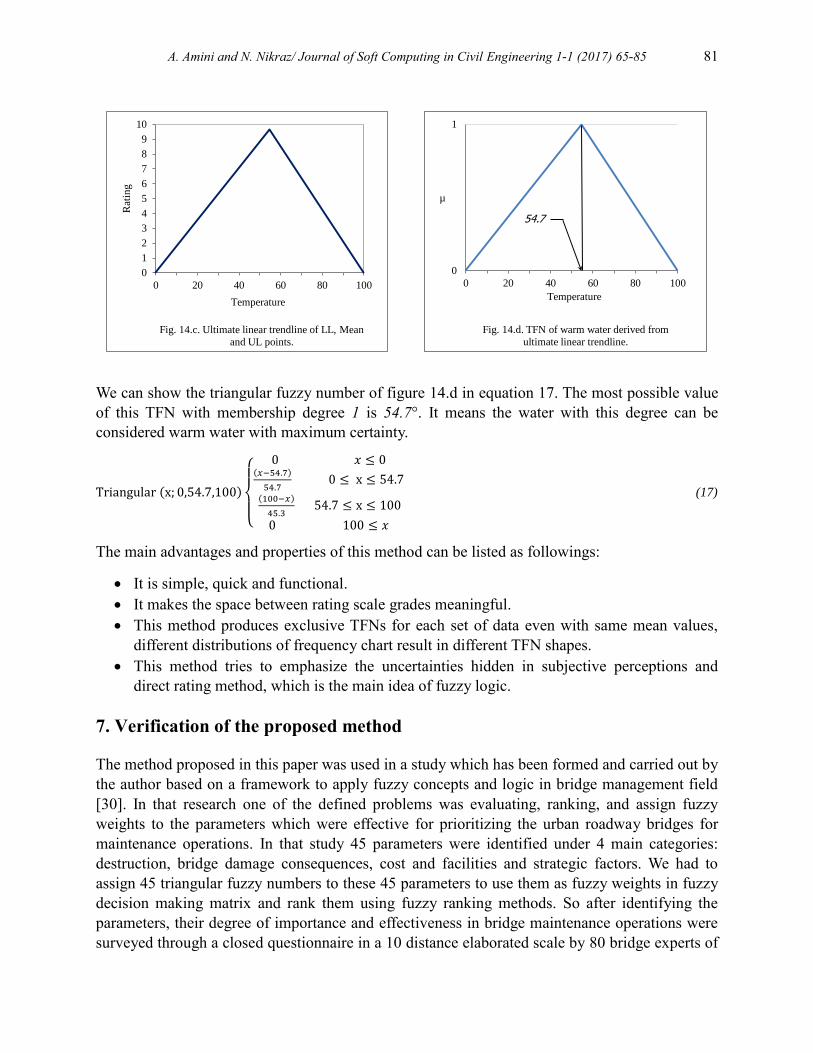
Figure 14.a shows the triangular forms due to linear regression of each three diagrams (LL,
Mean, and UL). The equations of ultimate linear regression for all set of data have been shown in
figure 14.b these equations result in the ultimate triangular shape of figure 14.c by scaling this
shape to [0,1] we reach to a normal TFN.(Fig.14.d.)
0
1
2
3
4
5
6
7
8
9
10
0 20 40 60 80 100
Rat
ing
Temperature
Fig. 13.a Warm water rating diagrams using the
proposed method.
Lower Limit (LL)MeanUpper Limit (UL)
0
0.2
0.4
0.6
0.8
1
0 20 40 60 80 100
µ
Temperature
Fig. 13.b Fuzzy sets of warm water using proposed
method.
LLMeanUL
0
1
2
3
4
5
6
7
8
9
10
0 20 40 60 80 100
Rat
ing
Temperature
Fig. 14.a. Linear trendlines of warm water rating
diagrams.
LL Trendline
Mean Trendline
UL Trendline
y = 0.1765x
y = -0.215x + 21.5
0
1
2
3
4
5
6
7
8
9
10
0 20 40 60 80 100
Rat
ing
Temperature
Fig. 14.b. Ultimate linear regression equations of
LL, Mean and UL points.
A. Amini and N. Nikraz/ Journal of Soft Computing in Civil Engineering 1-1 (2017) 65-85 81
We can show the triangular fuzzy number of figure 14.d in equation 17. The most possible value
of this TFN with membership degree 1 is 54.7°. It means the water with this degree can be
considered warm water with maximum certainty.
Triangular (x; 0,54.7,100)
{
0 𝑥 ≤ 0(𝑥−54.7)
54.7 0 ≤ x ≤ 54.7
(100−𝑥)
45.3 54.7 ≤ x ≤ 100
0 100 ≤ 𝑥
(17)
The main advantages and properties of this method can be listed as followings:
It is simple, quick and functional.
It makes the space between rating scale grades meaningful.
This method produces exclusive TFNs for each set of data even with same mean values,
different distributions of frequency chart result in different TFN shapes.
This method tries to emphasize the uncertainties hidden in subjective perceptions and
direct rating method, which is the main idea of fuzzy logic.
7. Verification of the proposed method
The method proposed in this paper was used in a study which has been formed and carried out by
the author based on a framework to apply fuzzy concepts and logic in bridge management field
[30]. In that research one of the defined problems was evaluating, ranking, and assign fuzzy
weights to the parameters which were effective for prioritizing the urban roadway bridges for
maintenance operations. In that study 45 parameters were identified under 4 main categories:
destruction, bridge damage consequences, cost and facilities and strategic factors. We had to
assign 45 triangular fuzzy numbers to these 45 parameters to use them as fuzzy weights in fuzzy
decision making matrix and rank them using fuzzy ranking methods. So after identifying the
parameters, their degree of importance and effectiveness in bridge maintenance operations were
surveyed through a closed questionnaire in a 10 distance elaborated scale by 80 bridge experts of
0
1
2
3
4
5
6
7
8
9
10
0 20 40 60 80 100
Rat
ing
Temperature
Fig. 14.c. Ultimate linear trendline of LL, Mean
and UL points.
0
1
0 20 40 60 80 100
µ
Temperature
Fig. 14.d. TFN of warm water derived from
ultimate linear trendline.
54.7
°

82 A. Amini and N. Nikraz/ Journal of Soft Computing in Civil Engineering 1-1 (2017) 65-85
four main groups of contractor, consultant, researcher and employer. Numbers from 0 to 10 were
assigned to 11 linguistic variables that defined the importance degree of parameters in a range
from unimportant to special important degree.
The verification was performed from two aspects. First, in ranking the parameters and second, in
selecting the most important parameters for further process.
7.1. Ranking the parameters
After collecting the completed questionnaires, their data were analyzed by using classic
statistical methods and parameters were ranked by using the Friedman test [31] then the result
was compared with the produced TFNs’ fuzzy ranking output. In this study, the Mabuchi [32]
algorithm was used for ranking the fuzzy numbers. This method proposes a ranking method by
using multiple level of α-cut which will have the weights role. Figure 15 shows two diagrams
represent this comparison. The blue diagram illustrates the ranking result using Mabuchi method
for TFNs constructed by using the proposed method and the red diagram indicates the ranking
based on the classic method of the Friedman test. In figure 15, P1 to P45 are parameters’ row
numbers in the questionnaire.
7.2. Selection the most effective parameters
In a non-fuzzy study [33], selecting the most important parameters which affect the bridge
priority for maintenance operations was based on this fact that the number of parameters
shouldn’t be limited as much as to raise the prioritizing error. Also they should not be such
extended that encounter analysis process with complexity. So after performing the ranking using
the Friedman test rank value, on the corresponding diagram that shows the rank value of priority
numbers (Fig. 16), 24 parameters before the point that a big fracture appears in the diagram,
were selected as most important parameters.
P1 P2 P3 P4 P5 P6 P7 P8 P9 P10 P11 P12 P13 P14 P15 P16 P17 P18 P19 P20 P21 P22 P23 P24 P25 P26 P27 P28 P29 P30 P31 P32 P33 P34 P35 P36 P37 P38 P39 P40 P41 P42 P43 P44 P45
Fuzzy 12 45 37 39 43 32 7 11 9 33 42 4 21 29 38 36 15 22 1 10 41 28 34 35 14 6 44 2 5 19 18 17 20 16 3 13 26 27 23 31 25 40 30 24 8
Friedman 11 45 37 41 44 34 12 10 8 32 42 4 22 29 40 35 14 18 1 9 38 28 36 33 15 6 43 2 5 21 16 17 19 20 3 13 27 26 23 31 25 39 30 24 7
0
5
10
15
20
25
30
35
40
45
Ran
k
Fig. 15. Parameters ranking diagrams based on fuzzy approach and Friedman test method.

A. Amini and N. Nikraz/ Journal of Soft Computing in Civil Engineering 1-1 (2017) 65-85 83
In the fuzzy approach, for selecting the most effective parameters, those that their minimum
fuzzy desirability of 50% with α = 0.5 is below the average index of the importance degree are
excluded [28]. To avoid the complexity of the drawing, a schematic diagram of the determination
of the 50% fuzzy desirability has been illustrated for 4 parameters in figure 17. In this diagram
the minimum fuzzy desirability of 50 % for P2, P27 and P24 is below the average importance
degree (5), so they would be excluded. Thirty two parameters out of 45 parameters (4 more
parameters than the non-fuzzy approach) were selected in this way for further process. This
case shows the fuzzy uncertainties involvement in determining the parameters prioritization.
Wider range and stronger uncertainties involved in the fuzzy ranking process for selecting the
most effective parameters are such cases that cannot be seen in classic statistical methods such as
Friedman test.
8. Conclusion
Using the fuzzy logic is a solution to overcome the limitations of decision making in an uncertain
environment or analysis, judgment and evaluating values or concepts where there is a lack of
transparency or imperfect information. In other words, fuzzy logic covers a wider area of
judgments includes the vagueness. In this paper, a simple algorithm for constructing the
triangular membership function was presented based on a direct rating method using the
frequency chart data of a rated variable on a numerical graded scale. These grades can be a
conversion of oral judgment or qualitative assessment of a fuzzy parameter or concept. In the
proposed method we used statistical values of average and standard deviation to form the
0
5
10
15
20
25
30
35
40
1 2 3 4 5 6 7 8 910
11
12
13
14
15
16
17
18
19
20
21
22
23
24
25
26
27
28
29
30
31
32
33
34
35
36
37
38
39
40
41
42
43
44
45
Fri
edm
an t
est
ran
k v
alu
e
Ranking Number
Fig. 16. Selection of the most effective parameters ranked by Friedman test.
0
0.5
1
0 1 2 3 4 5 6 7 8 9 10
µ
X (parameter importance grade)
Fig. 17. Using minimum fuzzy desirability of 50% for selecting the most important
parameters(TFNs have been produced using the proposed method)
Selected
Items
Excluded
Items
P
2
P27
Average importance
index
P24 P20
α
=

84 A. Amini and N. Nikraz/ Journal of Soft Computing in Civil Engineering 1-1 (2017) 65-85
boundaries of TFN, in a way that represents the uncertainty of parameter assessment, which is
evident in distribution of frequency chart. In the described algorithm only a symmetrical
distribution of frequency diagram about the average index leads to an isosceles triangle fuzzy
number and when there is a 100 percent certainty about the parameter assessment we can see a
singleton fuzzy number without any boundaries. Using this method in cases that the evaluated
parameters are the importance degree or weight factors of a multi-criteria decision making
matrix can reflect the assessment uncertainties in a reasonable way.
In the last section of this article we verified the proposed method with non-fuzzy classic methods
in a practical case study by comparing the fuzzy ranking of triangular fuzzy numbers of 45
parameters, constructed using the proposed method, with the Friedman test rank values. This
verification justifies the partial differences in output results due to considering the uncertainties
of qualitative assessments.
References
[1] Timothy, J. R., Parkinson, W.J., Fuzzy Logic and Probability Applications, 2002, Chapter 2, pp. 29-
43.
[2] Zadeh, L.A., The concept of a linguistic variable and its application to approximate reasoning,
Information Sciences 8 (1975), pp. 43–80.
[3] Zadeh, L.A., Fuzzy logic and approximate reasoning, Synthese, 30 (1975), pp. 407–428.
[4] Zadeh, L.A., A new direction in AI: toward a computational theory of perceptions, AI Magazine, 22
(1) (2001), pp. 73–84.
[5] Zadeh, L.A., Fuzzy sets Information and Control, 8 (1965), pp. 338–353.
[6] Castillo, O., Melin, P., Type-2 Fuzzy Logic Theory and Applications, Springer-Verlag, Berlin
Heidelberg (2008), Chapter 2, p. 6.
[7] Dubois, D., Prade, H., Possibility Theory: An Approach to Computerized Processing of Uncertainty,
Plenum Press, New York, 1988.
[8] Barnabas, B., Mathematics of Fuzzy Sets and Fuzzy Logic, Springer-Verlag, Berlin Heidelberg
(2013), Chapter 4, pp. 51-64.
[9] Dubois, D., Prade, H., Fuzzy Sets and Systems: Theory and Applications, Academic Press, New
York, 1980.
[10] Stefanin, L., Sorini, L., Fuzzy arithmetic with parametric LR fuzzy numbers, IFSA-EUSFLAT, 2009,
pp. 600-605.
[11] Castillo, O., Melin, P., Modelling, Simulation and Control of Non-linear Dynamical System, Taylor
and Francis, 2002, Chapter 2, pp. 13-14.
[12] Bilgiç, T., Turksen, IB., Elicitation of Membership Functions: How far can theory take us?,
Proceedings of the Sixth IEEE International Conference on Fuzzy Systems, Vol. 3 (1997), pp. 1321-
1325.
[13] Bilgiç, T., Turksen, IB., Measurement of membership functions: Theoretical and experimental work.
To appear in the D. Dubois and H. Prade (eds) International Handbook of Fuzzy Systems, Vol. 1:
Foundations, forthcoming.
[14] Krantz, D.H, Luce, R.D., Suppes, P., Tversky, A., Foundations of Measurement, Vol. 1. Academic
Press, San Diego, 1971.
[15] Wierman, M.J., An introduction to the mathematics of uncertainty, Creighton University, 2010, pp.
149-150.
[16] Saaty, T.L., The Analytic Hierarchy Process, McGraw Hill, New York, 1980.

A. Amini and N. Nikraz/ Journal of Soft Computing in Civil Engineering 1-1 (2017) 65-85 85
[17] Zadeh, L.A., Fuzzy sets as a basis for a theory of possibility, Fuzzy Sets and Systems, Vol.1 (1978),
pp. 3-28.
[18] Dubois, D., Prade, H., Unfair coins and necessity measures: towards a possibilistic interpretation of
histograms, Fuzzy Sets and Systems, Vol. 10 (1983), pp. 15-20.
[19] Klir G., A principle of uncertainty and information invariance, International Journal of General
Systems, Vol. 17 (1990), pp. 249-275.
[20] Civanlar, M.R., Trussell, H.J., Constructing membership functions using statistical data, Fuzzy Sets
and Systems, Vol. 18 (1986), pp. 1-13.
[21] Valliappan, S., Pham, T.D., Constructing the membership function of a fuzzy set with objective and
subjective information, Microcomputers in Civil Engineering, Vol.8 (1993), pp. 75-82.
[22] Chen, J.E., Otto, K.N., Constructing membership functions using interpolation and measurement
theory, Fuzzy Sets and Systems, Vol. 73 (1995), pp. 313-327.
[23] Pedrycz, W., Why triangular membership functions?, Fuzzy Sets and Systems, Vol. 64 (1994), pp.
21-30.
[24] Medasani, S., Kim, J., Krishnapuram, R., An overview of membership function generation
techniques for pattern recognition, International Journal of Approximate Reasoning, Vol. 19 (1998),
pp. 391-417.
[25] Sancho-Royo, A., Verdegay, J.L., Methods for the construction of membership functions,
International Journal of Intelligent Systems, Vol. 14 (1999), pp. 1213-1230.
[26] Sivanandam, S.N., Sumathi, S., Deepa, S.N., Introduction to Fuzzy Logic using MATLAB, Springer-
Verlag, Berlin Heidelberg, 2007, pp. 76-94.
[27] Azar, A., Faraji, H., Fuzzy Management Science, Management and Productivity Study Center of Iran
(affiliated with the Tarbiat Modares University), 2008.
[28] Asgharpour, M.J, Multi Criteria Decision Makings, Tehran University publications, 2009, Chapter 4,
pp. 332-346.
[29] Norwich, A.M., Turksen, IB., A model for the measurement of membership and the consequences of
its empirical implementation, Fuzzy Sets and Systems, Vol.12 (1984), pp. 1-25.
[30] Amini, A, Evaluating the effective parameters in prioritizing urban roadway bridges for maintenance
operation using fuzzy logic, M.Sc. Thesis, Science and research branch of Tehran Azad University,
2010.
[31] Friedman, M., The use of ranks to avoid the assumption of normality implicit in the analysis of
variance, Journal of the American Statistical Association (American Statistical Association), Vol. 32
(1937), pp. 675–701.
[32] Mabuchi, S., An approach to the comparison of fuzzy subsets with a α-cut dependent index, IEEE
Trans. Systems Man. Cybernet. SMC-18, 1988, pp. 264-272.
[33] Fathizadeh, A., Evaluating the effective parameters in urban roadway bridges prioritization, M.Sc.
Thesis, Science and research branch of Tehran Azad University, 2010.


![[PPT]4.7 Objective: Use Isosceles and Equilateral · Web view4.7 Objective: Use Isosceles and Equilateral Triangles Isosceles Triangle Legs Vertex Angle Base Base Angles Base Angles](https://img.pdfslide.us/doc/110x75/5ab09a077f8b9ac66c8b7351/ppt47-objective-use-isosceles-and-equilateral-view47-objective-use-isosceles.jpg)


![[PPT]Isosceles, Equilateral, and Right Triangles · Web viewIsosceles, Equilateral, and Right Triangles Chapter 4.6 Isosceles Triangle Theorem Isosceles The 2 Base s are Base angles](https://img.pdfslide.us/doc/110x75/5ab09a077f8b9ac66c8b7356/pptisosceles-equilateral-and-right-triangles-viewisosceles-equilateral-and.jpg)