Embed Size (px)
Citation preview

A Method for Atomic Spectroscopy
of Highly Charged Ions in the Pm Isoelectronic Sequence
Diploma work by Oivind Andersson
Lund Reports on Atomic Physics, LRAP-181 Lrmd, August 1995

Contents
1. Abstract................................................................................................................ 1
2. Introduction ........................................................................................................ 2 2.1. Alkali-like Spectra in the Promethium Sequence ...................... 2 2.2. Practical Aspects.................................................................................. 2 2.3. What the Theorists Have Predicted ............................................... 4
3. Method ................................................................................................................. 7 3.1. An Outline of the Experiment ......................................................... 7 3.2. ECR Ion-Sources .................................................................................. 7 3.3. The Target Chamber .......................................................................... 9 3.4. The Spectrometer ............................................................................... 11 3.5. Vacuum and Gas Flow ...................................................................... 13 3.6. Discrimination of Unwanted Spectra ............................................ 14 3.7. Alignment of the Experimental Setup .......................................... 15
4. Results .................................................................................................................. 16
5. Analysis............................................................................................................... 18 5.1. Estimating the Ionic Composition of the Beam .......................... 18 5.2. Discussion of the Results .................................................................. 21 5.3. Possible Improvements of the Method......................................... 21
6. Acknowledgements .......................................................................................... 23
7. References ........................................................................................................... 24
Appendix A: Theory of Electron Capture- A Brief Survey ......................... 25
Appendix B: IDL Program-Code for Simulation of Atomic Collisions ..... 35
Appendix C: Hartree-Fock Calculations ........................................................... 36
Appendix D: Popular Scientific Summary ....................................................... 39 D.l. A Brief Summary of Physics ............................................................. 39 D.2. The Secret Life of Atoms ................................................................... 40 D.3. Electron Capture- The Martini Model.. ........................................ 41 D.4. What Happened? ................................................................................ 43
Appendix E: Pascal Program for Estimating Beam Depletion ..................... 44

1. Abstract
The aim was to search for alkali-like spectra in the Promethium isoelectronic sequence. Alkali-like spectra have theoretically been predicted to occur for the heavier elements (Z = 74- 92) of the sequence. Pb22+ ions were produced by means of an ECR-ion source and accelerated towards a target of He gas. Colliding with He atoms the Pb22+ ions are likely to capture an electron, thus forming an excited Pm-like ion (Pb21+). This method allows the creation of a light source of relatively pure charge state composition (~q"" 1). A 2m grazing-incidence spectrometer was used for recording the spectra arising as the accelerated ions impinge on the target. No lines were recorded throughout the wavelength region where the spectrometer is sensitive. Further experiments are needed to make clear if this is due to experimental errors or not.
0. Andersson: A Method for Atomic Spectroscopy of HiRhly CharRed Ions ... 1

2. Introduction
2.1. Alkali-Like Spectra in the Promethium Sequence
In a paper published in 1980, L.J. Curtis and D.G. Ellis predicted the occurence of alkali-like spectra in the promethium isoelectronic sequence. The paper reports theoretical wavelengths and transition probabilities for the 5s 25-Sp 2p transitions for a number of elements in the Pro-sequence. These resonance transitions, analogous to the sodium D doublet, were predicted to be easily excited and produce bright lines in the ultraviolet region [1].
In many-electron atomic systems, an electron experiences interaction both with the nucleus and with the other electrons. For low ionic charges, the outer electrons are mainly influenced by electron-electron interaction, whereas with increasing ionic charge the interaction with the nucleus gets more important. In the limit of infinite nuclear and ionic charge the structure must resemble the hydrogenic case. This will in certain cases give rise to a re-ordering of electronic states along the isoelectronic sequence and thus result in a change in the appearance of the spectra [2]. Promethium has 61 electrons and is a rare earth element with its typical complicated spectrum. Its ground state configuration is 4f5 5s2 5p6 6s2, i.e. it is quite unlike an alkali [1]. In the hydrogenic limit of high ionic charge, however, 60 electrons can be in closed shells, the outermost electrons being in the full 4fl4 -shell. The last electron would then result in the ground state being 5s 25, the first excited levels being those of the 5p 2p term. This would be equivalent to a (heavy) alkali system, and the spectrum might resemble that of the alkali atoms, with strong resonance lines and little else [2].
2.2. Practical Aspects
In the light of this discussion, it may seem rather easy to confirm the predictions about the spectra in the Pro-sequence experimentally. It is, however, a formidable challenge since very line-rich spectra are associated with ions with so many electrons. There have not been many efforts yet, but the ones made have all failed.
At Lund university an attempt was made in 1984 to obtain spectra of most of the elements from Ir (Z = 77) to Bi (Z = 83) in the region 250-500 A. By focusing high power laser-pulses on targets of the various elements a plasma was obtained. The emitted spectra showed a few faint lines within a continuum. Some of these lines were identified as belonging to the Tm and Er isoelectronic sequences. No further analysis was deemed possible [2]. It has been suggested that since this was one of the first experiments with the high power laser in the laboratory, the negative result could be due to that the charge state distribution was not yet properly understood [3]. A new attempt is planned to be made during the spring 1995.
In a beam-foil experiment at Brookhaven, the energy of a beam of Au ions was
0. Andersson: A Method for Atomic Spectroscopy of Hi~hly Char~ed Ions ... 2

varied from 31 MeV to 238 MeV in order to find the best conditions for the production of the Pm-like spectrum. The spectra were recorded at various ion beam energies and showed an enormous amount of lines, but not a single identifiable feature was resolved [2].
Since most of the overwhelmingly many spectral lines must arise from coreexcited, short lived states, a later experiment at Bochum tried to get rid of these short lived decays by making use of the time resolution of the beam-foil light source. If the ion beam is not observed at the foil, but at a distance corresponding to 200 ps or more after excitation, the most rapid decays may have died out. In that case the more long lived states, and the states fed by cascades (less likely for core excited-states) will be present, though at a lower intensity than originally. This method resulted in diffently looking spectra; a number of lines could be resolved and confirmed in several downstream spectra. In comparison with the results of calculations predicting the positions of the Pm-like resonance lines (see below), identifications were suggested. The available calculations, however, gave results with a large scatter, and none of them could be considered to be satisfactorily close to the candidate lines in the measured spectra [2].
An important experimental problem seems to consist in sorting out the charge state of interest to the experiment. Both the laser-produced plasma and the beamfoil plasma produce a distribution of charge states resulting in a conglomeration of linesl . There is, however, theoretically a way of cleaning up the spectrum to obtain only the Pm-like part. This can be done e.g. by letting highly charged ions with 60 electrons collide with atomic hydrogen. Due to the high charge of the projectile ion, there is a high probability of the hydrogenic electron being captured by the ion during the collision and thus creating a Pm-like ion. If the electron is captured into an excited state it will decay to the ground state emitting radiation, hopefully an alkali-like spectrum. In a way this method can be said to resemble the beam-foil technique, but with the important difference that the wealth of charge states in the light source is avoided. This is due to that the ion, unless it collides with two hydrogen atoms, can not capture more than one electron. The electron capture technique will of course not be useful in life time measurements, since the gas target used will be too diffuse to give any time resolution.
In our situation it is more practical to use a helium target than an atomic hydrogen one, since atomic hydrogen does not exist naturally. When using a helium target an impinging ion can of course capture two electrons during the collision, and create a Sm-like ion. There are, however, ways of getting around this problem (see chapter 3.6).
The electron capture in itself can be described within the so called classical overbarrier model (see appendix A) which is based upon a number of simple classical assumptions. A classical model may not seem accurate to describe such a complicated process as a collision between two atoms, but as it turns out it actually reproduces experimental results. It yields e.g. cross sections and principal
1 The beam-foil charge state distribution is rather narrow compared to the one in the laser produced plasma, so in principle it should be possible to do the charge state discrimination needed with the beam-foil technique.
0. Andersson: A Method for Atomic Spectroscopy of HiKhly CharKed Ions ... 3

quantum numbers of the populated states in a quite satisfactory way. It also gives a concrete, if not totally realistic, picture of the collision process. In fact the overbarrier model can be said to represent the aim of all physics in being a very simple way to treat a very complicated problem. A more sophisticated treatment may give a slightly more exact description, but as the interest here is less of a theoretical nature than an experimental, appendix A focuses on the over-barrier model. The model works best in the low collision-energy regime (see appendix A) and also works better as the projectile charge increase. The ions we use as projectiles are indeed highly charged, but on the other hand our systems are Pmlike, i.e. they have a core of 60 electrons. As is mentioned in appendix A the classical over-barrier model treats ions like point charges, and a 60 electron core can in no way be said to resemble a point charge. This means that we should be careful in using it for describing our system. We can, however, be hopeful that the electrons will be captured into high-n states, as the model predicts, since this is generally what happens [4]. In the experiment we thus have a 60 electron ion in its ground state, capturing an electron typically into a Rydberg state. During the decay there is a probability to obtain core-excited states, i.e. in this case states with more than one excited electron, and these might take another path to the ground state than via the sought after resonance transitions. Consequently we may not find the lines, even if we do get a spectrum. Suppose, however, that we do find the resonance transitions. Can we then be sure that they are found where the theorists predict? The answear is no. As the used theories do not take into account mixing of states, the transistion probabilities and wavelengths might be quite wrong.
2.3. What the Theorists Have Predicted
Alkali-like spectra are characterized by very strong 25- 2P resonance transitions. They arise when the ground state of an atom or ion consists of a single electron outside of a core composed of closed shells or subshells. The high-Z part of the promethium sequence of ions corresponds to all orbitals with n::;; 4 being filled, leaving a single electron to move among then;::: 5 orbitals [1].
The calculations presented by L.J. Curtis and D.G. Ellis [1] were performed by means of a numerical, single configuration, non relativistic Hartree-Fock method (see appendix C). The atoms considered are very complex, and this method ignores many processes which could be important. It is, however, presumed to give a reasonably reliable estimate of the wavelengths; a prediction to be tested by experimentalists. The leading relativistic corrections were also calculated, using the Pauli approximation (the expectation values of the Darwin and relativistic mass correction terms [5]). To estimate the reliability, the same calculations were performed for the 4s-4p transitions in the Cu sequence, where comparison with experimental results is possible [1].
As was mentioned before, the ground configuration for neutral promethium is quite unlike an alkali, being 4f5 5s2 5p6 6s2. As the nuclear charge increases, the energy of the 4f orbital is gradually reduced. When W XIV is reached the Hartree-Fock calculations predict the ground state to be 4fl-4 5s. Figure 1 shows an isoelectronic plot of the relative Hartree-Fock energies of the lowest
0. Andersson: A Method for Atomic Spectroscopy of Hi~hly Char~ed Ions ... 4

configurations in the Pm sequence for ions with a core charge of 14- 32. According to this, the lowest levels of U XXXII will be alkalilike since the first excited states are in the 4fl4 Sp and 4fl4 Sd configurations and are well separated in energy. At the other end of the figure W XIV seems less clear since the 4fl4 Sp is well above the 4fl3 5s2 and comparable with the 4fl3 Ss Sp. There could nevertheless be reasons to believe that the 5s-5p doublet in W XIV can still be considered alkalilike to a reasonable approximation: First, neither the 4fl3 5s2 nor the 4fl3 Ss Sp contains a 2p term; thus they can not interact with the 4fl4 Sp and they also can not be excited from the 4fl4 Ss. Second, the Hartree-Fock orbitals are well separated spatially [1].
·e ~
..... ~ .....
3000
2000
1000
0.02 u Pb Au lr
~ ·1
w 0.08 0.10
Figure 1: Configuration energies in the Pm-sequence. t; is the core charge (Z-60) And E is the average energy of the configuration above the ground-state configuration.
The Hartree-Fock energies and wave functions for the Ss 25 and Sp 2p levels in the Pm sequence ions W XIV through U XXXII are taken as a reasonable first approximation. For these high-Z systems, however, relativistic corrections are very important. These were made by means of perturbation calculation and a semi-empirical method. To estimate the reliability, the correspondig calculations were made for the Cu sequence for the same range of atomic numbers. The hereby achieved results indicated agreement to within 1- 4%, in comparison with other results for the Cu sequence. Since the effective screening is larger in this range in the Pm sequence, the uncertainties were expected to be greater there [1].
Later, fully relativistic calculations were performed for energy levels and excitation energies for several ions in the Pm sequence. The objective was to either verify the previous calculations or make other predictions. These calculations were made by means of the Dirac-Pock approxiamtion and indeed verified the overall predictions on level ordering of Curtis and Ellis, which only included some relativistic effects pertubatively. However, some differences were found [5].
0. Andersson: A Method for Atomic Spectroscopy of Hixhly Charxed Ions ... 5

Table 1 gives the predicted 5s-5p wavelengths 'A, line strengths S and mean lives
't for selected ions in the Pm sequence, obtained by Curtis and Ellis. The wavelengths within parentheses are the ones obtained with the full relativistic treatment (given by the authors to two decimal places!) [5]:
z Spectrum Line 'AlA (Are I/ A) 't/ps S/a.u. 74 W XIV 1/2-1/2 379 (376.49) 80 1.16
1/2-3/2 277 (284.26) 31 77 Ir XVII 1/2-1/2 325 (323.58) 63 0.96
1/2-3/2 226 (233.27) 20 79 Au XIX 1/2-1/2 297 (295.92) 56 0.86
1/2-3/2 199 (206.63) 16 82 PbXXII 1/2-1/2 263 (261.55) 47 0.73
1/2-3/2 166 (174.05) 11 92 UXXXII 1/2-1/2 186 (185.34) 31 0.47
1/2-3/2 96 (104.75) 4
Table 1: The dipole transition matrix elements were computed directly from the Hartree-Fock Ss and Sp wave functions for a frozen core. No corrections for relativity or core-polarization were made in the line-strength calculations. The leading relativistic corrections to the energy levels were made as discussed above, and have been included in wavelengths and mean lives.
Now, what interest can these alkalilike resonance transitions have, if they are found? Considering that electron capture is one of the most important processes that can occur in collisions between atoms and highly charged ions at these low energies, this process will by far dominate all other types of inelastic collisions in plasmas. In magnetically confined fusion plasmas the radiation from excited states of impurity ions resulting from electron capture and electron-impact excitation may constitute a major part of the total energy losses. State-selective electron capture (i.e. the capture of electrons into specified atomic/ionic states) can be used as a powerful tool for spectroscopic diagnostics of high temperature plasmas [3]. Curtis and Ellis suggest that the spectra of the upper part of the Pm sequence could be of interest in plasma diagnostics [1]. The experiment in itself also has interesting aspects. As a curiosity it can be mentioned that electron capture could be a means of creating population inversion and thus achieving a lasing effect.
0. Andersson: A Method for Atomic Spectroscopy of Hi~hly Char~ed Ions ... 6

3. Method
3.1. An Outline of the Experiment
As we have now done a brief survey through some theoretical aspects of our experiment (in chapter 2 and appendix A, B and C) we can turn to problems of a more practical nature. The objective is to let Nd-like ions capture an electron during a collision with He, to create Pm-like ions. Hence the Nd-like ions (60 electrons) are accelerated from an ion source towards a gas target of He and by the time they reach the target we assume that all excited states will have decayed to the ground state. The capture may then result in a singly excited Pm-like system and we have a reaction of the type
(3.1) He(no, lo, mo) + Bq + ~ He+ + B(q-1 )+*(n, 1, m)
where Bq +is Nd-like and B(q-1 )+*is Pm-like (n, 1 and m denotes the electron state in each of the systems). As is mentioned in appendix A the electron will typically be captured into a high-n state.
3.2. ECR Ion-Sources
There are several ways of generating ions. In any sufficiently hot plasma the production of multiply charged ions takes place to a certain extent. The output of multiply charged ions from a conventional plasma ion source can be maximized by running it at the highest acceptable discharge power and the lowest neutral gas feeding rate for still stable operation. These ion sources can deliver fairly high ion charge states (typically up to q = 10 for medium- and high-Z elements). To achieve even higher charge states, special measures must be taken to increase the temperature of the plasma. One possibility is the use of spark discharges, another the irradiation of suitable targets by intense laser beams. In both cases considerably high charge states have been observed, but in general the total amount of ions produced from these quite small plasmas is very limited [6].
A very successful way to produce comparably much larger currents of multiply charged ions consists in heating a magnetically confined plasma by microwave irradiation with frequencies around the electron cyclotron resonance. Within an ECR-ion source the hot plasma is confined magnetically. In a first section a dense, cold plasma is produced by microwave discharge. This plasma diffuses into a second stage where ECR-heating takes place. Ions leak out of the field and can be extracted [6]. Acceleration of the ions can be acheived by putting the whole ion source on a high potenial and thus 'kicking' the extracted ions away. ECR-ion sources are able to produce beams of almost any multiply charged ion, and is the type of source that will be used for our experiment.
Some of the advantages with ECR-ion sources are that they give high ionization states at useful intensities and that they can be run constantly for several weeks without interruption. They can also produce beams from solid materials [7].
0. Andersson: A Method for Atomic Spectroscopy of Hi~hly Char~ed Ions ... 7

It is well known how to design an ECR-ion source, but since the plasma parameters are difficult to measure it is not known exactly how it functions. It is generally accepted that the ionization takes place step-by-step by electron impact. Since the cross section for this is small, it takes a large flux of high-energy electrons to produce highly stripped ions. Very high power is necessary in e.g. an electron-beam ion source. This can be avoided in an ECR ion source by detaining the plasma in such a way that the electrons can pass through it several times. The plasma is confined by means of a minimum-B configuration, i.e. the field is weakest in the center and increases radially. The mechanism for confinement is, however, not yet properly understood [7].
The cross section for ECR heating is a function of the electron temperature. It is, however, desirable to have a low ion temperature as the temperature increases the emittance and energy spread in the extracted beam. A varying B-field with frequency equal to the electron cyclotron frequency is a very efficient means of transferring energy to the electron population. The exact mechanism is complicated, but in a minimum-B configuration the electron cyclotron resonance condition is fulfilled for a closed surface around the central axis, the 'ECR-surface'. The plasma can be said to be a high pass filter since waves with frequency greater than the plasma frequency are transmitted, while those with lower frequency are reflected [7]. The plasma frequency is proportional to the square root of the electron density according to
(3.2) (SI units).
It is not possible in an ECR ion source to interrupt the confinement and extract ions. The ions can be extracted only if they are lost axially from the confinement region in direction towards the extractor. The confinement time is critical for the ECR ion source. If it is too short high ionization states will not be reached and if it is too long ions will be lost through charge exchange in the plasma. The process is thus sensitive and the ion source must be adjusted to achieve the right result [7].
Ackording to Paschen's law it is not possible to break down a neutral gas to a plasma if the gas pressure is too low. Therefore the ECR ion source is built in two stages (see figure 3.1). Step one operates at higher pressure and generates a 'cold' plasma, which flows along the magnetic field lines to step two due to a pressure gradient. It is in principle possible to use any method to generate ions in step one, but ECR-heating is the method that is always used. To achieve a high pressure gradient, step one operates close to the critical electron density (defined by the heating frequency as the electron density at which this is equal to the plasma frequency). The heating frequency is chosen greater in step one than in step two, as to make the critical electron density greater there. Step one is also placed close to step two. From step two about 5% of the ions go to the beamline whereas 95% are lost non-axially and are neutralized bouncing into the walls. Of this fraction about 20% is pumped out and 80% goes back into the plasma. The ions can thus go through several such cycles before they reach the beam [7].
0. Andersson: A Method for Atomic Spectroscopy of Hi~hly Char~ed Ions ... 8

Hexa- I Octupole Magnets
t Gas Inlet
Coils Pump
Figure 3.1: The gas is first let into step one where a cold plasma is generated by means of microwave radiation at the electron cyclotron frequency. Due to a pressure gradient between the two steps, ions diffuse into the main step where the plasma is magnetically confined and undergoes further ionization. Finally multiply charged ions diffuse into the beamline where they are accelerated.
3.3. The Target Chamber
When the ions leak out of the source they are "kicked" away down the beamline due to the source being put on a high electrostatic potential, typically 10 kV. Their velocity becomes about 1 mm/ns and the lifetimes of most atomic levels are typically on the order of 1 ns. Unless they are metastable they will thus definitely have decayed to the ground state by the time they reach the target chamber, which is placed several meters from the source. The target chamber is built up along three major axes; a target axis (vertical), a beam axis and a detection axis (see figure 3.2 on page 10). The helium gas is let into the evacuated chamber through a thin needle on the top and is pumped out through the bottom by means of a diffusion pump. This will hopefully give rise to a helium plume flowing vertically along the target axis without extending into the beamline or into the spectromemer to which the chamber is also attached. The extent of successfulness in this depends on the pressure gradient in various directions from the needle. It is important to have as low pressure as possible in the bottom of the chamber, i.e. to have a high pumping speed.
The beam enters through one side of the chamber and penetrates the helium plume horizontally just below the needle before it hits a Faraday cup on the other side of the chamber. The collisions will of course occur in the volume in which the beam and the target overlap. The Faraday cup is simply a small cup of copper which is put on a low potential as to collect the ions in the beam and measure the current. In this kind of experiments the light intensity is often measured as a function of the wavelength in a series of narrow intervals,
0. Andersson: A Method for Atomic Spectroscopy of Hi!{hly Char!{ed Ions ... 9

Figure 3.2: A- Valves, B- Pumps, C- Pirani gauge, D- Penning gauge, E - Faraday cup, F - Spectrometer.
0. Andersson: A Method for Atomic Spectroscopy of Hi~hly Char~ed Ions ... 10

"channels", which then are put together to form the spectrum. Since the beam current may not be completely steady the number of collisions per unit time may vary, resulting in fluctuations in the light intensity. It is therefore not necessarily convenient to spend equal times measuring in each channel. The important thing is that the same number of ions pass through the target for every channel. Thus, the Faraday cup is used to collect and measure the charge that has penetrated the target. The information is used to determine for how long data should be recorded in each channel.
Whenever the beam hits a solid object, secondary low-energetic electrons are created. In front of the Faraday cup there is a copper ring with negative potential. The ring is partly there to prevent secondary electrons created outside the Faraday cup from entering the cup, and partly to prevent secondary electrons created in the Faraday cup from leaving it.
The detection axis cuts the chamber horizontally at right angles to the beam axis. The things that are detected are the emitted light and the pressure in the chamber. Since the pressure probably is more dependent on the distance from the target than on the direction to it, the name 'detection axis' may not be quite accurate. The pressure gauges and the spectrometer are, however, attached to the chamber parallelly to an imaginary axis, as is shown in figure 3.2 (previous page), though it may not be of practical importance. Two pressure-measuring gauges are used; a Pirani gauge for the intervall torr to 10-3 torr, and a cold-cathode ionization vacuumeter (Penning gauge) for the lower pressure region. The Pirani gauge in principle consists of a hot wire with which the gas molecules collide and lead the heat off. The resistance in the wire of course varies with its temperature and therefore with the surrounding gas pressure. Thus an estimate of the pressure can be achieved by measuring the resistance, and this is the principle for a Pirani gauge. The Penning gauge consists of a cylindrical anode with a centrally positioned cathode, both mounted close to a permanent magnet. A voltage of around 2000 V attracts electrons in the gas to the cylindrical anode and the magnet makes them follow long, spirally shaped orbits. This increases the probability for colliding with the gas molecules and ionizing them. The ions in turn give rise to a discharge. An estimate of the pressure is acheived by measuring the ion current [8].
On the side opposite to the pressure measuring device the entrance slits of the spectrometer are placed. The spectrometer used is a high resolution 2-m grazing incidence Schwob-Fraenkel spectrometer. This kind of instrument was originally constructed for fusion plasma spectroscopy and was first installed on the TFR (Tokamak Fontenay-aux-Roses, France) [9].
3.4. The Spectrometer
Traditionally, plasma spectroscopy has been developed in the visible and VUV ranges, and spectra recorded on photographic plates or by means of photomultipliers. The photographic method of detection has no time resolution and photomultipliers need several reproducible discharges in order to measure accurately spectral profiles and brightnesses. However, a new type of detector has
0. Andersson: A Method for Atomic Spectroscopy of Hi!{hly Char!{ed Ions ... 11

come into use in tokamak spectroscopy and is used in the Schwob-Fraenkel instrument. It is a so called 'microchannel plate image intensifier coupled to a CCD array and allows the recording of large spectral ranges with simultaneous time resolution [9]. The Schwob-Fraenkel instrument is thus sensitive in the spectral region which is interesting to us and due to its technical facilities it is convenient for our experiment. Moreover, it is relatively compact and therefore in a sence 'easy' to transport.
A critical problem, especially in the use of grazing incidence spectrometers, is the high background level in the short wavelength region. The signal-to-noise ratio becomes very poor below about 30 A in most grazing incidence instruments. The Schwob-Fraenkel spectrometer has a relatively large Rowland circle diameter (2 m) and a very small grazing incidence angle (1 o- 1.5 °). This together with an auxiliary slit to eliminate UV stray light provide a high signal-to-background ratio [9].
The main body of the instrument consists of a one-piece aluminium block with an accurately machined arc-shaped surface (with a precision better than 10 ~m), which materializes the Rowland circle. The manufacturer has developed a method to preadjust grating holders by means of a Michelson-type interferometer. The method is fast, more accurate and more convenient than the usual trial-and-error adjustment using successive exposures in vacuum. In the instrument an accurate mounting accepting preadjusted grating holders then enables grating interchange without any further optical adjustment, which simplifies the procedure considerably [9].
~
~ ~
Microchannel Plate Phosphor Screen ~ Optical Fibres V/-
Figure 3.3: As UV photons hit the microchannel plate (jar left in figure) they create photoelectrons which are multiplied in the microchanels and focused onto a phosphor screen by means of an electric field. There they are converted to visible photons which are lead to a 1024 x 1024 pixel CCD array by means of a fiber optic conduit.
0. Andersson: A Method for Atomic Spectroscopy of Hi~hly Char~ed Ions ... 12

The grating is fixed in the spectrometer and the entrance slit and microchannel detectors are mounted on carriages which are movable along the Rowland circle. The head of the microchannel plate detector is composed of a flat rectangular 50-mm-long glass plate with narrow channels through it. This is coupled to a phosphor screen image intensifier. The incident UV photons produce photoelectrons at the MCP face which are then multiplied inside the microchannels. This is due to the electrons being accelerated by a high voltage (1 kV) over the plate, and knocking out new electrons as they bounce into the walls (see figure 3.3). The electrons are then accelerated and focused onto the phosphor screen which converts the electron signal to visible photons. Focusing is achieved by applying a voltage of +3 to +5 kV across the 1-mm gap between the microchannel plate output face and the phosphor layer. This voltage also enables an efficient conversion in the phosphor. Moreover, the microchannel plate input face is funneled to enlarge the open area from 55% to 70% of the total MCP input surface. This increases its efficiency [9]. The photons are lead from the
phosphor plate via optic fibers to a 1024x1024 pixel CCD array where they are converted to electric charge. A computer records the pulses and displays the spectrum on a screen.
3.5. Vacuum and Gas Flow
It is vitally important that the pressure in the spectrometer is not too high, since this can cause discharges in the microchannel detector which would ruin it. Ideally the pressure should lie below 10-6 torr. On the other hand it is desirable to have a high pressure in the target, since this increases the target luminosity. It is also important to restrict the flow of gas from the target to the beamline. When the beamline pressure is increased, the fraction of projectile ions that undergoes charge exchange before the target also is increased. The easiest way to restrict the gas flow between two regions, i.e. the conductance, is to use an as thin pipe to connect them as possible. For a 'long pipe' (i.e. when the length, L, is greater than 1.5 times the diameter, D) the conductance, C, behaves like
C=KD3 (3.3) L
where K is a constant with a value of about 10 1/s [8]. By chasing a pipe with half the diameter, the conductance is thus limited to 1/8 of the original value.
Another way to limit the conductance is by inserting an aperture in the connecting pipe. The conductance of a hole is proportional to its area, or to D2. Moreover, the total conductance of a serial coupling of conductances is
(3.4)
where Care the conductances of each component in the coupling; the holes as well as the pipes connecting them [8]. This scheme demands, however, that additional pumping is done between the conductance-limiting holes. Otherwise
0. Andersson: A Method for Atomic Spectroscopy of Hi[?hly Char{?ed Ions ... 13

the gas trapped between them will raise the pressure.
An good method to restrict the conductance between the target and the spectrometer is to install a microchannel plate between them, with its channels parallell to the path of the light. In this way the photons are free to pass through the channels, whereas the helium atoms are hindered by the conductance limiting effect of the microchannels. Equation 3.3 yields a conductance on the order of 10-11 1/s for a 5 mm long microchannel of diameter 1 !liD. The total conductance of many parallell channels is just the sum of the individual conductances. This means that even if we have a million channels in the plate, the conductance is still only 10-5 1/ s, i.e. practically nothing. A problem is, however, that these microchannel plates are quite costly.
An increase of the target pressure will gradually destroy the vacuum in the beamline. As the spectrometer slits work quite well as conductance limiters themselves, the beamline vacuum is actually what sets the limits. If any further steps are needed, it should be to limit the gas flow into the beamline.
3.6. Discrimination of Unwanted Spectra
As was mentioned in chapter 2, double capture can occur in collisions of highly charged ions with helium. Moreover, apart from capturing two electrons during the collision, the ion can also go through two (or more) single capture events in passing the target. The electrons are as we know typically captured into high-n states and unless the ion disposes of the second electron, e.g. by autoionization, the result is another spectrum. How do we discriminate against these unwanted spectra?
The probability for an incoming ion to collide with a target atom is proportional to the number of target atoms, i.e. to the pressure. The probability to collide twice is just the probability for colliding once times the probability to collide a second time. As the second collision is not different from the first one in a statistical sence it is equally probable. Thus the probability for two single-capture events is proportional to the square of the pressure. This means that we can discriminate against serial single-capture events by recording the spectrum at different pressures, disregarding lines with an intensity that do not scale linearly with pressure.
The ratio of single- to double-capture is, however, not dependent upon pressure. Double-capture events can most easily be discriminated against by shifting the beam charge. As is described in chapter 2 we use Nd-like ions (60 electrons) as projectiles to create a Pm-like ion (61 electrons). If the projectiles are Pm-like in stead, a single capture will result in a 62-electron system, i.e. the result of a double-capture to aNd-like ion. The lines that occur in both these spectra thus belong to the Sm-like spectrum (62 electrons) and should be disregarded.
0. Andersson: A Method for Atomic Spectroscopy of Hi~hly Char~ed Ions ... 14

3.7. Alignment of the Experimental Setup
The target chamber was attached to the beamline with a flexible pair of bellows and aligned by means of a theodolite, placed in front of the chamber. Three points on three different walls in the laboratory marked out the horizontal plane in which the beam lay. When the theodolite was adjusted so that its cross-wires coincided with these three points, its line of sight was in the plane of the beam. A fourth point above the beamline marked out the direction of the beam. The intersection of an imaginary vertical line from this point with the horizontal plane then marked out the symmetry axis of the beamline. The bellows were fixed in the position in which the beam would penetrate the target just below the injection needle and then hit the Faraday cup. A conductance limiter was also installed upstream in the chamber to prevent the target gas from taking this way into the beamline. This was simply a cupper plate with an aperture for the beam to pass through (see chapter 3.5).
The grazing-incidence spectrometer was then similarly attached to the chamber with a flexible pair of bellows at right angles to the beam axis. The back piece was removed and a laser was shot from the back of the spectrometer and reflected at the grating through the entrance slits, into the target chamber. By holding a piece of paper at the target injection needle the laser beam marked out the region at which the spectrometer was looking. From this information the spectrometer could be aligned. A 600 lines/mm-grating was inserted in the spectrometer, the whole setup was sealed and pumped down to vacuum.
0. Andersson: A Method for Atomic Spectroscopy of Hi:;(hly Char:;(ed Ions ... 15

4. Results
In what follows all beam currents refer to the value measured at the Faraday cup, without gas load in the target chamber. The pressures refer to the value measured at the chamber wall, about 25 ern from the target injector needle.
To calibrate the spectrometer a beam of 06+ was used, since the spectra of 0 VI and 0 V contain a number of lines in the wavelength region around 170A. However, an 06+-bearn of 7.6J..tA did not produce any signal. After a series of tests conducted with different gratings, at various target pressures and exposure times, it was speculated that something might be wrong with the target. Since the gas injector was made of a hypodermic needle with an inclined orifice, it was argued that the gas might be injected at an angle and thus miss the beam. The needle was taken out and its orifice ground to a straight angle. Still, after this manoeuvre no signal was detected.
Two possible explanations for the poor result were suggested. First the pressure gradient between the target chamber and the beam-pipe might be too small. If too much target gas flows into the beam pipe, the charge exchange might take place upstream to a large extent. In this way the ion charge of interest will not reach the target. The conductance-limiter (see chapter 3.7) was thus improved by mounting on it a tube of diameter 10 rnrn and length 70 rnrn, for the beam to pass through. Secondly, it was found that the target injector-needle was electrically insulated. As it had no connection to ground it might be charged by the beam, thus forcing the ions to avoid the target by electrical repulsion. A new target injector had already been made from a larger hypodermic needle, in case the old one would be damaged by the tooling. This one also had a straight orifice. The old needle was thus replaced, and the new one was connected to ground with a wire attached to the chamber.
After a new series of tests the 629A line in 0 V was observed. In stead of helium, air was used as target gas, since the only aim at this point was to produce a signal (the cross-section for capture to an ion is greater from air than from helium). After a ten-minute exposure a number of lines appeared when using the 06+bearn. Two lines of 0 VI, at 150A and 173A, were very distinct, although the 151A-line of 0 V was weaker. Some other lines could barely be discerned from the background. The chamber pressure was increased by a factor of two and a five-minute exposure was made. The line intensities were half their original value, due to the exposure time being half as long, indicating that increasing the pressure did not increase the number of events in the target region. The pressure was then decreased to half the initial value, resulting in a significant decrease in intensity for a five-minute exposure. It was thus decided that the original pressure, 2 · 10-5 Torr, would be convenient when switching to a Pb22+-bearn, as any increase of the target pressure also gives an undesired increase of the upstream pressure.
The beam was switched to a 0.4 J.LA-bearn of Pb22+ and a ten-minute exposure was made. The gas load resulted in 5% attenuation of the beam current due to charge exchange processes. No signal was detected. The exposure time was extended to
0. Andersson: A Method for Atomic Spectroscopy of Hi~hly Char~ed Ions ... 16

one hour with the same negative result. The background pressure in the target chamber was increased to 4 · 10-5 Torr (10% attenuation) in order to increase the number of interacting particles in the target region. Later, the background pressure was decreased to 5 · 10-6 Torr (1% beam attenuation) in order to lower the rate of charge-exchange taking place upstream, and a two-hour exposure was made. All of these attempts failed to produce a signal. A series of two-hour exposures were then made at this low pressure, scanning a larger wavelength interval between 18A and 290A. If there were photons, their resultant signal did not exceed the background noise from the detector.
At this stage the target gas was changed from air to helium. It was speculated that even if helium has a lower capture cross-section than molecular oxygen or nitrogen, it has a simpler structure which limits the number of processes that can occur. Two two-hour exposures were made with the same Pb22+-beam as above. First, in the region where the alkli-like resonance lines are predicted to occur. Then a search for inner-shell processes was made in the shorter wavelength region (18-42A). No signal was detected.
If a majority of the Pb22+ ions captured an electron far upstream, it could be remedied by increasing the original charge of the ions from +22e to +23e. The upstream charge exchange would then produce a beam that had a greater fraction in the desired charge state when it reached the target region. The beam was thus switched to Pb23+ at 0.6 J.LA. A two-hour exposure was made at 9.7 · 10-6 Torr, but no photons were detected.
The beam was switched back to Pb22+ and during three exposures a somewhat wider wavelength region around 170A was scanned. When this attempt failed to give any lines, the beam was switched to Pb23+ anew and a 14-hour exposure was made. This attempt was also fruitless. Finally, the beam was switched to 06+ to see if the lines that we had seen when using the air target also occurred with the helium target. They did, though somewhat fainter than originally observed.
0. Andersson: A Method for Atomic Spectroscopy of Hi~hly Char~ed Ions ... 17

5. Analysis
5.1. Estimating the Ionic Composition of the Beam
When using the 06+-beam a signal was expected to be obtained since, as is mentioned in chapter four, both the spectra of 0 VI and 0 V contain a number of strong lines in the wavelength region around 160A. The fact that the 629A-line of 0 V was observed after replacing the target injection needle indicates that something might have been wrong with the first target. However, the electrically insulated needle was probably not the main problem. Since beam current was measured at the Faraday cup the beam must in fact have passed through the target region without deflection (see figure 3.2 on page 10).
However, the fact that a ten-minute exposure on a Pb22+-beam of 0.4 11A did not show any lines is not surprising. The same exposure time was used for obtaining the oxygen spectra, and then the beam current was of 7.6 11A (all beam currents refer to the value measured without gas load in the chamber). The particle flux is proportional to the beam current divided by the ionic charge, which gives an about 70 times larger flux in the 06+-beam than in that of Pb22+. The capture cross section for Pb22+ is of course larger than that for 06+, estimately 22/6 times larger since the cross section scales roughly with the ionic charge. To obtain the same intensity with the Pb22+-beam as with the one of 06+ we would thus have to
increase the exposure time by a factor 70 · 6/22""' 19 (three hours).
According to the above estimate a two hour exposure with the Pb22+-beam would likely reveal the resonance lines, if they are there. However, no consideration has been taken to the loss of ions due to upstream charge exchange. The fact that target gas leaks into the beamline has the result that the beam does not exclusively consist of Pb22+ when reaching the target. The loss of the highest charge state present in the beam can be estimated as follows: The probability for the ion to capture an electron per unit length is
(5.1) Pc=C>·p
where a is the capture cross-section and p is the number density of target particles. The number density is related to the pressure, as is found with the perfect-gas law:
(5.2) p = 133.3 p · 10-6 · NA/RT = No p
where No is 3 · 1016 if pis measured in Torr and T=300K. The change in beam intensity, di, after a distance dl is
( 5. 3) di = -I · P c · dl
where I is the beam intensity. Integrating di from 0 to 1 gives the expression
0. Andersson: A Method for Atomic Spectroscopy of HiJ\hly Char:\ed Ions ... 18

(5.4) I= Io exp[-Pc ·1]
for the beam intensity after this length, where Io is the original beam intensity. Supposing that the beam crosses n regions, the pressure in each region taken to be constant, the intensity after these regions is
(5.5) I= Io exp[-(Pc1 · h + Pc2 · h + ... +Pen ·ln)]
The experimental setup can be considered to consist of three regions of constant pressure. The first one is the beamline which is delimited from the target chamber by means of the conductance limiter, the second one is the region surrounding the target in the target chamber and the third region is the target itself. The simplification is justified by the argument that just below the needle the target pressure should be considerably higher than in the rest of the chamber. As it was not possible to measure the pressure in the target, the values below refer to the pressure measured by the wall of the target chamber. The original intensity Io is calculated from the beam current measured at the Faraday cup without gas load in the chamber.
The number of excitations per unit time in the target region is now easily calculated as the difference in intensity before and after the target region,
(5.6) N = h-13 = Io { exp[-(Pc1 · h + Pc2 ·b)]- exp[-(Pc1 · h + Pc2 · h + Pc3 ·b)]}.
In appendix E there is a pascal program-code for making these estimations. Detector efficiency etc. is also taken into account there. A problem is that the measured pressures are not absolute. Thus it is not clear which pressures to give the program. However, the behaviour of the photon signal in 0 VI, as a function of the chamber pressure was measured. Using the program to calculate count rates (or light intensity), we can fit the measured intensities to the calculated ones and thus obtain an absolute pressure scale.
To be able to do this, we must know the pressure in the three regions. From measurements we can tell that the pressure increases by a factor of four between the beamline and the chamber. However, underneath the needle we can not measure and must therefore estimate the pressure there. We define K(x) as the ratio
K(x) = p(x) (5.n P2
where p(x) is the pressure at vertical distance x from the needle and p2 is the pressure in the region surrounding the target (region 2). Then we have
(5.8)
K(x) = S . ___Q__ • L v(x-L)x 81t R
0. Andersson: A Method for Atomic Spectroscopy of HiKhly CharKed Ions ... 19

where Sis the capacity of the pump (1/s), Land Rare the length and radius of the needle respectively and vis the mean velocity of the target atoms (given by the Maxwell-Bolzmann distribution) [10]. A reasonable estimate of the pumping speed is 400 1/ s which gives K(x) z 10, at a distance 7 mm below the needle.
figure 5.1
200r-~------~~--~----~----------~-------.
,-,180 2 ...... § 160
.-e 140 ~
Q) 120 ~ 1-< § 100
8 80 "d 2 60 C'il
.§ 40 ..... r:ll
~ 20
qo~-s,--2~------~---------1~0~-6----------1~0~~~-2--~s
Pressure [Torr]
In figure 5.1 the calculated count rate is plotted against the beamline pressure. In measurements it was found that the chamber pressure, pc, was a factor of four higher than the beam-line pressure, pb. The pressures in figure 5.1 should thus be multiplied by a factor of four to be comparable to the measured pc. As is mentioned in chapter four, when using a beam of 06+ the count rate does not
increase significantly when increasing pc from 2 · 10-5 to 4 · 10-5 Torr. A
significant decrease in the count rate is seen when lowering pc to 1 · 10-5 Torr. Comparing these observations to the fit in figure 5.1 it is found that the
measured pc, 2 · 10-5 Torr, corresponds to a fitted chamber-pressure of 3.6 · 10-6 Torr. The measured pc is thus a factor of 5.55 too large. Inserting the corrected chamber-pressures, the program predicts a count rate of 200 s-1 using a 7.6 J..LA beam of 06+. Using a 0.4 J..LA beam of Pb22+ the calculated count rate is 6 s-1. We should thus have increased the exposure time by a factor of 200/6 z 33, i.e. from ten minutes to five and a half hours. However, the lines in 0 VI were very intense so the resonance lines in Pb XXIII should defenitely be visible after a twohour exposure. Here it is appropriate to make a reservation for the validity of these estimates, since a number of parameters are not known. The most important one is the capture cross-section, since no measurements of Pb22+ has been made at comparable energies. The estimated cross section is somewhat lower than the one given by the over-barrier model.
0. Andersson: A Method for Atomic Spectroscopy of Hi~hly Char~ed Ions ... 20

5.2. Discussion of the Results
A possible explanation of the fact that lines do not show up for Pb22+ is that the states to which the electrons are captured decay via doubly excited states and not via the sought-after resonance transitions. The energy level structure is completely unknown for this ion, so this possibility can not be rejected. Another explanation could be that the predicted wavelengths for the lines we are looking for are wrong. However, we have done all that was possible - to scan a wider wavelength interval we would have to exchange the spectrometer. A third possible explanation could be that our estimate of the loss of charge in the beam is too low. The estimates work rather well for the oxygen case but, as is mentioned above, the capture cross section for Pb22+ is not known.
The predictions of alkali-like spectra in the Promethium isoelectronic sequence are based on single configuration Hartree-Fock calculations (see chapter 1 and appendix C). It is clear how important it is to take configuration interaction into account, but in so heavy a system as Pb22+ there might be thousands of interacting configurations. In other words a full treatment of the problem is almost impossible. However, earlier this spring a new attempt was made using laser-produced plasmas [3]. No trace of alkali-like spectra was found, which emphasizes the value of getting new calculations.
To summarise the situation, no conclusions can be drawn just yet. The conditions in the chamber should be optimized and a new experiment should be made, with elements other than Pb. Once it is confirmed that the method is working, further investigations should be made of Pb22+ and other ions in the Promethium isoelectronic sequence.
5.3. Possible Improvements of the Method
The target chamber can be improved in a number of ways. The most obvious thing is to improve the differential pumping, so that the target density may be increased without changing the background pressure in the chamber too much. The improvement can be achived by using a stronger pump and by further limiting the conductance between the target and the beamline. The conductance limiter used during the experiment increased the pressure gradient, but was placed with the orifice of the tube pointing towards the target. As seen from the target needle a larger solid angle was thus taken by the hole of the limiter, than when using the original one. A larger fraction of the target can thus be expected to be spread straight into the limiter. The orifice was also placed in a region with higher pressure than the the original limiter was exposed to. The pressure gradient between the chamber and the beamline would probably increase even more using a longer tube, pointing away from the target.
Another method to improve the beamline vacuum is to replace the needle by a traditional gas cell. In this scheme the target gas is let into a small cell with holes for observation and for the beam to pass through. Gas cells have been used in many experiments and are even comercially available. Calculations are in progress as to find out which solution is the better one.
0. Andersson: A Method for Atomic Spectroscopy of Hi~hly Char~ed Ions ... 21

It would be desirable to move the interaction region closer to the spectrometer slits as this could somewhat enhance the count rate. If this manoeuvre is meaningful depends on if the area seen by the spectrometer already covers the interaction region or not. If the spectrometer sees more than the interaction region, the intensity falls off as 1/r (if the interaction region is taken to be a line source). The slits are now 80 em from the target, which is indeed a long distance. Moving the slits closer can be achieved by making the chamber smaller and by attaching the spectrometer directly on the chamber, without the flexible bellows. The later alternative implies that the target needle is movable, since this is then the only means of aligning the setup.
0. Andersson: A Method for Atomic Spectroscopy of Hixhly Charxed Ions ... 22

6. Acknowledgements
I would like to thank my supervisor, Doc Roger Hutton, for being the first person to arouse my interest for atomic collisions. Whatever questions I have asked, he has been able to answer them in a clear way. He seems to have an amazing bornwith sense for atomic physics. I would also like to thank Bosse "Wunderbaum" Nystrom who has taught me the little I know about computers. He has also made me understand that atomic physics is 90% vacuum technology and 10% science. Doc Sven Huldt also deserves a special thanks; without him this report would not be quite the same. He has been an endless resource whenever advice was needed, and without him I would not know half of what I know about the bars and restaurants of Grenoble.
Further I want to thank the whole atomic spectroscopy group in Lund for being such nice people. Especially Doc Ulf Litzen who let me participate in examining laser-produced plasmas of elements interesting to the experiment, and Dr Glenn Wahlgren (NASA/Goddard) for helping me with appendix D. The crew at CEACENG in Grenoble were wonderful - thank you all. Dr Ariel Brenac was certainly right when he said "the hardest thing you can measure is nothing".
Finally I want to thank our collaborators, Professor Jean-Louis Schwob and Professor Samuel Bliman. Last, but not least, I would like to thank Brasserie Savoie on Rue Alsace-Lorraine in Grenoble, where the author has spent many an hour (and many a Franc) collecting his thoughts and finding inspiration.
0. Andersson: A Method for Atomic Spectroscopy of Hif{hly Charf{ed Ions ... 23
7. References
1. L.J. Curtis, D. G. Ellis (Phys. Rev. Lett., 45 1980, no 26 p1099).
2. V. Kaufman, E. Trabert et. al. (Phys. Scr., 42 1990, p705).
3. Ulf Litzen (unpublished, 1995).
4. N. Bohr, J. Lindhard (Dan. Mat. Fys. Medd., 28 1954, no 7).
5. Constantine E. Theodosiou, Vassilis Raftopoulos (Phys. Rev., A28 1983, p1186).
6. R. K. Janev, Hannspeter Winter (Physics Reports, 117 1985, no 5&6).
7. Y. Jongen, C.M. Lyncis (The Physics and Technology of Ion Sources, Wiley 1989).
8. Grunderna i Tillampad Vakuumteknik (Svenska Vakuum Siillskapet, 1988).
9. J.L. Schwab, A.W. Wouters et. al.: (Rev. Sci. Instrum., 58 (9) 1987, p1601).
10. W. Steckelmacher, R. Strong, M.W. Lucas (Journ. Phys. D11 1978, p1553).
11. R. Morgenstern (AIP Conference Proceedings, 274 1992).
12. A. Barany, H. Danared (Nucl. Instr. Meth., B:23 1987, p1).
13. A. Niehaus (Journ. Phys., B19 1986, p2925).
14. B.H. Bransden, C.J. Joachain: Introduction to Quantum Mechanics (Longman Scientific & Technical, 1989).
0. Andersson: A Method for Atomic Spectroscopy of Hi~hly Char~ed Ions ... 24

Appendix A Theory of Electron Capture - A Brief Survey
The electron capture process in collisions of highly charged ions with atoms is a very complex quantum mechanical problem. It is of course not sufficient to treat the problem from a classical "before and after the collision" point of view, since the interesting processes occur during the collision. Knowing how great problems theorists have trying to build models for one many-electron atom, it is not hard to imagine the difficulties associated with the description of two atoms colliding. There are many states which can interact and , moreover, the description will look different depending on how sudden the ion-atom impact is: Will the target electrons have time to adjust to the changing charge-conditions as the highly charged ion appears in the environment or will they be caught napping?
Even it is not our aim to explain theories, the electron capture process is an essential part of the experiment. Therefore it seems important to have at least an intuitive picture of the mechanisms involved. The available theoretical models are on quite varying levels of sophistication and I have chosen to concentrate mostly on the 'Classical Over-Barrier Model', which is based on a number of very simple classical assumptions but indeed describes many features of the problem correctly. Atomic units (me= h/21t = e2 =1) will be used if not explicitly stated otherwise.
Historically, capture and loss phenomena were first observed for a-particles and for cosmic rays passing through photographic emulsions in the upper atmosphere. Later, during the 1950's, experiments on the stopping and ionizing effects of fission ions offered the most detailed evidence for electron loss and capture by heavy ions; especially direct measurements of the charge of these ions during their passage through gases and solids. An unsuspected large difference in the average charge of fission ions passing through solids and through gases was found. In gases a smaller, but distinct, change with pressure in the average charge was found. A detailed study of the adjustment of charge allowed direct estimates of the cross sections for electron capture in collisions with the gas atoms [4].
Many features of electron capture are correctly described by the (extended) classical over-barrier model (formulated by Baniny et al 1985), e.g. the principal quantum numbers n of the projectile orbitals into which capture takes place, the insensitivity of the capture cross section to the projectile core structure2 as long as the total charge is the same, and the relatively weak dependence of the cross section on the collision velocity over a wide range [11].
To give an outline of the over-barrier model, we start by considering the general case of a slow collision between two ions of total charge Z1 and (Z2- k) respectively. Here k is the number of active electrons (k:::; Z2), i.e. the electrons that are transferred during the collision. Direct ionisation at the impact is not considered, but autoionization may take place as the ions separate. The collision 2 In the classical over-barrier model the core is assumed to be a point charge [my comment].
0. Andersson: A Method for Atomic Spectroscopy of Hi~hly Char~ed Ions ... 25

being "slow" means that the ion's velocity vis much smaller than the velocity of the active electrons. In such a collision the transfer takes place primarily at curve crossings of the diabatic quasimolecular energy levels of the system [12]. To a first approximation the potential energies of the initial and final states, as a function of the internuclear distance R, are given by
Vt(R) =-I£ + (Zl- k)Zz (A2) R
where Ii is the initial binding energy of the electrons for an infinite separation of the ions, while It* denotes the binding energy of the excited electrons in a possible final state. The condition for a crossing to occur is that It*> Ii, which shows that reactions proceeding through curve crossings are all exothermic [12].
The crossing distances Rc are determined by the energy resonance condition Vi(Rc) = Vt(Rc), i.e.
This gives that the crossing distance can be written
Rc = k Zl- :z (A4) Ii- It
To get a rough estimate of the cross section Q for this transfer of k elektrons we simply write
(AS) Q=n~
For an Au19+ collision on H this yields that single capture can take place at a distance R=36 a.u., which explains why the model works so well: The capture takes place so far from the core that our classical assumptions are valid. In a simple classical barrier model for a one-electron system, the electron moves in the potential wells of the two charges Z1 and Zz, being initially bound at Zz. Separating the two wells is a barrier with maximum
Umax(R) = - ( 1/Z:; + fZ:;f (A6) R
A condition for capture to take place is that the barrier sinks below the level of the electron's binding energy.
These very simple rules were only proposed as a model because of the absense of
0. Andersson: A Method for Atomic Spectroscopy of Hif{hly Charf{ed Ions ... 26
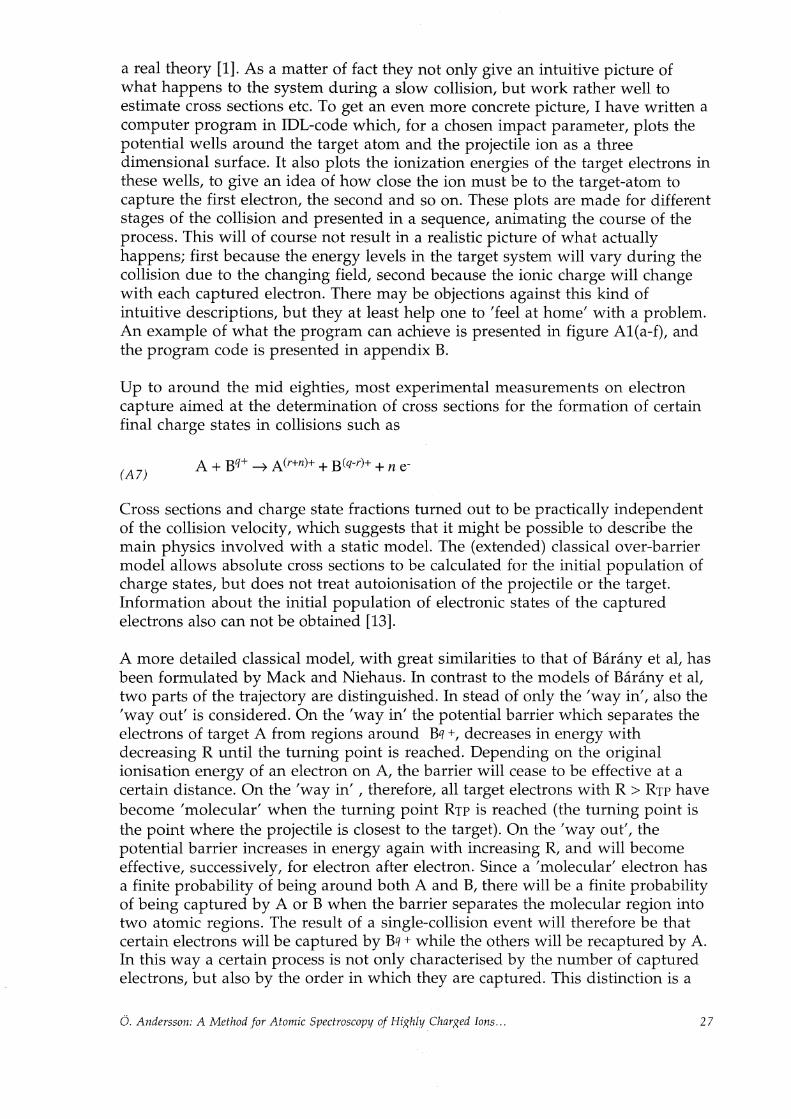
a real theory [1]. As a matter of fact they not only give an intuitive picture of what happens to the system during a slow collision, but work rather well to estimate cross sections etc. To get an even more concrete picture, I have written a computer program in IDL-code which, for a chosen impact parameter, plots the potential wells around the target atom and the projectile ion as a three dimensional surface. It also plots the ionization energies of the target electrons in these wells, to give an idea of how close the ion must be to the target-atom to capture the first electron, the second and so on. These plots are made for different stages of the collision and presented in a sequence, animating the course of the process. This will of course not result in a realistic picture of what actually happens; first because the energy levels in the target system will vary during the collision due to the changing field, second because the ionic charge will change with each captured electron. There may be objections against this kind of intuitive descriptions, but they at least help one to 'feel at home' with a problem. An example of what the program can achieve is presented in figure A1(a-f), and the program code is presented in appendix B.
Up to around the mid eighties, most experimental measurements on electron capture aimed at the determination of cross sections for the formation of certain final charge states in collisions such as
(A7) A+ Bq+ -t A<r+n)+ + B<q-r)+ + n e-
Cross sections and charge state fractions turned out to be practically independent of the collision velocity, which suggests that it might be possible to describe the main physics involved with a static model. The (extended) classical over-barrier model allows absolute cross sections to be calculated for the initial population of charge states, but does not treat autoionisation of the projectile or the target. Information about the initial population of electronic states of the captured electrons also can not be obtained [13].
A more detailed classical model, with great similarities to that of Barany et al, has been formulated by Mack and Niehaus. In contrast to the models of Barany et al, two parts of the trajectory are distinguished. In stead of only the 'way in', also the 'way out' is considered. On the 'way in' the potential barrier which separates the electrons of target A from regions around Bq +, decreases in energy with decreasing R until the turning point is reached. Depending on the original ionisation energy of an electron on A, the barrier will cease to be effective at a certain distance. On the 'way in' , therefore, all target electrons with R > Rrr have become 'molecular' when the turning point Rrr is reached (the turning point is the point where the projectile is closest to the target). On the 'way out', the potential barrier increases in energy again with increasing R, and will become effective, successively, for electron after electron. Since a 'molecular' electron has a finite probability of being around both A and B, there will be a finite probability of being captured by A orB when the barrier separates the molecular region into two atomic regions. The result of a single-collision event will therefore be that certain electrons will be captured by Bq + while the others will be recaptured by A. In this way a certain process is not only characterised by the number of captured electrons, but also by the order in which they are captured. This distinction is a
0. Andersson: A Method for Atomic Spectroscopy of Hixhly Charxed Ions ... 27

Physical one, because the state into Wh. h
depend on What has happened to the otlhc ani electron is captured WilJ, in general ere ectrons [13]. '
40
Figure A. I (a-b)
6. Andersson· A Meth dfi A .
. a "' '"""c Spectmscapy of lhihlv Cha'>r<d Ions ...
28

Figure AI (C-d)
0. Andersson· A Meth "fi ... .
. "" or Q'"""c SpectroSCopy of fliJ?hJy Char eJ '
. ;;;, iOns ...
29

-1
20_
-4Q[_ i-
-6o£ t
-sot_
Figure AI (e-j)
-1
40
30

Figure Al: The curved mesh represents the potential wells around the collision partners, whereas the contours in the base of the figure represent the ionization potential of the respective target electrons. Here, a projectile of charge +30 a.u. moves in the direction of the arrow at an impact parameter of 7 a.u. towards a He target. In figure (b) we see that the first target electron, with the ionization potential -24.60 eV, can already be captured. In figures (c) and (d) the projectile continues its motion and in figure (e) the potential well of He has slipped so deeply into the projectile well that it can hardly be seen. The second electron is , however, still bound to the target atom. In figure (j) the two collision partners have come so close that the last He electron, with an ionization potential of -54.42 e V, can finally be captured.
A further extension of the classical over-barrier model allows the description of electron capture into specific states, so called state-selective electron capture [6]. In this case we have a reaction of the type:
(AS) A(no, lo, mo) + Bq+ --7 A++ B(q-l)+*(n, l, m)
where (no, lo, mo) and (n, 1, m) are the usual quantum numbers specifying the initial and final state, respectively. Bq + denotes the primary multiply charged ion and B(q-1 )+*is the created excited product ion state [6].
The collision dynamics of any inelastic process between atoms and highly charged ions is basically characterized by three parameters. These are the relative collision velocity, v, the ionic charge, q, and the number of electrons in the collision system, N. Moreover, each particular process is also characterized by the binding energy of the initial and final states and other appropriate quantum numbers [6].
The collision velocity v , measured in units of the characteristic orbital velocity v0 of bound atomic electrons, determines the duration of the collision with respect to the characteristic electron transition times and, thus, the adiabaticity of the process. With the ionic charge q the strength of the different potential and dynamic interactions in the system are connected. Finally, the number of electrons in the system influences the collision dynamics not only in the obvious way by increasing the number of reaction pathways and the variety of inelastic processes, but also by affecting the symmetry properties of the collision system. With regard to the collision parameter v = v /vo one can distinguish between three dynamical regions of an inelastic ion-atom collisional process: Low velocities (v<<vo, adiabatic region), intermediate velocities (v "" vo) and high velocities (v>>vo) [6].
The physical mechanisms for the inelastic processes in these three regions are different and, consequently, the theoretical methods for their description also differ from each other [6].
In the electron capture process in atom-highly charged ion collisions, we note first that the A+ Bq + collision system for q>>l has its initial state (A+ Bq +) strongly coupled with a large number of states of the electronically rearranged system (A++ B(q-1 )+*).In a quasi-molecular picture of the system, adequate for low velocity collisions, the potential interaction energies of the initial and final states have the following asymptotic behaviour with respect to the internuclear
0. Andersson: A Method for Atomic Spectroscopy of Hi;,;hly Char;,;ed Ions ... 31

distance R (in the lowest approximation):
(A9)
(AlO)
where 1/2no2 = Io is the ionization potential of atom A, and -q2/2n2 = -IB,n is the binding energy of the electron in its final state. At large internuclear distances, where these two representations are valid, the strongest interactions between initial and final states appear in the regions where their respective potential energies become degenerate, i.e. at
q -1 Rnz--=---
_f_ __ l_ n<qn0.
(All) 2 n2 2 nt
With increasing ionic charge q, the number of final ionic states which interact with the initial state by the above-mentioned coupling mechanism increases drastically. This is particularly true for many-electron atoms [6].
y n ( R)
2
n
N
R __,__.
Figure 3: The strongest interactions between initial and final states appear in regions where the energy resonance condition is fulfilled, i.e. where the potential energies of these states become degenerate, or nearly degenerate.
0. Andersson: A Method for Atomic Spectroscopy of Hixhly Charxed Ions ... 32

With increasing collision velocity , the quasi-molecular picture of the collision system ceases to be adequate for description of electronic states. If v ""1 or greater than one, the electron is bound during most of the collision time either around the atomic core A+ or around the ion Bq +,and the usual atomic and ionic states are a good representation for its motion. In the region v "" 1, the number of strongly coupled discrete states participating in the electron transfer process is very large and increases with q. For still higher collision velocities, and particularly for v>>1, ionization becomes a dominant process [6].
All the mechanisms governing the single electron capture process are characterized by a common feature: The probability for electron transfer attains its maximum when the energies, as measured from the continuum, of the initial and final state which participate in the transition are close to each other [6].
Let us consider, for instance, an adiabatic collision (v <<1) and assume that the capture is governed by the above mechanism. The reaction is restricted to a region R::::; Ro, where the electron capture radius Ro is connected with q and no by Ro ""2n0 (2q)1/2. The energy resonance condition at R = Ro,
(A12)
1 q2 q -1 ---=---+--
2 na 2 n2 Ro
yields that the principal quantum number nm of the most probably populated final state is
no q nm "" ---;=====:::;=
q -1 1+--
(A13) ffq
or for ~q>>1:
(A14) v <<1 [6].
This yields e.g. for Pm-like gold (Au XIX) nm"" 11, i.e. typically the electron will be captured into a high-n state. With Bohr's correspondence principle in the back of one's head, this could explain why such simple mechanical considerations give a reasonable agreement with experiment [4]. In the intermediate velocity region (v "" 1) and the high velocity region (v >> 1), the dynamic character of the quasiresonance condition for electron capture can be illustrated within the first-order perturbation theory [6] (Born approximation, i.e. the perturbing potential is treated as a constant, as it varies slower than the duration of the collision [14]). For an atom-highly stripped ion system, the first order capture probability is proportional to
0. Andersson: A Method for Atomic Spectroscopy of Hi~hly Char~ed Ions ... 33

(A15)
with
(A16)
2 ffin = _1_- _5L
2 n5 2 n2
and with Q being the transferred momentum. It can easily be seen that for small collision velocity (where the transferred momentum is also small) the probability Pn attains its maximum when the "static" energy resonance
condition, ron "" 0, is satisfied. In this region ( for v = 1) the principal quantum number of the most probably populated final levels is given by:
(A17) nm"" no q, v ~ 1.
In the limit of very high collision velocities, the capture is predominantly governed by momentum transfer effects, and the energy resonance condition ceases to play any significant role [6].
The electron transfer process also selectively populates states with respect to the electron orbital angualar momentum. The !-distribution depends on the collision energy, but also on e.g. the stark mixing of levels with degenerate or nearly degenerate energies. As the electric field between the target atom and a highly charged projectile will be very strong, the stark effect will substantially decrease the role of the 1-quantum number. These effects will, however, not be treated here.
0. Andersson: A Method for Atomic Spectroscopy of Hi:<hly CharJ<ed Ions ... 34

Appendix B IDL Program-Code for Simulation of Atomic Collisions
function potential, x, y, q, R, b ***calculates potential in (x,y) for ion-atom distance R*** u = -13.6*((1/sqrt((x+0.001)"2 + (y+0.001)"2)) + (q/sqrt((x-R+0.001)"2 + (y-b+0.001)"2))) return, u end
pro bind_energi, target, lvls ***gives ionization potential for target*** if target eq 1 then lvls = [ -54.42, -24.60] if target eq 2 then lvls = [-122.45, -75.64, -5.39] if target eq 3 then lvls = [-71.62, -47.69, -5.14] if target eq 4 then lvls = [-63.46, -40.96, -21.56] if target eq 5 then lvls = [-40.74, -27.63, -15.76] if target eq 6 then lvls = [-36.95, -24.36, -14.00] if target eq 7 then lvls = [-32.10, -21.21, -12.13] return end
pro yta x = dblarr (50, 50) y = dblarr (50, 50) u = dblarr (50, 50)
ulimit = 10 llimit = -100
fori = 0, 49 do x(i, *) = i- 10 fori = 0, 49 do y(*, i) = i- 10
print, 'Stotparameter (0-30)?' read, b ***reads impact parameter*** print, 'Projektilens laddning?' read, q ***reads projectile charge*** print, 'Target atom?' print, '[He (=1), Li (=2), Na (=3), Ne (=4), Ar (=5), Kr (=6), Xe (=7)]' target = get_kbrd(1) ***reads target atom*** if target eq 1 then nlvls = 2 else nlvls =3 ***gives number of energy levels*** bind_energi, target, lvls
!z.range = [llimit, ulimit] xanimate, set = [800, 800, 10]
for R = 30, 1, -3 do begin u = potential (x, y, q, R, b) surface, u, x, y, /upper_only, /save ***draws upper side of potential surface*** contour, u, x, y, /t3d, /noerase, zvalue = 0, nlvls, levels= lvls ***draws ion. potential curves*** pix = tvrd() ***reads picture into memory*** xanimate, image= pix, frame= (30-r)/3 ***displays pictures as a movie***
endfor
xanimate, 5
end
0. Andersson: A Method for Atomic Spectroscopy of HiRhly CharRed Ions ... 35

Appendix C Hartree-Fock Calculations
The Hartree-Fock model (or self-consistent field method) is a method to obtain the central potential V(r) for a multi electron atom. In this approach it is assumed that the N-electron wave function is a Slater determinant ,
(Cl)
in which ua(q1) u~(q2) ... uv(qN) are individual electron spin-orbitals [14].
What is then a Slater determinant? To answear this question we consider a
system of two identical particles, and denote by \j/(q1, q2) an unsymmetrised eigenfunction of the Hamiltonian of this system corresponding to the eigenvalue E. The symmetric and antisymmetric eigenfunctions corresponding to the same eigenvalue E are given respectively by
and
(C2b) \j/A(q1, q2) = 2-1/2 [\j/(q1, q2)- \j/(q2, q1)]
where the factor 2-1/2 has been introduced for further convenience. As is well known the symmetric wave function must be used in the case of a system of two identical bosons, the antisymmetric one in the case of two identical fermions [14].
The generalisation to systems of N identical particles is straightforward. For example, in the case of N = 3, we can construct from the unsymmetrised wave
function \j/(q1, q2, q3) the completely symmetric wave function
(C3a) \j/s(q1, q2, q3) = 6-1/2 [\j/(q1, q2, q3) + \j/(q2, q1, q3) + \j/(q2, q3, q1)
+ 'II( q3, q2, q1) + 'II( q3, q1, q2) + 'II( q1, q3, q2)]
which is appropriate for a system of three identical bosons. For the fermion case, we use the completely antisymmetric wave function
(C3b) \j/A(q1, q2, q3) = 6-1/2 [\j/(q1, q2, q3)- \j/(q2, q1, q3) + \j/(q2, q3, q1)
- \j/(q3, q2, q1) + \j/(q3, q1, q2)- \j/(ql, q3, q2)]
0. Andersson: A Method for Atomic Spectroscopy of Hi~hly Char~ed Ions ... 36

An interesting special case is that for which the Hamiltonian H of a system of N identical particles is the sum of N identical single-particle Hamiltonians hi,
(C4)
i = 1
Let us denote by UJ.,( qi) the normalised eigenfunction of hi corresponding to the eigenenergy EA,:
A solution of the Schrodinger equation
(C6) H \jl(ql, ... , qN) = E \jl(ql, ... , qN)
is then given by
(C7) \jl(ql, ... , qN) = Ua(qi) U~(q2) ... Uv(qN)
where each of the symbols a,~' ... v represents a set of quantum numbers for the individual (one-particle) states UJ.,. The total energy E is just the sum of the individual energies EA, [14].
Consider the simplest case, N = 2. The symmetric and antisymmetric wave functions corresponding to the energy E = Ea + E~ are given by:
and
For the general case of N identical particles, the totally antisymmetric wave function built from the one-particle states ua(qi), u~(q2), ... uv(qN) is given by the Slater determinant, equation C1 [14].
The optimum Slater determinant is obtained by using the variational method to determine the best individual electron spin-orbitals. The variational method is useful in obtaining approximately the bound-state energies and wave functions of a time-independent Hamiltonian H. We denote by En the eigenvalues of this
Hamiltonian and by \jln the corresponding orthonormal eigenfunctions, and
assume that H has at least one bound state. Let <j> be an arbitrary square-integrable function, and let E [ <j>] be the functional
0. Andersson: A Method for Atomic Spectroscopy of Hi;;;hly Char;;;ed Ions ... 37

(C9) E[<!>]=<<j>IHI<j>>.
It is clear that if the function <I> is identical to one of the exact eigenfunctions En of
H (i.e. if H<j> =En<!>), then E[<!>] will be identical to the corresponding exact eigenvalue En:
(ClO) < <!> I H I<!>>= En<<!> I <!>>=En
Moreover, it can be shown that any function <1> for which the functional E[<!>] is
stationary is an eigenfunction of the discrete spectrum of H. That is, if <1> and 'l'n
differ by an arbitrary infinitesimal variation 8<j>,
(Cll) <!> = 'lfn + 8<j>
then the corresponding first-order variation of E[<!>] vanishes, 8E = 0 (for the proof, see a book in Quantum Mechanics, for example Bransden/Joachain [14]).
Now, let the trial function <1> be a Slater determinant containing the one electron orbitals to be determined. Upon variation of E[<!>] with respect to the spin-orbitals, it is found that the spin-orbitals must satisfy a system of coupled equations, known as the Hartree-Fock equations:
A= a, p, ... , v (C12)
where the Hartree-Fock potential, V (qi), represents the field in which the electron i moves when the atom is in a given state, for example the ground state [14].
The Hartree-Fock equations look similar to individual Schrodinger eigenvalue equations for each of the spin-orbitals UJ... They are not genuine eigenvalue equations, however, since the Hartree-Fock potential V (qi) depends on the (N-1)
other spin-orbitals u 11, with J..l =I- A. To solve the system of Hartree-Fock equations, one proceeds by iteration. Starting from approximate individual spin-orbitals, one first calculates the corresponding approximate expression of the HartreeFock potential. The Hartree-Fock equations are solved with this expression to obtain new spin-orbitals, which in turn yield a new potential. This procedure is repeated until the final spin-orbitals give a potential which is identical to (within the desired approximation) the potential obtained in the preceding step. The Hartree-Fock potential determined in this way is known as the self-consistent field of the atom (ion). It is, in general, spin dependent and depends also on the angular coordinates. A central potential can be obtained by averaging over the angular variables and the spin states [14].
0. Andersson: A Method for Atomic Spectroscopy of Hi~hly Char~ed Ions ... 38

Appendix D Popular Scientific Summary
D.l. A Brief Summary of Physics
"The truth is always unlikely. To make it likely, one has to improve it a bit with lies."
Fiodor Dostoievski
A physicist describes nature. So does a poet, sometimes. But what is the difference between a physicist and a poet? There are of course many differences. The most important one is perhaps that the physicist tries to describe nature in such a way that he can predict what will happen in certain situations. If you e.g. hold a ball in your hand and let go of it, the physicist can by means of a mathematical model predict when it will hit the ground. His prediction can be more or less true since it is very hard, if not impossible, to forsee all factors that influence the ball. These factors are an immense number of things, such as air resistance etc. In the 16th century, Gallileo reflected over this and said that if we can not tell the absolute truth- why not tell a good lie? Of all the factors that influence the ball, there must be some which are more important than others. We could e.g. describe the ball as moving in vacuum, without friction. This is of course a lie, but it helps us to see the problem more clearly. This way of "lying" to solve a problem is called physics. Standing before a problem which is too complicated to be solved exactly, the physicist reduces and simplifies the problem enough for it to be solvable, but not until it is trivial. In other words: Physics is the art of lying to understand the truth.
During our century we have come to understand that the description of some aspects of nature is even more complicated ,than was first believed. This is due e.g. to the fact that nature does not behave the same way in very small scale systems as it does in larger every day scales. We intuitively know what will happen to a ball when we drop it; no mathematics is required for us to understand that it will fall down. This is of course because we have seen it many times, and anyone who has lived his entire life in a gravitation field knows that 'what goes up must come down'. We have not, however, lived in the small world of the atoms so we can not be sure that the intuition we have aquired will work there. As it turns out, it does not. Thus, to describe an atom, we can not use intuitive models like Newton's mechanics but must use so called quantum mechanics. This is a modern theory that states many counterintuitive results as e.g. that it is impossible to know at the same time exactly where a particle is and where it is going. Exact knowledge of one of these things implicates an infinite uncertainty in the other. This and many other statements are very puzzling, but they all come out of the quantum mechanical treatment. The reason why this theory is used is that it produces results which agree extraordinarily well with experimental ones. It should be said that as quantum mechanics is applied to larger and larger systems, it gradually reproduces the intuitive results. This is important, so we can be sure that 'microcosmos' is not an entirely different reality - it just exhibits aspects that become unimportant with larger scale.
0. Andersson: A Method for Atomic Spectroscopy of Hixhly Charxed Ions ... 39

D.2. The Secret Life of Atoms
This work deals with the physics of atoms. As has been mentioned, atoms are indeed very small- on the order of one angstrom, or 1/10 000 000 000 m. This measure, however, is so small that it tells us nothing. To get a better understanding of how small an atom really is we must compare it to something we do know the size of. A ping-pong ball e.g. has a size of about three centimeters. If we enlarge the atom to the size of a ping-pong ball, this corresponds to enlarging a ping-pong ball to the size of earth! The atom consists of a positively charged nucleus in the center and a cloud of negative electrons around it. With the size of an atom we actually mean the size of this electron cloud. The nucleus is much smaller than this; about ten thousand times smaller. If we enlarge the atom, not to the size of a ping-pong ball, but to the size of a football ground (which is about a hundred meters across) the nucleus would not even be the size of a football. It would rather be the size of an insect in the grass, a centimeter or so.
If you supply the atom with energy it will release this energy again, often in the form of light. If you let a thin stroke of this light pass through a prism you will not see a continous spectrum. In a contiuous spectrum you find all the colours of the rainbow. Instead you will see a number of distinct lines of various colours. This is one of the most striking features of atoms and was known long before quantum mechanics: the spectrum. Quantum mechanics, however, gives the explanation: The atom could be compared to a multi-storey building, where the electrons can be on any floor but not anywhere in between. Being on one floor, or level, corresponds to having a certain energy, higher the further up in the building the electron goes. When the atom is supplied with energy, the electrons can absorb it in portions corresponding exactly to the energy difference between its current level and a higher level, to which it goes. It becomes "excited". After a while it falls back and can release this energy in the form of light of a certain wavelength, or colour. Each line in the spectrum corresponds to one such transition. Since the electrons can not absorb less energy than the energy difference to the next floor, we must think of the building as having no stairs. Using stairs you can go halfway between two floors and take a rest, which is impossible for electrons. One could say that they always take the elevator.
Now we have a simple notion of the atomic world and what atomic physics is about. This work aims at finding out whether some theoretical predictions about certain atomic spectra are true. One could ask why theoretical predictions need to be checked at all. As we have said, quantum mechanics gives a very good agreement with experiment. Today the forces acting between the electrons and the atomic nucleus are also well understood. The only important forces within the atom are electromagnetic ones, and electromagnetism has been thoroughly investigated for hundreds of years. So what is our problem? As a matter of fact, it is neither the forces involved nor the quantum mechanical description that is a problem. The obstacle is a more fundamental one: Most atoms consist of a large number of electrons which mutually interact, and it is impossible to solve exactly the equations for description of more than two interacting bodies. We can thus describe Hydrogen exactly, since it consists only of a nucleus and an electron, but already for Helium (two electrons) we are in trouble. Instead of trying to find an exact solution, one can use a number of approximate methods. For the atoms we
0. Andersson: A Method for Atomic Spectroscopy of Hi~hly Char~ed Ions ... 40

are interested in, which have 61 electrons, this becomes a formidable task and an experiment is absolutely necessary to verify the correctness of the calculations.
The theoretical predictions to be checked concern the spectra of "promethiumlike ions", i.e. atoms with 61 electrons. Say that we keep 61 electrons in the atom and increase the charge of the nucleus. Because of the forces between the electrons and the nucleus, the energy-levels of the electrons will now change. So does the spectrum. Theorists have said that for 61 electron-atoms with between 74 and 92 protons in the nucleus, the spectra will be especially simple, "alkalilike". The term alkalilike refers to a group of metals called the alkali metals. If you drive your car at night, you may notice the characteristic yellow light from the streetlights along some roads. It comes from the alkali metal sodium in the lamps. If you look at this light in a spectroscope two very strong yellow lines will appear close to each other, the so called sodium doublet. This doublet is due to that in these atoms, the only way for an excited electron to return to the ground level is to jump from either of the two second-lowest energy levels, emitting yellow light. The corresponding strong doublets exist in and dominate all alkali spectra in the same way. The alkalilike spectra in our atoms are said to arise as 60 electrons occupy the 60 lowest levels, forming a core, and the 61st electron moves among the rest of the levels. We aim at finding these doublets.
D.3. Electron Capture - The Martini Model
A problem we have to deal with is that there are no 61 electron-atoms with between 74 and 92 protons in the nucleus naturally on earth. We will have to make these in a laboratory and make them have 60 electrons in the lowest possible levels and the 61st one moving among the remaining levels. One way to achieve this is to first produce, in some way, atoms with 60 electrons and wait until these fall down to the lowest possible levels. This will only take parts of a second. Then we take an electron and put it into a high level in the atom. As it falls from level to level towards the ground level, it will hopefully emit the spectrum we are looking for. The first part of this is easy in the sence that we do not need to know exactly how to do it; there are special machines that can produce atoms with any number of electrons. The second part is trickier. How do we go about putting an extra electron in there?
As a matter of fact it can be done by letting the atom collide with e.g. a Hydrogen atom and steal the hydrogenic electron away. This is called electron capture. To understand better what happens we can pretend to be in the place of the hydrogenic electron. Then we are of course negatively charged and are attracted by the positively charged hydrogenic nucleus that we move around. The attraction gets stronger as we approach the nucleus, which means that it takes a certain amount of energy to keep a certain distance to the nucleus. If we have no energy we will occupy the ground level, i.e. the level closest to the nudes, and if we get enough energy we may even go so far away that we no longer are bound to the atom. The situation somewhat resembles sitting in a well; with enough energy you may jump out.
0. Andersson: A Method for Atomic Spectroscopy of Hi~hly Char~ed Ions ... 41

We can think of the electron as an olive in a Martini glass. When the electron is in the ground level the olive lies still on the surface of the Martini3 . If we supply the atom with energy, e.g. by agitating the glass, we "excite" the olive by increasing its kinetic energy. If we agitate the glass intensely enough it may even be "ionized", i.e. the olive leaves the glass. (Also the liquid itself may leave the glass, thus forming a 'Dry Martini', but that is indeed another story).
Electron capture could be described in the frame of our Martini model by two persons at a cocktail party, drinking to each other and putting their glasses together. One of them is very fond of olives and wants to steal his friend's olive, since he has already eaten his own. The desired olive is prevented by the rim from leaving the glass. This barrier can be overcome either by letting the olive go over it, or by lowering it enough for the olive to slip out. He has been thinking for a while and has come up with two schemes for the theft: The first one is to tip his friend's glass so that the olive floats up to the rim. He then does the same manoeuvre with his own glass and hopes to get the olive to float over into it, as the glasses and the Martini surfaces meet. He must of course move his glass very slowly and carefully if he shall succeed in this, but he does not have to supply the olive with extra energy. Once the barrier is removed, the olive is free to move between the glasses. The second scheme is to put the glasses together so violently that his friend's olive simply jumps out of the glass and into his. This is of course a way of supplying his friends glass with so much energy that it becomes ionized.
figure Dl: Two schemes for stealing the olive. Left: By tipping the glasses towards each other, the olive may float into the other glass as the Martini surfaces meet (slow collision). Right: The olive may also be made to jump into the other glass by brute force (fast collision).
One may object to these schemes saying that the first one only will result in a bad Martini-spot on the carpet and that the second one also is likely to fail. This is of course true, since Martini-glasses are rigid and do not interact in the same way as charged particles. In the atomic world, however, these schemes do work. The glass without an olive could corresponds to a positively charged ion. The olive in the other glass, i.e. the electron, will then experience an attractive force to this ion as it approaches. At a small enough distance the electron no longer knows
3 In these days of gene-manipulation, it is probably possible to develop an olive that does float in a Martini.
0. Andersson: A Method for Atomic Spectroscopy of Hi~hly Char~ed Ions ... 42

which charge to be bound to- the "barrier" between the atoms is gone. The electron may then "float over the rim" and be captured by the ion. This corresponds to the first scheme in which the olive floats into the other glass, and is what happens in slow collisions. In a fast collision the electron can absorb part of the kinetic energy in the collision and jump out of the atom, as in scheme number two. The free electron can then either be lost, fall back into the first atom or be captured by the ion. For a highly charged positive ion the latter alternative will of course dominate.
D.4. What Happened?
The experiment can simply be described as follows: We are accelerating 60-electron atoms towards a gas cloud of Helium. As the projectiles collide with the Helium atoms, they may capture a 61st electron into a high-energy state. This electron will fall from level to level, to the lowest energy level, the "ground state". For each level that this electron falls to it emits a photon (light). The wavelength of this light depends, as is mentioned above, on the energy difference between the levels. When looking at the light in a spectroscope we will see a number of lines of various colours - the characteristic spectrum of the ion. As it turns out, the lines that we are interested in are not predicted to lie within the visible region of the spectrum, but in the ultra-violet. This is not a problem, however, since there are detectors which are sensitive in this region.
Due to experimental problems, the time ran short when the experiment was conducted. The only ion that was investigated was Pb22+. Even though the lines were sought after in a wide interval of wavelengths, they were nowhere to be found. Since oxygen spectra were seen when the spectrometer was to be calibrated, we know that the method in principle works. What we do not know is why we did not see an alkali-like spectrum observing Pb22+. Was it because it does not exist, or because there is something wrong with the experiment? The time was too short to investigate this enough. However, this is not a reason for disappointment. The reason why it is called an experiment, is that you do not know from the start that it will work. Further, this result is in its own way a contribution to science, since someone who wants to continue the search for alkali-like spectra in the Promethium sequence has much to learn from this experiment.
0. Andersson: A Method for Atomic Spectroscopy of Hi!{hly Char!{ed Ions ... 43

Appendix E Pascal Program for Estimating Beam Depletion
program Depletion; const e = 1.602e-19; Na = 6.022e+23; 11 = 200; 12 = 12.5; 13 = 1; p1 = 4.5e-7; pf2 =4; pf3 = 10; pb = 4e-7; pbc = 7e-7;
var IP: real; q: integer; Bint: real; left: real; BI: real; p2, p3: real; s1, s3: real; Pc: real; Ps: real; Pexc: real; N: real; eff: real; NO, alpha: real;
begin IP := 10; q := 22; Bint := 1;
{electron charge} {Avogadros number} {length of region 1} {length of region 2} {target length} {region 1 pressure in torr} {pressure gradient p2 I p1} {pressure gradient ptargetlp2} {backgroud pressure in beamline} {backgroundpressure in chamber}
{Ionisation Potential of target gas in eV} {Original beam charge state} {relative beam intensity} {remaining beam beam intensity after target} {beam current} {pressure in region 2 and 3} {Bliman's capture cross-section and cross section for certain state} {probability for capture} {probability for survival} {probability for excitation} {number of excitations} {detection efficiency}
write('Beam current without gasload [!lA]? '); readln(BI); NO:= 3e+16; {number of particles torr-1*cm-3} writeln('1 Torr <=>', NO, ' cm-3'); write In; writeln('SUMMARY:'); writeln('Region 1 is the upstream beampipe'); writeln('Region 2 is the volume surrounding the target'); writeln('Region 3 is the target area'); s1 := 4e-12 * q I (IP * IP * IP); writeln('Capture cross-section: ', s1, ' cm2'); s3 := s1 * 0.1;
Pc := 11 * s1 * (p1- pb) *NO; Ps := 1- Pc; Bint := Bint * exp(-Pc); if Ps < 0 then Ps := 0; write In; writeln('Region 1length = ', 11 : 3, ' em');
0. Andersson: A Method for Atomic Spectroscopy of Hi~hly Char~ed Ions ... 44

writeln('Survival rate after region 1: ', 100 * Ps : 3 : 0, '%,pressure: ', 1000 * p1, 'mTorr'); writeln('Intensity: ', 100 * Bint : 3 : 0, ' %');
p2 :== pf2 * p1; Pc :== 12 * s1 * (p2 - pb) * NO; Ps :== Ps * (1 - Pc); Bint :== Bint * exp(-Pc); if Ps < 0 then Ps :== 0; writeln; writeln('Region 2 lenth: ', 12 : 3 : 1, ' em'); writeln('Survival rate after region 2: ', 100 * Ps : 3 : 0, ' %, pressure: ', p2 * 1000, ' mTorr'); writeln('Intensity: ', 100 * Bint : 3 : 0, ' %');
p3 :== pf3 * p2; Pc :== 13 * s3 * (p3- pbc) *NO; left:== Bint * exp(-Pc); Pexc :== Bint - left; if Pexc < 0 then Pexc :== 0; writeln; writeln('Target length: ', 13 : 3, ' em'); writeln('Target pressure: ', 1000 * p3, ' mTorr'); writeln('Probability for excitation: ', Pexc);
writeln; eff :== 0.005 * 0.05; {grating*detector effeiciency} writeln('Beam current of', BI: 3: 0,' 11A and detection efficiency', 100 * eff: 3: 2,' %'); N :== (BI * 1e-6 I (e * q)) * Pexc; {beam entering target* excited fraction} writeln('Number of excitations: ', N); alpha :== (1.01 I 360.01) * (8.01 I 360.01) I 4 *pi; {solid angle reduction} writeln('Solid angle reduction: ', alpha, ' Into slit: ', N * alpha); writeln('Total number of photons/second at detector: ',alpha* eff * N: 2: 2);
end.
0. Andersson: A Method for Atomic Spectroscopy of Hi~hly Char~ed Ions... 45