Embed Size (px)
Citation preview
A Method for Assessing Hydrologic Alteration within Ecosystems STOR
Brian D. Richter; Jeffrey V. Baumgartner; Jennifer Powell; David P. Braun
Conservation Biology, Volume 10, Issue 4 (Aug., 1996), 1163-1174.
Stable URL: http:/ /links.j stor.org/sici ?sici=OSSS-8892%28199608%291 0%3A4%3C 1163%3AAMF AHA %3E2.0.C0%3B2-E
Your use of the JSTOR archive indicates your acceptance of JSTOR' s Terms and Conditions of Use, available at http://www.jstor.org/about/terms.html. JSTOR's Terms and Conditions of Use provides, in part, that unless you
have obtained prior permission, you may not download an entire issue of a journal or multiple copies of articles, and you may use content in the JSTOR archive only for your personal, non-commercial use.
Each copy of any part of a JSTOR transmission must contain the same copyright notice that appears on the screen or printed page of such transmission.
Conservation Biology is published by Blackwell Science, Inc .. Please contact the publisher for further permissions regarding the use of this work. Publisher contact information may be obtained at http://www .j stor .org/joumals/blacksci-inc.html.
Conservation Biology ©1996 Blackwell Science, Inc.
JSTOR and the JSTOR logo are trademarks of JSTOR, and are Registered in the U.S. Patent and Trademark Office. For more information on JSTOR [email protected].
©2003 JSTOR
http://www .j stor.org/ Wed Aug 20 12:30:03 2003
A Method for Assessing Hydrologic Alteration within Ecosystems BRIAN D. RICHTER,* JEFFREY V. BAUMGARTNER,t JENNIFER POWELL,t AND DAVID P. BRAUN* '''The Nature Conservancy, P.O. Box 430, Hayden, CO 81639, U.S.A. tThe Nature Conservancy, 2060 Broadway, Suite 230, Boulder, CO 80302, U.S.A. :j:The Nature Conservancy, 1815 N. Lynn Street, Arlington, VA 22209, U.S.A.
Abstract: Hydrologic regimes play a major role in determining the biotic composition, structure, and function of aquatic, wetland, and riparian ecosystems. But human land and water uses are substantially altering hydrologic regimes around the world. Improved quantitative evaluations of human-induced hydrologic changes are needed to advance research on the biotic implications of hydrologic alteration and to support ecosystem management and restoration plans. We propose a method for assessing the degree of hydrologicalteration attributable to human influence within an ecosystem. This method, referred to as the "Indicators of Hydrologic Alteration," is based upon an analysis of hydrologic data available either from existing measurement points within an ecosystem (such as at stream gauges or wells) or model-generated data. We use 32 parameters, organized into five groups, to statistically characterize hydrologic variation within each year. These 32 parameters provide information on ecologically significant features of surface and ground water regimes influencing aquatic, wetland, and riparian ecosystems. We then assess the hydrologic perturbations associated with activities such as dam operations, flow diversion, groundwater pumping, or intensive land-use conversion by comparing measures of central tendenLy and dispersion for each parameter between user-defined "pre-impact" and "post-impact" time frames, generating 64 Indicators of Hydrologic Alteration. This method is intended for use with other ecosystem metrics in inventories of ecosystem integrity, in planning ecosystem management activities, and in setting and measuring progress toward conservation or restoration goals.
Un Metro para Evaluar Alteraciones Hidrol6gicas dentro de Ecosistemas
Resumen: Los regimenes hidrologicos juegan un papel importante en la determinacion de la composicion de la biota, la estructura y funcion de ecosistemas acudticos inundables y riparios. Sin embargo, el usa de la tierra y agua par parte del hombre estd alterando substancialmente regimenes hidrologicos. Se requieren mejores evaluaciones cuantitativas de los cambios hidrologicos inducidos par el hombre para avanzar en la investigacion de las implicaciones de la alteracion hidrologica sabre la biota y para soportar planes de manejo y restauracion del ecosistema. Proponemos un metoda para evaluar el grado de alteracion hidrologica atribuible a impactos humanos dentro de un ecosistema. Este metoda, denominado Indicadores de Alteracion Hidrologica, se basa en el ana/isis de datos hidrologicos disponibles ya sea de puntas de muestreo dentro de un ecosistema (tales como mediciones de corrientes a pozos) a generados par modelos. Utilizamos 32 pardmetros organizados en cinco grupos, para caracterizar estadisticamente la variacion hidrologica de cada ana. Estos 32 pardmetros proporcionan informacion de ·rasgos ecologicamente significativos de los regimenes de aguas superficiales y subterrdneas que influyen en ecosistemas acudticos, inundables y riparios. Se evaluaron las perturbaciones hidrologicas asociadas con actividades tales como operacion de presas, desviaci6n de flujos, bombeo de agua subterrdnea a cambios en el usa intensivo del suelo mediante la comparacion de medidas de tendencia central y dispersion para cada pardmetro, entre rangos de tiempo difini-
Paper submitted january 31, 1996; revised manuscript accepted August 14, 1996.
1163
Conservation Biology, Pages ll63-ll74 Volume 10, No.4, August 1996
1164 Assessing Hydrologic Alteration Richter et al.
dos como "pre-impacto "y "post-impacto," lo que gener6 64 Indicadores de Alteraci6n Hidrol6gica. Se pretende que este metoda sea utilizado en conjunto con ostros en inventarios de integridad de ecosistemas, en la planeaci6n de actividades de manejo de ecosistemas y en Ia definicion y medici6n de avances en las metas de conservaci6n o restauraci6n.
Introduction
A goal of ecosystem management is to sustain ecosystem integrity by protecting native biodiversity and the ecological (and evolutionary) processes that create and maintain that diversity. Faced with the complexity inherent in natural systems, achieving that goal will require that resource managers explicitly describe desired ecosystem structure, function, and variability; characterize differences between current and desired conditions; define ecologically meaningful and measurable indicators that can mark progress toward ecosystem management and restoration goals (Keddy et al. 1993); and incorporate adaptive strategies (Holling 1978) into resource management plans.
The biotic composition, structure, and function of aquatic, wetland, and riparian ecosystems depend largely on the hydrologic regime (Gorman & Karr 1978; Junket al. 1989; Poff & Ward 1990; National Research Council 1992; Sparks 1992; Mitsch & Gosselink 1993). Intra-annual variation in hydrologic conditions is essential to successful life-cycle completion for many aquatic, riparian, and wetland species; variation in these conditions often plays a major role in the population dynamics of these species through influences on reproductive success, natural disturbance, and biotic competition (Poff & Ward 1989). Modifications of hydrologic regimes can indirectly alter the composition, structure, or function of aquatic, riparian, and wetland ecosystems through their effects on physical habitat characteristics, including water temperature, oxygen content, water chemistry, and substrate particle sizes (Stanford & Ward 1979; Ward & Stanford 1983, 1989; Bain et al. 1988; Lillehammer & Saltveit 1984; Dynesius & Nilsson 1994).
Collectively, limnology research suggests that the full range of natural intra- and inter-annual variation of hydrologic regimes is necessary to sustain the native biodiversity and evolutionary potential of aquatic, riparian, and wetland ecosystems. This emerging paradigm is expressed in numerous recent statements about the necessity of protecting or restoring "natural" hydrologic regimes (National Research Council 1992; Sparks 1992; Doppelt et al. 1993; Dynesius & Nilsson 1994; Noss & Cooperrider 1994). For example, Sparks (1992) suggested that rather than optimizing water regimes for one or a few species, "a better approach is to approximate the natural flow regime that maintained . . . the entire panoply of species."
Despite the importance of natural hydrologic variation
Conservation Biology Volume 10, No.4, August 1996
in aquatic, wetland, and riparian ecosystems (Kusler & Kentula 1989; National Research Council 1992; Noss & Cooperrider 1994; Allan 1995), most ecosystem management and restoration efforts (for example, Hesse & Mestl 1993; Toth et al. 1993) have one or more shortcomings with respect to hydrology. Management decisions generally have focused on the known or perceived hydrologic requirements of only one, or at most a few, target aquatic species (Reiser et al. 1989), potentially neglecting the needs of other species and ecosystem processes an~ functions in general. For instance, the vast majority of instream flow prescriptions and water rights have been based solely upon the requirements of selected species of fish (Beecher 1990; Bishop et al. 1990; Kulik 1990; Zincone & Rulifson 1991). The range of flows needed to sustain aquatic-riparian ecosystems may be considerably greater than what would be prescribed for the aquatic system alone if the hydrologic requirements of riparian species also are considered (Hill et al. 1991). Other shortcomings include the failure to consider the influence of hydrologic processes on geomorphic changes, or on ecosystem functions such as material transport and cycling or food-web support, and the failure to consider the full range of temporal variability in hydrologic regimes.
Effective ecosystem management of aquatic, riparian, and wetland systems requires that existing hydrologic regimes be characterized using biologically relevant hydrologic parameters and that the degree to which human-altered regimes differ from natural or preferred conditions be related to the status and trends of the biota. Ecosystem management efforts should be considered experiments that test the need to maintain or restore natural characteristics of the hydrologic regime in order to sustain ecosystem integrity. Unfortunately, few limnology studies have closely examined hydrologic influences on ecosystem integrity, in part because commonly used statistical tools are poorly suited for characterizing hydrologic data into biologically relevant attributes. The lack of appropriate or robust statistical tools has in turn constrained knowledge about the effects of hydrologic alteration on ecosystem integrity. Without such knowledge, ecosystem managers will not be compelled to protect or restore natural characteristics of the hydrologic regime.
We present an approach (1) to statistically characterize the temporal variability in hydrologic regimes using biologically relevant statistical attributes, and (2) to quantify hydrologic alterations associated with pre-
Richter et al.
sumed perturbations (such as dam operations, flow diversion, or intensive conversion of land uses in a watershed) by comparing the hydrologic regimes from preimpact and post-impact time frames. We then illustrate the application of this method with a case study from the dam-altered Roanoke River in North Carolina (U.S.A). Our intent is to make available to ecosystem managers and researchers an easily utilized analytical tool for comprehensively summarizing complex hydrologic variation with biologically relevant attributes. It is not our intent to describe or predict biological responses to hydrologic alteration. Instead; we hope that this tool will facilitate investigations into the effects of hydrologic modifications on the biotic composition, structure, and function of aquatic, riparian, and wetland ecosystems.
Methods
Indicators of Hydrologic Alteration
Our general approach for hydrologic assessment is first to define a series of biologically relevant hydrologic attributes that characterize intra-annual variation in water conditions and then to use an analysis of the inter-annual variation in these attributes as the foundation for comparing hydrologic regimes before versus after a system has been altered by various human activities. Because the proposed method results in the computation of a
Assessing Hydrologic Alteration 1165
representative, multi-parameter suite of hydrologic characteristics-or indicators-for assessing hydrologic alteration, we refer to it as the Indicators of Hydrologic Alteration (IHA) method. The IHA method has four steps:
(1) Define the data series (e.g., stream gauge or well records) for pre- and post-impact periods in the ecosystem of interest.
(2) Calculate values of hydrologic attributes. We calculate values for each of 32 ecologically relevant hydrologic parameters (Table 1) for each year in each data series, i.e., one set of values for the pre-impact data series and one for the post-impact data series.
(3) Compute inter-annual statistics. We compute measures of central tendency and dispersion for the 32 parameters in each data series, based on the values calculated in step 2. This produces 64 inter-annual statistics for each data series (32 measures of central tendency and 32 measures of dispersion).
(4) Calculate values of the IHA. We compare the 64 inter-annual statistics between the pre- and post-impact data series, and we present each result as a percentage deviation of one time period (the postimpact condition) relative to the other (the preimpact condition). The method can be used to compare the state of one system to itself over time (e.g., pre- versus post-impact as just described), or it can be used to compare the state of one system to another (e.g., an altered system to a reference
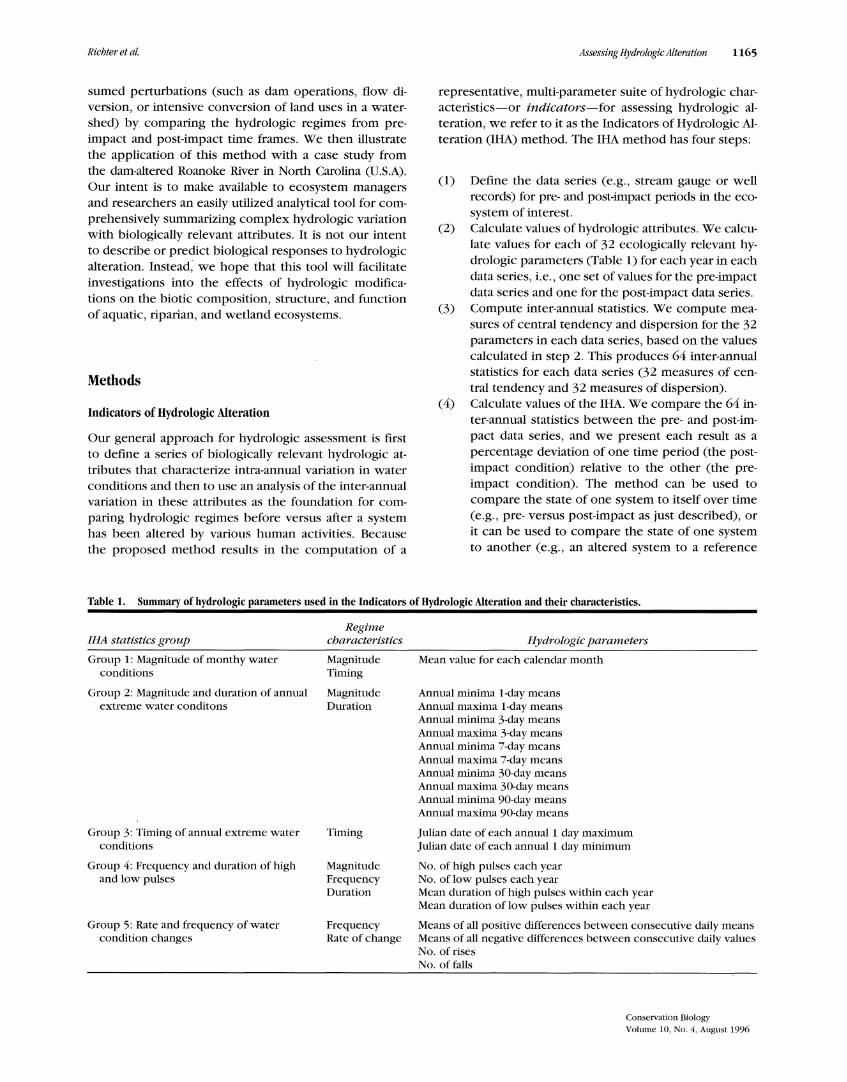
Table 1. Summary of hydrologic parameters used in the Indicators of Hydrologic Alteration and their characteristics.
IHA statistics group
Group 1: Magnitude of monthy water conditions
Group 2: Magnitude and duration of annual extreme water conditons
Group 3: Timing of annual extreme water conditions
Group 4: Frequency and duration of high and low pulses
Group 5: Rate and frequency of water condition changes
Regime characteristics
Magnitude Timing
Magnitude Duration
Timing
Magnitude Frequency Duration
Frequency Rate of change
Hydrologic parameters
Mean value for each calendar month
Annual minima 1-day means Annual maxima 1-day means Annual minima 3-day means Annual maxima 3-day means Annual minima 7-day means Annual maxima 7-day means Annual minima 30-day means Annual maxima 30-day means Annual minima 90-day means Annual maxima 90-day means
Julian date of each annual 1 day maximum Julian date of each annual 1 day minimum
No. of high pulses each year No. of low pulses each year Mean duration of high pulses within each year Mean duration of low pulses within each year
Means of all positive differences between consecutive daily means Means of all negative differences between consecutive daily values No. of rises No. of falls
Conservation Biology Volume 10, No.4, August 1996
1166 Assessing Hydrologic Alteration
system) or current conditions to simulated results based on models of future modification to a system.
The data we use in estimating all attribute values are daily mean water conditions (e.g., levels, heads, flow rates). The same computational strategies will work with any regular-interval hydrologic data, such as monthly means, but the sensitivity of the IHA method for detecting hydrologic alteration is increasingly compromised with time intervals longer than a day. Detection of certain types of hydrologic impacts, such as the rapid flow fluctuations associated with hydropower generation at dams, may require data from even shorter intervals (e.g., hourly).
Hydrologic Attributes
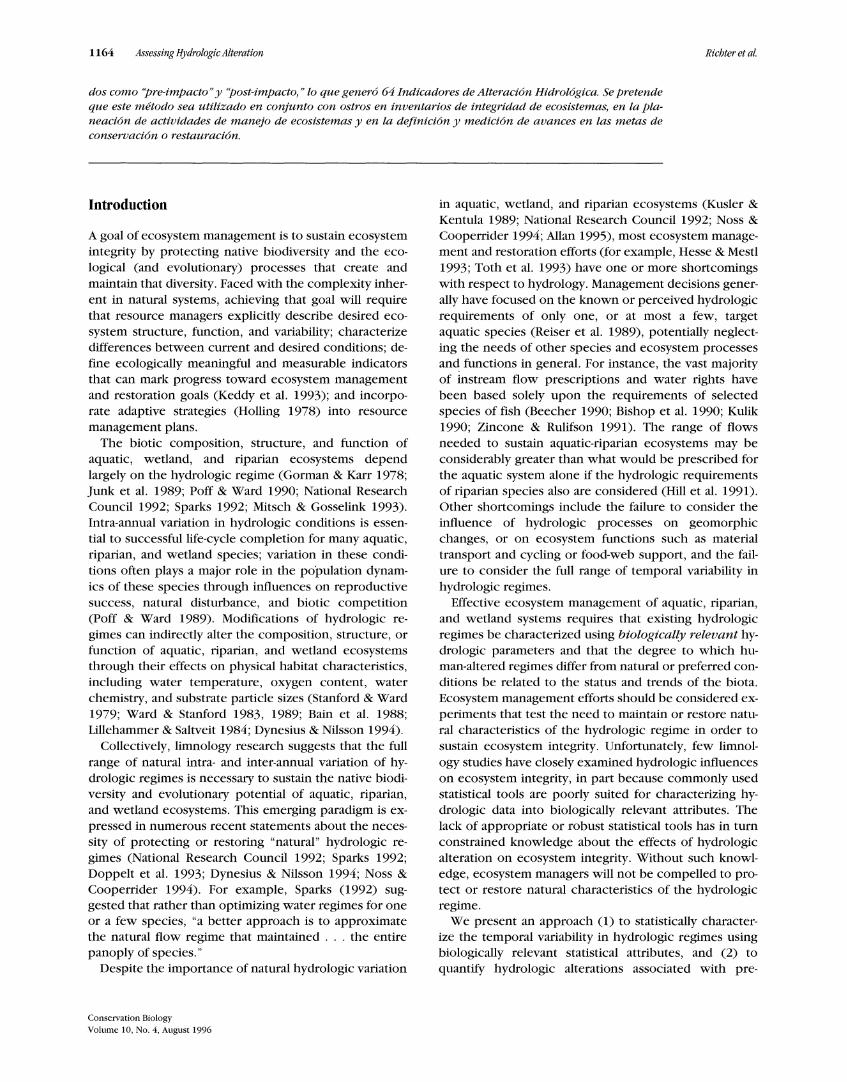
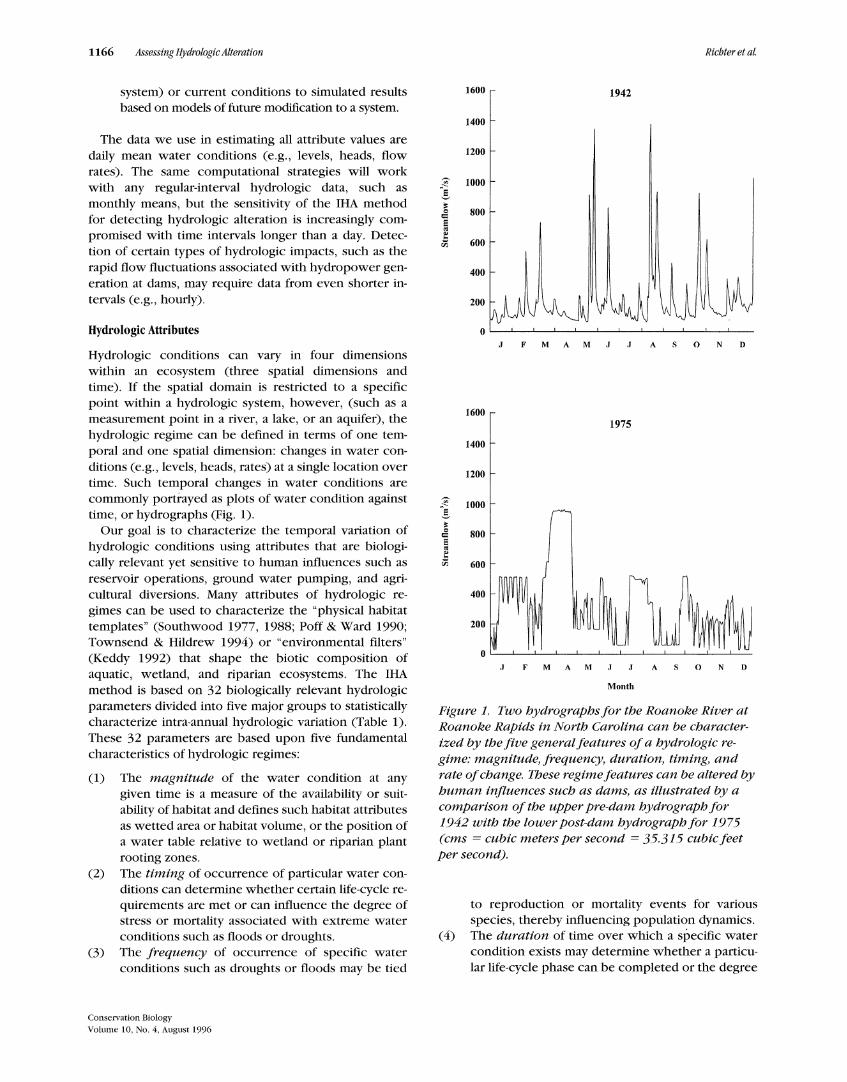
Hydrologic conditions can vary in four dimensions within an ecosystem (three spatial dimensions and time). If the spatial domain is restricted to a specific point within a hydrologic system, however, (such as a measurement point in a river, a lake, or an aquifer), the hydrologic regime can be defined in terms of one temporal and one spatial dimension: changes in water conditions (e.g., levels, heads, rates) at a single location over time. Such temporal changes in water conditions are commonly portrayed as plots of water condition against time, or hydrographs (Fig. 1).
Our goal is to characterize the temporal variation of hydrologic conditions using attributes that are biologically relevant yet sensitive to human influences such as reservoir operations, ground water pumping, and agricultural diversions. Many attributes of hydrologic regimes can be used to characterize the "physical habitat templates" (Southwood 1977, 1988; Poff & Ward 1990; Townsend & Hildrew 1994) or "environmental filters" (Keddy 1992) that shape the biotic composition of aquatic, wetland, and riparian ecosystems. The IHA method is based on 32 biologically relevant hydrologic parameters divided into five major groups to statistically characterize intra-annual hydrologic variation (Table 1). These 32 parameters are based upon five fundamental characteristics of hydrologic regimes:
(1) The magnitude of the water condition at any given time is a measure of the availability or suitability of habitat and defines such habitat attributes as wetted area or habitat volume, or the position of a water table relative to wetland or riparian plant rooting zones.
(2) The timing of occurrence of particular water conditions can determine whether certain life-cycle requirements are met or can influence the degree of stress or mortality associated with extreme water conditions such as floods or droughts.
(3) The frequency of occurrence of specific water conditions such as droughts or floods may be tied
Conservation Biology Volume 10, No.4, August 1996
Richter et al.
1600 1942
1400
1200
;!!!- 1000 5 ~ 0 800 <= Ei " " ... lil 600
400
200
0 J F M A M ,J ,J A s 0 N D
1600 1975
1400
1200
"~ 1000 5 ~ 0 800 = Ei " " ... lil 600
400
.I F M A M .I .J A S 0 N D
Month
Figure 1. Two hydro graphs for the Roanoke River at Roanoke Rapids in North Carolina can be characterized by the five general features of a hydrologic regime: magnitude, frequency, duration, timing, and rate of change. These regime features can be altered by human influences such as dams, as illustrated by a comparison of the upper pre-dam hydro graph for 1942 with the lower post-dam hydrograph for 1975 (ems = cubic meters per second = 35.315 cubic feet per second).
to reproduction or mortality events for various species, thereby influencing population dynamics.
( 4) The duration of time over which a specific water condition exists may determine whether a particular life-cycle phase can be completed or the degree
Richter et at.
to which stressful effects such as inundation or desiccation can accumulate.
(5) The rate of change in water conditions may be tied to the stranding of certain organisms along the water's edge or in ponded depressions, or the ability of plant roots to maintain contact with phreatic water supplies.
The 32 IHA parameters provide a detailed representation of the hydrologic regime for the purpose of assessing hydrologic alteration. Most important, they entail hydrologic statistics commonly employed in limnology studies because of their great ecological relevance (Custard 1984; Kozlowski 1984; Hughes & James 1989; Poff & Ward 1989). Also, because certain streamflow levels shape physical habitat conditions within river channels, we also identified 32 hydrologic characteristics that might aid in detection of physical habitat alteration in lotic systems. For example, changes in the central tendency of annual maxima might suggest changes in river morphology (Leopold 1994).
Sixteen of the hydrologic characteristics focus on the magnitude, duration, timing, and frequency of extreme events because of the pervasive influence of extreme forces in ecosystems (Gaines & Denny 1993) and geomorphology (Leopold 1994); the other 16 parameters measure the central tendency of either the magnitude or rate of change of water conditions. We describe the rationale underlying the five major grouping of hydrologic characteristics and the specific parameters included within each.
1. MAGNITUDE
This group includes 12 parameters, each of which measures the central tendency (mean) of the daily water conditions for a given month. The monthly mean of the daily water conditions describes "normal" daily conditions for the month, and thus provides a general measure of habitat availability or suitability. The similarity of monthly means within a year reflects conditions of relative hydrologic constancy, whereas inter-annual variation (e.g., coefficient of variation) in the mean water condition for a given month provides an expression of environmental contingency (Colwell 1974; Poff & Ward 1989). The terms constancy and contingency as used here refer to the degree to which monthly means vary from month to month (constancy) and the extent to which flows vary within any given month ( contingency).
2. MAGNITUDE AND DURATION OF ANNUAL EXTREME CONDITIONS
The 10 parameters in this group measure the magnitude of extreme (minimum and maximum) annual water conditions of various duration, ranging from daily to seasonal. The durations we used follow natural or human-
Assessing Hydrologic Alteration 1167
imposed cycles and include the 1-day, 3-day, 7-day (weekly), 30-day (monthly), and 90-day (seasonal) extremes. For any given year, the 1-day maximum (or minimum) is represented by the highest (or lowest) single daily value occurring during the year; the multi-day maximum (or minimum) is represented by the highest (or lowest) multi-day average value occurring during the year. The mean magnitude of high and low water extremes of various duration provide measures of environmental stress and disturbance during the year; conversely, such extremes may be necessary precursors or triggers for the reproduction of certain species. The inter-annual variation (e.g., coefficient of variation) in the magnitude of these extremes provides another expression of contingency.
3. TIMING OF ANNUAL EXTREME CONDITIONS
Group 3 includes two parameters, one measuring the Julian date of the 1-day annual minimum water condition and the other measuring the Julian date of the 1-day maximum water condition. The timing of the highest and lowest water conditions within annual cycles provides another measure of environmental disturbance or stress by describing the seasonal nature of these stresses. Key life-cycle phases (e.g., reproduction) may be intimately linked to the timing of annual extremes; thus human-induced changes in timing may cause reproductive failure, stress, or mortality. The inter-annual variation in timing of extreme events reflects environmental contingency.
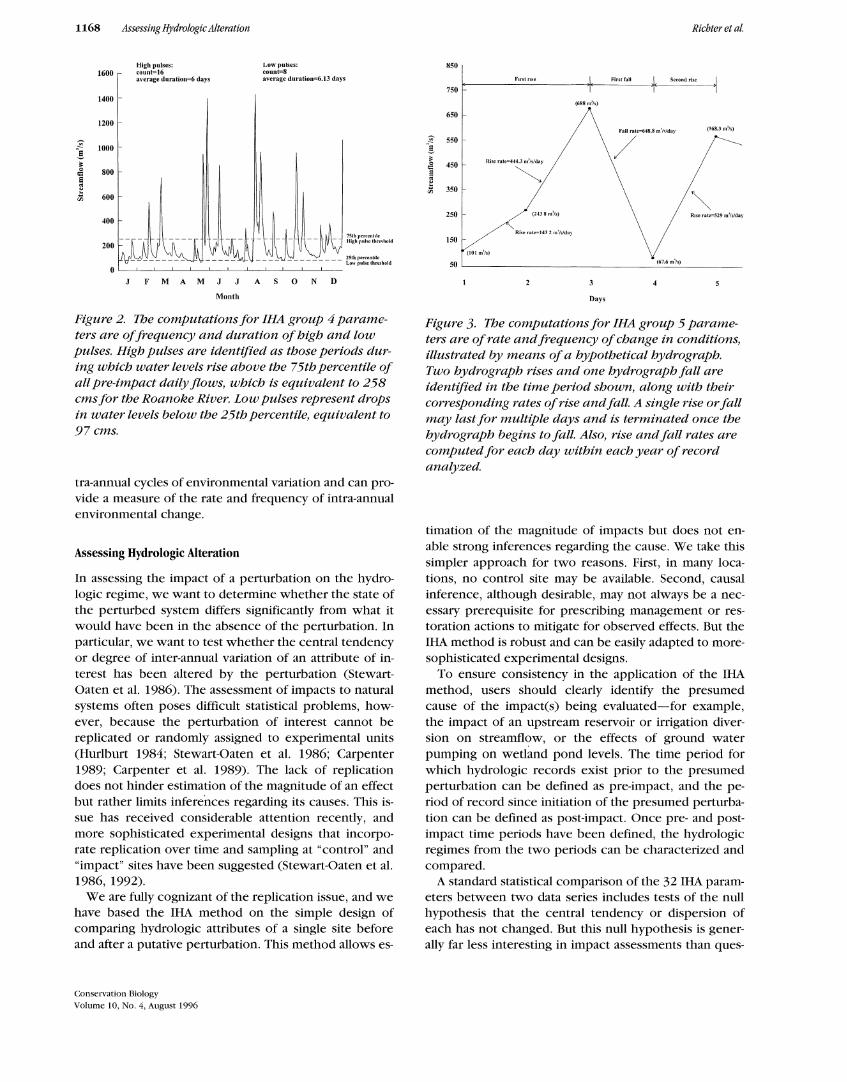
4. FREQUENCY AND DURATION OF HIGH AND LOW PULSES
The four parameters in group 4 include two that measure the number of annual occurrences during which the magnitude of the water condition exceeds an upper threshold or remains below a lower threshold, respectively, and two that measure the mean duration of such high and low pulses (Fig. 2). These measures of frequency and duration of high and low water conditions together portray the pulsing behavior of environmental variation within a year and provide measures of the shape of these environmental pulses. Hydrologic pulses are defined here as those periods within a year in which the daily mean water condition either rises above the 75th percentile (high pulse) or drops below the 25th percentile (low pulse) of all daily values for the preimpact time period.
5. RATE AND FREQUENCY OF CHANGE IN CONDITIONS
The four parameters in group 5 measure the number and mean rate of both positive and negative changes in water conditions from one day to the next (Fig. 3). The rate and frequency of change in water conditions can be described in terms of the abmptness and number of in-
Conservation Biology Volume 10, No.4, August 1996
1168
1600
1400
1200
i 1000
~ 800 c e ~
~ u; 600
400
200
Assessing Hydrologic Alteration
High pulses: count=16 average duration=6 days
Low pulses: count=8 average duration=-6.13 days
JFMAMJJASOND
Month
7Sthperccllhle High pul~e lhre-;hold
Figure 2. The computations for IHA group 4 parameters are of frequency and duration of high and low pulses. High pulses are identified as those periods during which water levels rise above the 75th percentile of all pre-impact daily flows, which is equivalent to 258 ems for the Roanoke River. Low pulses represent drops in water levels below the 25th percentile, equivalent to 97 ems.
tra-annual cycles of environmental variation and can provide a measure of the rate and frequency of intra-annual environmental change.
Assessing Hydrologic Alteration
In assessing the impact of a perturbation on the hydrologic regime, we want to determine whether the state of the perturbed system differs significantly from what it would have been in the absence of the perturbation. In particular, we want to test whether the central tendency or degree of inter-annual variation of an attribute of interest has been altered by the perturbation (StewartOaten et al. 1986). The assessment of impacts to natural systems often poses difficult statistical problems, however, because the perturbation of interest cannot be replicated or randomly assigned to experimental units (Hurlburt 1984; Stewart-Oaten et al. 1986; Carpenter 1989; Carpenter et al. 1989). The lack of replication does not hinder estimation of the magnitude of an effect but rather limits inferences regarding its causes. This issue has received considerable attention recently, and more sophisticated experimental designs that incorporate replication over time and sampling at "control" and "impact" sites have been suggested (Stewart-Oaten et al. 1986, 1992).
We are fully cognizant of the replication issue, and we have based the IHA method on the simple design of comparing hydrologic attributes of a single site before and after a putative perturbation. This method allows es-
Conservation Biology Volume 10, No.4, August 1996
Richter et al.
H50
fi1rstnse
750
(688m"!s)
650
Fall rate=648.8 m '!~/day (568.3m'/s)
i 550
s 450 "' ~ ~
Rise rate=444.3 m'/.o;/day
~ /
"' 350
250 (2438m'/s) Rl.1e rate=529 nf'/s/day
ltiserale=l432 m'/s/d<l)
!50
(lOlm'/s)
soL_ __________________________ ~'"~·'~m'l~>) ________ ~
Days
Figure 3. The computations for IHA group 5 parameters are of rate and frequency of change in conditions, illustrated by means of a hypothetical hydro graph. Two hydrograph rises and one hydro graph fall are identified in the time period shown, along with their corresponding rates of rise and fall. A single rise or fall may last for multiple days and is terminated once the hydro graph begins to fall. Also, rise and fall rates are computed for each day within each year of record analyzed.
timation of the magnitude of impacts but does not enable strong inferences regarding the cause. We take this simpler approach for two reasons. First, in many locations, no control site may be available. Second, causal inference, although desirable, may not always be a necessary prerequisite for prescribing management or restoration actions to mitigate for observed effects. But the IHA method is robust and can be easily adapted to moresophisticated experimental designs.
To ensure consistency in the application of the IHA method, users should clearly identify the presumed cause of the impact(s) being evaluated-for example, the impact of an upstream reservoir or irrigation diversion on streamflow, or the effects of ground water pumping on wetland pond levels. The time period for which hydrologic records exist prior to the presumed perturbation can be defined as pre-impact, and the period of record since initiation of the presumed perturbation can be defined as post-impact. Once pre- and postimpact time periods have been defined, the hydrologic regimes from the two periods can be characterized and compared.
A standard statistical comparison of the 32 IHA parameters between two data series includes tests of the null hypothesis that the central tendency or dispersion of each has not changed. But this null hypothesis is generally far less interesting in impact assessments than ques-
Richter et al.
HUUU Pre-dam: 1913-1949 Post-dam: 1956-1991
7000
..,2 .§. 6000 g "' ! 5000
s 4000
.§ ~ 3000
; § 2000
"' 1000
0~--~~--~~--~~--~--~~--------------1915 1925 1935 1945 1955 1965 1975 1985
1920 1930 1940 1950 1960 1970 1980 1990
Year
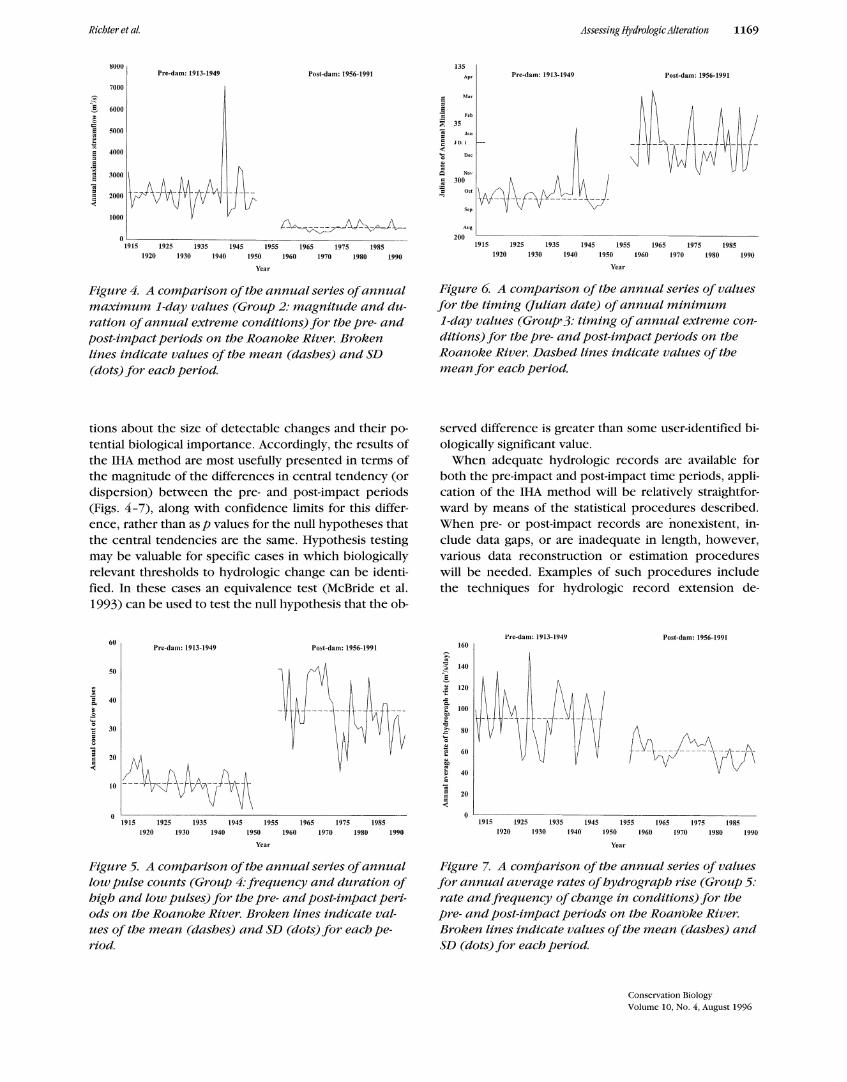
Figure 4. A comparison of the annual series of annual maximum 1-day values (Group 2: magnitude and duration of annual extreme conditions) for the pre- and post-impact periods on the Roanoke River. Broken lines indicate values of the mean (dashes) and SD (dots) for each period.
tions about the size of detectable changes and their potential biological importance. Accordingly, the results of the IHA method are most usefully presented in terms of the magnitude of the differences in central tendency (or dispersion) between the pre- and post-impact periods (Figs. 4-7), along with confidence limits for this difference, rather than asp values for the null hypotheses that the central tendencies are the same. Hypothesis testing may be valuable for specific cases in which biologically relevant thresholds to hydrologic change can be identified. In these cases an equivalence test (McBride et al. 1993) can be used to test the null hypothesis that the ob-
60 Pre-dam: 1913-1949 Post-dam: 1956-1991
50
-3 40 "' ~ "0 = 30
= 8 ;; = 20 = ~
10
1915 1925 1935 1945 1955 1965 1975 1985 1920 1930 1940 1950 1960 1970 1980 1990
Year
Figure 5. A comparison of the annual series of annual low pulse counts (Group 4: frequency and duration of high and low pulses) for the pre- and post-impact periods on the Roanoke River. Broken lines indicate values of the mean (dashes) and SD (dots) for each period.
Assessing Hydrologic Alteration 1169
135
Ap• Pre-dam: 1913-1949
F,b
35
Aug
200 1915 1925 1935 1945 1955 1965 1975 1985
1920 1930 1940 1950 1960 1970 1980 1990
Year
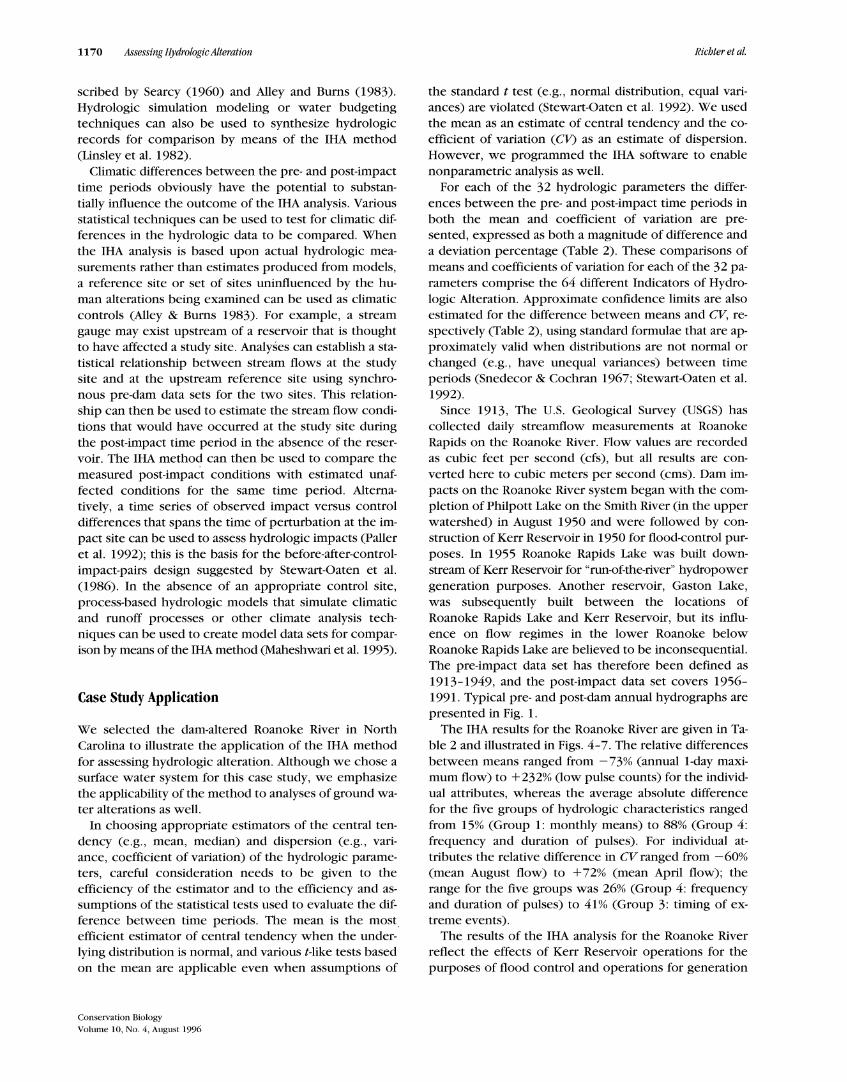
Figure 6. A comparison of the annual series of values for the timing (fulian date) of annual minimum 1-day values (Group·3: timing of annual extreme conditions) for the pre- and post-impact periods on the Roanoke River. Dashed lines indicate values of the mean for each period.
served difference is greater than some user-identified biologically significant value.
When adequate hydrologic records are available for both the pre-impact and post-impact time periods, application of the IHA method will be relatively straightforward by means of the statistical procedures described. When pre- or post-impact records are nonexistent, include data gaps, or are inadequate in length, however, various data reconstmction or estimation procedures will be needed. Examples of such procedures include the techniques for hydrologic record extension de-
Pre-dam: 1913-1949 Post-dam: 1956-1991 160
~
I 140
M 120
'" ~ ~ 100
e -
"' £ 80 ~ 0
~ 60
t 40 ~ . = 20 §
"' 1915 1925 1935 1945 1955 1965 1975 1985
1920 1930 1940 1950 1960 1970 1980 1990
Year
Figure 7. A comparison of the annual series of values for annual average rates of hydro graph rise (Group 5: rate and frequency of change in conditions) for the pre- and post-impact periods on the Roanoke River. Broken lines indicate values of the mean (dashes) and SD (dots) for each period.
Conservation Biology Volume 10, No.4, August 1996
1170 Assessing Hydrologic Alteration
scribed by Searcy (1960) and Alley and Burns (1983). Hydrologic simulation modeling or water budgeting techniques can also be used to synthesize hydrologic records fot comparison by means of the IHA method (Linsley et al. 1982).
Climatic differences between the pre- and post-impact time periods obviously have the potential to substantially influence the outcome of the IHA analysis. Various statistical techniques can be used to test for climatic differences in the hydrologic data to be compared. When the IHA analysis is based upon actual hydrologic measurements rather than estimates produced from models, a reference site or set of sites uninfluenced by the human alterations being examined can be used as climatic controls (Alley & Burns 1983). For example, a stream gauge may exist upstream of a reservoir that is thought to have affected a study site. Analyses can establish a statistical relationship between stream flows at the study site and at the upstream reference site using synchronous pre-dam data sets for the two sites. This relationship can then be used to estimate the stream flow conditions that would have occurred at the study site during the post-impact time period in the absence of the reservoir. The IHA method can then be used to compare the measured post-impact conditions with estimated unaffected conditions for the same time period. Alternatively, a time series of observed impact versus control differences that spans the time of perturbation at the impact site can be used to assess hydrologic impacts (Paller et al. 1992); this is the basis for the before-after-controlimpact-pairs design suggested by Stewart-Oaten et al. (1986). In the absence of an appropriate control site, process-based hydrologic models that simulate climatic and runoff processes or other climate analysis techniques can be used to create model data sets for comparison by means of the IHA method (Maheshwari et al. 1995).
Case Study Application
We selected the dam-altered Roanoke River in North Carolina to illustrate the application of the IHA method for assessing hydrologic alteration. Although we chose a surface water system for this case study, we emphasize the applicability of the method to analyses of ground water alterations as well.
In choosing appropriate estimators of the central tendency (e.g., mean, median) and dispersion (e.g., variance, coefficient of variation) of the hydrologic parameters, careful consideration needs to be given to the efficiency of the estimator and to the efficiency and assumptions of the statistical tests used to evaluate the difference between time periods. The mean is the most efficient estimator of central tendency when the underlying distribution is normal, and various t-like tests based on the mean are applicable even when assumptions of
Conservation Biology Volume 10, No.4, August 1996
Richter et at.
the standard t test (e.g., normal distribution, equal variances) are violated (Stewart-Oaten et al. 1992). We used the mean as an estimate of central tendency and the coefficient of variation ( CV) as an estimate of dispersion. However, we programmed the IHA software to enable nonparametric analysis as well.
For each of the 32 hydrologic parameters the differences between the pre- and post-impact time periods in both the mean and coefficient of variation are presented, expressed as both a magnitude of difference and a deviation percentage (Table 2). These comparisons of means and coefficients of variation for each of the 32 parameters comprise the 64 different Indicators of Hydrologic Alteration. Approximate confidence limits are also estimated for the difference between means and CV, respectively (Table 2), using standard formulae that are approximately valid when distributions are not normal or changed (e.g., have unequal variances) between time periods (Snedecor & Cochran 1967; Stewart-Oaten et al. 1992).
Since 1913, The U.S. Geological Survey (USGS) has collected daily streamflow measurements at Roanoke Rapids on the Roanoke River. Flow values are recorded as cubic feet per second (cfs), but all results are converted here to cubic meters per second (ems). Dam impacts on the Roanoke River system began with the completion of Philpott Lake on the Smith River (in the upper watershed) in August 1950 and were followed by construction of Kerr Reservoir in 1950 for flood-control purposes. In 1955 Roanoke Rapids Lake was built downstream of Kerr Reservoir for "run-of-the-river" hydropower generation purposes. Another reservoir, Gaston Lake, was subsequently built between the locations of Roanoke Rapids Lake and Kerr Reservoir, but its influence on flow regimes in the lower Roanoke below Roanoke Rapids Lake are believed to be inconsequential. The pre-impact data set has therefore been defined as 1913-1949, and the post-impact data set covers 1956-1991. Typical pre- and post-dam annual hydrographs are presented in Fig. 1.
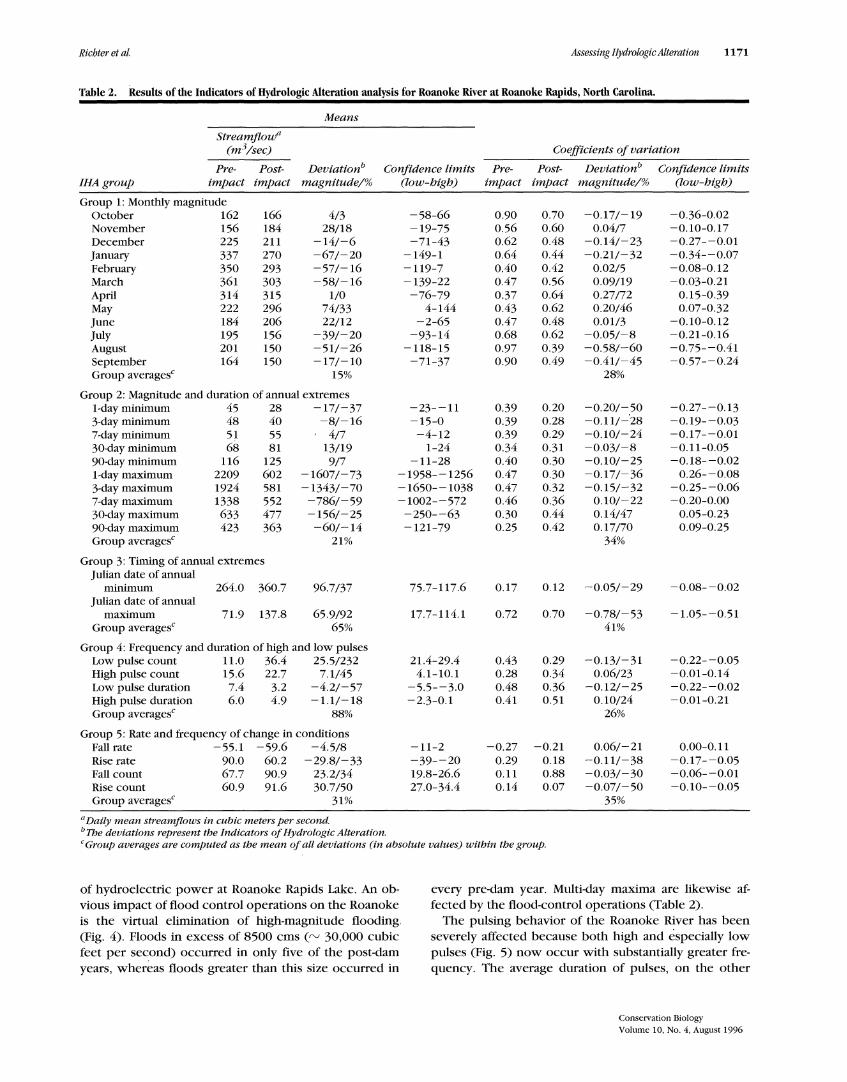
The IHA results for the Roanoke River are given in Table 2 and illustrated in Figs. 4-7. The relative differences between means ranged from -73% (annual 1-day maximum flow) to +232% (low pulse counts) for the individual attributes, whereas the average absolute difference for the five groups of hydrologic characteristics ranged from 15% (Group 1: monthly means) to 88% (Group 4: frequency and duration of pulses). For individual attributes the relative difference in CV ranged from -60% (mean August flow) to +72% (mean April flow); the range for the five groups was 26% (Group 4: frequency and duration of pulses) to 41% (Group 3: timing of extreme events).
The results of the IHA analysis for the Roanoke River reflect the effects of Kerr Reservoir operations for the purposes of flood control and operations for generation
Richter et al. Assessing Hydrologic Alteration 1171
Table 2. Results of the Indicators of Hydrologic Alteration analysis for Roanoke River at Roanoke Rapids, North Carolina.
Means
Streamjlowa (m 3/sec) Coefficients of variation
Pre- Post- Deviationb Confidence limits Pre- Post- Deviationb Confidence limits IHAgroup impact impact magnitude/% (low-high) impact impact magnitude/% (low-high)
Group 1: Monthly magnitude October 162 166 4/3 -58-66 0.90 0.70 -0.17/-19 -0.36-0.02 November 156 184 28/18 -19-75 0.56 0.60 0.04/7 -0.10-0.17 December 225 211 -14/-6 -71-43 0.62 0.48 -0.14/-23 -0.27--0.01 January 337 270 -67!-20 -149-1 0.64 0.44 -0.21/-32 -0.34--0.07 February 350 293 -57/-16 -119-7 0.40 0.42 0.02/5 -0.08-0.12 March 361 303 -58/-16 -139-22 0.47 0.56 0.09/19 -0.03-0.21 April 314 315 1/0 -76-79 0.37 0.64 0.27/72 0.15-0.39 May 222 296 74/33 4-144 0.43 0.62 0.20!46 0.07-0.32 June 184 206 22/12 -2-65 0.47 0.48 0.01/3 -0.10-0.12 July 195 156 -39/-20 -93-14 0.68 0.62 -0.05/-8 -0.21-0.16 August 201 150 -51!-26 -118-15 0.97 0.39 -0.58!-60 -0.75--0.41 September 164 150 -17/-10 -71-37 0.90 0.49 -0.41/-45 -0.57--0.24 Group averagesc 15% 28%
Group 2: Magnitude and duration of annual extremes 1-day minimum 45 28 -17/-37 -23--11 0.39 0.20 -0.20/-50 -0.27--0.13 3-day minimum 48 40 -8/-16 -15-0 0.39 0.28 -0.11/-.28 -0.19--0.03 7-day minimum 51 55 417 -4-12 0.39 0.29 -0.10/-24 -0.17--0.01 30-day minimum 68 81 13/19 1-24 0.34 0.31 -0.03/-8 -0.11-0.05 90-day minimum 116 125 917 -11-28 0.40 0.30 -0.10/-25 -0.18--0.02 1-day maximum 2209 602 -1607/-73 -1958--1256 0.47 0.30 -0.17/-36 0.26--0.08 3-day maximum 1924 581 -1343/-70 -1650--1038 0.47 0.32 -0.15/-32 -0.25--0.06 7-day maximum 1338 552 -786!-59 -1002--572 0.46 0.36 0.10/-22 -0.20-0.00 30-day maximum 633 477 -156/-25 -250--63 0.30 0.44 0.14/47 0.05-0.23 90-day maximum 423 363 -60/-14 -121-79 0.25 0.42 0.17/70 0.09-0.25 Group averagesc 21% 34%
Group 3: Timing of annual extremes Julian date of annual
minimum 264.0 360.7 96.7!37 75.7-117.6 0.17 0.12 -0.05/-29 -0.08--0.02 Julian date of annual
maximum 71.9 137.8 65.9/92 17.7-114.1 0.72 0.70 -0.78/-53 -1.05--0.51 Group averagesc 65% 41%
Group 4: Frequency and duration of high and low pulses Low pulse count 11.0 36.4 25.5/232 21.4-29.4 0.43 0.29 -0.13/-31 -0.22--0.05 High pulse count 15.6 22.7 7.1/45 4.1-10.1 0.28 0.34 0.06/23 -0.01-0.14 Low pulse duration 7.4 3.2 -4.2!-57 -5.5--3.0 0.48 0.36 -0.12/-25 -0.22--0.02 High pulse duration 6.0 4.9 -1.1!-18 -2.3-0.1 0.41 0.51 0.10/24 -0.01-0.21 Group averagesc 88% 26%
Group 5: Rate and frequency of change in conditions Fall rate -55.1 -59.6 -4.5/8 -11-2 -0.27 -0.21 0.06/-21 0.00-0.11 Rise rate 90.0 60.2 -29.8/-33 -39--20 0.29 0.18 -0.11/-38 -0.17--0.05 Fall count 67.7 90.9 23.2/34 19.8-26.6 0.11 0.88 -0.03/-30 -0.06--0.01 Rise count 60.9 91.6 30.7/50 27.0-34.4 0.14 0.07 -0.07!-50 -0.10--0.05 Group averagesc 31% 35%
a Daily mean streamjlows in cubic meters per second. b The deviations represent the Indicators of Hydrologic Alteration. cGroup averages are computed as the mean of all deviations (in absolute values) within the group.
of hydroelectric power at Roanoke Rapids Lake. An obvious impact of flood control operations on the Roanoke is the virtual elimination of high-magnitude flooding. (Fig. 4). Floods in excess of 8500 ems ("-' 30,000 cubic feet per second) occurred in only five of the post-dam years, whereas floods greater than this size occurred in
every pre-dam year. Multi-day maxima are likewise affected by the flood-control operations (Table 2).
The pulsing behavior of the Roanoke River has been severely affected because both high and especially low pulses (Fig. 5) now occur with substantially greater frequency. The average duration of pulses, on the other
Conservation Biology Volume 10, No.4, August 1996
1172 Assessing Hydrologic Alteration
hand, is much shorter in the post-dam period. This is a byproduct of hydropower generation, wherein water is stored in the reservoir until sufficient head is attained to generate power efficiently, at which time it is rapidly released through the dam turbines. The effect on the hydrologic regime is to create a greater frequency of high and low pulses of lesser duration (Group 4: frequency and duration of high and low pulses) and also to increase the number of hydrograph rises and falls (Group 5: rate and frequency of change in water conditions).
The magnitude and timing of the annual minima have changed, with a shift from higher fall season to lower mid-winter annual lows (Fig. 6). This probably results from attempts to capture winter flows for later spring and summer use in hydropower generation.
Surprisingly, the average hydrograph rise rate (Group 5: rate and frequency of change, Fig. 7) for the Roanoke is reduced from the pre-darn period. Typically, areas downstream of hydropower dams experience steeper hydrograph rises because of the rapid release of water from the reservoir during peaking power generation. The apparent reduction in rise rates on the Roanoke is probably due to the fact that flow releases seldom exceed 566 ems (20,000 cfs), which corresponds to turbine capacity limits. In the pre-dam period, flows commonly rose more than 1132 ems (40,000 cfs) in a single day during rainstorms.
Changes in the variability ofthe 32 IRA parameters are also evident (Table 2; Figs. 4-7). In general, variability has been reduced in summer and winter monthly means, in extremely low water conditions, in timing of the annual highs and lows, in high and low pulse durations, and in frequency and rate of hydrograph rises and falls. On the other hand, coefficients of variation increased for springtime monthly means and long duration (e.g., 30- and 90-day), high flow magnitudes.
Dam-related alterations to the Roanoke flow regime have been blamed for the drastic reduction of striped bass populations (Zincone & Rulifson 1991). Higher average streamflows in the spring months (May-June) have been associated with less successful rates of juvenile bass recruitment. Aquatic invertebrates inhabiting the littoral zone along the river's edge may be severely affected by the greater frequency of hydrograph pulses, rises, and falls. Rapidly reversing cycles of wetting and drying have been shown to decimate littoral-zone benthic fauna unable to migrate with the shifting river edge (Armitage 1984; Walker et al. 1992; Moog 1993). Such losses of benthic fauna may be substantially reducing the availability of prey for the Roanoke's fishes.
Altered flood patterns may lead to significant alterations in the composition and structure of the Roanoke's bottomland hardwood forest by changing the magnitude and duration of floods (Lea 1991; Richter 1993). This forest has been heralded as being the "highest quality and most extensive" bottomland hardwood forest on the
Conservation Biology
Volume 10, No.4, August 1996
Richter et at.
southeastern coastal plain (Lynch 1991). The different plant species and floodplain forest communities along the Roanoke are thought to be. distributed along a gradient of inundation duration (or anoxic stress). With the elimination of high-magnitude flooding, higher floodplain surfaces are now seldom if ever inundated, enabling less flood tolerant species to become established on lower sites, and thus lowering overall vegetation diversity. Changes in the forest could also have serious implications for Neotropical migratory birds using this area (Zeller 1993).
Using the IHA Method
During development of the IRA method, a longer list of statistical parameters was consolidated to minimize the number of computations and to reduce redundancy; at the same time we retained as much sensitivity to different forms of hydrologic alteration as possible. The 32 IRA parameters appear to be robust in their ability to quantitatively describe alterations peculiar to specific human influences such as flood control. We also considered aggregating the results across each of the five groups of hydrologic characteristics. Users must bear in mind, however, the risk of losing information when relative differences are averaged across parameters within IRA groups (Suter 1993). We strongly recommend that IRA results be presented in the full scorecard format as shown in Table 2 to retain information about the specific hydrologic alterations associated with the perturbation under investigation. Reporting the full suite of hydrologic parameters also enables investigators to explore relationships between individual parameters and biotic responses.
This caution about lumping hydrologic parameters into IRA groups and averaging results within groups should not inhibit exploration of the relationship between overall group averages and specific types of human influences such as reservoir operations, groundwater pumping, timber harvest, or urbanization. Such integrative analysis is urgently needed to enable ecosystem managers to better assess or anticipate the effects of certain land and water uses. The sensitivity and robustness of individual IRA parameters and IRA groups to a wide range of human influences in different ecoregional settings remains to be tested.
The U.S. Clean Water Act Amendments of 1972 (PL 92-500) called for the restoration and maintenance of the "chemical, physical, and biological integrity of the nation's waters." Increased use of analytical methods such as the IRA will demonstrate how far we have to go toward restoring the physical integrity of U.S. rivers, lakes, and aquifers. We .anticipate that the IRA method will be used in conjunction with other ecC>system metrics that evaluate more directly the biological conditions and ecological degradation within an ecosystem, such as
Richter et at.
the Index of Biotic Integrity (Karr 1991, 1993). Other authors (Karr 1991, 1993; Keddy et al. 1993; Minshall 1993) have emphasized the importance of using a multiparameter suite of metrics to assess ecosystem integrity because it is unlikely that any one metric will be sufficiently sensitive to be useful under all circumstances.
As illustrated by our case study, the IRA method is extremely useful in drawing attention to aspects of a hydrologic regime altered by various types of human influences such as dams and ground water pumping. Elucidation of hydrologic alterations alone, however, says little about the nature or degree to which biologic patterns and processes may degrade in response to such alterations. The tough work of interpreting and documenting species- or community-specific responses to hydrologic changes remains. By revealing the direction and magnitude of hydrologic alterations, the IRA method will aid ecological researchers in formulating hypotheses about the hydrologic causes of various forms of ecosystem modification. For example, the IRA results for the Roanoke River direct our attention to assessing the effects of dam operations on fish populations, littoral-zone benthic fauna, and floodplain forest communities.
The IRA method should also prove useful in the design of ecological restoration programs. On the Roanoke River, for example, dam-altered flow regimes have been implicated in various forms of ecosystem degradation. Based on the IRA results (Table 2), restoration hypotheses should be directed at the expected biotic responses to increased frequencies of high-magnitude flooding, reductions in the frequency of high and low pulses, reductions in the frequency of hydrograph reversals between rising and falling river periods, and shifts in the annual minimum flows from winter back to the fall season. Programs to monitor the response to hydrologic restoration could follow two strategies: (1) continue to characterize the hydrologic regime using the IRA method, in order to look for expected decreases in the before and after deviations in IRA groups, and (2) directly monitor the status of the targeted biota. Both the hydrologic restoration strategy and the biomonitoring program could be continually refined as we learn about the system.
The utility of the IRA method for designing hydrologic restoration strategies or for assessing potential hydrologic effects associated with various water development proposals will be limited unless hydrologic simulation models can be used to create synthesized records of daily streamflow or water table fluctuations under future climate or development scenarios. If potential hydrologic conditions can be simulated using such models, these conditions could then be compared with existing conditions (actual hydrologic measurements or simulation of current conditions) by means of the IRA method .. Management decisions could then be based upon the IRA's elucidation of hydrologic regime changes likely to be associated with alternative management scenarios.
Assessing Hydrologic Alteration 1173
Software Availability and Acknowledgments
The software program developed for computing IRA parameter values and deviations is available by written request from Smythe Scientific Software, 2060 Dartmouth, Boulder, CO 80303, U.S.A., or by phone at (303) 499-0222. Chuck Smythe of Smythe Scientific Software provided all computer programming of the IRA analyses. Andrew Wilcox conducted a literature review of other ecosystem metrics that greatly aided the development of this paper. Hydrologic data were accessed via the "HydroData" system distributed by Hydrosphere, Inc. Invaluable reviews of this paper were provided by P. Angermeier, G. Auble,]. Friedman,]. Harrison, S. Johnson, ]. Karr, S. Pearsall, N. L. Poff, D. Salzer,]. Stromberg, R. Unnasch, K. Walker, R. Wigington, D. Wilber, and A. Wilcox, and two anonymous reviewers.
Literature Cited
Allan,]. D. 1995. Stream ecology: Stmcture and function of mnning waters. Chapman and Hall, London.
Alley, W. M., and A. W. Bums. 1983. Mixed-station extension of monthly streamflow records. Journal of Hydraulic Engineering 109: 1272-1284.
Armitage, P. D. 1984. Environmental changes induced by stream regu· lation and their effect on !otic macroinvertebrate communities. Pages 139-165 in A. Lillehammer and S.]. Saltveit, editors. Regu· lated rivers. Universitetsforlaget As, Oslo.
Bain, M. B.,]. T. Finn, and H. E. Brooke. 1988. Streamflow regulation and fish community stmcture. Ecology 69:382-392.
Beecher, H. A. 1990. Standards for instream flows. Rivers 1:97-109. Bishop, A. B., T. B. Hardy, and B. D. Glabou. 1990. Analyzing instream
flow tmde-offs for small hydropower development. Rivers 1:173-182. Carpenter, S. R. 1989. Replication and treatment strength in whole
lake experiments. Ecology 70:453-463. Carpenter, S. R.i T. M. Frost, D. Heisey, and T. K. Kratz. 1989. Random
ized intervention analysis and the interpretation of whole-ecosystem experiments. Ecology 70:1142-1152.
Colwell, R. K. 1974. Predictability, constancy, and contingency of periodic phenomena. Ecology 55:1148-1153.
Doppelt, B., M. Scurlock, C. Frissell, and]. Karr. 1993. Entering the watershed: A new approach to save America's river ecosystems. Island Press, Washington, D.C.
Dynesius, M., and C. Nilsson. 1994. Fragmentation and flow regulation of river systems in the northern third of the world. Science 266:753-762.
Gaines, S. D., and M. W. Denny. 1993. The largest, smallest, highest, lowest, longest, and shortest: extremes in ecology. Ecology 74: 1677-1692.
Gorman, G. T., and ]. R. Karr. 1978. Habitat stmcture and stream fish communities. Ecology 59:507-515.
Gustard, A. 1984. The characterisation of flow regimes for assessing the impact of water resource management on river ecology. Pages 53-60 in A. Lillehammer and S.]. Saltveit, editors. Regulated rivers. Universitetsforlaget As, Oslo.
Hesse, L. W., and G. E. Mestl. 1993. An alternative hydrograph for the Missouri River based on the precontrol condition. North American Journal of Fisheries Management 13:360-366.
Hill, M. T., W. S. Platts, and R. L. Beschta. 1991. Ecological and geomorphological concepts for instream and out-of-channel flow re· quirements. Rivers 2:198-210.
Holling, C. S. 1978. Adaptive environmental assessment and management. John Wiley & Sons, London.
Conservation Biology Volume 10, No.4, August 1996
1174 Assessing Hydrologic Alteration
Hughes, J. M. R., and B. James. 1989. A hydrological regionalization of streams in Victoria, Australia, with implications for stream ecology. Australian Journal of Marine Freshwater Research 40:303-326.
Hurlbert, S. J. 1984. Pseudoreplication and the design of ecological field experiments. Ecological Monographs 54:187-211.
Junk, W., P. B. Bayley, and R. E. Sparks. 1989. The flood pulse concept in river-floodplain systems. Proceedings of the International Large River Symposium (LARS). Canadian Special Publications in Fisheries and Aquatic Sciences 106:110-127.
Karr, J. R. 1991. Defining and assessing ecological integrity: beyond water quality. Environmental Toxicology and Chemistry 12:1521-1531.
Karr, J. R. 1993. Measuring biological integrity: lessons from streams. Pages 83-104 inS. Woodley, J. Kay, and G. Francis, editors. Ecological integrity and the management of ecosystems. St. Lucie Press, Delray Beach, Florida.
Keddy, P. A. 1992. Assembly and response mles: two goals for predictive community ecology. Journal of Vegetation Science 3:157-164.
Keddy, P. A., H. T. Lee, and I. C. Wisheu. 1993. Choosing indicators of ecosystem integrity: Wetlands as a model system. Pages 61-79 inS. Woodley, J. Kay, and G. Francis, editors. Ecological integrity and the management of ecosystems. St. Lucie Press, Delray Beach, Florida.
Kozlowski, T. T., editor. 1984. Flooding and plant growth. Academic Press, San Diego, California.
Kulik, B. H. 1990. A method to refine the New England aquatic base flow policy. Rivers 1:8-22.
Kusler, J. A., and M. E. Kentula, editors. 1989. Wetland creation and restoration: the status of the science, vol. I-II. EPA/7600/3-89/038. U.S. Environmental Protection Agency, Environmental Research Laboratory, Corvallis, Oregon.
Lea, R. 1991. Forest resources. Pages 61-65 in R. A. Rulifson and C. S. Manooch III, editors. Roanoke River Water Flow Committee report for 1990. Technical memorandum NMFS-SEFC-291. National Oceanic and Atmospheric Administration, Washington, D.C.
Leopold, L. B. 1994. A view of the river. Harvard University Press, Cambridge, Massachusetts.
Lillehammer, A., and S. J. Saltveit, editors. 1984. Regulated rivers. Universitetsforlaget As, Oslo.
Linsley, R. K., Jr., M.A. Kohler, and J. L. H. Paulhus. 1982. Hydrology for engineers. McGraw-Hill, New York.
Lynch, M. 1991. Ecological resources of the lower Roanoke River basin. Pages 49-60 in R. A. Rulifson and C. S. Manooch III, editors. Roanoke River Water Flow Committee report for 1990. Technical memorandum NMFS-SEFC-291. National Oceanic and Atmospheric Administration, Washington, D.C.
Maheshwari, B. L., K. F. Walker, and T. A. McMahon. 1995. Effects of regulation on the flow regime of the River Murray, Australia. Regulated Rivers 10:15-38.
McBride, G. B., J. C. Loftis, and N. C. Adkins. 1993. What do significance tests really tell us about the environment? Environmental Management 17:423-432.
Minshall, G. W. 1993. Stream-riparian ecosystems: Rationale and methods for basin-level assessments of management effects. Pages 153-177 in M. E. Jensen and P. S. Bourgeron, editors. Eastside forest ecosystem health assessment, vol. 2. Ecosystem management: principles and applications. U.S. Forest Service, Missoula, Montana.
Mitsch, W.]., and}. G. Gosselink. 1993. Wetlands. Van Nostrand Reinhold, New York.
Moog, 0. 1993. Quantification of daily peak hydropower effects on aquatic fauna and management to minimize environmental impacts. Regulated Rivers 8:5-14.
National Research Council. 1992. Restoration of aquatic systems: science, technology, and public policy. National Academy Press, Washington, D.C.
Noss, R. F., and A. Y. Cooperrider. 1994. Saving nature's legacy: Protecting and restoring biodiversity. Island Press, Washington, D.C.
Conservation Biology Volume 10, No.4, August 1996
Richter et at.
Paller, M. H., S. F. Modica, and E. G. Hofstetter. 1992. Short-term changes in a southeastern coastal plain fish assemblage following artificial increases in streamflow. Rivers 3:243-259.
Poff, N. L., and}. V. Ward. 1989. Implications of streamflow variability and predictability for !otic community stmcture: a regional analysis of streamflow patterns. Canadian Journal of Aquatic Sciences 46: 1805-1818.
Poff, N. L., and J. V. Ward. 1990. Physical habitat template of !otic systems: recovery in the context of historical pattern of spatiatemporal heterogeneity. Environmental Management 14:629-645.
Reiser, D. W., T. A. Wesche, and C. Estes. 1989. Status of instream flow legislation and practices in North America. Fisheries 14:22-29.
Richter, B. D. 1993. Altered hydrologic regimes and implications for bottomland hardwoods along the Roanoke River. Pages 21-22 in Proceedings of the Roanoke River wildlife management workshop, August 10-12. U.S. Fish and Wildlife Service, Raleigh, North Carolina.
Searcy, J. K. 1960. Graphical correlation of gaging-station records. Water-supply paper 1541-C. U.S. Geological Survey, Washington, D.C.
Southwood, T. R. E. 1977. Habitat, the templet for ecological strategies? Journal of Animal Ecology 46:337-365.
Southwood, T. R. E. 1988. Tactics, strategies and templets. Oikos 52: 3-18.
Snedecor, G. W., and W. G. Cochran. 1967. Statistical methods. 6th edition. Iowa State University Press, Ames.
Sparks, R. E. 1992. Risks of altering the hydrologic regime of large rivers. Pages 119-152 in J. Cairns, Jr., B. R. Niederlehner, and D. R. Orvos, editors. Predicting ecosystem risk: advances in modern environmental toxicology, vol. 20. Princeton Scientific Publishing, Princeton, New Jersey.
Stanford, J. A., and J. V. Ward. 1979. Stream regulation in North America. Pages 215-236 in J. V. Ward and J. A. Stanford, editors. The ecology of regulated streams. Plenum Press, New York.
Stewart-Oaten, A., W. W. Murdoch, and K. R. Parker. 1986. Environmental impact assessment: "pseudoreplication" in time? Ecology 67:929-940.
Stewart-Oaten, A., J. R. Bence, and C. W. Osenberg. 1992. Assessing effects of unreplicated perturbations: no simple solutions. Ecology 73:1396-1404.
Suter, G. W. II. 1993. A critique of ecosystem health concepts and indexes. Environmental Toxicology and Chemistry 12:1533-1539.
Toth, L. A., J. T. B. Obeysekera, W. A. Perkins, and M. K. Loftin. 1993. Flow regulation and restoration of Florida's Kissimmee River. Regulated Rivers 8:155-166.
Townsend, C. R., and A. G. Hildrew. 1994. Species traits in relation to a habitat template for river systems. Freshwater Biology 31:265-275.
Walker, K. F., M. C. Thoms, and F. Sheldon. 1992. Effects of weirs on the littoral environment of the River Murray, South Australia. Pages 271-292 in P. J. Boon, P. Calow, and G. E. Petts, editors. River conservation and management. Wiley and Sons, New York.
Ward, J. V., and J. A. Stanford. 1983. The intermediate-disturbance hypothesis: An explanation for biotic diversity patterns in !otic ecosystems. Pages 347-356 in T. D. Fontaine, III, and S.M. Bartell, editors. Dynamics of !otic ecosystems. Ann Arbor Science, Ann Arbor, Michigan.
Ward, J. V., and J. A. Stanford. 1989. Riverine ecosystems: The influence of man on catchment dynamics and fish ecology. Canadian Special Publications in Fisheries and Aquatic Sciences 106:56-64.
Zeller, N. S. 1993. Abundance and habitat use of overwintering avian communities along the Roanoke River, North Carolina. Page 48 in Proceedings of the Roanoke River wildlife management workshop, August 10-12. U.S. Fish and Wildlife Service, Raleigh, North Carolina.
Zincone, L. H., and R. A. Rulifson. 1991. Instream flow <!nd striped bass recmitment in the lower Roanoke River, North Carolina. Rivers 2: 125-137.