Embed Size (px)
Citation preview

Article
A Meta-Analysis Suggests
Different NeuralCorrelates for Implicit and Explicit LearningHighlights
d Explicit versus implicit learning have different post-choice
oscillatory synchrony
d Explicit learning exploits feedback about errors; implicit
learning does not
d Alpha/beta synchrony increases with explicit learning
d Theta synchrony decreases with implicit learning
Loonis et al., 2017, Neuron 96, 521–534October 11, 2017 ª 2017 Elsevier Inc.https://doi.org/10.1016/j.neuron.2017.09.032
Authors
Roman F. Loonis, Scott L. Brincat,
Evan G. Antzoulatos, Earl K. Miller
In Brief
Loonis et al. find that explicit and implicit
learning use feedback about correct
choices versus errors differently. Implicit
learning relies more on theta synchrony
(3–7 Hz) while explicit learning relies on
alpha/beta synchrony (10–30 Hz).
Neuron
Article
A Meta-Analysis SuggestsDifferent Neural Correlatesfor Implicit and Explicit LearningRoman F. Loonis,1,2 Scott L. Brincat,1 Evan G. Antzoulatos,1,3 and Earl K. Miller1,4,*1The Picower Institute for Learning and Memory, Department of Brain and Cognitive Sciences, Massachusetts Institute of Technology,
Cambridge, MA 02139, USA2Department of Anatomy and Neurobiology, Boston University, Boston MA, 02118, USA3Center for Neuroscience, Department of Neurobiology, Physiology and Behavior, University of California Davis, Davis, CA 95616, USA4Lead Contact
*Correspondence: [email protected]
https://doi.org/10.1016/j.neuron.2017.09.032
SUMMARY
A meta-analysis of non-human primates perform-ing three different tasks (Object-Match, Category-Match, and Category-Saccade associations) re-vealed signatures of explicit and implicit learning.Performance improved equally following correctand error trials in the Match (explicit) tasks, but itimprovedmore after correct trials in the Saccade (im-plicit) task, a signature of explicit versus implicitlearning. Likewise, error-related negativity, a markerfor error processing, was greater in the Match(explicit) tasks. All tasks showed an increase inalpha/beta (10–30 Hz) synchrony after correctchoices. However, only the implicit task showed anincrease in theta (3–7 Hz) synchrony after correctchoices that decreased with learning. In contrast, inthe explicit tasks, alpha/beta synchrony increasedwith learning and decreased thereafter. Our resultssuggest that explicit versus implicit learning engagesdifferent neural mechanisms that rely on differentpatterns of oscillatory synchrony.
INTRODUCTION
Learning was once believed to be a unitary process. As it turned
out, however, patient HM and other amnesia patients have pre-
served skill learning despite an inability to retain and recall new
facts and episodes (Scoville and Milner, 1957; Milner et al.,
1968; Cohen and Squire, 1980). This led to the notion that there
are at least two major forms of learning: one, hippocampal-
dependent and episodic in content (explicit learning) and,
another, non-hippocampal and largely unconscious (implicit
learning).
While it is clear that explicit and implicit learning engage
distinct brain systems, differences in their neural mechanisms
have been less clear. For themost part, studies of the neural cor-
relates of both types of learning report similar findings. On the
neuron level, tuning sharpens, signal-to-noise ratio improves,
and their activity becomes a better predictor of task events (Ant-
zoulatos and Miller, 2011; Asaad et al., 1998; Brincat and Miller,
2015; Chen andWise, 1995; Sakai andMiyashita, 1991; Pasupa-
thy and Miller, 2005; Williams and Eskandar, 2006; Wirth et al.,
2003, 2009). On the network level, learning enhances oscillatory
activity, improves synchrony between neurons, and even sculpts
unique oscillatory ensembles (Antzoulatos andMiller, 2014; Brin-
cat and Miller, 2015; Buschman et al., 2012; Hargreaves et al.,
2012; Jutras et al., 2009, 2013). Animal studies are generally
agnostic as to whether this plasticity is related to explicit or im-
plicit learning. Assignment to one or the other is typically made
by whether the brain area in question has been associated
with explicit learning (e.g., the hippocampus) or implicit learning
(e.g., the basal ganglia) and whether learning is fast (explicit) or
slow (implicit). There is no clear neural signature differentiating
the two.
This is due, in part, to practical considerations. A typical exper-
iment trains animals to learn one task. That is difficult enough.
Training animals to learn two or more tasks is prohibitively time
consuming. It occurred to us, however, that we had data from
three experiments that differed in their formal demands in two
ways: one, in the content of what was learned (paired associa-
tions between objects versus category membership) and, two,
in how that learning was ‘‘read out’’ (via a match decision or vi-
suomotor association). Fortuitously, there was enough overlap
in the tasks for us to isolate these different factors. We found
different patterns of post-choice synchrony that varied with the
readout, not with the content. Examination of the animals’
behavior and neural activity supported the conclusion that these
different synchrony patterns were signatures of explicit and im-
plicit learning.
RESULTS
TasksSix monkeys (three different pairs) performed three different
learning tasks (Figures 1A–1C). During each session of the Ob-
ject-Match task (OM; Figure 1A), animals learned, through trial
and error, four novel associations between pairs of objects
(see STAR Methods). They saw two objects in succession: first
a sample and then a test. If the test object was the pre-assigned
Neuron 96, 521–534, October 11, 2017 ª 2017 Elsevier Inc. 521
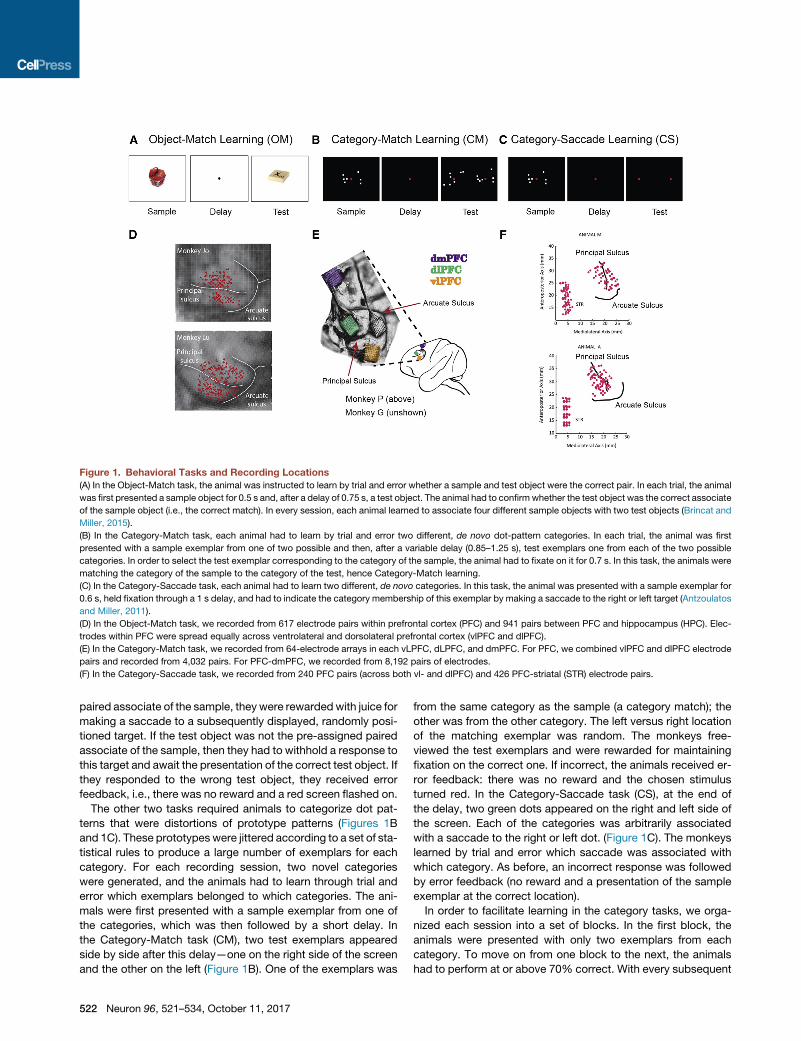
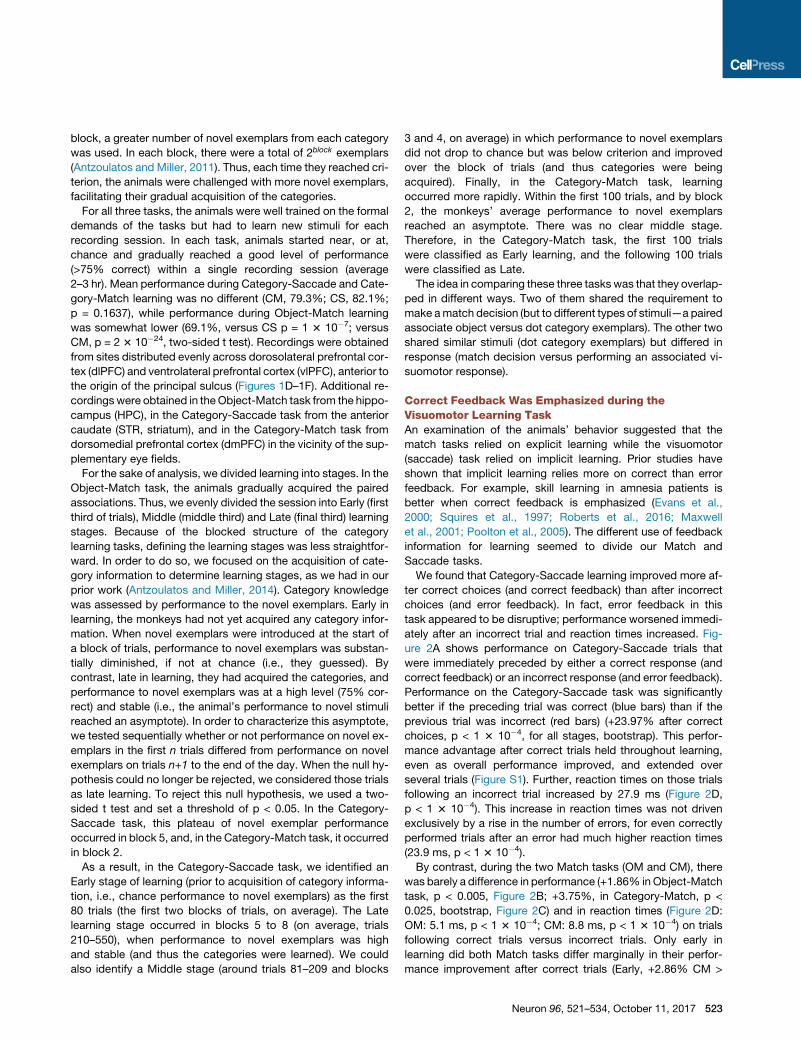
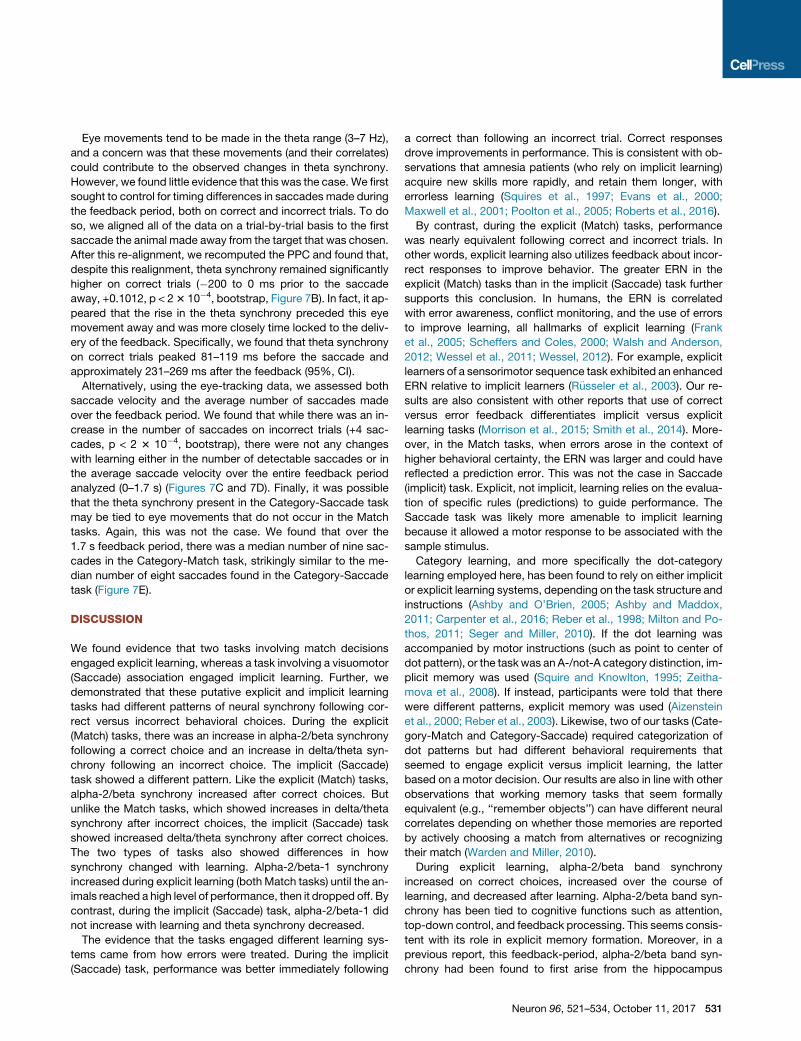
Figure 1. Behavioral Tasks and Recording Locations
(A) In the Object-Match task, the animal was instructed to learn by trial and error whether a sample and test object were the correct pair. In each trial, the animal
was first presented a sample object for 0.5 s and, after a delay of 0.75 s, a test object. The animal had to confirmwhether the test object was the correct associate
of the sample object (i.e., the correct match). In every session, each animal learned to associate four different sample objects with two test objects (Brincat and
Miller, 2015).
(B) In the Category-Match task, each animal had to learn by trial and error two different, de novo dot-pattern categories. In each trial, the animal was first
presented with a sample exemplar from one of two possible and then, after a variable delay (0.85–1.25 s), test exemplars one from each of the two possible
categories. In order to select the test exemplar corresponding to the category of the sample, the animal had to fixate on it for 0.7 s. In this task, the animals were
matching the category of the sample to the category of the test, hence Category-Match learning.
(C) In the Category-Saccade task, each animal had to learn two different, de novo categories. In this task, the animal was presented with a sample exemplar for
0.6 s, held fixation through a 1 s delay, and had to indicate the category membership of this exemplar by making a saccade to the right or left target (Antzoulatos
and Miller, 2011).
(D) In the Object-Match task, we recorded from 617 electrode pairs within prefrontal cortex (PFC) and 941 pairs between PFC and hippocampus (HPC). Elec-
trodes within PFC were spread equally across ventrolateral and dorsolateral prefrontal cortex (vlPFC and dlPFC).
(E) In the Category-Match task, we recorded from 64-electrode arrays in each vLPFC, dLPFC, and dmPFC. For PFC, we combined vlPFC and dlPFC electrode
pairs and recorded from 4,032 pairs. For PFC-dmPFC, we recorded from 8,192 pairs of electrodes.
(F) In the Category-Saccade task, we recorded from 240 PFC pairs (across both vl- and dlPFC) and 426 PFC-striatal (STR) electrode pairs.
paired associate of the sample, they were rewardedwith juice for
making a saccade to a subsequently displayed, randomly posi-
tioned target. If the test object was not the pre-assigned paired
associate of the sample, then they had to withhold a response to
this target and await the presentation of the correct test object. If
they responded to the wrong test object, they received error
feedback, i.e., there was no reward and a red screen flashed on.
The other two tasks required animals to categorize dot pat-
terns that were distortions of prototype patterns (Figures 1B
and 1C). These prototypes were jittered according to a set of sta-
tistical rules to produce a large number of exemplars for each
category. For each recording session, two novel categories
were generated, and the animals had to learn through trial and
error which exemplars belonged to which categories. The ani-
mals were first presented with a sample exemplar from one of
the categories, which was then followed by a short delay. In
the Category-Match task (CM), two test exemplars appeared
side by side after this delay—one on the right side of the screen
and the other on the left (Figure 1B). One of the exemplars was
522 Neuron 96, 521–534, October 11, 2017
from the same category as the sample (a category match); the
other was from the other category. The left versus right location
of the matching exemplar was random. The monkeys free-
viewed the test exemplars and were rewarded for maintaining
fixation on the correct one. If incorrect, the animals received er-
ror feedback: there was no reward and the chosen stimulus
turned red. In the Category-Saccade task (CS), at the end of
the delay, two green dots appeared on the right and left side of
the screen. Each of the categories was arbitrarily associated
with a saccade to the right or left dot. (Figure 1C). The monkeys
learned by trial and error which saccade was associated with
which category. As before, an incorrect response was followed
by error feedback (no reward and a presentation of the sample
exemplar at the correct location).
In order to facilitate learning in the category tasks, we orga-
nized each session into a set of blocks. In the first block, the
animals were presented with only two exemplars from each
category. To move on from one block to the next, the animals
had to perform at or above 70% correct. With every subsequent
block, a greater number of novel exemplars from each category
was used. In each block, there were a total of 2block exemplars
(Antzoulatos and Miller, 2011). Thus, each time they reached cri-
terion, the animals were challenged with more novel exemplars,
facilitating their gradual acquisition of the categories.
For all three tasks, the animals were well trained on the formal
demands of the tasks but had to learn new stimuli for each
recording session. In each task, animals started near, or at,
chance and gradually reached a good level of performance
(>75% correct) within a single recording session (average
2–3 hr). Mean performance during Category-Saccade and Cate-
gory-Match learning was no different (CM, 79.3%; CS, 82.1%;
p = 0.1637), while performance during Object-Match learning
was somewhat lower (69.1%, versus CS p = 1 3 10�7; versus
CM, p = 2 3 10�24, two-sided t test). Recordings were obtained
from sites distributed evenly across dorosolateral prefrontal cor-
tex (dlPFC) and ventrolateral prefrontal cortex (vlPFC), anterior to
the origin of the principal sulcus (Figures 1D–1F). Additional re-
cordingswere obtained in theObject-Match task from the hippo-
campus (HPC), in the Category-Saccade task from the anterior
caudate (STR, striatum), and in the Category-Match task from
dorsomedial prefrontal cortex (dmPFC) in the vicinity of the sup-
plementary eye fields.
For the sake of analysis, we divided learning into stages. In the
Object-Match task, the animals gradually acquired the paired
associations. Thus, we evenly divided the session into Early (first
third of trials), Middle (middle third) and Late (final third) learning
stages. Because of the blocked structure of the category
learning tasks, defining the learning stages was less straightfor-
ward. In order to do so, we focused on the acquisition of cate-
gory information to determine learning stages, as we had in our
prior work (Antzoulatos and Miller, 2014). Category knowledge
was assessed by performance to the novel exemplars. Early in
learning, the monkeys had not yet acquired any category infor-
mation. When novel exemplars were introduced at the start of
a block of trials, performance to novel exemplars was substan-
tially diminished, if not at chance (i.e., they guessed). By
contrast, late in learning, they had acquired the categories, and
performance to novel exemplars was at a high level (75% cor-
rect) and stable (i.e., the animal’s performance to novel stimuli
reached an asymptote). In order to characterize this asymptote,
we tested sequentially whether or not performance on novel ex-
emplars in the first n trials differed from performance on novel
exemplars on trials n+1 to the end of the day. When the null hy-
pothesis could no longer be rejected, we considered those trials
as late learning. To reject this null hypothesis, we used a two-
sided t test and set a threshold of p < 0.05. In the Category-
Saccade task, this plateau of novel exemplar performance
occurred in block 5, and, in the Category-Match task, it occurred
in block 2.
As a result, in the Category-Saccade task, we identified an
Early stage of learning (prior to acquisition of category informa-
tion, i.e., chance performance to novel exemplars) as the first
80 trials (the first two blocks of trials, on average). The Late
learning stage occurred in blocks 5 to 8 (on average, trials
210–550), when performance to novel exemplars was high
and stable (and thus the categories were learned). We could
also identify a Middle stage (around trials 81–209 and blocks
3 and 4, on average) in which performance to novel exemplars
did not drop to chance but was below criterion and improved
over the block of trials (and thus categories were being
acquired). Finally, in the Category-Match task, learning
occurred more rapidly. Within the first 100 trials, and by block
2, the monkeys’ average performance to novel exemplars
reached an asymptote. There was no clear middle stage.
Therefore, in the Category-Match task, the first 100 trials
were classified as Early learning, and the following 100 trials
were classified as Late.
The idea in comparing these three tasks was that they overlap-
ped in different ways. Two of them shared the requirement to
make amatch decision (but to different types of stimuli—a paired
associate object versus dot category exemplars). The other two
shared similar stimuli (dot category exemplars) but differed in
response (match decision versus performing an associated vi-
suomotor response).
Correct Feedback Was Emphasized during theVisuomotor Learning TaskAn examination of the animals’ behavior suggested that the
match tasks relied on explicit learning while the visuomotor
(saccade) task relied on implicit learning. Prior studies have
shown that implicit learning relies more on correct than error
feedback. For example, skill learning in amnesia patients is
better when correct feedback is emphasized (Evans et al.,
2000; Squires et al., 1997; Roberts et al., 2016; Maxwell
et al., 2001; Poolton et al., 2005). The different use of feedback
information for learning seemed to divide our Match and
Saccade tasks.
We found that Category-Saccade learning improved more af-
ter correct choices (and correct feedback) than after incorrect
choices (and error feedback). In fact, error feedback in this
task appeared to be disruptive; performance worsened immedi-
ately after an incorrect trial and reaction times increased. Fig-
ure 2A shows performance on Category-Saccade trials that
were immediately preceded by either a correct response (and
correct feedback) or an incorrect response (and error feedback).
Performance on the Category-Saccade task was significantly
better if the preceding trial was correct (blue bars) than if the
previous trial was incorrect (red bars) (+23.97% after correct
choices, p < 1 3 10�4, for all stages, bootstrap). This perfor-
mance advantage after correct trials held throughout learning,
even as overall performance improved, and extended over
several trials (Figure S1). Further, reaction times on those trials
following an incorrect trial increased by 27.9 ms (Figure 2D,
p < 1 3 10�4). This increase in reaction times was not driven
exclusively by a rise in the number of errors, for even correctly
performed trials after an error had much higher reaction times
(23.9 ms, p < 1 3 10�4).
By contrast, during the two Match tasks (OM and CM), there
was barely a difference in performance (+1.86% inObject-Match
task, p < 0.005, Figure 2B; +3.75%, in Category-Match, p <
0.025, bootstrap, Figure 2C) and in reaction times (Figure 2D:
OM: 5.1 ms, p < 1 3 10�4; CM: 8.8 ms, p < 1 3 10�4) on trials
following correct trials versus incorrect trials. Only early in
learning did both Match tasks differ marginally in their perfor-
mance improvement after correct trials (Early, +2.86% CM >
Neuron 96, 521–534, October 11, 2017 523
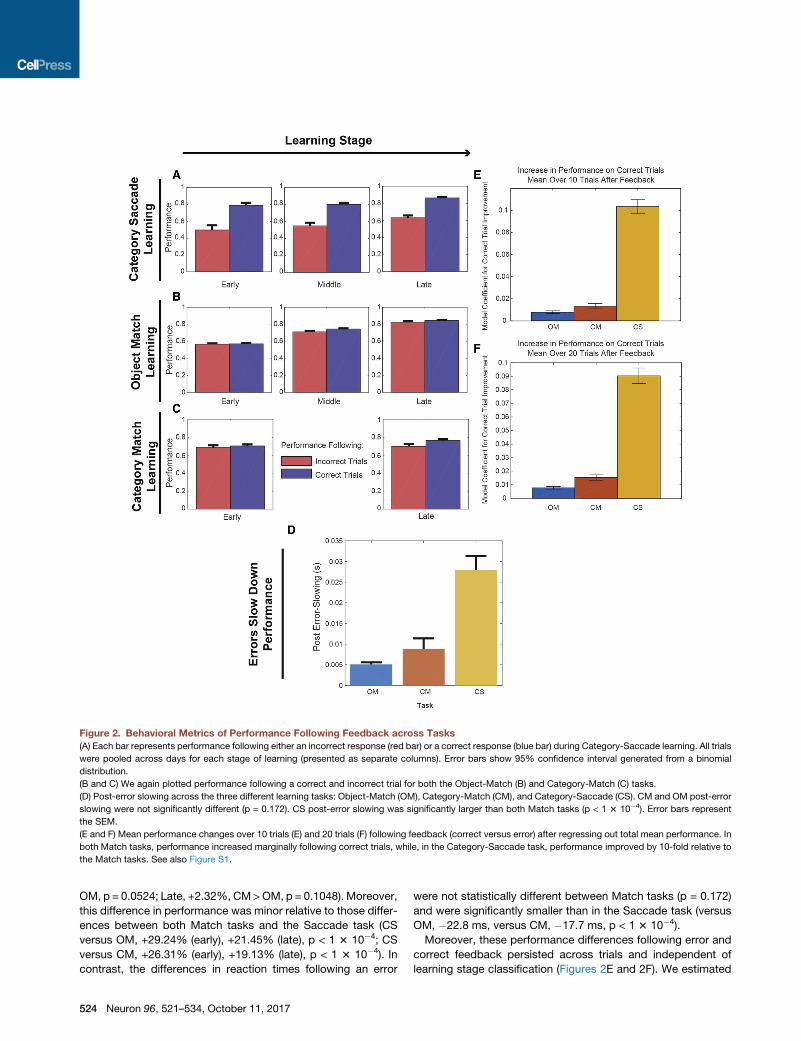
Figure 2. Behavioral Metrics of Performance Following Feedback across Tasks
(A) Each bar represents performance following either an incorrect response (red bar) or a correct response (blue bar) during Category-Saccade learning. All trials
were pooled across days for each stage of learning (presented as separate columns). Error bars show 95% confidence interval generated from a binomial
distribution.
(B and C) We again plotted performance following a correct and incorrect trial for both the Object-Match (B) and Category-Match (C) tasks.
(D) Post-error slowing across the three different learning tasks: Object-Match (OM), Category-Match (CM), and Category-Saccade (CS). CM and OM post-error
slowing were not significantly different (p = 0.172). CS post-error slowing was significantly larger than both Match tasks (p < 1 3 10�4). Error bars represent
the SEM.
(E and F) Mean performance changes over 10 trials (E) and 20 trials (F) following feedback (correct versus error) after regressing out total mean performance. In
both Match tasks, performance increased marginally following correct trials, while, in the Category-Saccade task, performance improved by 10-fold relative to
the Match tasks. See also Figure S1.
OM, p = 0.0524; Late, +2.32%, CM>OM, p = 0.1048). Moreover,
this difference in performance was minor relative to those differ-
ences between both Match tasks and the Saccade task (CS
versus OM, +29.24% (early), +21.45% (late), p < 1 3 10�4; CS
versus CM, +26.31% (early), +19.13% (late), p < 1 3 10�4). In
contrast, the differences in reaction times following an error
524 Neuron 96, 521–534, October 11, 2017
were not statistically different between Match tasks (p = 0.172)
and were significantly smaller than in the Saccade task (versus
OM, �22.8 ms, versus CM, �17.7 ms, p < 1 3 10�4).
Moreover, these performance differences following error and
correct feedback persisted across trials and independent of
learning stage classification (Figures 2E and 2F). We estimated
a bivariate linear model examining whether both the mean per-
formance of all trials prior to feedback and the type of feedback
(correct or an error) influenced mean performance in the 10 (Fig-
ure 2E) or 20 (Figure 2F) trials post-feedback. Again, we found
that in the Saccade tasks, there was significantly better perfor-
mance after correct than error trials than in the Match tasks
(20 trial model – OM: +0.0078, CM: +0.0153, CS: +0.0903; CM,
OM < CS, p < 0.0004; 10 trial model – OM: +0.0078,
CM: +0.0134, CS: +0.1034; CM, OM < CS, p < 0.0004, boot-
strap). We will see next that these task differences were also
mirrored in differences in an evoked potential called the error-
related negativity.
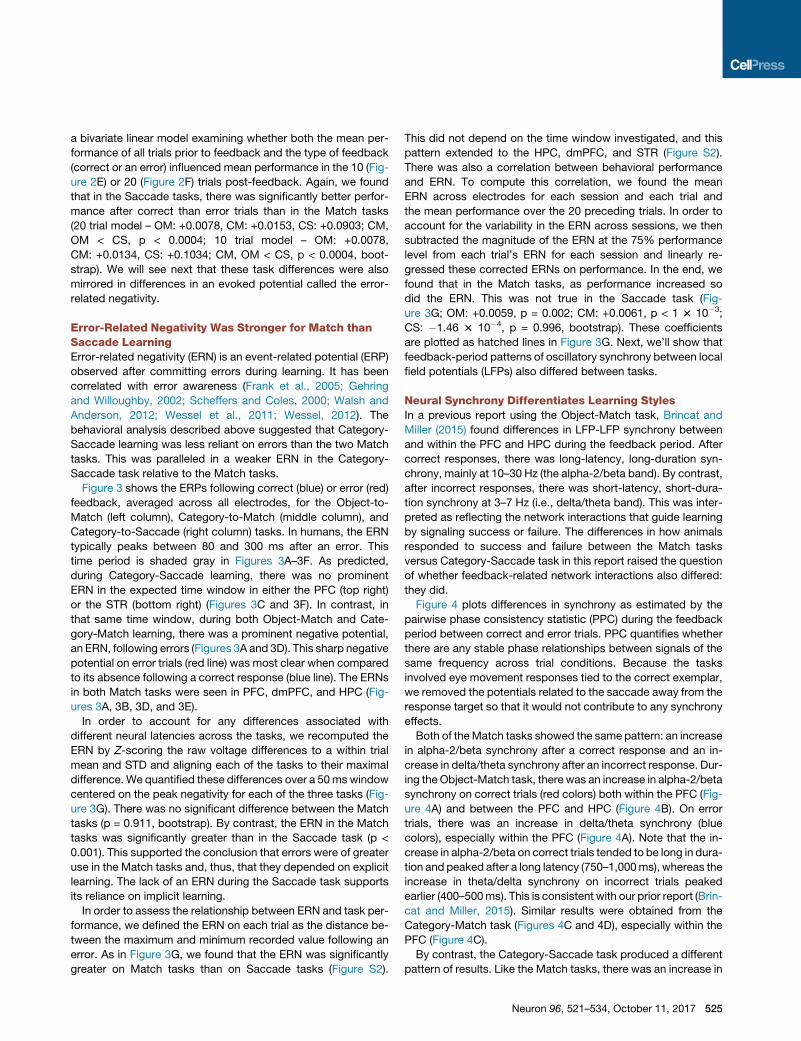
Error-Related Negativity Was Stronger for Match thanSaccade LearningError-related negativity (ERN) is an event-related potential (ERP)
observed after committing errors during learning. It has been
correlated with error awareness (Frank et al., 2005; Gehring
and Willoughby, 2002; Scheffers and Coles, 2000; Walsh and
Anderson, 2012; Wessel et al., 2011; Wessel, 2012). The
behavioral analysis described above suggested that Category-
Saccade learning was less reliant on errors than the two Match
tasks. This was paralleled in a weaker ERN in the Category-
Saccade task relative to the Match tasks.
Figure 3 shows the ERPs following correct (blue) or error (red)
feedback, averaged across all electrodes, for the Object-to-
Match (left column), Category-to-Match (middle column), and
Category-to-Saccade (right column) tasks. In humans, the ERN
typically peaks between 80 and 300 ms after an error. This
time period is shaded gray in Figures 3A–3F. As predicted,
during Category-Saccade learning, there was no prominent
ERN in the expected time window in either the PFC (top right)
or the STR (bottom right) (Figures 3C and 3F). In contrast, in
that same time window, during both Object-Match and Cate-
gory-Match learning, there was a prominent negative potential,
an ERN, following errors (Figures 3A and 3D). This sharp negative
potential on error trials (red line) was most clear when compared
to its absence following a correct response (blue line). The ERNs
in both Match tasks were seen in PFC, dmPFC, and HPC (Fig-
ures 3A, 3B, 3D, and 3E).
In order to account for any differences associated with
different neural latencies across the tasks, we recomputed the
ERN by Z-scoring the raw voltage differences to a within trial
mean and STD and aligning each of the tasks to their maximal
difference. We quantified these differences over a 50ms window
centered on the peak negativity for each of the three tasks (Fig-
ure 3G). There was no significant difference between the Match
tasks (p = 0.911, bootstrap). By contrast, the ERN in the Match
tasks was significantly greater than in the Saccade task (p <
0.001). This supported the conclusion that errors were of greater
use in the Match tasks and, thus, that they depended on explicit
learning. The lack of an ERN during the Saccade task supports
its reliance on implicit learning.
In order to assess the relationship between ERN and task per-
formance, we defined the ERN on each trial as the distance be-
tween the maximum and minimum recorded value following an
error. As in Figure 3G, we found that the ERN was significantly
greater on Match tasks than on Saccade tasks (Figure S2).
This did not depend on the time window investigated, and this
pattern extended to the HPC, dmPFC, and STR (Figure S2).
There was also a correlation between behavioral performance
and ERN. To compute this correlation, we found the mean
ERN across electrodes for each session and each trial and
the mean performance over the 20 preceding trials. In order to
account for the variability in the ERN across sessions, we then
subtracted the magnitude of the ERN at the 75% performance
level from each trial’s ERN for each session and linearly re-
gressed these corrected ERNs on performance. In the end, we
found that in the Match tasks, as performance increased so
did the ERN. This was not true in the Saccade task (Fig-
ure 3G; OM: +0.0059, p = 0.002; CM: +0.0061, p < 1 3 10�3;
CS: �1.46 3 10�4, p = 0.996, bootstrap). These coefficients
are plotted as hatched lines in Figure 3G. Next, we’ll show that
feedback-period patterns of oscillatory synchrony between local
field potentials (LFPs) also differed between tasks.
Neural Synchrony Differentiates Learning StylesIn a previous report using the Object-Match task, Brincat and
Miller (2015) found differences in LFP-LFP synchrony between
and within the PFC and HPC during the feedback period. After
correct responses, there was long-latency, long-duration syn-
chrony, mainly at 10–30 Hz (the alpha-2/beta band). By contrast,
after incorrect responses, there was short-latency, short-dura-
tion synchrony at 3–7 Hz (i.e., delta/theta band). This was inter-
preted as reflecting the network interactions that guide learning
by signaling success or failure. The differences in how animals
responded to success and failure between the Match tasks
versus Category-Saccade task in this report raised the question
of whether feedback-related network interactions also differed:
they did.
Figure 4 plots differences in synchrony as estimated by the
pairwise phase consistency statistic (PPC) during the feedback
period between correct and error trials. PPC quantifies whether
there are any stable phase relationships between signals of the
same frequency across trial conditions. Because the tasks
involved eye movement responses tied to the correct exemplar,
we removed the potentials related to the saccade away from the
response target so that it would not contribute to any synchrony
effects.
Both of theMatch tasks showed the same pattern: an increase
in alpha-2/beta synchrony after a correct response and an in-
crease in delta/theta synchrony after an incorrect response. Dur-
ing the Object-Match task, there was an increase in alpha-2/beta
synchrony on correct trials (red colors) both within the PFC (Fig-
ure 4A) and between the PFC and HPC (Figure 4B). On error
trials, there was an increase in delta/theta synchrony (blue
colors), especially within the PFC (Figure 4A). Note that the in-
crease in alpha-2/beta on correct trials tended to be long in dura-
tion and peaked after a long latency (750–1,000ms), whereas the
increase in theta/delta synchrony on incorrect trials peaked
earlier (400–500ms). This is consistent with our prior report (Brin-
cat and Miller, 2015). Similar results were obtained from the
Category-Match task (Figures 4C and 4D), especially within the
PFC (Figure 4C).
By contrast, the Category-Saccade task produced a different
pattern of results. Like the Match tasks, there was an increase in
Neuron 96, 521–534, October 11, 2017 525
Figure 3. Error-Related Negativity across Brain Regions and Tasks
(A–C) Across all electrodes in prefrontal cortex, we computed the evoked potentials in each task separately. The blue line is the evoked potential averaged across
correct trials, and the red line is the evoked averaged across the incorrect trials. The shaded gray region represents the time of an expected error-related
negativity between 80 and 300 ms after feedback. In the Object-Match (A) and Category-Saccade (C) tasks, we averaged across 242 and 64 electrodes
distributed across vl- and dlPFC, respectively. In the Category-Match (B) task, we averaged across each array within vl- and dlPFC (n = 97 arrays).
(D–F) Evoked potentials within the hippocampus (n = 162 electrodes) (D), the supplementary eye fields (n = 30 arrays) (E), and the striatum (n = 65 electrodes) (F)
during the Object-Match, Category-Match, and Category-Saccade tasks, respectively.
(G) The error-related negativity is plotted here for each task. The error-related negativity was computed by subtracting the evoked potentials on correct and
incorrect trials, and it was aligned to the maximal differences across tasks. We compared the peak negativity by averaging around this peak (±25 ms). The error
bars represent +1 SEM. The hatched lines overlying the bars reflect the estimated coefficients for the change in the ERN as a function of performance (10 trial
mean prior to feedback). In bothMatch tasks, the ERN increased with performance and hence behavioral certainty. The estimated coefficient in the Saccade task
was near to 0 and not statistically significant. See also Figure S2.
alpha-2/beta after correct responses (light red colors). However,
correct responses in the Category-Saccade produced a large in-
crease in theta/delta (darker red colors), unlike theMatch tasks in
which delta/theta synchrony only increased after incorrect re-
sponses. This was true both within the PFC (Figure 4E) and espe-
cially between the PFC and STR (Figure 4F).
We quantified these differences by averaging over the 1.25 s
after feedback was delivered (time zero in Figures 4A–4F). The
526 Neuron 96, 521–534, October 11, 2017
results are shown in Figure 4G. Positive values indicate greater
synchrony after a correct response; negative values indicate
greater synchrony after an incorrect response. In the alpha-2/
beta band, all three tasks showed a significant increase in syn-
chrony after correct trials only, within the PFC (OM, +0.012;
CM, +0.0186; CS, +0.0358; p < 2 3 10�4, bootstrap) and, albeit
weaker, between PFC and other areas (OM, +0.0012, p = 0.002;
CM, +0.0112, p < 2 3 10�4; CS, +0.0268, p < 2 3 10�4). In the
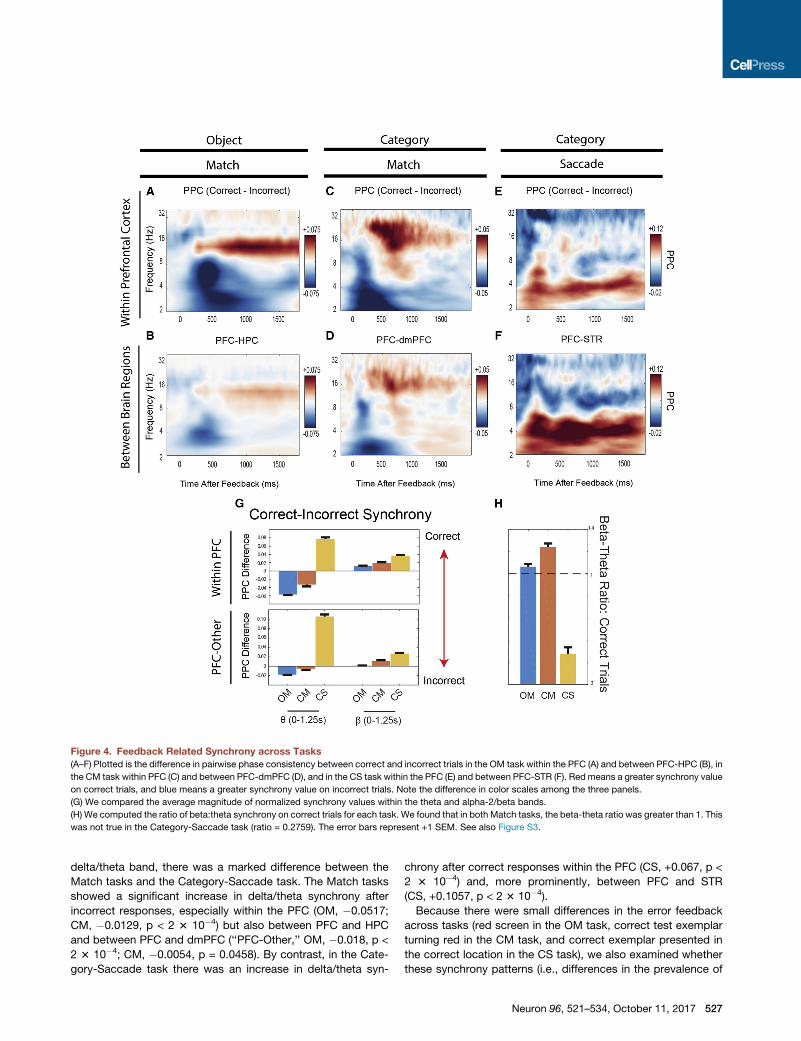
Figure 4. Feedback Related Synchrony across Tasks
(A–F) Plotted is the difference in pairwise phase consistency between correct and incorrect trials in the OM task within the PFC (A) and between PFC-HPC (B), in
the CM task within PFC (C) and between PFC-dmPFC (D), and in the CS task within the PFC (E) and between PFC-STR (F). Redmeans a greater synchrony value
on correct trials, and blue means a greater synchrony value on incorrect trials. Note the difference in color scales among the three panels.
(G) We compared the average magnitude of normalized synchrony values within the theta and alpha-2/beta bands.
(H) We computed the ratio of beta:theta synchrony on correct trials for each task. We found that in both Match tasks, the beta-theta ratio was greater than 1. This
was not true in the Category-Saccade task (ratio = 0.2759). The error bars represent +1 SEM. See also Figure S3.
delta/theta band, there was a marked difference between the
Match tasks and the Category-Saccade task. The Match tasks
showed a significant increase in delta/theta synchrony after
incorrect responses, especially within the PFC (OM, �0.0517;
CM, �0.0129, p < 2 3 10�4) but also between PFC and HPC
and between PFC and dmPFC (‘‘PFC-Other,’’ OM, �0.018, p <
2 3 10�4; CM, �0.0054, p = 0.0458). By contrast, in the Cate-
gory-Saccade task there was an increase in delta/theta syn-
chrony after correct responses within the PFC (CS, +0.067, p <
2 3 10�4) and, more prominently, between PFC and STR
(CS, +0.1057, p < 2 3 10�4).
Because there were small differences in the error feedback
across tasks (red screen in the OM task, correct test exemplar
turning red in the CM task, and correct exemplar presented in
the correct location in the CS task), we also examined whether
these synchrony patterns (i.e., differences in the prevalence of
Neuron 96, 521–534, October 11, 2017 527
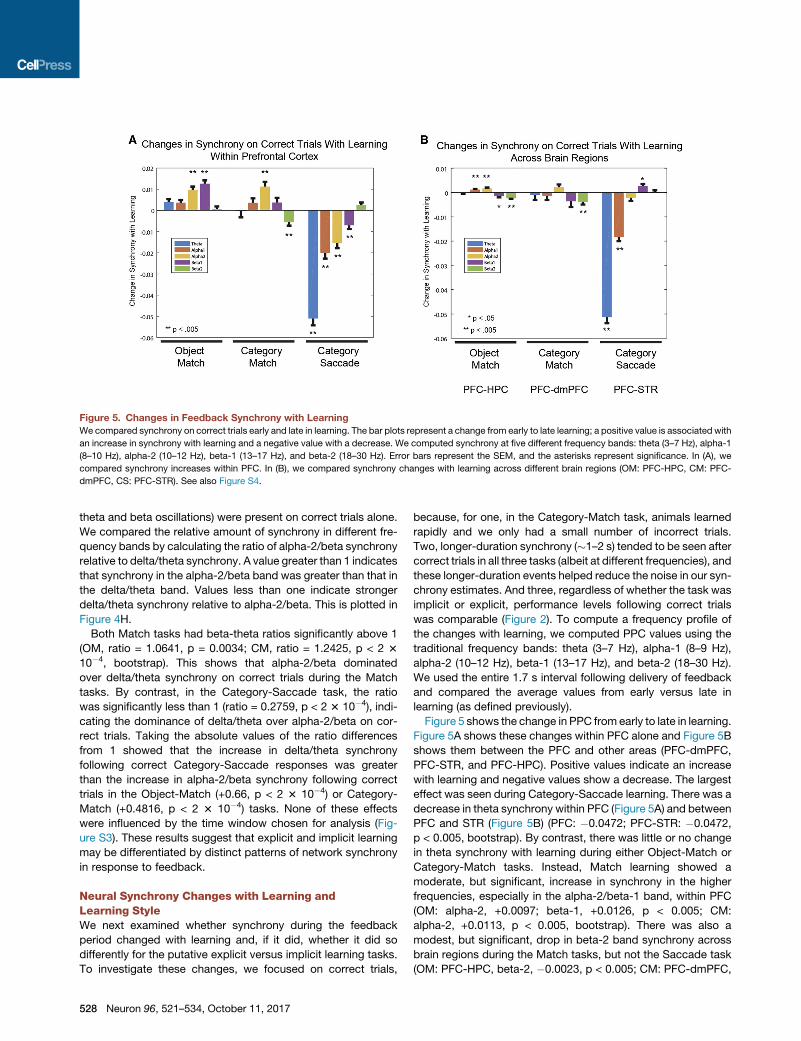
Figure 5. Changes in Feedback Synchrony with Learning
We compared synchrony on correct trials early and late in learning. The bar plots represent a change from early to late learning; a positive value is associated with
an increase in synchrony with learning and a negative value with a decrease. We computed synchrony at five different frequency bands: theta (3–7 Hz), alpha-1
(8–10 Hz), alpha-2 (10–12 Hz), beta-1 (13–17 Hz), and beta-2 (18–30 Hz). Error bars represent the SEM, and the asterisks represent significance. In (A), we
compared synchrony increases within PFC. In (B), we compared synchrony changes with learning across different brain regions (OM: PFC-HPC, CM: PFC-
dmPFC, CS: PFC-STR). See also Figure S4.
theta and beta oscillations) were present on correct trials alone.
We compared the relative amount of synchrony in different fre-
quency bands by calculating the ratio of alpha-2/beta synchrony
relative to delta/theta synchrony. A value greater than 1 indicates
that synchrony in the alpha-2/beta band was greater than that in
the delta/theta band. Values less than one indicate stronger
delta/theta synchrony relative to alpha-2/beta. This is plotted in
Figure 4H.
Both Match tasks had beta-theta ratios significantly above 1
(OM, ratio = 1.0641, p = 0.0034; CM, ratio = 1.2425, p < 2 3
10�4, bootstrap). This shows that alpha-2/beta dominated
over delta/theta synchrony on correct trials during the Match
tasks. By contrast, in the Category-Saccade task, the ratio
was significantly less than 1 (ratio = 0.2759, p < 2 3 10�4), indi-
cating the dominance of delta/theta over alpha-2/beta on cor-
rect trials. Taking the absolute values of the ratio differences
from 1 showed that the increase in delta/theta synchrony
following correct Category-Saccade responses was greater
than the increase in alpha-2/beta synchrony following correct
trials in the Object-Match (+0.66, p < 2 3 10�4) or Category-
Match (+0.4816, p < 2 3 10�4) tasks. None of these effects
were influenced by the time window chosen for analysis (Fig-
ure S3). These results suggest that explicit and implicit learning
may be differentiated by distinct patterns of network synchrony
in response to feedback.
Neural Synchrony Changes with Learning andLearning StyleWe next examined whether synchrony during the feedback
period changed with learning and, if it did, whether it did so
differently for the putative explicit versus implicit learning tasks.
To investigate these changes, we focused on correct trials,
528 Neuron 96, 521–534, October 11, 2017
because, for one, in the Category-Match task, animals learned
rapidly and we only had a small number of incorrect trials.
Two, longer-duration synchrony (�1–2 s) tended to be seen after
correct trials in all three tasks (albeit at different frequencies), and
these longer-duration events helped reduce the noise in our syn-
chrony estimates. And three, regardless of whether the task was
implicit or explicit, performance levels following correct trials
was comparable (Figure 2). To compute a frequency profile of
the changes with learning, we computed PPC values using the
traditional frequency bands: theta (3–7 Hz), alpha-1 (8–9 Hz),
alpha-2 (10–12 Hz), beta-1 (13–17 Hz), and beta-2 (18–30 Hz).
We used the entire 1.7 s interval following delivery of feedback
and compared the average values from early versus late in
learning (as defined previously).
Figure 5 shows the change in PPC from early to late in learning.
Figure 5A shows these changes within PFC alone and Figure 5B
shows them between the PFC and other areas (PFC-dmPFC,
PFC-STR, and PFC-HPC). Positive values indicate an increase
with learning and negative values show a decrease. The largest
effect was seen during Category-Saccade learning. There was a
decrease in theta synchrony within PFC (Figure 5A) and between
PFC and STR (Figure 5B) (PFC: �0.0472; PFC-STR: �0.0472,
p < 0.005, bootstrap). By contrast, there was little or no change
in theta synchrony with learning during either Object-Match or
Category-Match tasks. Instead, Match learning showed a
moderate, but significant, increase in synchrony in the higher
frequencies, especially in the alpha-2/beta-1 band, within PFC
(OM: alpha-2, +0.0097; beta-1, +0.0126, p < 0.005; CM:
alpha-2, +0.0113, p < 0.005, bootstrap). There was also a
modest, but significant, drop in beta-2 band synchrony across
brain regions during the Match tasks, but not the Saccade task
(OM: PFC-HPC, beta-2, �0.0023, p < 0.005; CM: PFC-dmPFC,
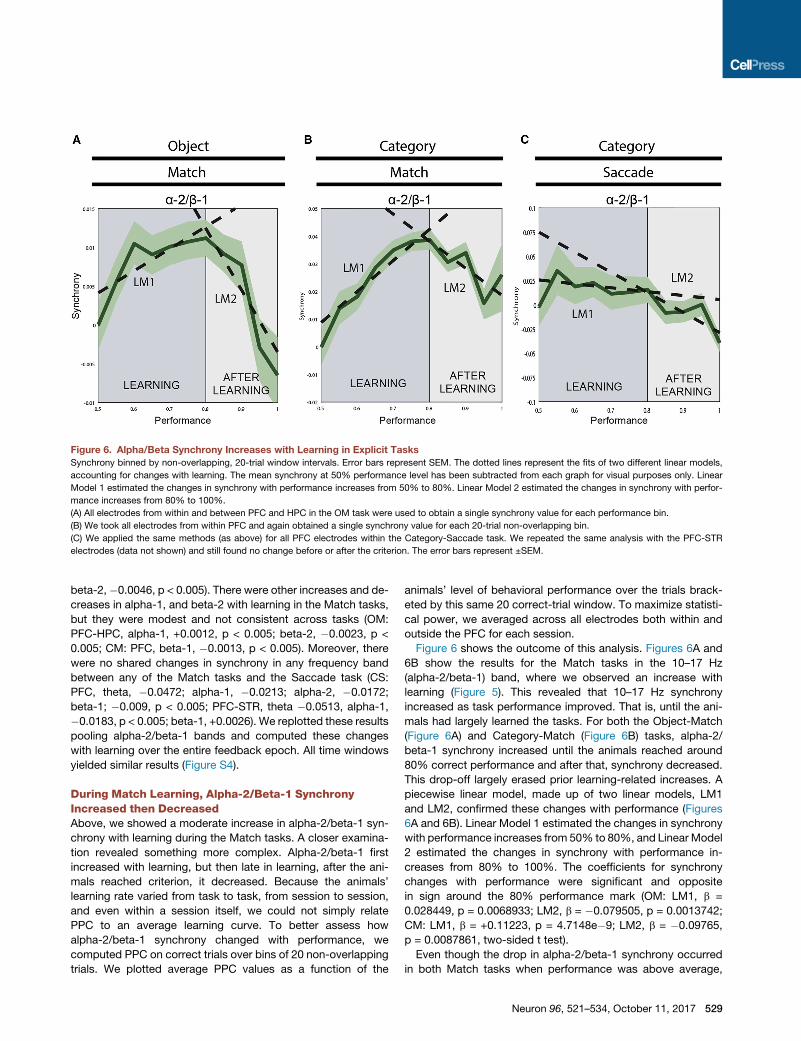
Figure 6. Alpha/Beta Synchrony Increases with Learning in Explicit Tasks
Synchrony binned by non-overlapping, 20-trial window intervals. Error bars represent SEM. The dotted lines represent the fits of two different linear models,
accounting for changes with learning. The mean synchrony at 50% performance level has been subtracted from each graph for visual purposes only. Linear
Model 1 estimated the changes in synchrony with performance increases from 50% to 80%. Linear Model 2 estimated the changes in synchrony with perfor-
mance increases from 80% to 100%.
(A) All electrodes from within and between PFC and HPC in the OM task were used to obtain a single synchrony value for each performance bin.
(B) We took all electrodes from within PFC and again obtained a single synchrony value for each 20-trial non-overlapping bin.
(C) We applied the same methods (as above) for all PFC electrodes within the Category-Saccade task. We repeated the same analysis with the PFC-STR
electrodes (data not shown) and still found no change before or after the criterion. The error bars represent ±SEM.
beta-2,�0.0046, p < 0.005). There were other increases and de-
creases in alpha-1, and beta-2 with learning in the Match tasks,
but they were modest and not consistent across tasks (OM:
PFC-HPC, alpha-1, +0.0012, p < 0.005; beta-2, �0.0023, p <
0.005; CM: PFC, beta-1, �0.0013, p < 0.005). Moreover, there
were no shared changes in synchrony in any frequency band
between any of the Match tasks and the Saccade task (CS:
PFC, theta, �0.0472; alpha-1, �0.0213; alpha-2, �0.0172;
beta-1; �0.009, p < 0.005; PFC-STR, theta �0.0513, alpha-1,
�0.0183, p < 0.005; beta-1, +0.0026). We replotted these results
pooling alpha-2/beta-1 bands and computed these changes
with learning over the entire feedback epoch. All time windows
yielded similar results (Figure S4).
During Match Learning, Alpha-2/Beta-1 SynchronyIncreased then DecreasedAbove, we showed a moderate increase in alpha-2/beta-1 syn-
chrony with learning during the Match tasks. A closer examina-
tion revealed something more complex. Alpha-2/beta-1 first
increased with learning, but then late in learning, after the ani-
mals reached criterion, it decreased. Because the animals’
learning rate varied from task to task, from session to session,
and even within a session itself, we could not simply relate
PPC to an average learning curve. To better assess how
alpha-2/beta-1 synchrony changed with performance, we
computed PPC on correct trials over bins of 20 non-overlapping
trials. We plotted average PPC values as a function of the
animals’ level of behavioral performance over the trials brack-
eted by this same 20 correct-trial window. To maximize statisti-
cal power, we averaged across all electrodes both within and
outside the PFC for each session.
Figure 6 shows the outcome of this analysis. Figures 6A and
6B show the results for the Match tasks in the 10–17 Hz
(alpha-2/beta-1) band, where we observed an increase with
learning (Figure 5). This revealed that 10–17 Hz synchrony
increased as task performance improved. That is, until the ani-
mals had largely learned the tasks. For both the Object-Match
(Figure 6A) and Category-Match (Figure 6B) tasks, alpha-2/
beta-1 synchrony increased until the animals reached around
80% correct performance and after that, synchrony decreased.
This drop-off largely erased prior learning-related increases. A
piecewise linear model, made up of two linear models, LM1
and LM2, confirmed these changes with performance (Figures
6A and 6B). Linear Model 1 estimated the changes in synchrony
with performance increases from 50% to 80%, and Linear Model
2 estimated the changes in synchrony with performance in-
creases from 80% to 100%. The coefficients for synchrony
changes with performance were significant and opposite
in sign around the 80% performance mark (OM: LM1, b =
0.028449, p = 0.0068933; LM2, b = �0.079505, p = 0.0013742;
CM: LM1, b = +0.11223, p = 4.7148e�9; LM2, b = �0.09765,
p = 0.0087861, two-sided t test).
Even though the drop in alpha-2/beta-1 synchrony occurred
in both Match tasks when performance was above average,
Neuron 96, 521–534, October 11, 2017 529
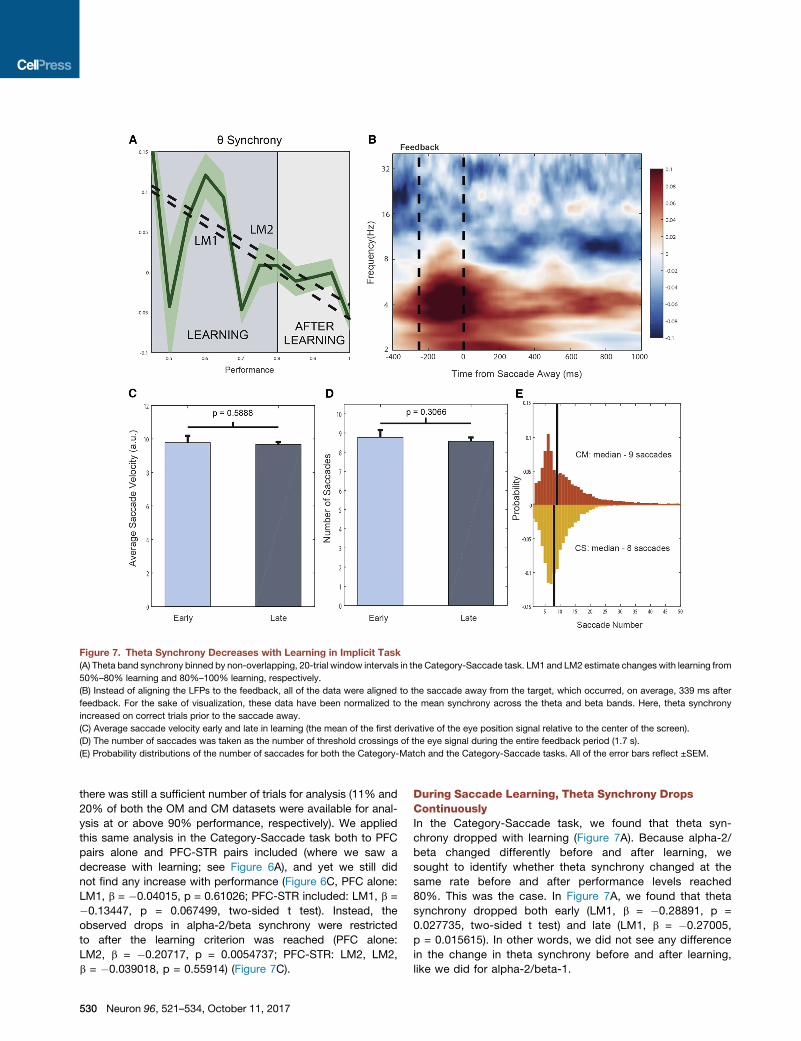
Figure 7. Theta Synchrony Decreases with Learning in Implicit Task
(A) Theta band synchrony binned by non-overlapping, 20-trial window intervals in the Category-Saccade task. LM1 and LM2 estimate changes with learning from
50%–80% learning and 80%–100% learning, respectively.
(B) Instead of aligning the LFPs to the feedback, all of the data were aligned to the saccade away from the target, which occurred, on average, 339 ms after
feedback. For the sake of visualization, these data have been normalized to the mean synchrony across the theta and beta bands. Here, theta synchrony
increased on correct trials prior to the saccade away.
(C) Average saccade velocity early and late in learning (the mean of the first derivative of the eye position signal relative to the center of the screen).
(D) The number of saccades was taken as the number of threshold crossings of the eye signal during the entire feedback period (1.7 s).
(E) Probability distributions of the number of saccades for both the Category-Match and the Category-Saccade tasks. All of the error bars reflect ±SEM.
there was still a sufficient number of trials for analysis (11% and
20% of both the OM and CM datasets were available for anal-
ysis at or above 90% performance, respectively). We applied
this same analysis in the Category-Saccade task both to PFC
pairs alone and PFC-STR pairs included (where we saw a
decrease with learning; see Figure 6A), and yet we still did
not find any increase with performance (Figure 6C, PFC alone:
LM1, b = �0.04015, p = 0.61026; PFC-STR included: LM1, b =
�0.13447, p = 0.067499, two-sided t test). Instead, the
observed drops in alpha-2/beta synchrony were restricted
to after the learning criterion was reached (PFC alone:
LM2, b = �0.20717, p = 0.0054737; PFC-STR: LM2, LM2,
b = �0.039018, p = 0.55914) (Figure 7C).
530 Neuron 96, 521–534, October 11, 2017
During Saccade Learning, Theta Synchrony DropsContinuouslyIn the Category-Saccade task, we found that theta syn-
chrony dropped with learning (Figure 7A). Because alpha-2/
beta changed differently before and after learning, we
sought to identify whether theta synchrony changed at the
same rate before and after performance levels reached
80%. This was the case. In Figure 7A, we found that theta
synchrony dropped both early (LM1, b = �0.28891, p =
0.027735, two-sided t test) and late (LM1, b = �0.27005,
p = 0.015615). In other words, we did not see any difference
in the change in theta synchrony before and after learning,
like we did for alpha-2/beta-1.
Eye movements tend to be made in the theta range (3–7 Hz),
and a concern was that these movements (and their correlates)
could contribute to the observed changes in theta synchrony.
However, we found little evidence that this was the case. We first
sought to control for timing differences in saccades made during
the feedback period, both on correct and incorrect trials. To do
so, we aligned all of the data on a trial-by-trial basis to the first
saccade the animal made away from the target that was chosen.
After this re-alignment, we recomputed the PPC and found that,
despite this realignment, theta synchrony remained significantly
higher on correct trials (�200 to 0 ms prior to the saccade
away, +0.1012, p < 23 10�4, bootstrap, Figure 7B). In fact, it ap-
peared that the rise in the theta synchrony preceded this eye
movement away and was more closely time locked to the deliv-
ery of the feedback. Specifically, we found that theta synchrony
on correct trials peaked 81–119 ms before the saccade and
approximately 231–269 ms after the feedback (95%, CI).
Alternatively, using the eye-tracking data, we assessed both
saccade velocity and the average number of saccades made
over the feedback period. We found that while there was an in-
crease in the number of saccades on incorrect trials (+4 sac-
cades, p < 2 3 10�4, bootstrap), there were not any changes
with learning either in the number of detectable saccades or in
the average saccade velocity over the entire feedback period
analyzed (0–1.7 s) (Figures 7C and 7D). Finally, it was possible
that the theta synchrony present in the Category-Saccade task
may be tied to eye movements that do not occur in the Match
tasks. Again, this was not the case. We found that over the
1.7 s feedback period, there was a median number of nine sac-
cades in the Category-Match task, strikingly similar to the me-
dian number of eight saccades found in the Category-Saccade
task (Figure 7E).
DISCUSSION
We found evidence that two tasks involving match decisions
engaged explicit learning, whereas a task involving a visuomotor
(Saccade) association engaged implicit learning. Further, we
demonstrated that these putative explicit and implicit learning
tasks had different patterns of neural synchrony following cor-
rect versus incorrect behavioral choices. During the explicit
(Match) tasks, there was an increase in alpha-2/beta synchrony
following a correct choice and an increase in delta/theta syn-
chrony following an incorrect choice. The implicit (Saccade)
task showed a different pattern. Like the explicit (Match) tasks,
alpha-2/beta synchrony increased after correct choices. But
unlike the Match tasks, which showed increases in delta/theta
synchrony after incorrect choices, the implicit (Saccade) task
showed increased delta/theta synchrony after correct choices.
The two types of tasks also showed differences in how
synchrony changed with learning. Alpha-2/beta-1 synchrony
increased during explicit learning (both Match tasks) until the an-
imals reached a high level of performance, then it dropped off. By
contrast, during the implicit (Saccade) task, alpha-2/beta-1 did
not increase with learning and theta synchrony decreased.
The evidence that the tasks engaged different learning sys-
tems came from how errors were treated. During the implicit
(Saccade) task, performance was better immediately following
a correct than following an incorrect trial. Correct responses
drove improvements in performance. This is consistent with ob-
servations that amnesia patients (who rely on implicit learning)
acquire new skills more rapidly, and retain them longer, with
errorless learning (Squires et al., 1997; Evans et al., 2000;
Maxwell et al., 2001; Poolton et al., 2005; Roberts et al., 2016).
By contrast, during the explicit (Match) tasks, performance
was nearly equivalent following correct and incorrect trials. In
other words, explicit learning also utilizes feedback about incor-
rect responses to improve behavior. The greater ERN in the
explicit (Match) tasks than in the implicit (Saccade) task further
supports this conclusion. In humans, the ERN is correlated
with error awareness, conflict monitoring, and the use of errors
to improve learning, all hallmarks of explicit learning (Frank
et al., 2005; Scheffers and Coles, 2000; Walsh and Anderson,
2012; Wessel et al., 2011; Wessel, 2012). For example, explicit
learners of a sensorimotor sequence task exhibited an enhanced
ERN relative to implicit learners (R€usseler et al., 2003). Our re-
sults are also consistent with other reports that use of correct
versus error feedback differentiates implicit versus explicit
learning tasks (Morrison et al., 2015; Smith et al., 2014). More-
over, in the Match tasks, when errors arose in the context of
higher behavioral certainty, the ERN was larger and could have
reflected a prediction error. This was not the case in Saccade
(implicit) task. Explicit, not implicit, learning relies on the evalua-
tion of specific rules (predictions) to guide performance. The
Saccade task was likely more amenable to implicit learning
because it allowed a motor response to be associated with the
sample stimulus.
Category learning, and more specifically the dot-category
learning employed here, has been found to rely on either implicit
or explicit learning systems, depending on the task structure and
instructions (Ashby and O’Brien, 2005; Ashby and Maddox,
2011; Carpenter et al., 2016; Reber et al., 1998; Milton and Po-
thos, 2011; Seger and Miller, 2010). If the dot learning was
accompanied by motor instructions (such as point to center of
dot pattern), or the taskwas an A-/not-A category distinction, im-
plicit memory was used (Squire and Knowlton, 1995; Zeitha-
mova et al., 2008). If instead, participants were told that there
were different patterns, explicit memory was used (Aizenstein
et al., 2000; Reber et al., 2003). Likewise, two of our tasks (Cate-
gory-Match and Category-Saccade) required categorization of
dot patterns but had different behavioral requirements that
seemed to engage explicit versus implicit learning, the latter
based on a motor decision. Our results are also in line with other
observations that working memory tasks that seem formally
equivalent (e.g., ‘‘remember objects’’) can have different neural
correlates depending on whether those memories are reported
by actively choosing a match from alternatives or recognizing
their match (Warden and Miller, 2010).
During explicit learning, alpha-2/beta band synchrony
increased on correct choices, increased over the course of
learning, and decreased after learning. Alpha-2/beta band syn-
chrony has been tied to cognitive functions such as attention,
top-down control, and feedback processing. This seems consis-
tent with its role in explicit memory formation. Moreover, in a
previous report, this feedback-period, alpha-2/beta band syn-
chrony had been found to first arise from the hippocampus
Neuron 96, 521–534, October 11, 2017 531
(Brincat and Miller, 2015). Together, all of this information sug-
gests that the alpha-2/beta band synchrony found in the feed-
back period may reflect the activity of specialized neural circuits
originating from the hippocampus responsible for explicit
learning.
Theta synchrony, on the other hand, has been linked with
learning, memory, and conflict monitoring (Colgin, 2013). Theta
oscillations and theta stimulation have been known to facilitate
both long-term potentiation (LTP) and long-term depression
(LTD) in vitro and in vivo (Huerta and Lisman, 1995; Hyman
et al., 2003). Theta synchrony has never been reported in non-
human primates in response to correct feedback, nor has its
decrease with learning. It has been found to become more prev-
alent in patients with even mild Alzheimer’s, who by definition
increasingly rely on implicit learning strategies (Coben et al.,
1990; Jeong, 2004). Our observations of theta synchrony within
prefrontal cortex and between prefrontal cortex and striatum, in
addition to the hippocampus, suggest that theta synchrony is a
widespread plasticity signal. Implicit learning, therefore, may
depend on global changes in LTD and LTP rather than the acti-
vation of specific hippocampal-based networks.
Alternatively, theta oscillations may act as a mechanism orga-
nizing neural activity between brain areas. Previous studies have
suggested that low-frequency synchronizations facilitate long-
distance communication. For instance, theta synchrony has
been reported to coordinate activity between regions, such as
V4-FEF (Liebe et al., 2012), STR-HPC (DeCoteau et al., 2007),
FEF-ACC (Babapoor-Farrokhran et al., 2017), PFC-HPC (Bench-
enane et al., 2010), PFC-STR-HPC (Herweg et al., 2016), and
LIP-TEO-V4-Pulvinar (Wang et al., 2012). In particular, one study
found that as animals learned a procedural task, theta oscilla-
tions within STR and HPC became anti-phasic (DeCoteau
et al., 2007). The presence of theta synchrony, hence, between
PFC and STR may facilitate the functional connectivity between
PFC and STR over that of PFC and HPC.
In sum, our results suggest that explicit versus implicit learning
not only engages different brain systems, it may also engage
different neural mechanisms that rely on different patterns of
oscillatory synchrony.
STAR+METHODS
Detailed methods are provided in the online version of this paper
and include the following:
d KEY RESOURCES TABLE
d CONTACT FOR REAGENT AND RESOURCE SHARING
d EXPERIMENTAL MODEL AND SUBJECT DETAILS
d METHOD DETAILS
532
B Task Details
B Neurophysiology and Hardware
B Prototype and Exemplar Generation
B Block Design
B Bias Correction
d QUANTIFICATION AND STATISTICAL ANALYSIS
B Learning Stages
B Behavioral Analyses
B Evoked Potential and Error-Related Negativity
Neuron 96, 521–534, October 11, 2017
B Time-Frequency Analysis
B Synchrony Analysis
B Subtraction of Eye Movement Away
B Linear Regression
B Category-Saccade Controls
d DATA AND SOFTWARE AVAILABILITY
SUPPLEMENTAL INFORMATION
Supplemental Information includes four figures and can be found with this
article online at https://doi.org/10.1016/j.neuron.2017.09.032.
AUTHOR CONTRIBUTIONS
R.F.L. analyzed all the data and both designed and conducted the Category-
Match experiment. S.L.B. designed and conducted the Object-Match experi-
ment. E.G.A. designed and conducted the Category-Saccade experiment.
E.K.M designed the experiments. R.F.L. and E.K.M wrote the paper.
ACKNOWLEDGMENTS
We thank Andre Bastos, Brenna Gray, Jacob Donoghue, Simon Kornblith, Mi-
kael Lundqvist, Morteza Moazami, Jefferson Roy, and Andreas Wutz for
thoughtful comments and technical assistance during data analysis, data
collection, and animal training. We also would like to thank Dr. Anne-Sophie
Touret for her careful paper revisions and meaningful insights. This work
was supported by NIMH R37MH087027 and R01MH065252 and The Picower
Institute Innovation Fund.
Received: May 1, 2017
Revised: August 7, 2017
Accepted: September 20, 2017
Published: October 11, 2017
REFERENCES
Aizenstein, H.J., MacDonald, A.W., Stenger, V.A., Nebes, R.D., Larson, J.K.,
Ursu, S., and Carter, C.S. (2000). Complementary category learning systems
identified using event-related functional MRI. J. Cogn. Neurosci. 12, 977–987.
Antzoulatos, E.G., and Miller, E.K. (2011). Differences between neural activity
in prefrontal cortex and striatum during learning of novel abstract categories.
Neuron 71, 243–249.
Antzoulatos, E.G., and Miller, E.K. (2014). Increases in functional connectivity
between prefrontal cortex and striatum during category learning. Neuron 83,
216–225.
Asaad, W.F., Rainer, G., and Miller, E.K. (1998). Neural activity in the primate
prefrontal cortex during associative learning. Neuron 21, 1399–1407.
Ashby, F.G., and Maddox, W.T. (2011). Human category learning 2.0. Ann. N Y
Acad. Sci. 1224, 147–161.
Ashby, F.G., and O’Brien, J.B. (2005). Category learning and multiple memory
systems. Trends Cogn. Sci. 9, 83–89.
Babapoor-Farrokhran, S., Vinck, M., Womelsdorf, T., and Everling, S. (2017).
Theta and beta synchrony coordinate frontal eye fields and anterior cingulate
cortex during sensorimotor mapping. Nat. Commun. 8, 13967.
Benchenane, K., Peyrache, A., Khamassi, M., Tierney, P.L., Gioanni, Y.,
Battaglia, F.P., andWiener, S.I. (2010). Coherent theta oscillations and reorga-
nization of spike timing in the hippocampal- prefrontal network upon learning.
Neuron 66, 921–936.
Brainard, D.H. (1997). The psychophysics toolbox. Spat. Vis. 10, 433–436.
Brincat, S.L., and Miller, E.K. (2015). Frequency-specific hippocampal-pre-
frontal interactions during associative learning. Nat. Neurosci. 18, 576–581.
Buschman, T.J., Denovellis, E.L., Diogo, C., Bullock, D., andMiller, E.K. (2012).
Synchronous oscillatory neural ensembles for rules in the prefrontal cortex.
Neuron 76, 838–846.
Carpenter, K.L., Wills, A.J., Benattayallah, A., and Milton, F. (2016). A compar-
ison of the neural correlates that underlie rule-based and information-integra-
tion category learning. Hum. Brain Mapp. 37, 3557–3574.
Chen, L.L., andWise, S.P. (1995). Supplementary eye field contrasted with the
frontal eye field during acquisition of conditional oculomotor associations.
J. Neurophysiol. 73, 1122–1134.
Coben, L.A., Chi, D., Snyder, A.Z., and Storandt, M. (1990). Replication of a
study of frequency analysis of the resting awake EEG in mild probable
Alzheimer’s disease. Electroencephalogr. Clin. Neurophysiol. 75, 148–154.
Cohen, N.J., and Squire, L.R. (1980). Preserved learning and retention of
pattern-analyzing skill in amnesia: dissociation of knowing how and knowing
that. Science 210, 207–210.
Colgin, L.L. (2013). Mechanisms and functions of theta rhythms. Annu. Rev.
Neurosci. 36, 295–312.
DeCoteau, W.E., Thorn, C., Gibson, D.J., Courtemanche, R., Mitra, P., Kubota,
Y., and Graybiel, A.M. (2007). Learning-related coordination of striatal and hip-
pocampal theta rhythms during acquisition of a procedural maze task. Proc.
Natl. Acad. Sci. USA 104, 5644–5649.
Evans, J.J., Wilson, B.A., Schuri, U., Andrade, J., Baddeley, A., Bruna, O.,
Canavan, T., Sala, S.D., Green, R., Laaksonen, R., et al. (2000). A comparison
of ‘‘errorless’’ and ‘‘trial-and-error’’ learning methods for teaching individuals
with acquired memory deficits. Neuropsychol. Rehabil. 10, 67–101.
Frank, M.J., Woroch, B.S., and Curran, T. (2005). Error-related negativity pre-
dicts reinforcement learning and conflict biases. Neuron 47, 495–501.
Gehring, W.J., and Willoughby, A.R. (2002). The medial frontal cortex and the
rapid processing of monetary gains and losses. Science 295, 2279–2282.
Hargreaves, E.L., Mattfeld, A.T., Stark, C.E.L., and Suzuki, W.A. (2012).
Conserved fMRI and LFP signals during new associative learning in the human
and macaque monkey medial temporal lobe. Neuron 74, 743–752.
Herweg, N.A., Apitz, T., Leicht, G., Mulert, C., Fuentemilla, L., and Bunzeck, N.
(2016). Theta-alpha oscillations bind the hippocampus, prefrontal cortex,
and striatum during recollection: evidence from simultaneous EEG-fMRI.
J. Neurosci. 36, 3579–3587.
Huerta, P.T., and Lisman, J.E. (1995). Bidirectional synaptic plasticity induced
by a single burst during cholinergic theta oscillation in CA1 in vitro. Neuron 15,
1053–1063.
Hyman, J.M., Wyble, B.P., Goyal, V., Rossi, C.A., and Hasselmo, M.E. (2003).
Stimulation in hippocampal region CA1 in behaving rats yields long-term
potentiation when delivered to the peak of theta and long-term depression
when delivered to the trough. J. Neurosci. 23, 11725–11731.
Jeong, J. (2004). EEG dynamics in patients with Alzheimer’s disease. Clin.
Neurophysiol. 115, 1490–1505.
Jutras, M.J., Fries, P., and Buffalo, E.A. (2009). Gamma-band synchronization
in the macaque hippocampus and memory formation. J. Neurosci. 29,
12521–12531.
Jutras, M.J., Fries, P., and Buffalo, E.A. (2013). Oscillatory activity in the mon-
key hippocampus during visual exploration andmemory formation. Proc. Natl.
Acad. Sci. USA 110, 13144–13149.
Kornblith, S., Buschman, T.J., and Miller, E.K. (2016). Stimulus load and oscil-
latory activity in higher cortex. Cereb. Cortex 26, 3772–3784.
Liebe, S., Hoerzer, G.M., Logothetis, N.K., and Rainer, G. (2012). Theta
coupling between V4 and prefrontal cortex predicts visual short-term memory
performance. Nat. Neurosci. 15, 456–462, S1–S2.
Maxwell, J.P., Masters, R.S.W., Kerr, E., and Weedon, E. (2001). The implicit
benefit of learning without errors. Q. J. Exp. Psychol. A 54, 1049–1068.
Milner, B., Corkin, S., and Teuber, H.-L. (1968). Further analysis of
the hippocampal amnesic syndrome: 14-year follow-up study of H.M.
Neuropsychologia 6, 215–234.
Milton, F., and Pothos, E.M. (2011). Category structure and the two learning
systems of COVIS. Eur. J. Neurosci. 34, 1326–1336.
Morrison, R.G., Reber, P.J., Bharani, K.L., and Paller, K.A. (2015). Dissociation
of category-learning systems via brain potentials. Front. Hum. Neurosci.
9, 389.
Pasupathy, A., and Miller, E.K. (2005). Different time courses of learning-
related activity in the prefrontal cortex and striatum. Nature 433, 873–876.
Pelli, D.G. (1997). The VideoToolbox software for visual psychophysics: trans-
forming numbers into movies. Spat. Vis. 10, 437–442.
Poolton, J.M., Masters, R.S.W., and Maxwell, J.P. (2005). The relationship be-
tween initial errorless learning conditions and subsequent performance. Hum.
Mov. Sci. 24, 362–378.
Posner, M.I., Goldsmith, R., and Welton, K.E., Jr. (1967). Perceived distance
and the classification of distorted patterns. J. Exp. Psychol. 73, 28–38.
Reber, P.J., Stark, C.E.L., and Squire, L.R. (1998). Contrasting cortical activity
associated with category memory and recognition memory. Learn. Mem. 5,
420–428.
Reber, P.J., Gitelman, D.R., Parrish, T.B., and Mesulam, M.M. (2003).
Dissociating explicit and implicit category knowledge with fMRI. J. Cogn.
Neurosci. 15, 574–583.
Roberts, J.L., Anderson, N.D., Guild, E., Cyr, A.-A., Jones, R.S.P., and Clare, L.
(2016). The benefits of errorless learning for people with amnestic mild cogni-
tive impairment. Neuropsychol. Rehabil. Published online August 8, 2016.
https://doi.org/10.1080/09602011.2016.1216000.
R€usseler, J., Kuhlicke, D., andM€unte, T.F. (2003). Human error monitoring dur-
ing implicit and explicit learning of a sensorimotor sequence. Neurosci. Res.
47, 233–240.
Sakai, K., andMiyashita, Y. (1991). Neural organization for the long-termmem-
ory of paired associates. Nature 354, 152–155.
Scheffers, M.K., and Coles, M.G.H. (2000). Performance monitoring in a
confusing world: error-related brain activity, judgments of response accuracy,
and types of errors. J. Exp. Psychol. Hum. Percept. Perform. 26, 141–151.
Scoville, W.B., and Milner, B. (1957). Loss of recent memory after bilateral hip-
pocampal lesions. J. Neurol. Neurosurg. Psychiatry 20, 11–21.
Seger, C.A., and Miller, E.K. (2010). Category learning in the brain. Annu. Rev.
Neurosci. 33, 203–219.
Smith, J.D., Boomer, J., Zakrzewski, A.C., Roeder, J.L., Church, B.A., and
Ashby, F.G. (2014). Deferred feedback sharply dissociates implicit and explicit
category learning. Psychol. Sci. 25, 447–457.
Squire, L.R., and Knowlton, B.J. (1995). Learning about categories in the
absence of memory. PNAS 92, 12470–12474.
Squires, E.J., Hunkin, N.M., and Parkin, A.J. (1997). Errorless learning of novel
associations in amnesia. Neuropsychologia 35, 1103–1111.
Torrence, C., and Compo, G.P. (1998). A practical guide to wavelet analysis.
Bull. Am. Meteorol. Soc. 79, 61–78.
Vinck, M., van Wingerden, M., Womelsdorf, T., Fries, P., and Pennartz, C.M.A.
(2010). The pairwise phase consistency: a bias-free measure of rhythmic
neuronal synchronization. Neuroimage 51, 112–122.
Vogels, R., Sary, G., Dupont, P., and Orban, G.A. (2002). Human brain regions
involved in visual categorization. Neuroimage 16, 401–414.
Walsh, M.M., and Anderson, J.R. (2012). Learning from experience: event-
related potential correlates of reward processing, neural adaptation, and
behavioral choice. Neurosci. Biobehav. Rev. 36, 1870–1884.
Wang, L., Saalmann, Y.B., Pinsk, M.A., Arcaro, M.J., and Kastner, S. (2012).
Electrophysiological low-frequency coherence and cross-frequency coupling
contribute to BOLD connectivity. Neuron 76, 1010–1020.
Warden, M.R., and Miller, E.K. (2010). Task-dependent changes in short-term
memory in the prefrontal cortex. J. Neurosci. 30, 15801–15810.
Wessel, J.R. (2012). Error awareness and the error-related negativity: evalu-
ating the first decade of evidence. Front. Hum. Neurosci. 6, 88.
Wessel, J.R., Danielmeier, C., and Ullsperger, M. (2011). Error awareness re-
visited: accumulation of multimodal evidence from central and autonomic ner-
vous systems. J. Cogn. Neurosci. 23, 3021–3036.
Neuron 96, 521–534, October 11, 2017 533

Williams, Z.M., and Eskandar, E.N. (2006). Selective enhancement of associa-
tive learning by microstimulation of the anterior caudate. Nat. Neurosci. 9,
562–568.
Wirth, S., Yanike, M., Frank, L.M., Smith, A.C., Brown, E.N., and Suzuki, W.A.
(2003). Single neurons in the monkey hippocampus and learning of new asso-
ciations. Science 300, 1578–1581.
534 Neuron 96, 521–534, October 11, 2017
Wirth, S., Avsar, E., Chiu, C.C., Sharma, V., Smith, A.C., Brown, E., and Suzuki,
W.A. (2009). Trial outcome and associative learning signals in the monkey hip-
pocampus. Neuron 61, 930–940.
Zeithamova, D., Maddox, W.T., and Schnyer, D.M. (2008). Dissociable proto-
type learning systems: evidence from brain imaging and behavior. J. Neurosci.
28, 13194–13201.
STAR+METHODS
KEY RESOURCES TABLE
REAGENT or RESOURCE SOURCE IDENTIFIER
Experimental Model: Organisms/Strains
Rhesus Macaque (Macaca Mulatta) Primate Center N/A
Software and Algorithms
MATLAB MathWorks https://www.mathworks.com
CORTEX National Institute of Mental Health https://www.nimh.nih.gov/labs-at-nimh/research-
areas/clinics-and-labs/ln/shn/index.shtml
Psychtoolbox-3 Brainard, 1997; Pelli, 1997 http://psychtoolbox.org/
Other
64 ch. (8 3 8) Utah Array (Electrodes) Blackrock Microsystems N/A
FHC-Electrodes FHC N/A
U-probe (24 ch.) Plexon N/A
Cereplex M Headstage Blackrock Microsystems PN#8603
Cereplex E Headstage Blackrock Microsystems PN#8010
Eyelink I / II SR Research N/A
Custom built microdrives N/A N/A
Cerebus (128 channels) Blackrock Microsystems PN#4176
Multichannel Acquisition Processor Plexon N/A
HST/8o50-G1 (Headstage) Plexon N/A
VG2401mh 2400 Gaming Monitor Viewsonic N/A
5-RLD-E2-C Gravity feed dispenser Crist N/A
CONTACT FOR REAGENT AND RESOURCE SHARING
Further information and requests for resources and reagents should be directed to and will be fulfilled by the Lead Contact, Earl K.
Miller ([email protected]).
EXPERIMENTAL MODEL AND SUBJECT DETAILS
All experiments were performed in adult (�8–10 years old) rhesus macaques (Macaca mulatta), ranging from 5 to 13 kg. All proced-
ures followed the guidelines of the MIT Animal Care and Use Committee and the US National Institutes of Health. In total, 4 females
and 2 males were trained in this study. They were pair-housed, and on a normal 12-hr diurnal schedule. In the Category-Saccade
task, one of the animals had been previously trained on a conditional association task. In the Category-Match task, one of the animals
was being actively treated with cyclosporine daily. All animals spent approximately 1-2 years of training on their respective tasks.
METHOD DETAILS
Task DetailsThe details of the Object-Match task have been presented previously (Brincat and Miller, 2015). In each session, six novel objects
were chosen from an image database (Hemera Photo-Objects). Four were randomly designated as cue objects, and the remaining
two as associate objects. In turn, each cue object was randomly paired with an associate object. Themonkeys’ task throughout each
session was to learn, through trial-and-error, which associate was paired with each cue. To initiate a trial, each monkey fixated on a
central white dot for 0.5 s. After this fixation period, a cue object (foveal, 3� wide) was presented for 0.5 s, followed by a blank delay of
0.75 s. Two associate objects were then presented in a randomly-ordered series. Each object presentation lasted 0.5 s, andwas then
followed by another a brief delay of 0.6 s. To indicate that an object was a match, the monkey had to saccade to a subsequently
presented visual target, a white dot presented 7.5� to the left or right of fixation. And if it did so, the animal received juice and a
new trial began within 3 s. If incorrect, instead of juice, a red ‘‘error screen’’ flashed on for 1.5 s, and the animal had to wait 6 s
for the subsequent trial. The location (left versus right) of the response target after each associate was randomized and unrelated
to task performance.
Neuron 96, 521–534.e1–e7, October 11, 2017 e1
The details of Category-Saccade task have also been presented previously (Antzoulatos and Miller, 2011, 2014). In this task, an-
imals had to learn to classify a number of category exemplars generated from two different prototypes into two categories. Each cate-
gory was directly tied to a specific saccadic target (right or left). To start a trial, animals first fixatedwithin 1.5-2� of a red, central target(0.4� in diameter) for 0.7 s. After this fixation period, a randomly chosen category exemplar (6� by 6�) from either category was pre-
sented for 0.6 s. Trials from both categories were randomly interleaved throughout the session. One second after the end of
the exemplar period, two saccade targets (a green dot, 0.6� in diameter) appeared on the left and right of the center of fixation
(5� from the center). In order to indicate a response, the animals had to make a single, direct saccade within 1 s of target presentation
and maintain fixation on it for 0.2 s. If the animal chose correctly, it was rewarded with drops of juice. If the animal did not, it was
punished with a 5 s timeout, during which the cue was presented again at the location of the corresponding target.
In each session of the Category-Match, animals had to classify a number of category exemplars generated from two novel
different prototypes into two categories. Each category here, however, was neither tied to any particular saccade nor saccade loca-
tion. Instead at the test period, the animal had the opportunity to freely investigate two exemplars, one of whichmatched the category
of the sample exemplar, and then had to choose by fixating on thismatch. To initiate each trial, each animal had to fixate within 2.5� ofa centrally located, red dot (0.2� in diameter) for 0.5 s. After this fixation, an exemplar of one of the two categories was presented at
the center of the screen (7� by 7�) for 1 s. If the animal continued to fixate through this sample period, and a subsequent delay of 0.85 s
(with an additional jitter of 0.4 s), then the central fixation dot disappeared and two new exemplars were presented on the left and right
side of the screen (9� from the center of the screen). Once the test exemplars appeared, the animal had the opportunity to freely view
both of the exemplars presented and make the correct choice. To indicate this choice, the animal had to fixate on one of the two
peripherally presented exemplars for 0.7 s. If it made the correct choice, the white dots of the chosen exemplar turned green and
the animal received juice. If the animal did not make the correct choice, the chosen exemplar turned red and no juice was given. De-
pending on the animal, the length of timeout incurred on error trials varied from 5-16 s.
Neurophysiology and HardwareIn both theCategory-Saccade andObject-Match task stimulus presentation and reward delivery were controlled by Cortex (NIMH,
Laboratory of Neuropsychology) and presented on a 100 Hz CRT monitor. Eye movements and pupil size were monitored and re-
corded using an infrared eye tracking system (Eyelink I & Eyelink II, SR Research @ 500 Hz). In these tasks, up to 16 electrodes
were lowered in PFC, HPC, or STR acutely. All recordings from PFC and STR, and most from HPC, were performed with epoxy-
coated tungstenmicroelectrodes (FHC). On someHPC recordings, 24-channel linear probes with 300-um spacing between adjacent
platinum iridium contacts were used (U-probes, Plexon). For targeting, the animals’ implanted chambers were co-registered with
structural MRI images. For all of the PFC, STR, and someHPC recordings, these electrodes were lowered daily though the dura using
custom-built, screw micro-drives. The exact location on the grid and orientation of the grid were varied to limit cortical damage and
maximize coverage of the intended regions. For the linear probes, electrodes were lowered through a 25-gauge transdural cannula
using a motorized drive system (NAN-S4, NAN instruments). The electrodes would be lowered until spiking was detected, and then
electrodes were allowed to sit for about an hour to limit apparent neural drift. Neural activity was amplified, filtered, digitized and
stored using an integrated multichannel recording system (Multichannel Acquisition Processor, Plexon). The signal from each elec-
trode was amplified by a high input–impedance, unitary gain headstage (HST/8o50-G1, Plexon), referenced to ground, filtered from
0.7–300 Hz, and amplified 1000-fold. LFPs were recorded continuously at 1 kHz. Only electrodes with cells present on them were
included for these analyses and, after trial cutting, evoked potentials were subtracted out from each individual trial.
In the Category-Match task, stimulus presentation and reward delivery were controlled by custom software written in MATLAB
using PsychToolbox. All stimuli were presented on a LCD screen at 144 Hz (ViewSonic VG2401mh 24’’ Gaming Monitor). Eye move-
ments and pupil size were monitored using EyeLink II at 1000 Hz sampling. Four 8x8 channel Blackrock Cereport arrays with 1mm
long electrodes were implanted in dorsomedial prefrontal cortex (dmPFC), dorosolateral prefrontal cortex (dlPFC), and ventrolateral
prefrontal cortex (vlPFC). Each electrode was separated by 400 um. vlPFC, dlPFC, and dmPFC were all defined by anatomical land-
marks following the craniotomy. The vlPFC array was placed 1mm ventral to the principal sulcus and was centered at 9-12mm ante-
rior to the genu of the arcuate sulcus. In contrast, the dlPFC array was positioned slightly more rostral, 12-15mm anterior to the genu
of the arcuate and 1 mm dorsal to the principal sulcus. Finally, we placed the dmPFC (dorsomedial prefrontal cortex) array in the
vicinity of where others have reported to identify the supplementary eye fields. The medial edge of the array was placed 5mm
from the midline, and 5mm anterior to the genu of the arcuate sulcus. We recorded using Blackrock headstages (Blackrock Cereplex
M and Cereplex E). Signals were sampled at 30 kHz, band-passed between 0.3 Hz and 7.5 kHz (1st order Butterworth high-pass and
3rd order Butterworth low-pass), and digitized at a 16-bit, 250 nV/bit. All LFPs were recorded with a low-pass 250 Hz Butterworth
filter, referenced to ground, sampled at 1 kHz, and AC-coupled. In Monkey G, an error in the design of the Cereplex E head-stage
made the system susceptible to ground loops and to DC-drifts in the signal. This required us to apply a high-pass, 0.5 Hz FIR filter
in both directions on the whole dataset to avoid any phase distortions. All arrays had units present on at least 5, if not typically a large
proportion of channels. All channels were included in this analysis, and for all synchrony analyses the evoked potentials averaged
across trials were subtracted from each individual trial.
e2 Neuron 96, 521–534.e1–e7, October 11, 2017

Prototype and Exemplar GenerationIn both the Category-Match and Category-Saccade tasks, the visual stimuli were composed of 7 randomly located dots on a black
background. To construct the categories, we followed previously published procedures (Posner et al., 1967; Vogels et al., 2002; Ant-
zoulatos and Miller, 2011). Every day, two novel prototypes were created at random. These prototypes (as would be the exemplars)
were generated as 7 arbitrarily positioned, 7-pixel dots on a grid of 140 by 140 pixels. In order to control for difficulty and ease, these
arbitrarily constructed prototypes had to obey a number of rules: (1) They had no dot centers that fell within 14 pixels of one another.
(2) The average dot position of the prototype was at the center of the grid. (3) No dots from each exemplar fell within a 10-dot margin
on the edge. And, (4) the minimum Euclidean distance between all pairs of dots between each prototype was no greater than 200
pixels. Each of these 140 3 140 pixel exemplars subtended 6-7 degrees of visual angle.
In order to generate the exemplars, the prototype dot patterns were jittered according to a procedure first established by Posner
and colleagues (Posner et al., 1967). To determine this jitter, we first defined 5 concentric annular regions. These annuli were centered
around each dot, and spaced apart radially by 7 pixels. Region 1 refers to the annulus immediately surrounding the dot center, 1 dot-
diameter away, and region 5 refers to the annulus 5 dot-diameters away from this dot. Next, each dot from each prototypewas shifted
away from its prototypical location by at least 1 region; no exemplar was identical to the prototype. Whether any particular dot was
moved to regions 2 to 5 depended on the distortion level desired. Each exemplar had to be unique, different from any other exemplar,
and, to ensure such, no more than 2 dots from each exemplar could be less than 10 pixels away from any other exemplar’s dots.
Posner et al. defined 9 distinct levels of distortion, based on the probability of a dot to shift to each of these 5 concentric regions.
Two of these 9 distortions were used in this task. At distortion level 1, 88% of dots were shifted to region 1, 10% to region 2, 1.5% to
region 3, 0.4% to region 4, and 0.2% to region 5. At distortion 2, 75%of dots were shifted to region 1, 15% to region 2, 5% to region 3,
3% to region 4, and 2% to region 5. In the Category-Saccade task, the generated exemplars were largely at distortion level 2. In the
Category-Match task, which appeared more difficult for animals to acquire, distortion level 1 exemplars were used for both animals.
As a side note, in order to rule out that any of the reported effects were a result of the level distortion, we repeated 3 sessions in one of
the twomonkeys at distortion level 2. The results were similar; themonkey showed an enhancement of synchrony in the beta band on
correct trials and theta band on incorrect trials.
Overall, the use of these visual stimuli in both tasks provided for us a number of advantages: (1) These categories were not imbued
with any overt meaning to the subject, for they held no apparent relationship to objects seen in daily life. (2) The exemplars which
could, in fact, look distinctively different from one another were always perceptually related and averaged out to the original proto-
type. And (3), these categories could not be distinguished by any simple rule.
Block DesignTo facilitate learning, in both the Category-Match and Category-Saccade task, each learning session was organized into blocks. The
blocks were defined by a progressively growing pool of available exemplars from which any could be used for a given trial and any
task period (sample or test). In any given block, with the exception of block 1 in the Category-Saccade task, therewere a total of 2block
number of exemplars for each category. In the Category-Saccade task, in the first block, there was a single exemplar per category.
The pool of available exemplars grew by accretion, ‘‘new’’ exemplars were added to a bank of ‘‘familiar’’ ones, so that the total avail-
able exemplar was equal to 2block. The terms novel and familiar are not an indication for how familiar any exemplar was to an animal,
but simply a reflection of when it became available in the pool of potentially usable exemplars. As the blocks progressed, the chances
for only seeing novel exemplars increased substantially, and performance on these novel exemplars suggested successful catego-
rization. In fact, block transition was not possible without successful categorization, and the overlap of available exemplars between
blocks favored a smoother learning process.
In order to pass from one block to another, each animal had to achieve a particular behavioral criterion. The criteria diverged some-
what between the two category tasks. In the Category-Saccade task, a block transition occurred when the animal had correctly
responded to 80% of the previous 20 trials. In the Category-Match task, both animals had a tremendous capacity for being biased
in either choosing a particular location and/or a particular category. In order to limit these behavioral biases, each animal had
to successfully complete 70% of the previous 10 trials for each potential condition (Category A – on left, Category A – on right,
Category B – on left, and Category B – on right). Because of these behavioral criteria in both tasks, not all available exemplars
were presented in each block. In the Category-Match task, an additional restraint was imposed on the pool of available exemplars
presented in block 1. Because both animals struggled to pass block one, in which two exemplars from each category were pre-
sented, the exemplars from each category had to have a Euclidean distance of less than 20 pixels apart. This constraint reduced
the difficulty of the first block, promoted rapid block passage, and ultimately favored category abstraction. Following block one, there
was no limitation on the presented exemplars.
Bias CorrectionThe Category-Match was a more difficult task to maintain high levels of performance and, as a result, if left to each of their own de-
vices, each of the animals engaged in suboptimal strategies and would fail to learn to categorize stimuli. To avoid these aberrant
behaviors, we detected the animals’ biases, and scaled the probability that any particular condition was shown to counteract
these ‘‘easier,’’ inefficient strategies. In order to assess bias in any one of the four conditions enumerated above, we compared
performance in each of the four conditions to one another, and computed the Mann Whitney U test statistic (U) for each of these
Neuron 96, 521–534.e1–e7, October 11, 2017 e3
comparisons. R1 represents the sum of ranks for condition 1 and the n1 represents the sample size for sample 1. From this test sta-
tistic, we obtained the area under the curve, subtracted 0.5 to obtain a bias measure, and remapped this bias measure to a value
between [0-1] by dividing it by 0.5. We then used this measure to scale the probability that any particular condition would be
seen. We only implemented this bias correction algorithm after 20 trials were performed in each of the blocks.
Eqn: 1 U=R1 � n1ðn1 + 1Þ2
Eqn: 2 AUC=U
n1n2
Eqn: 3 Bias=ðAUC� 0:5Þ
0:5
QUANTIFICATION AND STATISTICAL ANALYSIS
Learning StagesIn a previous report, which analyzed this sameCategory-Saccade task, block 5 similarly marked the transition toward a late stage of
learning (Antzoulatos and Miller, 2011). In that study, early learning (alternatively called stimulus-response association) was defined
as the first two blocks of the task, where novel exemplar performance was at chance. By contrast, late learning (alternatively called
category-performance) was defined as those blocks when novel performance on each category in a 16-trial window was above 75%
correct. This behavioral criterion was reached on average by block 5. The middle stage of learning (alternatively called category
learning) was defined, therefore, as those blocks which remained, i.e., those blocks between the early and late stages of learning,
and hence blocks 3 and 4. Due to the congruence of the sliding t test first presented here and those previously published behavioral
results, we separated learning into the same learning stages.
In the Category-Match task, novel performance had already plateaued by block 2 (on average, trial 89), and a division of learning
stages by blocks was not appropriate. Because future analyses divided behavioral curves by 20 trial bins, we rounded the 89- trial
criterion to the next multiple of 20, and defined early learning as the first 100 trials and late learning as the next 100. Moreover,
because of the rapid learning particularly present in the Category-Match task, we restricted these analyses involving the learning
stages in both the Category-Saccade and Category-Match tasks to those days in which learning was a bit more difficult and perfor-
mance on all trials (not just novel) was less than or equal to 80% in the first 20 trials. In the Category-Match task, 39 days matched
these criteria, evenly spread across both monkeys (23 days fromMonkey P, 16 days fromMonkey G). In the Category-Saccade task,
12 days matched these criteria (8 days from Monkey 1, 4 days from Monkey 2). All days from all monkeys in each task were pooled
together. As we will see, learning in these analyses was assumed to be somewhat linear, and we expected to see physiological
changes that correlated with average changes in performance in late versus early trials. And while we did, we also show (when
binning trials from the entire session by performance) that none of these results depend on a particular learning stage classification
nor any assumption that learning need be linear.
Because the Object-Match task was not blocked, unlike the category tasks, the behavioral criteria for learning stages differed as
well. As previously reported, in the Object-Match task, only those sessions for which each of the final cue-associate pairings were
performed at 32 correct response over the final 50 trials (py 0.01, binomial test) were included in this final analysis. 61 sessions met
these criteria, and trials within them were simply divided into thirds. The first-third of the session was early learning, the second-third
middle learning, and the last-third late learning.
Behavioral AnalysesIn all three tasks, we computed performance in the trial following a correct trial or an incorrect trial irrespective of the following cate-
gory or cue-associate presented. A binomial distribution was fit to each of the post-correct and post-incorrect trial performances,
and 95% confidence intervals were generated. During these same trials, we compared reaction times on trials following correct
and incorrect trials. In both the Category-Saccade task and Object-Match task, we computed the differences in the time it took
the animals to respond following target presentation between correct and incorrect trials. In the Category-Match task, because
the task involved free viewing, we computed the differences in time between the presentation of thematch exemplars and the chosen
response after controlling for the number of saccades. To control for saccade number, we subtracted correct and incorrect trial times
when the animal completed a single saccade, and the same for two saccades. All significance testing was done on a distribution
generated through 10,000 bootstraps of correct-incorrect trial time differences over sessions in each task. From these distributions,
we computed 95% confidence intervals by finding the 2.5% and 97.5% quantiles of each distribution.
In order to confirm that performance following errors was greatly reduced in the Saccade task relative to the Match tasks, we also
examined whether mean performance over 10 and 20 trials after a correct or an error differed in each task. We computed a linear
e4 Neuron 96, 521–534.e1–e7, October 11, 2017
regression model without interactions and treated both total trial performance pre-feedback, and the type of feedback (correct or an
error) as independent variables, andmean trial performance in those 10 or 20 post-feedback trials as the response variable. The type
of feedback (correct or error) was treated as a categorical variable and, thus, the design matrix had a single column of 1’s or 0’s for
feedback type. We then pooled all combinations of trial feedback, post-feedback performance, and pre-feedback performance (10
or 20 trials) across all sessions, and used normal equations to analytically compute the coefficients for intercept, pre-feedback in-
fluence, and correct-incorrect post-feedback differences. We then randomly sampled all of the trials from all days, and computed
an empirical distribution for each coefficient of the model. In Figures 2E and 2F, we plotted correct-incorrect feedback coefficient
for each of the tasks. In Figure 2E, we examined the post feedback coefficient for 10 trials, and in Figure 2F for 20 trials.
In Figure S1, we visualized performance differences after correct and incorrect trials across a sequence of 8 trials post-feedback.
Again, we pooled all post feedback trials after correct and incorrect trials across all sessions, and randomly sampled the trials from
across the days to obtained a mean performance difference for each post-feedback trial (i.e., post-feedback trial 1, post-feedback
trial 2, etc.). We plot in Figure S1, an error-bar reflecting the standard deviation of this bootstrapped distribution.
Evoked Potential and Error-Related NegativityIn three tasks, we computed evoked potentials on correct and incorrect trials by averaging across trials on each electrode from each
region. As in previous work, in both the Object-Match and Category-Saccade tasks, recordings from each of these acute electrodes
were considered independent (Brincat and Miller, 2015; Antzoulatos and Miller 2011). In these two sets of recordings, pairs of elec-
trodes were placed > 1.5mmapart across a large swath of ventrolateral and dorsolateral prefrontal cortex. Evoked potentials from all
of these sites were averaged and plotted. For these analyses and others, we performed statistical testing by bootstrapping the trials
and pairs to ensure that the reported findings were not dependent on any independence assumption. In the Category-Match task,
evoked potentials were computed across an entire array and averaged across sessions. The error-related negativity is an evoked
potential that arises more prominently on incorrect trials and occurs in epochs spanning 80-300 ms following feedback. In order
to compute the error-related negativity, the evoked potential from incorrect trials was subtracted from correct trials. We aligned
all of the tasks to their maximal peak (i.e., where the error-related negativity is greatest), and then normalized the entire signal by
the mean and standard deviation of the differences across the entire trial and feedback (�2 s to 1.7 s post-feedback). To compare
the error-related negativity across the tasks, we computed the mean value of the normalized voltage differences for a 50ms period of
time centered around the maximum difference from each task. We computed 10,000 bootstraps and found the empirical value for
each comparison. In order to account for multiple comparisons, we applied a Bonferroni correction and multiplied all p values by 3.
In order to further test that the ERNwas greater in the Match tasks than in the Saccade task, we defined the ERN by estimating the
amplitude of the evoked potential arising subsequent to an error. In order to compute this amplitude, we found the maximum and
minimum value for each z-scored signal averaged across all incorrect trials in the feedback period for each electrode. The magnitude
of the ERNwas equal to the distance between themax andmin values, and we compared themean ERN across electrodes. To avoid
questions on the independence of different electrodes, we first bootstrapped the trials and then the electrodes 1,000 times to obtain
an empirical probability distribution on the size of the ERN. However, given both the large number of electrodes recorded daily (PFC,
n = 128; dmPFC, n = 64) and the large number of error trial counts, we chose to be conservative for the Category-Match task and
bootstrapped across the sessions. In order to test our a priori hypothesis that the ERN in the Match tasks was greater than in the
Saccade task, we computed the p values by finding the number of bootstraps that were greater in the match distributions than
that in the saccade distribution, and dividing by the total number of bootstraps. To visualize the independence between the specific
timing and the magnitude of the ERN computed, we took the maximum and minimum values found within three different time win-
dows (Figure S2: 50-350ms, 100-400ms, and 150-450ms). Also un-plotted we compared those results when taking the entire
50-450ms interval; the p values were equal equivalent to those in the 50-350ms window. Regardless of the interval chosen, we found
that the ERN in the Match tasks in the PFC was greater than that in the Saccade task. We also repeated these analyses in the HPC
(OM), dmPFC (CM), and STR (CS). Again, the same pattern was true: the ERN in both the HPC and the dmPFCwas greater than that in
the STR.
Using a similar method to that described above, we also obtained themagnitude of the ERN on a per trial basis. We again found the
distance between the maximum and minimum value in the feedback; however, in this case we did not average across trials. Instead,
before taking this distance, we averaged across all PFC electrodes. For each session, we had a single ERNmagnitude for each incor-
rect trial. Moreover, for each incorrect trial, we found the mean performance over the previous 20 trials. Since we were carrying out a
regression analysis examining how performance interacts with the ERN, we corrected the ERN magnitudes in each session by sub-
tracting its mean magnitude at 75% performance. This was meant to facilitate the comparison of the ERN magnitudes by removing
any day-specific effects. We next pooled trials across all sessions and used robust regression (as described below in the Linear
Regression section) to assess how a single trial ERN correlated with prior performance (Figure 2G). To compute statistical differ-
ences, we again randomly sampled across all of the magnitude-ern pairs, and the compared the computed coefficient to zero.
Time-Frequency AnalysisSpectrogram and coherograms were computed by applying the continuous wavelet transform to the trial-by-trial data. In order to
compute the transform efficiently, for each complex-valued Morlet wavelet of wave number 6, we multiplied its Fourier transform
by the Fourier transform of the trial data, and took the inverse Fourier transform of this product (Torrence and Compo, 1998). The
Neuron 96, 521–534.e1–e7, October 11, 2017 e5
61 daughter wavelets sampled the frequency space exponentially (base of 2), starting at a max frequency of 80 Hz, and ending 6
(numoctaves) exponential decreases later (here, 80/26 = 1.25 Hz). For every exponential decrease, here, for every halving, we sampled
10 frequencies (num_per_octave). All of the sampled frequencies from this paper can be given by the following equation:
Eqn: 5: Sampled Frequencies=max frequency
2
�0:
1num per octave
: numoctaves
�In order to obtain the amplitude or power from the complex output of the wavelet transform, we took the complex modulus of
wavelet coefficients. Alternatively, for phase values, we took the inverse tangent of the ratio of the real and imaginary components
of the wavelet coefficients.
Synchrony AnalysisTo estimate synchrony, we computed the pairwise phase consistency (PPC), an unbiased estimator of the magnitude squared resul-
tant (Vinck et al., 2010). In other words, the pairwise phase consistency statistic is a measure equivalent on the population level to the
square of the oft-used phase locking value (PLV) but which is uninfluenced in its average by trial number. In this study, differences in
trial number were prominent, as there were both differences in the number of incorrect and correct trials for any given session, as well
as differences in the number of correct trials in any given 20-trial window. In order to implement the PPC statistic, we used a simpli-
fication derived previously (Kornblith et al., 2016)
Equation 6.
PPC=2
NðN� 1ÞXN�1
j = 1
XNk = j +1
ðcos qj cos qk + sin qj sin qkÞ
=1
NðN� 1Þ
"�����XNj = 1
expðiqjÞ�����2
� N
#
= 1� varðcos qÞ � varðsin qÞwhere q is the vector of angular differences between two channels at any given point in frequency and time. N is the number of trials.
For every single channel-pair, we subtracted the phases (obtained from the wavelet-transformed data) of one channel from those
of another, took the variance of the sine and cosine of these angle differences across trials, and subtracted both of these variances
from 1. To compute changes in synchrony early and late in learning, we bootstrapped the channels or sessions 1,000 times and ob-
tained an empirical distribution. We used this distribution to estimate p values. Because we were looking for differences above or
below 0, we applied both a two-way test as well as a Bonferroni correction. The Bonferroni correction was used, instead of a
more statistically powerful multiple comparisons correction, because it is particularly effective at controlling the type I error when
different tests are potentially correlated.
Subtraction of Eye Movement AwayBecause one of the animals in the Category-Match task had some stereotyped eyemovements after correct responses, we removed
from both eye movement tasks (in this case, both Category tasks) the saccade related to the eye movement away from the response
target. In order to do so, we identified the time of the saccade away by taking the derivative of the eye trace and setting a voltage
threshold (+0.02V for the Category-Saccade, +0.05V for the Category-Match). We determined each of these thresholds based on
the threshold evoked by the saccade to the target. Once this threshold was reached, we cut the data prior to the threshold crossing
(50 ms) and after (Category-Match, 450ms; Category-Saccade, 250 ms). These times were determined by the shape of the evoked
potentials in each of the tasks (i.e., when the mean saccade potential returned to 0V). Different time windows around the saccade
were used, and none changed the results. After all of the saccadic periods were cut from each trial, we obtained a template for a
saccade for each electrode by taking the mean across all of saccades. Once we obtained this template, we returned to the original
data, and applied linear regression to obtain an optimal fit of the template to the saccade potential on each individual trial. Once we
found the optimal fit of the template to the data, we subtracted the template from the original data. In order to avoid spurious edge
effects, we re-filtered all of the data in both directions by two FIR equiripple filters. Filter 1 was a 106 order, low pass, equiripple FIR
filter at 80 Hz (Fpass = 80 Hz, Fstop = 100, Apass = 1, Astop = 60). Filter 2 was a 1047 order, high pass, equiripple FIR filter at 1.5 Hz
(Fstop = 0.7, Fpass = 1.5, Astop = 20, Apass = 1).
Linear RegressionTo both better assess the synchrony changes across learning, and avoid particular assumptions regardingwhether learning occurred
linearly over time, we estimated synchrony using PPC across all electrode pairs over 20-trial window bins across each session. We
computed the PPC only on correct trials, for we had previously found that most of the longer duration synchrony events occurred on
correct trials. These 20-trial windows were non-overlapping, and hence independent. For every 20-trial bin, we had a single PPC
value (averaged across all electrode pairs of interest) and an average performance value. We pooled all 20-trial PPC values across
e6 Neuron 96, 521–534.e1–e7, October 11, 2017
all sessions in each of the 3 tasks, and performed linear regression to assess whether PPC varied directly with performance. Our
design matrix was simply a column of 1 s (our intercept) for each 20-trial bin and another column for performance. After solving
the normal equation and calculating the residuals, we computed a t-value and a corresponding p value. In order to confirm that
the assumptions underlying linear regression were met, we plotted how synchrony varied performance from chance (50%) to high
performance (100%). We found that over the range of different performance level the variances at each level were largely equivalent
with the exception at 100%. To ensure that our results were resistant to this possible violation of heteroscedasticity, we performed
both linear regression on a reduced performance range from 50% to 95% (where variances were equal), and robust regression using
iteratively reweighted least-squares with a bi-square weighting function and a tuning constant of 4.685. Robust regression, unlike
ordinary least-squares regression, minimizes the influence of data points that are outliers by penalizing their influence. Neither of
these methods changed the results; and are unreported here.
Category-Saccade ControlsBecause eye movements tend to be rhythmic and occur in the 3-4 Hz range, we wanted to ensure that both correct-incorrect
synchrony differences and learning-related synchrony decreases were unrelated to changes in eye movements. To address these
concerns, we did two things: One, we controlled for the latency differences in the saccade away from the target that arose between
correct and incorrect trials. Two, we examined whether eye movements, like theta synchrony, changed with learning. To control for
the latency differences in the eye movement away from the target, we first estimated when saccades were made following the initial
saccade to the target using analog outputs from the eye monitoring system. After computing our wavelets and removing the evoked
potentials related to the feedback, we aligned each individual trial to this saccade away from the target. Despite this procedure con-
trolling for eye movements, theta synchrony differences emerged immediately following feedback, and did not appear influenced by
the realignment procedure.
In order to investigate eyemovement changeswith learning, we compared themean saccade velocity and the number of saccades
made in the feedback period (0-1.7 s). To assess saccade velocity, we cut the raw eye signal into trials, computed the animal’s po-
sition on the screen relative to center (by taking the square root of the sum of squares of the X and Y eye position signals), and took the
1st derivative of the resulting position signal. Saccade velocity was averaged across the 1.7 s of the feedback period, and the number
of saccades identified was equal to the number of time points that exceeded a voltage threshold of 0.025 V/s (�178 deg/s). The feed-
back period is a difficult time to capture behavioral events such as saccades, because the animal maymove out of eye tracking limits.
As a result, the values computed here may be underestimates of the true saccade count. Moreover, while visual inspection of the eye
traces at the thresholds given above suggests thatmany of these events are saccades, we cannot preclude that some of the saccadic
events are, in fact, eye blinks. Note that their inclusion here is conservative, and these flaws of behavioral observation are shared
across tasks. To compute significance, we bootstrapped the trials and sessions 10,000 times.
DATA AND SOFTWARE AVAILABILITY
Custom code for analyses will be provided upon request to the Lead Contact.
Neuron 96, 521–534.e1–e7, October 11, 2017 e7


![CLINICAL - RESPeRATE device to lower blood pressure naturally · The overall evidence from clinical trials and meta-analysis suggests that Device-guided slow breathing [RESPeRATE]](https://img.pdfslide.us/doc/110x75/5ee061a2ad6a402d666b9349/clinical-resperate-device-to-lower-blood-pressure-naturally-the-overall-evidence.jpg)