Embed Size (px)
Citation preview
A message from the editor...
Dear Refiner:
Synergy has been a major focus of both Grace Davison and Advanced RefiningTechnologies over the last year. This issue of the Catalagram features an article on our GENESIS catalyst blend, which draw on the performance of both our commercially provenMIDAS and IMPACT catalyst families. GENESIS catalysts have demonstrated their flexibilityand superior yields in a number of commercial applications, proving that, when combined,the blended catalysts' performance exceeds that of each of the individual components.
Our previous issue featured a lead article on synergy between hydroprocessing andFCC operations, concentrating on the dynamics between hydrotreated cat feed and its effecton FCC catalyst yields. Our leadership position with Grace Davison and Advanced RefiningTechnologies allows us to explore this area from both the DHT and FCCU angles.
Another synergy can be found in ART's SmARTTM and ApARTTM catalyst systems forULSD and CFH, respectively. These systems are designed with various components to meetyour specific needs for yields, feed, operating severity, hydrogen use and other critical vari-ables.
As we continue to explore the synergy between our existing products, we are alsocommitted to customer-driven research and development to deliver the refining catalysts foryour next challenges. Explore the synergy of our catalysts and let us optimize your units.We stand ready to partner with you to give you the best operations possible.
Regards,
Joanne DeadyJoanne DeadyVice PresidentFCC Marketing/Research and DevelopmentGrace Davison
Catalagram 102 Fall 2007 1

www.e-catalysts.com2
IN THIS ISSUEThe GENESISTM Catalyst SystemRosann K. Schiller, Denise Farmer, and Larry LanganGrace Davison Refining Technologies
Taking advantage of the synergy between catalyst technologies provides opti-mized yields and product selectivities for refiners.
3
GSR Products Maintain Excellent Performance When Used with Olefins AdditivesWu-Cheng Cheng and Ruizong HuGrace Davison Refining Technologies
The simultaneous and optimized use of Davison Additives allows a refinery toreach its operating and economic objectives.
12
CATALAGRAM 102Fall 2007
Managing Editor:Joanne Deady
Contributors:Wu-Cheng Cheng
Denise FarmerRuizhong HuDavid Hunt
Larry LanganMarilyn Moncrief
Chuck OlsenRosann K. Schiller
Yuying ShuKelly StaffordBrian Watkins
Rick WormsbecherA. E. Zieber
Please addressyour comments to
W. R. Grace & Co.-Conn.7500 Grace Drive
Columbia, MD 21044(410) 531-4000
www.e-catalysts.com
©2007W. R. Grace & Co.-Conn.
Catalytic FCC Gasoline Sulfur Reduction:Mechanism of Sulfur Reduction Excerpted from the Journal of CatalysisYuying Shu and Rick WormsbecherGrace Davison Refining Technologies
Understanding the mechanism of gasoline sulfur species formation enablesscientists to define catalytic solutions for gasoline sulfur reduction.
31
The information presented herein is derived from our testing and experience. It is offered, free of charge, for your considera-tion, investigation and verification. Since operating conditions vary significantly, and since they are not under our control, wedisclaim any and all warranties on the results which might be obtained from the use of our products. You should make noassumption that all safety or environmental protection measures are indicated or that other measures may not be required.
N U M B E R 1 0 2 Fa l l 2 0 0 7
INSIDE
> Recombination of Technologies
> FCC Equilibrium Catalyst Trends
> ULSD Catalyst Performance
> Sulfur Reduction
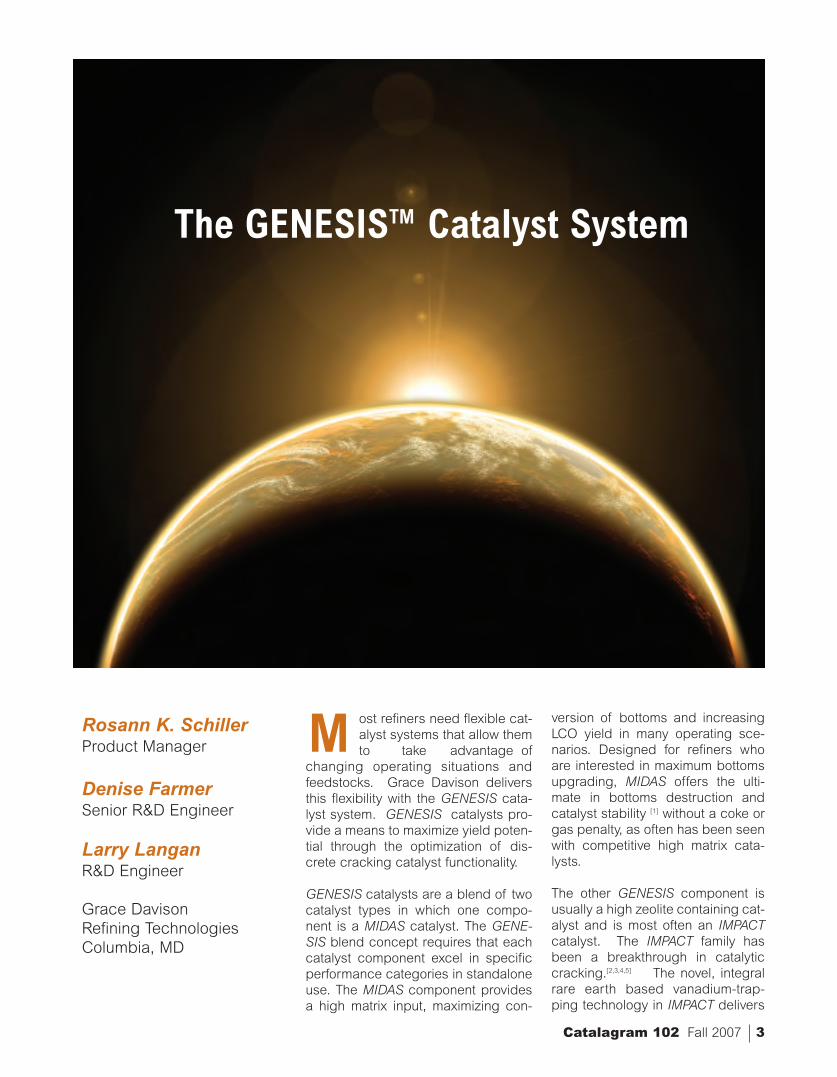
The GENESISTM Catalyst System
Worldwide FCC Equilibrium Catalyst Trends:A Ten-Year ReviewMarilyn Moncrief, David Hunt and Kelly StaffordGrace Davison Refining Technologies
This update demonstrates how Ecat activity, contaminants, and other proper-ties have changed, both worldwide and geographically, over the last ten years.It also allows individual refiners to rank their own Ecat properties relative to theindustry in several categories.
28The Effects of Treat Gas H2 Purity on ULSD Catalyst PerformanceA. E. ZieberProcess Engineer, Chevron, USA, Salt Lake City, UT RefineryBrian Watkins and Chuck OlsenAdvanced Refining Technologies
Hydrogen purity is a key component in extending run length and extendinghydrotreating catalyst life
20
Catalagram 102 Fall 2007 3
ost refiners need flexible cat-alyst systems that allow themto take advantage of
changing operating situations andfeedstocks. Grace Davison deliversthis flexibility with the GENESIS cata-lyst system. GENESIS catalysts pro-vide a means to maximize yield poten-tial through the optimization of dis-crete cracking catalyst functionality.
GENESIS catalysts are a blend of twocatalyst types in which one compo-nent is a MIDAS catalyst. The GENE-SIS blend concept requires that eachcatalyst component excel in specificperformance categories in standaloneuse. The MIDAS component providesa high matrix input, maximizing con-
version of bottoms and increasingLCO yield in many operating sce-narios. Designed for refiners whoare interested in maximum bottomsupgrading, MIDAS offers the ulti-mate in bottoms destruction andcatalyst stability [1] without a coke orgas penalty, as often has been seenwith competitive high matrix cata-lysts.
The other GENESIS component isusually a high zeolite containing cat-alyst and is most often an IMPACTcatalyst. The IMPACT family hasbeen a breakthrough in catalyticcracking.[2,3,4,5] The novel, integralrare earth based vanadium-trap-ping technology in IMPACT delivers
The GENESISTM Catalyst System
MRosann K. SchillerProduct Manager
Denise FarmerSenior R&D Engineer
Larry LanganR&D Engineer
Grace Davison Refining TechnologiesColumbia, MD

exceptional activity maintenance,coke and gas selectivity. The inclu-sion of IMPACT in the GENESIS sys-tem provides critical zeolite surfacearea and activity as well as superiorcoke and gas selectivity in a broadrange of applications, from severelyhydrotreated gasoils to heavy residfeeds.
It is well known that the key to opti-mal FCC catalyst performance isthe right balance between zeoliteactivity and matrix activity, or theZ/M ratio.[6] In pilot plant comparisontesting, a high Z/M catalyst will tendto have better coke and gas selec-tivity than a low Z/M formulation.However, the low Z/M catalyst willachieve lower bottoms yield at con-stant conversion, often with a cokepenalty. It is critical that zeolite andmatrix activity are appropriately bal-anced for each unit, taking into con-sideration the type of feed that isprocessed along with the unit con-straints and objectives. The GENE-SIS concept provides the ultimate inflexibility to optimize formulation Z/Mfor each specific application.
MIDAS: The Key Component
The superior bottoms destructionand catalytic stability obtained fromits open particle morphology makeMIDAS an excellent fit for applica-tion in all units wishing to minimizeslurry. Moreover, the design of thiscatalyst maximizes the balance ofpores in the 100-600 Å range withan optimized ratio of weak to strongacid sites in the matrix. This balanceof mesoporosity and optimized acidstrength greatly improves the selec-tivity of the bottoms cracking reac-tions that take place without the gaspenalty often observed with otherhigh matrix catalysts.[3]
For short contact time FCC applica-tions, it is critical that feed mole-cules have no limitations in gettingto the catalyst acid sites, and theMIDAS catalyst architecture is idealfor eliminating diffusion con-straints.[7] In addition to overcomingthe challenges of diffusion limitedsystems, MIDAS catalysts are also
Figure 1MIDAS Commercial Performance
Coke, wt.%
Bo
tto
ms,
wt.
%
15.0
12.5
10.0
7.5
5.03 4 5 6 7 8
Competitive Low Z/M Catalyst
MIDAS
www.e-catalysts.com4
Figure 2MIDAS Commercial Performance
Conversion, wt.%
Hyd
rog
en, w
t.%
0.55
0.50
0.40
0.35
0.30
58 62 66 70 74
Competitive Low Z/M Catalyst
MIDAS
0.25
0.45
Table IProperties of IMPACT and MIDAS Catalysts
IMPACT MIDAS
Fresh Properties
wt.% 45.2 49.5
wt.% 4.9 2.0
Surface Area, m2/g 317 267
Zeolite, m2/g 263 154
Matrix, m2/g 54 113
Deactivated Properties
Surface Area, m2/g 187 175
Zeolite, m2/g 149 92
Matrix, m2/g 38 83
Unit Cell, 24.28 24.29
Hg PSD, cm3/g 0.338 0.429
0-100, cm3/g 0.034 0.101
100-1000, cm3/g 0.132 0.279
1000+, cm3/g 0.172 0.049
Al2O3,
Re2O3,
Å
designed to minimize the deleteri-ous effects of high equilibrium cata-lyst (Ecat) contaminant metals levelsassociated with resid processingwhile delivering superior bottomscracking to LCO and gasoline at lowcoke yield.
The benefits of the MIDAS architec-ture have been demonstrated incommercial applications. Figures 1and 2 compare the performance ofMIDAS to a competitive high matrixcatalyst technology. Not only doesMIDAS demonstrate excellent bot-toms cracking, it also reducedhydrogen production by 20%despite higher metals on Ecat.
GENESIS: CombinedEffectiveness
Since MIDAS is the key componentin the GENESIS blends, the expec-tation is that the bottoms crackingperformance of the GENESIS sys-tem would be improved overIMPACT alone. Generally when bot-toms cracking increases, there is adecline in coke selectivity and viceversa. It is expected that as matrixactivity increases this is also true.[8]
However, the relationship betweenbottoms cracking and coke selectiv-ity of the GENESIS system is uniquein that increased bottoms crackingis accompanied by improved cokeselectivity. A synergistic effect
exists and GENESIS catalysts demon-strate a superior coke to bottoms rela-tionship than either component alone.The synergy is attributable to theunique matrix properties of MIDASand its interaction with Grace Davisonhigh zeolite catalyst technology. Thissynergy is the greatest when MIDAS iscombined with the IMPACT catalystfamily; however similar performanceadvantages are seen when MIDAS iscombined with other high zeoliteDavison catalysts. Grace Davison hasdone extensive R&D work to under-stand the synergy that exists betweenIMPACT and MIDAS. The summary ofthat data is presented here.
Catalagram 102 Fall 2007 5
7
8
9
10
11
12
13
70 71 72 73 74 75 76 77 78
Conversion, wt.%
Bo
tto
ms,
wt.
%
IMPACT
MIDAS
GENESIS
Research & Development
Traditionally, in testing, the expecta-tion of catalyst blend performanceis that the resultant yields would beclose to the linear average of eachindividual catalyst. In performancetesting of GENESIS systems, theresultant yields exceed those ofeither blend component. A com-prehensive study was designed tomeasure the selectivity advantageof these catalyst systems due to thesynergy that exists between MIDASand IMPACT. Properties of com-mercially produced IMPACT andMIDAS catalysts are shown in TableI. The catalysts were deactivatedindividually using the CPS-3 proto-col[9] at 1465ºF, and the GENESISblend was prepared after thesteaming of each component. Thetwo catalysts had similar unit cellsizes after steaming. MIDAS hadlower zeolite and higher matrix sur-face area with higher pore volume.The catalysts were tested in theDavison Circulating Riser (DCR) ona resid, a VGO, and a hydrotreatedVGO feedstock. The properties ofthe feedstocks are shown in Table II.The resid feed has 5.1 wt.% ConCarbon, 20.6 ºAPI and about 35%1000ºF+. The VGO feed is paraf-finic (11.94 K-Factor) with about15% 1000ºF+. The hydrotreatedfeed has very low sulfur (0.035wt.%) and is highly naphthenic(37.2% Cn).
Table IIProperties of Feedstocks
Resid Feed VGO Hydrotreated VGO
API Gravity @60 ˚F 20.6 25.5 23.5
Sulfur, wt.% 0.416 0.369 0.035
Conradson Carbon, wt.% 5.1 0.68 0.03
Ni, ppm 6.6 0.4 0.5V, ppm 16.5 0.2 0
K Factor 11.76 11.94 11.5Refractive Index 1.52236 1.50263 1.50245Average Molecular Weight 445 406 332% Paraffinic Ring Carbons, Cp 59.2 63.6 47.2% Naphthenic Ring Carbons, Cn 15.4 17.4 37.2% Aromatic Ring Carbons, Ca 25.4 18.9 15.6
Simulated Distillation, vol.%, ˚FIBP 455 307 36710% 653 607 52630% 793 740 64450% 894 818 73470% 1017 904 82790% 1265 1034 942FBP 1324 1257 1078
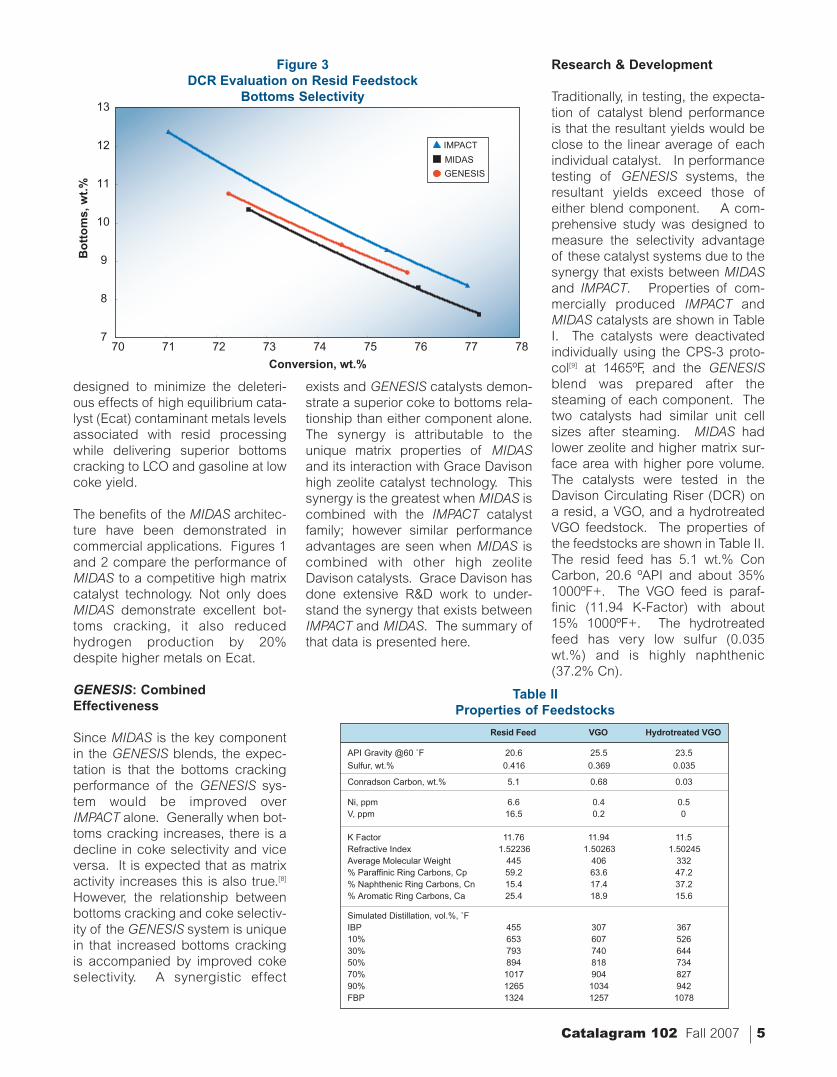
Figure 3 DCR Evaluation on Resid Feedstock
Bottoms Selectivity
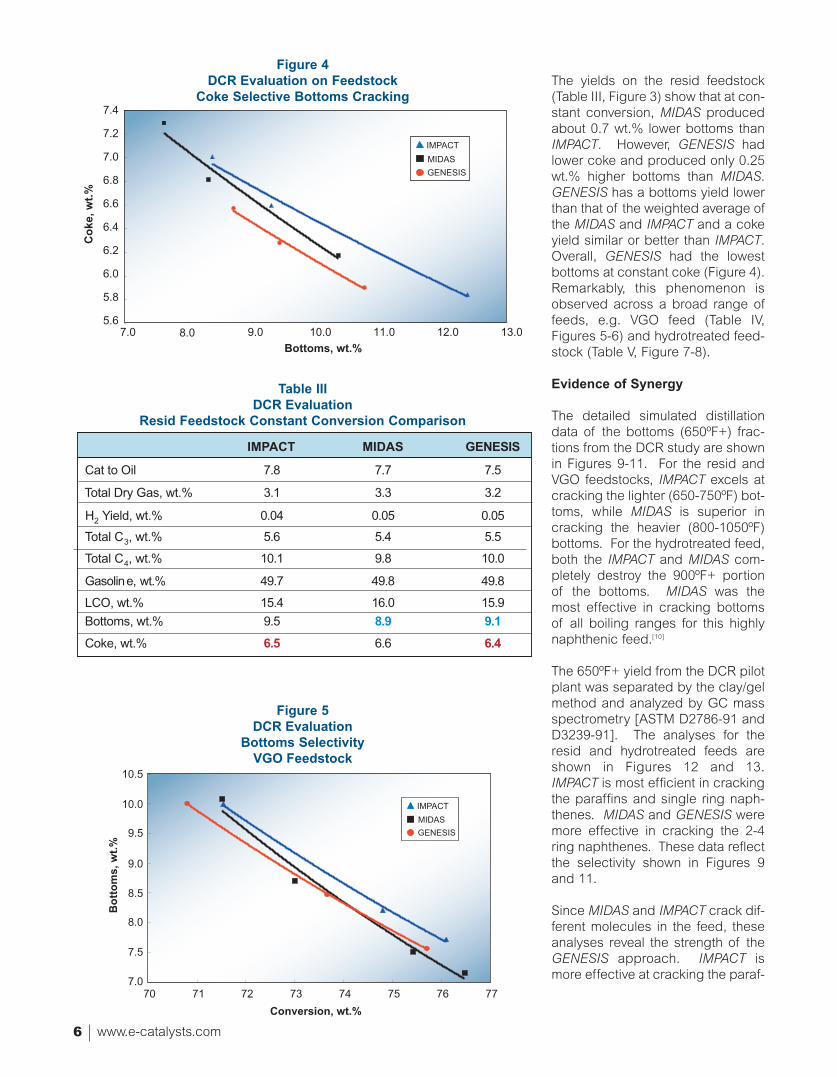
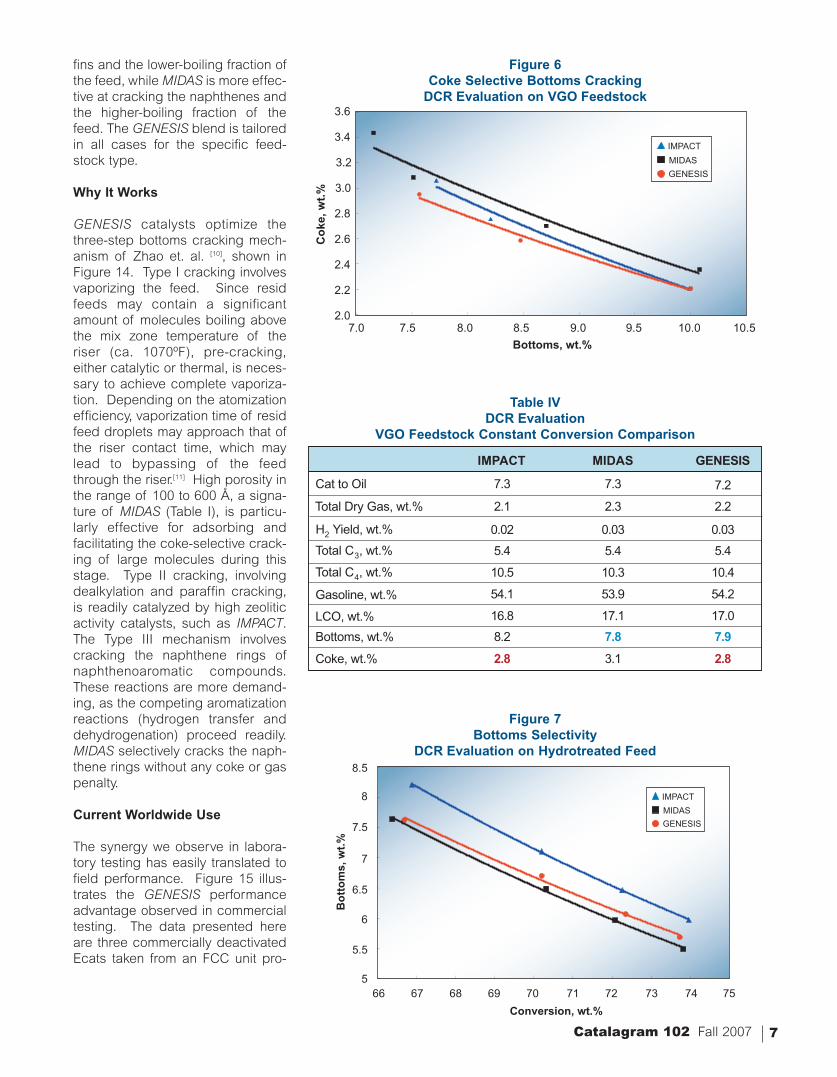
The yields on the resid feedstock(Table III, Figure 3) show that at con-stant conversion, MIDAS producedabout 0.7 wt.% lower bottoms thanIMPACT. However, GENESIS hadlower coke and produced only 0.25wt.% higher bottoms than MIDAS.GENESIS has a bottoms yield lowerthan that of the weighted average ofthe MIDAS and IMPACT and a cokeyield similar or better than IMPACT.Overall, GENESIS had the lowestbottoms at constant coke (Figure 4).Remarkably, this phenomenon isobserved across a broad range offeeds, e.g. VGO feed (Table IV,Figures 5-6) and hydrotreated feed-stock (Table V, Figure 7-8).
Evidence of Synergy
The detailed simulated distillationdata of the bottoms (650ºF+) frac-tions from the DCR study are shownin Figures 9-11. For the resid andVGO feedstocks, IMPACT excels atcracking the lighter (650-750ºF) bot-toms, while MIDAS is superior incracking the heavier (800-1050ºF)bottoms. For the hydrotreated feed,both the IMPACT and MIDAS com-pletely destroy the 900ºF+ portionof the bottoms. MIDAS was themost effective in cracking bottomsof all boiling ranges for this highlynaphthenic feed.[10]
The 650ºF+ yield from the DCR pilotplant was separated by the clay/gelmethod and analyzed by GC massspectrometry [ASTM D2786-91 andD3239-91]. The analyses for theresid and hydrotreated feeds areshown in Figures 12 and 13.IMPACT is most efficient in crackingthe paraffins and single ring naph-thenes. MIDAS and GENESIS weremore effective in cracking the 2-4ring naphthenes. These data reflectthe selectivity shown in Figures 9and 11.
Since MIDAS and IMPACT crack dif-ferent molecules in the feed, theseanalyses reveal the strength of theGENESIS approach. IMPACT ismore effective at cracking the paraf-
www.e-catalysts.com6
7.0 9.0 10.0 11.0 12.0 13.0
Bottoms, wt.%
Co
ke, w
t.%
IMPACT
MIDAS
GENESIS
8.0
7.4
7.2
7.0
6.8
6.6
6.4
6.2
6.0
5.8
5.6
Table IIIDCR Evaluation
Resid Feedstock Constant Conversion Comparison
IMPACT MIDAS GENESIS
Cat to Oil 7.8 7.7 7.5
H2 Yield, wt.% 0.04 0.05 0.05
Total C3, wt.% 5.6 5.4 5.5
Total C4, wt.% 10.1 9.8 10.0
Gasoline, wt.% 49.7 49.8 49.8
LCO, wt.% 15.4 16.0 15.9
Bottoms, wt.% 9.5 8.9 9.1
Coke, wt.% 6.5 6.6 6.4
Total Dry Gas, wt.% 3.1 3.3 3.2
Figure 5DCR Evaluation
Bottoms Selectivity VGO Feedstock
70 71 72 73 74 75 76 77
Conversion, wt.%
Bo
tto
ms,
wt.
%
IMPACT
MIDAS
GENESIS
10.5
10.0
9.5
9.0
8.5
8.0
7.5
7.0
Figure 4DCR Evaluation on Feedstock
Coke Selective Bottoms Cracking
7Catalagram 102 Fall 2007
Figure 6Coke Selective Bottoms Cracking
DCR Evaluation on VGO Feedstock
7.0 7.5 8.0 8.5 9.0 9.5 10.0 10.5
Bottoms, wt.%
Co
ke, w
t.%
IMPACT
MIDAS
GENESIS
3.6
3.4
3.0
2.8
2.6
2.4
2.2
2.0
3.2
Table IVDCR Evaluation
VGO Feedstock Constant Conversion Comparison
0.02 0.03 0.03
5.4 5.4 5.4
10.5 10.3 10.4
54.1 53.9 54.2
16.8 17.1 17.0
8.2 7.8 7.9
2.8 3.1 2.8
IMPACT MIDAS GENESIS
Cat to Oil 7.3 7.3
H2 Yield, wt.%
Total C3, wt.%
Total C4, wt.%
Gasoline, wt.%
LCO, wt.%
Bottoms, wt.%
Coke, wt.%
Total Dry Gas, wt.%
7.2
2.1 2.3 2.2
Figure 7Bottoms Selectivity
DCR Evaluation on Hydrotreated Feed
66 67 68 69 70 71 72 73
Conversion, wt.%
Bo
tto
ms,
wt.
%
IMPACT
MIDAS
GENESIS7.5
7
6
5.5
5
6.5
74 75
8
8.5
fins and the lower-boiling fraction ofthe feed, while MIDAS is more effec-tive at cracking the naphthenes andthe higher-boiling fraction of thefeed. The GENESIS blend is tailoredin all cases for the specific feed-stock type.
Why It Works
GENESIS catalysts optimize thethree-step bottoms cracking mech-anism of Zhao et. al. [10], shown inFigure 14. Type I cracking involvesvaporizing the feed. Since residfeeds may contain a significantamount of molecules boiling abovethe mix zone temperature of theriser (ca. 1070ºF), pre-cracking,either catalytic or thermal, is neces-sary to achieve complete vaporiza-tion. Depending on the atomizationefficiency, vaporization time of residfeed droplets may approach that ofthe riser contact time, which maylead to bypassing of the feedthrough the riser.[11] High porosity inthe range of 100 to 600 Å, a signa-ture of MIDAS (Table I), is particu-larly effective for adsorbing andfacilitating the coke-selective crack-ing of large molecules during thisstage. Type II cracking, involvingdealkylation and paraffin cracking,is readily catalyzed by high zeoliticactivity catalysts, such as IMPACT.The Type III mechanism involvescracking the naphthene rings ofnaphthenoaromatic compounds.These reactions are more demand-ing, as the competing aromatizationreactions (hydrogen transfer anddehydrogenation) proceed readily.MIDAS selectively cracks the naph-thene rings without any coke or gaspenalty.
Current Worldwide Use
The synergy we observe in labora-tory testing has easily translated tofield performance. Figure 15 illus-trates the GENESIS performanceadvantage observed in commercialtesting. The data presented hereare three commercially deactivatedEcats taken from an FCC unit pro-

cessing resid that has used IMPACTand MIDAS separately as well as aGENESIS blend of both technolo-gies. These Ecats were then testedin an ACE pilot plant over a singlefeed. GENESIS has the advantagein coke-selective bottoms cracking.For resid applications, GENESISblends allow for maximization ofcarbon content of the feed orincreased conversion up to the cokeburn limit.
We've demonstrated how GENESISperforms relative to the individualcomponents, but how does GENE-SIS compare to other technologies?A refiner processing hydrotreatedfeed switched from a state-of-the-art Davison catalyst for hydrotreatedfeeds to a GENESIS system com-prised of IMPACT and MIDAS.Figure 16 demonstrates the per-formance advantage of GENESISrelative to the hydrotreated bench-mark technology. In ACE testing ofunit Ecats, GENESIS results in animproved coke-to-bottoms relation-ship, providing the ultimate in oper-ating flexibility for this refiner to opti-mize hydrotreating and FCC opera-tions.
In GENESIS catalysts, typically theother blend component is from theIMPACT family. The full range ofDavison Al-Sol and Si-Sol catalystshave been used with success inGENESIS systems as shown inTable VI. These commercial appli-cations demonstrate the viability ofthe GENESIS catalyst systemacross many different feed types.
Conclusions
In the DCR study, we saw that theGENESIS system consistently per-forms with the coke selectivity ofIMPACT and the bottoms selectivityof MIDAS, yielding the synergisticeffect of a superior coke-to-bottomsrelationship. This synergy existsbecause both catalysts crack spe-cific feed species: IMPACT cracksparaffins more efficiently whileMIDAS destroys more ringed naph-
www.e-catalysts.com8
Figure 8DCR Evaluation on Hydrotreated Feedstock
Coke Selective Bottoms Cracking
5.0 5.5 6.0 6.5 7.0 7.5
Bottoms, wt.%C
oke
,wt.
%
IMPACT
MIDAS
GENESIS
2.0
1.8
1.4
1.2
1.0
1.6
8.0 8.5
2.2
2.4
2.6
Table VDCR Evaluation
Hydrotreated Feedstock Constant Conversion Comparison
0.03 0.03 0.03
5.0 5.1 5.0
10.0 10.0 10.0
54.24 54.0 54.2
20.8 21.3 21.1
6.3 5.7 5.9
2.0 2.2 2.0
IMPACT MIDAS GENESIS
Cat to Oil 7.7 7.7
H2 Yield, wt.%
Total C3, wt.%
Total C4, wt.%
Gasoline, wt.%
LCO, wt.%
Bottoms, wt.%
Coke, wt.%
Total Dry Gas, wt.%
7.8
0.03 0.03 0.03
Figure 9Bottoms Cracking Selectivity
Resid Feedstock Constant Conversion DCR Comparison
0.00
0.50
1.00
1.50
2.00
2.50
3.00
650-700Yields
700-750Yields
750-800Yields
800-850Yields
850-900Yields
900-950Yields
950-1050Yields
Boiling range ˚F
Yie
ld, w
t.%
of
Fee
d MIDAS is more selective in cracking the heaviest fraction of the feedstock.
IMPACT MIDASGENESIS

9Catalagram 102 Fall 2007
thenes. MIDAS improves unit cokeselectivity by effectively eliminatingand cracking coke precursors.
The GENESIS system provides theutmost in formulation flexibility bycustom tuning the blend ratio. Wecan optimize the catalyst Z/M ratioto match the specific unit feedstockand operating constraints. In addi-tion to optimizing the blend ratio, theactivity levels of the individual com-ponents are carefully selected tomatch the operating mode and feedtypes. This formulation flexibilitycan deliver a significant selectivitychange, allowing the refiner toaccommodate a seasonal opera-tion, or to manage a swing feed-stock, or even a hydrotreater out-age.
In high metals resid applications,GENESIS catalysts allow for maxi-mization of carbon content of thefeed or for increased conversion upto the coke burn limit. Not onlydoes GENESIS reduce slurry yield,it does so without the expectedcoke and gas penalty oftenobserved with competitive highmatrix catalysts.
In VGO and hydrotreated feedapplications, GENESIS providesoperational flexibility to react to sea-sonal economics and the opportuni-ty to optimize hydrotreater and FCCoperations together.
For more information on how GENE-SIS catalysts can improve youroperation, please call your GraceDavison Sales Representative orRosann Schiller at (410) 531-8217,[email protected]
Figure 10Bottoms Cracking Selectivity
VGO Feedstock Constant Conversion DCR Comparison
0.00
0.50
1.00
1.50
2.00
2.50
3.00
650-700Yields
700-750Yields
750-800Yields
800-850Yields
850-900Yields
900-950Yields
950-1050Yields
Boiling range ˚F
Yie
ld, w
t.%
IMPACT MIDASGENESIS
Figure 11Bottoms Cracking Selectivity
Hydrotreated VGO Feedstock Constant Conversion DCR Comparison
0.00
0.50
1.00
1.50
2.00
2.50
650-700Yields
700-750Yields
750-800Yields
800-850Yields
850-900Yields
900-950Yields
950-1050Yields
Boiling range ˚F
Yie
ld, w
t.%
IMPACT MIDASGENESIS
Figure 12GC/MS Characterization of Bottoms
Resid Feedstock Constant Conversion Comparison
0.00
2.00
4.00
6.00
8.00
10.00
12.00
14.00
16.00
1-RingNaphthenes
2-RingNaphthenes
3-RingNaphthenes
4-RingNaphthenes
Paraffins
wt.
% o
f B
ott
om
s
IMPACT MIDAS GENESIS

www.e-catalysts.com10
Figure 13GC/MS Characterization of Bottoms
Hydrotreated Feedstock Constant Conversion Comparison
0.00
2.00
4.00
6.00
8.00
10.00
12.00
14.00
16.00
Paraffins 1-RingNaphthenes
2-RingNaphthenes
3-RingNaphthenes
4-RingNaphthenes
wt.
% o
f B
ott
om
s
IMPACT MIDAS GENESIS
Figure 14Bottoms Cracking Mechanism
Feed
RR
Thermal/Catalytic
Catalytic
Coke
Type II Type III
Type I
MIDAS is more effective for Type I and Type III. IMPACT is more
effective for Type II.
Figure 15Commercial Resid Example of GENESIS Synergy
Coke, wt.%
Bo
tto
ms,
wt.
%
9
8
7
6
5
4.5 5.0 5.5 6.0 6.5 7.0 7.5
GENESIS
IMPACT
MIDAS

References
1. Catalagram 98, “Maximizing BottomsUpgrading: Give Resid the MIDASTM Touch,”Hunt, L., Fall 2005.
2. Catalagram 93, “IMPACTTM: ABreakthrough Technology for ResidProcessing - Commercial Update,” Purnell,S.K., Fall 2003.
3. Catalagram 96, “New CatalystTechnologies Based on Tunable ReactiveMatrices: IMPACTTM, LIBRATM and POLAR-ISTM,” Cheng, W.C. & Nee, J.R., Fall 2004.
4. Catalagram 97, “Next Generation Al-Sol FCC Catalyst Technologies,” Nee, J.R.,Spring 2005.
5. Catalagram 99, “Recent CommercialExperience in Improving Refinery Profitabilitywith Grace Davison Alumina-Sol Catalysts,”Petti, N., Yaluris, G., Hunt, L., Spring 2006.
6. Mott, R.W., Wear, C., “FCC CatalystDesign for Optimal Performance,” NPRAAnnual Meeting 1988, AM-88-73.
7. Spry, J.C., Sawyer, W.H., 68th AnnualAIChE Meeting, Los Angeles 1975.
8. Young, G.W., Creighton, J., Wear, C.,Ritter, R.E., “Effect of Feed Properties on theOptimization of FCC Catalysts for BottomsReduction.” NPRA 1987, Annual Meeting,AM-87-51.
9. Wallenstein, D, Harding, R. H., Nee, J.R. D., Boock, L. T.; Recent Advances in theDeactivation of FCC Catalysts by CyclicPropylene Steaming (CPS) in the Presenceand Absence of Metals; Appl. Catalysis A:General 204 (2000) 89-106.
10. Zhao, X., Cheng, W-C., Rudesill, J. A.;“FCC Bottoms Cracking Mechanisms andImplications for Catalyst Design for ResidApplications”; NPRA Annual Meeting, SanAntonio, TX, 2002.
11. Huang, Z., and Ho, T. C.; Effect ofThermolysis on Resid Droplet Vaporization inFluid Catalytic Cracking; ChemicalEngineering Journal, 91 (2003) 45-58.
11Catalagram 102 Fall 2007
Figure 16GENESIS Outperforms Benchmark Catalyst for Hydrotreated Feeds
ECAT ACE TESTING
4
5
6
7
8
9
10
11
1 1.5 2 2.5
Coke, wt.%
Bo
tto
ms,
wt.
%
GENESIS
3 3.5
Grace HT Benchmark
Name
Refiner 1
Ni + V Feed Type Blend Component
275 VGO SPECTRA
Refiner 2 300 Hydrotreated IMPACT
Refiner 3 400 Hydrotreated ORION
Refiner 4 900 Hydrotreated IMPACT
Refiner 5 1200 VGO IMPACT
Refiner 6 1300 VGO IMPACT
Refiner 7 1800 VGO IMPACT
Refiner 8 1900 VGO IMPACT
Refiner 9 2000 Resid AURORA
Refiner 10 2000 Resid IMPACT
Refiner 11 2500 Resid SPECTRA
Refiner 12 2500 VGO ORION
Refiner 13 2500 VGO IMPACT
Refiner 14 3000 Resid IMPACT
Refiner 15 3000 VGO AURORA
Refiner 16 3000 VGO IMPACT
Refiner 17 3500 Resid IMPACT
Refiner 18 3500 Resid IMPACT
Refiner 19 3500 Resid AURORA
Refiner 20 4000 Resid ORION
Refiner 21 6000 Resid IMPACT
Refiner 22 7000 Resid IMPACT
Refiner 23 7000 Resid ADVANTA
Refiner 24 7500 Resid IMPACT
Refiner 25 9500 Resid IMPACT
Table VI GENESIS Applications
Introduction
o maximize profitability fromthe FCCU and comply withenvironmental regulations,
many refineries have turned to the useof FCC additives. For example, arefiner may use D-PriSM® or GSR®-5additives to lower gasoline sulfur,while using an olefins additive, suchas OlefinsMax® to increase propyleneand gasoline octane. For units usingmultiple additives, it is logical toinquire whether the action of oneadditive may interfere with the effec-tiveness of another. This is particular-ly true with the increased focus on sul-fur in fuels.
It is well known that ZSM-5 cracksgasoline range olefins into LPGolefins, thus limiting the extent ofhydrogen transfer reactions that form
gasoline range paraffins.[1] As aconsequence of decreased gaso-line volume, the concentration ofaromatics and sulfur compounds ingasoline are expected to increase.Others[3] have suggested that due tothe increase in product olefinicity,there would also be a greater possi-bility of recombination reactionsinvolving olefins and diolefins withH2S and sulfides to form thiopheniccompounds, thus increasing theconcentration of sulfur compoundsin gasoline. In this article, we willshow that although ZSM-5 increas-es gasoline sulfur by a concentra-tion effect, it does not diminish theeffectiveness of catalytic sulfurreduction technologies, either inlaboratory testing or in commercialapplications.
T
GSR ProductsMaintain ExcellentPerformance When Used withOlefins Additives
Wu-Cheng Cheng Grace Davison
Ruizhong HuGrace Davison
www.e-catalysts.com12

Historical Understanding
The origin of sulfur molecules inFCC gasoline and their interactionwith FCC catalyst have been stud-ied extensively [1-4]. Harding et al.determined that only about 4% offeed sulfur ended up in gasolineboiling range (430˚F-) products,while the majority of feed sulfurcracked into H2S. The gasoline-range sulfur compounds were pri-marily thiophene derivatives andbenzothiophene. Thiophene com-pounds could be removed primarilyvia hydrogen transfer to tetrahy-drothiophenes and subsequent ringopening to form H2S. Thus, increas-ing the hydrogen transfer activity ofthe base FCC catalyst or using D-PriSM additive, which enhances therate of cracking of tetrahydrothio-phene to H2S, can both effectivelylower gasoline sulfur.
Lappas et al. [3] showed that theaddition of a 10% ZSM-5 additive toa low metals (vanadium and nickel),low unit cell size Ecat increased theconcentration of FCC gasoline sul-fur. However, most of this increasecould be attributed to the concen-tration effect caused by shifting ofgasoline to LPG. Calculated on afeed basis, gasoline sulfurincreased by only 4%. The authorsattributed this modest gasoline sul-fur increase to the change in relativerates of chain cracking, hydridetransfer and cyclization. Increasing
the rate of recombination reactions(such as those in Figure 17) due to theincrease in light olefins present wasalso suggested as a possibility. Themost likely explanation is that the addi-tion of 10% ZSM-5 additive to thebase catalyst, which had inherentlylow activity, diluted the cracking andhydrogen transfer activity. Thisreduced cracking and hydrogentransfer activity could very well haveled to the modest increase in gasolinesulfur observed. In many commercialapplications where higher levels ofZSM-5 additive are used, the basecatalyst is typically reformulated tomaintain constant cracking activity.
An attempt to quantify the potentialfor recombination reactions in theFCC unit was conducted by Leflaiveet al. [4] using pure olefin and diolefincompounds in the presence of H2Sand FCC catalyst. The studyshowed that at very long contacttimes, the transformation of olefinsor diolefins into thiophenic com-pounds was possible, and diolefinswere shown to be more likely thanolefins to transform. The proposedmechanism by Leflaive et al.involves first the formation of a thiolthrough a nucleophilic addition ofH2S, then a cyclization into tetrahy-drothiophene derivatives that canbe dehydrogenated into thiopheniccompounds. However, as pointedout by Harding et al. and Corma etal. [5], the thiol and tetrahydrothio-phene sulfur compounds areamong those most easily convertedin the FCC process. Moreover,many gasoline sulfur reductiontechnologies (e.g. D-PriSM additive)are specifically designed to drivethese easy to crack sulfur com-pounds to H2S, and make themunavailable for recombination reac-tions. Hence, though the recombi-nation reactions are mechanisticallypossible, their contribution to gaso-line sulfur formation in actual FCCcommercial operation has not beenquantified.
Figure 17Gasoline Sulfur Formation through Recombination
S
R
S
S
R
RH-S-Ror
R-S-R
H-S-Ror
R-S-R
S
R
Figure 18Effect of ZSM-5 on Gasoline Olefins
ZSM-5 does not Increase gasoline olefins concentration
0
0.2
0.4
0.6
0.8
1
65 70 75 80
Gas
olin
e D
iole
fin
s, w
t.%
Conversion, wt.%
DCR Evaluation
0 wt.% OlefinsMax
2 wt.% OlefinsMax
4 wt.% OlefinsMax
13Catalagram 102 Fall 2007

Recent Laboratory Examples
Based on our laboratory testing andcommercial experience, we havefound that the use of ZSM-5 addi-tives does not increase gasoline sul-fur beyond the above mentionedconcentration effect for two signifi-cant reasons. First, while diolefinsare much more reactive than olefinsand are expected to be more likelyto undergo recombination reac-tions, ZSM-5 does not increase theconcentration of diolefins (Figure18), which are mainly a product ofthermal cracking (Figure 19). Nextby examining the possible pathwaysof a gasoline range olefins mole-cule, it is evident that recombinationreactions are not as favorable asalternative reactions. A gasolineolefin molecule can undergo hydro-gen transfer to form a paraffin. Itcan further crack to form smallerolefins or it can recombine with H2Sor sulfides to form thiophenes. Theability of ZSM-5 to alter FCC yieldsindicates that the rate at which
gasoline olefins crack on ZSM-5 is thesame or faster than the rate at whichgasoline olefins undergo hydrogentransfer reactions on base FCC cata-lyst. In other words, ZSM-5 does not
decrease the intrinsic rate of hydro-gen transfer; it merely offers a fasteralternative pathway for gasolineolefins. Thus, the relative rates ofthe three reactions are: Cracking
Figure 19Effect of Temperature on Gasoline Olefins
Gasoline olefins are a result of thermal cracking
0
0.5
1
1.5
2
65 70 75 80 85
Gas
olin
e D
iole
fin
s, w
t.%
Conversion, wt.%
DCR Evaluation
970˚F
1010˚F
1050˚F
Table VIIEffect of ZSM-5 on Yields
3000 ppm Ni, 3000 ppm V/CPS DCR Evaluation on Resid Feed - 75 wt.% Conversion
Base Base1% OlefinsMax
Cat to Oil 7.63 7.58 7.67 7.76 8.41
0.13 0.13 0.13 0.13 0.13
2.08 2.07 2.07 2.07 2.14
6.44 6.88 7.27 7.88 8.935.46 5.88 6.25 6.79 7.74
12.01 12.53 12.79 13.43 14.387.11 7.47 7.67 8.03 8.56
Gasoline, wt.% 48.63 47.78 46.93 45.77 43.35
G-Con P, wt% 4.60 4.51 4.43 4.37 4.24
G-Con I, wt% 29.33 29.45 29.14 29.03 27.78
G-Con A, wt% 31.47 31.61 31.79 32.21 34.88
G-Con N, wt% 9.97 9.74 9.86 9.69 10.17
G-Con O wt% 24.62 24.68 24.78 24.69 22.93
G-Con RON EST 90.12 90.44 90.65 91.00 91.02
G-Con MON EST 78.97 79.22 79.35 79.65 79.68
LCO, wt.% 15.07 15.09 15.17 15.11 14.88
Bottoms, wt.% 9.93 9.91 9.83 9.89 10.12
Coke, wt.% 5.60 5.52 5.70 5.62 5.95
H2 Yield, wt.%
C1 + C2’s, wt.%
Total C3, wt.%C3=, wt.%
Total C4, wt.%
Total C4=, wt.%
Base2% OlefinsMax
Base4% OlefinsMax
Base8% OlefinsMax
www.e-catalysts.com14

on ZSM-5 > Hydrogen Transfer >Recombin-ation, and the addition ofZSM-5 should actually lower, notincrease the relative contribution ofrecombination.
To support this discussion, a pilotplant study was commissioned toshow the effect on yields and gaso-line sulfur of increasing levels ofZSM-5 additive combined with ahigh rare earth base FCC catalyst.Tables VII and VIII list hydrocarbonyields and the concentration of var-ious gasoline sulfur species,respectively, at constant conversionresulting from cracking a resid feed-stock over the various samples inthe Davison Circulating Riser(DCR). The samples were deacti-vated with 3000 ppm nickel and3000 ppm vanadium, using theCyclic Propylene Steaming (CPS)protocol. Table VII exhibits theeffect of OlefinsMax® additions, at0, 1, 2, 4 and 8%, where the hydro-carbon yields clearly show theexpected trend when an increasing
Table VIIIGasoline Sulfur Concentration
3000 ppm Ni, 3000 ppm V/CPS DCR Evaluation on Resid Feed - 75 wt.% Conversion
Sulfur Concentration ppm in Gasoline
Mercaptans 8.77 9.73 9.07 6.11 4.00Thiophene 16.23 16.75 16.11 15.83 18.60MethylThiophenes 36.83 37.40 37.62 36.36 39.71TetrahydroThiophene 3.21 2.99 3.00 2.57 3.13
41.17 41.79 38.59 37.76 39.1711.17 13.22 15.59 19.63 17.47
BenzoThiophene 47.83 48.56 48.64 49.17 53.89AlkylBenzoThiophenes 1664.47 1700.28 1757.34 1776.46 1891.71
Sulfur Concentration ppm on Feed Basis
Mercaptans 4.26 4.65 4.26 2.80 1.73
Thiophene 7.89 8.00 7.56 7.25 8.06MethylThiophenes 17.91 17.87 17.65 16.64 17.22TetrahydroThiophene 1.56 1.43 1.41 1.18 1.36
20.02 19.97 18.11 17.28 16.985.43 6.32 7.32 8.98 7.57
BenzoThiophene 23.26 23.20 22.83 22.50 23.36AlkylBenzoThiophenes 809.41 812.32 824.66 813.06 820.12
Base
ZSM-5 concentrates gasoline sulfur by cracking gasoline into LPG. Gasoline sulfur concentration on a feed basis is constant
Base1% OlefinsMax
C2 - Thiophenes
Base2% OlefinsMax
Base4% OlefinsMax
Base8% OlefinsMax
C3 - Thiophenes
C2 - ThiophenesC3 - Thiophenes
15Catalagram 102 Fall 2007
amount of ZSM-5 additive is used.The C/O at constant conversion wasessentially unchanged for theseblends with 1%, 2% and 4%OlefinsMax and increased slightly forthe blend with 8% OlefinsMax due to aslight activity dilution effect. The C3
and C4 olefins and paraffins increasedat the expense of gasoline olefins, andthere was an overall decrease in gaso-line yield. Table VIII shows the majorgasoline-range sulfur species pro-duced for the catalyst blends tested,and are listed first on a gasoline basisand then on a feed basis. It is evidentthat on a gasoline basis, the concen-trations of most sulfur speciesincreased with the increase inOlefinsMax additive concentration.However, on a feed basis, the yields ofmost sulfur species were unchanged(fluctuations were within the measure-ment error). It is interesting to notethat the concentration of mercaptans(sum of all gasoline range sulfurspecies with a boiling point belowthiophene) appears to decrease withincreasing concentrations of
OlefinsMax additive. This trend isconsistent with the observations ofCorma et al. Compared to the ear-lier example by Lappas et al., webelieve that the higher activity of thebase catalyst and the lower concen-trations of ZSM-5 additive used inthis study resulted in a lower impacton the overall cracking and hydro-gen transfer activity, and thereforeno gasoline sulfur increase wasobserved on a feed basis.
In addition to this study where labo-ratory deactivated samples wereused in the testing, we also commis-sioned a study using commercialequilibrium catalysts (Ecats) con-taining both ZSM-5 and gasolinesulfur reduction additives. Table IXlists three Ecats from one commer-cial unit that were collected at differ-ent times. The first two Ecats con-tained 0% and 2.0% OlefinsMax,respectively, while the third Ecatcontained 1.5% OlefinsMax but witha different base catalyst. The firsttwo Ecat samples contained an alu-

Table IXProperties of Ecat Samples
Table XACE Evaluation of Base and SuRCA Ecat Samples
SuRCA lowers gasoline sulfur, even in the presence of ZSM-5 additive
Al2O3, wt.% 53.357.0 57.42.342.33 2.33
0.2970.26 0.24Fe, wt.% 0.460.46 0.46Ni 131114 408V, ppm 299389 1540
ABD, cc/gm 0.820.84 0.83APS, m 63.657 55Surface Area, m2/gm 134136 133
Zeolite 7676 73 Matrix 5860 60
Unit Cell, Å 24.3224.33 24.32
Base EcatNo OlefinsMax
Base Ecat2.0% OlefinsMax
SuRCA Ecat1.5% OlefinsMax
Re2O3, wt.%Na2O, wt.%
, ppm
Conversion 70
Propylene 4.91 4.804.99 5.73 5.615.41 5.72 5.78
10.66 10.22
Gasoline 51.24 49.78 49.90RON 91.26 91.79 92.19MON 80.25 80.71 80.76LCO 24.21 23.96 24.05Bottoms 5.79 6.04 5.95Coke 2.52 2.44 2.69
Light Cut Sulfur, ppm 125 127 88 31.1%Heavy Cut Sulfur, ppm 28 31 21 32.8%Cut Gasoline Sulfur, ppm 153 159 109 31.4%Total Sulfur, ppm 196 210 152 27.8%
Total C3’s
5.531.334.26
9.92
5.471.57
Gasoline Sulfur, on gasoline basis
Base EcatNo OlefinsMax
Base Ecat2.0% OlefinsMax
SuRCA Ecat1.5% OlefinsMax
Reduction
Total C4= s Total C4’s
Catalyst to Oil RatioDry Gas
6.121.39
mina-sol catalyst with moderate rareearth, while the third Ecat sample isthe SuRCA version of that catalyst,designed to provide similar yieldsas the base catalyst but to alsoreduce gasoline sulfur. The surfacearea and unit cell size of the threeEcats are essentially identical. Allthree Ecats were tested in an ACE [6]
pilot plant unit using the refiner'shydrotreated feed. The hydrocarbonyields and sulfur in gasoline at con-stant conversion are listed in Table X.The increase in propylene yield andoctane from the 0% OlefinsMax sam-ple to either the 2.0% or the 1.5%OlefinsMax samples is proportional tothe increase in OlefinsMax in the Ecat.
www.e-catalysts.com16
The decrease in gasoline yield isalso proportional to the increasingZSM-5 additive concentration. Inspite of the concentration effectfrom the decreasing gasoline yield,the gasoline sulfur concentration ofthe SuRCA containing Ecat is about30% lower than the two base Ecats.

Figure 20Propylene Yield Trends for Ecat Sample Blends4% OlefinsMax produces expected increase in propylene
GSR-5 does not negatively impact ZSM-57.0
Conversion, wt.%
6.5
6.0
5.5
5.0
C3
= w
t.%
4.5
4.075 76 77 78 79 8180
ZSM-5/GSR Interaction DCR Study
Base Ecat Base Ecat + 4% OlefinsMax
Base Ecat + 25% GSR-5 Base Ecat + 4% OlefinsMax + 25% GSR-5
Table XIProperties of Base Ecat and Feed
Base Ecat
Al2O3 (wt.%) 42.9
RE2O3 (wt.%) 3.2
Na2O (wt.%) 0.36
Fe2O3 (wt.%) 0.72
P2O5 (wt.%) 0.09
Surface Area (m2/g)
131Zeolite
168
Matrix 37
Unit Cell (Å) 24.33
Ni (ppm) 40
V (ppm) 60
Feed
API 24.7
Aromatic Ring Carbons, Ca (wt.%) 20.5
Napthenic Ring Carbons, Cn (wt.%) 17.1
Paraffinic Carbons, Cp (wt.%) 62.4
Sulfur (wt.%) 0.82
Distillation (˚F), IBP 310
10% (˚F) 583
30% (˚F) 723
Concarbon (wt.%) 0.77
50% (˚F) 799
70% (˚F) 878
90% (˚F) 1002
FBP (˚F) 1177
Figure 21Gasoline Octane Trends for Ecat Sample Blends
4% Olefins-Max produces expected increase in octaneGSR-5 does not negatively impact ZSM-5
ZSM-5/GSR Interaction DCR Study
75 76 77 78 79 80 81
91.0
Conversion, wt.%
90.8
90.6
90.4
90.2
G -
Co
n R
ON
ES
T
90.0
89.8
89.6
89.4
89.2
89.0
Base Ecat Base Ecat + 4% OlefinsMax
Base Ecat + 25% GSR-5 Base Ecat + 4% OlefinsMax + 25% GSR-5
17Catalagram 102 Fall 2007
To further decouple the ZSM-5 andsulfur reduction effects, a DCRstudy with commercial Ecat wasconducted. A high rare earth, lowmetals base Ecat was blended sep-arately with 4% OlefinsMax and with25% GSR-5, as well as with both 4%OlefinsMax and 25% GSR-5. GSR-5 is an additive based on the sulfurreduction functionality of SuRCAthat also provides base crackingfunctionality. The samples were labdeactivated to match typical com-mercial performance. A fairly paraf-finic feedstock with 0.8 wt% sulfurwas cracked over each of the sam-ples. The properties of the baseEcat sample and the feed used inthe study are shown in Table XI.
The addition of 4% OlefinsMax pro-vided similar shifts in propylene(Figure 20) and gasoline octane(Figure 21) as the same amount ofthe additive produced in Table VII.The addition of the GSR-5 additivedid not cause any change in olefinsor octane. Additionally, becauseGSR-5 imparts cracking activitywhile providing gasoline sulfurreduction, the addition of GSR-5 tothe base Ecat did not significantlychange the yields of other FCCproducts.
Figure 22 shows the cut gasolinesulfur concentration on a gasolinebasis for the samples tested. Cutgasoline sulfur is the sum of the sul-fur species that boil through 428 ºF(mercaptans through C4 thio-phenes). GSR-5 by itself reducesgasoline sulfur by 30% at 78% con-version, and the sulfur reductionperformance is similar with the addi-tion of 4% OlefinsMax. This is con-sistent with the performanceobserved in Table X.
The addition of 4% OlefinsMaxyields 8% higher gasoline sulfur at78% conversion on a gasolinebasis, which is comparable to the7% increase in gasoline sulfurobserved for the commercial com-parison of the base Ecat to the 2%OlefinsMax Ecat in Table X.Normalizing the results in Figure 20to a feed basis, the increase in

Figure 22Gasoline Sulfur Trends for Ecat Sample BlendsGSR-5 reduces gasoline sulfur by 30% alone or with ZSM-5
Higher gasoline sulfur is due to concentration effect of ZSM-5
ZSM-5 / GSR Interaction DCR Study
280
330
380
430
480
530
580
630
75 76 77 78 79 80 81
Cu
t G
aso
line
Su
lfu
r,p
pm
Conversion, wt.%
Base Ecat Base Ecat + 4% OlefinsMax
Base Ecat + 25% GSR-5 Base Ecat + 4% OlefinsMax + 25% GSR-5
0.070
95% Point, ˚F
0.065
0.060
0.055
0.050
0.045
0.040
0.035
0.030
0.025
0.020
Gas
olin
e S
lbs/
Fee
d S
lbs
20% Lower GasolineSulfur Selectivity
340 350 360 370 380 390
Base Division Catalyst SuRCA SuRCA with OlefinsMax
Figure 23SuRCA Performance at Alon USA, Big Spring, Texas
with the use of ZSM-5 additives is dueto a concentration effect from thecracking of gasoline molecules intoLPG, as opposed to recombinationreactions. Furthermore, ZSM-5 addi-tives used in combination with gaso-line sulfur reduction technologies donot show increased gasoline sulfurfrom recombination reactions.Refiners have utilized both technolo-gies simultaneously and achieved per-formance comparable to the use ofeach independently. Those refinersconsidering the use of both technolo-gies can be confident in the ability ofeach product to achieve its individualproduct performance goals.
References
1. P.H. Schipper, F.G. Dwyer, P.T.Sparrell, S. Mizrahi, and J.A. Herbst, “FluidCatalytic Cracking � Role in ModernRefining”, M.L. Occelli (Ed.), ACSSymposium Series, Vol. 375, AmericanChemical Society, Washington D.C., 1988, p.64
2. R.H. Harding. R.R. Gatte, J.A.Whitecavage, and R.F. Wormsbecher,“Reaction Kinetics of Gasoline SulfurCompounds”, J.N. Armor (Ed.), ACSSymposium Series, Vol. 552, AmericanChemical Society, Washington D.C., 1994,p.286-296.
3. A.A. Lappas, J.A. Valla, I.A. Vasalos,C. Kuehler, J. Francis, P. O'Connor, and N.J.Gudde, “The Effect of Catalyst Properties onthe In Situ Reduction of Sulfur in FCCGasoline”, Applied Catalysis A: General 262(2004) p.31-41.
4. P. Leflaive, J.L. Lemberton, G. Pérot,C. Mirgain, J.Y. Carriat and J.M. Colin, “Onthe Origin of Sulfur Impurities in FluidCatalytic Cracking Gasoline - Reactivity ofThiophene Derivatives and of Their PossiblePrecursors Under FCC Conditions”, AppliedCatalysis A: General 227 (2002) p.201-215.
5. A. Corma, C. Martínez, G. Ketley, andG. Blair, “On the Mechanism of SulfurRemoval During Catalytic Cracking”, AppliedCatalysis A: General 208 (2001) p.135-152.
6. J.C. Kayser, “Versatile Fluidized BedReactor”, U.S. Patent No. 6,069,012 (2000).
7. M. Gwin (Alon), E.J. Udvari, and D.A.Hunt, “SuRCA Catalyst Reduces FCCGasoline Sulfur and More at the Alon USA,Big Spring Refinery”, Catalagram 96 (2004)p.33-36 (published by Grace Davison, abusiness unit of W.R. Grace & Co.).
www.e-catalysts.com18
gasoline sulfur with 4% OlefinsMaxin inventory is only 3%, again indi-cating that it is a concentrationeffect that causes higher apparentgasoline sulfur with ZSM-5 additiveuse.
Commercial Example
The gasoline sulfur reduction per-formance of SuRCA catalyst andthe GSR-5 additive in the abovestudies are similar to what we haveobserved with Ecats that do notcontain ZSM-5 additives. In 2004,the Alon USA, Big Spring, TX refin-ery co-authored an article withGrace Davison summarizing theirsuccessful experience with the useof SuRCA catalyst to reduce theirFCC gasoline sulfur by 20% [7]. Therefinery also used OlefinsMax on anopportunity basis to make incre-mental refinery grade propylene.The performance of SuRCA wasquantified both with and without theZSM-5 additive. As Figure 23 indi-cates, the 20% reduction in gasolinesulfur was consistent whether or notZSM-5 was present.
Conclusion
Recent pilot plant analysis andcommercial data indicates that anyincrease in gasoline sulfur observed

19Catalagram 102 Fall 2007

race Davison's laboratories testthousands of equilibrium fluidcracking catalyst (Ecat) sam-
ples each year. These samples pro-vide important insights into FCC unitoperations and are critical for unit opti-mization and troubleshooting.
The purpose of this article is twofold.First, it will communicate how Ecatactivity, contaminants and other prop-erties have shifted over the past tenyears, both worldwide and by geo-graphic region. Second, it will allowthe individual refiner to rank their ownFCC Ecat properties relative to theindustry in several key categories.
The following data reflects ten yearsof Ecat sample analyses from 1997through 2006. The data representsover 117,000 individual Ecat sam-ples from approximately 300 FCCunits around the world.
Figures 24 to 32 show a ten-yeartrend of average Ecat propertiesacross all regions of the world: AsiaPacific (AP), European Union (EU),Latin America (LA) and NorthAmerica (NA). EU includes Europe,Africa, the Middle East and Russia.North America includes the UnitedStates, Canada and the U.S. VirginIslands. Data reflects Ecat samples
Marilyn Moncrief
David Hunt
Kelly Stafford
Grace Davison Refining Technologies
G
Worldwide FCC Equilibrium Catalyst Trends -
A Ten-Year Review
www.e-catalysts.com20

that we have received from 1997through 2006, both from refinersusing Grace Davison FCC catalystas well as competitor products.
Figure 24 identifies interestingtrends in MAT activity. All regionsexperienced significant increases inactivity from 1997 through 2004, atwhich time activity stabilized. On aworldwide basis, average activityincreased from 67.5 to 70.7 wt.%over the ten-year period.Additionally, North America hasconsistently reported the highestactivity of the four regions, whileAsia Pacific has seen the greatestoverall gains, from 64.2 to 69.7wt.%.
Higher activity is consistent withincreases in Ecat rare earth content(Figure 25) and Ecat Unit Cell Size,UCS (Figure 26). Worldwide, aver-age rare earth has climbed morethan 65%, from 1.54 to 2.56 wt.%,over the past ten years. Similarincreases are seen in each geo-graphic region. Consistent with rareearth, average Ecat UCS data hasseen a steady rise from 24.27 to24.30Å.
Unit cell size and rare earth datasuggests that the increase in Ecatactivity is largely due to higher lev-els of rare earth exchanged ontothe catalyst zeolite. Figures 25 and26 also confirm conditions in theFCC Ecat that can lead to highergasoline selectivity as a result of theshift to higher UCS Ecat. For manycatalyst systems, this shift in UCSalso suggests improved catalystcoke selectivity.
FCC catalyst alumina content hasexperienced a steady upward trendfrom 38.9 to 44.0 wt.%, as seen inFigure 27. Higher Al2O3 has beenobserved in all regions and con-firms the industry's acceptance ofthe value of alumina content onFCC catalyst performance. Gracereported on the value of alumina-solcatalyst technologies in a recentCatalagram publication. (1)
Ecat contaminant trends are seenon Figures 28 to 32. Nickel in par-
Figure 24Average MAT Activity by Region 1997-2006
MA
T,w
t.%
Region
APEULA
NAWW
Year
1997 1998 1999 2000 2001 2002 2003 2004 2005 2006
73
72
71
70
69
68
67
66
65
64
Figure 25Average Rare Earth by Region 1997-2006
RE
203,
wt.
%
Region
APEULA
NAWW
Year1997 1998 1999 2000 2001 2002 2003 2004 2005 2006
2.75
2.50
2.25
2.00
1.75
1.50
Figure 26Average Unit Cell Size by Region 1997-2006
UC
S,A
ng
stro
ms
Region
APEULA
NAWW
Year
1997 1998 1999 2000 2001 2002 2003 2004 2005 2006
24.33
24.32
24.31
24.30
24.29
24.28
24.27
24.26
21Catalagram 102 Fall 2007

ticular (Figure 28) provides insightinto the differing FCC feedstocksprocessed in the Pacific Rim unitsas compared to the rest of theworld. Vanadium (Figure 29) hasbeen on the rise in the Asia Pacificregion, increasing from 1900 to2400 ppm and reflecting a 26%increase with a 14% increase innickel. This trend is reversed on aworldwide basis, where vanadiumhas increased less than 6% whilenickel is up almost 20% over theten-year period, from 1475 to 1750ppm. Nickel, and to a lesser extentvanadium, acts as dehydrogenationcatalyst that increases the yields ofthe unwanted products hydrogenand coke.(2) Vanadium is also mobileunder FCC regenerator conditionsand reduces catalyst activity bydestroying zeolite framework.(3)
Increased Ecat activity togetherwith higher nickel and vanadiumlevels suggest that today's catalystshave improved coke selectivity dueto enhanced metals trapping andimproved zeolite and matrix design.
Iron presents a mixed picture(Figure 30). Iron levels havedropped by 11% in Europe, 10% inAsia Pacific, and almost 5% in LatinAmerica over the last ten years. Ironin North America, on the otherhand, dropped significantly in thelate 1990's, but has been increasingsteadily since 2000. Today theFCC's with the highest Ecat iron lev-els are located in North America.Organic based iron deposited onthe catalyst during the crackingreactions can have a seriousadverse effect on activity and bot-toms cracking.(4)
Calcium (Figure 31) had been sta-ble for several years, but hasclimbed substantially since 2002.Worldwide CaO levels haveincreased 74% overall from 0.083 to0.144 wt.%. Asia Pacific has thehighest levels, while North and LatinAmerica have seen the highest per-centage increases. Europe has thelowest average calcium by weightpercent and has also experiencedthe lowest percentage increase
Figure 27Average Alumina by Region 1997-2006
Al2
03,w
t.%
Region
APEULA
NAWW
Year
1997 1998 1999 2000 2001 2002 2003 2004 2005 2006
47.5
45.0
42.5
40.0
37.5
35.0
Figure 28Average Nickel by Region 1997-2006
Ni,
pp
m Region
APEULA
NAWW
Year
1997 1998 1999 2000 2001 2002 2003 2004 2005 2006
4500
4000
3500
3000
2500
2000
1500
1000
Figure 29Average Vanadium by Region 1997-2006
V, p
pm Region
APEULA
NAWW
Year
1997 1998 1999 2000 2001 2002 2003 2004 2005 2006
3000
2750
2500
2250
2000
1750
1500
www.e-catalysts.com22

over the time period. Ca is oftenfound on the surface of the Ecattogether with Fe and may beinvolved in the mechanism by whichFe poisons the Ecat.(4)
Sodium (Figure 32) has been trend-ing downward on a worldwidebasis, decreasing by over 12%since 1997. Asia Pacific and NorthAmerica have contributed to theoverall decrease by droppingalmost 25% and 18%, respectively.Over the last ten years FCC units inEurope have the lowest levels ofsodium, while Latin America has thehighest. Sodium on Ecat comesboth from the raw materials used tomanufacture the catalyst as well assalt contamination in the feedstock.Sodium can deactivate the catalystby poisoning the acid sites on thematrix and zeolite and by surfacearea sintering.(5)
Figures 33 through 42 present nor-mal distributions of worldwide 2006Ecat data. These plots can be usedas a quick reference to determinewhere an individual FCC unit fallsversus the industry. The numbersatop each bar represent the numberof FCC units within that data range.
As can be seen in Figure 33, MATactivity reflects a range from 57 to81 with a mean of 70.7 wt.%. MostFCC units operating at an activitylevel greater than 77% likelyprocess deeply hydrotreated feed-stock, while units operating at loweractivity could be processing resid-ual based feedstocks and targetinglower conversion levels.
Figure 34 presents a rare earthrange from 0.02 to 5.48 wt.% with amean of 2.56 wt.%. Many unitsoperating at higher rare earth levelsare taking advantage of GraceDavison's IMPACT catalyst technol-ogy, which incorporates an integralrare earth vanadium trap. Figure 34also confirms the limited number ofunits using a zero rare earth cata-lyst.
Figure 30Average Iron by Region 1997-2006
Fe,
wt.
%
Region
APEULA
NAWW
Year
1997 1998 1999 2000 2001 2002 2003 2004 2005 2006
0.58
0.56
0.54
0.52
0.50
0.48
0.46
Figure 31Average Calcium by Region 1997-2006
CaO
, wt.
% Region
APEULA
NAWW
Year
1997 1998 1999 2000 2001 2002 2003 2004 2005 2006
0.20
0.15
0.10
0.05
Figure 32Average Sodium by Region 1997-2006
Na,
wt.
%
Region
APEULA
NAWW
Year
1997 1998 1999 2000 2001 2002 2003 2004 2005 2006
0.425
0.375
0.400
0.350
0.325
0.275
0.300
0.250
23Catalagram 102 Fall 2007
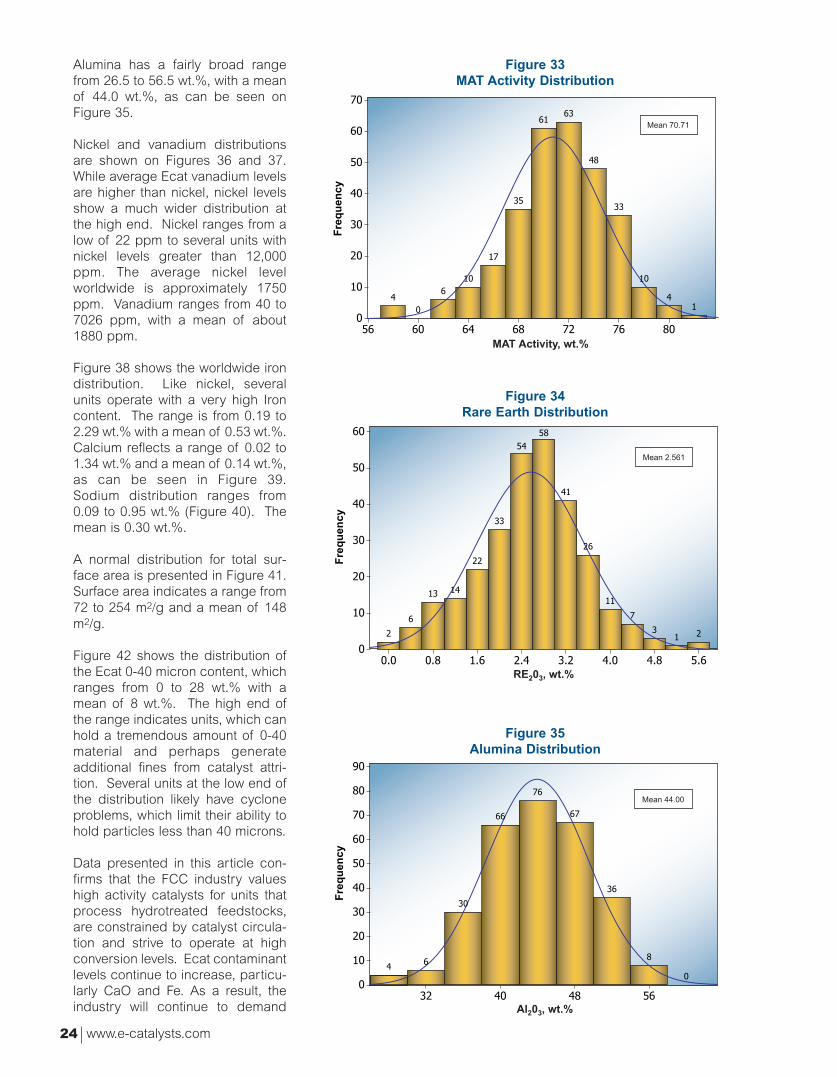
Figure 33MAT Activity Distribution
08672786460665
07
06
05
04
03
02
01
01
4
01
33
84
3616
53
71
016
04
Fre
qu
ency
MAT Activity, wt.%
Mean 70.71
Figure 34Rare Earth Distribution
6.58.40.42.34.26.18.00.0
06
05
04
03
02
01
021
3
7
11
62
14
8545
33
22
4131
6
2
Fre
qu
ency
RE203, wt.%
Mean 2.561
Figure 35Alumina Distribution
65840423
09
08
07
06
05
04
03
02
01
00
8
63
76
67
66
03
64
Fre
qu
ency
Al203, wt.%
Mean 44.00
Alumina has a fairly broad rangefrom 26.5 to 56.5 wt.%, with a meanof 44.0 wt.%, as can be seen onFigure 35.
Nickel and vanadium distributionsare shown on Figures 36 and 37.While average Ecat vanadium levelsare higher than nickel, nickel levelsshow a much wider distribution atthe high end. Nickel ranges from alow of 22 ppm to several units withnickel levels greater than 12,000ppm. The average nickel levelworldwide is approximately 1750ppm. Vanadium ranges from 40 to7026 ppm, with a mean of about1880 ppm.
Figure 38 shows the worldwide irondistribution. Like nickel, severalunits operate with a very high Ironcontent. The range is from 0.19 to2.29 wt.% with a mean of 0.53 wt.%.Calcium reflects a range of 0.02 to1.34 wt.% and a mean of 0.14 wt.%,as can be seen in Figure 39.Sodium distribution ranges from0.09 to 0.95 wt.% (Figure 40). Themean is 0.30 wt.%.
A normal distribution for total sur-face area is presented in Figure 41.Surface area indicates a range from72 to 254 m2/g and a mean of 148m2/g.
Figure 42 shows the distribution ofthe Ecat 0-40 micron content, whichranges from 0 to 28 wt.% with amean of 8 wt.%. The high end ofthe range indicates units, which canhold a tremendous amount of 0-40material and perhaps generateadditional fines from catalyst attri-tion. Several units at the low end ofthe distribution likely have cycloneproblems, which limit their ability tohold particles less than 40 microns.
Data presented in this article con-firms that the FCC industry valueshigh activity catalysts for units thatprocess hydrotreated feedstocks,are constrained by catalyst circula-tion and strive to operate at highconversion levels. Ecat contaminantlevels continue to increase, particu-larly CaO and Fe. As a result, theindustry will continue to demand
www.e-catalysts.com24

Figure 36Nickel Distribution
>000210000100080006000400020
002
051
001
05
061
821
06
602
Fre
qu
ency
Ni, ppm
Mean 1756
Figure 37Vanadium Distribution
00070006000500040003000200010
06
05
04
03
02
01
0112
58
010101
91
62
83
55
8373
33
Mean 1881
Fre
qu
ency
V, ppm
Figure 38Iron Distribution
>40.129.008.086.065.044.023.002.0
021
001
08
06
04
02
0
6411
62
201
711
62
1
Mean 0.5305
Fre
qu
ency
Fe, wt.%
25Catalagram 102 Fall 2007

Figure 39Calcium Distribution
>0.18.06.04.02.00.0
061
041
021
001
08
06
04
02
051020
6741
74
251
95
Mean 0.1441
Fre
qu
ency
CaO, wt.%
Figure 40Sodium Distribution
08.027.046.065.084.004.023.042.061.080.0
09
08
07
06
05
04
03
02
01
0332
6
12
93
97
19
74
2
Mean 0.3003
Fre
qu
ency
Na, wt.%
Figure 41Total Surface Area Distribution
08204200206102108
08
07
06
05
04
03
02
01
0011
5
51
64
8637
26
81
40
Mean 147.9
Fre
qu
ency
Total Surface Area, m2/g
www.e-catalysts.com26

FCC catalysts that provide excellentcoke selectivity and high liquidyields through enhanced metals tol-erance. This data also confirms that
Figure 420-40 Micron Particle Distribution
>2202816141210186420
07
06
05
04
03
02
01
0
433
9
41
04
25
56
45
33
41
2
Mean 8.198
Fre
qu
ency
0-40 Micron, wt.%
27Catalagram 102 Fall 2007
there is a wide distribution of contam-inant metals and that each catalystapplication must be designed for thespecific application.
References
1. Petti, Yaluris and Hunt, “Recent Commercial Experience in ImprovingRefining Profitability with Grace DavisonAlumina-Sol Catalysts,” Catalagram No. 99,pg. 2-11, 2006
2. Petti, Tomczak, Pereira, Cheng,“Investigation of nickel species on commer-cial FCC equilibrium catalysts-implicationson catalysts performance and laboratoryevaluation,” Applied Catalysis General 169(1998), pg. 95-109
3. Wormsbecher, Cheng, Kim, Harding,“Deactivation and Testing of HydrocarbonProcessing Catalysts,” ACS SymposiumSeries 634, 1996 American Chemical Society1996, pg. 283-295
4. Yaluris, et al, “The Effects of FePoisoning on FCC Catalysts,” NPRA AnnualMeeting 2001, New Orleans, LA, AM 01-59
5. Zhao, Cheng, “Deactivation andTesting of Hydrocarbon ProcessingCatalysts,” ACS Symposium Series 634, 1996American Chemical Society 1996, pg. 159-170
race Davison is pleased toannounce that we are work-ing on the redesign of the e-
Catalysts.com web site. The newsite will maintain a lot of the familiarplacement and navigational fea-tures of the old site with a newgraphic style and appearance thatis more focused on the needs of ourcustomers.
e-Catalysts.com celebrates its 6thanniversary this year and continues toremain focused on being the premierinternet source of customized techni-cal services for refining processes.
We invite you to visit e-Catalyststoday. If not already a memberand interested in joining, we inviteyou to apply at www.e-Catalysts.com or contact PhylStrawley at (410-531-8257).
www.e-Catalysts.com Redesign - Coming Soon
G

hevron USA’s Salt Lake CityRefinery loaded their recentlyrevamped ULSD unit in April
2006 with approximately 220,000 lbsof ART's SmART catalyst system™consisting of 75% ART CDXi and 25%ART AT505. The unit commencedoperation in May 2006. At the time ofstartup, the unit received hydrogenfrom several sources, and estimatesput the hydrogen purity between 65%and 75% at the reactor inlet. Shortlyafter start up the unit began deactivat-ing at a higher than expected rate,and it appeared that a catalystchange-out would be required by the
THE Effects of Treat Gas H2 Purity onULSD Catalyst Performance
A. E. Zieber Process Engineer,Chevron USA,Salt Lake City, UT Refinery
B.R.Watkins
C. W. Olsen Advanced RefiningTechnologies
end of the year. A summary of theperformance experienced duringthis period is shown in Figure 43.The figure shows that the start ofrun WABT was 665-670°F, and thevery high rate of deactivation isreadily apparent.
To help understand the perform-ance of this ULSD unit the refineryprovided feedstock for use in thepilot plant program. The goal of thestudy was to evaluate the perform-ance of the SmART system usingChevron, Salt Lake City feed andoperating conditions, and to explore
C
www.e-catalysts.com28

the impact of hydrogen partial pres-sure on catalyst activity and stabili-ty.
The initial phase of the pilot plantprogram utilized 100% hydrogen atunit conditions using lot retains ofthe catalyst loaded in the commer-cial unit. This showed that 628°Fwas required to achieve 7 ppmproduct sulfur. The Salt Lake CityULSD unit is not equipped with arecycle gas scrubber, and measure-ments indicated that there wasabout 2 mole% H2S in the recyclegas stream. Simulating 2 mole%H2S in the treatgas to the pilot plantresulted in a decrease in HDS activ-ity, and it then required about 635°Fto achieve 7 ppm product sulfur.
The next phase of the testing wasaimed at investigating the effects ofhydrogen purity on performance.Chevron was interested in compar-ing the impact of 90% H2 purity and70% H2 purity. As mentioned above,the purity at the start of the cyclewas believed to be between 65-75%, and 90% represented theexpected case after start up of anew hydrogen plant at the refinery.Since the pilot plant uses 100%hydrogen, the hydrogen purityeffects were simulated by adjustingthe pressure to match the hydrogenpartial pressure corresponding to
the desired hydrogen purities. Flashcalculations were completed usingthe commercial unit feed and condi-tions to determine the H2 pressure forboth 90% and 70% H2 purity cases.The 90% purity case operated at ahydrogen partial pressure of 612 psiawhile the 70% purity case was at apartial pressure of 480 psia.
The effects of lowering the hydrogenpartial pressures representing the90% and 70% purities had a signifi-cant effect on catalyst activity in ULSDservice. Operating at 612 psia hydro-gen resulted in an increase of WABTto achieve 7 ppm from 628°F to 642°Fwhile the 480 psia hydrogen caserequired an increase in temperature to657°F for 7 ppm sulfur. These results
are summarized along with the100% H2 purity and H2S effect inFigure 44.
The pilot plant protocol then calledfor 1000 hours of operation whilemaintaining 10 ppm sulfur in orderto compare the effects of decreas-ing hydrogen purity on catalyst sta-bility. The results of this are shownin Figure 45. The 90% purity systemhad a deactivation rate of about6°F/month while the 70% systemdeactivated at about 17°F/month.These pilot plant runs are summa-rized Figure 45.
In September 2006 the Salt LakeCity refinery brought their newhydrogen plant on line and this,combined with several other opera-tional changes, increased thehydrogen purity of the treat gas tothe ULSD unit to >95%. This result-ed in a significant decrease in therate of deactivation. The unit wasexperiencing 15°F/month deactiva-tion on average, with periods ashigh as 30 °F/month prior to startingthe hydrogen plant. The fouling ratedecreased to about 5°F/month withthe improved hydrogen purity. Thispart of the unit cycle is shown inFigure 46. These changes allowedthe unit to run a full 12-month cyclebefore turning around.
Not surprisingly, the hydrogen purityof the treat gas also has a signifi-cant impact on the product color.
Figure 43Chevron, Salt Lake ULSD OperationMay 2006 Through September 2006
610
630
650
670
690
710
730
750
100 120 140
Days
WA
BT,
F
0 20 40 60 80
Figure 44Hydrogen Purity Effects on Catalyst Activity
0 5 10 15 20 25 30 35
100% PURITY
2% H2S
90% PURITY
70% PURITY
Required WABT Increase, ˚F
29Catalagram 102 Fall 2007

The color of the product degradedsteadily as the catalyst deactivated,and after the aging step the ASTMcolor was significantly worst for the70% H2 case at <3.0 ASTM com-pared to 1.5 ASTM for the 90%hydrogen case. This compares withan ASTM color of around 1.0 forboth cases prior to aging. Similarly,the HDN activity is severely affect-ed. The product nitrogen increasedfrom 1-2 ppm to 20 ppm during theaging test for the 70% purity casecompared to a change of only 1 to3 ppm for the 90% purity case. Thisdemonstrates that lower H2 purityresults in a loss of HDS and HDNactivity, degrades product color andincreases the deactivation rate.
Chevron, Salt Lake turned theULSD unit around in June 2007 andloaded a fresh SmART catalyst sys-tem. The unit has been operated atfull capacity for several months with-out the same drastic start-of-runfouling rate observed on the previ-ous run, due to operation with >95%pure hydrogen. The current deacti-vation rate is showing <5 °F/month.
Advanced Refining Technologiesand Chevron worked closely togeth-er to troubleshoot the poor perform-
ance experienced in their newlyrevamped ULSD unit charged with aSmART Catalyst System. The pilotplant testing was able to prove that thehigh deactivation rate observed earlyin the cycle was completely the resultof the low hydrogen partial pressureand not the catalyst. Based on theconfidence developed in the pilotdata, Salt Lake again chose to loadthe ART catalyst for the second run.This experience is a good demonstra-
tion of the importance of hydrogenpartial pressure in ULSD applica-tions. Maintaining good hydrogenpartial pressure is extremely impor-tant for lower pressure ULSD units,and the data suggests that there isa hydrogen partial pressure "cliff”where lower purities cause a muchgreater than expected increase infouling rate.
Figure 45Relative Deactivation Rates With Hydrogen Purity
635
645
655
665
675
685
695
0 200 400 600 800 1000
Hours
WA
BT,
F
90%
70%
Figure 46Chevron, Salt Lake City ULSD Operation
With Improved H2 Purity
610
630
650
670
690
710
730
750
0 40 80 120 160 200 240 280 320 360 400Days
WA
BT,
F
www.e-catalysts.com30
31Catalagram 102 Fall 2007
nvironmental regulations havecaused refiners to lower speci-fications on the sulfur content of
motor fuels. Because FCC gasolinecontributes up to 90 % of the sulfur tothe gasoline pool, this has highlightedthe importance of reducing sulfurdirectly in the FCC unit. GraceDavison has been providing catalystsand additives that reduce FCC gaso-line sulfur by up to 45% to the refiningindustry for over 10 years. Thesetechnologies have been proven in over80 units worldwide and include bothadditive technologies D-PriSM® andGSR®-5, and complete catalyst sys-tems, such as SuRCA® and the newestcatalyst system NeptuneTM.
In 1992, well before the industry real-ized the need for sulfur reduction inFCC gasoline, Grace Davison began
its extensive research and develop-ment efforts to reduce sulfur in FCCproducts. The first patents, appear-ing in 1994 and 1996, describe aLewis acid on alumina based addi-tive technology, with the primaryLewis acid being Zn. Nearly all ofthe sulfur species in gasoline arethiophene and alkylthiophenes,which are Lewis bases. It is therealization that Lewis acid centerson the catalyst surface play a keyrole in the direct removal of sulfurspecies that led to the developmentof the D-PriSM additive, however, lit-tle was known about the details ofthe surface chemistry and reactionpathways. In 1994, Grace Davisonscientists proposed that the sulfurreducing additive increased thecracking of tetrahydrothiophenesas shown in Figure 47.
E
Catalytic FCC Gasoline:Sulfur Reduction
MechanismExcerpted from The Journal of Catalysis
Yuying Shu
Rick Wormsbecher
Grace Davison RefiningTechnologies
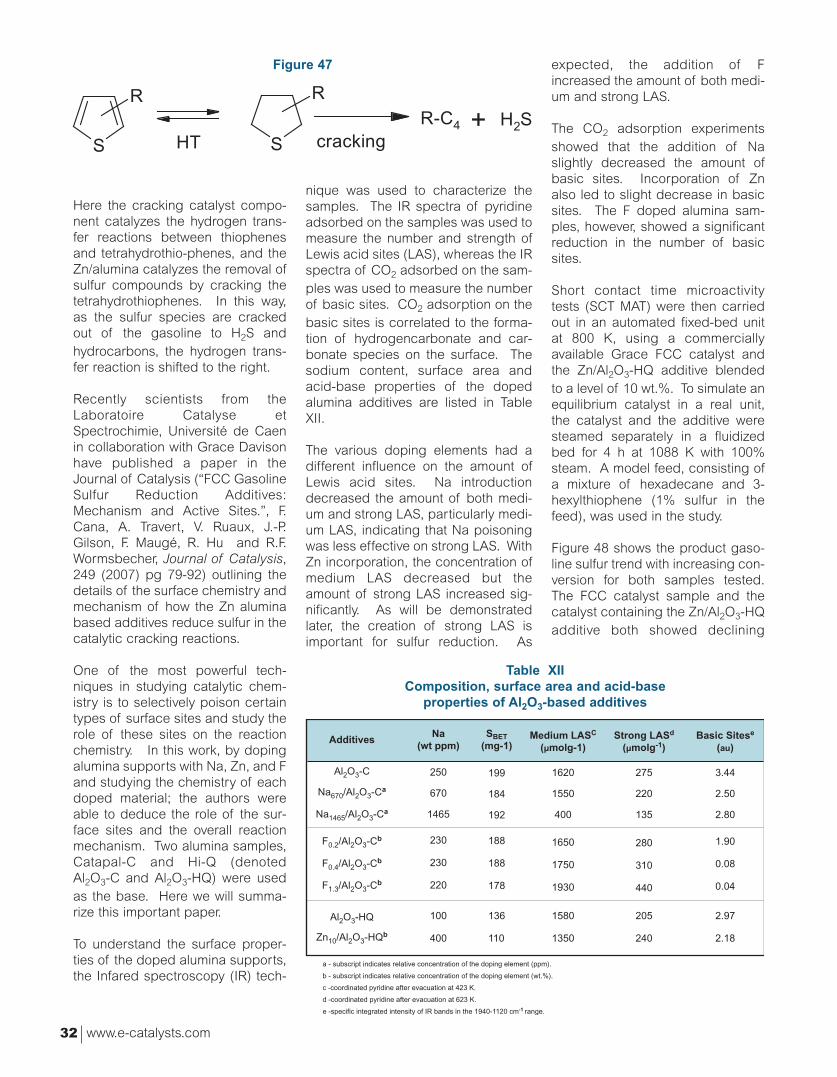
Here the cracking catalyst compo-nent catalyzes the hydrogen trans-fer reactions between thiophenesand tetrahydrothio-phenes, and theZn/alumina catalyzes the removal ofsulfur compounds by cracking thetetrahydrothiophenes. In this way,as the sulfur species are crackedout of the gasoline to H2S andhydrocarbons, the hydrogen trans-fer reaction is shifted to the right.
Recently scientists from theLaboratoire Catalyse etSpectrochimie, Université de Caenin collaboration with Grace Davisonhave published a paper in theJournal of Catalysis (“FCC GasolineSulfur Reduction Additives:Mechanism and Active Sites.”, F.Cana, A. Travert, V. Ruaux, J.-P.Gilson, F. Maugé, R. Hu and R.F.Wormsbecher, Journal of Catalysis,249 (2007) pg 79-92) outlining thedetails of the surface chemistry andmechanism of how the Zn aluminabased additives reduce sulfur in thecatalytic cracking reactions.
One of the most powerful tech-niques in studying catalytic chem-istry is to selectively poison certaintypes of surface sites and study therole of these sites on the reactionchemistry. In this work, by dopingalumina supports with Na, Zn, and Fand studying the chemistry of eachdoped material; the authors wereable to deduce the role of the sur-face sites and the overall reactionmechanism. Two alumina samples,Catapal-C and Hi-Q (denotedAl2O3-C and Al2O3-HQ) were usedas the base. Here we will summa-rize this important paper.
To understand the surface proper-ties of the doped alumina supports,the Infared spectroscopy (IR) tech-
nique was used to characterize thesamples. The IR spectra of pyridineadsorbed on the samples was used tomeasure the number and strength ofLewis acid sites (LAS), whereas the IRspectra of CO2 adsorbed on the sam-ples was used to measure the numberof basic sites. CO2 adsorption on thebasic sites is correlated to the forma-tion of hydrogencarbonate and car-bonate species on the surface. Thesodium content, surface area andacid-base properties of the dopedalumina additives are listed in TableXII.
The various doping elements had adifferent influence on the amount ofLewis acid sites. Na introductiondecreased the amount of both medi-um and strong LAS, particularly medi-um LAS, indicating that Na poisoningwas less effective on strong LAS. WithZn incorporation, the concentration ofmedium LAS decreased but theamount of strong LAS increased sig-nificantly. As will be demonstratedlater, the creation of strong LAS isimportant for sulfur reduction. As
expected, the addition of Fincreased the amount of both medi-um and strong LAS.
The CO2 adsorption experimentsshowed that the addition of Naslightly decreased the amount ofbasic sites. Incorporation of Znalso led to slight decrease in basicsites. The F doped alumina sam-ples, however, showed a significantreduction in the number of basicsites.
Short contact time microactivitytests (SCT MAT) were then carriedout in an automated fixed-bed unitat 800 K, using a commerciallyavailable Grace FCC catalyst andthe Zn/Al2O3-HQ additive blendedto a level of 10 wt.%. To simulate anequilibrium catalyst in a real unit,the catalyst and the additive weresteamed separately in a fluidizedbed for 4 h at 1088 K with 100%steam. A model feed, consisting ofa mixture of hexadecane and 3-hexylthiophene (1% sulfur in thefeed), was used in the study.
Figure 48 shows the product gaso-line sulfur trend with increasing con-version for both samples tested.The FCC catalyst sample and thecatalyst containing the Zn/Al2O3-HQadditive both showed declining
Figure 47
S S
R R
HT+ H2S
crackingR-C4
Table XIIComposition, surface area and acid-base
properties of Al2O3-based additives
AdditivesNa
(wt ppm)SBET
(mg-1)Medium LASC
(µmolg-1)Strong LASd
(µmolg-1)Basic Sitese
(au)
Al2O3-C
Na670/Al2O3-Ca
Na1465/Al2O3-Ca
F0.2/Al2O3-Cb
F0.4/Al2O3-Cb
F1.3/Al2O3-Cb
Al2O3-HQ
Zn10/Al2O3-HQb
250
670
1465
230
230
220
100
400
199
184
192
188
188
178
136
110
1620
1550
400
1650
1750
1930
1580
1350
275
220
135
280
310
440
205
240
3.44
2.50
2.80
1.90
0.08
0.04
2.97
2.18
a - subscript indicates relative concentration of the doping element (ppm).
b - subscript indicates relative concentration of the doping element (wt.%).
c -coordinated pyridine after evacuation at 423 K.
d -coordinated pyridine after evacuation at 623 K.
e -specific integrated intensity of IR bands in the 1940-1120 cm-1 range.
www.e-catalysts.com32

33Catalagram 102 Fall 2007
gasoline sulfur with increasing con-version. This is consistent with pre-viously published literature.
Figure 49 shows the gasoline sulfurspecies at constant conversion(63%) for both samples. The addi-tion of the Zn/Al2O3-HQ additiveresulted in a 26% reduction in gaso-line sulfur, with most of the reduc-tion observed in the tetrahydrothio-phene (THT), thiophene, andalkylthiophenes species. In particu-lar, the additive led to the completeremoval of THT (99%), with muchless thiophene reduction (14%).This experiment using the modelfeed corroborates Grace Davison'searlier proposal that the sulfurreduction of the Zn based additiveproceeds through the reactiongiven in Figure 47, where the Znadditive catalyzes the cracking ofTHT.
To better elucidate the reactivity ofTHT and thiophene in the presenceof the additives, reactivity testswere conducted on the pure alumi-na and doped alumina samples.Thiophene did not react at all withthe additives and the conversionswere less than 1%. However, withmost of the additives, THT essen-tially cracked to 1,3-butadiene andH2S according to the reactionshown in Figure 51.
Table XIII shows the initial rates ofthe various additives for THTdecomposition. The Na dopedsamples led to a marked decreaseof the initial activity, and a linearrelationship existed between the ini-tial conversion and the Na contentof the three additives. Surprisingly,the F doped samples also led to avery strong decrease in initial activ-ity, which became very low for thehighest fluorine content.Conversely, the addition of Zn toAl2O3-HQ increased the initial rateby about 50%.
To gain more insight into the natureof the active sites for THT cracking,the operando IR technique was
Figure 48Influence of conversion on gasoline sulfur concentration for base FCCcatalyst (Without additive) and catalyst + Zn/Al2O3-HQ (With additive)
With additive
Withoutadditive
8000
Conversion (wt.%)
S/p
pm
6000
4000
2000
020 30 40 50 60 70 80
Figure 49Gasoline sulfur species for base FCC catalyst (Without additive) and
catalyst + Zn/Al2O3-HQ (With additive) at 63% conversion
With additive
Withoutadditive
1800
S/p
pm
mercaptans
1600
1400
12001000800
0
200400
600
THT
Thiophenol
Thiophene
Alkylthiophenes
Benzothiophene
Figure 50IR spectra recorded during THT conversion on Al2O3-C
Wavenumber cm-1
0.2
3500
510
15
14501560
295836003765
3000 2500 2000 1500
690 K
W/F = 3,2 g.h.mol-1
A
time/
min
.

used to simultaneously obtain the IRspectra of surface species andonline measurement of catalyticactivity.
A series of surface IR spectrarecorded during the reaction of THTon Al2O3-C is presented in Figure50, while the evolution of the con-version with the time on-stream isdisplayed in Figure 52. The peaksobserved at 1565 and 1450 cm 1are carboxylate peaks formed bythe reaction of the product butadi-ene from Figure 51 with the basicsites on the additive. These peaksgrow in intensity with increasingtime on-stream.
Figure 52 shows a linear correlationbetween the THT conversion andthe carboxylate peaks, suggestingthat the deactivation is likely due tothe poisoning of the basic sites bythe product butadiene, and alsoindicates that the basic sites arenecessary for the catalytic reactionto decompose THT. The importanceof basic sites will become clearerafter the discussion of the F dopingexperiments later in this article.
To elucidate the influence of Lewisacid sites on reactivity, the concen-tration of LAS of the catalyst weremodified by different amounts ofpyridine before performing the reac-tion. The IR spectra recorded afterpyridine pre-adsorption showedthat under such conditions, pyridineonly adsorbed on the strong LAS ofalumina. The amount of LAS poi-soned by pyridine adsorption wasdetermined from the IR spectra.The variation of the conversion inTHT decomposition versus theamount of pre-adsorbed pyridine(see Figure 53) showed thatdecreasing the concentration ofstrong LAS had a direct deleteriouseffect on catalytic activity.
From the experiments describedabove, it is clear that the strongLewis acid sites (strong LAS) play asignificant role in THT decomposi-
Figure 51
S+ H2S
Figure 52THT conversion versus carboxylates
(Reprinted by permission of 2007 Elsevier Inc.)
3
4
5
6
7
15 20 25 30 35 40 45 50carboxylates (au)
Co
nv.
% T
HT
Figure 53THT conversion rate vs. pre-adsorbed pyridine
10
Co
nve
rsio
n (
%)
Pre-adsorbed Pyridine (µmol/g)
8
6
4
2
00 20 40 60 80
Table XIIIInitial rates for THT Transformation of
the Alumina-Based additives
Additives THT Rated
r0(mol h-1 g-1)
Al2O3-C
Na670/Al2O3-C
Na1465/Al2O3-C
F0.2/Al2O3-C
F0.4/Al2O3-C
F1.3/Al2O3-C
Al2O3-HQ
Zn/Al2O3-HQ
0.209
0.144
0.049
0.090
0.059
0.010
0.115
0.170
Measured after 1 min of reaction
www.e-catalysts.com34

35Catalagram 102 Fall 2007
tion. In the publication, the authorsshowed that THT preferentiallyadsorbed on the strong LAS, sug-gesting that the key step in thedecomposition of THT is its adsorp-tion on strong LAS. By selectivelypoisoning of the LAS with pyridine,the rate of THT decomposition isdecreased.
The pyridine adsorption IR spectra,Figure 54, shows that Na decreasesthe number of strong acid sites,while Zn increases the number ofstrong acid sites. Using this and thedata in Table XIII, the authors corre-lated the initial THT conversion withthe concentration of strong LAS(see Figure 55). Therefore, the poi-soning of the strong Lewis acidsites by sodium significantlydecreases activity and the promo-tion of strong Lewis acid sites by Znincreases the activity.
The behavior of the F doped sam-ples was very different than the Znor Na doped samples. Fluorineincreases the LAS (Table XII) yetdecreases the conversion of THT.This surprising result is curioussince fluorine is a well-known pro-moter of Lewis acid catalyzed reac-tions. The authors conclude that theLAS are necessary but not sufficientfor THT conversion. From the CO2
adsorption data (Table XII), it isseen that the addition of fluorinedecreased the number of basicsites. When the initial activity is plot-ted versus the number of basicsites for the fluorine doped samples,a linear correlation is observed (seeFigure 56). This correlation is astrong indication of the involvementof the basic sites on the surface ofthe additives. Also, from theoperando experiments, the lineardecrease in the activity as the car-boxylate species formed on the sur-face (Figure 52) showed that as thebasic oxygen centers converted tocarboxylate the reaction sloweddown. This is another indication ofthe role of the basic sites on thedecomposition of THT.
The authors noted that there is astrong similarity of THT cracking withthe decomposition of alcohols overalumina. Consequently they proposedthe mechanism shown in Figure 57,which is formally known an E2-typeelimination involving both Lewis acidand basic oxygen site pairs.Essentially the Lewis acid site selec-tively adsorbs the Lewis base sulfur ofthe THT molecule. The basic sitespromote the abstraction of protons tocatalyze the cracking of THT to buta-
Figure 54IR spectra of pyridine adsorption indicating
influence of Na and Zn on LAS
Wavenumbers cm-1
0.1
Nadoping
1624
1650 1600
strongLAS
1616
mediumLAS
A
Zndoping
}}
C-250
C-670C-1465
HiQ
Zn/HiQ
Figure 55Role of LAS in activity
0
20
40
60
80
Number of strongest LAS 8a (1624 cm-1)
Na poisoning
Zn doping
C-250
C-670
C-1465
HiQ
Zn/HiQ
Init
ialC
on
vers
ion
(%
)
0,1 0,2 0,3
v
diene and H2S. The proposedmechanism accounts for high selec-tivity for THT cracking due to thebalance of surface acid-base prop-erties.
In summary, using a wide variety ofspectroscopic, operando, shortcontact time microactivity, and cat-alytic techniques the mechanism ofsulfur reduction by Zn aluminabased additives was determined.The incorporation of Zn favors theformation of strong LAS at the
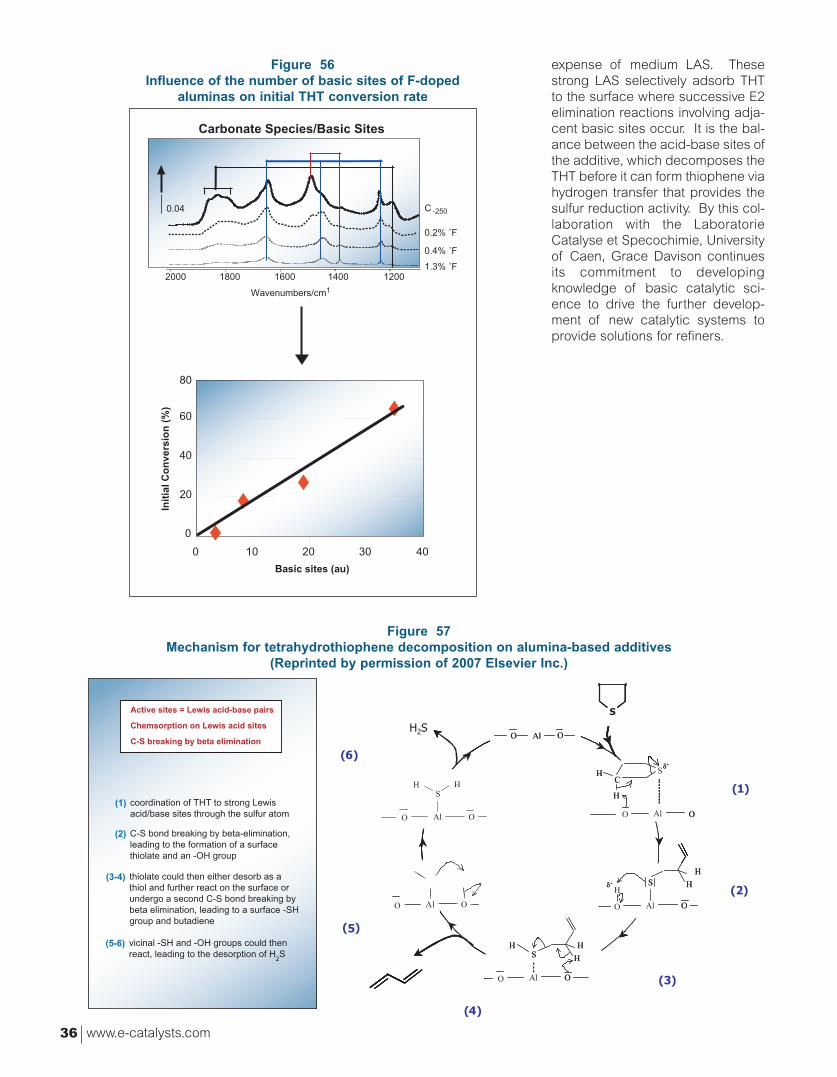
Figure 56Influence of the number of basic sites of F-doped
aluminas on initial THT conversion rate
0.04 C -250
0.2% ˚F
0.4% ˚F
1.3% ˚F
Carbonate Species/Basic Sites
0
20
40
60
80
0
Basic sites (au)
Init
ial C
on
vers
ion
(%
)
2000 1800 1600 1400 1200
Wavenumbers/cm1
10 20 30 40
Figure 57Mechanism for tetrahydrothiophene decomposition on alumina-based additives
(Reprinted by permission of 2007 Elsevier Inc.)
AlO
SC
H
O
Hδ+
AlO
H
O
S H
H
δ+
AlO O
S H
HH
AlO O
SH
H
S
H2S AlO O
AlO O
SH H
AlO
SC
H
O
Hδ+
AlO
SC
H
O
Hδ+
AlO
H
O
S H
H
δ+
AlO
H
O
S H
H
δ+
AlO
H
O
S H
H
δ+
AlO O
S H
HH
AlO O
S H
HH
AlO O
SH
H
AlO O
SH
H
AlO OAlO O
AlO O
SH H
AlO
SC
H
O
Hδ+
AlO
H
O
S H
H
δ+
AlO O
S H
HH
AlO O
SH
H
AlO O
AlO O
SH H
AlO
SC
H
O
Hδ+
AlO
SC
H
O
Hδ+
AlO
H
O
S H
H
δ+
AlO
H
O
S H
H
δ+
AlO
H
O
S H
H
δ+
AlO O
S H
HH
AlO O
S H
HH
AlO O
SH
H
AlO O
SH
H
AlO OAlO O
AlO O
SH H (1)
(3)
(4)
(5)
(6)
(2)
coordination of THT to strong Lewisacid/base sites through the sulfur atom
(1)
thiolate could then either desorb as athiol and further react on the surface orundergo a second C-S bond breaking bybeta elimination, leading to a surface -SHgroup and butadiene
(3-4)
C-S bond breaking by beta-elimination,leading to the formation of a surface thiolate and an -OH group
(2)
vicinal -SH and -OH groups could thenreact, leading to the desorption of H
2S
(5-6)
Active sites = Lewis acid-base pairs
Chemsorption on Lewis acid sites
C-S breaking by beta elimination
expense of medium LAS. Thesestrong LAS selectively adsorb THTto the surface where successive E2elimination reactions involving adja-cent basic sites occur. It is the bal-ance between the acid-base sites ofthe additive, which decomposes theTHT before it can form thiophene viahydrogen transfer that provides thesulfur reduction activity. By this col-laboration with the LaboratorieCatalyse et Specochimie, Universityof Caen, Grace Davison continuesits commitment to developingknowledge of basic catalytic sci-ence to drive the further develop-ment of new catalytic systems toprovide solutions for refiners.
www.e-catalysts.com36