Embed Size (px)
Citation preview

Monthly M&A InsIderA mergermArket report on globAl m&A Activity
mArcH 2012
Monthly M&A InsIdermergermarket
GlobAl overvIew 01
AmericAs: lAtin AmericA 06
nortH AmericA 11
AsiA-pAcific 16
europe 21
middle eAst & AfricA 27
About MerrIll corporAtIon 32
www.mergermarket.comPart of the mergermarket group
CONTENTS
80 strandlondon, Wc2r 0rlunited kingdom
t: +44 (0)20 7059 6100f: +44 (0)20 7059 [email protected]
11 West 19th street 2nd fl.new york, ny 10011usA
t: +1 212 686-5606f: +1 212 [email protected]
suite 2401-3grand millennium plaza181 Queen’s road, centralHong kong
t: +852 2158 9700f: +852 2158 [email protected]
Monthly M&A Insider
global overview
01
Despite these discouraging numbers, easing volatility in global markets and rising optimism in the US are fuelling expectations of an increase in M&A activity. Relieved after the ECB’s second major injection of liquidity into the banking system, followed by an orderly Greek default, investors are now hungrier for growth. On the front line are business leaders in the corporate sphere, where robust earnings have heralded stronger forecasts.
Key indicators are also providing good reasons to expect more fruitful months ahead. In the US, declining unemployment and better than expected economic growth are likely to boost business confidence. A number of possible takeover targets are currently trading at low multiples, cast aside by wary investors but with strong cases that they’re undervalued. Eventually, this could trigger more firms in the region to deploy their capital, seeking expansion at this key turning point.
The outlook for private equity is looking up as well. Indices that track fund returns demonstrate that whilst the class has experienced losses over recent months, it has outperformed global stock markets and the next couple of years could see more winners emerge amongst financial investors.
Another particularly buoyant region for M&A over the past month has been Latin America, thanks mostly to one major transaction in the card services industry. Brazil’s biggest bank, Itau, has moved to take the nation’s second biggest card payment processor, Redecard, private in a US$7bn deal.
The sale comes after an 84% increase in Redecard’s stock price over the past twelve months. Redecard will continue to face fierce competition from larger rival Cielo, with whom it shares 80% of the US$400 billion-a-year card payment processing market.
The global economic environment has damaged Latin American growth, yet more M&A is expected in the years ahead as abundant natural resources and the region’s growth potential attracts inbound acquirers. In one of the most prominent recent stories, Andarko Petroleum’s Brazilian business looks set to fetch up to US$3bn from Norway’s Statoil. Such a deal would give Norway’s state-controlled energy group greater access to one of the world’s most potentially lucrative offshore oil territories.
Meanwhile in Europe, the Central Bank’s US$700m second round Long Term Refinancing Operation (LTRO 2) reduced the risk of liquidity driven bank failure, particularly in the south where bond yields are also beginning to stabilise. M&A has begun to recover in Financial Services and under-capitalised banks are possible takeover targets for stronger acquirers. For example Marfin Popular Bank (MPB), the listed Greek-Cypriot bank is reportedly being courted by Russia’s VTB Bank, which is interested in acquiring a 33% stake, though other possible buyers are in the running. The news comes as Sberbank completes a US$812m acquisition of Austria-based Volksbank International (VBI), underscoring the hunger amongst Russian banks for global expansion.
GLOBAL OVERVIEw
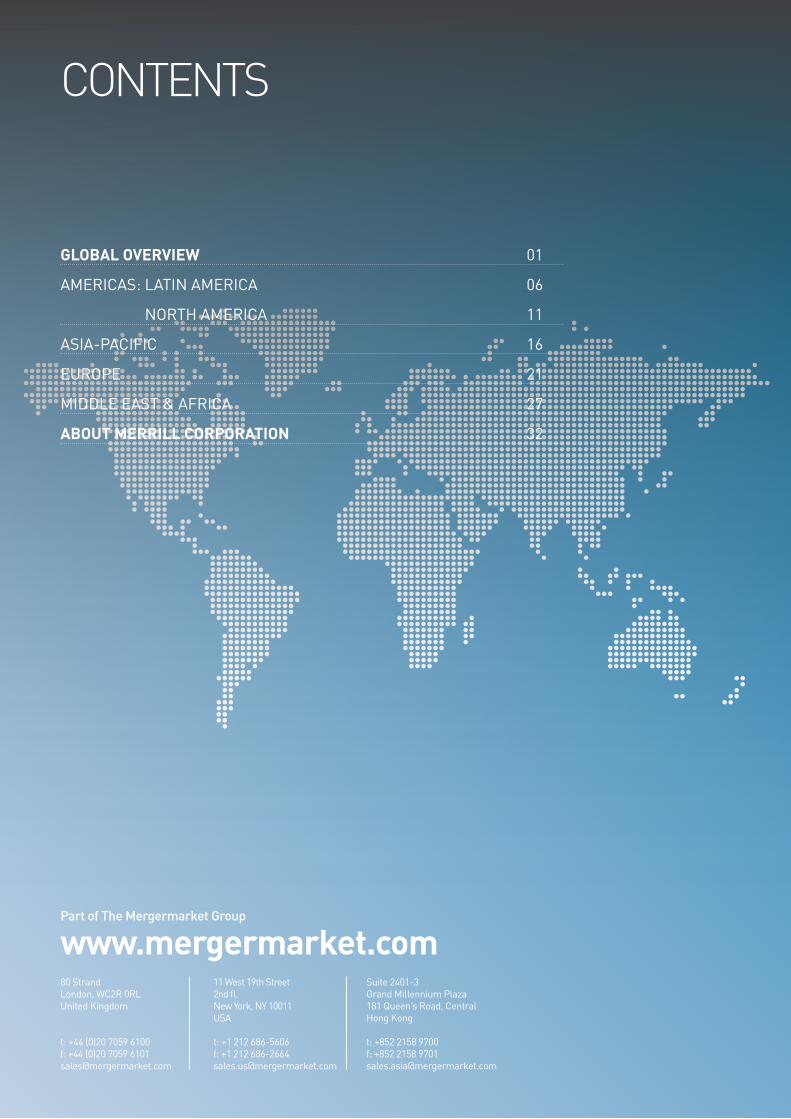
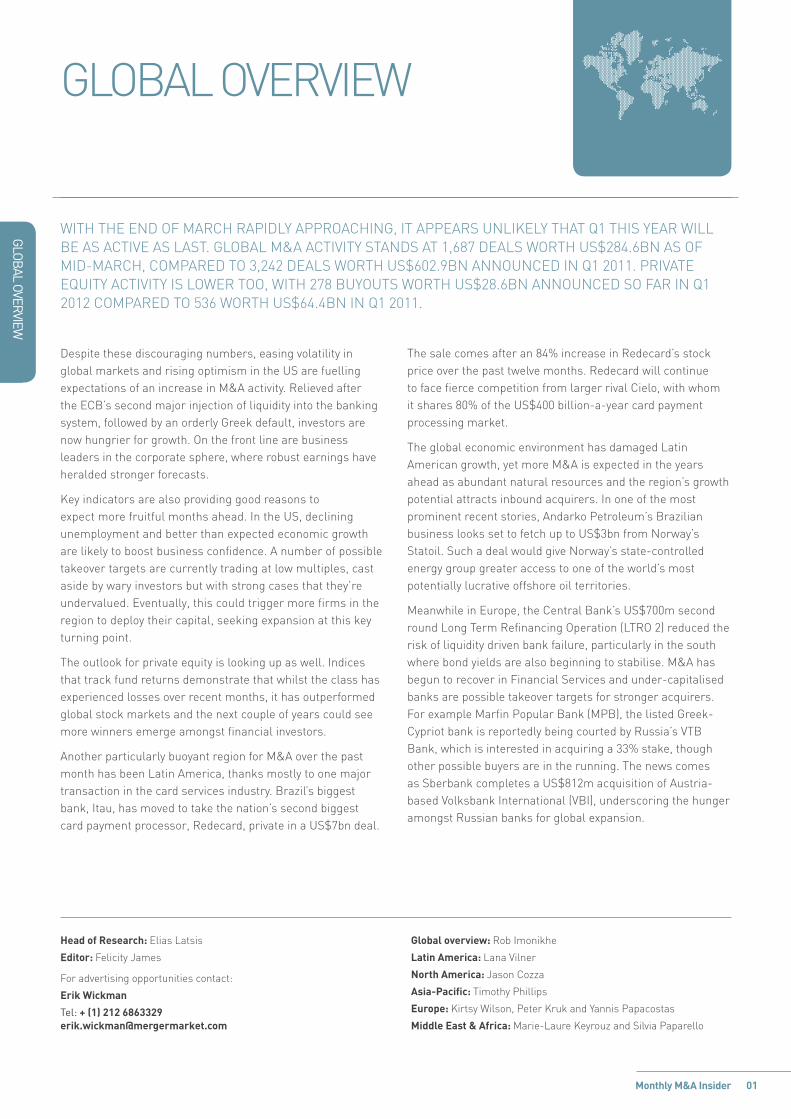
wITh ThE END OF MARCh RAPIDLy APPROAChING, IT APPEARS UNLIKELy ThAT Q1 ThIS yEAR wILL BE AS ACTIVE AS LAST. GLOBAL M&A ACTIVITy STANDS AT 1,687 DEALS wORTh US$284.6BN AS OF MID-MARCh, COMPARED TO 3,242 DEALS wORTh US$602.9BN ANNOUNCED IN Q1 2011. PRIVATE EQUITy ACTIVITy IS LOwER TOO, wITh 278 BUyOUTS wORTh US$28.6BN ANNOUNCED SO FAR IN Q1 2012 COMPARED TO 536 wORTh US$64.4BN IN Q1 2011.
Head of Research: Elias Latsis
Editor: Felicity James
For advertising opportunities contact:
Erik Wickman
Tel: + (1) 212 6863329 [email protected]
Global overview: Rob Imonikhe
Latin America: Lana Vilner
North America: Jason Cozza
Asia-Pacific: Timothy Phillips
Europe: Kirtsy wilson, Peter Kruk and yannis Papacostas
Middle East & Africa: Marie-Laure Keyrouz and Silvia Paparello
Monthly M&A Insider 02
globAl overvieW
TrENd graPhS
GlobAl M&A quArterly trend
0
200
400
600
800
1,000
1,200
1,400
Q112*
Q411
Q311
Q211
Q111
Q410
Q310
Q210
Q110
Q409
Q309
Q209
Q109
Q408
Q308
Q208
Q108
Q407
Q307
Q207
Q107
Q406
Q306
Q206
Q106
Valu
e (U
S$bn
)
Total value Mid-market value
Num
ber of deals
0
500
1,000
1,500
2,000
2,500
3,000
3,500
4,000
4,500
Total volume Mid-market volume
0
50
100
150
200
250
300
350
400
Q112*
Q411
Q311
Q211
Q111
Q410
Q310
Q210
Q110
Q409
Q309
Q209
Q109
Q408
Q308
Q208
Q108
Q407
Q307
Q207
Q107
Q406
Q306
Q206
Q106
Valu
e (U
S$bn
)
Buyout value Exit value
Num
ber of deals
Buyout volume Exit volume
0
100
200
300
400
500
600
700
800
900
GlobAl M&A AnnuAl trend GlobAl M&A AnnuAl prIvAte equIty trend
0
500
1,000
1,500
2,000
2,500
3,000
3,500
4,000
YTD 2012*201120102009200820072006
Valu
e (U
S$bn
)
Total value Mid-market value
Num
ber of deals
0
2,000
4,000
6,000
8,000
10,000
12,000
14,000
16,000
18,000
Total volume Mid-market volume
0
100
200
300
400
500
600
700
800
900
YTD 2012*201120102009200820072006
Valu
e (U
S$bn
)
Buyout value Exit value
Num
ber of deals
Buyout volume Exit volume
0
500
1,000
1,500
2,000
2,500
3,000
3,500
GlobAl M&A quArterly prIvAte equIty trend
Monthly M&A Insider 03
globAl overvieW
TrENd graPhS
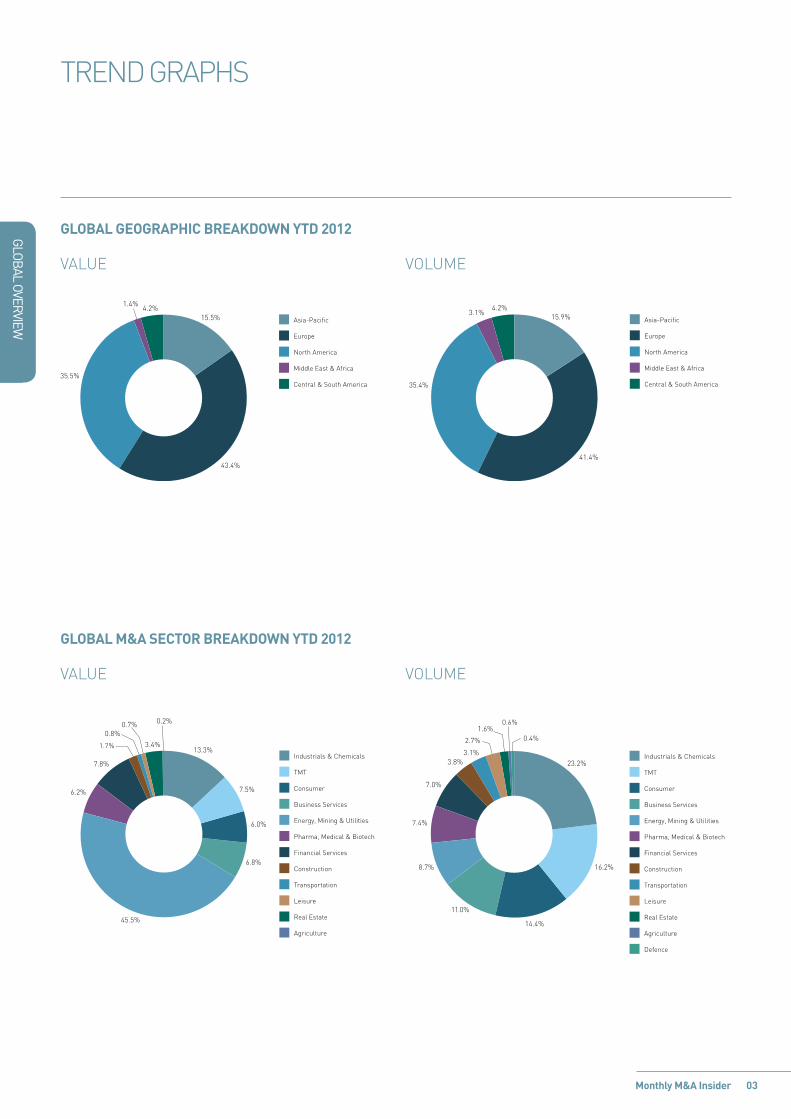
GlobAl M&A sector breAkdown ytd 2012
GlobAl GeoGrAphIc breAkdown ytd 2012
valuE
valuE
vOluME
vOluME
45.5%
6.8%
3.4%1.7%
0.7% 0.2%
7.8%
0.8%
6.2%
13.3%
7.5%
6.0%
Industrials & Chemicals
TMT
Consumer
Business Services
Energy, Mining & Utilities
Pharma, Medical & Biotech
Financial Services
Construction
Transportation
Leisure
Real Estate
Agriculture
1.4%4.2%
35.5%
43.4%
15.5% Asia-Pacific
Europe
North America
Middle East & Africa
Central & South America
8.7%
11.0%
0.6%
0.4%2.7%
3.1%
1.6%
7.0%
3.8%
7.4%
23.2%
16.2%
14.4%
Industrials & Chemicals
TMT
Consumer
Business Services
Energy, Mining & Utilities
Pharma, Medical & Biotech
Financial Services
Construction
Transportation
Leisure
Real Estate
Agriculture
Defence
4.2%3.1%
35.4%
41.4%
15.9% Asia-Pacific
Europe
North America
Middle East & Africa
Central & South America
Monthly M&A Insider 04
globAl overvieW
TrENd graPhS
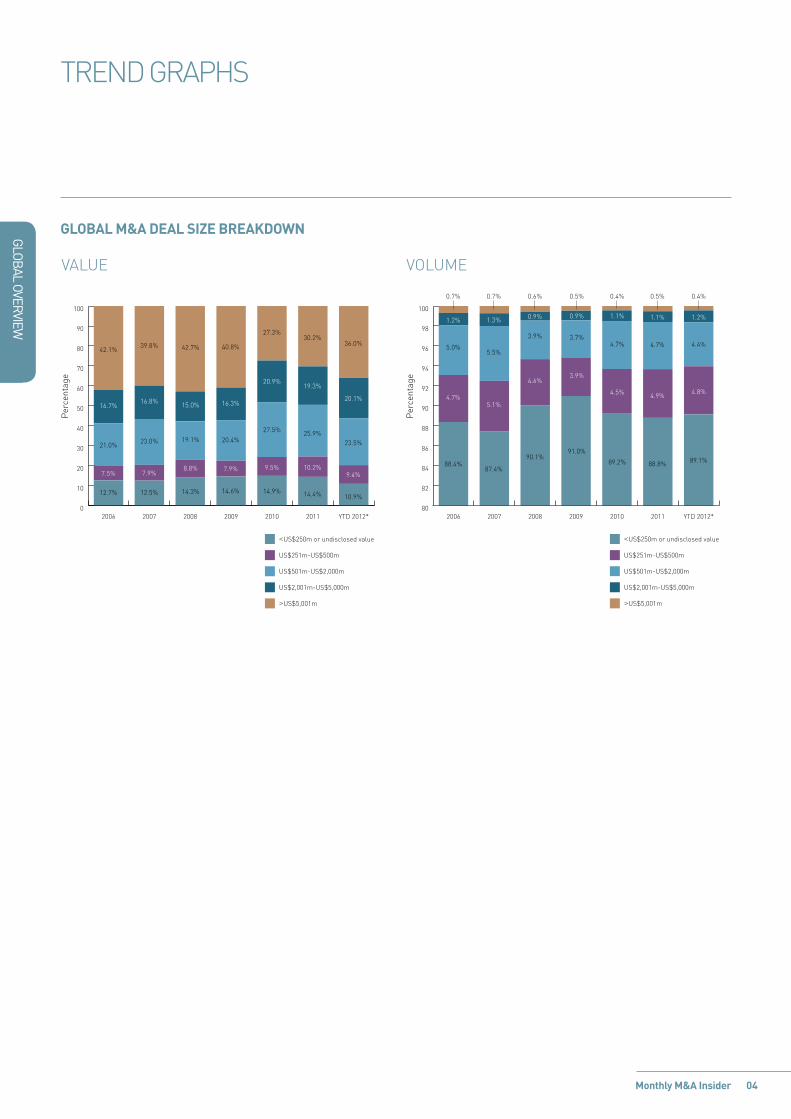
GlobAl M&A deAl sIze breAkdown
valuE vOluME
0
10
20
30
40
50
60
70
80
90
100
YTD 2012*201120102009200820072006
42.1%
16.7%
21.0%
7.5%
12.7%
39.8%
16.8%
23.0%
7.9%
12.5%
42.7%
15.0%
19.1%
8.8%
14.3%
40.8%
16.3%
20.4%
7.9%
14.6%
27.3%
20.9%
27.5%
9.5%
14.9%
30.2%
19.3%
25.9%
10.2%
14.4%
36.0%
20.1%
23.5%
9.4%
10.9%
<US$250m or undisclosed value
US$251m-US$500m
US$501m-US$2,000m
US$2,001m-US$5,000m
>US$5,001m
Per
cent
age
80
82
84
86
88
90
92
94
96
98
100
YTD 2012*201120102009200820072006
<US$250m or undisclosed value
US$251m-US$500m
US$501m-US$2,000m
US$2,001m-US$5,000m
>US$5,001m
1.2%
5.0%
4.7%
88.4%
1.3%
5.5%
5.1%
87.4%
0.6%
0.9%
3.9%
4.6%
90.1%
0.9%
3.7%
3.9%
91.0%
89.2%
4.5%
4.7%
1.1%
0.4%
1.1%
4.7%
4.9%
88.8%
0.7% 0.7% 0.5%
1.2%
4.4%
4.8%
89.1%
0.4%0.5%
Per
cent
age

Smarter • Faster • EasierSecure • Precise • EfficientAward Winning • Global
Certified • Industry Leading24/7/365 Service • Solutions
Smarter • Faster • EasierSecure • Precise • EfficientAward Winning • Global
Certified • Industry Leading24/7/365 Service • Solutions
Confidential • CompliantBest Practices
Focusedon yourbusiness
We thought of that.
datasite.com
Don’t you deserve a partner who is as focused on your business as you are?
Dealmakers know they need to be aggressive, determined and experienced to get the best results for their deal. As the best virtual data room (VDR) in the business, Merrill DataSite brings that same intense focus to our customers.
With true transparency in pricing, terms & conditions, award winning customer service, and the highest standard in security certification, Merrill DataSite’s cutting-edge technology and 24-7 client support allows M&A dealmakers to move fast and play to win. Users can easily organise, review and share data for due diligence on a completely secure, simple-to-use datasite, accessible via the Internet globally. Merrill DataSite can have your VDR ready for loading in as little as two hours, with extensive content loaded and ready for review within 24 hours.
Merrill delivers unmatched customer service throughout the entire deal process so the only thing you need to focus on is your deal.
At Merrill DataSite, we believe in sharing ideas and best practices that assist companies in expanding and capturing new opportunities. Case Studies and White Papers are available based on Business Type (M&A, IPO, Bankruptcy, etc.) and for specific audiences: Legal Advisors – Investment Banking – Corporate Executive Level. To download our FREE industry survey reports please visit the Merrill DataSite Knowledge Center at www.datasite.com.
M E R R I L L D A T A S I T E
LATIN AM
ERICA
LATIN AMERICAA MERgERMARkET M&A REpoRT oN
Monthly M&A Insider 06
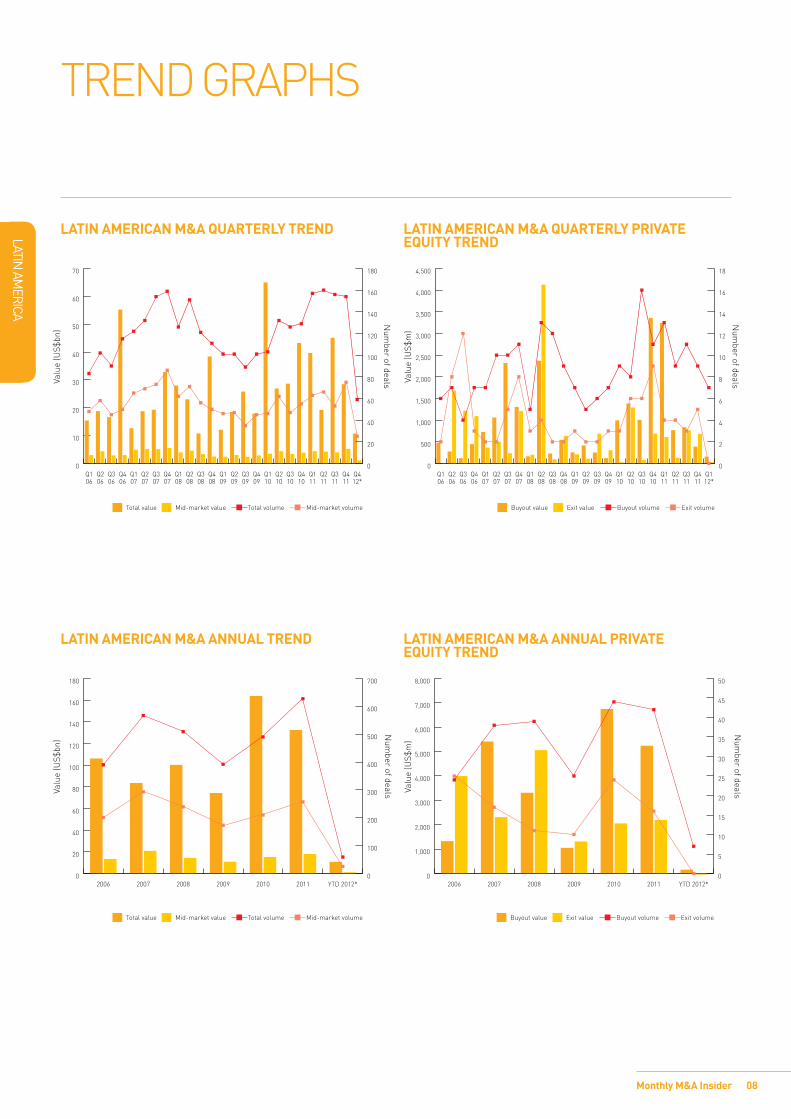
Nonetheless, despite the low overall M&A activity in early 2012, the number of Latin American leveraged buyouts in January and February of the year (7 deals worth US$160m) was on par with Q4 2011’s numbers (9 deals worth US$390m). It is not inconceivable that by the end of March the number of buyout transactions in the first quarter of 2012 will surpass last quarter’s figures. The growing volume and value of such deals is a further proof that Latin American markets – and especially Brazil – are becoming increasingly popular among global private equity firms. For example, H.I.g. Capital has recently opened an office in Rio de Janeiro and announced a plan to expand its operations in Latin America.
Although pE investors are beginning to explore opportunities in several countries of the region such as Colombia and peru, Brazil, with its growing economy and untapped potential, is the number one target for private equity firms at this point. At the beginning of March, for instance, the Carlyle group announced its acquisition of Ri Happy Brinquedos Ltda, the largest retail toy chain in Brazil, for an estimated consideration of US$352m.
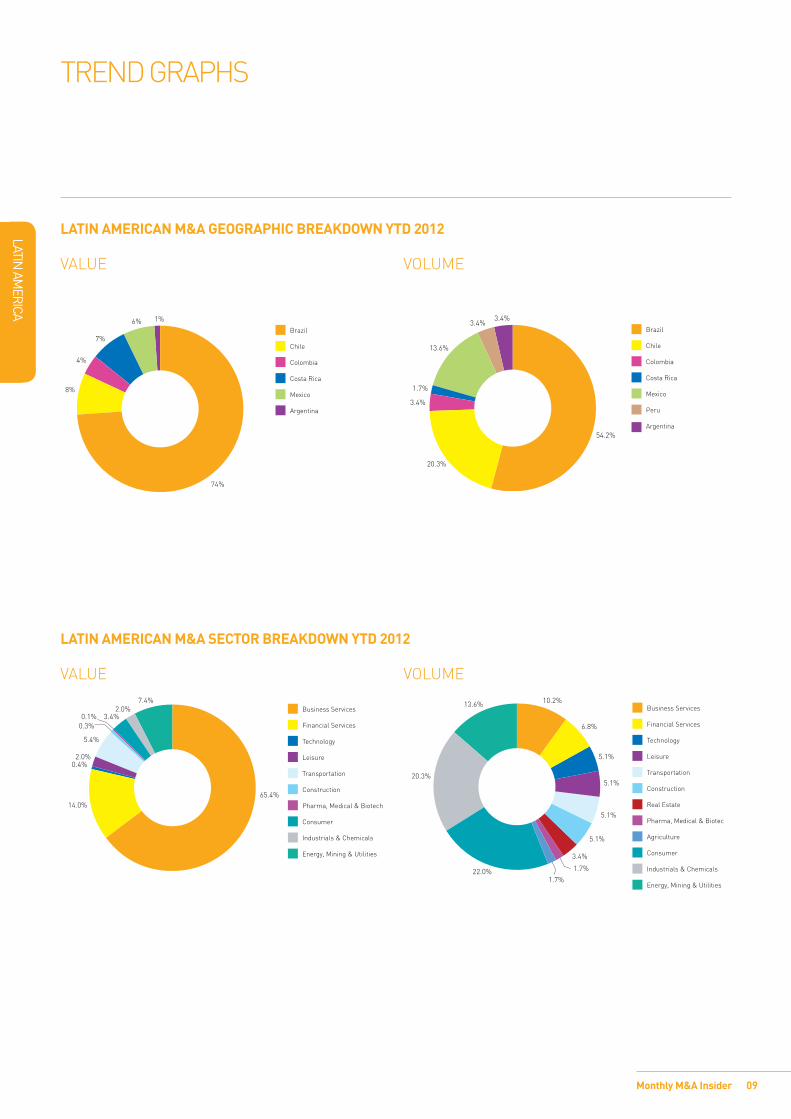
Notably, the Ri Happy deal belongs to the Consumer sector, which saw the largest number of announced deals in January and February of 2012 (13 transactions valued at US$ 330m). This one deal announced in the beginning of March will more than double the overall value in the sector. At the same time, Business Services dominated the sector tables by value with 6 deals worth US$7bn. However, most of the value for the sector came from Itau Unibanco Holdings SA’s acquisition of a 49.99% stake in Redecard SA, a Brazil-based provider of credit card payment processing services, for a total deal value of US$6.9bn). The transaction had an EBITDA multiple of 12.3x and a relatively high revenue multiple of 7.6x. As a result of this transaction, Itau, which already owns the remaining 50.01% stake in Redecard, will be able to strengthen its position in the lucrative and expanding credit card payment processing industry in Brazil.
As the Brazilian economy continues to thrive, the middle class in the country is also expected to grow, further driving innovation and expansion in the banking, services, and consumer sectors in the country. given the expectations, it will be interesting to see what will happen to the M&A market in this and the following quarters of 2012.
LATIN AMERICAN M&A HAD A SLow START AT THE BEgINNINg oF 2012 wITH 59 DEALS woRTH US$10.7BN TAkINg pLACE IN JANUARy AND FEBRUARy oF THIS yEAR. By CoMpARISoN, 95 DEALS vALUED AT US$23.6M wERE ANNoUNCED IN THE FIRST Two MoNTHS oF 2011. THE DIFFERENCE REpRESENTS A 37.9% DECREASE IN THE NUMBER oF DEALS AND A 54.7% DRop IN THE vALUE oF DEALS. IT IS DIFFICULT To SAy So EARLy INTo THE yEAR IF THE TREND wILL CoNTINUE INTo THE FoLLowINg MoNTHS. AT THE END oF 2011, SoME ANALySTS pREDICTED THAT LATIN AMERICA wILL SEE AN INCREASE IN M&A IN 2012, AND THERE IS STILL TIME FoR THE pREDICTIoNS To MATERIALISE.
07
LATIN AM
ERICA
Monthly M&A Insider
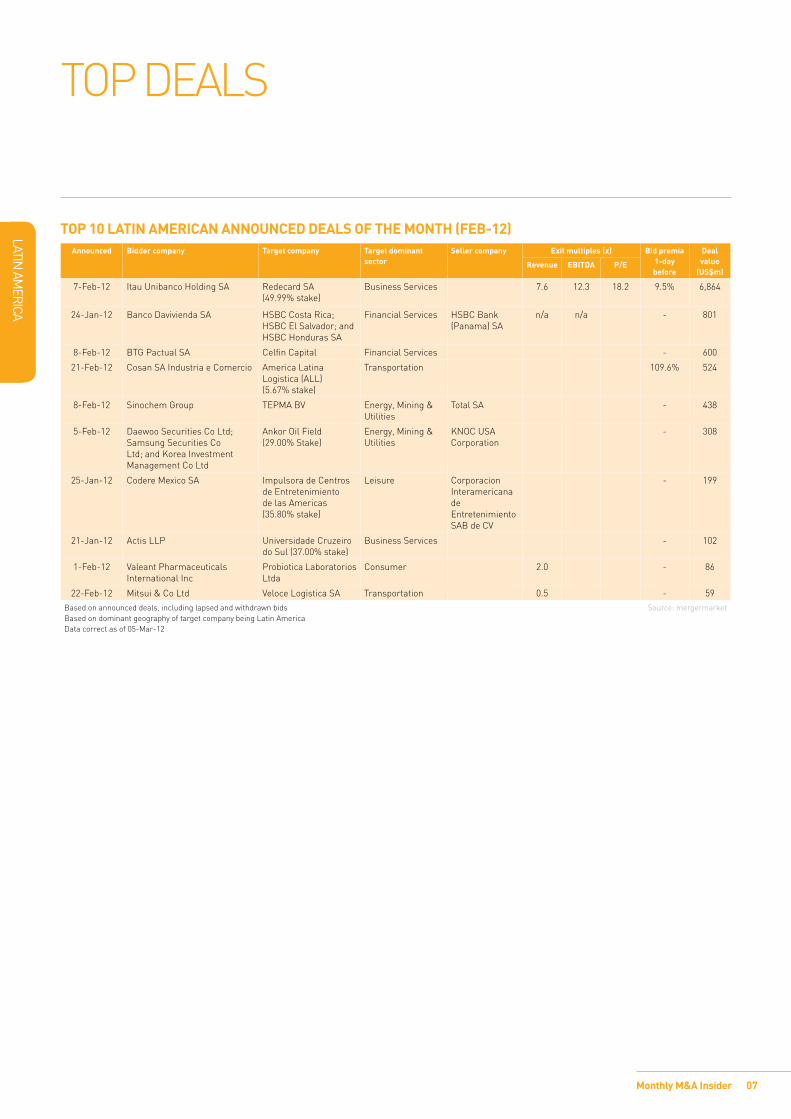
Top 10 LATIN AMERICAN ANNouNCEd dEALs of ThE MoNTh (fEb-12)Announced bidder company Target company Target dominant
sectorseller company Exit multiples (x) bid premia
1-day before
deal value
(us$m)Revenue EbITdA p/E
7-Feb-12 Itau Unibanco Holding SA Redecard SA (49.99% stake)
Business Services 7.6 12.3 18.2 9.5% 6,864
24-Jan-12 Banco Davivienda SA HSBC Costa Rica; HSBC El Salvador; and HSBC Honduras SA
Financial Services HSBC Bank (panama) SA
n/a n/a - 801
8-Feb-12 BTg pactual SA Celfin Capital Financial Services - 600
21-Feb-12 Cosan SA Industria e Comercio America Latina Logistica (ALL) (5.67% stake)
Transportation 109.6% 524
8-Feb-12 Sinochem group TEpMA Bv Energy, Mining & Utilities
Total SA - 438
5-Feb-12 Daewoo Securities Co Ltd; Samsung Securities Co Ltd; and korea Investment Management Co Ltd
Ankor oil Field (29.00% Stake)
Energy, Mining & Utilities
kNoC USA Corporation
- 308
25-Jan-12 Codere Mexico SA Impulsora de Centros de Entretenimiento de las Americas (35.80% stake)
Leisure Corporacion Interamericana de Entretenimiento SAB de Cv
- 199
21-Jan-12 Actis LLp Universidade Cruzeiro do Sul (37.00% stake)
Business Services - 102
1-Feb-12 valeant pharmaceuticals International Inc
probiotica Laboratorios Ltda
Consumer 2.0 - 86
22-Feb-12 Mitsui & Co Ltd veloce Logistica SA Transportation 0.5 - 59Based on announced deals, including lapsed and withdrawn bids Based on dominant geography of target company being Latin AmericaData correct as of 05-Mar-12
Source: mergermarket
Top DEALS
LATIN AM
ERICA
Monthly M&A Insider
TREND gRApHS
0
10
20
30
40
50
60
70
Q412*
Q411
Q311
Q211
Q111
Q410
Q310
Q210
Q110
Q409
Q309
Q209
Q109
Q408
Q308
Q208
Q108
Q407
Q307
Q207
Q107
Q406
Q306
Q206
Q106
Total value Mid-market value
Num
ber of dealsValu
e (U
S$bn
)
0
20
40
60
80
100
120
140
160
180
Total volume Mid-market volume
0
500
1,000
1,500
2,000
2,500
3,000
3,500
4,000
4,500
Q112*
Q411
Q311
Q211
Q111
Q410
Q310
Q210
Q110
Q409
Q309
Q209
Q109
Q408
Q308
Q208
Q108
Q407
Q307
Q207
Q107
Q406
Q306
Q206
Q106
Valu
e (U
S$m
)
Buyout value Exit value
Num
ber of deals
Buyout volume Exit volume
0
2
4
6
8
10
12
14
16
18
0
20
40
60
80
100
120
140
160
180
YTD 2012*201120102009200820072006
Total value Mid-market value
Num
ber of dealsValu
e (U
S$bn
)
0
100
200
300
400
500
600
700
Total volume Mid-market volume
0
1,000
2,000
3,000
4,000
5,000
6,000
7,000
8,000
YTD 2012*201120102009200820072006
Valu
e (U
S$m
)
Buyout value Exit value
Num
ber of deals
Buyout volume Exit volume
0
5
10
15
20
25
30
35
40
45
50
08
LATIN AMERICAN M&A quARTERLy TRENd
LATIN AMERICAN M&A ANNuAL TRENd LATIN AMERICAN M&A ANNuAL pRIvATE EquITy TRENd
LATIN AMERICAN M&A quARTERLy pRIvATE EquITy TRENd
LATIN AM
ERICA
Monthly M&A Insider
TREND gRApHS
LATIN AMERICAN M&A gEogRAphIC bREAkdowN yTd 2012
vALUE voLUME
74%
8%
4%
7%
6% 1%
Brazil
Chile
Colombia
Costa Rica
Mexico
Argentina
54.2%
20.3%
3.4%
1.7%
13.6%
3.4%3.4%
Brazil
Chile
Colombia
Costa Rica
Mexico
Peru
Argentina
LATIN AMERICAN M&A sECToR bREAkdowN yTd 2012
vALUE voLUME
65.4%14.0%
0.4%2.0%
5.4%
0.3%0.1% 3.4%
2.0%7.4%
Business Services
Financial Services
Technology
Leisure
Transportation
Construction
Pharma, Medical & Biotech
Consumer
Industrials & Chemicals
Energy, Mining & Utilities
10.2%
6.8%
5.1%
5.1%
5.1%
5.1%
3.4%
22.0%
20.3%
13.6%
1.7%
1.7%
Business Services
Financial Services
Technology
Leisure
Transportation
Construction
Real Estate
Pharma, Medical & Biotech
Agriculture
Consumer
Industrials & Chemicals
Energy, Mining & Utilities
09
10
LATIN AM
ERICA
Monthly M&A Insider
LATIN AMERICAN M&A dEAL sIzE bREAkdowN
vALUE voLUME
0
10
20
30
40
50
60
70
80
90
100
YTD 2012*201120102009200820072006
<US$250m or undisclosed value
US$251m-US$500m
US$501m-US$2,000m
US$2,001m-US$5,000m
>US$5,001m
46.9%
8.3%
21.8%
10.3%
12.7%
16.2%
10.8%
31.3%
16.2%
25.5%
30.5%
20.3%
24.5%
10.0%
14.7%
9.2%
29.3%
36.6%
10.1%
14.8%9.4%
6.9%
24.9%
19.2%
39.6%
28.6%
18.2%
28.1%
11.0%
14.2%
64.1%
18.0%
7.0%
10.9%
Per
cent
age
20
30
40
50
60
70
80
90
100
YTD 2012*201120102009200820072006
1.0%
5.4%
7.4%
85.1%
0.2%
5.3%
6.3%
87.5%
0.6%
4.7%
5.3%
88.2%
0.3%
6.9%
5.4%
85.7% 82.2%
6.3%
8.2%
1.2%1.0% 0.7% 1.2% 1.8% 2.0%
6.2%
6.1%
85.8%
0.8%
Per
cent
age
1.1%
3.4%
5.1%
89.8%
1.7%
<US$250m or undisclosed value
US$251m-US$500m
US$501m-US$2,000m
US$2,001m-US$5,000m
>US$5,001m
TREND gRApHS
NORTH
AMERICA
A mergermArket m&A report on
11Monthly M&A Insider
nortH AmerICA
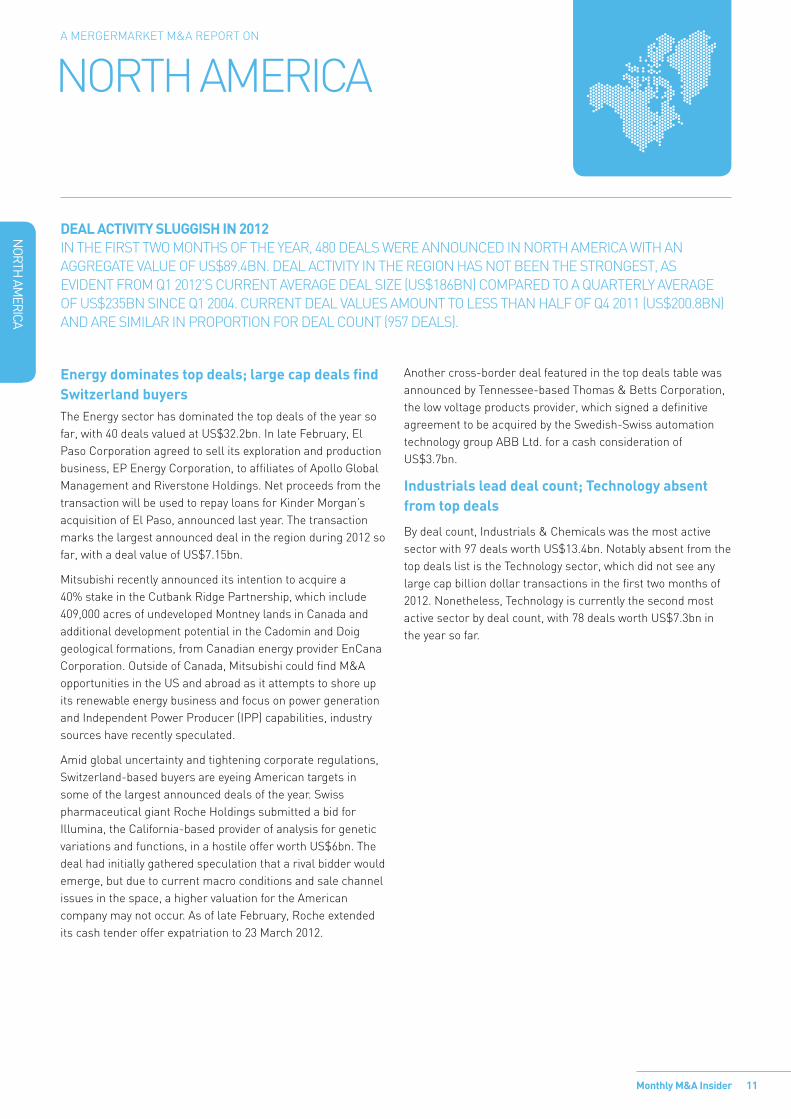
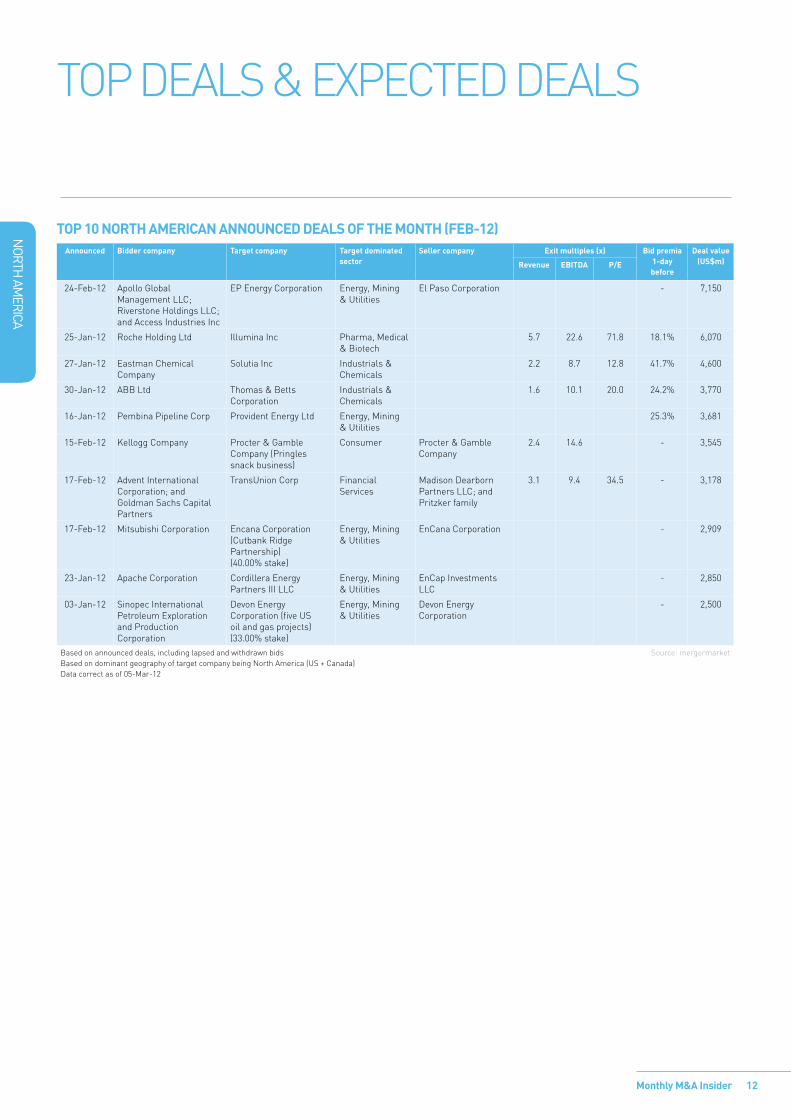
DeAl ActIvIty sluggIsh In 2012In tHe fIrst two montHs of tHe yeAr, 480 deAls were AnnounCed In nortH AmerICA wItH An AggregAte vAlue of us$89.4bn. deAl ACtIvIty In tHe regIon HAs not been tHe strongest, As evIdent from Q1 2012’s Current AverAge deAl sIze (us$186bn) CompAred to A QuArterly AverAge of us$235bn sInCe Q1 2004. Current deAl vAlues Amount to less tHAn HAlf of Q4 2011 (us$200.8bn) And Are sImIlAr In proportIon for deAl Count (957 deAls).
energy dominates top deals; large cap deals find switzerland buyersthe energy sector has dominated the top deals of the year so far, with 40 deals valued at us$32.2bn. In late february, el paso Corporation agreed to sell its exploration and production business, ep energy Corporation, to affiliates of Apollo global management and riverstone Holdings. net proceeds from the transaction will be used to repay loans for kinder morgan’s acquisition of el paso, announced last year. the transaction marks the largest announced deal in the region during 2012 so far, with a deal value of us$7.15bn.
mitsubishi recently announced its intention to acquire a 40% stake in the Cutbank ridge partnership, which include 409,000 acres of undeveloped montney lands in Canada and additional development potential in the Cadomin and doig geological formations, from Canadian energy provider enCana Corporation. outside of Canada, mitsubishi could find m&A opportunities in the us and abroad as it attempts to shore up its renewable energy business and focus on power generation and Independent power producer (Ipp) capabilities, industry sources have recently speculated.
Amid global uncertainty and tightening corporate regulations, switzerland-based buyers are eyeing American targets in some of the largest announced deals of the year. swiss pharmaceutical giant roche Holdings submitted a bid for Illumina, the California-based provider of analysis for genetic variations and functions, in a hostile offer worth us$6bn. the deal had initially gathered speculation that a rival bidder would emerge, but due to current macro conditions and sale channel issues in the space, a higher valuation for the American company may not occur. As of late february, roche extended its cash tender offer expatriation to 23 march 2012.
Another cross-border deal featured in the top deals table was announced by tennessee-based thomas & betts Corporation, the low voltage products provider, which signed a definitive agreement to be acquired by the swedish-swiss automation technology group Abb ltd. for a cash consideration of us$3.7bn.
Industrials lead deal count; technology absent from top deals
by deal count, Industrials & Chemicals was the most active sector with 97 deals worth us$13.4bn. notably absent from the top deals list is the technology sector, which did not see any large cap billion dollar transactions in the first two months of 2012. nonetheless, technology is currently the second most active sector by deal count, with 78 deals worth us$7.3bn in the year so far.
12
NORTH
AMERICA
Monthly M&A Insider
top deAls & expeCted deAls
top 10 north AMerIcAn AnnounceD DeAls of the Month (feb-12) Announced bidder company target company target dominated
sectorseller company exit multiples (x) bid premia
1-day before
Deal value(us$m)revenue ebItDA p/e
24-feb-12 Apollo global management llC; riverstone Holdings llC; and Access Industries Inc
ep energy Corporation energy, mining & utilities
el paso Corporation - 7,150
25-Jan-12 roche Holding ltd Illumina Inc pharma, medical & biotech
5.7 22.6 71.8 18.1% 6,070
27-Jan-12 eastman Chemical Company
solutia Inc Industrials & Chemicals
2.2 8.7 12.8 41.7% 4,600
30-Jan-12 Abb ltd thomas & betts Corporation
Industrials & Chemicals
1.6 10.1 20.0 24.2% 3,770
16-Jan-12 pembina pipeline Corp provident energy ltd energy, mining & utilities
25.3% 3,681
15-feb-12 kellogg Company procter & gamble Company (pringles snack business)
Consumer procter & gamble Company
2.4 14.6 - 3,545
17-feb-12 Advent International Corporation; and goldman sachs Capital partners
transunion Corp financial services
madison dearborn partners llC; and pritzker family
3.1 9.4 34.5 - 3,178
17-feb-12 mitsubishi Corporation encana Corporation (Cutbank ridge partnership) (40.00% stake)
energy, mining & utilities
enCana Corporation - 2,909
23-Jan-12 Apache Corporation Cordillera energy partners III llC
energy, mining & utilities
enCap Investments llC
- 2,850
03-Jan-12 sinopec International petroleum exploration and production Corporation
devon energy Corporation (five us oil and gas projects) (33.00% stake)
energy, mining & utilities
devon energy Corporation
- 2,500
based on announced deals, including lapsed and withdrawn bids based on dominant geography of target company being north America (us + Canada) data correct as of 05-mar-12
source: mergermarket
13
NORTH
AMERICA
Monthly M&A Insider
situation target company sector potential bidder company
financial advisor to bidder (b); target (t); seller (s)
seller company
Market cap/ est. value (us$m)
comments
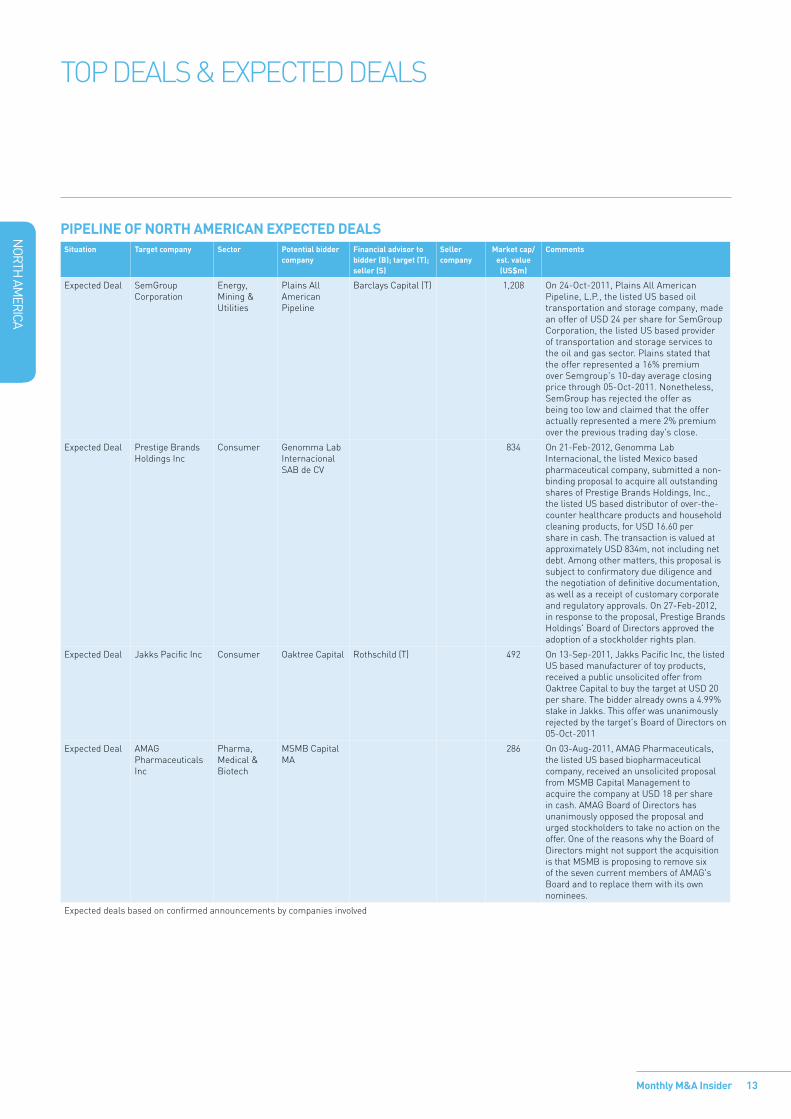
expected deal semgroup Corporation
energy, mining & utilities
plains All American pipeline
barclays Capital (t) 1,208 on 24-oct-2011, plains All American pipeline, l.p., the listed us based oil transportation and storage company, made an offer of usd 24 per share for semgroup Corporation, the listed us based provider of transportation and storage services to the oil and gas sector. plains stated that the offer represented a 16% premium over semgroup's 10-day average closing price through 05-oct-2011. nonetheless, semgroup has rejected the offer as being too low and claimed that the offer actually represented a mere 2% premium over the previous trading day's close.
expected deal prestige brands Holdings Inc
Consumer genomma lab Internacional sAb de Cv
834 on 21-feb-2012, genomma lab Internacional, the listed mexico based pharmaceutical company, submitted a non-binding proposal to acquire all outstanding shares of prestige brands Holdings, Inc., the listed us based distributor of over-the-counter healthcare products and household cleaning products, for usd 16.60 per share in cash. the transaction is valued at approximately usd 834m, not including net debt. Among other matters, this proposal is subject to confirmatory due diligence and the negotiation of definitive documentation, as well as a receipt of customary corporate and regulatory approvals. on 27-feb-2012, in response to the proposal, prestige brands Holdings' board of directors approved the adoption of a stockholder rights plan.
expected deal Jakks pacific Inc Consumer oaktree Capital rothschild (t) 492 on 13-sep-2011, Jakks pacific Inc, the listed us based manufacturer of toy products, received a public unsolicited offer from oaktree Capital to buy the target at usd 20 per share. the bidder already owns a 4.99% stake in Jakks. this offer was unanimously rejected by the target's board of directors on 05-oct-2011
expected deal AmAg pharmaceuticals Inc
pharma, medical & biotech
msmb Capital mA
286 on 03-Aug-2011, AmAg pharmaceuticals, the listed us based biopharmaceutical company, received an unsolicited proposal from msmb Capital management to acquire the company at usd 18 per share in cash. AmAg board of directors has unanimously opposed the proposal and urged stockholders to take no action on the offer. one of the reasons why the board of directors might not support the acquisition is that msmb is proposing to remove six of the seven current members of AmAg's board and to replace them with its own nominees.
expected deals based on confirmed announcements by companies involved
pIpelIne of north AMerIcAn expecteD DeAls
top deAls & expeCted deAls
14
NORTH
AMERICA
Monthly M&A Insider
trend grApHs
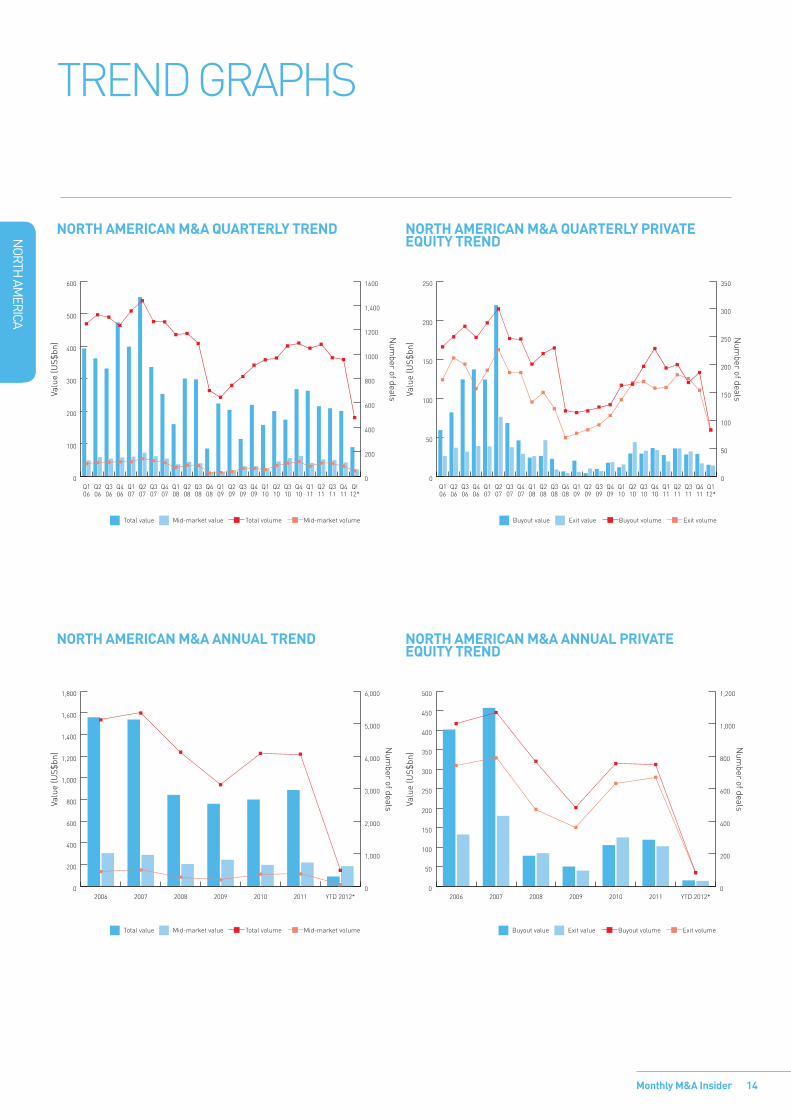
north AMerIcAn M&A quArterly trenD
0
100
200
300
400
500
600
Q!12*
Q411
Q311
Q211
Q111
Q410
Q310
Q210
Q110
Q409
Q309
Q209
Q109
Q408
Q308
Q208
Q108
Q407
Q307
Q207
Q107
Q406
Q306
Q206
Q106
Valu
e (U
S$bn
)
Total value Mid-market value
Num
ber of deals
0
200
400
600
800
1000
1200
1,400
1600
Total volume Mid-market volume
0
50
100
150
200
250
Q112*
Q411
Q311
Q211
Q111
Q410
Q310
Q210
Q110
Q409
Q309
Q209
Q109
Q408
Q308
Q208
Q108
Q407
Q307
Q207
Q107
Q406
Q306
Q206
Q106
Valu
e (U
S$bn
)
Buyout value Exit value
Num
ber of deals
Buyout volume Exit volume
0
50
100
150
200
250
300
350
north AMerIcAn M&A AnnuAl trenD north AMerIcAn M&A AnnuAl prIvAte equIty trenD
0
200
400
600
800
1,000
1,200
1,400
1,600
1,800
YTD 2012*201120102009200820072006
Total value Mid-market value
Num
ber of dealsValu
e (U
S$bn
)
0
1,000
2,000
3,000
4,000
5,000
6,000
Total volume Mid-market volume
0
50
100
150
200
250
300
350
400
450
500
YTD 2012*201120102009200820072006
Valu
e (U
S$bn
)
Buyout value Exit value
Num
ber of deals
Buyout volume Exit volume
0
200
400
600
800
1,000
1,200
north AMerIcAn M&A quArterly prIvAte equIty trenD
15
NORTH
AMERICA
Monthly M&A Insider
trend grApHs
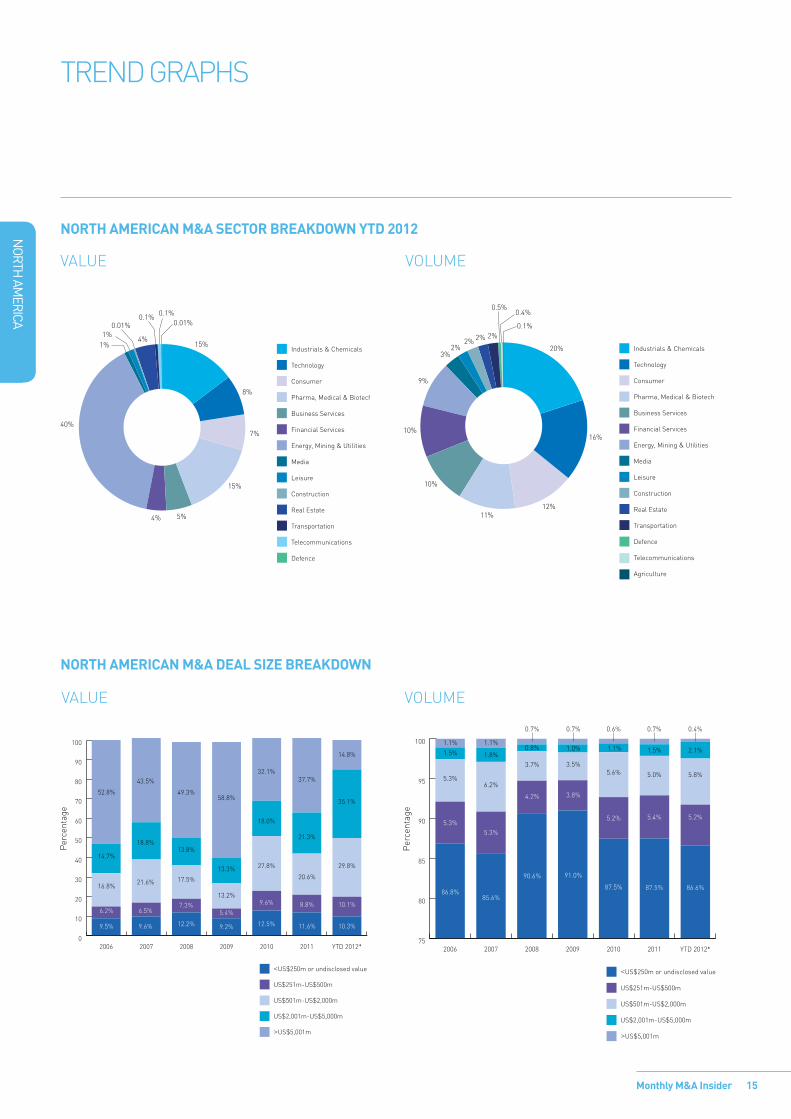
north AMerIcAn M&A sector BreAkDown ytD 2012
vAlue volume
15%
8%
7%
15%
5%4%
40%
1%1%
0.01%0.1% 0.1%
4%
0.01%
Industrials & Chemicals
Technology
Consumer
Pharma, Medical & Biotech
Business Services
Financial Services
Energy, Mining & Utilities
Media
Leisure
Construction
Real Estate
Transportation
Telecommunications
Defence
20%
16%
12%11%
10%
10%
3%2%
2% 2% 2%
9%
0.5%
0.1%
0.4%
Industrials & Chemicals
Technology
Consumer
Pharma, Medical & Biotech
Business Services
Financial Services
Energy, Mining & Utilities
Media
Leisure
Construction
Real Estate
Transportation
Defence
Telecommunications
Agriculture
north AMerIcAn M&A DeAl sIze BreAkDown
vAlue volume
0
10
20
30
40
50
60
70
80
90
100
YTD 2012*201120102009200820072006
<US$250m or undisclosed value
US$251m-US$500m
US$501m-US$2,000m
US$2,001m-US$5,000m
>US$5,001m
52.8%
14.7%
16.8%
6.2%
9.5%
43.5%
18.8%
21.6%
6.5%
9.6%
49.3%
13.8%
17.5%
7.3%
12.2%
58.8%
13.3%
13.2%
5.4%
9.2% 12.5%
9.6%
27.8%
18.0%
32.1%37.7%
21.3%
20.6%
8.8%
11.6%
14.8%
35.1%
29.8%
10.1%
10.3%
Per
cent
age
75
80
85
90
95
100
YTD 2012*201120102009200820072006
1.1%
1.5%
5.3%
5.3%
86.8%
1.1%
1.8%
6.2%
5.3%
85.6%
0.8%
3.7%
4.2%
90.6%
1.0%
3.5%
3.8%
91.0%
87.5%
5.2%
5.6%
1.1% 1.5%
5.0%
5.4%
87.5%
0.7% 0.7% 0.7%
2.1%
5.8%
5.2%
86.6%
0.4%0.6%
<US$250m or undisclosed value
US$251m-US$500m
US$501m-US$2,000m
US$2,001m-US$5,000m
>US$5,001m
Per
cent
age
ASIA-PAcIfIc
A mergermArket m&A report on
Monthly M&A Insider 16
ASIA-pAcIfIc
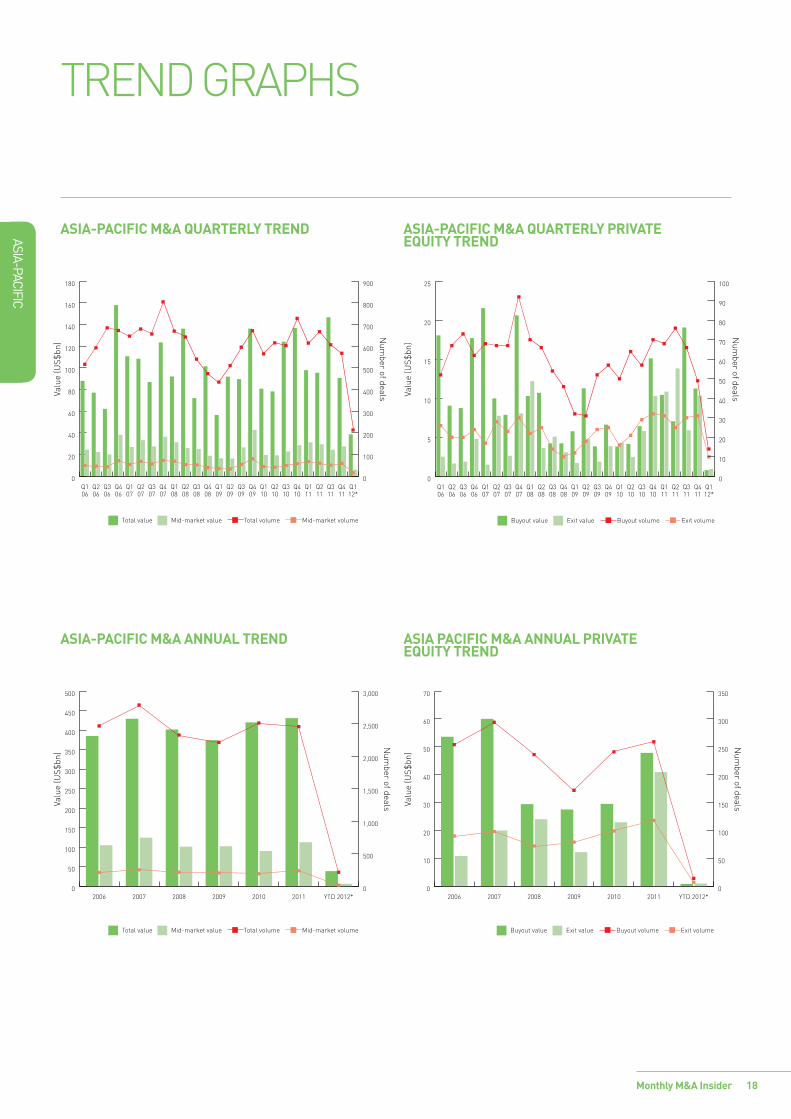
even so, deal numbers in Asia-pacific for the first two months took a massive hit. A total of US$38.5bn in deals were announced, compared to US$97.8bn worth of deals in Q1 2011. cash is clearly sitting on the sidelines waiting for signs of a sustainable recovery both in the US and europe.
energy, mining & Utilities bore witness to the biggest total deal value, with a combined US$15.33bn worth of deals in the first two months of 2012. And it was in India, which suffered an m&A drought last year, where Sesa goa’s US$10.29bn blockbuster bid for Sterlite Industries (India) made up nearly two thirds of the sector total. Industrials & chemicals was second, with a combined total of US$7.2bn in deals. this was followed by the consumer sector, which notched up US$3.43bn worth of deals.
meanwhile, Industrials & chemicals topped the deal count, notching up 42 deals in the first two months of 2012. coming in joint-second were Business Services and energy, mining & Utilities, which both posted 25 deals apiece.
private equity stamped its mark on the top 10 announced deals, with tpg’s US$1.46bn bid for Australia’s Billabong. However, this was short lived as the deal later lapsed as Billabong rejected tpg’s improved offer. eurozone woes have overseen a vertiginous drop in confidence. And the “wait-and-see” approach seems to be borne out by the numbers. Buyouts in the region in the first two months of 2012 only totalled US$0.8bn, compared to US$10.4bn in Q1 2011. exits followed a similar path, with US$0.9bn in exits so far this year, compared to US$10.8bn in Q1 2011.
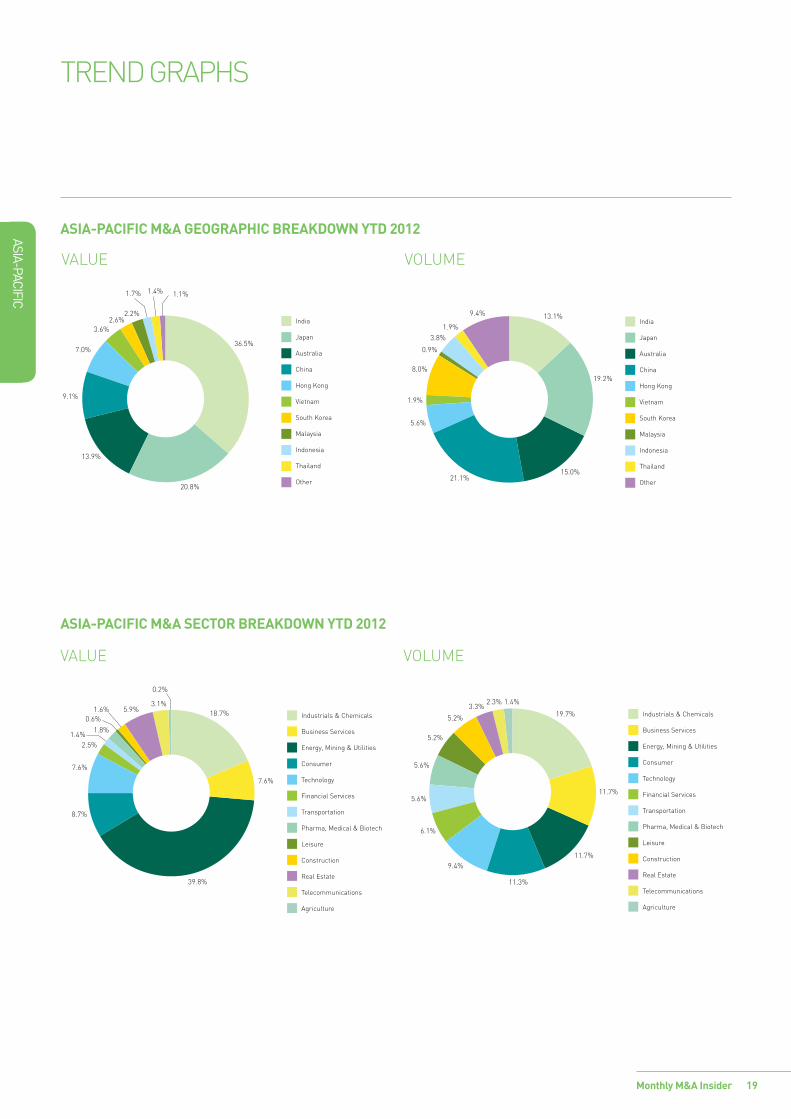
Looking ahead, there will be continued interest in Southeast Asian investment in sectors such as technology, consumer, and energy, mining & Utilities. Indonesia, boasting a population of nearly 250m and generating two-thirds of its gDp from consumer spending, will be a focal point for growth going forward. there have already been significant deals; a US$146m bid for a 36.06% stake in trikomsel, an Indonesian retailer of mobile phones, from Legacy Investment and golden Soleil, two mobile phone retailers based in the Seychelles and British Virgin Islands, respectively, is just one example.
cash-rich Japanese and chinese companies, as well as the behemoth korean chaebols such as Samsung and Lotte group, will ensure there is continued cross-border interest within Asia.
tHe yeAr 2012 StArteD oUt wItH poSItIVe newS comIng oUt of tHe US regArDIng gDp growtH. ALreADy cHeereD At A HeALtHy 2.8%, Q4 2011 wAS recentLy reVISeD Up to 3% on tHe BAck of Stronger conSUmer nUmBerS.
17Monthly M&A Insider
ASIA-PAcIfIc
top DeALS
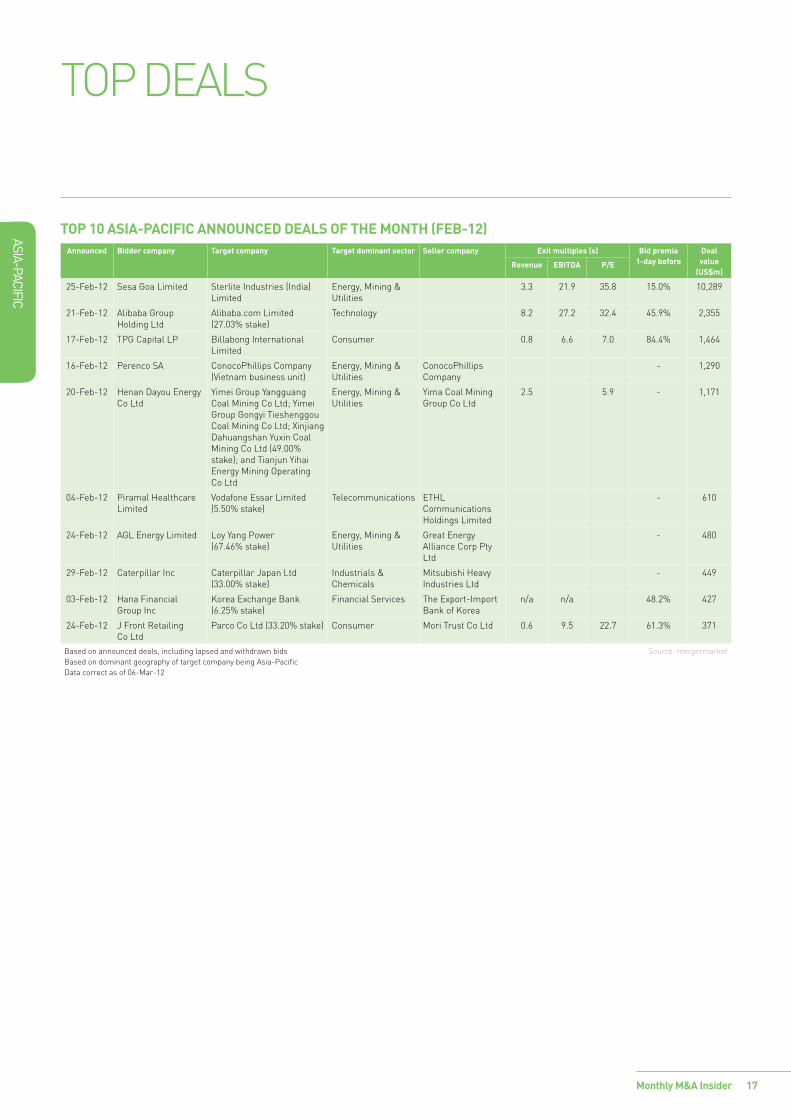
Top 10 AsIA-pAcIfIc Announced deAls of The MonTh (feb-12)Announced bidder company Target company Target dominant sector seller company exit multiples (x) bid premia
1-day beforedeal value
(us$m)Revenue ebITdA p/e
25-feb-12 Sesa goa Limited Sterlite Industries (India) Limited
energy, mining & Utilities
3.3 21.9 35.8 15.0% 10,289
21-feb-12 Alibaba group Holding Ltd
Alibaba.com Limited (27.03% stake)
technology 8.2 27.2 32.4 45.9% 2,355
17-feb-12 tpg capital Lp Billabong International Limited
consumer 0.8 6.6 7.0 84.4% 1,464
16-feb-12 perenco SA conocophillips company (Vietnam business unit)
energy, mining & Utilities
conocophillips company
- 1,290
20-feb-12 Henan Dayou energy co Ltd
yimei group yangguang coal mining co Ltd; yimei group gongyi tieshenggou coal mining co Ltd; Xinjiang Dahuangshan yuxin coal mining co Ltd (49.00% stake); and tianjun yihai energy mining operating co Ltd
energy, mining & Utilities
yima coal mining group co Ltd
2.5 5.9 - 1,171
04-feb-12 piramal Healthcare Limited
Vodafone essar Limited (5.50% stake)
telecommunications etHL communications Holdings Limited
- 610
24-feb-12 AgL energy Limited Loy yang power (67.46% stake)
energy, mining & Utilities
great energy Alliance corp pty Ltd
- 480
29-feb-12 caterpillar Inc caterpillar Japan Ltd (33.00% stake)
Industrials & chemicals
mitsubishi Heavy Industries Ltd
- 449
03-feb-12 Hana financial group Inc
korea exchange Bank (6.25% stake)
financial Services the export-Import Bank of korea
n/a n/a 48.2% 427
24-feb-12 J front retailing co Ltd
parco co Ltd (33.20% stake) consumer mori trust co Ltd 0.6 9.5 22.7 61.3% 371
Based on announced deals, including lapsed and withdrawn bids Based on dominant geography of target company being Asia-pacific Data correct as of 06-mar-12
Source: mergermarket
18
ASIA-PAcIfIc
Monthly M&A Insider
trenD grApHS
AsIA-pAcIfIc M&A quARTeRly TRend
0
20
40
60
80
100
120
140
160
180
Q112*
Q411
Q311
Q211
Q111
Q410
Q310
Q210
Q110
Q409
Q309
Q209
Q109
Q408
Q308
Q208
Q108
Q407
Q307
Q207
Q107
Q406
Q306
Q206
Q106
Valu
e (U
S$bn
)
Total value Mid-market value
Num
ber of deals
0
100
200
300
400
500
600
700
800
900
Total volume Mid-market volume
0
5
10
15
20
25
Q112*
Q411
Q311
Q211
Q111
Q410
Q310
Q210
Q110
Q409
Q309
Q209
Q109
Q408
Q308
Q208
Q108
Q407
Q307
Q207
Q107
Q406
Q306
Q206
Q106
Valu
e (U
S$bn
)
Buyout value Exit value
Num
ber of deals
Buyout volume Exit volume
0
10
20
30
40
50
60
70
80
90
100
AsIA-pAcIfIc M&A AnnuAl TRend AsIA pAcIfIc M&A AnnuAl pRIvATe equITy TRend
0
50
100
150
200
250
300
350
400
450
500
YTD 2012*201120102009200820072006
Total value Mid-market value
Num
ber of dealsValu
e (U
S$bn
)
0
500
1,000
1,500
2,000
2,500
3,000
Total volume Mid-market volume
0
10
20
30
40
50
60
70
YTD 2012*201120102009200820072006
Valu
e (U
S$bn
)
Buyout value Exit value
Num
ber of deals
Buyout volume Exit volume
0
50
100
150
200
250
300
350
AsIA-pAcIfIc M&A quARTeRly pRIvATe equITy TRend
19
ASIA-PAcIfIc
Monthly M&A Insider
trenD grApHS
AsIA-pAcIfIc M&A GeoGRAphIc bReAKdoWn yTd 2012
VALUe VoLUme
India
Japan
Australia
China
Hong Kong
Vietnam
South Korea
Malaysia
Indonesia
Thailand
Other
36.5%
20.8%
13.9%
7.0%
3.6%2.6%
2.2%
1.1%1.4%1.7%
9.1%
13.1%
15.0%
5.6%
21.1%
1.9%
8.0%
0.9%
3.8%1.9%
9.4%
19.2%
India
Japan
Australia
China
Hong Kong
Vietnam
South Korea
Malaysia
Indonesia
Thailand
Other
AsIA-pAcIfIc M&A secToR bReAKdoWn yTd 2012
VALUe VoLUme
39.8%
8.7%
7.6%
0.6%1.6% 5.9%
3.1%
0.2%
18.7%
7.6%
1.4%2.5%
1.8%
Industrials & Chemicals
Business Services
Energy, Mining & Utilities
Consumer
Technology
Financial Services
Transportation
Pharma, Medical & Biotech
Leisure
Construction
Real Estate
Telecommunications
Agriculture
19.7%
11.7%
11.7%
11.3%
9.4%
6.1%
5.6%
5.6%
5.2%
5.2%
3.3%2.3% 1.4%
Industrials & Chemicals
Business Services
Energy, Mining & Utilities
Consumer
Technology
Financial Services
Transportation
Pharma, Medical & Biotech
Leisure
Construction
Real Estate
Telecommunications
Agriculture
20
ASIA-PAcIfIc
Monthly M&A Insider
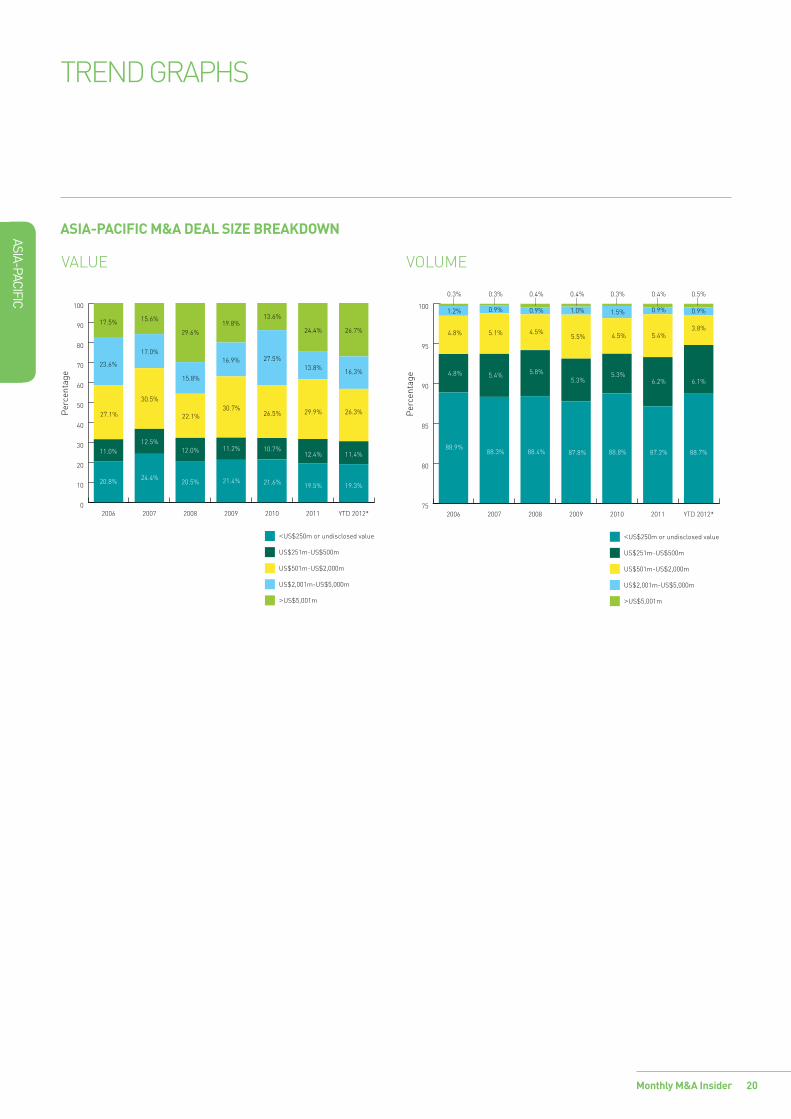
AsIA-pAcIfIc M&A deAl sIze bReAKdoWn
VALUe VoLUme
0
10
20
30
40
50
60
70
80
90
100
YTD 2012*201120102009200820072006
<US$250m or undisclosed value
US$251m-US$500m
US$501m-US$2,000m
US$2,001m-US$5,000m
>US$5,001m
17.5%
23.6%
27.1%
11.0%
20.8%
15.6%
17.0%
30.5%
12.5%
24.4%
29.6%
15.8%
22.1%
12.0%
20.5%
19.8%
16.9%
30.7%
11.2%
21.4% 21.6%
10.7%
26.5%
27.5%
13.6%
24.4%
13.8%
29.9%
12.4%
19.5%
26.7%
16.3%
26.3%
11.4%
19.3%
Per
cent
age
75
80
85
90
95
100
YTD 2012*201120102009200820072006
1.2%
4.8%
4.8%
88.9%
0.9%
5.1%
5.4%
88.3%
0.9%
4.5%
5.8%
88.4%
1.0%
5.5%
5.3%
87.8% 88.8%
5.3%
4.5%
1.5% 0.9%
5.4%
6.2%
87.2%
0.3% 0.3% 0.3% 0.4%
0.9%
3.8%
6.1%
88.7%
0.5%0.4% 0.4%
<US$250m or undisclosed value
US$251m-US$500m
US$501m-US$2,000m
US$2,001m-US$5,000m
>US$5,001m
Per
cent
age
trenD grApHS
21Monthly M&A Insider
europe
A mergermArket m&A report on
eUrope
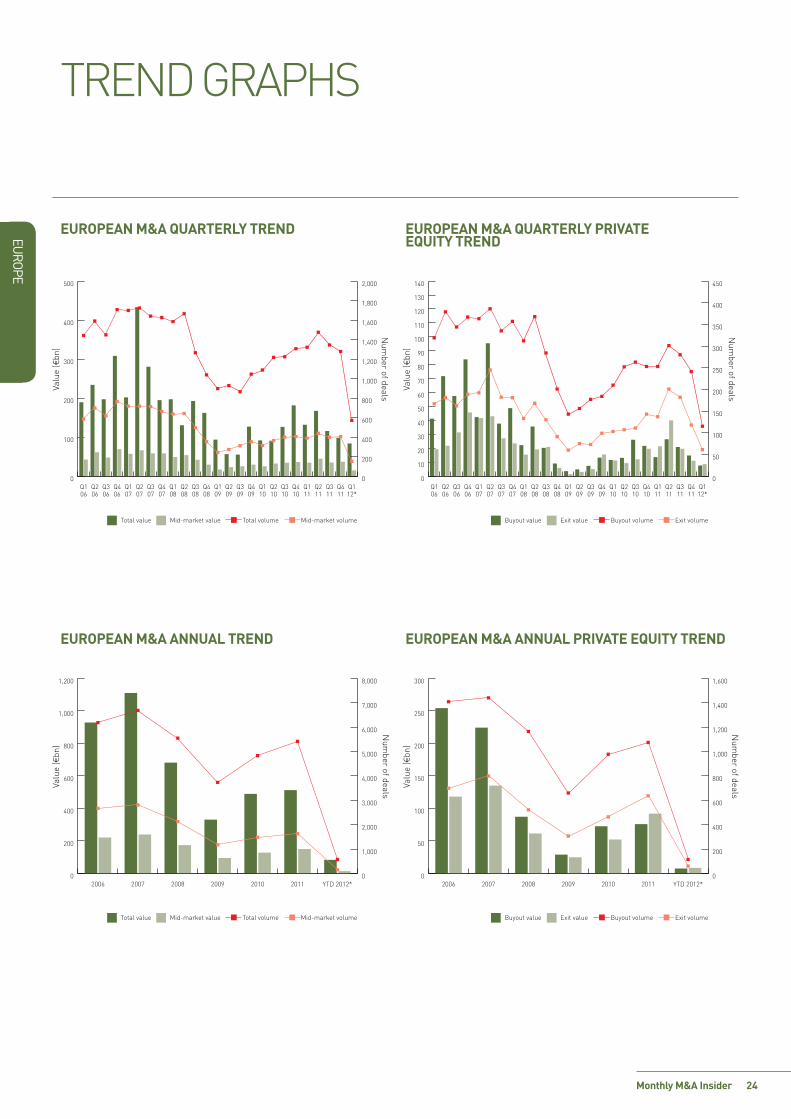
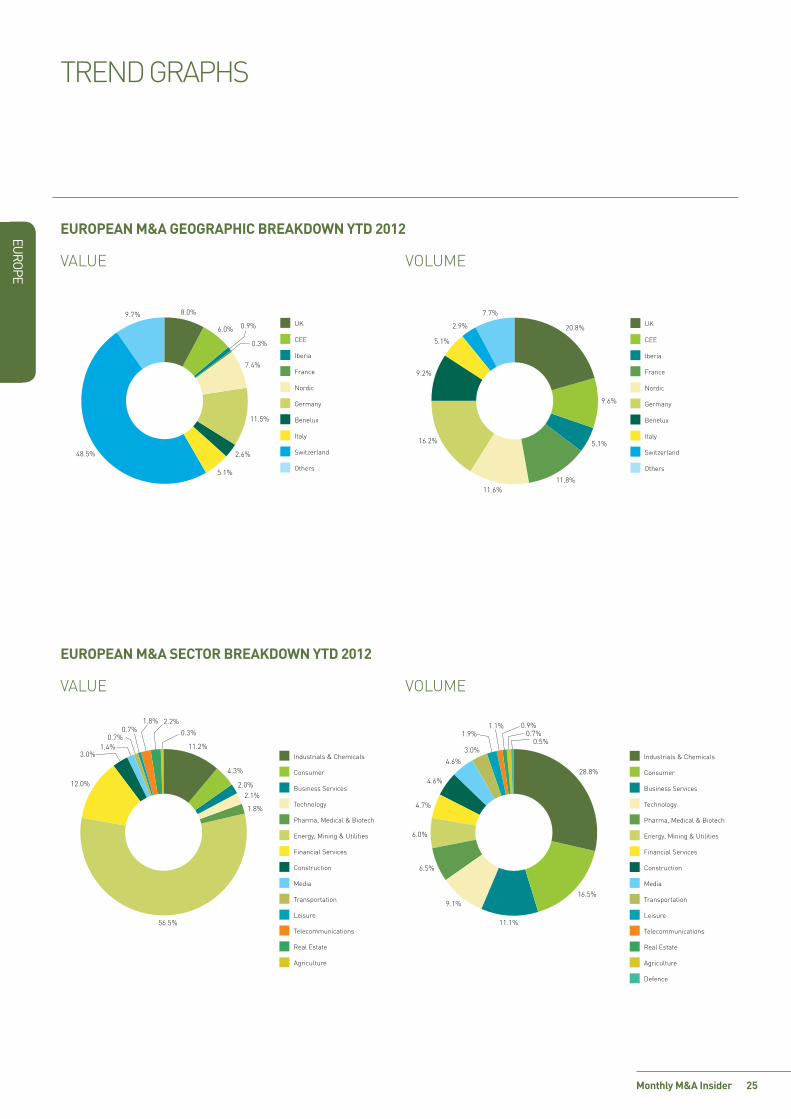
Stable Scandinavia 2011 was a successful year for the nordics and accounted for €50.1bn worth of transaction, according to mergermarket data. this is supported by 2011’s 182 deals in Q1 producing a 98% increase since 2009’s low of 92 deals. It wouldn’t be surprising, however, to see 2012’s Q1 looking very similar to 2009 when also considering the on-going debt crisis in the eurozone and the global economic uncertainty. For deal value, the biggest increase in a Q1 during the last six years has been between Q1 2010 and Q1 2011 at 97% from €5.906bn to €11.635bn. Standards are high for 2012 and Q1 is unlikely to catch up with 2011 meaning a halt in the gradual rise in activity since 2009.
Sector Industrials & Chemicals is the consolidated sector that has dominated the nordics since 2007. From 2009 though, this has been the chief sector for both deal value and volume, even when activity hasn’t been very high. Q1 2012 will see the same trend continue but the 20 deals so far valuing at €2.556bn result in a 47% decrease in deals and a 68% drop in deal value compared to last years’ Q1 showing 38 deals valuing at €7.035bn.
Country breakdown
Sweden and norway have eight active sectors already, making them the most lively in Scandinavia. Sweden’s second largest sector at 16.7% is Construction and also provides the largest deal value at a total market share of 51.9%. Sweden was the busiest for the whole of 2011 within the nordic area with 266 transactions totalling €21bn. potential takeovers of Swedish target companies are likely to include Ahlsell, the construction products and machinery distributor being acquired by CVC. Bravida, the integrated supplier of technical installation and service solutions for buildings and plants, is also up for sale by owner private equity firm triton, which has hired Deutsche Bank and Handelsbanken as financial advisors to find bidders. Another targeted company is Actic, the Swedish fitness chain, which is planning to be sold by owner FSn Capital.
Finland’s six active sectors and Denmark’s four active sectors prove that they deal mostly in the areas that are known to provide a positive return in their niche markets. these markets are Industrials & Chemicals for both while pharma, medial and Biotech coming second in Finland and energy, mining & Utilities coming second in Denmark. the difficulty for Danish m&A in 2012 will be the proposed increase in tax law which will discourage generational takeovers.
Despite a slow start to 2012, conditions remain relatively conducive to m&A transactions in the nordic region. the lending environment looks largely positive across the nordics region. this works well with both factors of the overhang of maturities of private equity portfolios and the healthy amount of companies with strong balance sheets and expansive ambitions.
A FOCUS ON THE NORDIC REGION tHe norDIC regIon getS 2012 oFF to A Slow StArt wItH A totAl oF 66 DeAlS VAlUIng €6.176Bn In tHe FIrSt two montHS. mArCH’S ACtIVIty IS UnlIkely to eQUAlISe tHe 116 DeAlS DIFFerenCe CompAreD to 2011’S FUll Q1 At 182 DeAlS AnD A DeAl VAlUe oF €11.635Bn. neVertHeleSS, m&A DeAlmAkerS In SCAnDInAVIA (SweDen, DenmArk, FInlAnD, norwAy AnD ICelAnD) “remAIn mIlDly optImIStIC” ACCorDIng to mergermArket IntellIgenCe.
22
europe
Monthly M&A Insider
top DeAlS & expeCteD DeAlS
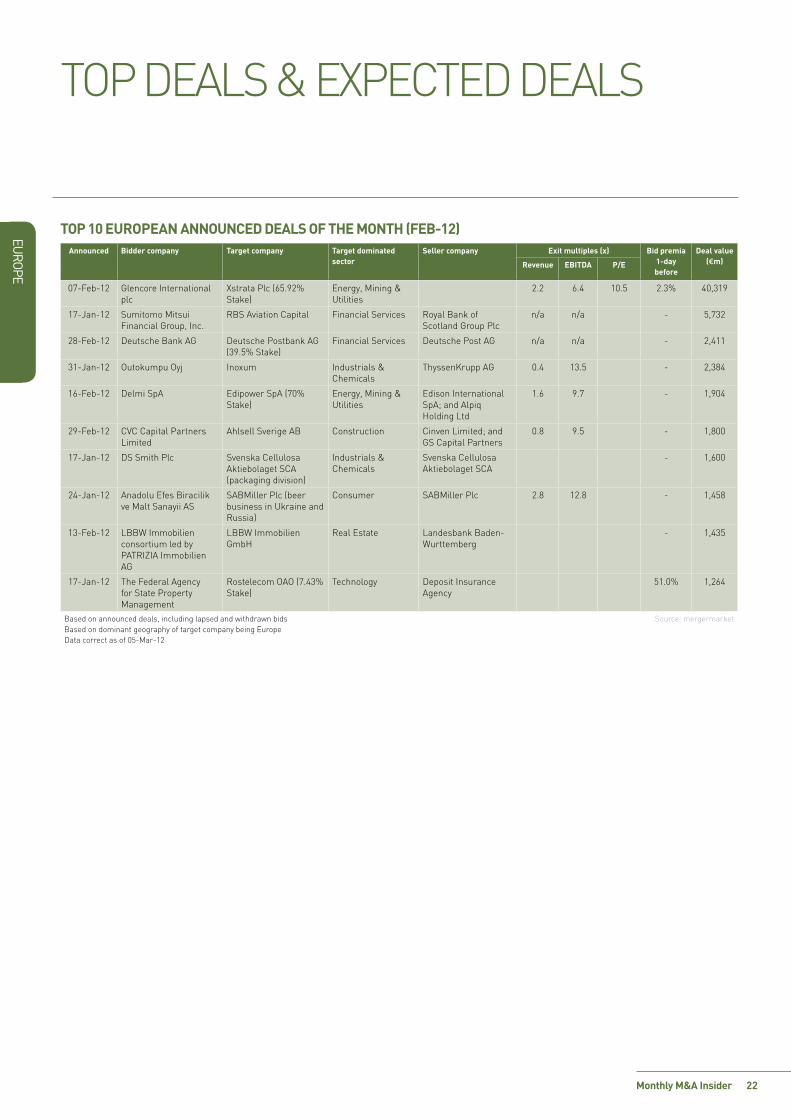
top 10 europeAN ANNouNCed deAlS of the MoNth (feb-12) Announced bidder company target company target dominated
sectorSeller company exit multiples (x) bid premia
1-day before
deal value(€m)revenue ebItdA p/e
07-Feb-12 glencore International plc
xstrata plc (65.92% Stake)
energy, mining & Utilities
2.2 6.4 10.5 2.3% 40,319
17-Jan-12 Sumitomo mitsui Financial group, Inc.
rBS Aviation Capital Financial Services royal Bank of Scotland group plc
n/a n/a - 5,732
28-Feb-12 Deutsche Bank Ag Deutsche postbank Ag (39.5% Stake)
Financial Services Deutsche post Ag n/a n/a - 2,411
31-Jan-12 outokumpu oyj Inoxum Industrials & Chemicals
thyssenkrupp Ag 0.4 13.5 - 2,384
16-Feb-12 Delmi SpA edipower SpA (70% Stake)
energy, mining & Utilities
edison International SpA; and Alpiq Holding ltd
1.6 9.7 - 1,904
29-Feb-12 CVC Capital partners limited
Ahlsell Sverige AB Construction Cinven limited; and gS Capital partners
0.8 9.5 - 1,800
17-Jan-12 DS Smith plc Svenska Cellulosa Aktiebolaget SCA (packaging division)
Industrials & Chemicals
Svenska Cellulosa Aktiebolaget SCA
- 1,600
24-Jan-12 Anadolu efes Biracilik ve malt Sanayii AS
SABmiller plc (beer business in Ukraine and russia)
Consumer SABmiller plc 2.8 12.8 - 1,458
13-Feb-12 lBBw Immobilien consortium led by pAtrIZIA Immobilien Ag
lBBw Immobilien gmbH
real estate landesbank Baden-wurttemberg
- 1,435
17-Jan-12 the Federal Agency for State property management
rostelecom oAo (7.43% Stake)
technology Deposit Insurance Agency
51.0% 1,264
Based on announced deals, including lapsed and withdrawn bids Based on dominant geography of target company being europe Data correct as of 05-mar-12
Source: mergermarket
23
EUROPE
Monthly M&A Insider
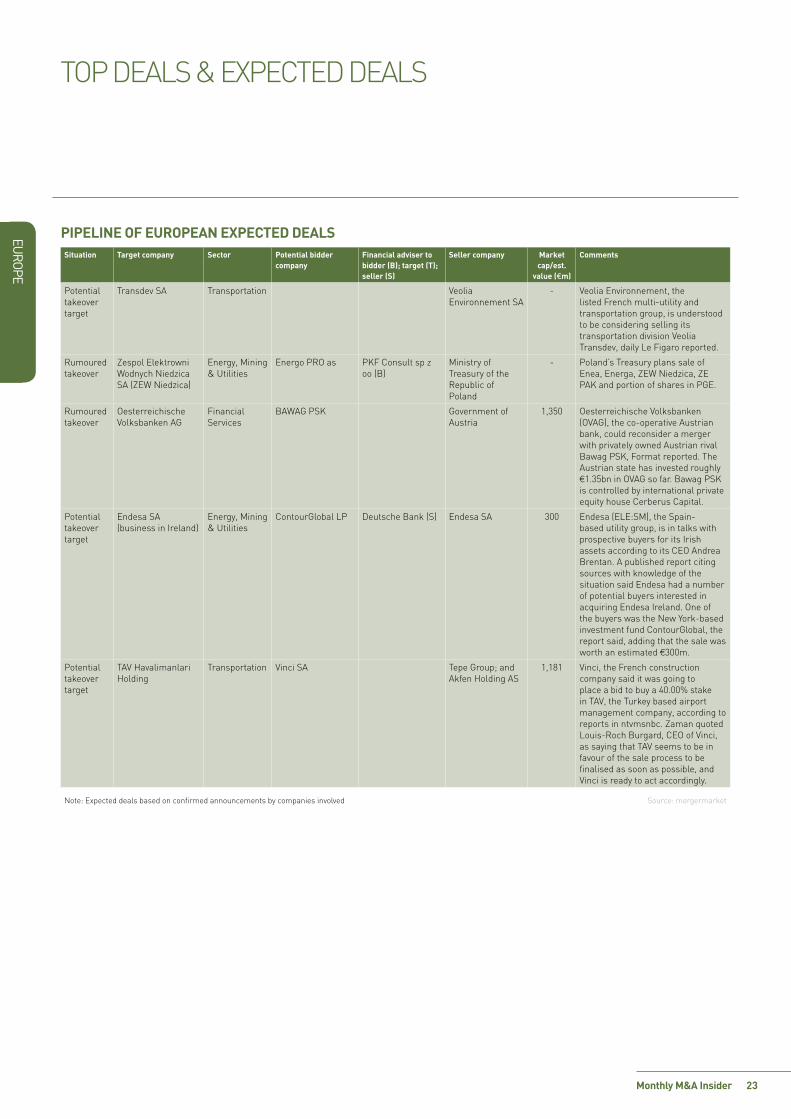
PIPelIne of euroPeAn exPected deAlssituation target company sector Potential bidder
companyfinancial adviser to bidder (B); target (t); seller (s)
seller company Market cap/est.
value (€m)
comments
Potential takeover target
Transdev SA Transportation Veolia Environnement SA
- Veolia Environnement, the listed French multi-utility and transportation group, is understood to be considering selling its transportation division Veolia Transdev, daily Le Figaro reported.
Rumoured takeover
Zespol Elektrowni Wodnych Niedzica SA (ZEW Niedzica)
Energy, Mining & Utilities
Energo PRO as PKF Consult sp z oo (B)
Ministry of Treasury of the Republic of Poland
- Poland’s Treasury plans sale of Enea, Energa, ZEW Niedzica, ZE PAK and portion of shares in PGE.
Rumoured takeover
Oesterreichische Volksbanken AG
Financial Services
BAWAG PSK Government of Austria
1,350 Oesterreichische Volksbanken (OVAG), the co-operative Austrian bank, could reconsider a merger with privately owned Austrian rival Bawag PSK, Format reported. The Austrian state has invested roughly €1.35bn in OVAG so far. Bawag PSK is controlled by international private equity house Cerberus Capital.
Potential takeover target
Endesa SA (business in Ireland)
Energy, Mining & Utilities
ContourGlobal LP Deutsche Bank (S) Endesa SA 300 Endesa (ELE:SM), the Spain-based utility group, is in talks with prospective buyers for its Irish assets according to its CEO Andrea Brentan. A published report citing sources with knowledge of the situation said Endesa had a number of potential buyers interested in acquiring Endesa Ireland. One of the buyers was the New York-based investment fund ContourGlobal, the report said, adding that the sale was worth an estimated €300m.
Potential takeover target
TAV Havalimanlari Holding
Transportation Vinci SA Tepe Group; and Akfen Holding AS
1,181 Vinci, the French construction company said it was going to place a bid to buy a 40.00% stake in TAV, the Turkey based airport management company, according to reports in ntvmsnbc. Zaman quoted Louis-Roch Burgard, CEO of Vinci, as saying that TAV seems to be in favour of the sale process to be finalised as soon as possible, and Vinci is ready to act accordingly.
Note: Expected deals based on confirmed announcements by companies involved Source: mergermarket
TOP DEALS & ExPECTED DEALS
europe
Monthly M&A Insider 24
trenD grApHS
europeAN M&A quArterly treNd
0
100
200
300
400
500
Q112*
Q411
Q311
Q211
Q111
Q410
Q310
Q210
Q110
Q409
Q309
Q209
Q109
Q408
Q308
Q208
Q108
Q407
Q307
Q207
Q107
Q406
Q306
Q206
Q106
Valu
e (€
bn)
Total value Mid-market value
Num
ber of deals
0
200
400
600
800
1,000
1,200
1,400
1,600
1,800
2,000
Total volume Mid-market volume
0
10
20
30
40
50
60
70
80
90
100
110
120
130
140
Q112*
Q411
Q311
Q211
Q111
Q410
Q310
Q210
Q110
Q409
Q309
Q209
Q109
Q408
Q308
Q208
Q108
Q407
Q307
Q207
Q107
Q406
Q306
Q206
Q106
Buyout value Exit value Buyout volume Exit volume
Valu
e (€
bn)
Num
ber of deals
0
50
100
150
200
250
300
350
400
450
europeAN M&A ANNuAl treNd europeAN M&A ANNuAl prIvAte equIty treNd
0
200
400
600
800
1,000
1,200
YTD 2012*201120102009200820072006
Total value Mid-market value
Num
ber of deals
Valu
e (€
bn)
0
1,000
2,000
3,000
4,000
5,000
6,000
7,000
8,000
Total volume Mid-market volume
0
50
100
150
200
250
300
YTD 2012*201120102009200820072006
Valu
e (€
bn)
Buyout value Exit value
Num
ber of deals
Buyout volume Exit volume
0
200
400
600
800
1,000
1,200
1,400
1,600
europeAN M&A quArterly prIvAte equIty treNd
europe
Monthly M&A Insider 25
trenD grApHS
europeAN M&A GeoGrAphIC breAkdowN ytd 2012
VAlUe VolUme
UK
CEE
Iberia
France
Nordic
Germany
Benelux
Italy
Switzerland
Others
2.6%
11.5%
48.5%
5.1%
8.0%
6.0%
0.3%
9.7%
0.9%
7.4%
16.2%
9.2%
2.9%
7.7%
5.1%
20.8%
9.6%
11.8%
5.1%
11.6%
UK
CEE
Iberia
France
Nordic
Germany
Benelux
Italy
Switzerland
Others
europeAN M&A SeCtor breAkdowN ytd 2012
VAlUe VolUme
11.2%
4.3%
56.5%
3.0%
12.0%
0.7%0.7%
1.8% 2.2%
1.4%
2.0%
1.8%
2.1%
Industrials & Chemicals
Consumer
Business Services
Technology
Pharma, Medical & Biotech
Energy, Mining & Utilities
Financial Services
Construction
Media
Transportation
Leisure
Telecommunications
Real Estate
Agriculture
0.3%
4.6%28.8%
1.9%
6.0%
3.0%
4.7%
4.6%
1.1% 0.9%0.7%
0.5%
16.5%
11.1%
9.1%
6.5%
Industrials & Chemicals
Consumer
Business Services
Technology
Pharma, Medical & Biotech
Energy, Mining & Utilities
Financial Services
Construction
Media
Transportation
Leisure
Telecommunications
Real Estate
Agriculture
Defence
europe
Monthly M&A Insider 26
trenD grApHS
europeAN M&A deAl SIze breAkdowN
VAlUe VolUme
0
10
20
30
40
50
60
70
80
90
100
YTD 2012*201120102009200820072006
<€250m or undisclosed value
€251m-€500m
€501m-€2,000m
€2,001m-€5,000m
>€5,001m
17.6%
23.5%
8.4%
15.9%
34.6%
16.4%
22.3%
8.4%
13.7%
39.2%
14.8%
20.4%
9.1%
17.0%
38.7%
20.0%
24.2%
9.2%
20.2% 17.2%
9.2%
30.2%
21.2%
26.4% 22.1%17.4%
21.9%
30.9%
11.2%
18.7%
56.2%
5.6%
20.7%
8.3%
9.3%
Per
cent
age
88
90
92
94
96
98
100
YTD 2012*201120102009200820072006
3.8%
0.9%
3.5%
91.4%
4.0%
0.9%
3.9%
90.8%
2.7%
0.6%
3.2%
93.1%
2.1%
0.6%
2.3%
94.8%
93.1%
2.7%
3.3%
0.7% 0.7%
3.1%
3.0%
93.0%
0.4%0.4% 0.4% 0.4%0.2% 0.2% 0.2%
0.4%
3.2%
3.5%
92.6%
<€250m or undisclosed value
€251m-€500m
€501m-€2,000m
€2,001m-€5,000m
>€5,001m
Per
cent
age
27
Mid
dle east &
africa
THE MIDDLE EAST & AFRICA
A MERgERMARkET M&A REpoRT on
Monthly M&A Insider
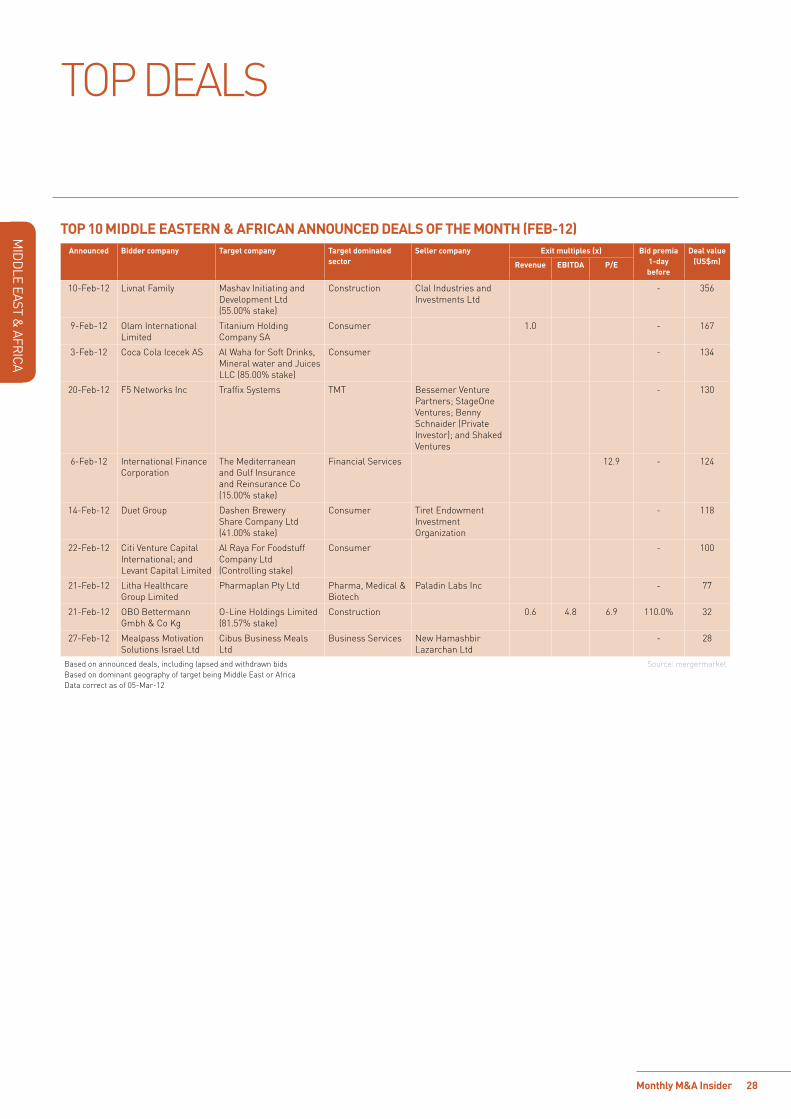
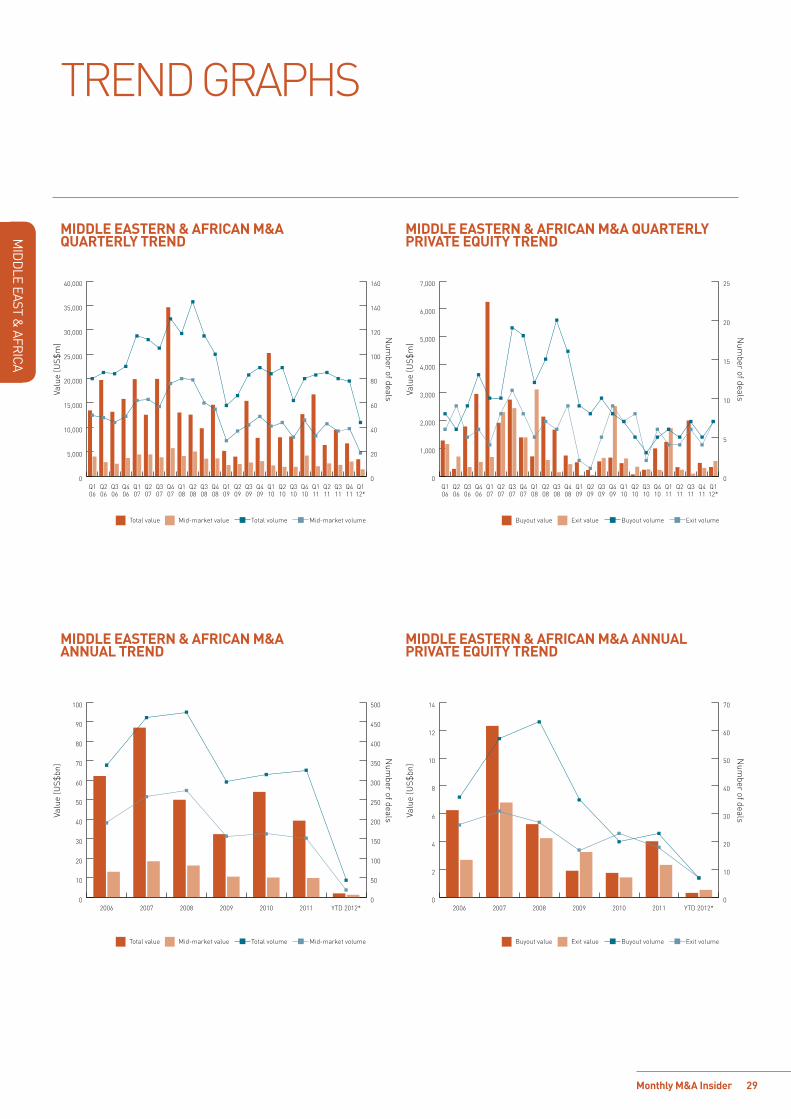
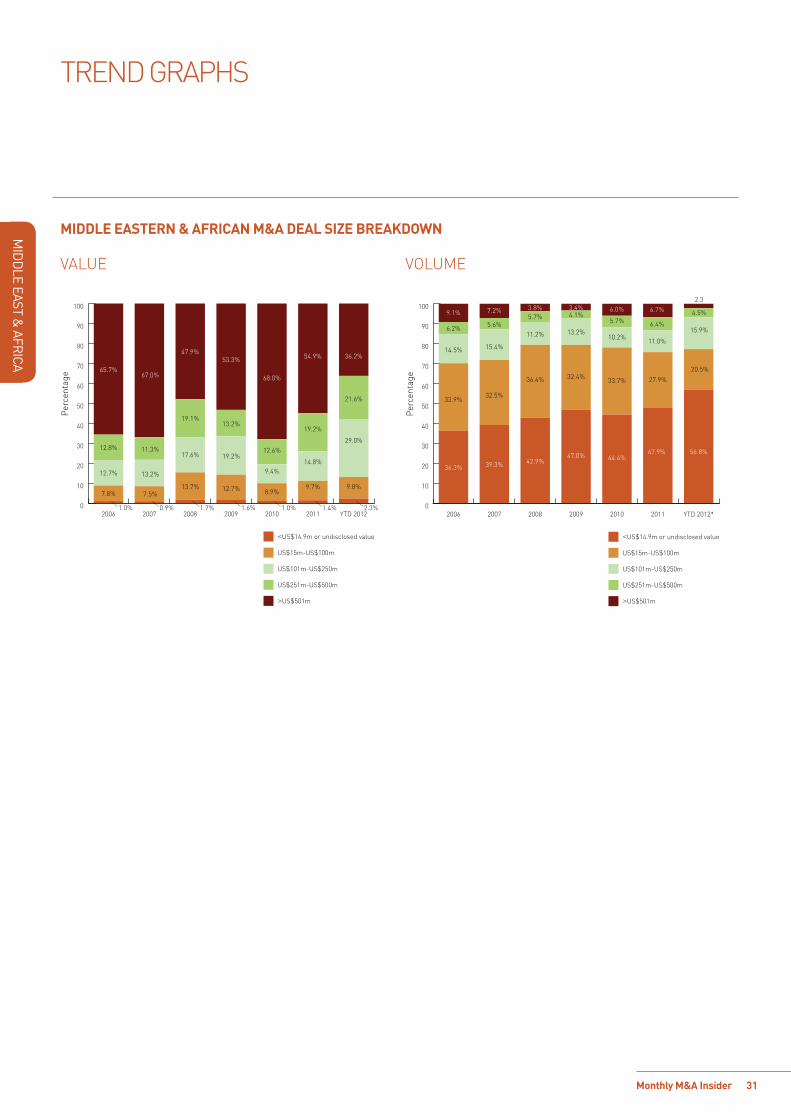
After a slight recovery in the last period of 2011, with a total number of deals amounting to US$4bn for the month of December only, the M&A activity in the ME&A region has seen a slowdown in the first two months of 2012, with a total value of US$3.5bn, representing a 72.2% decrease in value and 15% decrease in number of deals compared to the same period last year.
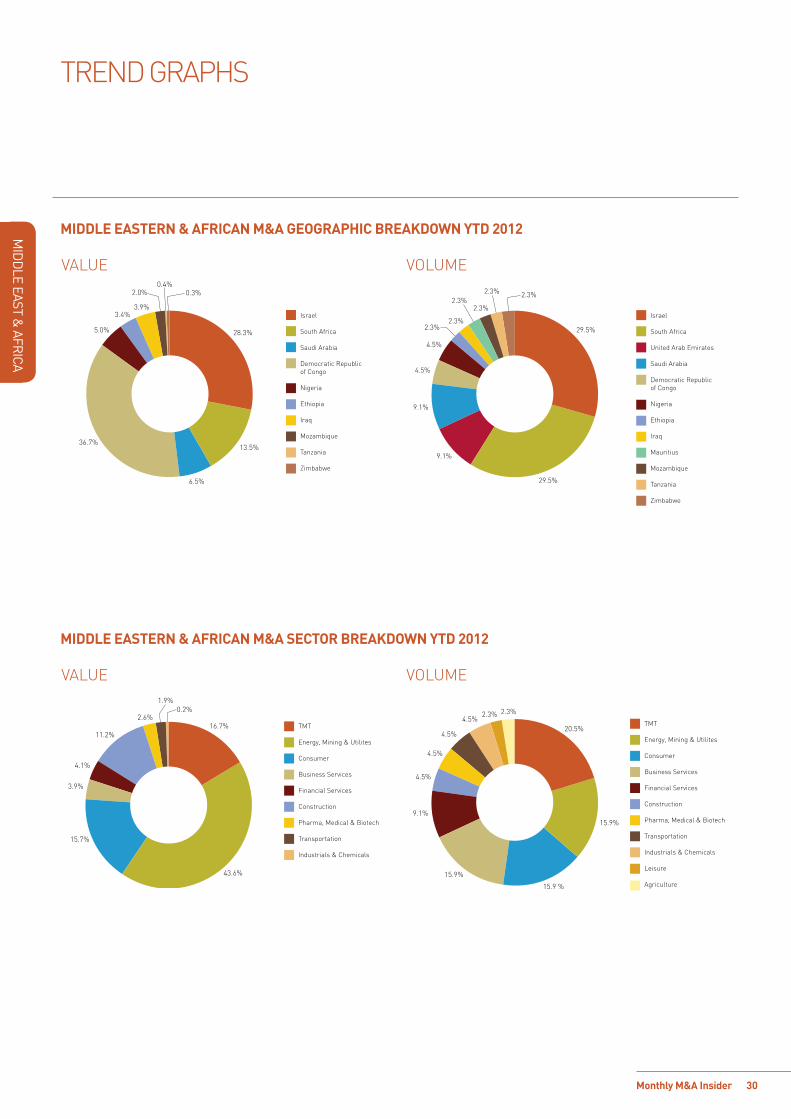
The M&A activity in January and February was mainly driven by a series of large deals in the Energy, Mining & Utilities sector which accounted for the largest percentage of deal value in the region, with 43.6% of the market share. The top ME&A mining deals announced include the acquisition of the Democratic Republic of Congo-based kolwezi Tailings project, Frontier and Lonshi mines and related exploration interests of First Quantum Minerals, the Canada-based mining company engaged in mineral exploration, development and mining, by Eurasian natural Resources Corporation plc, the Uk-based diversified natural resources group with integrated mining, processing, energy and transport operations, and the Evander gold Mines Ltd acquisition by pan African Resources plc along with Witwatersrand Consolidated gold Resources Limited, which amounted to US$1.3bn and US$221m respectively. However, TMT was the most active sector by number of deals, with 9 transactions (representing 20.5% of the market share) announced in January and February, worth US$577m.
Orascom – France Telecom saga over?After a long period of dispute and rejection, France Telecom (FT) and orascom Telecom have finally reached an agreement on the acquisition of the Egyptian mobile operator Mobinil. The French operator has been keen to take control over Mobinil since at least 2010, when it made a bid to purchase the remaining stake it doesn’t own in Mobinil. That deal was then cancelled by the Egyptian Court, who ruled in favour of orascom. Almost two years later, France Telecom made a non-binding offer valuing Mobinil share at Egp202.5, and intends to launch a tender offer at the same offer price for the remainder of the 29% stake in the company traded on the Egyptian stock exchange. Shareholders of orascom Telecom voted in favour of the sale of most of their stake in the jointly owned Mobinil, in a deal worth about US$2bn. orascom Telecom will remain as France Telecom strategic local partner in Egypt, and will keep a 5% stake in Mobinil and a 30% voting rights along with board representation.
The question remains on whether the deal will go through this time. According to Marc Rennard, Vice president of France Telecom for Africa, the Middle East and Asia, the deal should not face any obstacles because of the offer price of Egp202.5 per share, which was valued by FT at Egp245 per share back in 2010 ( a discount of 17%). The sale, which is subject to final documentation and to the approval of the companies’ respective boards of directors and of regulatory authorities, is expected to be completed in two months.
France Telecom owns about 71% of Mobinil Telecom Co., which controls Mobinil, and orascom Telecom owns the rest. orascom Telecom also holds a 20% direct stake in Mobinil, while about 29% is traded on the Egyptian Exchange.
ME&A M&A ACTIVITYWITH A poLITICAL EnVIRonMEnT THAT ConTInUES To bE DEFInED by UnCERTAInTy In THE MIDDLE EAST & AFRICA (ME&A), THE M&A ACTIVITy In THE REgIon SHoWS no SIgn oF RECoVERy. ACTIVITy In THE REgIon IS QUITE TARgETED, WITH 59% oF THE VoLUME oF DEALS TAkIng pLACE In SoUTH AFRICA AnD ISRAEL.
28
Mid
dle east &
africa
Monthly M&A Insider
Top DEALS
TOp 10 MIddlE EAsTErn & AFrICAn AnnOunCEd dEAls OF ThE MOnTh (FEb-12) Announced bidder company Target company Target dominated
sectorseller company Exit multiples (x) bid premia
1-day before
deal value(us$m)revenue EbITdA p/E
10-Feb-12 Livnat Family Mashav Initiating and Development Ltd (55.00% stake)
Construction Clal Industries and Investments Ltd
- 356
9-Feb-12 olam International Limited
Titanium Holding Company SA
Consumer 1.0 - 167
3-Feb-12 Coca Cola Icecek AS Al Waha for Soft Drinks, Mineral water and Juices LLC (85.00% stake)
Consumer - 134
20-Feb-12 F5 networks Inc Traffix Systems TMT bessemer Venture partners; Stageone Ventures; benny Schnaider (private Investor); and Shaked Ventures
- 130
6-Feb-12 International Finance Corporation
The Mediterranean and gulf Insurance and Reinsurance Co (15.00% stake)
Financial Services 12.9 - 124
14-Feb-12 Duet group Dashen brewery Share Company Ltd (41.00% stake)
Consumer Tiret Endowment Investment organization
- 118
22-Feb-12 Citi Venture Capital International; and Levant Capital Limited
Al Raya For Foodstuff Company Ltd (Controlling stake)
Consumer - 100
21-Feb-12 Litha Healthcare group Limited
pharmaplan pty Ltd pharma, Medical & biotech
paladin Labs Inc - 77
21-Feb-12 obo bettermann gmbh & Co kg
o-Line Holdings Limited (81.57% stake)
Construction 0.6 4.8 6.9 110.0% 32
27-Feb-12 Mealpass Motivation Solutions Israel Ltd
Cibus business Meals Ltd
business Services new Hamashbir Lazarchan Ltd
- 28
based on announced deals, including lapsed and withdrawn bids based on dominant geography of target being Middle East or Africa Data correct as of 05-Mar-12
Source: mergermarket
29
Mid
dle east &
africa
Monthly M&A Insider
TREnD gRApHS
MIddlE EAsTErn & AFrICAn M&A quArTErlY TrEnd
0
5,000
10,000
15,000
20,000
25,000
30,000
35,000
40,000
Q112*
Q411
Q311
Q211
Q111
Q410
Q310
Q210
Q110
Q409
Q309
Q209
Q109
Q408
Q308
Q208
Q108
Q407
Q307
Q207
Q107
Q406
Q306
Q206
Q106
Valu
e (U
S$m
)
Total value Mid-market value
Num
ber of deals
0
20
40
60
80
100
120
140
160
Total volume Mid-market volume
0
1,000
2,000
3,000
4,000
5,000
6,000
7,000
Q112*
Q411
Q311
Q211
Q111
Q410
Q310
Q210
Q110
Q409
Q309
Q209
Q109
Q408
Q308
Q208
Q108
Q407
Q307
Q207
Q107
Q406
Q306
Q206
Q106
Buyout value Exit value Buyout volume Exit volume
Num
ber of dealsValu
e (U
S$m
)
0
5
10
15
20
25
MIddlE EAsTErn & AFrICAn M&A AnnuAl TrEnd
MIddlE EAsTErn & AFrICAn M&A AnnuAl prIVATE EquITY TrEnd
0
10
20
30
40
50
60
70
80
90
100
YTD 2012*201120102009200820072006
Total value Mid-market value
Valu
e (U
S$bn
)
Num
ber of deals
0
50
100
150
200
250
300
350
400
450
500
Total volume Mid-market volume
0
2
4
6
8
10
12
14
YTD 2012*201120102009200820072006
Buyout value Exit value Buyout volume Exit volume
Valu
e (U
S$bn
)
0
10
20
30
40
50
60
70
Num
ber of deals
MIddlE EAsTErn & AFrICAn M&A quArTErlY prIVATE EquITY TrEnd
30
Mid
dle east &
africa
Monthly M&A Insider
TREnD gRApHS
MIddlE EAsTErn & AFrICAn M&A GEOGrAphIC brEAKdOWn YTd 2012
MIddlE EAsTErn & AFrICAn M&A sECTOr brEAKdOWn YTd 2012
VALUE
VALUE
VoLUME
VoLUME
4.1%
11.2%
2.6%
1.9%0.2%
16.7%
43.6%
3.9%
15.7%
TMT
Energy, Mining & Utilites
Consumer
Business Services
Financial Services
Construction
Pharma, Medical & Biotech
Transportation
Industrials & Chemicals
29.5%
9.1%
29.5%
9.1%
4.5%
4.5%
2.3%2.3%
2.3%2.3%
2.3% 2.3%
Israel
South Africa
United Arab Emirates
Saudi Arabia
Democratic Republicof Congo
Nigeria
Ethiopia
Iraq
Mauritius
Mozambique
Tanzania
Zimbabwe
20.5%
15.9%
15.9 %
15.9%
9.1%
4.5%
4.5%
4.5%
4.5%2.3% 2.3%
TMT
Energy, Mining & Utilites
Consumer
Business Services
Financial Services
Construction
Pharma, Medical & Biotech
Transportation
Industrials & Chemicals
Leisure
Agriculture
28.3%
13.5%
6.5%
3.9%
2.0%0.4%
0.3%
3.4%
36.7%
5.0%
Israel
South Africa
Saudi Arabia
Democratic Republicof Congo
Nigeria
Ethiopia
Iraq
Mozambique
Tanzania
Zimbabwe
31
Mid
dle east &
africa
Monthly M&A Insider
TREnD gRApHS
MIddlE EAsTErn & AFrICAn M&A dEAl sIZE brEAKdOWn
VALUE VoLUME
0
10
20
30
40
50
60
70
80
90
100
YTD 2012201120102009200820072006
12.7%
12.8%
65.7%
13.2%
11.3%
67.0%
17.6%
19.1%
47.9%
19.2%
13.2%
53.3%
68.0%
12.6%
9.4%
19.2%
7.8% 7.5%13.7% 12.7% 8.9%
14.8%
9.7%
54.9%
21.6%
29.0%
9.8%
36.2%
1.0% 0.9% 1.7% 1.6% 1.0% 1.4% 2.3%
<US$14.9m or undisclosed value
US$15m-US$100m
US$101m-US$250m
US$251m-US$500m
>US$501m
Per
cent
age
0
10
20
30
40
50
60
70
80
90
100
YTD 2012*201120102009200820072006
33.9%
14.5%
6.2%
9.1%
32.5%
15.4%
5.6%
7.2%
36.4%
11.2%
5.7%3.8%
32.4%
13.2%
4.1%3.4% 6.0%
5.7%
33.7%
10.2%11.0%
6.4%
36.3% 39.3% 42.9%47.0% 44.4%
47.9%
27.9%
6.7%
15.9%
4.5%
56.8%
20.5%
2.3
<US$14.9m or undisclosed value
US$15m-US$100m
US$101m-US$250m
US$251m-US$500m
>US$501m
Per
cent
age
Monthly M&A Insider 32
ABO
UT M
ERR
ILL COR
POR
ATION
About Merrill CorporAtion
Merrill Transaction and Compliance Services through a broad range of tools and services, Merrill Corporation streamlines document composition, filing, printing, distribution and electronic access to the transaction and regulatory compliance activities of its clients engaged in securities offerings, reorganisations, mergers and acquisitions, SeC and other regulatory filings. As a registered, third-party service provider offering public companies expert eDGArization and Xbrl filing services, Merrill professionals can compose, edit, electronically file, manage and distribute data in printed or electronic format.
Merrill Legal Solutions provide both on-demand and on-site litigation support, information management and electronic and print document management services for law firms, corporate legal departments and professional services firms.
examples of our expertise include the creation of searchable litigation document repositories, management of electronic data discovery and the delivery of real-time court reporting and deposition videography services.
Merrill’s Marketing and Communication Solutions supply brand identity management, customer communication and packaged direct marketing programmes for sales professionals in industries such as real estate, mutual funds and insurance. examples of our services include customisable corporate identity materials, direct-mail marketing pieces and promotional programs supported by web-based technologies.
Merrill’s Translations Services provide a range of translation options to help clients achieve the most efficient and cost effective approach to their translation projects. Merrill brink offers extensive legal translation services for international litigation, intellectual property, patents, contractual matters, antitrust matters, mergers and acquisitions, arbitration and more.
www.datasite.com
About Merrill DataSiteRevolutionising the due diligence process
Merrill DataSite is designed for rapid deployment and can be up and running within two hours of a client’s need. our team can scan, upload and organise thousands of pages of content from any source in 24 hours or less. every aspect of the process, from document scanning to VDr hosting and project management is delivered by Merrill’s multilingual team, available around the clock worldwide.
With Merrill DataSite, all documents are captured and indexed to an online database and because all rights are designated by the client, security and control are guaranteed. each user’s ability to view, print or access source documents is set up by the client administrator and can be changed at any time. Merrill DataSite provides useful tools, including full search, viewer audit capability, Q&A, bulk uploads and detailed user activity tracking that help clients maintain tighter control and have greater insight into reviewer behaviour.
Merrill DataSite enhances transaction success
Merrill DataSite is the industry’s acknowledged leader. More than 61,000 different private and public companies across the globe have leveraged Merrill DataSite to increase the value of the following types of transactions:
• Mergers, acquisitions and divestitures
• private placement transactions
• leveraged buyout transactions
• bankruptcy and reorganisation transactions
• Financial restructuring transactions
• initial public offerings and dual-track processes
• Asset purchases and liquidations
• post-merger integration
FounDeD in 1968 AnD heADQuArtereD in St. pAul, MinneSotA, Merrill CorporAtion iS A leADinG proViDer oF outSourCeD SolutionS For CoMpleX buSineSS CoMMuniCAtion AnD inForMAtion MAnAGeMent. Merrill’S SerViCeS inCluDe DoCuMent AnD DAtA MAnAGeMent, litiGAtion Support, lAnGuAGe trAnSlAtion SerViCeS, FulFillMent, iMAGinG AnD printinG. Merrill SerVeS the CorporAte, leGAl, FinAnCiAl SerViCeS, inSurAnCe AnD reAl eStAte MArketS. With More thAn 5,000 people in oVer 40 DoMeStiC AnD 22 internAtionAl loCAtionS, Merrill eMpoWerS the CoMMuniCAtionS oF the WorlD’S leADinG orGAniSAtionS.
33Monthly M&A Insider
About Merrill DAtASite
Merrill DataSite – built with the client in mindMerrill DataSite was created to meet its clients’ needs and built to their specifications. Since 2002 we have consistently leveraged the experiences of our clients to add leading-edge functionality to the available toolset. Merrill DataSite allows its users and administrators to:
Examine documents immediately. Patented technology ensures you never have to wait for a document to be downloaded. because the data resides on Merrill’s servers, you can simultaneously view an unlimited number of documents in multiple windows without having to close out or save to your “temp” file. When faced with hundreds of documents to review, this feature saves significant time and expense.
Designate user permissions. team administrators can control which users will be able to view, print or download specific documents, folders or projects – simply and quickly.
Search every word in every document. With large document collections, sophisticated search features are key to finding critical information and accelerating the due diligence process. Merrill DataSite performs optical Character recognition (oCr) on each and every letter in each and every document. our search capabilities allow users to search tens – if not hundreds – of thousands of pages to find what’s relevant to them. Merrill DataSite’s search capabilities ensure nothing is missed in any of the posted documents - regardless of where they may be organised within the index (e.g. find every instance of “contract” and “termination” within 5 words of each other, etc.). Search results are returned much faster and are unlimited in terms of document results and hits within a document.
using wildcard, fuzzy, proximity, boosting, boolean and grouping modifiers, you can search and find exact matches and near-matches, including misspelled words. Potential buyers will enjoy increased confidence knowing they’ve received and seen all materials and documents that are relevant to their decision-making.
Protect confidential information. ”View-only” documents are never downloaded. Merrill DataSite, not the computer’s browser, controls the caching process providing unmatched security levels. unlike other VDr providers, images are never viewable on the PC’s cache after the conclusion of a session.
Track all activity accurately. Auditing and reporting tools provide a verifiable account of each individual’s time spent viewing both documents and specific pages – information that adds negotiating leverage.
Need to work remotely?No problem. Whether you’re working in beijing or New York, you can view your documents online without having to navigate through internal firewalls and email restrictions that often exist for outside company connections and which delay the due diligence process.
Security is our highest priorityMerrill has been a trusted provider of secure information to the financial and legal industries for more than 40 years. our employees execute letters of confidentiality and we are audited annually (internal and third-party) to make certain our it infrastructure and processes remain sound.
Merrill DataSite was the first virtual data room to receive the iSo 27001 certification for its comprehensive information Security Management System (iSMS).
the iSo 27001 standard, developed by the international organisation for Standards to establish international requirements for information security and certification of iSMS, is designed to ensure effective protection of information assets in foreign markets, as well as across national and regional boundaries.
The best tool in the industryMerrill DataSite technology allows for the fastest conversion of soft and hard copy documents to the electronic viewing platform. As a result, designated administrators are able to review documents the moment they are available.
through secure, simultaneous access, full text search capabilities and robust reporting tools, both archival and transactional due diligence processes are streamlined. As a result, Merrill DataSite gives you more insight and control, and dramatically reduces transaction time and costs.
As a leading provider of VDr solutions worldwide, Merrill DataSite has empowered nearly two million unique visitors to perform electronic due diligence on thousands of transactions totalling trillions of dollars in asset value.
Now SMArTEr, FASTEr, EASIEr!
PlEASE vISIT our wEbSITE: www.DATASITE.coM
ABO
UT M
ERR
ILL DATASITE
Monthly M&A Insider 34
AboUT MERRILL CoRpoRATIon
aBO
Ut M
err
ill cOr
POr
atiON
EXECuTIVE MAnAGEMEnTEd bifulkpresidentTel: +1 212 229 6563
paul hartzellSenior Vice presidentTel: +1 212 367 5950
EXECuTIVE sAlEsChris beckmannRegional Director, germany, Switzerland and polandTel: +49 69 25617 110
Alex GrossRegional Director, Eastern Europe & Middle EastTel: +49 69 7593 7148
Michael hinchliffe Regional Director, U. k. Tel: +44 20 7422 6100
Jonathan hughesAccount Manager, northern EuropeTel: +44 20 7422 6100
shashank JainAccount Manager, United Arab EmiratesTel: +971 (0)50 252 3025
Alvaro OrtegaRegional Director, Southern EuropeTel: +44 20 7422 6100
Adam pangAccount Manager, EuropeTel: +44 20 7422 6268
Merlin J. piscitelli Regional Director, Europe Tel: +44 20 7422 6100Jérôme pottierRegional Director, FranceTel: +33 (0) 1 40 06 13 12
Colin schopbach Regional Director, U. k. Tel: +44 20 7422 6100
Anna scottRegional Director, U. k. Tel: +44 20 7422 6100
hakema El-hadadRegional Director, northern AfricaTel: +33 (0) 1 40 06 13 10
Mark FinnieRegional Director, north AsiaTel: +852 2536 2534
Ari leeRegional Director, north AsiaTel: +852 9855 3758
Vincent lorkRegional Director, South East AsiaTel: +65 6248 4602
Chris robilliardRegional Director, Australia & new ZealandTel: +612 8667 3064
Manuel bentosinos Regional Director, Mexico, Columbia and Caribbean Tel: +52 55 9171 2237
Ana paula Macêd Távora de Castro Regional Director, South AmericaTel: +55 11 9908 0858
luis Felipe salles CunhaRegional Director, brazilTel: +55 11 3568 2429
Carlos nogueiraRegional Director, brazilTel: +55 11-3895-8572
brian GilbreathVice president, Midwest and Latin AmericaTel: +1 404 934 8085
hank GregorySVp, Western Canada & pacific northwest Tel: + 604 603 4360
ryan MacMillanRegional Director, CanadaTel: +1 416 214 2448
Jason hedgesRegional Director, CanadaTel: +1 416-878-3260
Michael Kennedy Regional Director, new England Tel: +1 207 829 4369
ross WhittakerRegional Director, new EnglandTel: +1 617.535.1516
Jon lenihanRegional Director, bostonTel: +1 617-535-1618
scott redikerRegional Director, Mid AtlanticTel: +1 443-690-3122
Forrest r. doaneRegional Director, new yorkTel: +1 212 229 6620
Adam KuritzkyRegional Director, new yorkTel: +1 917 232 9569
shelle MartinRegional Director, new york Tel: +1 212 229 6613
John McElroneRegional Director, new yorkTel: +1 212 229 6656
Matthew Mezzancello Regional Director, ny, nJ & pA Tel: +1 212 229 6618
steve picconeVice president, new yorkTel: +1 212 229 6883
William poleseRegional Director, new yorkTel: +1 212 229 6612
paul KleinkaufRegional Director, SoutheastTel: +1 404 602 3251
Michail sidorovRegional Director, ohio & MichiganTel: +1 216-333-1274
Jessie sainiRegional Director, MidwestTel: +1 312-386-2293
scott haugenRegional Director, Minnesota & WisconsinTel: +1 651 632 4375
Anthony CrosbyRegional Director, ChicagoTel: +1 312 674 6511
Mark plaehnRegional Director, ChicagoTel: +1 312 674 6527
Kelly-leigh Keefe,Regional Director, ChicagoTel: +1 312-386-2229
nicholas renterRegional Director, TexasTel: +1 214 754 2100
Andrew buonincontro Regional Director, bay AreaTel: +1 650 493 1400
Erik sandieRegional Director, bay AreaTel: +1 650 493 1400
Jay loyolaRegional Director, bay AreaTel: +1 949 622 0663
dan phelanRegional Director, Los AngelesTel: +1 213 253 2139
hans schumannRegional Director, San DiegoTel: +1 760 635 0830
david YearyVice president, DataSite Life SciencesTel: +1 415 307 4414
James snazaDirector of Life SciencesTel: +1 651 632 4585
Jon blue Vice president, Clean Tech Tel: +1 206-696-9169
www.mergermarket.comRemark, part of The Mergermarket group
80 StrandLondon, WC2R 0RLUnited Kingdom
t: +44 (0)20 7059 6100f: +44 (0)20 7059 [email protected]
11 West 19th Street, 2nd fl.New York, NY 10011USA
t: +1 212 686-5606f: +1 212 [email protected]
Suite 2401-3Grand Millennium Plaza181 Queen’s Road, CentralHong Kong
t: +852 2158 9700f: +852 2158 [email protected]
disclaimer
This publication contains general information and is not intended to be comprehensive nor to provide financial, investment, legal, tax or other professional advice or services. This publication is not a substitute for such professional advice or services, and it should not be acted on or relied upon or used as a basis for any investment or other decision or action that may affect you or your business. before taking any such decision you should consult a suitably qualified professional adviser. Whilst reasonable effort has been made to ensure the accuracy of the information contained in this publication, this cannot be guaranteed and neither Mergermarket nor any of its subsidiaries nor any affiliate thereof or other related entity shall have any liability to any person or entity which relies on the information contained in this publication, including incidental or consequential damages arising from errors or omissions. Any such reliance is solely at the user’s risk.
Remark, the events and publications arm of The Mergermarket group, offers a range of publishing, research and events services that enable clients to enhance their own profile, and to develop new business opportunities with their target audience.
The following notes pertain to data contained in this publication:
• Deals are included where the deal value is greater than or equal to €5m.
• Where no deal value has been disclosed, deals are included if the turnover of the target is greater than or equal to €10m.
• Deals are included in the graphs and Top Deals in each section based on the dominant geography and dominant sector of the target company. Data underlying the League Tables are based on deals where the bidder, target or parent geography of either is that of the geography in focus.
• *Q1 2012 refers to the period 1-Jan-12 to 29-Feb-12. *yTD 2012 refers to the period 1-Jan-12 to 29-Feb-12.