Embed Size (px)
Citation preview
University of Rhode Island University of Rhode Island
DigitalCommons@URI DigitalCommons@URI
Open Access Dissertations
2001
A MECHANISTIC STUDY OF FLOW AND COMPRESSION A MECHANISTIC STUDY OF FLOW AND COMPRESSION
BEHAVIOR OF PHARMACEUTICAL POWDERS BEHAVIOR OF PHARMACEUTICAL POWDERS
Yogita Desai University of Rhode Island
Follow this and additional works at: https://digitalcommons.uri.edu/oa_diss
Recommended Citation Recommended Citation Desai, Yogita, "A MECHANISTIC STUDY OF FLOW AND COMPRESSION BEHAVIOR OF PHARMACEUTICAL POWDERS" (2001). Open Access Dissertations. Paper 180. https://digitalcommons.uri.edu/oa_diss/180
This Dissertation is brought to you for free and open access by DigitalCommons@URI. It has been accepted for inclusion in Open Access Dissertations by an authorized administrator of DigitalCommons@URI. For more information, please contact [email protected].

DOCTOR OF PHILOSOPHY DISSERTATION
OF
YOGIT A DESAI
APPROVED:
Dissertation Committee:
Major Professor
DEAN OF THE GRADUATE SCHOOL
UNIVERSITY OF RHODE ISLAND
2001
A MECHANISTIC STUDY OF FLOW AND COMPRESSION BEHAVIOR
OF PHARMACEUTICAL POWDERS
BY
YOGITA DESAI
A DISSERTATION SUBMITTED IN PARTIAL FULFILLMENT OF THE
REQUIREMENTS FOR THE DEGREE OF
DOCTOR OF PHILOSOPHY
IN
PHARMACEUTICAL SCIENCES
UNIVERSITY OF RHODE ISLAND
2001
ABSTRACT
Majority of the drug substances are administered to patients in the form of oral
solid dosage forms. The drug substance is mixed with excipients and the resulting
powder blend is compressed into tablets. For a pharmaceutical powder to be
compressed into uniform solid dosage forms, it is essential that the powder blend has
good flow and compaction properties. The flow and compression properties of a
pharmaceutical blend depend on the physicochemical properties of the individual
components and their relative proportions in the mixture. Poor compressibility along
with the poor flowable nature of most of the pharmaceutical mixtures poses
tremendous challenges during the scale up and production stages. Vast majority of the
tableting research was performed using single components though a typical tablet is a
multi-component system. In this investigation, an attempt was made to study the flow
and compression behaviors of multi-component mixtures containing several of the
most commonly used pharmaceutical excipients. The effect of triboelectric charging
during powder processing was also evaluated.
The objectives of this study include: i) to investigate the relationship between the
individual components and their mixed systems; ii) to analyze and predict the flow
behavior of a mixed system from individual components using an experimental design;
iii) to determine the optimum conditions for a mixture to exhibit better flow behavior;
iv) to investigate the compression behavior of statistically designed multi-component
mixtures using an instrumented tablet press; v) to determine the effect of mixing time,
mixer type and batch size on triboelectrification of powders in a high shear mixer; and
vi) to compare the antistatic effect of different lubricants/glidants on electronegative
and electropositive materials.
( Lactose Anhydrous (97%w/w) blends were prepared with 3%w/w
lubricant/glidant(s) in a planetary mixer as per simplex experimental design. The
lubricants evaluated were: magnesium stearate, NF, stearic acid and colloidal silicon
dioxide, NF (Cab-0-Sil M5). The relative amounts of lubricants/glidants were varied
from 0 to 3% as per simplex design. One set of powder blends were prepared with a
constant mix time of 3 minutes. Another set of powder blends were prepared with
varying mix time until a relatively constant value for bulk density was achieved for
specific blend. A total of ten powder blends of 500 grams each were prepared for each
experiment. Response surface methodology was used to correlate the variation in
lubricant/glidant(s) with the flow behavior. The powder blends and individual
components were evaluated for bulk density, tapped density, aerated bulk density,
packed bulk density, compressibility index, angle of repose, angle of spatula, angle of
fall, angle of difference, cohesiveness, dispersibility, moisture content and particle size
distribution. The data was analyzed using StatGraphics software and the special cubic
model was fitted to generate mathematical equations. Contour plots were obtained to
interpret the flow behavior of powder blends as a function of mixture composition.
The compression behavior of experimentally designed multi-component
mixtures using an instrumented tablet press was studied. The mixtures comprised of
anhydrous lactose, NF, microcrystalline cellulose, NF (Avicel® PH101) and
pregelatinized starch, NF (Starch 1500) with individual quantities varying from 0 to
99% w/w based on a simplex design. Magnesium stearate, NF was added as lubricant
at 1 % w/w level. The batch size was 900 grams (equivalent to 3000 tablets). Ten
experimental mixtures were prepared in a Collette Gral 10 High Shear Mixer with 3
minutes of pre-blending and 1 minute of lubricant mixing. The powder mixtures were
( evaluated for bulk and tapped densities, particle size distribution and moisture content.
The powder blends were compressed using a 10-station instrumented Piccola rotary
tablet press (Model: 026 BIO) equipped with a compression research system (PC-30,
SMI Inc.). Tablets were prepared with 12/32" standard concave tooling with
compressjon forces of 1000 lbs, 2000 lbs, 3000 lbs, 4000 lbs, 5000 lbs, 6000 lbs and
maximum achievable force. The compression force-time profiles were recorded to
measure the compression force and ejection force for each compression cycle. The
tablets were evaluated for hardness, weight, thickness, friability and disintegration
time. The true densities of tablets and powder blends were measured using a helium
pycnometer (Ultrapycnometer 1000). The compression force-time pulses for all the
mixtures at each compression force were compared to investigate the effect of mixture
composition on the compression behavior of powder blends. Events such as rise time,
fall time, dwell time, contact time, areas and pulse widths that characterize the nature
of each compression pulse were evaluated using a response surface method
(StatgraphicsP/us). Tablet surface area and volume was calculated using Natoli
computer program. Contour plots were generated to study the effect of formulation
composition on bulk density, tablet hardness, dwell time, total area of compression
force-time curve, ejection force, tablet surface area, and porosity. Heckel relationships
were plotted using the compressibility model.
The effect of high shear mixing on electrical properties of pharmaceutical
materials such as pregelatinized starch (Starch 1500), microcrystalline cellulose
(Avicel® PHIOI) and cimetidine formulation (cimetidine:lactose anhydrous:Avicel®
PHIOI:Starch 1500: lubricant = 69:10:10:10:1) was determined as a function of
mixing time. Different lubricants/ glidants such as magnesium stearate, stearic acid,
( colloidal silicon dioxide (Cab-0-Sil MS) and sodium stearyl fumarate (Pruv®) were
evaluated for their antistatic effect. The selected material(s) were screened through a
30-mesh hand screen and were mixed in a Collette Gral 10 high shear mixer for 10
minutes at a mixer arm speed of 660 rpm and a chopper speed of 3000 rpm.
Lubricant/glidant at 1 % w/w level was added to the pre-blend and the mixing was
continued for an additional 3 minutes. The electrostatic charges on powder blends
were measured using the Faraday Cup connected to NanoCoulomb Electrometer after
0, S, 10, 11, 12 and 13 minutes of mixing. Mixer type effect was evaluated by mixing
powders in Collette Gral 10 high shear mixer and Kitchen Aid Planetary Mixer and
determining the electrostatic measurements. Batch sizes of O.S kg and 2.S kg were
evaluated to determine the batch size effect on triboelectrification during high shear
mixing. The last contact surface for all electrostatic measurements was kept constant
with teflon coated stainless steel surface.
From different flow parameters evaluated for lactose anhydrous blends, it can be
summarized that the relationship for powder properties between the mixture and its
components is non-linear. Significant differences were observed in the flow behavior
of powder blends obtained with constant mixing time and those obtained with variable
mixing times. Among the three variable components as per the simplex design, Cab-
0-Sil MS had a significant effect on the time required to achieve the constant bulk
density for a specific powder blend. It was demonstrated that using the special cubic
simplex design, the flow behavior of lactose blend can be optimized. For constant mix
time study, the model predicted that Lactose Anhydrous would show optimum flow
behavior with formulation composition of 0.2S%w/w Magnesium Stearate, 1.48%w/w
Stearic Acid and l .27%w/w Cab-0-Sil MS. Thus from the response surface contour
( plots and the mathematical model equations, one can determine the composition of the
flow enhancers required, mix time to achieve constant bulk density so that the final
blend will display optimum flow behavior.
The statistically designed powder blends comprising Lactose Anhydrous,
Avicel® PHlOl, Starch 1500 and Magnesium Stearate were compressed using an
instrumented tablet press. The compression force-time curves and ejection force-time
curves were evaluated and critical compression parameters such as ejection force,
dwell time, tablet surface area, porosity and Heckel plots were determined. The
compression parameters generated in this study, provide valuable insights into how
multi-component mixtures behave under pressure. The key findings can be
summarized as follows: The weight variation, tablet thickness, tablet surface area and
volume of tablets increased with an increase in the concentration of Starch 1500 in the
mixture. As the level of A vice!® PH 101 in the blend increases, so does the hardness
profile for tablets. Maximum disintegration times were observed for tablets prepared
from blend containing Avicel® PH101 and Lactose Anhydrous at 49.5% level.
Maximum dwell time of 107 msec was observed for 99% Lactose Anhydrous at
maximum achievable force (~8500 lbs) and a minimum dwell time of 51 msec was
observed for the same blend at 1000 lbs of applied force. The compressibility of
blends increased with an increase in the amount of Avicel® PHlOl in mixture. The
amount of ejection force required for tablets increased with an increase in the
concentration of Anhydrous Lactose in the blend. Tablets prepared from the blend
containing 49.5% Anhydrous Lactose and 49.5% Starch 1500 displayed maximum
amount of porosity. The presence of Starch 1500 has a significant effect on tablets
with high porosity values. Heckel plots were generated to elucidate the densification
and deformation mechanism of various mixtures. Based on the shapes of the curves,
the dominant component of the mixture seems to dictate the deformation mechanism.
In mixtures containing the components in equal amounts, the deformation mechanism
seems to be complex. The results provide critical information on compression
behavior of multi-component mixtures for comparative purposes as there are hardly
any published reports in this area.
When evaluated individually, cimetidine displayed electropositive charge
whereas all other excipients displayed electronegative charges. Cab-0-Sil M5 was
found to be the most electronegative whereas stearic acid was found to be the least
electronegative among the excipients examined. Based on the results obtained in this
study, when Starch 1500 was blended with 1 % lubricant/glidant in a Collette Oral 10
High Shear Mixer, the lubricants/glidants can be arranged as follows in the decreasing
order of their ability to reduce the static charges produced during the blending process:
magnesium stearate > Pruv® > stearic acid > Cab-0-Sil M5. For Avicel® PHlOl
blends, the antistatic effect of the same agents can be arranged in the decreasing order
as: magnesium stearate > stearic acid> Pruv® > Cab-0-Sil M5. As the mixing time
with lubricants/glidants increased from 1 minute to 3 minutes, the antistatic effect
seems to reduce. The antistatic effect of lubricants/glidants was dependent on the
electrical charge behavior of the materials studied. The mixer design and type played
an important role in determining the electrostatic charges of powder blends in
pharmaceutical processing. Powders blended in Collette Oral 10 High Shear Mixer
produced more electrostatic charges as compared to those blended in Kitchen Aid
Planetary Mixer. The mixer loading also played an important role in determining the
electrostatic charges of powder blends in powder processing. The triboelectrification
( of the blend in a high shear mixer decreased with an increase in the batch size from 0.5
kg to 2.5 kg. Thus by measuring static charges present on drugs/excipients during
developmental stage, formulation scientist can utilize triboelectrification process to
obtain powder blends that have low segregation problems.
In summary, the results indicated that by varying the m1xmg time and/or
relative proportion and type of lubricants/flow enhancers, it is possible to achieve
powder blends with markedly improved flow properties. The current findings on
compression behavior of multi-component mixtures will help formulation scientists to
design and develop a robust tablet dosage form that meets the desired quality attributes
and is free of processing problems during scale up and production. Selection of
formulation components based on their electrical behavior will enhance the
development of dosage forms that have good flow and compression behavior.
With the advent of so many new polymeric materials, further studies will
definitely shed more light on the complex process of compaction, since there are only
a few published reports concerning multi-component mixtures are available so far.
ACKNOWLEDGEMENTS
My heartfelt thanks to Dr. Hossein Zia, my thesis advisor, for his unerring
guidance and personal and professional support to help me fulfill my goals. I am
especially grateful to Dr. Thomas Needham for his constant support and
encouragement. I remain indebted io my entire thesis committee including, Drs.
Campbell, Lausier, Lee, Suryanarayan and Zhang for their patience and input. I am
grateful to Deans Luzzi and Telang for giving me confidence to pursue my aspirations.
I would like to thank Dr. Salah U. Ahmed and Ezzeldin Hamza of Barr
Laboratories, Inc. for permitting me to use the laboratory facilities at Barr. I will
always cherish the support and friendship, which afforded to me at Barr by Gandha,
Yan Lou, Venkatesh, Serge, Kanchan, Jaidev and numerous other peoples.
From the bottom of my heart, I would like to express my love and my gratitude
to my parents, Shashikant and Y ashoda, whose work ethic has tinged every nuance of
my academic and professional life. Their innumerable sacrifices and unconditional
understanding will always remain my source of strength.
To my angels, my husband Polireddy, and my little Priyanka, a.k.a. Nunu. Poli,
you are my best friend, my truest confidant, and my harshest critic. Your honesty,
your intelligence, and your compassion influence everything that I do and achieve.
Thank you for your many sacrifices and helping me in so many ways. I will never be
able to thank you enough and yet thank you; the two of you truly complete me.
To my younger brother, Kedar, for his love and friendship. To Tai Aaji, who
could not be here to see me accomplish this milestone in my life, but who smiles down
at me with a level of love and pride that only she has earned in my life. To Gangu
Vlll

( Aaji, who has spent a lifetime looking after all of us. To my beloved Maushis
(Aunties), I hope that in some way my work stands for the hard work and sacrifices in
bringing me up.
I want to thank all the people who have afforded me so many reasons to be
thankful for in my life. I thank God for blessing me with the love and support of so
many special people.
ix

(
To my family
x
( PREFACE
This dissertation was prepared according to the University of Rhode Island
"Guidelines for the Format of Theses and Dissertations" standards for Manuscript
format, approved April 1, 2001. For this dissertation, three articles are combined to
satisfy the requirements of the Department of Applied Pharmaceutical Sciences,
College of Pharmacy, University of Rhode Island.
Manuscript I Investigation of the Predictability of Flow Characteristics of
Powder Mixtures
This manuscript summarizes the trends and prediction of the flow behavior of a mixed
powder system in relation to that of the individual components. These results have
been presented at the 10th Annual Meeting of American Association of
Pharmaceutical Scientists (AAPS) in Seattle, WA, 1996 and at the Eastern Regional
Meeting of AAPS in New Brunswick, NJ, June 1997. This paper will be submitted for
publication in the 'Journal of Pharmaceutical Sciences'.
Manuscript II Analysis of Compression Behavior of Multi-Component
Mixtures using an Instrumented Tablet Press
This manuscript comprises of the investigation of the compression behavior of
statistically designed multi-component mixtures using an instrumented tablet press.
The findings of this study were presented at 12th Annual Meeting of American
Association of Pharmaceutical Scientists (AAPS) held at San Francisco, CA in 1998.
These findings will be submitted in two parts for publication in the 'International
Journal of Pharmaceutics'.
Xl
( Manuscript III Effect of Formulation Components and Manufacturing Process
on the Electrostatic Behavior of Pharmaceutical Powders
This manuscript describes a study performed to elucidate the significance of
static charges generated on pharmaceutical powders during high shear mixing. These
results have been presented at 12th Annual Meeting of American Association of
Pharmaceutical Scientists (AAPS) held at San Francisco, CA in 1998. These results
will be submitted for publication in 'Drug Development and Industrial Pharmacy'.
Xll
(
(
ABSTRACT
ACKNOWLEDGEMENTS
PREFACE
TABLE OF CONTENTS
LIST OF TABLES
LIST OF FIGURES
MANUSCRIPT I
TABLE OF CONTENTS
INVESTIGATION OF THE PREDICT ABILITY OF FLOW
CHARACTERISTICS OF POWDER MIXTURES
Abstract .......... .......................... .................... ...... ........ ..... ..... .. .. ........ .
Introduction ...... ... ....... .. ......................... ............................. .. .. .......... .
Methodology ........... .. ..... .... ... ... ..... ..... .... ... ....... ................... ....... ..... . .
Results and Discussion .... .. ......... ... .. ... ......... .......... .. ..... .... ........... .. .. .
Conclusions
References
MANUSCRIPT II
ANALYSIS OF COMPRESSION BEHAVIOR OF MULTI-COMPONENT
MIXTURES USING AN INSTRUMENTED TABLET PRESS
Abstract ..... ................ .... .... ...... .. ...... ... .. .. ..... ..... ... ............ .... ........... .. .
Introduction ........ .......... ..... ....... .. .. ..... ..... ... ..... ..... ......... .......... .. ... .... . .
Methodology ... ... ........ ...... .. .... ... .. ......... .. ... .... .... .. .. ....................... .... .
Xlll
viii
XI
Xlll
xv
XIX
2
4
7
13
46
48
53
54
56
62
Results and Discussion .. . . .. .. . .. .. .. . . . . . . . . . . . .. .. . . . . .. .. . . . . . . .. .. .. .. . .. .. . . . .. . . . . . . . . 72
Conclusions ......... ..... ............ ... ........... ... ........ ...................... ........... ... 157
References . . . . . . . . . . . . . . . . . . . . . . . . . . . . . . . . . . . . . . . . . . . . . . . . . . . . . . . . . . . . . . . . . . . . . . . . . . . . . . . . . . . . . . . . . 160
MANUSCRIPT III
EFFECT OF FORMULATION COMPONENTS AND MANUFACTURING
PROCESS ON THE ELECTROSTATIC BEHAVIOR OF
PHARMACEUTICAL POWDERS
Abstract . . . . . . . . . . . . . . . . . . . . . . . . . . . . . . . . . . . . . . . . . . . . . . . . . . . . . . . . . . . . . . . . . . . . . . . . . . . . . . . . . . . . . . . . . . . . . 169
Introduction ....................................................................................... 171
Methodology........................... ........................................................... 177
Results and Discussion . . . . . . . . . . . . . . . . . . . . . . . . . . . . . . . . . . . . . . . . . . . . . . . . . . . . . . . . . . . . . . . . . . . .. . 181
Conclusions . . .. . . ......... .. . . .. . . . . . . . .. . . .. .. . . .. . .. . .. . .. . . .. .. . . .. . . . . .. .. . . .. . . . .. .. . . . . . . . . . 216
References . . . . . . . . . . . . . . . . . . . . . . . . . . . . . . . . . . . . . . . . . . . . . . . . . . . . . . . . . . . . . . . . . . . . . . . . . . . . . . . . . . . . . . . . . 219
BIBLIOGRAPHY 223
XIV
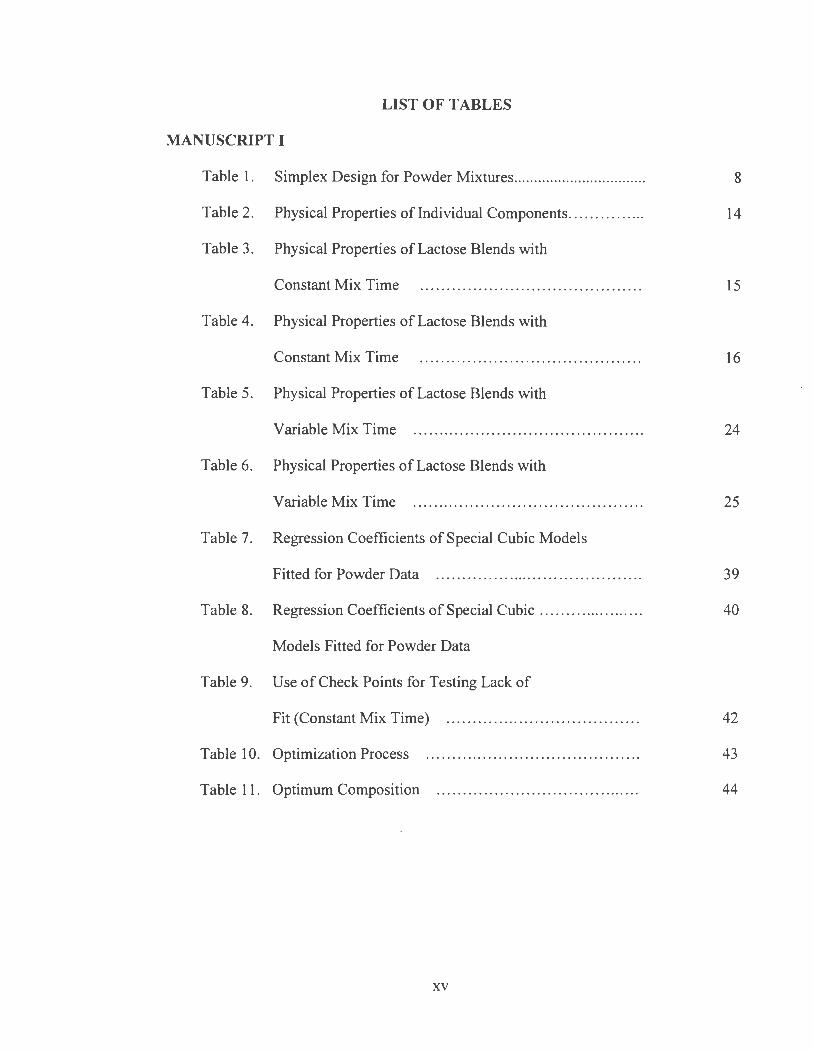
LIST OF TABLES
MANUSCRIPT I
Table 1. Simplex Design for Powder Mixtures .. ........ ....... .... .. ........ ..
Table 2. Physical Properties oflndividual Components .... . ...... .. ..
Table 3. Physical Properties of Lactose Blends with
Constant Mix Time
Table 4. Physical Properties of Lactose Blends with
Constant Mix Time
Table 5. Physical Properties of Lactose Blends with
Variable Mix Time
Table 6. Physical Properties of Lactose Blends with
Variable Mix Time
Table 7. Regression Coefficients of Special Cubic Models
Fitted for Powder Data . . .. . .. . ... . ....... .. .......... . .... . .. .
Table 8. Regression Coefficients of Special Cubic ............. . ...... .
Models Fitted for Powder Data
Table 9. Use of Check Points for Testing Lack of
Fit (Constant Mix Time) . . .. . ... .... .. . .. . .. . .. .. . ... .. . .... .
Table 10. Optimization Process
Table 11 . Optimum Composition
xv
8
14
15
16
24
25
39
40
42
43
44
MANUSCRIPT II
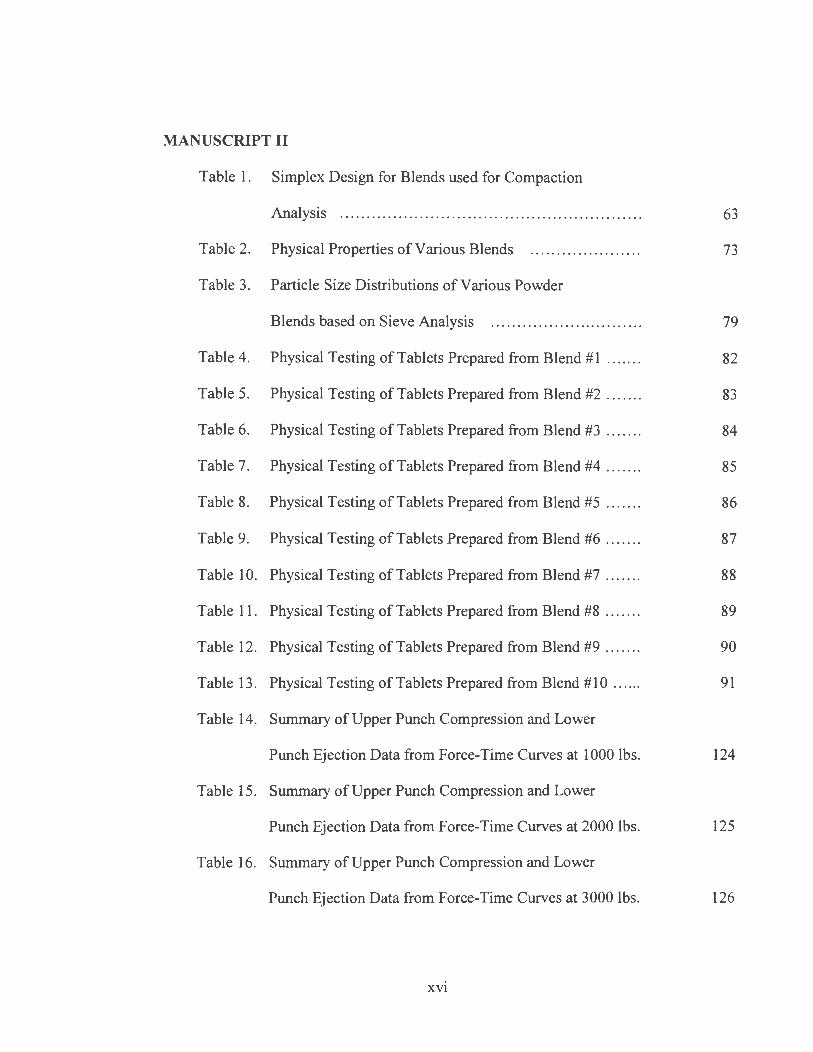
Table 1. Simplex Design for Blends used for Compaction
Analysis . . .. ............ . .. . ..... ............... .. . . . .. ...... . .. .
Table 2. Physical Properties of Various Blends . ......... . ......... .
Table 3. Particle Size Distributions of Various Powder
Blends based on Sieve Analysis .... . .... .. .. . .............. .
Table 4. Physical Testing of Tablets Prepared from Blend #1 ...... .
Table 5. Physical Testing of Tablets Prepared from Blend #2 ...... .
Table 6. Physical Testing of Tablets Prepared from Blend #3 ...... .
Table 7. Physical Testing of Tablets Prepared from Blend #4 ...... .
Table 8. Physical Testing of Tablets Prepared from Blend #5 ...... .
Table 9. Physical Testing of Tablets Prepared from Blend #6 ...... .
Table 10. Physical Testing of Tablets Prepared from Blend #7 ...... .
Table 11. Physical Testing of Tablets Prepared from Blend #8 .. . ... .
Table 12. Physical Testing of Tablets Prepared from Blend #9 ...... .
Table 13. Physical Testing of Tablets Prepared from Blend #10 ..... .
Table 14. Summary of Upper Punch Compression and Lower
Punch Ejection Data from Force-Time Curves at 1000 lbs.
Table 15. Summary of Upper Punch Compression and Lower
63
73
79
82
83
84
85
86
87
88
89
90
91
124
Punch Ejection Data from Force-Time Curves at 2000 lbs. 125
Table 16. Summary of Upper Punch Compression and Lower
Punch Ejection Data from Force-Time Curves at 3000 lbs. 126
XVI
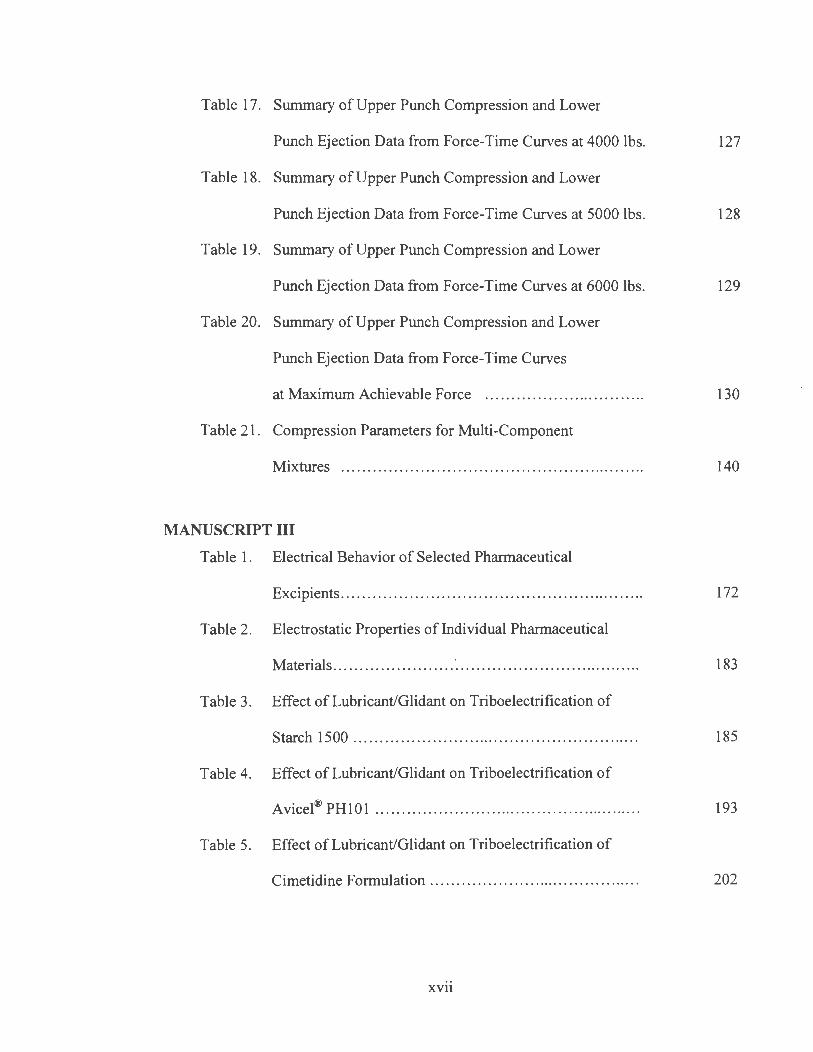
Table 17. Summary of Upper Punch Compression and Lower
Punch Ejection Data from Force-Time Curves at 4000 lbs. 127
Table 18. Summary of Upper Punch Compression and Lower
Punch Ejection Data from Force-Time Curves at 5000 lbs. 128
Table 19. Summary of Upper Punch Compression and Lower
Punch Ejection Data from Force-Time Curves at 6000 lbs. 129
Table 20. Summary of Upper Punch Compression and Lower
Punch Ejection Data from Force-Time Curves
at Maximum Achievable Force ............................... 130
Table 21. Compression Parameters for Multi-Component
Mixtures ......................................................... . 140
MANUSCRIPT III
Table 1. Electrical Behavior of Selected Pharmaceutical
Excipients ......................................................... . 172
Table 2. Electrostatic Properties of Individual Pharmaceutical
Materials ....................... · ................................... . 183
Table 3. Effect of Lubricant/Glidant on Triboelectrification of
Starch 1500 ............. .. ....................................... . 185
Table 4. Effect of Lubricant/Glidant on Triboelectrification of
Avicel® PH101 ................................................... . 193
Table 5. Effect of Lubricant/Glidant on Triboelectrification of
Cimetidine Formulation ........................................ . 202
XVll
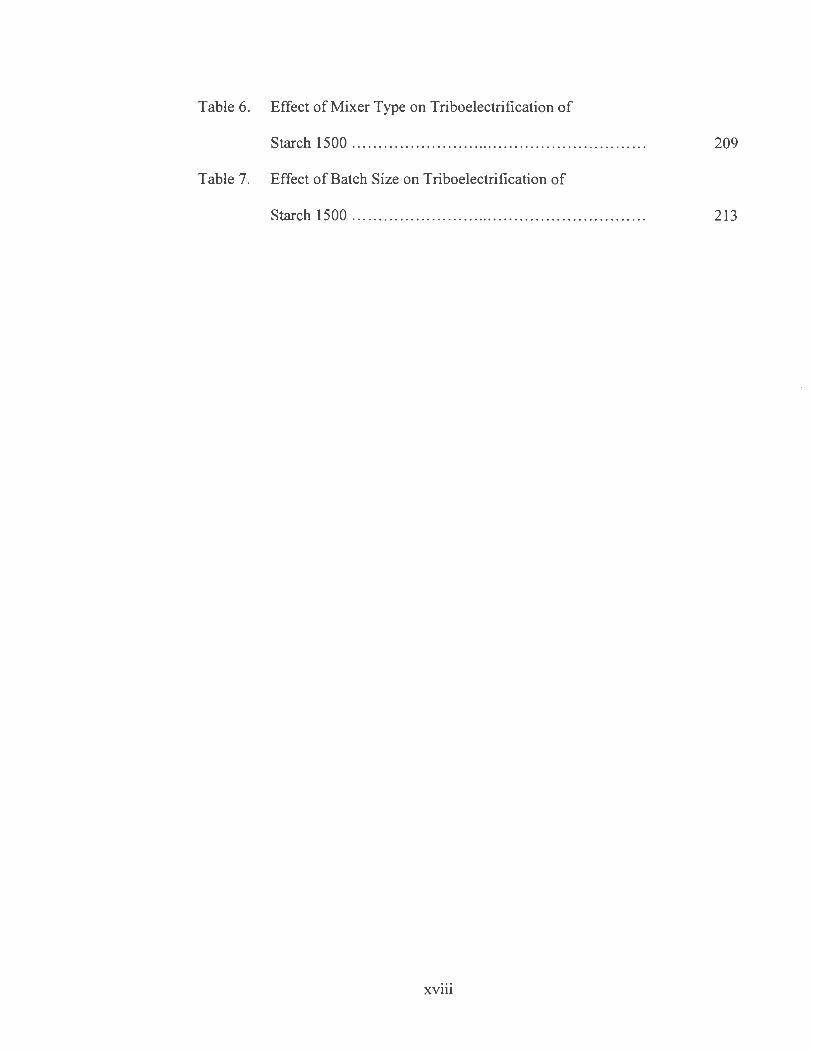
Table 6. Effect of Mixer Type on Triboelectrification of
Starch 1500 . . . . . . . . . . . . . . . . . . . . . . . . . . . . . . . . . . . . . . . . . . . . . . . . . . . . . . . . 209
Table 7. Effect of Batch Size on Triboelectrification of
Starch 1500. .. . .. . . .... .. .. . . .. . .. ...... .. . ... .. . .. . ... . .. . . . . .. . . . 213
xviii
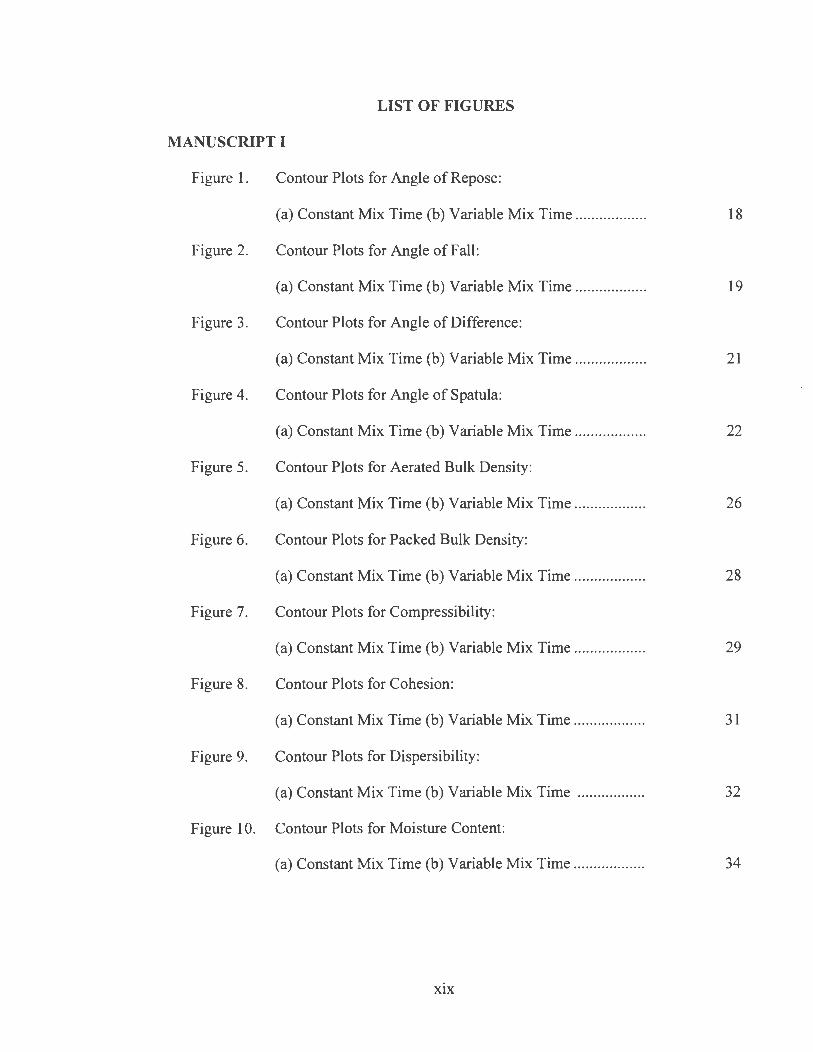
( LIST OF FIGURES
MANUSCRIPT I
Figure 1. Contour Plots for Angle of Repose:
(a) Constant Mix Time (b) Variable Mix Time .................. 18
Figure 2. Contour Plots for Angle of Fall:
(a) Constant Mix Time (b) Variable Mix Time .................. 19
Figure 3. Contour Plots for Angle of Difference:
(a) Constant Mix Time (b) Variable Mix Time .................. 21
Figure 4. Contour Plots for Angle of Spatula:
(a) Constant Mix Time (b) Variable Mix Time ....... .. ......... 22
Figure 5. Contour Plots for Aerated Bulle Density:
(a) Constant Mix Time (b) Variable Mix Time .... .............. 26
Figure 6. Contour Plots for Packed Bulk Density:
(a) Constant Mix Time (b) Variable Mix Time .................. 28
Figure 7. Contour Plots for Compressibility:
(a) Constant Mix Time (b) Variable Mix Time .................. 29
Figure 8. Contour Plots for Cohesion:
(a) Constant Mix Time (b) Variable Mix Time ........... ....... 31
Figure 9. Contour Plots for Dispersibility:
(a) Constant Mix Time (b) Variable Mix Time ................. 32
Figure 10. Contour Plots for Moisture Content:
(a) Constant Mix Time (b) Variable Mix Time .................. 34
XIX
( Figure 11. Contour Plots for Mean Particle Size:
(a) Constant Mix Time (b) Variable Mix Time ................ .
Figure 12. Contour Plot for Mixing Time to obtain
Maximum Bulk Density ... .. .... .... ............................ ........... .
MANUSCRIPT II
Figure 1. Different Phases of the Compression Cycle ..................
Figure 2. Process Flow Chart for Preparation of Powder Blends ......
Figure 3. Pulse Analysis of the Force-Time Curve ......................
Figure 4. Comparison of Bulk Densities of Powder Blends ............
Figure 5. Consolidation of Powder Blends as a Function of Taps ....
Figure 6. Comparison of Compressibility Indices for Powder Blends
Figure 7. Geometric Mean Particle Sizes based on Sieve Analysis
for Powder Blends .............................................. .
Figure 8. Effect of Compression Force on Tablet Hardness .......... .
Figure 9. Effect of Formulation Composition on Tablet Hardness at
4000 lbs of Compression Force ............................... .
Figure 10. Effect of Compression Force on Tablet Thickness ........ .
Figure 11 . Effect of Compression Force on Tablet Friability ......... .
Figure 12. Effect of Compression Force on Tablet Disintegration ... .
Figure 13. Typical Pulse Analysis of the Compaction Force-Time
Curve for Blend # 1 at 4000 lbs ............................... .
xx
36
38
59
64
68
74
75
77
80
94
95
97
98
100
104
Figure 14. Typical Pulse Analysis of the Ejection Force-Time
Curve for Blend #1 at 4000 lbs ..... .... ........................ 105
Figure 15. Typical Pulse Analysis of the Compaction Force-Time
Curve for Blend #2 at 4000 lbs ................................. 106
Figure 16. Typical Pulse Analysis of the Ejection Force-Time
Curve for Blend #2 at 4000 lbs ................................ 107
Figure 17. Typical Pulse Analysis of the Compaction Force-Time
Curve for Blend #3 at 4000 lbs .......... ..... ..... ............ 108
Figure 18. Typical Pulse Analysis of the Ejection Force-Time
Curve for Blend #3 at 4000 lbs ................................ 109
Figure 19. Typical Pulse Analysis of the Compaction Force-Time
Curve for Blend #4 at 4000 lbs ................................ 110
Figure 20. Typical Pulse Analysis of the Ejection Force-Time
Curve for Blend #4 at 4000 lbs ................................ 111
Figure 21. Typical Pulse Analysis of the Compaction Force-Time
Curve for Blend #5 at 4000 lbs ................................ 112
Figure 22. Typical Pulse Analysis of the Ejection Force-Time
Curve for Blend #5 at 4000 lbs ................................ 113
Figure 23. Typical Pulse Analysis of the Compaction Force-Time
Curve for Blend #6 at 4000 lbs ................................. 114
Figure 24. Typical Pulse Analysis of the Ejection Force-Time
Curve for Blend #6 at 4000 lbs ................................ 115
Figure 25. Typical Pulse Analysis of the Compaction Force-Time
Curve for Blend #7 at 4000 lbs ........ .. .......... ...... .... . .. 116
XXI
( Figure 26. Typical Pulse Analysis of the Ejection Force-Time
Curve for Blend #7 at 4000 lbs .......... . ..... . .. . .. ... ... . .... 117
Figure 27. Typical Pulse Analysis of the Compaction Force-Time
Curve for Blend #8 at 4000 lbs ....... .................. .... .... 118
Figure 28. Typical Pulse Analysis of the Ejection Force-Time
Curve for Blend #8 at 4000 lbs .......... . .............. . .... .. . 119
Figure 29. Typical Pulse Analysis of the Compaction Force-Time
Curve for Blend #9 at 4000 lbs .. . .... . ... . ..................... 120
Figure 30. Typical Pulse Analysis of the Ejection Force-Time
Curve for Blend #9 at 4000 lbs .. . .......... . ... . ............ .. . 121
Figure 31. Typical Pulse Analysis of the Compaction Force-Time
Curve for Blend # 10 at 4000 lbs ..... .. .... . ................ .. . 122
Figure 32. Typical Pulse Analysis of the Ejection Force-Time
Curve for Blend # 10 at 4000 lbs . . .... . ... . ....... . . ......... . . 123
Figure 33. Effect of Compression Force on Dwell Time ....... .. . .. .... 132
Figure 34. Effect of Formulation Composition on Dwell
Time at 4000 lbs of Compression Force . . .................. .. 133
Figure 35. Effect of Compression Force on Total Area of
Compression Pulse .......... .... ........ ............... ....... .. 135
Figure 36. Effect of Compression Force on Total Area of
Ejection Pulse ......... . ..... . ........... . .. .......... . .. . . . . . ..... 136
Figure 37. Effect of Compression Force on Ejection Force .. . . ..... . ... 138
Figure 38. Effect of Formulation Composition on Ejection
Force at 4000 lbs of Compression Force ...... .. . ... . . .. .. . ... 139
XXll
Figure 39. Effect of Compression Force on Tablet Surface Area . . . . . . 141
Figure 40. Effect of Formulation Composition on Tablet Surface
Area at 4000 lbs of Compression Force ........... . .... . ..... 142
Figure 41. Effect of Compression Force on Tablet Volume . ..... . . . ... 144
Figure 42. Effect of Compression Force on Tablet Porosity ........ . ... 146
Figure 43. Effect of Formulation Composition on Tablet
Porosity at 4000 lbs of Compression Force .................. 147
Figure 44. Different Types of Compression Behavior Distinguished
By the Heckel Equation ......................................... 149
Figure 45. Heckel Plots for Statistically Designed Mixtures . ... .. ..... 152
MANUSCRIPT III
Figure 1. Experimental Set-Up for Measurement of Electrostatic
Charges on Pharmaceutical Powders ................................. 180
Figure 2. Effect of Magnesium Stearate on Triboelectrification of
Starch 1500 in Collette Gral 10 High Shear Mixer .. .......... 186
Figure 3. Effect of Pruv on Triboelectrification of Starch 1500 in
Collette Gral 10 High Shear Mixer ................................... 187
Figure 4. Effect of Stearic Acid on Triboelectrification of
Starch 1500 in Collette Gral 10 High Shear Mixer ............. 189
Figure 5. Effect of Cab-0-Sil MS on Triboelectrification of
Starch 1500 in Collette Gral 10 High Shear Mixer .. . . . .... 190
Figure 6. Effect of Magnesium Stearate on Triboelectrification of
Avicel® PH101 in Collette Gral 10 High Shear Mixer .... .... . 194
XXlll
Figure 7. Effect of Pruv on Triboelectrification of Avicel® PH IOI in
Collette Gral 10 High Shear Mixer ..... ..... ............. ............ 196
Figure 8. Effect of Stearic Acid on Triboelectrification of
Avicel® PH101 in Collette Gral 10 High Shear Mixer ......... 197
Figure 9 Effect of Cab-0-Sil MS on Triboelectrification of
Avicel® PH101 in Collette Gral 10 High Shear Mixer ....... .. 199
Figure 10. Effect of Magnesium Stearate on Triboelectrification of
Cimetidine Formulation in Collette Gral 10 High Shear Mixer 203
Figure 11. Effect of Cab-0-Sil MS on Triboelectrification of
Cimetidine Formulation in Collette Gral 10 High Shear Mixer 204
Figure 12. Effect of Mixer Type on Triboelectrification of
Starch lSOO ......... ........ .. ..... ... .......................... 210
Figure 13. Effect of Batch Size on Triboelectrification of
Starch 1 SOO in Collette Gral 10 High Shear Mixer ......... 214
XXlV
MANUSCRIPT I
INVESTIGATION OF THE PREDICT ABILITY OF FLOW
CHARACTERISTICS OF POWDER MIXTURES
1
( ABSTRACT
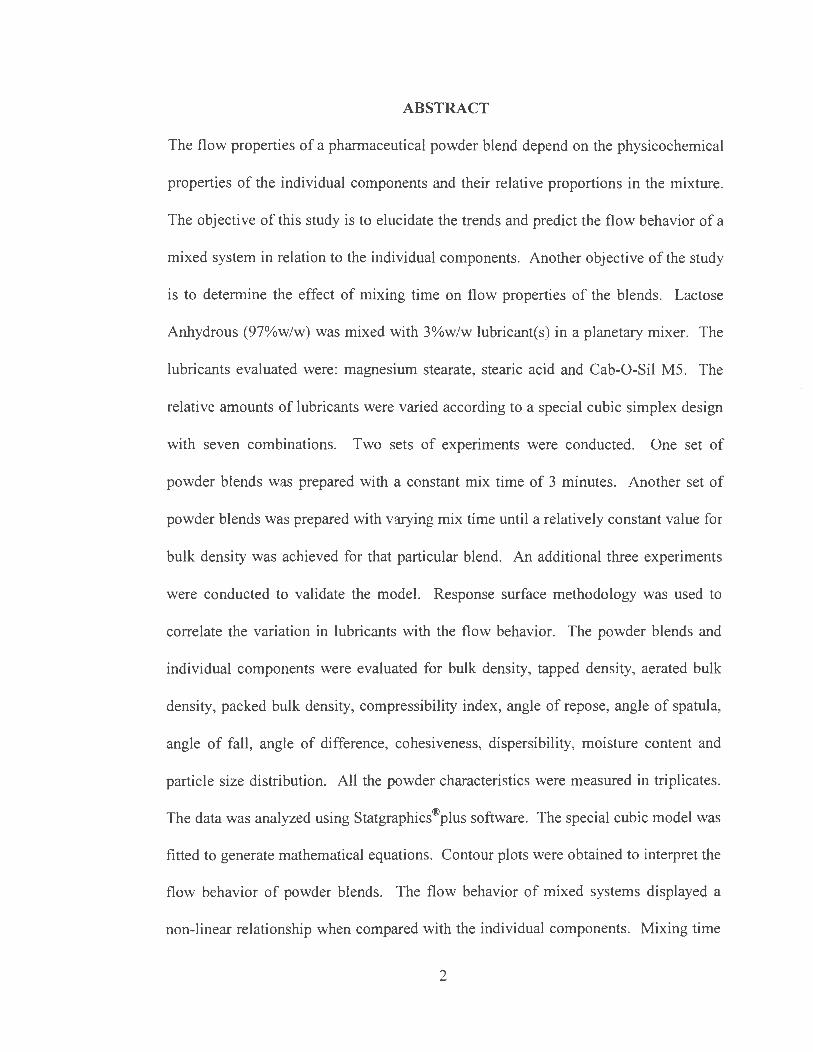
The flow properties of a pharmaceutical powder blend depend on the physicochemical
properties of the individual components and their relative proportions in the mixture.
The objective of this study is to elucidate the trends and predict the flow behavior of a
mixed system in relation to the individual components. Another objective of the study
is to determine the effect of mixing time on flow properties of the blends. Lactose
Anhydrous (97%w/w) was mixed with 3%w/w lubricant(s) in a planetary mixer. The
lubricants evaluated were: magnesium stearate, stearic acid and Cab-0-Sil M5. The
relative amounts of lubricants were varied according to a special cubic simplex design
with seven combinations. Two sets of experiments were conducted. One set of
powder blends was prepared with a constant mix time of 3 minutes. Another set of
powder blends was prepared with varying mix time until a relatively constant value for
bulk density was achieved for that particular blend. An additional three experiments
were conducted to validate the model. Response surface methodology was used to
correlate the variation in lubricants with the flow behavior. The powder blends and
individual components were evaluated for bulk density, tapped density, aerated bulk
density, packed bulk density, compressibility index, angle of repose, angle of spatula,
angle of fall, angle of difference, cohesiveness, dispersibility, moisture content and
particle size distribution. All the powder characteristics were measured in triplicates.
The data was analyzed using Statgraphics®plus software. The special cubic model was
fitted to generate mathematical equations. Contour plots were obtained to interpret the
flow behavior of powder blends. The flow behavior of mixed systems displayed a
non-linear relationship when compared with the individual components. Mixing time
2
had significant effect on the flow properties of the blends that were evaluated. Among
the three lubricants/flow enhancers, Cab-0-Sil M5 had the most significant effect on
the mixing time required to obtain constant bulk density. Based on the statistical
model, lactose anhydrous showed optimum flow behavior with 0.25%w/w magnesium
stearate, 1.48%w/w stearic acid and 1.27%w/w Cab-0-Sil M5. The results indicated
that by varying the mixing time and/or relative proportion and type of lubricants/flow
enhancers, it is possible to achieve powder blends with improved flow properties.
Keywords: powder; flow; mixing time; mixtures; lubricant; simplex design; response
surface; optimization; lactose anhydrous; magnesium stearate; stearic acid; silicon
dioxide; Carr.'. s indices.
3
( INTRODUCTION
The design and development of a successful pharmaceutical dosage form
requires complete understanding of the fundamental principles involved in product
development (1-3). For a pharmaceutical powder to be compressed or encapsulated
into uniform solid dosage forms, it is essential that the powder blend have good flow
properties. Poor flow behavior of a powder is related to the high cohesive energies
associated with fine particles and causes problems in the manufacturing of a quality
product ( 4, 5). Cohesive stress, which is the cohesive force per unit surface area, is
smaller for the larger particles. This is the reason why fine particles are more
cohesive, and increasing particle size generally improves flow. Enlargement of
particle size is often done by wet granulation or slugging. The powder flow may also
be improved by altering the particle shape ( 6, 7).
There are many factors which influence the behavior of powders and these
include physical, mechanical and environmental factors (8). Surface energy changes
and elastic deformation properties are two opposing forces that influence the particle
true areas of contact. Electrostatic forces, particle size, shape and size distributions
affect the flow. Environmental factors such as humidity, adsorbed impurities (air,
water etc.), consolidation load and time, direction and rate of shear, and storage
container properties also influence the powder flow. The identification, quantification
and control of these parameters is of importance during the manufacturing where the
production of a uniform product is essential.
There are many published methods to determine powder flow, however due to
many variables associated with powder flow, there is no universally acceptable method
4
developed (9-16). Yet, well-defined experiments are essential to generate reproducible
information so that accurate predictions can be made. Carr (9-11) defined a number of
flow parameters, which are calculated according to a weighting system after their
measurement. The flowability of a powder is evaluated using angle of repose, angle of
spatula, compressibility and cohesion. The overall flowability, angle of fall ,
dispersibility and angle of difference, determine the floodability of a powder. Carr (9-
11) has also provided a detailed procedure whereby indices are deduced for each
floodability parameter indicative of the tendency of a powder to exhibit floodable
flow.
Development of a dosage form is essentially an optimization process. For a
formulator with scarce resources and time constraints, statistical experimental designs
offer excellent means to obtain the . best compromise within the existing constraints
(17, 18). Thus optimization techniques have become essential tools for the formulator
to develop a robust dosage form in short period of time and with fewer resources. A
good design should (i) generate a satisfactory distribution of information throughout
the experimental region, (ii) ensure that the fitted model predicts a value, at all points
in the experimental region that is as close as possible to the true value of the response,
(iii) give good detectability of model lack of fit, and (iv) provide an internal estimate
of the error variance. In the current investigation, simplex design in combination with
response surface methodology was utilized to understand and predict the flow
behavior of mixed powders using Carr' s indices. The objective was to observe the
trends in the flow behavior of lactose anhydrous and predict the optimum levels of
Cab-0-Sil MS, stearic acid and magnesium stearate to obtain the best possible flow.
5
When two or more pharmaceutical materials are mixed together, the resultant
system will exhibit flow properties, which are dependent on the nature of individual
components and their proportion in the mixture. The relationship between the flow
properties of the mixture and the individual components is generally considered to be
linear. However, in practicality the relationship is not always linear. This study will
attempt to elucidate the nature of the relationship among commonly used excipients in
terms of flow properties by a systematic study of flow behavior of powder blends.
Mixing time is another critical parameter that affects the blending process and will
have significant impact on the flow behavior of powders.
The objectives of this study include: i) to determine a simplistic approach to
improve the flow behavior of pharmaceutical powders ii) to study the relationship
between the individual components and their mixed systems iii) to analyze and predict
the flow behavior of a mixed system from the individual components using an
experimental design (iv) to evaluate the effect of mixing time on flow properties of
powder blends and v) to determine the optimum composition of lubricants/flow
enhancers for a mixture to have maximum flow.
6
( METHODOLOGY
Materials
The materials used in this study are lactose anhydrous, NF (Sheffield Products,
USA), magnesium stearate, NF (Mallinckrodt Co., USA), Colloidal Silicone Dioxide
(Cab-0-Sil M5® M5) (Cabot Corp., USA) and stearic acid, NF (Witco Corp. USA).
Methods
Preparation of Powder Blends:
Lactose anhydrous, NF (97%w/w) was mixed with 3%w/w lubricant(s) in a
Kitchen Aid Planetary Mixer. Lubricants evaluated were: magnesium stearate, stearic
acid and Cab-0-Sil M5 MS. T~e relative amounts of lubricants were varied as per the
simplex design described in Table 1. A constant batch size of 500 grams was used for
all the experimental runs. The validity of the design was determined by conducting
three experiments at different points in the lattice model.
Constant Mixing Time: The ingredients were passed through # 30 mesh screen
separately and the screened materials were placed in a Kitchen Aid Planetary Mixer
(Kitchen Aid, Inc., OH) and mixed for three minutes at 94 rpm. A total of ten powder
blends were prepared with varying concentrations of flow enhancers as per the simplex
design described in Table 1. A constant batch size of 500 grams was used for all the
experimental runs.
Variable Mixing Time: The ingredients were passed through # 30 mesh screen
separately and the screened materials were placed in a Kitchen Aid Planetary Mixer.
7
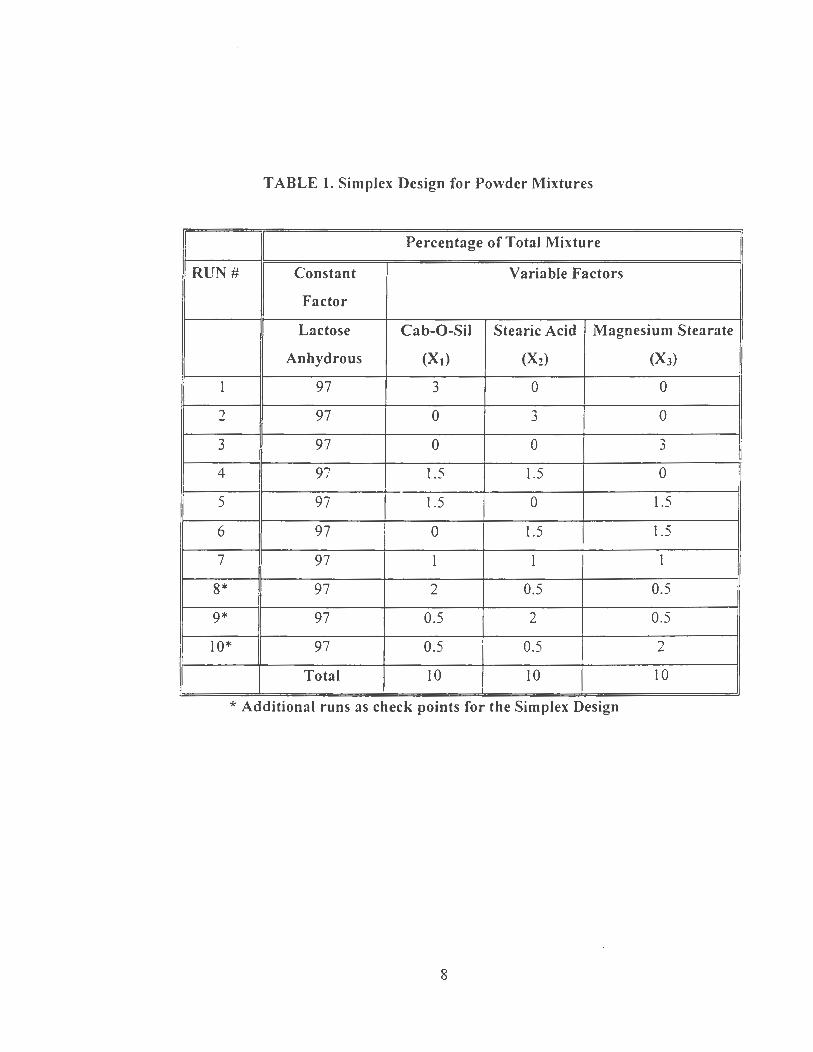
TABLE 1. Simplex Design for Powder Mixtures
Percentage of Total Mixture
RUN# Constant Variable Factors
Factor
Lactose Cab-0-Sil Stearic Acid Magnesium Stearate
Anhydrous (X1) (X2) (X3)
1 97 3 0 0
"') 97 0 3 0
3 97 0 0 3
4 97 1.5 1.5 0
5 97 1.5 0 1.5
6 97 I 0 1.5 1.5
7 97 1 1 1
8* 97 2 0.5 0.5
9* 97 0.5 2 0.5
10* 97 0.5 0.5 2
Total 10 10 10
* Additional runs as check points for the Simplex Design
8
( The contents were mixed at 94 rpm and the bulk density of powder was monitored
after every half a minute of mixing. Mixing was continued until a relatively constant
value for bulk density was achieved. When a constant value for bulk density was
achieved then it was considered that the blend has reached a steady state of mixing.
The powder compositions as per the simplex design in Table 1 were blended until all
the powders have achieved constant values for bulk density.
Evaluation of Powder Blends for Flow Behavior
The mixed powders and individual components were evaluated for powder
characteristics such as bulk density, tapped density, aerated bulk density, packed bulk
density, compressibility index, angle of repose, angle of spatula, angle of fall , angle of
difference, cohesiveness, disp.ersibility, moisture content and particle size distribution.
Bulk and Tapped Density Determination: The weight of powder required to fill 100
mL of graduated cylinder was determined and from which the bulk density was
calculated as the ratio of mass to volume of powder. The tapped density was
calculated from a constant volume of powder achieved after a number of taps using
Tap Density Tester (Van der Kamp, USA).
Flow Characterization: The flow parameters of powders such as aerated bulk
density, packed bulk density, compressibility index, angle of repose, angle of spatula,
angle of fall , angle of difference, cohesion, and dispersibility were determined using a
Hosokawa Powder Tester (Hosokawa Micron Corporation, Japan). The Carr' s indices
9
determining the powder flow properties were calculated (9-11 ). All the measurements
were made in triplicate.
Moisture Content Determination: A powder sample of 2-4 grams was placed on a
Mettler Moisture Determining Balance (Model Mettler LP16, Mettler Corp., USA) and
the sample was heated at 105°C until a constant weight was achieved. The moisture
content was thus determined as the percentage of loss on drying (LOD). The
measurements were made in triplicate.
Particle Size Analysis: The particle size distribution for vanous powders was
determined using a Gilsonic Autosiever (Model GA-6A, Gilson Company Inc. , OH).
The sieves used for this analysis have the following opening sizes: 180µm, 125µm,
90µm , 53µm, 45µm, 32µm, and 20µm. A sample of 5 grams of powder was placed on
the top sieve and after sieving for 5 minutes, the powders retained on each sieve were
weighed. The amounts of powders retained were utilized to determine the geometric
mean particle size of the powder blend.
Data Analysis
A statistical design, namely "Simplex Centroid Design" was utilized in the
present study (19). The points of composition in the simplex were explored in
accordance with a lattice arrangement and the responses were represented by
polynomials (19-22). The design is explained by an equilateral triangle. Each side of
the triangle represents one of the three varying components. Each vertex of the
10
triangle indicates the maximum amount of one component and the minimum amount
of the other two components in the system. Any point inside the triangle corresponds
to a mixture of fixed composition of three variables. Accurate mapping of responses
in a lattice structure is represented by polynomial equations and contour plots. A
polynomial equation correlates the measured properties (responses) with the
formulation compositions (factors). Coefficients in the polynomials are simple
functions of the measured responses at the lattice points. Using these polynomial
equations from the data collected, the properties of the mixed systems are evaluated.
The special cubic design is described by the following equation (19):
Y = b1 X1 + b1 X2 + b3 X3 + b12 X1X2 + bn X1X3 + b13 X2X3 + bm X1X2X3
where X1 = Cab-0-Sil M5, X2 = Stearic Acid, X3 =Magnesium Stearate
b1 .... b123 =Regression Coefficients
The graphical representation of a polynomial equation is the response surface
or contour plot. The response variables such as flow characteristics, mean particle size
and moisture content were fitted using a special cubic model. The response surface
contour plots were obtained for each flow parameter as a function of varying amounts
of flow enhancers. The statistical software package, 'Statgraphics®plus (23) was
utilized to analyze the data.
In order to determine whether the relationship between the powder properties
of individual components and their mixtures was linear or not, the theoretical values
for the flow properties of the mixtures were determined assuming a linear relationship
11
and these values were compared with actual measured values for flow properties of
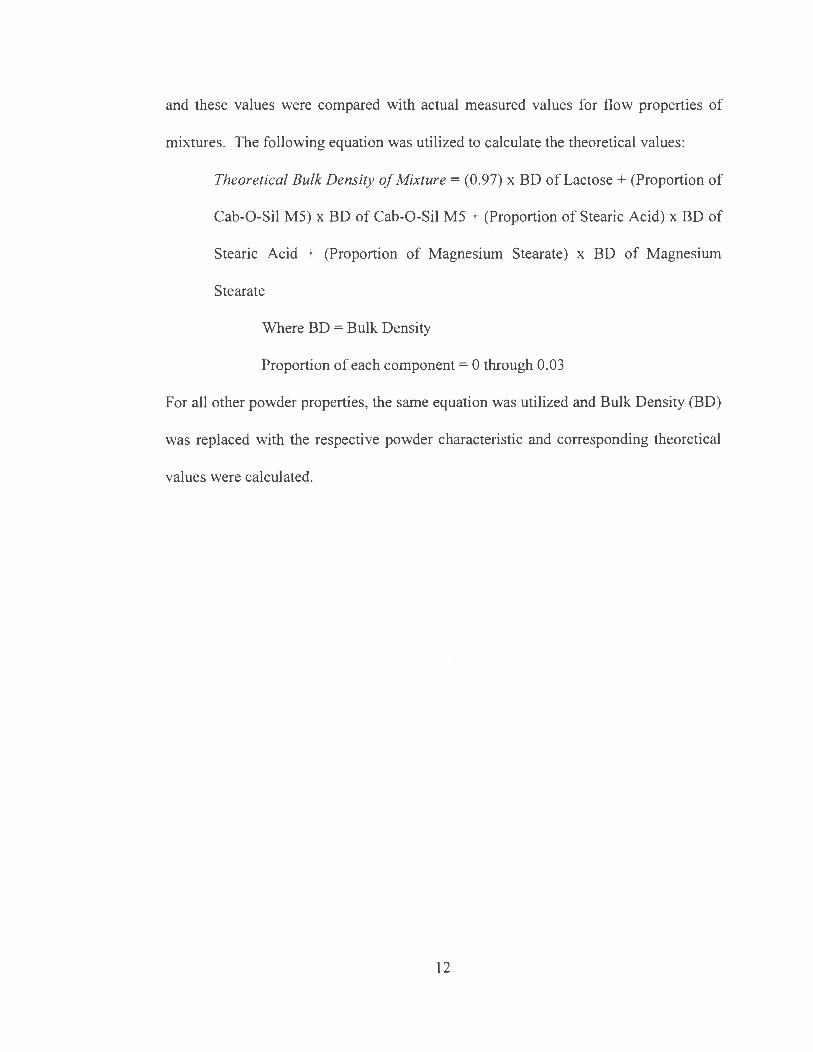
mixtures. The following equation was utilized to calculate the theoretical values:
Theoretical Bulk Density of Mixture = (0.97) x BD of Lactose + (Proportion of
Cab-0-Sil M5) x BD of Cab-0-Sil M5 + (Proportion of Stearic Acid) x BD of
Stearic Acid + (Proportion of Magnesium Stearate) x BD of Magnesium
Stearate
Where BD =Bulk Density
Proportion of each component = 0 through 0.03
For all other powder properties, the same equation was utilized and Bulk Density (BD)
was replaced with the respective powder characteristic and corresponding theoretical
values were calculated.
12
RESULTS AND DISCUSSION
The individual components of the blends were evaluated for flow properties
prior to conducting the experiments as per the experimental design. The data is
provided in Table 2. The powder characteristics of the blends prepared with a constant
mix time are summarized in Tables 3 and 4. The powder properties of the blends
prepared using variable mix times to achieve constant bulk density are provided in
Tables 5 and 6. For all parameters, the theoretical values for different blends were
calculated asswning a linear relationship between the individual excipients and the
mixtures. These values are summarized in Tables 3, 4, 5 and 6. The regression
coefficients that would describe the polynomial equations defining the contour
surfaces are summarized in Tables 7 and 8. The summary of testing performed on lack
of fit model for constant mix time is provided in Table 9. Table I 0 describes the
optimization process and the constraints imposed on the model. The predicted flow
values for optimized formulation composition are provided in Table 11. In order to
determine whether any trends existed in the flow behavior, contour plots for varying
compositions of stearic acid, magnesiwn stearate and Cab-0-Sil MS in lactose blends
were provided in Figures I through 12.
One of the critical parameters that interest formulators is the flowability of the
powder formulations (14, 16, 24). The processability of these blends is markedly
affected by flowability concerns, since the materials need to be moved from one place
to another. For example, encapsulation and/or tabletting on high-speed machines are
only possible when the powder can be fed at higher rates.
13
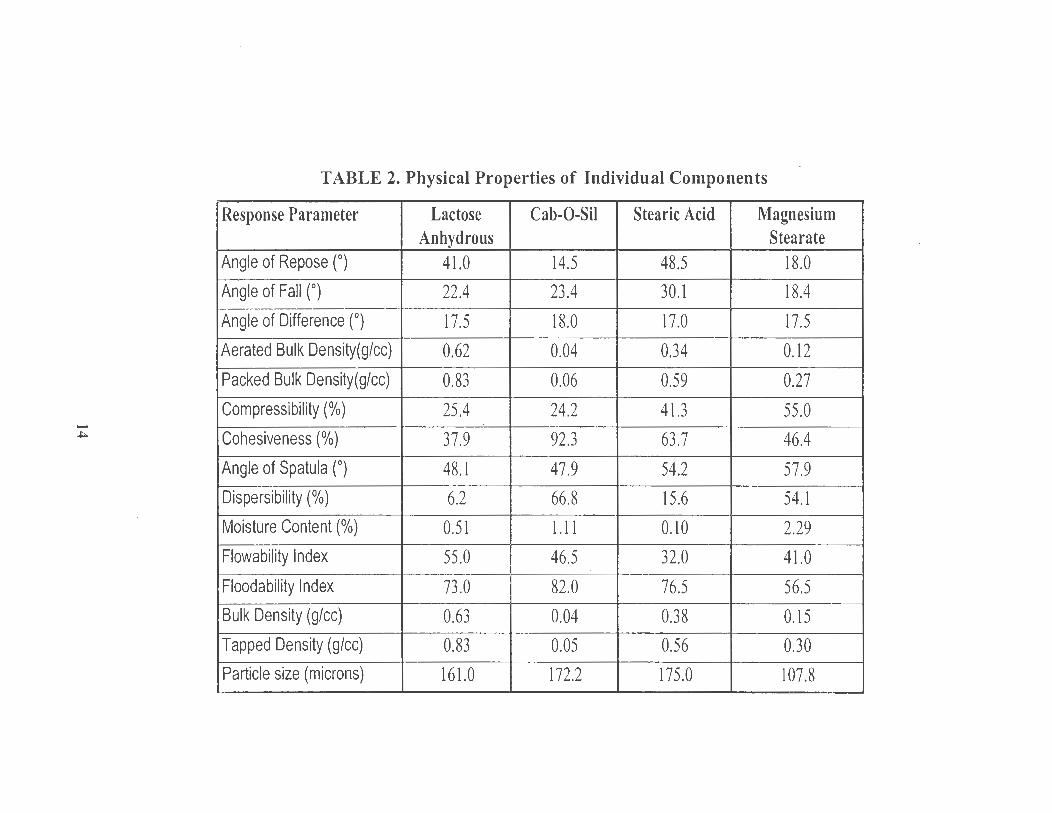
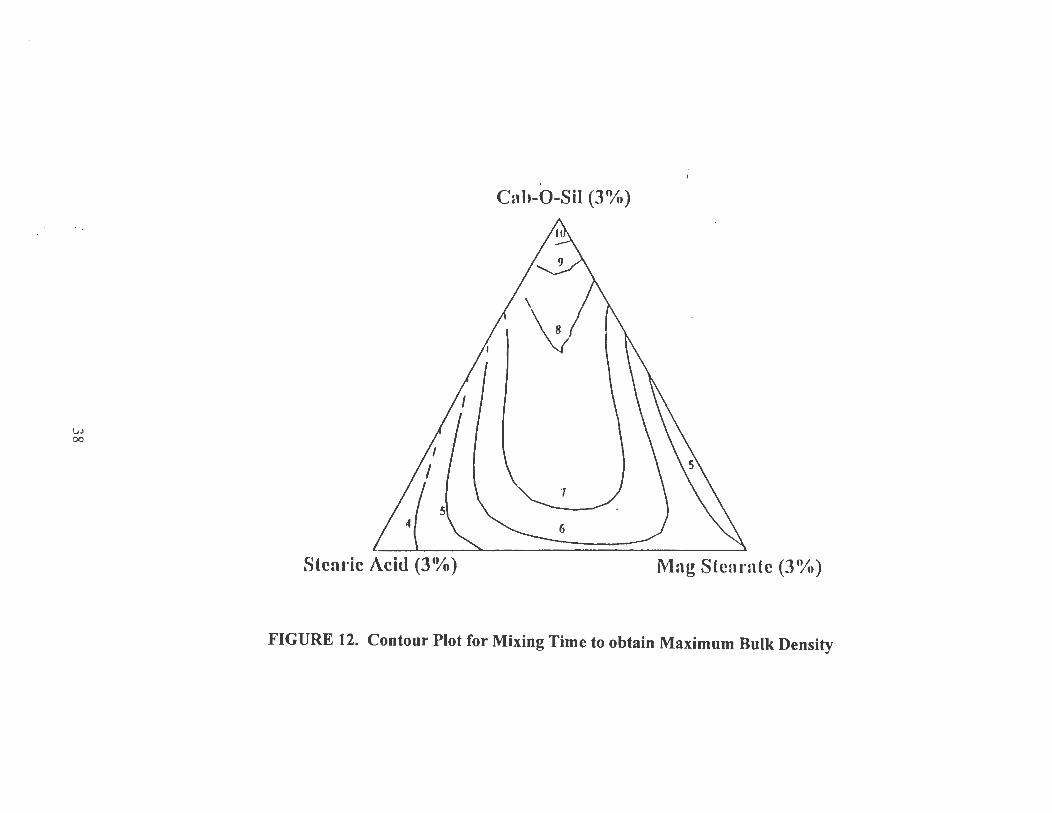
TABLE 2. Physical Properties of Individual Components
Response Parameter Lactose Cab-0-Sil Stearic Acid Magnesium Anhydrous Stearate
Angle of Repose (°) 41.0 14.5 48.5 18.0
Angle of Fall (°) 22.4 23.4 30.1 18.4
Angle of Difference (0) 17.5 18.0 17.0 17.5
Aerated Bulk Density(glcc) 0.62 0.04 0.34 0.12
Packed Bulk Density(glcc) 0.83 0.06 0.59 0.27
Compressibility(%) 25.4 24.2 41.3 55.0 -+:>. Cohesiveness(%) 37.9 92.3 63.7 46.4
Angle of Spatula (0) 48.1 47.9 54.2 57.9
Dispersibility (%) 6.2 66.8 15.6 54.1
Moisture Content(%) 0.51 1.11 0.10 2.29
Flowability Index 55.0 46.5 32.0 41.0
Floodability Index 73.0 82.0 76.5 56.5
Bulk Density (glee) 0.63 0.04 0.38 0.15 Tapped Density (glee) 0.83 0.05 0.56 0.30 Particle size (microns) 161.0 172.2 175.0 107.8
-Vi
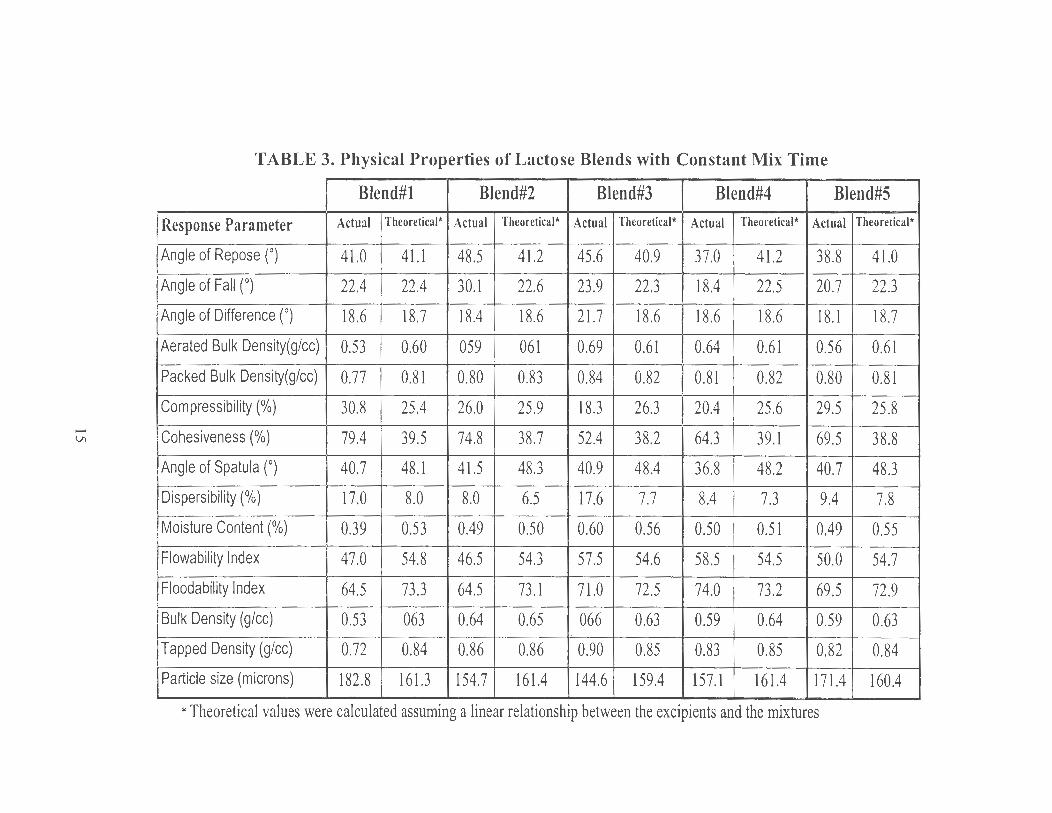
TABLE 3. Physical Properties of Lactose Blends with Constant Mix Time
Blend#l Blend#2 Blend#3 Blend#4 Blend#S
Response Parameter Actual Theoretical* Actual Theoretical* Actual Theoretical* Actual Theoretical* Actual Theoretical*
Angle of Repose (0) 41.0 41.1 48.5 41.2 45.6 40.9 37.0 41.2 38.8 41.0
Angle of Fall (°) 22.4 22.4 30.1 22.6 23.9 22.3 18.4 22.5 20.7 22.3
Angle of Difference (0) 18.6 18.7 18.4 18.6 21.7 18.6 18.6 18.6 18.1 18.7
Aerated Bulk Density(glcc) 0.53 0.60 059 061 0.69 0.61 0.64 0.61 0.56 0.61
Packed Bulk Density(glcc) 0.77 0.81 0.80 0.83 0.84 0.82 0.81 0.82 0.80 0.81
Compressibility(%) 30.8 25.4 26.0 25.9 18.3 26.3 20.4 25.6 29.5 25.8
Cohesiveness (%) 79.4 39.5 74.8 38.7 52.4 38.2 64.3 39.1 69.5 38.8
Angle of Spatula (0) 40.7 48.l 41.5 48.3 40.9 48.4 36.8 48.2 40.7 48.3
Dispersibility (%) 17.0 8.0 8.0 6.5 17.6 7.7 8.4 7.3 9.4 7.8
Moisture Content(%) 0.39 0.53 0.49 0.50 0.60 0.56 0.50 0.51 0.49 0.55
Flowability Index 47.0 54.8 46.5 54.3 57.5 54.6 58.5 54.5 50.0 54.7
Floodability Index 64.5 73.3 64.5 73.1 71.0 72.5 74.0 73.2 69.5 72.9
Bulk Density (glee) 0.53 063 0.64 0.65 066 0.63 0.59 0.64 0.59 0.63
Tapped Density (glee) 0.72 0.84 0.86 0.86 0.90 0.85 0.83 0.85 0.82 0.84
Particle size (microns) 182.8 161.3 154.7 161.4 144.6 159.4 157.1 161.4 171.4 160.4
*Theoretical values were calculated assuming a linear relationship. between the excipients and the mixtures
~
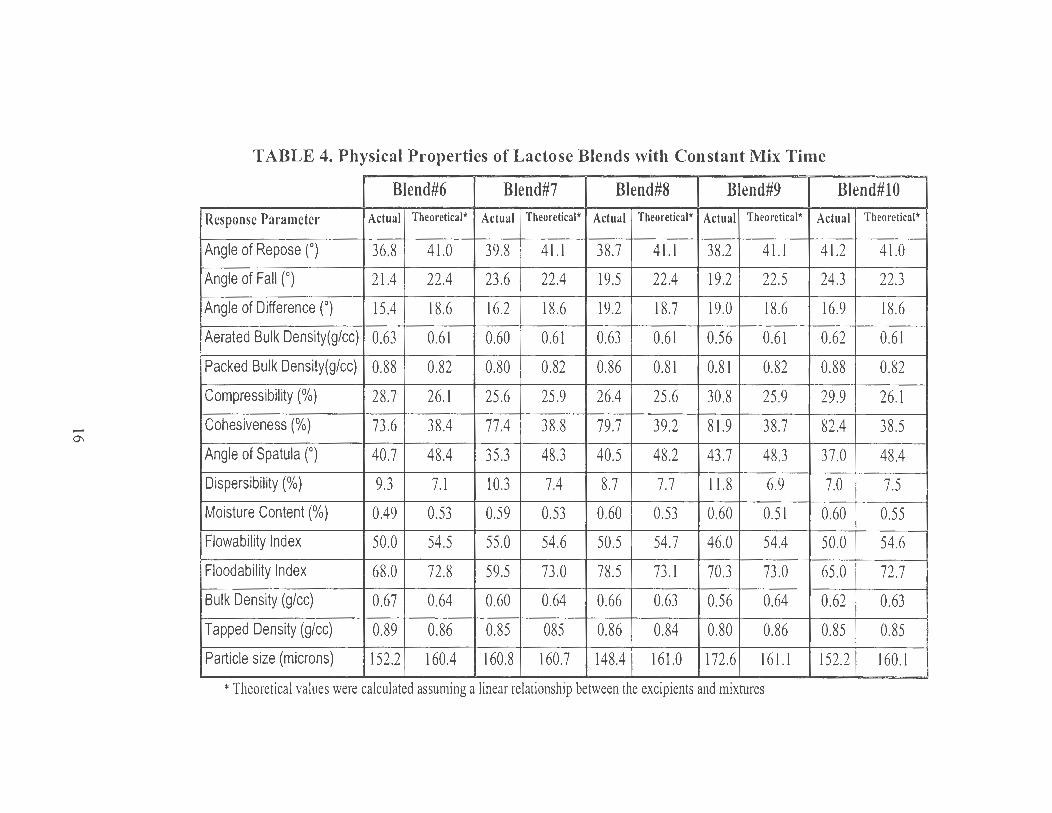
TABLE 4. Physical Properties of Lactose Blends with Constant Mix Time
Blend#6 Blend#7 Blend#8 Blend#9 Blend#lO
Response Parameter Actual Theoretical* Actual Theoretical* Actual Theoretical* Actual Theoretical* Actual Theoretical*
Angle of Repose (0) 36.8 41.0 39.8 41.l 38.7 41.1 38.2 41.1 41.2 41.0
Angle of Fall (°) 21.4 22.4 23.6 22.4 19.5 22.4 19.2 22.5 24.3 22.3
Angle of Difference (0) 15.4 18.6 16.2 18.6 19.2 18.7 19.0 18.6 16.9 18.6
Aerated Bulk Density(glcc) 0.63 0.61 0.60 0.61 0.63 0.61 0.56 0.61 0.62 0.61
Packed Bulk Density(glcc) 0.88 0.82 0.80 0.82 0.86 0.81 0.81 0.82 0.88 0.82
Compressibility(%) 28.7 26.l 25.6 25.9 26.4 25.6 30.8 25.9 29.9 26.1
- Cohesiveness(%) 73.6 38.4 77.4 38.8 79.7 39.2 81.9 38.7 82.4 38.5 °' Angle of Spatula (°) 40.7 48.4 35.3 48.3 40.5 48.2 43.7 48.3 37.0 48.4
Dispersibility (%) 9.3 7.1 l 0.3 7.4 8.7 7.7 11.8 6.9 7.0 7.5
Moisture Content (%) 0.49 0.53 0.59 0.53 0.60 0.53 0.60 0.51 0.60 0.55
Flowability Index 50.0 54.5 55.0 54.6 50.5 54.7 46.0 54.4 50.0 54.6
Floodability Index 68.0 72.8 59.5 73.0 78.5 73. l 70.3 73.0 65.0 72.7
Bulk Density (glee) 0.67 0.64 0.60 0.64 0.66 0.63 0.56 0.64 0.62 0.63
Tapped Density (glee) 0.89 0.86 0.85 085 0.86 0.84 0.80 0.86 0.85 0.85
Particle size (microns) 152.2 160.4 160.8 160.7 148.4 161.0 172.6 161.1 152.2 160. l
*Theoretical values were calculated assuming a linear relationship between the excipients and mixtures
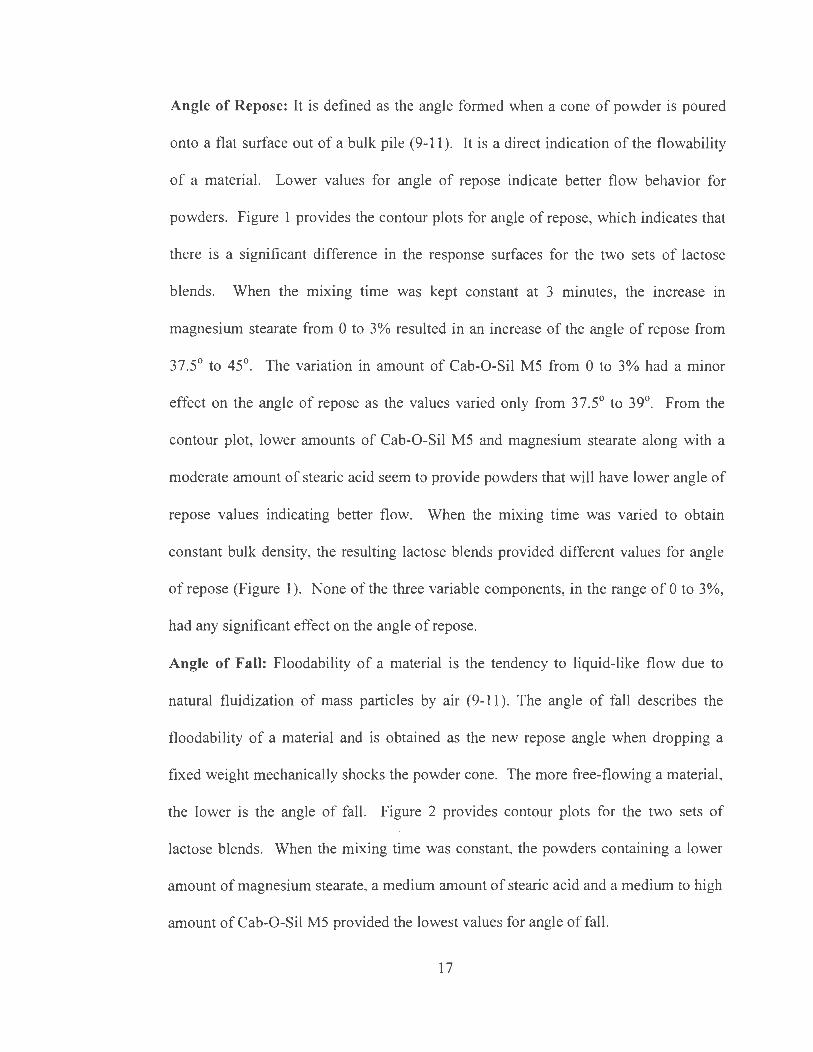
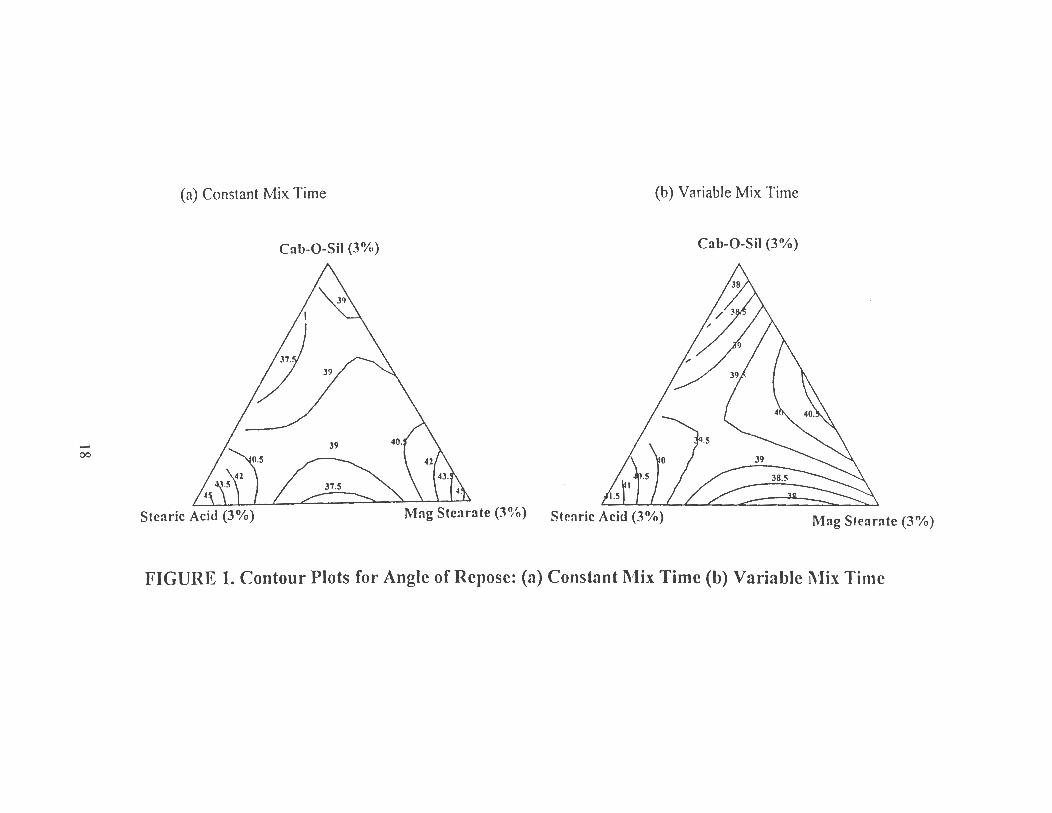
( Angle of Repose: It is defined as the angle formed when a cone of powder is poured
onto a flat surface out of a bulk pile (9-11 ). It is a direct indication of the flowability
of a material. Lower values for angle of repose indicate better flow behavior for
powders. Figure 1 provides the contour plots for angle of repose, which indicates that
there is a significant difference in the response surfaces for the two sets of lactose
blends. When the mixing time was kept constant at 3 minutes, the increase in
magnesium stearate from 0 to 3% resulted in an increase of the angle of repose from
37.S0 to 4S 0• The variation in amount of Cab-0-Sil MS from 0 to 3% had a minor
effect on the angle of repose as the values varied only from 37.S0 to 39°. From the
contour plot, lower amounts of Cab-0-Sil MS and magnesium stearate along with a
moderate amount of stearic acid seem to provide powders that will have lower angle of
repose values indicating better flow. When the mixing time was varied to obtain
constant bulk density, the resulting lactose blends provided different values for angle
of repose (Figure 1 ). None of the three variable components, in the range of 0 to 3%,
had any significant effect on the angle of repose.
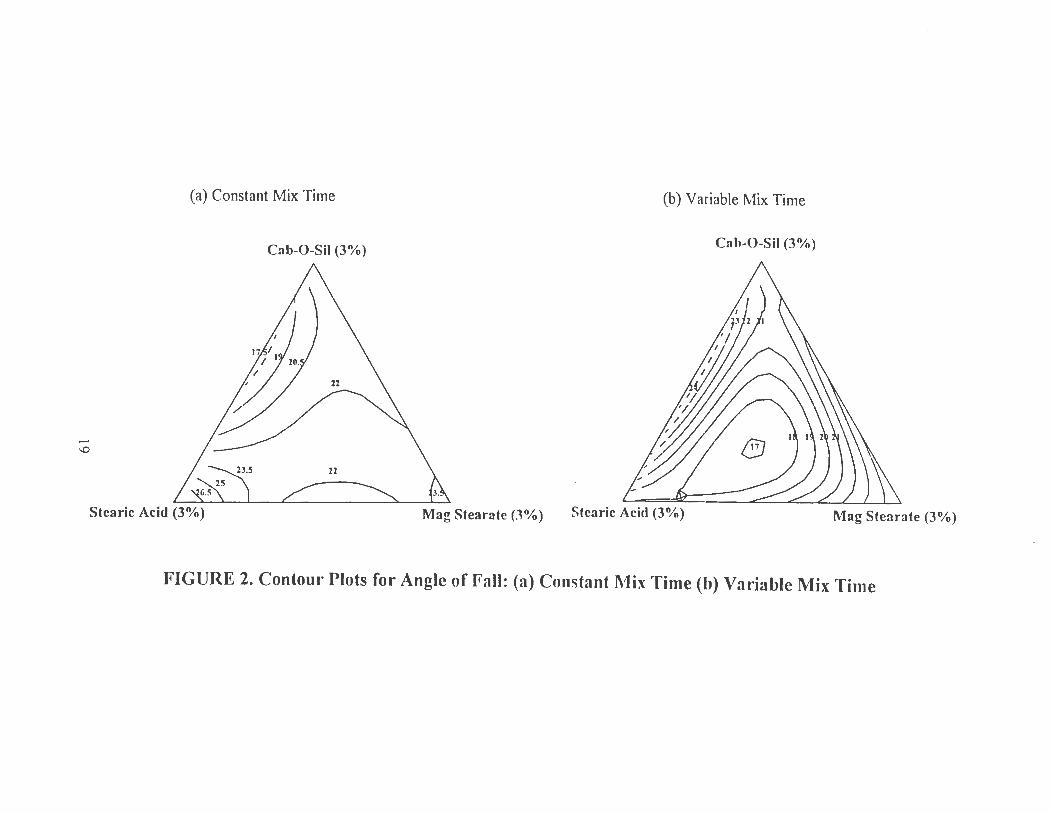
Angle of Fall: Floodability of a material is the tendency to liquid-like flow due to
natural fluidization of mass particles by air (9-11 ). The angle of fall describes the
floodability of a material and is obtained as the new repose angle when dropping a
fixed weight mechanically shocks the powder cone. The more free-flowing a material,
the lower is the angle of fall. Figure 2 provides contour plots for the two sets of
lactose blends. When the mixing time was constant, the powders containing a lower
amount of magnesium stearate, a medium amount of stearic acid and a medium to high
amount of Cab-0-Sil MS provided the lowest values for angle of fall.
17
....... 00
--..._
(a) Constant Mix Time (b) Variable Mix Time
Cab-0-Sil (3°/.,) Cab-0-Sil (3%)
Stc:iric Acid (3%) Mag Stcarate (3%) Ste:iric Acid (3%) Mag Stearate (3%)
FIGURE 1. Contour Plots for Angle of Repose: (a) Constant l\ilix Time (b) Variable l\'lix Time
,-."
(a) Constant Mix Time (b) Variable Mix Time
Cab-0-Sil (3%) Cah-0-Sil (3%)
...... \0
Stearic Acid (3%) Mag Stearate (.1%) Stearic Acicl (3%) Mag Stearate (3%)
FIGURE 2. Contour Plots for Angle of Fall: (a) Constant l\1ix Time (h) Variable Mix Time
When the mixing time was varied to obtain constant bulk density, a minimum value of
17° was observed for angle of fall at moderate levels of all the three components that
comprise the simplex design. The model predicts that at this composition, the lactose
blend will have maximum floodability.
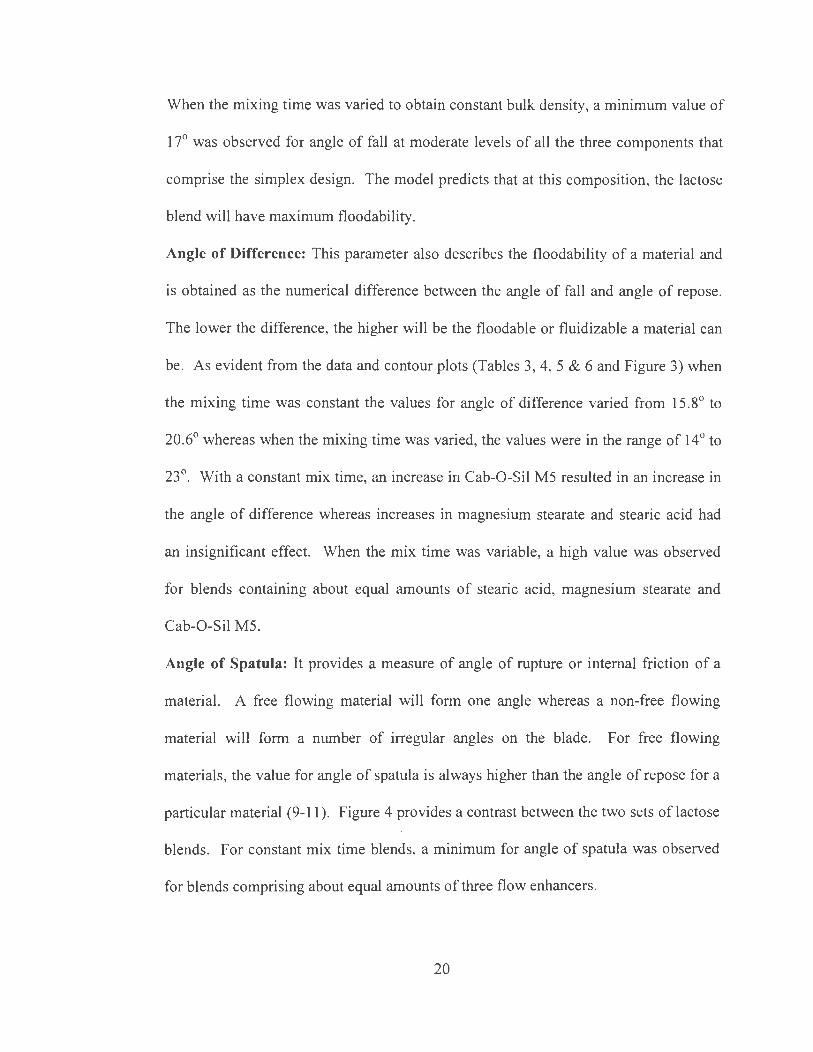
Angle of Difference: This parameter also describes the floodability of a material and
is obtained as the numerical difference between the angle of fall and angle of repose.
The lower the difference, the higher will be the floodable or fluidizable a material can
be. As evident from the data and contour plots (Tables 3, 4, S & 6 and Figure 3) when
the mixing time was constant the values for angle of difference varied from lS.8° to
20.6° whereas when the mixing time was varied, the values were in the range of 14° to
23°. With a constant mix time, an increase in Cab-0-Sil MS resulted in an increase in
the angle of difference whereas increases in magnesium stearate and stearic acid had
an insignificant effect. When the mix time was variable, a high value was observed
for blends containing about equal amounts of stearic acid, magnesium stearate and
Cab-0-Sil MS.
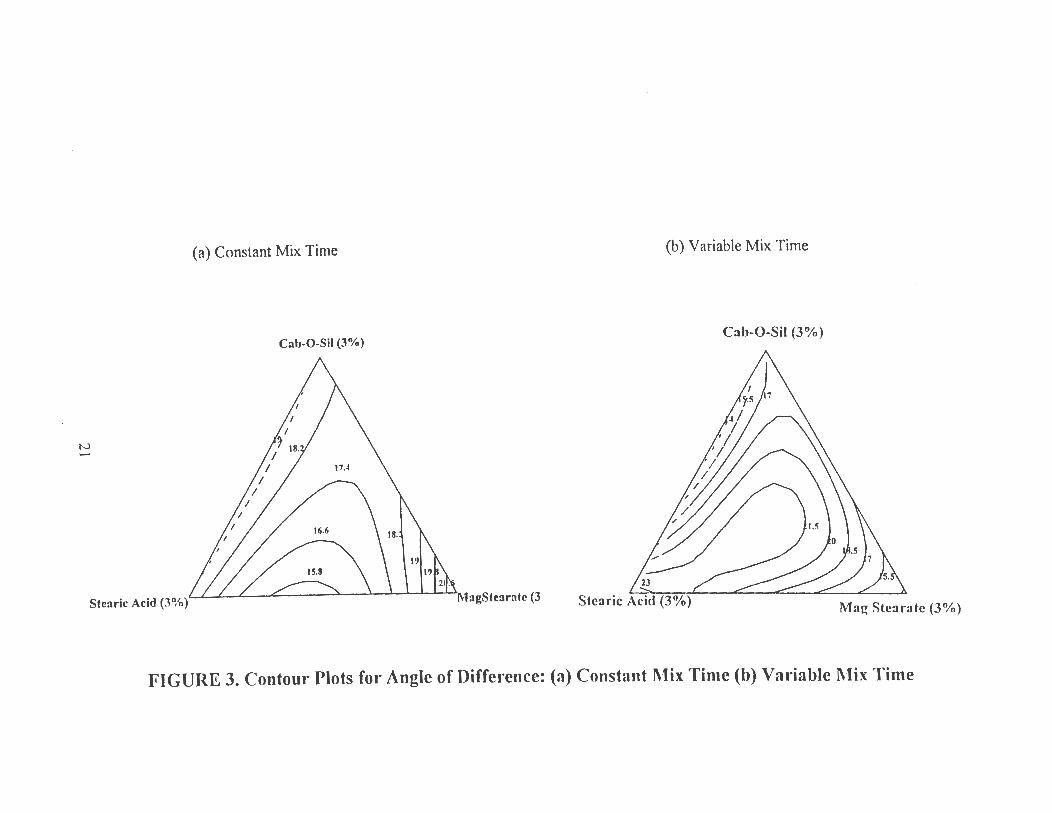
Angle of Spatula: It provides a measure of angle of rupture or internal friction of a
material. A free flowing material will form one angle whereas a non-free flowing
material will form a number of irregular angles on the blade. For free flowing
materials, the value for angle of spatula is always higher than the angle of repose for a
particular material (9-11 ). Figure 4 provides a contrast between the two sets of lactose
blends. For constant mix time blends, a minimum for angle of spatula was observed
for blends comprising about equal amounts of three flow enhancers.
20
-
(a) Constant Mix Time (b) Variable Mix Time
Cab-0-Sil (3%) Cab-0-Sil (3%)
N ......
Stearic Acid (3%) agStearate (3 Mag Stearatc (3%)
FIGURE 3. Contour Plots for Angle of Difference: (a) Constant 1\1ix Time (b) Variable l\lix Time
N N
~
(a) Constant Mix Time (b) Variable Mix Time
Cab-0-Sil (3%) Cab-0-Sil (3%)
Stearic Acid (3%) Mag Stcarnte (3%) Stcaric Acid (3%) Mag Stearate (3%)
FIGURE 4. Contour Plots for Angle of Spatula: (a) Constant l\ilix Time (h) Variable Mix Time
( For the same composition, when the mixing time was variable, a maximum was
observed in the contour plot indicating that mixing times have an effect on the values
observed for angle of spatula (Figure 4).
Bulk Density & Tapped Density: These are important micromeritic parameters in
determining the flow of a powder. They are useful for determining the feed range
calculations, mixer loading capacity and hopper or bin capacity (25 , 40). Bulk density
is the ratio of mass to volume. The bulk & tapped density values for individual
excipients are summarized in Table 2. In this investigation an attempt was made to
determine whether the relationship between the flow properties of individual
components and those of mixtures is linear or not. The theoretical values were
calculated usir..g equation described in Data Analysis section. The theoretical values
for different blends were calculated assuming a linear relationship between the
bulk/tapped density of excipients and that of mixtures. When the mixing time was
kept constant (3 min) the theoretical density values were found to be higher than the
actual values in some cases and for others, the values remained the same (Tables 3&4).
When the mixing time was varied till constant bulk density was obtained for blends,
all the theoretical values were found to be significantly lower than the actual values
(Tables 5&6).
Aerated Bulk Density: This is also known as loose bulk density (9-11 ). This gives an
indication of air entrapped in the powder. From the contour plot (Figure 5) for lactose
blends mixed for 3 minutes, as the amount of stearic acid was increased from 0% to
3%, the aerated bulk density increased from 0.54 to 0.64 g/mL. The high values for
aerated bulk density were seen when the magnesium stearate is at 3%.
23
N -+::>.
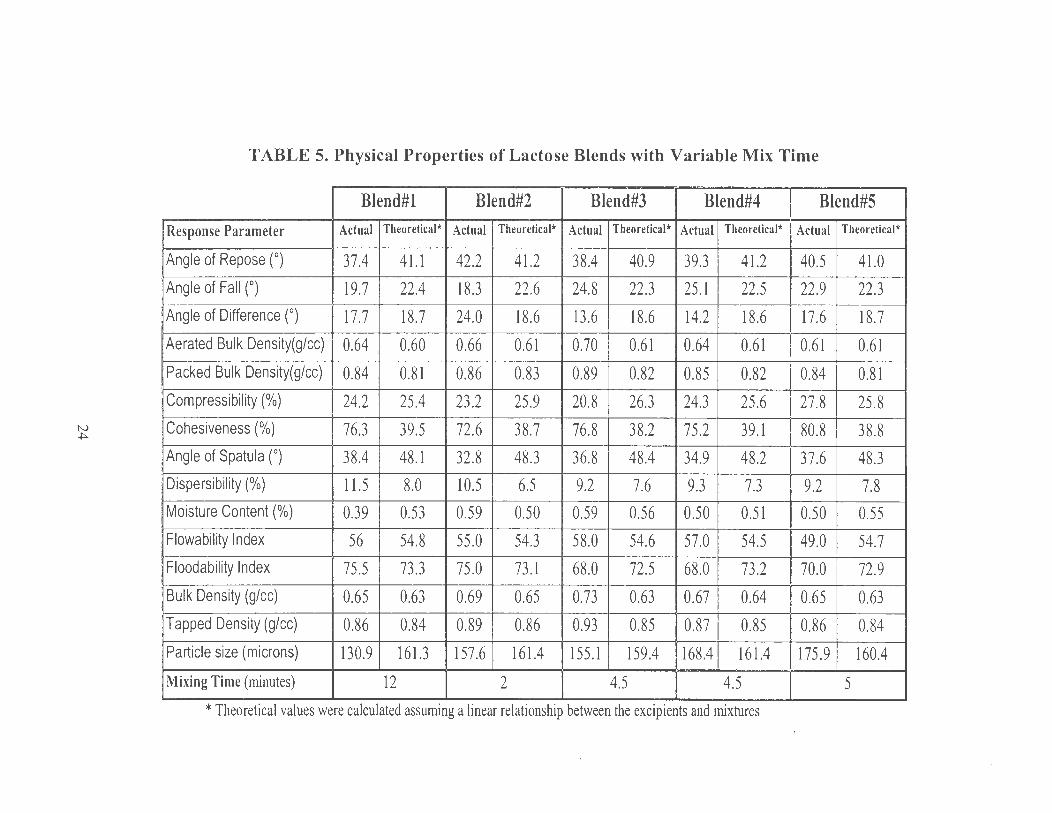
TABLE 5. Physical Properties of Lactose Blends with Variable Mix Time
Blend#l Blend#2 Blend#3 Blend#4 Blend#S
Response Parameter Actual Theoretical* Actual Theoretical* Actual Theoretical* Actual Theoretical* Actual Theoretical*
Angle of Repose (0) 37.4 41.1 42.2 41.2 38.4 40.9 39.3 41.2 40.5 41.0
Angle of Fall (0) 19.7 22.4 18.3 22.6 24.8 22.3 25.1 22.5 22.9 22.3
Angle of Difference (0) 17.7 18.7 24.0 18.6 13.6 18.6 14.2 18.6 17.6 18.7
Aerated Bulk Density(glcc) 0.64 0.60 0.66 0.61 0.70 0.61 0.64 0.61 0.61 0.61
Packed Bulk Density(glcc) 0.84 0.81 0.86 0.83 0.89 0.82 0.85 0.82 0.84 0.81 Compressibility(%) 24.2 25.4 23.2 25.9 20.8 26.3 24.3 25.6 27.8 25.8 Cohesiveness (%) 76.3 39.5 72.6 38.7 76.8 38.2 75.2 39.1 80.8 38.8 Angle of Spatula (0
) 38.4 48.1 32.8 48.3 36.8 48.4 34.9 48.2 37.6 48.3 Dispersibility (%) 11.5 8.0 10.5 6.5 9.2 7.6 9.3 7.3 9.2 7.8 Moisture Content(%) 0.39 0.53 0.59 0.50 0.59 0.56 0.50 0.51 0.50 0.55 Flowability Index 56 54.8 55.0 54.3 58.0 54.6 57.0 54.5 49.0 54.7 Floodability Index 75.5 73.3 75 .0 73.1 68.0 72.5 68.0 73.2 70.0 72.9
Bulk Density (glee) 0.65 0.63 0.69 0.65 OJ3 0.63 0.67 0.64 0.65 0.63 Tapped Density (glee) 0.86 0.84 0.89 0.86 0.93 0.85 0.87 0.85 0.86 0.84
Particle size (microns) 130.9 161.3 157.6 161.4 155.1 159.4 168.4 161.4 175.9 160.4
Mixing Time (minutes) 12 2 4.5 4.5 5
* Theoretical values were calculated assuming a linear relationship between the excipients and mixtures
N VI
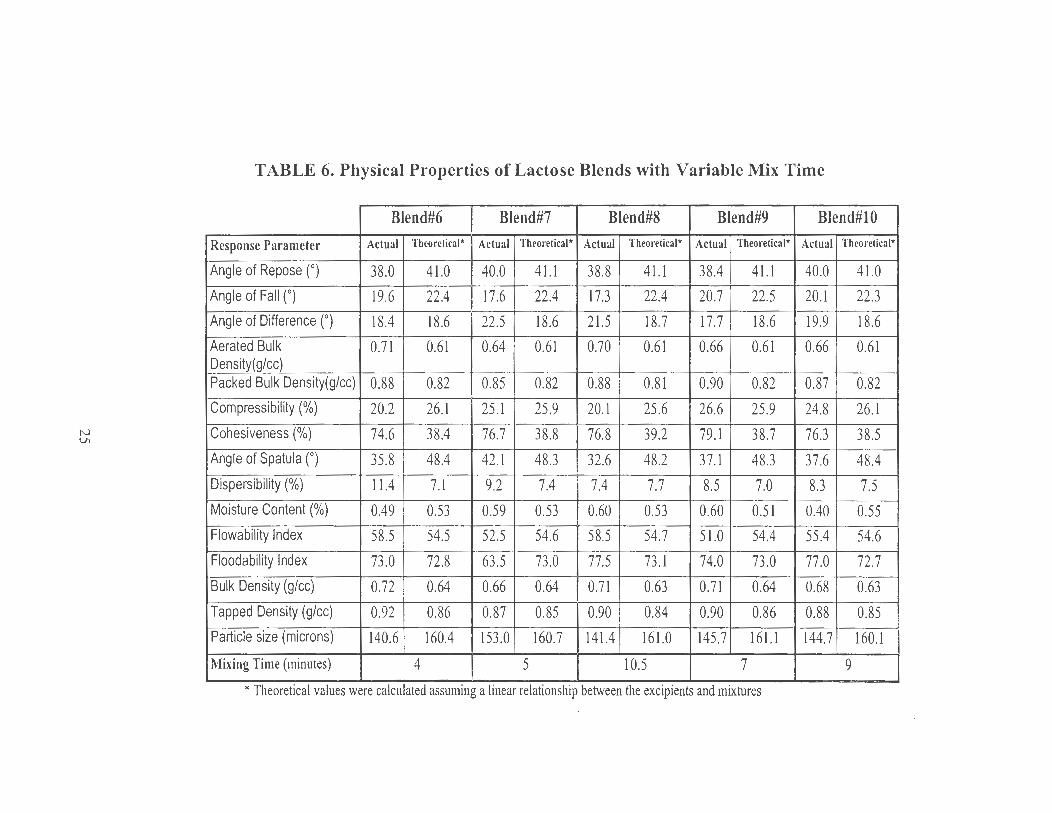
TABLE 6. Physical Properties of Lactose Blends with Variable Mix Time
Blend#6 Blend#7 Blend#8 Blend#9 Blend#lO
Response Parameter Actual Theoretical* Actual Theoretical* Actual Theoretical* Actual Theoretical* Actual Theoretical*
Angle of Repose (°) 38.0 41.0 40.0 41.1 38.8 41.1 38.4 41.1 40.0 41.0
Angle of Fall (0) 19.6 22.4 17.6 22.4 17.3 22.4 20.7 22.5 20. l 22.3
Angle of Difference (°) 18.4 18.6 22.5 18.6 21.5 18.7 17.7 18.6 19.9 18.6
Aerated Bulk 0.71 0.61 0.64 0.61 0.70 0.61 0.66 0.61 0.66 0.61 Density(glcc) Packed Bulk Density(glcc) 0.88 0.82 0.85 0.82 0.88 0.81 0.90 0.82 0.87 0.82
Compressibility(%) 20.2 26.l 25 .1 25.9 20.1 25.6 26.6 25.9 24.8 26.1
Cohesiveness(%) 74.6 38.4 76.7 38.8 76.8 39.2 79.1 38.7 76.3 38.5
Angle of Spatula (0) 35.8 48.4 42.1 48.3 32.6 48.2 37.1 48.3 37.6 48.4
Dispersibility (%) 11.4 7.1 9.2 7.4 7.4 7.7 8.5 7.0 8.3 7.5
Moisture Content(%) 0.49 0.53 0.59 0.53 0.60 0.53 0.60 0.51 0.40 0.55
Flowability Index 58.5 54.5 52.5 54.6 58.5 54.7 51.0 54.4 55.4 54.6
Floodability Index 73.0 72.8 63.5 73.0 77.5 73.1 74.0 73.0 77.0 72.7
Bulk Density (glee) 0.72 0.64 0.66 0.64 0.71 0.63 0.71 0.64 0.68 0.63
Tapped Density (glee) 0.92 0.86 0.87 0.85 0.90 0.84 0.90 0.86 0.88 0.85
Particle size (microns) 140.6 160.4 153.0 160.7 141.4 161.0 145.7 161.1 144.7 160.1
Mixing Time (minutes) 4 5 10.5 7 9
* Theoretical values were calculated assuming a linear relationship between the excipients and mixtures
N 0\
(a) Constant Mix Time (b) Variable Mix Time
Cab-0-Sil (3%) Cab-0-Sil (3%)
Stearic Acid (3%) Mag Stearate (3%) Stcaric Acid (3%) Mag Stearate (3%)
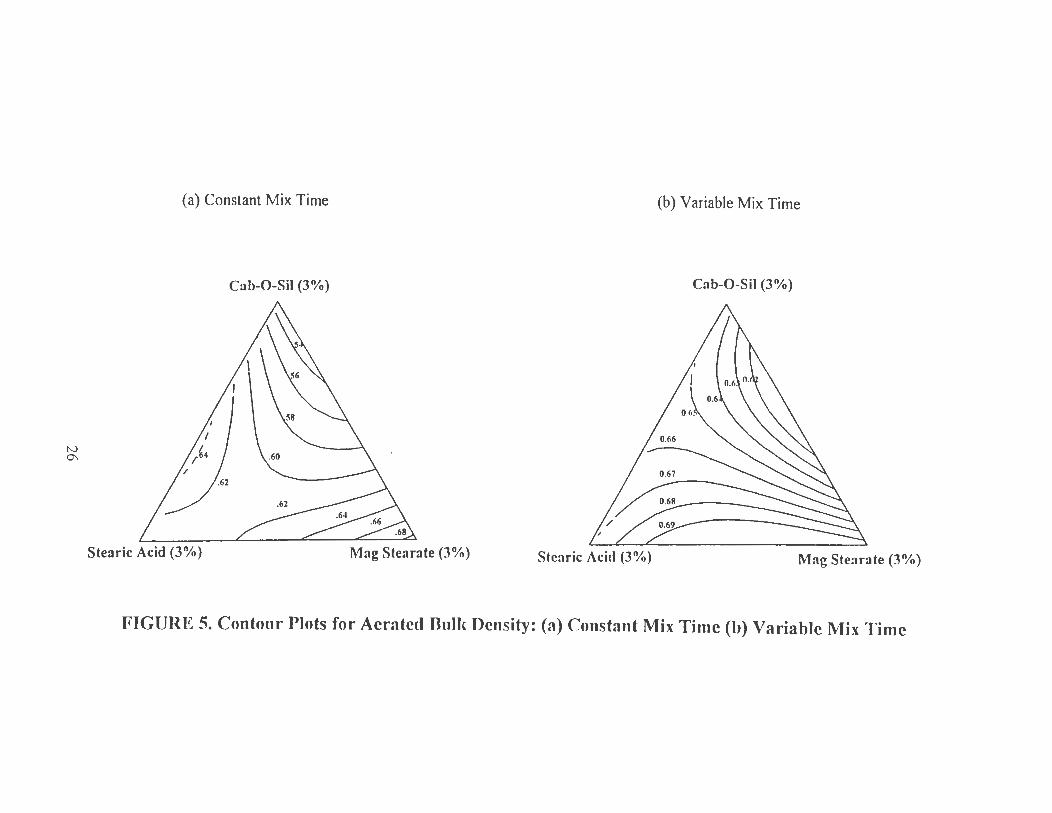
FIGURE 5. Contour Plots for Aerated nulk Density: (a) Constant Mix Time (h) Variable Mix Time
,--.
( It is clearly evident that Cab-0-Sil M5 had inverse effect on aerated bulk density
(Figure 5). When the mixing times were varied, higher values were observed at low
levels of Cab-0-Sil M5 and higher levels of stearic acid and magnesium stearate
(Figure 5).
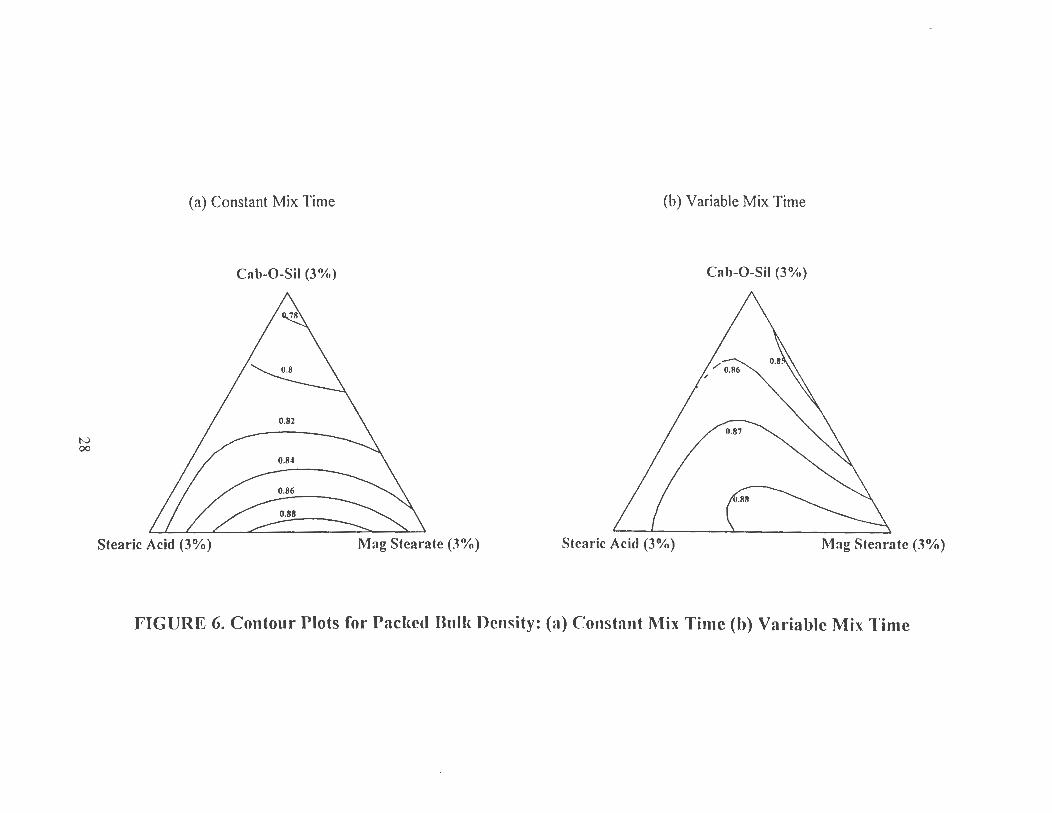
Packed Bulk Density: This parameter provides useful information on the compacting
strength of a material that may occur in the hopper (9-11 ). From the contour plot
(Figure 6) for blends that were mixed for constant time, Cab-0-Sil M5 had an inverse
effect on the packed bulk density whereas stearic acid and magnesium stearate had a
minor effect on the density values. When the mixing times were varied, the Cab-0-Sil
M5 still had the same inverse effect on bulk density (Figure 6). The packed density
values increased with an increase in magnesium stearate and the amount of stearic acid
in the blend had insignificant effect.
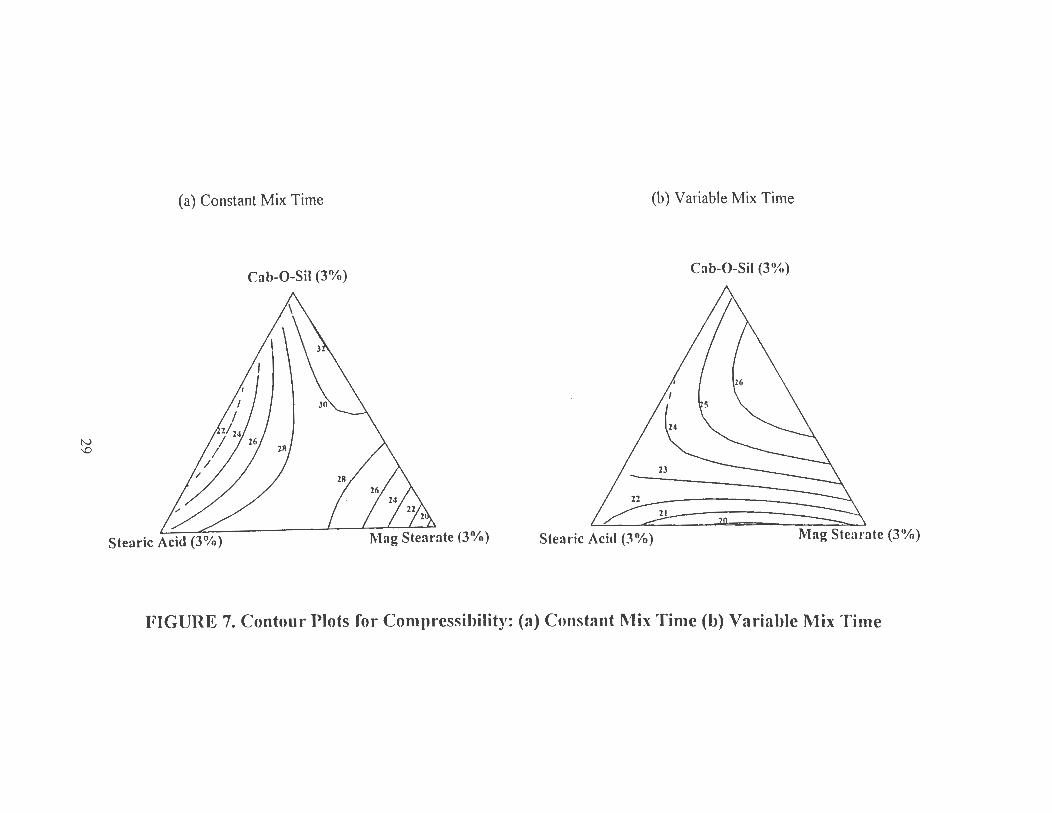
Compressibility: This is obtained from aerated and packed bulk densities and
provides an excellent measure on compactibility of materials. The more compressible
a material is, the less flowable it will be (9-11) . Tables 2, 3, 4, 5&6 provide the values
for compressibility of various lactose blends and Figure 7 provides the trends noticed
by varying the compositions of the flow enhancers from 0 to 3%. When the mixing
time was kept constant, magnesium stearate provided lower values for compressibility
when incorporated in small amounts (0-0.5%) or in high amounts (- 3%). At moderate
amounts it resulted in high values for compressibility. Stearic acid had the inverse
effect on the compressibility values. When the mixing times were varied, significantly
lower values for compressibility were observed. Stearic acid had the inverse effect
27
N 00
--..._
(a) Constant Mix Time (b) Variable Mix Time
Cab-0-Sil (3°/ii) Cab-0-Sil (3%)
Stearic Acid (3%) Mag Stearate (3%) Stearic Acid (3%) Mag Stearate (3%)
FIGURE 6. Contour Plots for Paclced Bulk Density: (a) Constant l\1ix Time (b) Variable Mix Time
N \0
-,
(a) Constant Mix Time (b) Variable Mix Time
Cab-0-Sil (3%) Cab-0-Sil (3%)
Stearic Acid (3%) Stearic Acid (3%) Mag Stearate (3%)
FIGURE 7. Contour Plots for Compressibility: (a) Constant Mix Time (b) Variable Mix Time
_,
and a significant difference in the effect of magnesium stearate on compressibility was
observed when compared to the constant mix blends (Figure 7).
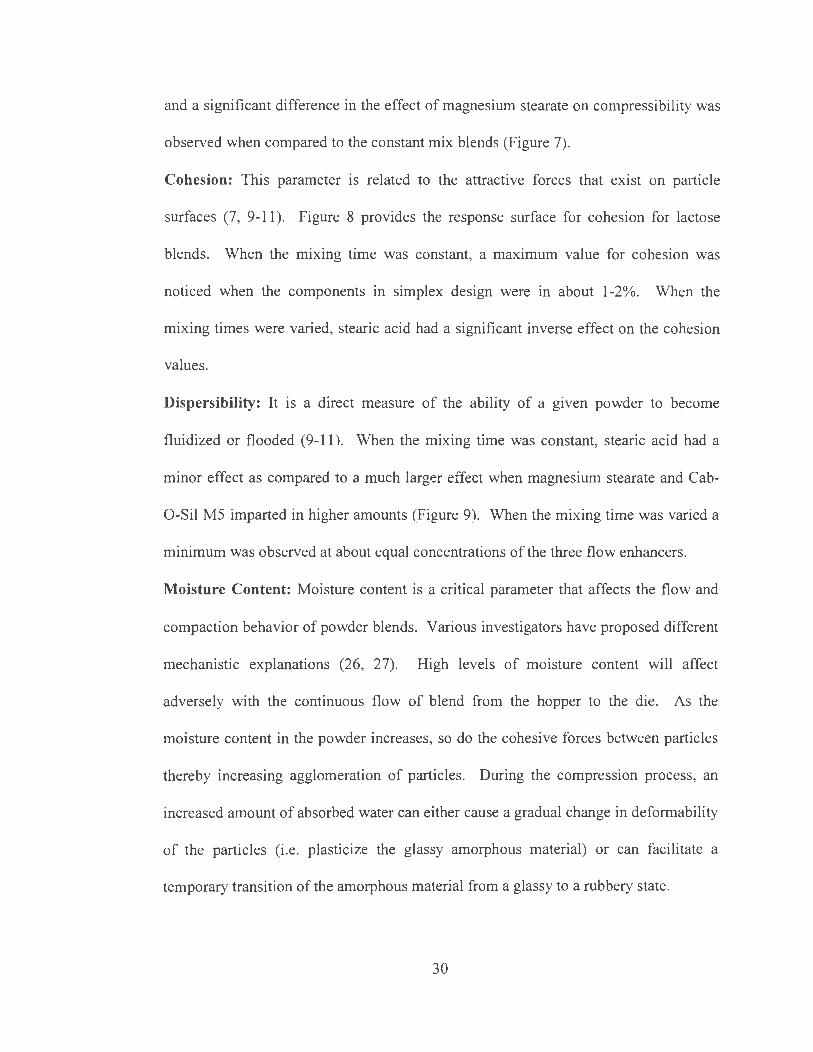
Cohesion: This parameter is related to the attractive forces that exist on particle
surfaces (7, 9-11 ). Figure 8 provides the response surface for cohesion for lactose
blends. When the mixing time was constant, a maximum value for cohesion was
noticed when the components in simplex design were in about 1-2%. When the
mixing times were varied, stearic acid had a significant inverse effect on the cohesion
values.
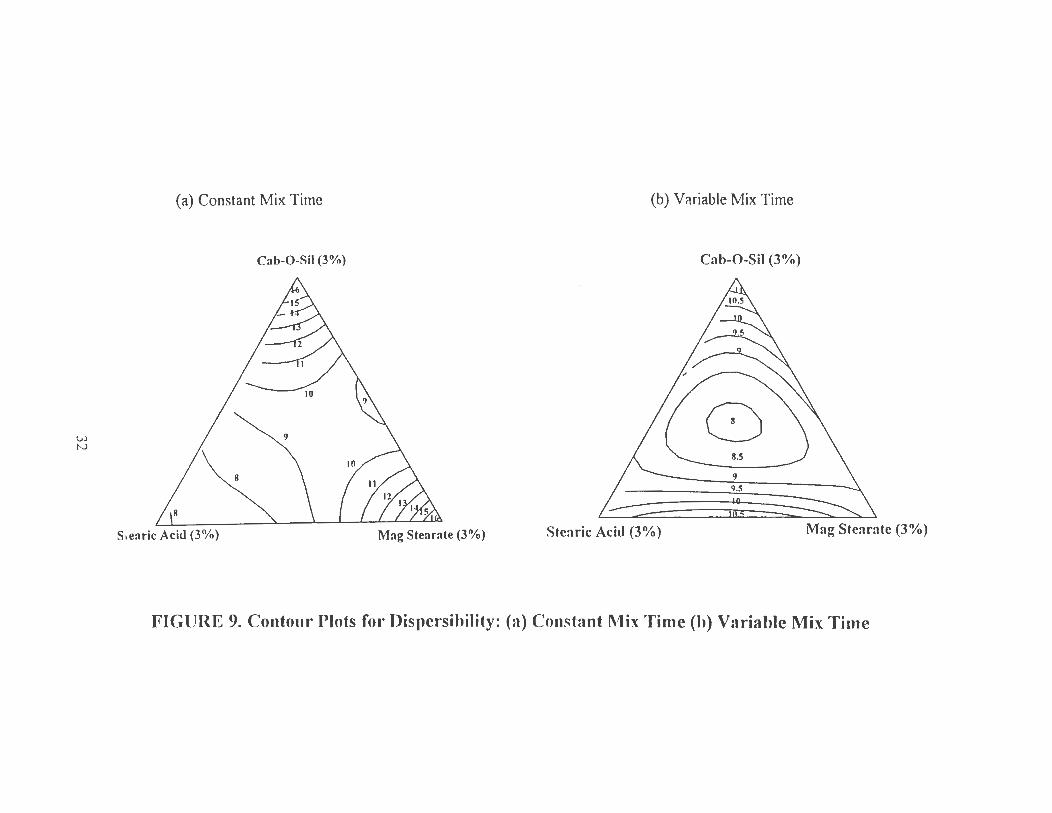
Dispersibility: It is a direct measure of the ability of a given powder to become
fluidized or flooded (9-11 ). When the mixing time was constant, stearic acid had a
minor effect as compared to a much larger effect when magnesium stearate and Cab-
0-Sil MS imparted in higher amounts (Figure 9). When the mixing time was varied a
minimum was observed at about equal concentrations of the three flow enhancers.
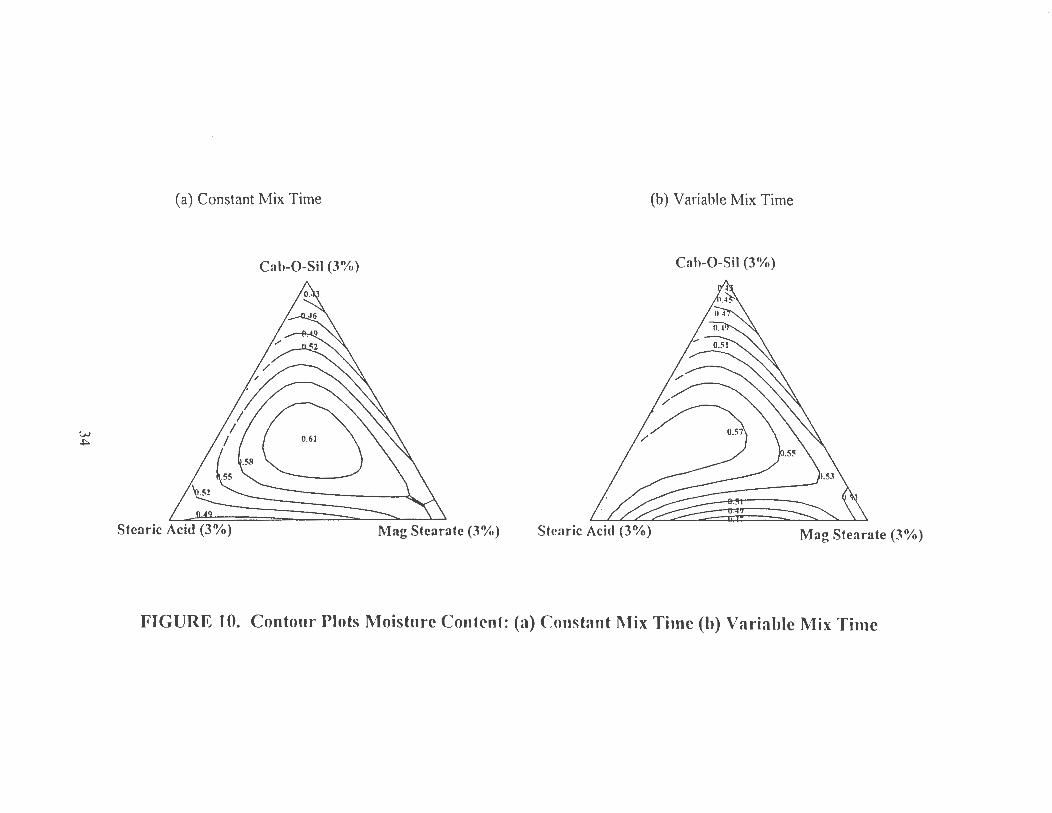
Moisture Content: Moisture content is a critical parameter that affects the flow and
compaction behavior of powder blends. Various investigators have proposed different
mechanistic explanations (26, 27). High levels of moisture content will affect
adversely with the continuous flow of blend from the hopper to the die. As the
moisture content in the powder increases, so do the cohesive forces between particles
thereby increasing agglomeration of particles. During the compression process, an
increased amount of absorbed water can either cause a gradual change in deformability
of the particles (i.e. plasticize the glassy amorphous material) or can facilitate a
temporary transition of the amorphous material from a glassy to a rubbery state.
30
\.>) ......
,-,.
(a) Constant Mix Time (b) Variable Mix Time
Cab-0-Sil (3%) Cab-0-Sil (3%)
Stearic Acid (3°/ii) Mag Stearate (3%) Stearic Acid (3%)
FIGURE 8. Contour Plots for Cohesion: (a) Constrmt Mix Time (b) Variable Mix Time
w N
,.. -
(a) Constant Mix Time (b) Variable Mix Time
Cab-0-Sil (3%) Cab-0-Sil (3%)
S1earic Acid (3%) Mag Stearate (3%) Stenric Acid (3%) Mag Stearate (3%)
FIGURE 9. Contour Plots for Dispcrsihility: (a) Constant l\1ix Time (h) Variable Mix Time
( Moisture content also will have an adverse impact on the stability of pharmaceutical
dosage forms. As the values for moisture content for various lactose blends reported
in Tables 2, 3, 4, 5&6 and indicate that there was not much significant variation in the
moisture content. Figure 10 displays the effect of formulation composition on the
moisture levels present in the lactose blends.
Particle Size Distribution: Particle size is a simple concept and yet a difficult one to
quantitate. Feret' s diameter, Martin's diameter, projected area diameter, specific area
diameter, Stoke's diameter, and volume diameters are few of several measurements
that have been used to quantify particle size. Reports in literature demonstrate that
decreasing particle size resulted in an increased angle of repose, suggesting that the
coefficient of interparticle friction increased with decreasing particle size (4, 5, 7, 8,
14, 28-32). Some investigators using flow-through-an-orifice experiments reported
that the flow rate increased with decreasing particle size (in contrast to angle of repose
observations) until a maximum is reached; followed by a rapid decrease in flow at
smaller particle size (8 , 14). The decreased flow for small particles has been attributed
to increased Van der Waals, electrostatic and surface tension forces, while the
decreased flow at larger particle sizes may be partly due to the size of the orifice
relative to that of the particles ( 4 ). Poor flow due to high quantity of drug present in
the high dose formulations is related to the cohesive energies associated with the fine
particles. Cohesive stress, which is the cohesive force per unit surface area, is smaller
for the larger particles. This is the reason, why fine particles are more cohesive and
increasing particle size improves flow (9-11 ).
33
w +>-
(a) Constant Mix Time (b) Variable Mix Time
Cab-0-Sil (3%) Cah-0-Sil (31Y.1)
Stcaric Acid (3%) Mag Stcaratc (3°/c,) Stcaric Acid (3%) Mag Stearate (3%)
FIGURE 10. Contour Plots Moisture Content: (a) Constant l\tix Time (b) Variable Mix Time
-
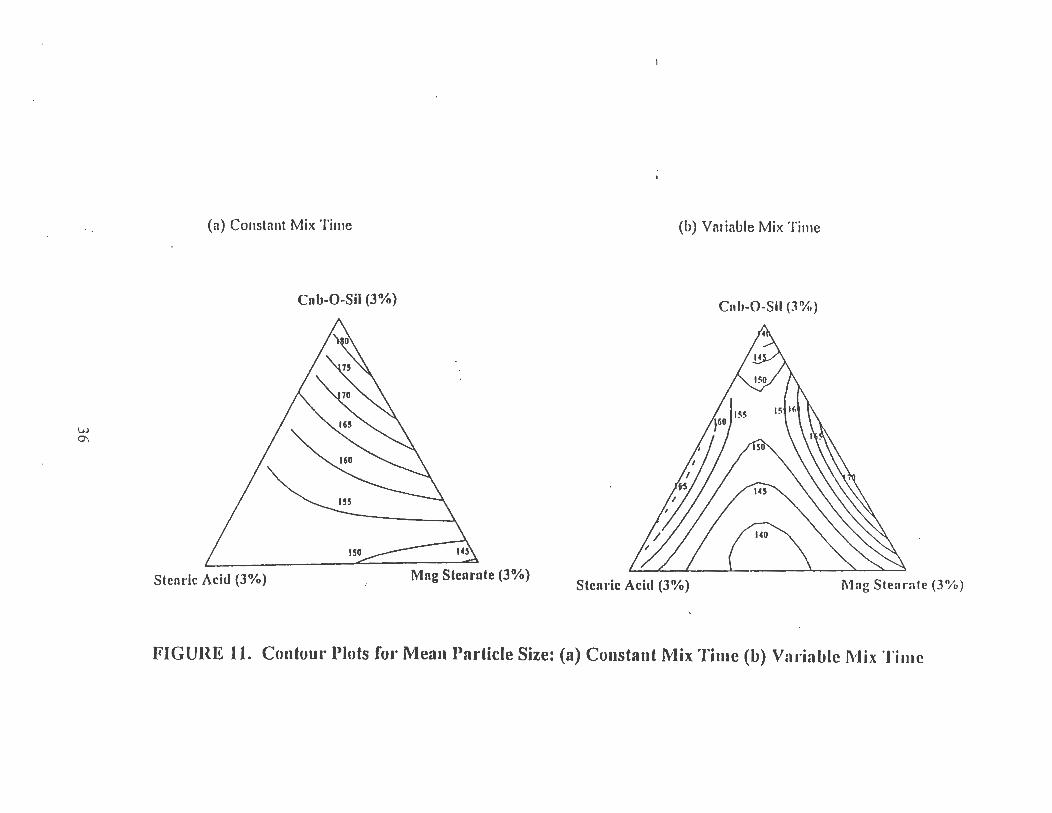
( In this study, the mean particle size for different blends was determined by
sieve analysis and the data is provided in Tables 2, 3, 4, S&6 and Figure 11 . When the
mixing time was kept constant, the mean particle size values varied from 14S to 180
microns. There were minor increases in the mean particle size when the amount of
Cab-0-Sil MS was altered. These variations are probably due to the random
adsorption of Cab-0-Sil MS particles on the surface of the lactose particles (33).
When the mixing times were varied, Cab-0-Sil MS did not have any significant effect
and the mean particle size remained small. In both sets of experiments, stearic acid
and magnesium stearate had similar effects (Figure 11 ).
Mixing Time: Among all the parameters, mixing time is one critical parameter that
has implications on flowability of powders and unifo1m distribution of drug in the
powder blend. Mixing is defined as a process that results in randomization of
dissimilar particles within any system (34). Mixing is a critical process that dictates
the flow of pharmaceutical powders. Many investigations have been reported with the
effects of physical and chemical properties of materials on powder processing (34-39).
There are many parameters that affect mixing process and these include type of mixer,
nature of individual components of the mixture, order of addition of components to the
batch, batch size, mixing speed, mixing time etc ( 40-42). The effect of mixing time
needs to be evaluated carefully as too much mixing time will result in demixing of
powders (43-4S). Longer mixing times with lubricants result in lower tablet hardness
values.
From the flow data generated in this study, it is evident that significant
differences in powder characteristics were noticed based on the mixing times.
3S
w
°'
-...,
(a) Co11sta11t Mix Time (b) Variable Mix Time
CnlJ-0-Sil (3%) Cnh-0-Sll (3%)
Stenric Acid (3%) Mng Stenrnte (3%) Stenric Acid (3%) Mag Stearnle (3%)
FIGUilE 11. Contour Plots for Mean Particle Size: (a) Constant l\tlix Time (b) Variable J\!lix Time
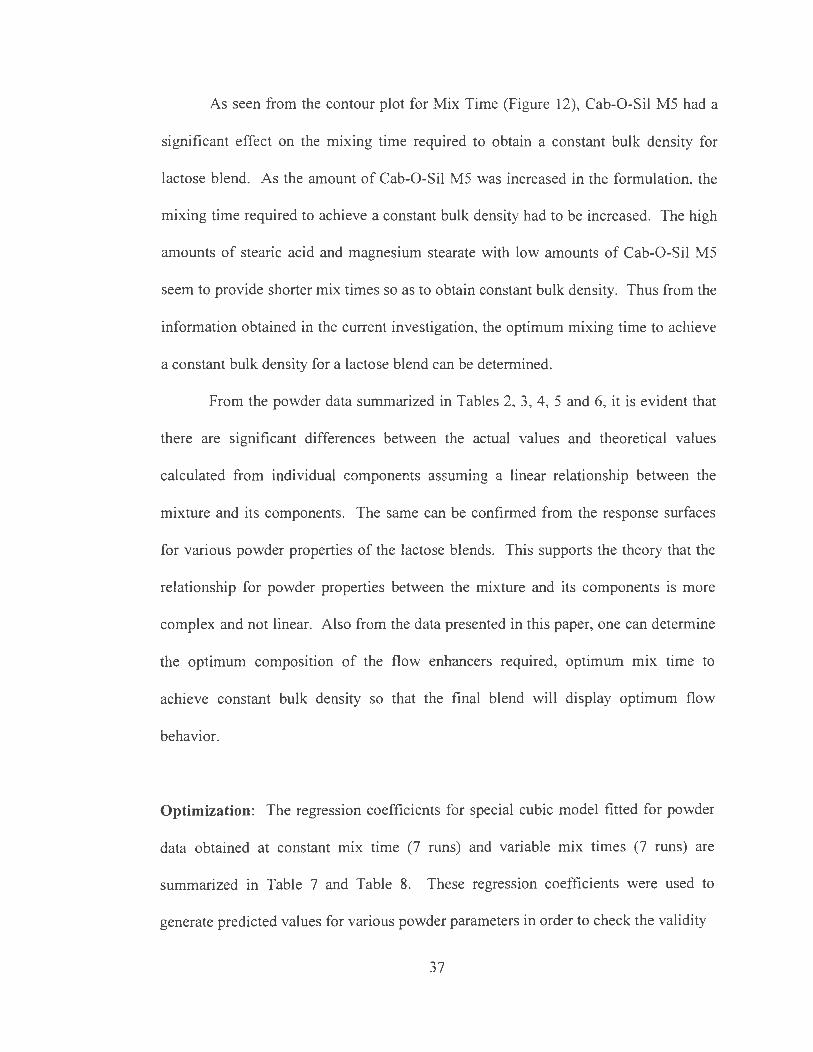
As seen from the contour plot for Mix Time (Figure 12), Cab-0-Sil MS had a
significant effect on the mixing time required to obtain a constant bulk density for
lactose blend. As the amount of Cab-0-Sil MS was increased in the formulation, the
mixing time required to achieve a constant bulk density had to be increased. The high
amounts of stearic acid and magnesium stearate with low amounts of Cab-0-Sil MS
seem to provide shorter mix times so as to obtain constant bulk density. Thus from the
information obtained in the current investigation, the optimum mixing time to achieve
a constant bulk density for a lactose blend can be determined.
From the powder data summarized in Tables 2, 3, 4, S and 6, it is evident that
there are significant __ differences between the actual values and theoretical values
calculated from individual components assuming a linear relationship between the
mixture and its components. The same can be confirmed from the response surfaces
for various powder properties of the lactose blends. This supports the theory that the
relationship for powder properties between the mixture and its components is more
complex and not linear. Also from the data presented in this paper, one can determine
the optimum composition of the flow enhancers required, optimum mix time to
achieve constant bulk density so that the final blend will display optimum flow
behavior.
Optimization: The regression coefficients for special cubic model fitted for powder
data obtained at constant mix time (7 runs) and variable mix times (7 runs) are
summarized in Table 7 and Table 8. These regression coefficients were used to
generate predicted values for various powder parameters in order to check the validity
37
VJ 00
,,..--. ..........
CalJ-0-Sil (3°/o)
Stcaric Acid. (3o/o) Mag Slcarntc (3°~1)
FIGURE 12. Contour Plot for Mixing Time to obtain Maximum Bulk Density
uJ \0
..---.... ~
TABLE 7. Regression Coefficients of Special Cubic Models Fitted for Powder Data
Cbefficients Bl B2 B3
Response Pararreter CoostantMx VarialieMx Coffitaut Mx VarialieMx CoostantMx VariatleMx 'Ilrre 'Ilrre Ture 'Ilrre Ture Ture
kged~ 40.9 37.2 48.0 420 45.9 38.7
kgedFal 221 19.9 '29.-2 17.9 24.6 24.9
kge d Dffererre 18.8 17.3 18.9 24.0 21.4 13.8
.Aacte::J BJ k D:rsity 0.53 0.65 O.W 0.67 0.69 0.70
Pa:Xe::J BJk D:rsity O.Tl 0.86 0.80 0.86 0.85 0.88
Ca Ip esslblity 31.4 24.5 25.8 224 19.0 21.3 Q:hesi\e""-ess 79.7 76.5 74.6 73.1 54.5 76.3
kged~a 420 38.2 41.8 321 40.0 36.8 Dsp:;rsiblity 17.4 11.5 8.4 10.1 16.5 9.2
rvbsh.re Caiert 0.40 0.42 0.50 O.W o.w 0.55
ROIB:llity ln:Ex 67.l - 0.65 - 69.8 -
Rcx:rl:tility ln:Ex 0.56 - 0.62 - 0.<56 -
BJk D:rsity 0.53 - 0.65 - 0.65 -
T~D:rsity 0.73 - 0.86 - O.~ -
PatidesiZE 183.9 130.0 153.4 156.4 144.0 154.3 Mxi.I15 Turn - 11.3 - 3.1 - 5.1
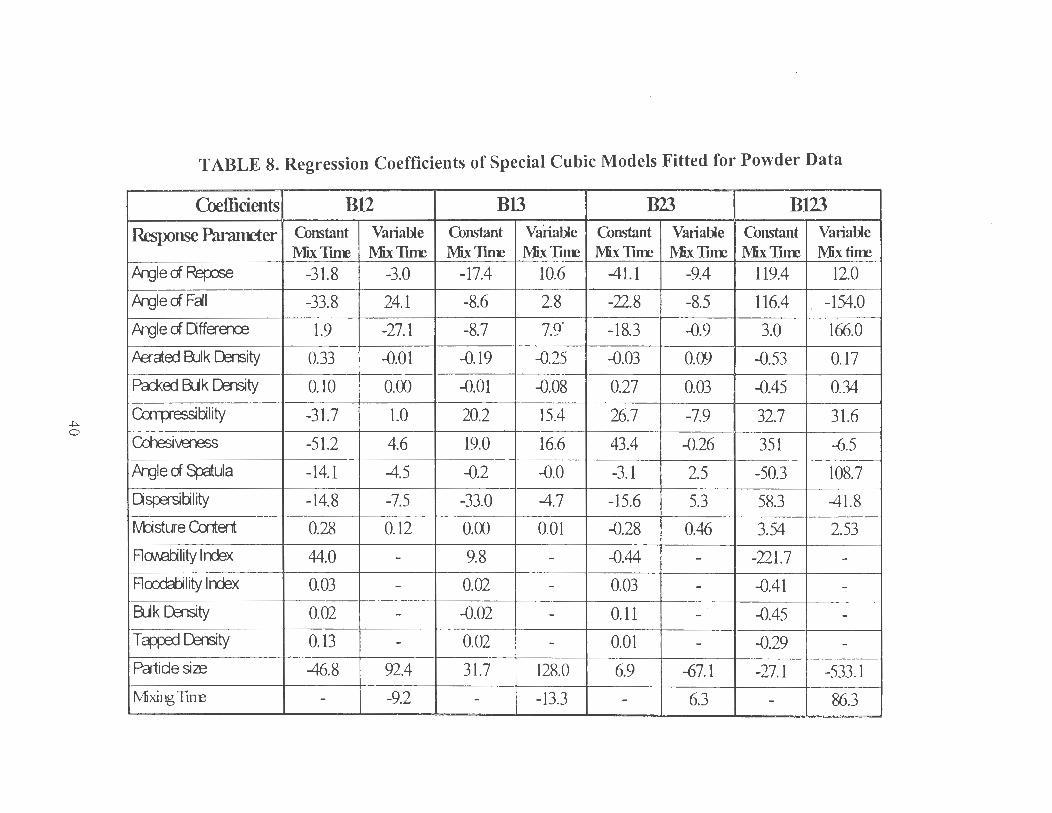
~ 0
TABLE 8. Regression Coefficients of Special Cubic Models Fitted for Powder Data
Coefficients B12 B13 B23 B123
Response Pararreter C.Onstant Variable C.Onstant Vanable C.Onstant Variable C.Onstant Variable MxTure MixTure MixTure MixTmE MxllllE MixTure MixTure IVJiXtinE
A-r:Jle ci Retx>se -31.8 -3.0 -17.4 10.6 -41.1 -9.4 119.4 12.0
Afr:Jle ci Feil -33.8 24.l -8.6 2.8 -22.8 -8.5 116.4 I -154.0
Afr:Jle ci DffEnn::s 1.9 -27.l -8.7 7.9~ -18.3 --0.9 3.0 166.0
.Affata::J B.Jlk caisity 0.33 --0.01 --0.19 --0.25 --0.03 0.(1) --0.53 0.17
Pa::kffi B.J k D?.nsity 0.10 0.00 --0.01 --0.08 0.27 0.03 --0.45 0.34
O:rrµ-esslblity -31.7 1.0 20.2 15.4 26.7 -7.9 32.7 31.6
O:tesi\16"eSS -51.2 4.6 19.0 16.6 43.4 --0.26 351 -6.5
Afr:Jle ci ~ula -14.1 -4.5 --0.2 --0.0 -3.1 2.5 -50.3 108.7
DSfE'Slblity -14.8 -7.5 -33.0 -4.7 -15.6 5.3 58.3 -41.8 l\lbsture O:ntent 0.28 0.12 0.00 0.01 --0.28 0.46 3.54 2.53
ROJ\0blity lrrex 44.0 - 9.8 - --0.44 - -221.7 -
Flocdablity lrrex 0.03 - 0.02 - 0.03 - --0.41 -B.J k D?.nsity 0.02 - --0.02 - 0.11 - --0.45 -T~D?.nsity 0.13 - 0.02 - 0.01 - --0.29 -Paiide size -46.8 92.4 31.7 128.0 6.9 -67.l -27.l -533.1 Mxing Turn - -9.2 - -13.3 - 6.3 - 86.3
-...
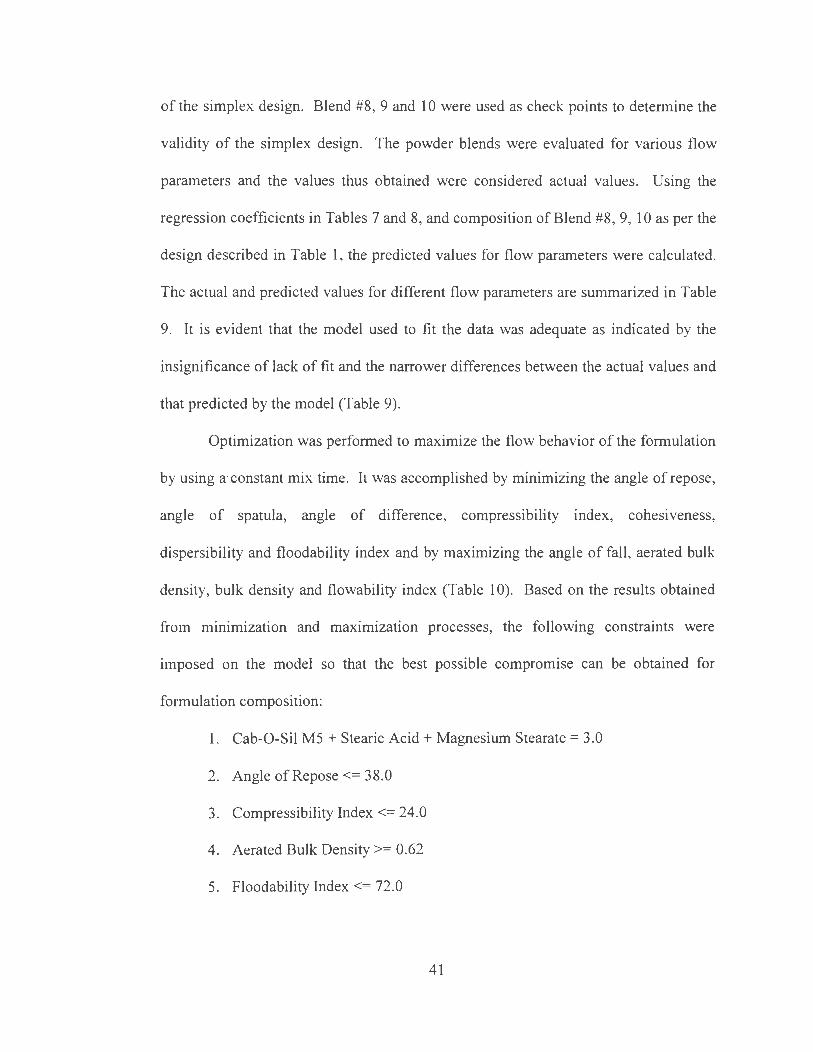
( of the simplex design. Blend #8, 9 and 10 were used as check points to determine the
validity of the simplex design. The powder blends were evaluated for various flow
parameters and the values thus obtained were considered actual values. Using the
regression coefficients in Tables 7 and 8, and composition of Blend #8 , 9, 10 as per the
design described in Table 1, the predicted values for flow parameters were calculated.
The actual and predicted values for different flow parameters are summarized in Table
9. It is evident that the model used to fit the data was adequate as indicated by the
insignificance of lack of fit and the narrower differences between the actual values and
that predicted by the model (Table 9).
Optimization was performed to maximize the flow behavior of the formulation
by using a· constant mix time. It was accomplished by minimizing the angle of repose,
angle of spatula, angle of difference, compressibility index, cohesiveness,
dispersibility and floodability index and by maximizing the angle of fall , aerated bulk
density, bulk density and flowability index (Table 10). Based on the results obtained
from minimization and maximization processes, the following constraints were
imposed on the model so that the best possible compromise can be obtained for
formulation composition:
1. Cab-0-Sil MS+ Stearic Acid+ Magnesium Stearate = 3.0
2. Angle of Repose<= 38.0
3. Compressibility Index<= 24.0
4. Aerated Bulk Density >= 0.62
5. Floodability Index <= 72.0
41
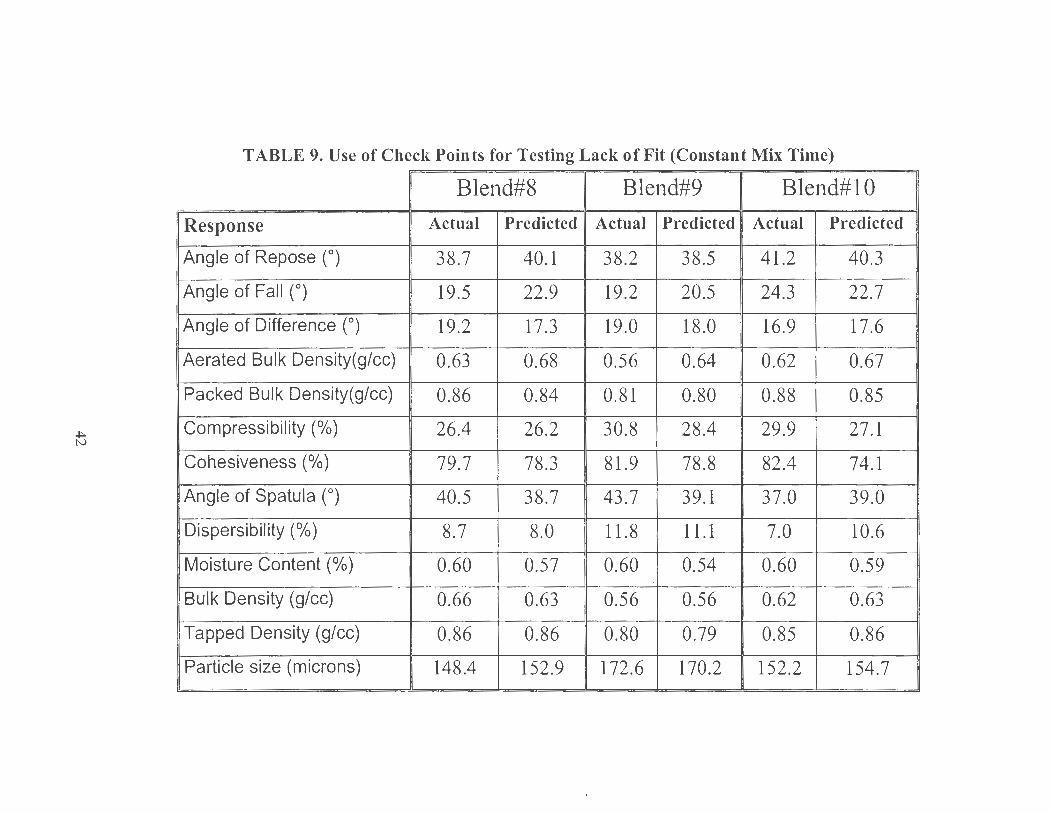
~ N
TABLE 9. Use of Check Points for Testing Lack of Fit (Constant Mix Time)
Blend#8 Blend#9 Blend#lO
Response Actual Predicted Actual Predicted Actual Predicted
Angle of Repose (0) 38.7 40.1 38.2 38.5 41.2 40.3
Angle of Fall (0) 19.5 22.9 19.2 20.5 24.3 22.7
Angle of Difference (0) 19.2 17.3 19.0 18.0 16.9 17.6
Aerated Bulk Density(glcc) 0.63 0.68 0.56 0.64 0.62 0.67
Packed Bulk Density(glcc) 0.86 0.84 0.81 0.80 0.88 0.85
Compressibility(%) 26.4 26.2 30.8 28.4 29.9 27.1
Cohesiveness (%) 79.7 78.3 81.9 78.8 82.4 74.1
Angle of Spatula (0) 40.5 38.7 43.7 39.1 37.0 39.0
Dispersibility (%) 8.7 8.0 11.8 11.1 7.0 10.6
Moisture Content(%) 0.60 0.57 0.60 0.54 0.60 0.59
Bulk Density (glee) 0.66 0.63 0.56 0.56 0.62 0.63
Tapped Density (glee) 0.86 0.86 0.80 0.79 0.85 0.86
Particle size (microns) 148.4 152.9 172.6 170.2 152.2 154.7
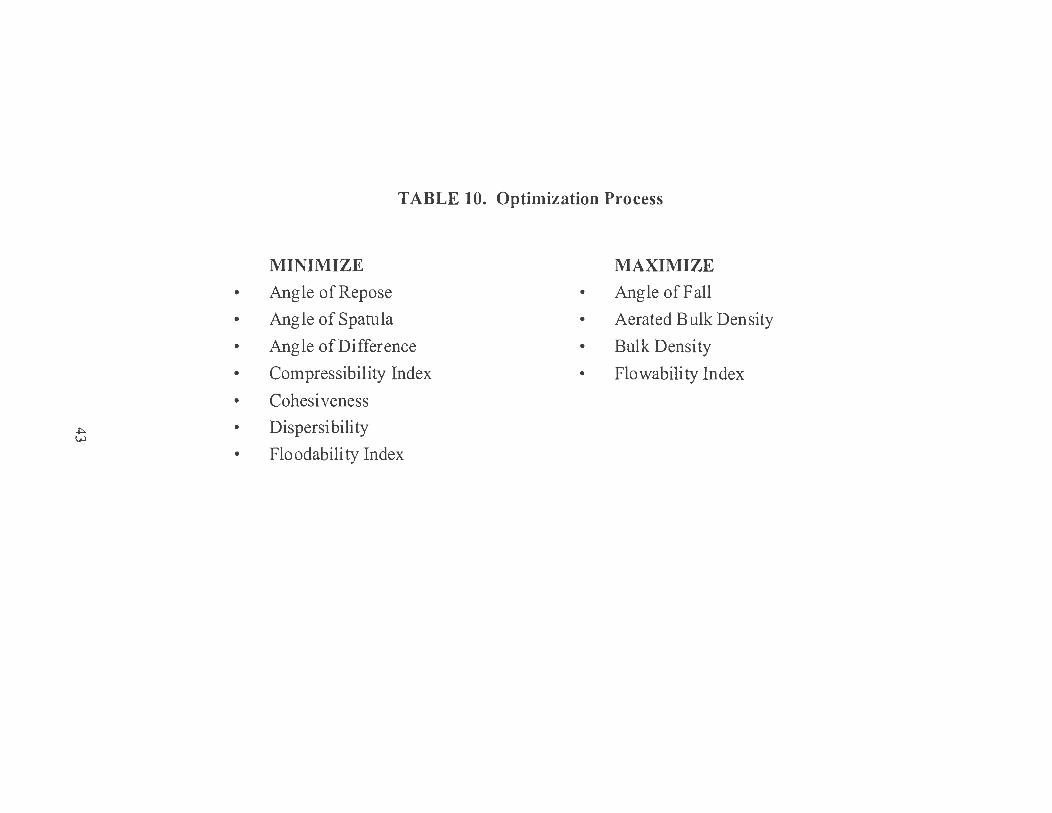
---..
TABLE 10. Optimization Process
MINIMIZE MAXIMIZE
• Angle of Repose • Angle of Fall
• Angle of Spatula • Aerated Bulk Density
• Angle of Difference • Bulk Density
• Compressibility Index • Flo wabili ty Index
• Cohesiveness
~ • Dispersi bili ty VJ
• Floodabili ty Index
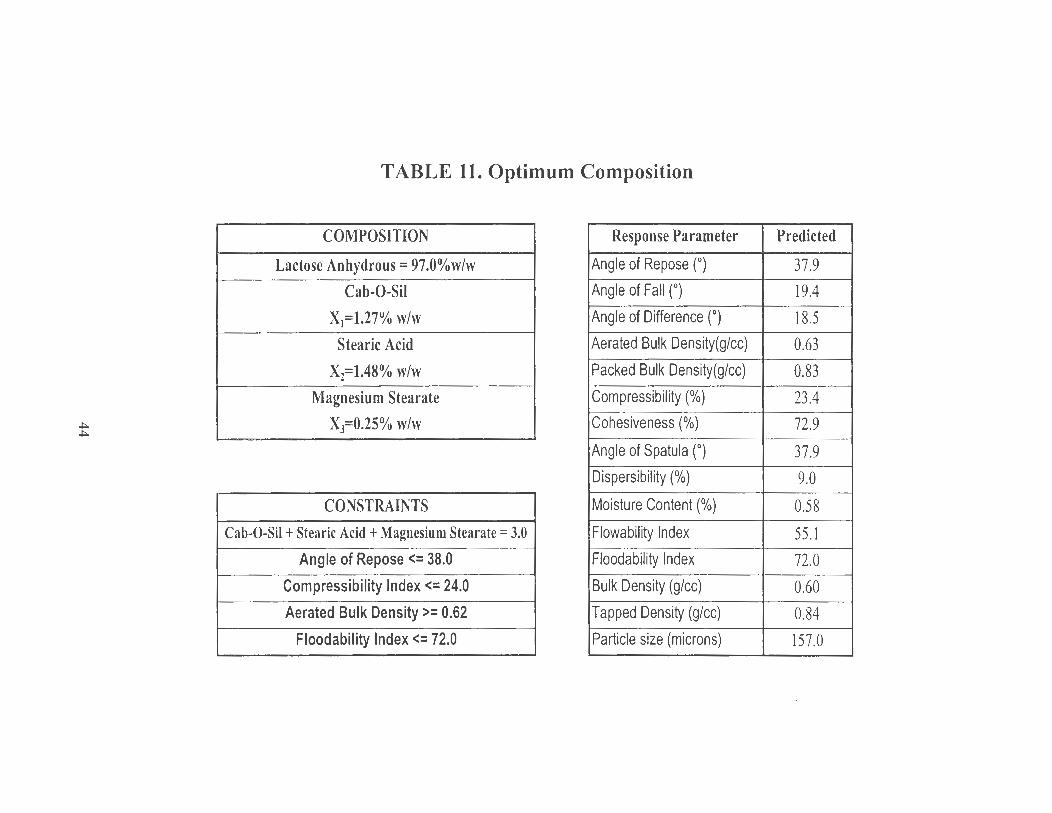
~ ~
TABLE 11. Optimum Composition
COMPOSITION Response Parameter
Lactose Anhydrous= 97.0%w/w Angle of Repose (0)
Cab-0-Sil Angle of Fall (0)
X1=1.27% w/w Angle of Difference (°)
Stearic Acid Aerated Bulk Density(g/cc)
X2=1.48% w/w Packed Bulk Density(g/cc)
Magnesium Stearate Compressibility(%)
X3=0.25% w/w Cohesiveness(%)
Angle of Spatula (°)
Dispersibility (%)
CONSTRAINTS Moisture Content(%)
Cab-0-Sil + Stearic Acid +Magnesium Stearate = 3.0 Flowability Index
Angle of Repose <= 38.0 Floodability Index
Compressibility Index<= 24.0 Bulk Density (glee)
Aerated Bulk Density>= 0.62 Tapped Density (g./cc)
Floodability Index <= 72.0 Particle size (microns)
---....
Predicted
37.9
19.4
18.5
0.63
0.83
23.4
72.9
37.9
9.0
0.58
55.1
72.0
0.60
0.84
157.0
( For lactose blends with constant mix time, using the above mentioned constraints, the
model predicted the following composition for blend that will have optimum flow
properties: Cab-0-Sil MS = 1.27%, Stearic Acid = 1.48% and Magnesium Stearate =
0.25% (Table 11 ). The model also predicted the response values for various powder
properties. As evident from the predicted values summarized in Table 11, the model
predicted composition display optimum flow behavior.
45
CONCLUSIONS
The powder properties of lactose anhydrous blends by incorporating
magnesium stearate, stearic acid and Cab-0-Sil MS in varying amounts from 0 to 3%
as per the simplex design were analyzed. One set of the powder blends was mixed at a
constant mix time of three minutes and another set of experiments with variable mix
times to achieve constant bulk density was performed. The mixed systems and
individual components were evaluated for powder characteristics such as bulk density,
tapped density, aerated bulk density, packed bulk density, compressibility index, angle
of repose, angle of spatula, angle of fall, angle of difference, cohesiveness,
dispersibility, moisture content and particle size distribution.
From the different powder parameters evaluated, it can be summarized that the
relationship for powder properties between the mixture and its components is non
linear. Significant differences were observed in the flow behavior of powder blends
obtained with constant mixing time and those obtained with variable mixing times.
Among the three variable components, Cab-0-Sil MS had a significant effect on the
time required to achieve constant bulk density of a powder blend.
This study demonstrated that by using simplex design, the flow behavior of
lactose blend can be optimized. For constant mix time study, the model predicted that
lactose anhydrous would show optimum flow behavior with 0.2S%w/w magnesium
stearate, 1.48%w/w stearic acid and 1.27%w/w Cab-0-Sil MS.
Thus from the response surface contour plots and the mathematical model
equations, one can determine the optimum composition of the flow enhancers
46
( required, optimum mix time to achieve constant bulk density so that the final blend
will display optimum flow behavior.
47
( REFERENCES
1. Kumar, V., Sunder, N. and Potdar, A. Critical factors in developing
pharmaceutical formulations - An overview, Part I. Pharmaceutical Technology,
16: 94-102 (1992).
2. Kumar, V., Sunder, N. and Potdar, A. Critical factors in developing
pharmaceutical formulations - An overview, Part II. Pharmaceutical Technology,
16: 86-92 (1992).
3. Stamm, A. Process and dosage form controls: Fommlation factors. Drug
Development and Industrial Pharmacy, 15: 965-974 (1989).
4. Hartley, P. A., Parfitt, G. D., and Pollack, L. B. The role of the Van der Waals
force in the agglomeration of powders containing submicron particles. Powder
Technology, 42: 35-46 (1985).
5. Hiestand, E. N. Powders: Particle-particle interactions. Journal of Pharmaceutical
Sciences, 55(12): 1325-1344 (1966).
6. Wong, L. W. and Pilpel, N. The effect of shape of fine particles on the formulation
of ordered mixtures. Journal of Pharmacy and Pharmacology, 40: 567-568 (1988).
7. Otsuka, A. , Iida, K., Danjo, K. and Sunada, H. Measurement of adhesive force
between particles. III. Effect of particle shape and surface asperity. Chemical
Pharmaceutical Bulletin, 36: 741-749 (1988).
8. Amidon, G. E. Physical and mechanical property characterization of powders. In
Brittain, H.G. (Ed.), Physical Characterization of Pharmaceutical Solids, Marcel
Dekker, Inc. , New York, 281-319 (1995).
48
( 9. Carr, R. L. Classifying flow properties of solids. Chemical Engineering, 72: 69
(1965).
10. Carr, R. L. Evaluating flow properties of solids. Chemical Engineering, 72: 163-
168 (1965).
11. Carr, R. L. Particle behavior storage and flow. British Journal of Chemical
Engineering, 15: 1541 (1970).
12. Buslik, D. A proposed universal homogeneity and mixmg index. Powder
Technology, 7: 111-116 (1973).
13. Staniforth, P. T. and Berry, R. E. R. A general flowability index for powders,
Powder Technology, 8: 243 (1973).
14. Amidon, G. E. and Houghton, M. E. Powder flow testing in preformulation and
formulation development. Pharmaceutical Manufacturing, July, 21-31 (1985).
15. Johanson, J. R. Predicting segregation of bimodal particle mixtures using the flow
properties of bulk solids. Pharmaceutical Technology, 20: 46-57 (1996).
16. Carson J. W. and Marinelli, J. Characterize bulk solids to ensure smooth flow.
Chemical Engineering, April, 78-90 (1994).
17. Stetsko, G. Statistical experimental design and its application to pharmaceutical
development problems. Drug Development and Industrial Pharmacy, 12: 1109-
1123 (1986).
18. Schwartz, J. B. and O'Connor, R. E. Optimization techniques in pharmaceutical
formulation and processing. In Banker, G.S. and Rhodes, C.T. (Eds.), Modern
Pharmaceutics, 3rd Edition, Marcel Dekker, Inc., New York, 727-772 (1996).
49
( 19. Scheffe, H. The simplex-centroid design for experiments with mixtures. Journal of
Royal Statistical Society, B25: 235-263 (1963).
20 . Scheffe, H. Experiments with mixtures. Journal of Royal Statistical Society, B20:
344-360 (1958).
21. Gorman, J. W. and Hinman, J. E. Simplex lattice designs for multicomponent
systems. Technometrics, 4: 463-487 (1962).
22. Spendley, W., Hext, G. R. and Hinsworth, F. R. Sequential application of simplex
designs in optimization and evolutionary operation. Technometrics, 4: 441-461
(1962).
23. Statgraphics®Plus for Windows, Version 2.0, Manugistics, Inc., Rockville,
Maryland, USA.
24. Sheskey, P. J. and Dasbach, T. P. Evaluation of various polymers as dry binders in
the preparation of an immediate release tablet formulation by roller compaction.
Pharmaceutical Technology, 19: 98-112 (1995).
25. Zuurman, G. K. Bolhuis and H. Vromans. Effect of binder on the relationship
between bulk density and compactibility of lactose granulations. International
Journal of Pharmaceutics, 119: 65-69 (1995).
26. Shotton, E. J. and Harb, N. The effect of humidity and temperature on the cohesion
of powders. Journal of Pharmacy and Pharmacology, 18: 175-178 (1966).
27. Amidon, G. E and Houghton, M. E. The effect of moisture on the mechanical and
powder flow properties of microcrystalline cellulose. Pharmaceutical Research,
12: 923-929 (1995).
50
( 28. Johnson, M. C. R. The effect of particle size upon mixture homogeneity.
Pharmaceutica Acta Helvetiae , 50 (3): 60-63 (1975).
29. Williams, J.C. and Khan, M. I. The mixing and segregation of particulate solids of
different particle size. The Chemical Engineer, January, 19-25 (1973).
30. Chowhan, Z. T. Segregation of particulate solids-Part I. Pharmaceutical
Technology, 19: 56-70 (1995).
31. Chowhan, Z. T. Segregation of particulate solids-Part II Pharmaceutical
Technology, 19: 80-94 (1995).
32. Vachon, M. G. and Chulia, D. The use of particle characteristics to elucidate mix
homogeneity in binary powder blends. Drug Development and Industrial
Pharmacy, 24(10): 961-971 (1998).
33 . Sindel, U. , Schweiger, A. and Zimmermann, I. Determination of the optimum
mixing time for a mixture of lactose and colloidal silicon dioxide. Journal of
Pharmaceutical Sciences, 87 (4) : 524-526 (1998).
34. Cooke, M. H., Stephens, D. J. and Bridgwater, J. Powder mixing- A literature
survey. Powder Technology, 15: 1-20 (1976).
35. Hersey, J. A., Cook, P., Smyth, M., Bishop, E. A. and Clarke, E. A. Homogeneity
of multicomponent powder mixtures. Journal of Pharmaceutical Sciences, 63(3) :
408-411 (1974).
36. Staniforth, J. N. The effect of frictional charges on flow properties of direct
compression tableting excipients. International Journal of Pharmaceutics, 11:
109-117 (1982).
51
( 3 7. Chowhan, Z. T. and Chi, L. Drug-excipient interactions resulting from powder
mixing III: Solid state properties and their effect on drug dissolution. Journal of
Pharmaceutical Sciences, 75(6): 534-541 (1986).
38. Velasco, M. V., Munoz-Ruiz, A., Monedero, M. C. and Jimenez-Castellanos, M.
R. Study of flowability of powders. Effect of the addition of lubricants. Drug
Development and Industrial Pharmacy, 21(20): 2385-2391 (1995).
39. de Villiers, M. M. Description of the kinetics of the deagglomeration of drug
particle agglomerates during powder mixing. International Journal of
Pharmaceutics, 151:1-6 (1997).
40. Fuller, W. 0 . Mixing up a batch: Batch mixer types and selection tips. Powder and
Bulk Engineering, January, 48-66 (1998).
41. Waters, A. J. Solving flow problems: How to select a bin retrofit. Powder and
Bulk Engineering, November, 45-55 (1997).
42. Abouzied, A. Z. M. and Fuerstenau, D. W. Effect of mixing aids on the transport
behavior of particulate solids. Powder Technology, 23: 261-271 (1979).
43. Johansson, M. E. Investigations of mixing time dependence of the lubricating
properties of granular and powdered magnesium stearate. Acta Pharmaceutica
Suec 22: 343-350 (1985).
44. Ragnarsson, G., Holzer, A. W., and Sjogren, J. The influence of mixing time and
colloidal silica on the lubricating properties of magnesium stearate. International
Journal of Pharmaceutics, 3: 127-131 (1979).
45 . Khan, K. A. , Musikabhumma, P. and Rubinstein, M. H. The effect of mixing time
of magnesium stearate on the tabletting properties of dried microcrystalline
cellulose. Pharmaceutica Acta Helvetiae , 58: 109-111 (1983).
52
MANUSCRIPT II
ANALYSIS OF COMPRESSION BEHAVIOR OF MULTI-COMPONENT
MIXTURES USING AN INSTRUMENTED TABLET PRESS
53

ABSTRACT
Purpose. To investigate the compression behavior of experimentally designed multi
component mixtures using an instrumented tablet press. Methods. The mixtures
comprised of Anhydrous Lactose, NF, Microcrystalline Cellulose, NF (Avicel PH101)
and Pregelatinized Starch, NF (Starch 1500) with individual quantities varying from 0
to 99% w/w based on a simplex design. Magnesium Stearate, NF was added as
lubricant at 1 % w/w level. The batch size was 900 grams (equivalent to 3000 tablets).
Ten experimental mixtures were prepared in a Collette Gral 10 High Shear Mixer with
3 minutes of pre-blending and 1 minute of lubricant mixing. The mixtures were
evaluated for bulk and tapped densities, particle size distribution and moisture content.
The mixtures were compressed using a 10-station instrumented rotary tablet press
(Piccola 026 B 1-0) equipped with a compression research system (PC-30, SMI Inc.)
and 12/32" standard concave tooling at 1000 lbs, 2000 lbs, 3000 lbs, 4000 lbs, 5000
lbs, 6000 lbs and maximum achievable force. The compression force-time profiles
were recorded to measure the de-aeration force, compression force and ejection force
for each compression cycle. The tablets were evaluated for hardness, weight,
thickness, friability and disintegration time. The true densities of tablets and mixtures
were measured using a helium pycnometer (Ultrapycnometer 1000). Results. The
compression force-time pulses for all the mixtures at each compressional force were
compared to investigate the effect of mixture composition on the compression
behavior of mixtures. Events such as rise time, fall time, dwell time, contact time,
areas and pulse widths that characterize nature of each compression pulse were
evaluated using a response surface methodology (StatgraphicsP/us). Heckel
54
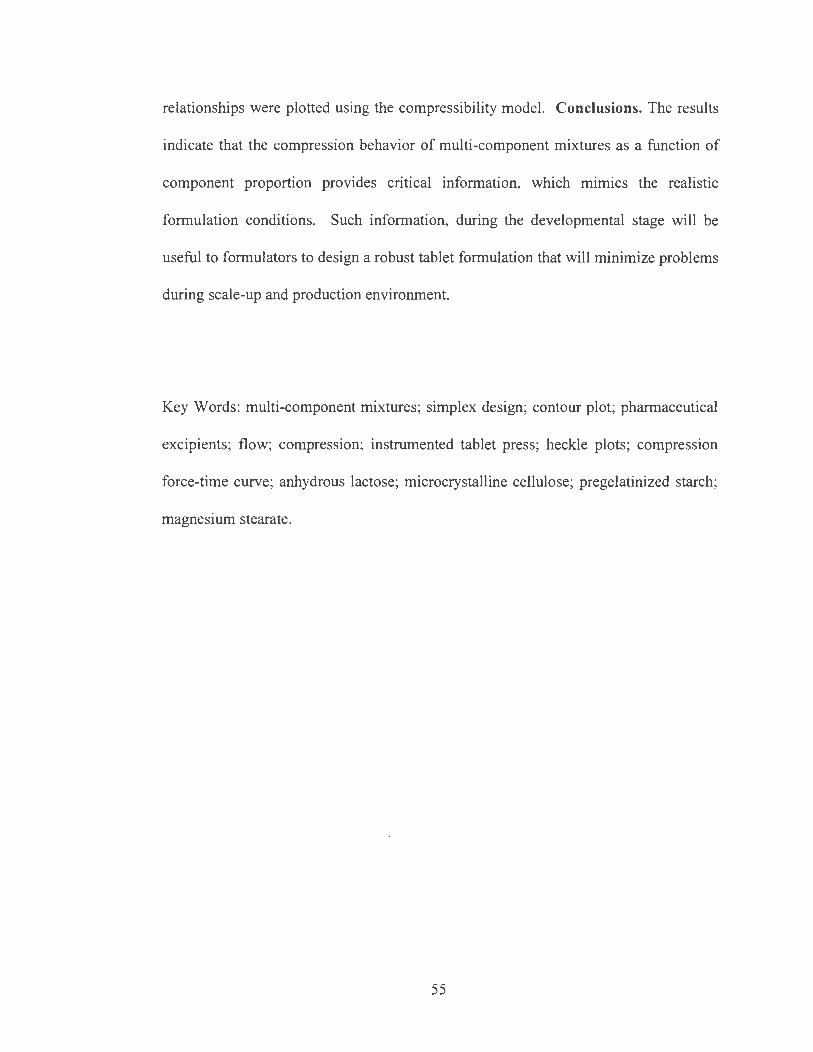
( relationships were plotted using the compressibility model. Conclusions. The results
indicate that the compression behavior of multi-component mixtures as a function of
component proportion provides critical information, which mimics the realistic
formulation conditions. Such information, during the developmental stage will be
useful to formulators to design a robust tablet formulation that will minimize problems
during scale-up and production environment.
Key Words: multi-component mixtures; simplex design; contour plot; pharmaceutical
excipients; flow; compression; instrumented tablet press; heckle plots; compression
force-time curve; anhydrous lactose; microcrystalline cellulose; pregelatinized starch;
magnesium stearate.
55
( INTRODUCTION
Interest and popularity of tablet dosage forms has brought increasing attention
on the compression of pharmaceutical mixtures. The advantages of tablets are: 1) low
manufacturing cost, 2) reduced liability to tampering, 3) less variation in dosage and 4)
improved patient compliance as compared to other dosage forms. Tablets can be made
either from granulations or powder blends. Since wet or dry granulation involves
additional processing steps such as drying, milling, slugging or roller compaction,
direct compression seems to be the method of choice for tablet manufacturing.
However, poor compressibility along with the poor flowable nature of most of the
pharmaceutical mixtures poses tremendous challenges during the scaleup and
production stages. In this investigation, the compression behaviors of mixtures
containing, several of the most commonly used excipients have been evaluated.
There are many ongoing investigations that focus on characterizing the
compression behavior of pharmaceutical materials (1-9). Compression behavior of
pharmaceutical blends is determined by factors such as individual excipients, type of
tablet press, tooling, press speed, feed rate etc. Compression force-time profiles are
used to characterize the compaction behavior of formulations with respect to their
elastic and plastic properties. The compression force-time profile is a fingerprint for a
formulation and can be useful in choosing excipients for direct compression and
binders for granulation.
Powders consolidate under a compressive force by a variety of mechanisms,
ranging from particle fragmentation to plastic and elastic deformation (9-14). Particle
fracture can be regarded as a virtually instantaneous process, while irreversible
56
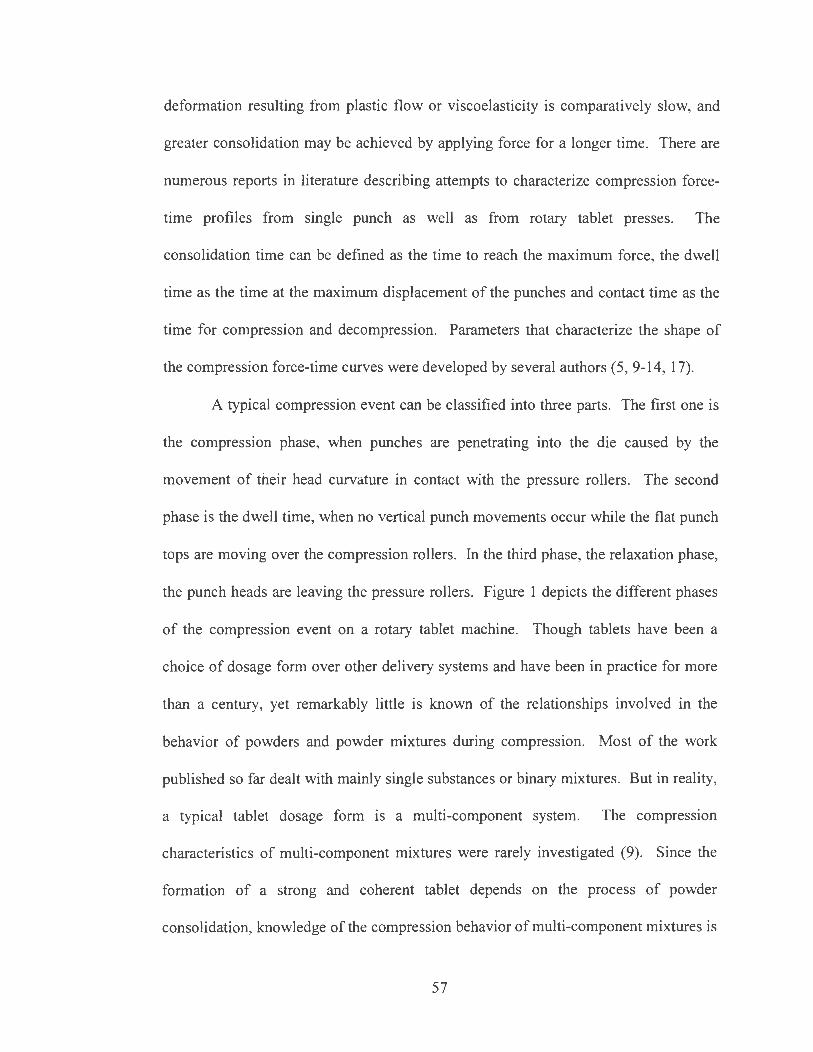
( deformation resulting from plastic flow or viscoelasticity is comparatively slow, and
greater consolidation may be achieved by applying force for a longer time. There are
numerous reports in literature describing attempts to characterize compression force
time profiles from single punch as well as from rotary tablet presses. The
consolidation time can be defined as the time to reach the maximum force, the dwell
time as the time at the maximum displacement of the punches and contact time as the
time for compression and decompression. Parameters that characterize the shape of
the compression force-time curves were developed by several authors (5, 9-14, 17).
A typical compression event can be classified into three parts. The first one is
the compression phase, when punches are penetrating into the die caused by the
movement of their head curvature in contact with the pressure rollers. The second
phase is the dwell time, when no ·vertical punch movements occur while the flat punch
tops are moving over the compression rollers. In the third phase, the relaxation phase,
the punch heads are leaving the pressure rollers. Figure 1 depicts the different phases
of the compression event on a rotary tablet machine. Though tablets have been a
choice of dosage form over other delivery systems and have been in practice for more
than a century, yet remarkably little is known of the relationships involved in the
behavior of powders and powder mixtures during compression. Most of the work
published so far dealt with mainly single substances or binary mixtures. But in reality,
a typical tablet dosage form is a multi-component system. The compression
characteristics of multi-component mixtures were rarely investigated (9). Since the
formation of a strong and coherent tablet depends on the process of powder
consolidation, knowledge of the compression behavior of multi-component mixtures is
57

essential for formulation scientists to optimize formulation composition. The (
instrumented tablet machines are considered to be very useful tools to evaluate the
compaction behavior of pharmaceutical materials that make up the formulations.
Usually, these materials differ in physical and chemical properties thereby making the
compaction of multi-component mixtures more challenging.
Compression profiles may act as formulation 'finger-prints' and aid in
troubleshooting. In spite of extensive research in tableting area, the basic questions
still seem to be open. Is it possible to obtain some basic parameters from the force-
time curve in order to predict compression characteristics of different types of
materials? How well can the most important mechanical properties of tablets are .·
estimated from force-time cmves? And, is it possible to predict the compression
behavior of materials in high speed rotary machines used in production on the basis of
compression data obtained from varying types of laboratory tablet machines?
The assessment of the compaction performances of the formulation ingredients
is an important aspect of tablet product design and development. However, there is no
standard compaction test method required · by the pharmacopeias. Therefore data
obtained from two or more compaction studies are not comparable, since because of
the inconsistent techniques employed, the equipment (i.e. type of press and tooling),
the parameters monitored (i.e. compaction speed, applied force, and punch
displacement), or methods used to manipulate the compaction data (i.e. Heckel
equation, work of compaction) vary widely in these studies (6).
58
(
(kN) 10
8
4
2
0
6550 6600 66!10 6700 mo 6800
lower punch - - - reference signal
6850 6900
(msec]
Figure 1. Different Phases of the Compression Cycle (14)
1) Compression: punch head moving against pressure roller
2) Dwell time: maximum deformation takes place
3) Relaxation: punch head leaving pressure roller
59
( Recently, Celik and Okutgen (15) optimized the parameters of tablet weight,
lubrication, equipment, tooling, punch displacement profile, pressure range, as well as
other pre-, during, and postcompaction parameters in their compaction studies, and
proposed a standard compaction functionality 'tabletability' testing method capable of
comparing the relative tabletability features of different materials and different lots of
the same material with high sensitivity. Applying this test method, the authors
generated ' compaction finger-prints' for a number of commonly used tableting
excipients in order to establish a compaction data bank that can eventually be utilized
as an informative reference source in tablet formulation studies.
A recent survey by Shangraw and Demarest (16) revealed a number of
interesting facts about solid-dosage formulation design and development: lactose and
microcrystalline cellulose are the most preferred fillers-binders and tradition is still a
very important reason for the preference.
At present there are hardly any reports available in literature on behavior of
multi-component mixtures during compression. But in reality, a typical tablet dosage
form contains drug, filler, binder, disintegrant and lubricant. Most of the tableting
research was done with individual components. The objective of this investigation
was to evaluate the compression behavior of powder blends consisting of commonly
used pharmaceutical excipients, namely, Anhydrous Lactose, NF, Microcrystalline
Cellulose, NF (Avicel® PH101), Pregelatinized Starch, NF (Starch® 1500) and
Magnesium Stearate, NF. A simplex design was utilized to determine the effect of
individual components comprising the mixtures on tablet properties. Compression
60
parameters were determined from compression force-time pulse. Such information
shall, help to develop a robust tablet formulation that will minimize problems during
scale-up and production conditions.
61
METHODOLOGY
MATERIALS
The materials used in this study were Anhydrous Lactose, NF (Sheffield Products,
USA), Microcrystalline Cellulose, NF (Avicel® PH101) (FMC Inc, USA),
Pregelatinized Starch, NF (Starch® 1500) (Colorcon Inc., USA) and Magnesium
Stearate, NF (Mallinckrodt Co., USA).
METHODS
Preparation of Powder Blends: The powder blends were prepared using commonly
used pharmaceutical excipients, namely, Anhydrous Lactose, NF, Microcrystalline
Cellulose, NF (Avicel® PH101) and Pregelatinized Starch, NF (Starch® 1500) as per
the simplex design described in Table 1. The quantities of the excipients were varied
from 0 to 99% w/w as per the experimental design. The batch size for each blend was
kept constant at 900 grams (equivalent to 3000 tablets). Magnesium Stearate, NF, at
1 % w/w level, was added as lubricant. A total of ten blends were prepared as per the
process described in Figure 2. The ingredients were passed through a #30 mesh hand
screen separately and the screened materials were placed in a Collette Gral 10 High
Shear Mixer. The mixing was performed for three minutes at low speed (430 rpm)
with chopper OFF. The lubricant was passed through a #30 mesh hand screen and was
mixed with the pre-blend for 1 minute at the same mixer settings. Each powder blend
containing composition as per the simplex experimental design (Table 1) was prepared
in a similar fashion.
62
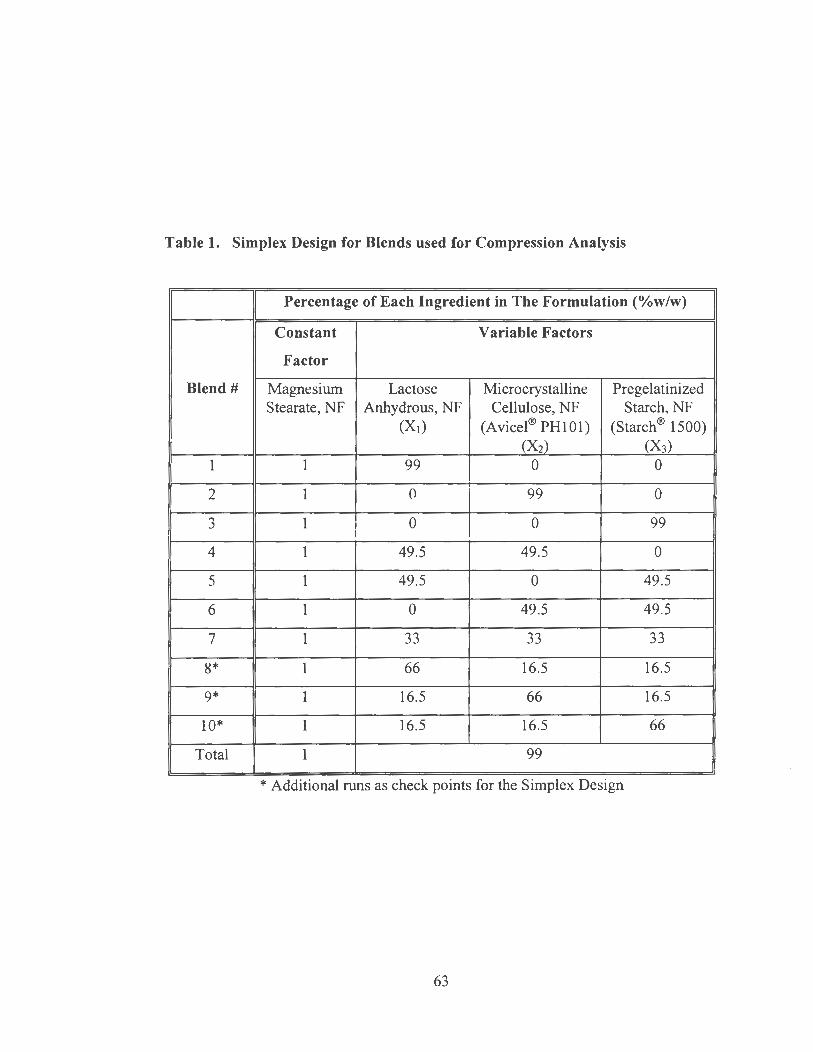
(
Table 1. Simplex Design for Blends used for Compression Analysis
Percentage of Each Ingredient in The Formulation (%w/w)
Constant Variable Factors
Factor
Blend# Magnesium Lactose Microcrystalline Pregelatinized Stearate, NF Anhydrous, NF Cellulose, NF Starch, NF
(X1) (Avicel® PH101) (Starch® 1500) _(_Xtl_ (X3)
1 1 99 0 0
2 1 0 99 0
3 1 0 0 99
4 1 49.5 49.5 0
5 1 49.5 0 49.5
6 1 0 49.5 49.5
7 1 33 33 33
8* 1 66 16.5 16.5
9* 1 16.5 66 16.5
10* 1 16.5 16.5 66
Total 1 99
* Additional runs as check points for the Simplex Design
63
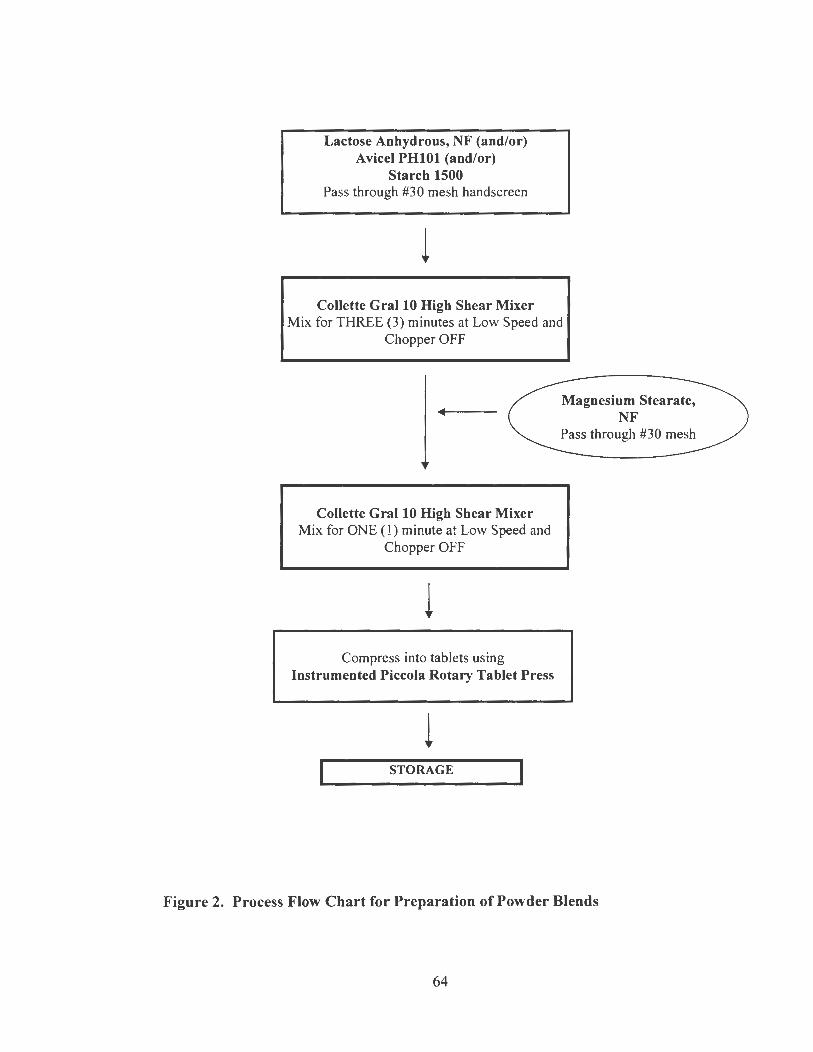
(
Lactose Anhydrous, NF (and/or) Avicel PH101 (and/or)
Starch 1500 Pass through #30 mesh handscreen
Collette Gral 10 High Shear Mixer Mix for THREE (3) minutes at Low Speed and
Chopper OFF
Collette Gral 10 High Shear Mixer Mix for ONE ( 1) minute at Low Speed and
Chopper OFF
Compress into tablets using Instrumented Piccola Rotary Tablet Press
STORAGE
Magnesium Stearate, NF
Figure 2. Process Flow Chart for Preparation of Powder Blends
64
( Characterization of Powder Blends:
The powder mixtures were evaluated for bulk density, tap density,
compressibility index, moisture content, particle size distribution and true density.
Bulk and Tap Density Determination: The weight of powder required to fill a 100
mL graduated cylinder was determined and from which the bulk density was
calculated as the ratio of mass per volume of the powder. The tap density of the
powder was calculated after 100, 250, 500 and 1000 taps using Vander Kamp Tap
Density Tester (Van Kel Industries, Inc., USA). Mean values of three density
measurements were determined. From these measurements, Hausner Number and
Compressibility Index values were calculated.
The Hausner Number was determined using the equation:
Hausner Number = (J'apped Density/Bulk Density)
The Compressibility Index was determined using the following equation:
Compressibility Index {°/o) ={(Initial Volume-Final Volume)/Final Volume}xJOO
= {(J'ap Density-Bulk Density)/Tap Density}xJOO
Moisture Content Determination: A powder sample of 2-4 grams was placed on a
Mettler Moisture Determining Balance (Model Mettler LP16, Mettler Corp., USA) and
the sample was heated at 105 °C until a constant weight was achieved. The moisture
content was thus determined as the percentage of loss on drying (LOD). Mean values
of three measurements were determined.
65
( Particle Size Analysis: The particle size distribution for various powders was
determined using a Gilsonic Autosiever (Model GA-6A, Gilson Company Inc., Ohio).
The sieves used for this analysis have the following opening sizes: 180µm, 125µm,
90µm , 53µm, 45µm , 32µm , and 20µm. A sample of 5 grams of powder was placed on
the top sieve and after sieving for 5 minutes, the powders retained on each sieve were
weighed. The amounts of powders retained were utilized to determine the geometric
mean particle size of the powder blend.
Preparation of Tablets:
A ten-station instn.unented rotary tablet press (Model : Piccola 026 B 10, Piccola
Industria, Riva S.A., Buenos Aires, Argentina) was utilized to compress blends into
tablets. Only five out of ten stations were utilized for compression of powders. A
tablet weight of 300 mg and 12/32 inch standard concave tooling were used. A paddle
feeder was utilized to feed the powder into the die stations. The powder blends were
compressed at -1000 lbs. , 2000 lbs. , 3000 lbs., 4000 lbs. , 5000 lbs., 6000 lbs. and at
maximum achievable force on the tablet press. All blends were compressed at a press
speed of 15 rpm.
Compression Data Collection: The compress10n force-time profiles at different
compressional forces were obtained using an instrumented Piccola Rotary Tablet
Press. The Piccola Rotary Tablet Press was equipped with strain gauge based
transducers to measure the de-aeration force, compression force and ejection force for
the compression cycle. Five stations were utilized to obtain data during compression
66
of various formulations as per the experimental design described in Table 1. A
Compression Research System (PC-30, SMI Inc.) was utilized to gather and analyze
data during compression process. The software allows collecting data in four modes:
Scope, Tooling, Status and Repetitive Sample. In Scope mode, detailed information
about an individual pulse can be obtained. Events such as rise and fall time, dwell
time, contact time, area under the curve, and pulse width characterize the signature of
the pulse. A typical pulse diagram was shown in Figure 3. Pulse signatures are a
function of the physical characteristics of the tablet press, turret speed, and the
properties of the formulation. Therefore for the same press running at a constant
speed, different formulations can be directly compared for evaluation. Tooling mode
provides very useful infom1ation during compression and can be used to evaluate the
performance of each station. The variation in data in this mode can be directly related
to the flow behavior of the powders. Status mode is used to statistically analyze large
quantities of data resulting from extended time runs. This mode can be used to
determine whether a process is in control or not. Repetitive Sample mode is used to
acquire data that will later be cross-plotted. This mode is used typically to determine
the effect of applied force on the tablet hardness.
Characterization of Tablets:
Weight, Thickness & Hardness: The tablets produced for all the blends at various
compressional forces were evaluated for weight variation, thickness and hardness
using Dr. Schleuniger Pharmatron Tablet tester (Model: 6D, Dr. K. Schleuniger,
Geneva, Switzerland). For each parameter, mean value of 10 tablets was determined.
67
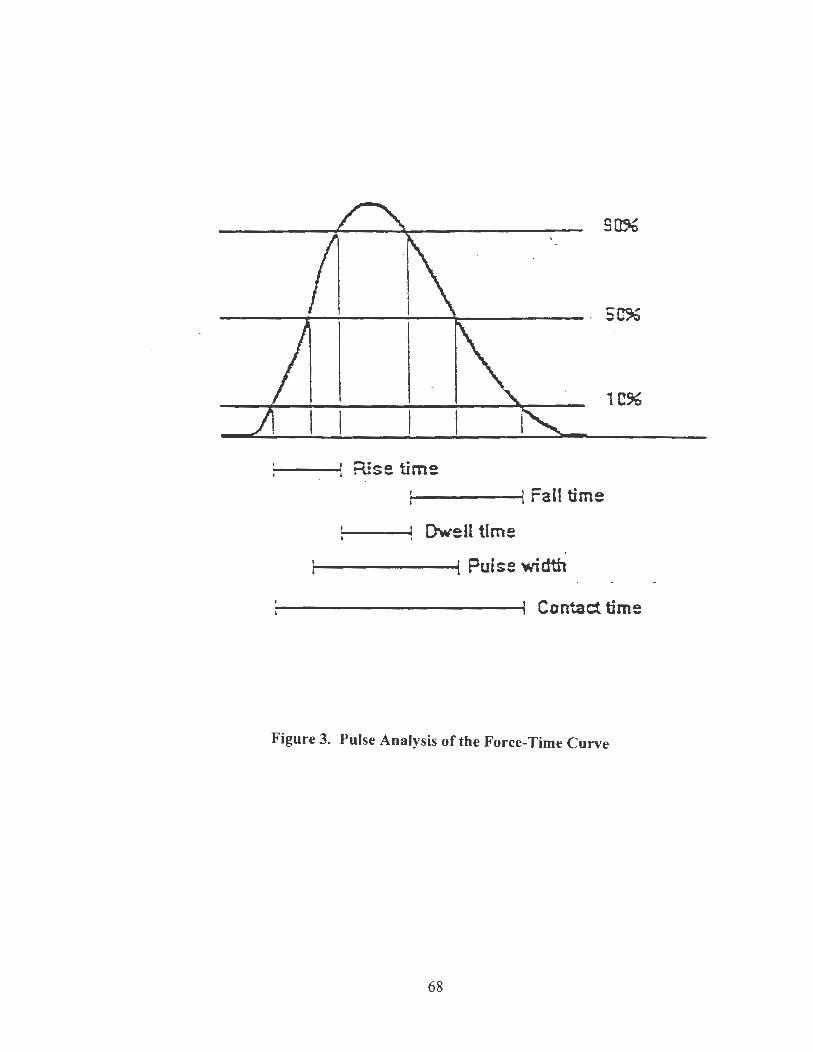
Rise time ,_ ____ Fall time
Dwell time
1--------~ Pulse width
90%
10%
Contact time
Figure 3. Pulse Analysis of the Force-Time Curve
68
(
Disintegration Testing: The disintegration test as per the USP method was performed
utilizing Hanson Research Disintegration Test Apparatus (Model: QC-21 , Chatsworth,
CA, USA) at 30 cycles per minute and distilled water as medium at 37±0.5°C. The
mean disintegration time for six tablets at each experimental condition was
determined.
True Density Determination: The true density of tablets and final blends was
measured using a helium pycnometer (Ultrapycnometer 1000, Quantachrome Corp.,
Fairfield, NJ, USA). Mean values of 5 readings were calculated for both the powder
blends and tablets prepared from various compositions.
Tablet Volume and Surface Area Determination: The tablet volume and surface
area were calculated from the mean values of tablet weight and tablet thickness and
tooling dimensions utilizing a Natoli computer program.
Data Analysis:
Porosity is a function of the voids in a powder column and measurement of
porosity changes as a function of the compression pressure is a method widely used in
describing the compaction processes of powders. For porosity measurements, the
dimensions and weight of a powder column (i.e. apparent density) and particle density
(referred to often as true density) of the solid material should be known. The porosity,
€, can be expressed by the equation:
69
( Where PA is the apparent density of powder column and PT is the particle density of
the compressed material. The value of pA/pT, also referred as D, is regarded as the
relative density or the packing fraction, which describes the solid fraction of a porous
powder column. A value for the applied pressure, P, while loading a powder column
under pressure is a function of the compression force, F, and the punch tip area, A:
P=F/A
The compression force and porosity data were analyzed usmg the Heckel
compressibility model (17), one form of which is:
Ln (1/1-D) =KP+ A
Where D is the relative density, (1-D) represents the pore fraction, P is the applied
pressure, and Kand A are constants. A plot of ln (111-D) vs P is known as a Heckel
plot. The constants Kand A are the slope and intercept, respectively, calculated from
the linear portion of the Heckel plot. Typically at lower pressures, the plot is curved
whereas at higher pressures, the plot is linear. The reciprocal of the slope of the linear
region (K) is termed the mean yield pressure. The intercept, A, is related to the initial
packing density of the powder. The initial curved region of the Heckel plot is
attributed to particle rearrangement and its extent can be quantified using the
relationship:
Db= Da-Do
Where Db is the increase in relative density due to particle rearrangement, Da = 1-e-A is
the extrapolated relative density from the intercept (A) of the linear portion of the
Heckel plot, and 0 0 is the initial relative density.
70
A statistical design, namely "Simplex-Centroid Design" was utilized in the present
study (18). The points of composition in the simplex were explored in accordance
with a lattice arrangement and the responses were represented by polynomials (18-20).
The special cubic design is described by the following equation (18):
Y = b1 X1 + b2 X2 + b3 X3 + b12 X1X2 + b13 X1X3 + b23 X2X3 + bm X1X2X3
where X1 =Lactose Anhydrous, X2 = Avicel PH101, X3 =Starch 1500
b1 ... . b123 =Regression Coefficients
The graphical representation of a polynomial equation is the response surface or
contour plot. The response variables such as tablet hardness, dwell time, tablet surface
area, porosity etc. were fitted using a special cubic model. The response surface
contour plots were obtained for each parameter as a function of varying amounts of
lactose anhydrous, Avicel® PH101 and Starch® 1500. The statistical software
packages Statgraphics® Plus (21) and Design-Expert® (22) were utilized to analyze the
data.
71
RESULTS & DISCUSSION
Physical Characteristics of Powder Blends:
The powder mixtures containing Lactose Anhydrous, NF, Microcrystalline Cellulose,
NF (Avicel® PHIOl), Pregelatinized Starch, NF (Starch® 1500) and Magnesium
Stearate, NF in various proportions as per the simplex design described in Table 1,
were prepared and evaluated for blend characteristics such as bulk density, tapped
density, true density, Hausner Number, compressibility index, moisture content and
particle size distribution. The results are summarized in Tables 2-3 and Figures 4-7.
Most of the active pharmaceutical ingredients have low bulk density and this is
due to entrapment of large amounts of air between particles. At high speeds, this
entrapped air causes capping of tablets and reduces tablet strength. For filling the die
cavities, high bulk density is advantageous. Hence an objective of formulation design
process is to increase the bulk density of the final blend to minimize the air entrapment
and offset the effect of high compression speeds. Figure 4 describes the change of
bulk density of mixtures as a function of component proportion. Among the three
excipients, Starch® 1500 had the highest bulk density (0.7277 gm/cc) followed by
Lactose Anhydrous, NF (0.6717 gm/cc) and Avicel® PHIOl (0.4014 gm/cc). Among
all the mixtures, the binary mixture containing Starch® 1500 and Lactose Anhydrous,
NF in 1: 1 ratio (Blend#5) had the highest bulk density (0.7786 gm/cc) whereas
Avicel® PHIOl (Blend#2) had the lowest bulk density (0.4014 gm/cc). Figure 5
demonstrates the effect of tapping process on the bulk density of mixtures. As can be
seen from Figure 5, 250-500 taps were sufficient to obtain plateau conditions for all
the mixtures, which indicate that the mixtures are free flowing (23, 24).
72
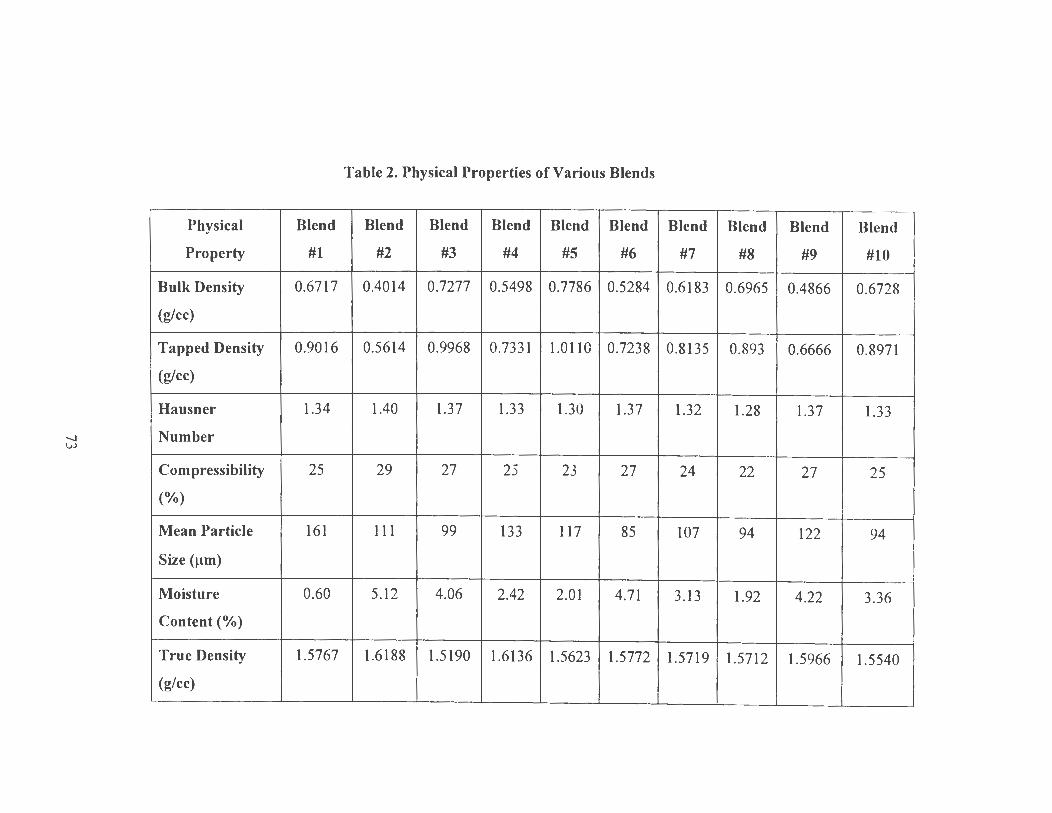
-...) !.,;.)
Physical
Property
Bulk Density
(glee)
Tapped Density
(glee)
Hausner
Number
Compressibility
(%)
Mean Particle
Size (µm)
Moisture
Content(%)
True Density
(glee)
Blend
#1
0.6717
0.9016
1.34
25
161
0.60
1.5767
Table 2. Physical Properties of Various Blends
Blend Blend Blend Blend Blend
#2 #3 #4 #5 #6
0.4014 0.7277 0.5498 0.7786 0.5284
0.5614 0.9968 0.7331 1.0110 0.7238
1.40 1.37 1.33 1.30 1.37
29 27 25 23 27
111 99 133 117 85
5.12 4.06 2.42 2.01 4.71
1.6188 1.5190 1.6136 1.5623 1.5772
,,...~ .
Blend Blend Blend Blend
#7 #8 #9 #10
0.6183 0.6965 0.4866 0.6728
0.8135 0.893 0.6666 0.8971
1.32 1.28 1.37 1.33
24 22 27 25
107 94 122 94
3.13 1.92 4.22 3.36
1.5719 1.5712 1.5966 1.5540
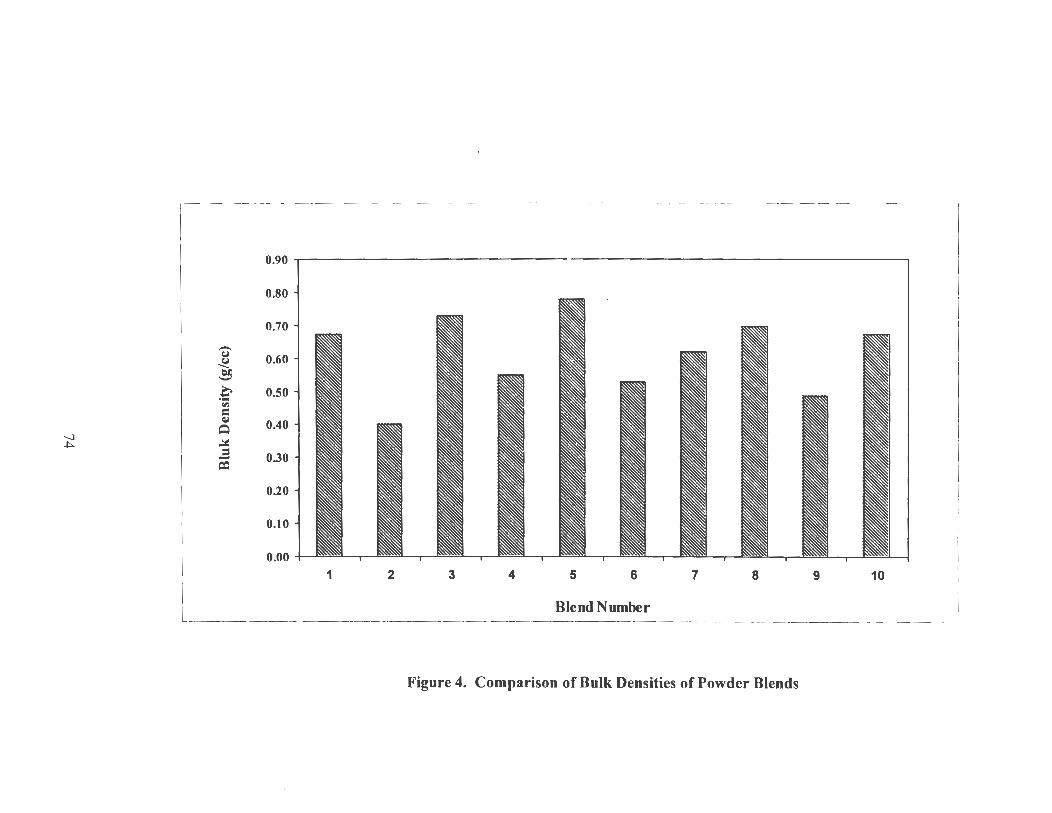
-~
0.90
0.80
0.70
-CJ 0.60 ~ ~ -£ 0.50 <ll
= Q,I 0.40
-J I ~
~ .::c: = 0.30 -CQ
0.20
0.10
0.00 1 2 3 4 5 6 7 8 9 10
Blend Number
Figure 4. Comparison of Bulk Densities of Powder Blends
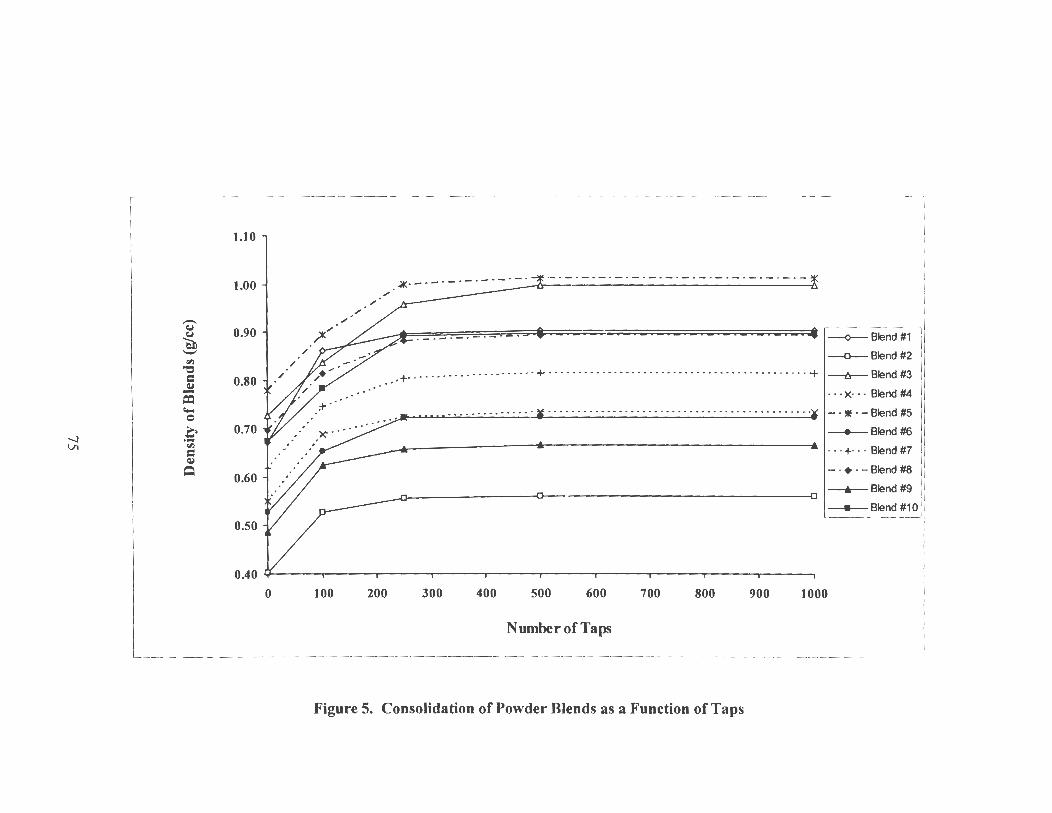
1.10
1.00
-CJ
~ 0.90 -<ll
"O
= 0.80 ~ -~ c..,. 0
-....) I £ 0.70 Vo <ll = ~
~ 0.60
0.50
0.40
0 100
,; ,;
,;
200
~- - . - -- . - . - . - . ~---_--_--_-·-=---. =....:...=...:.:...:..=..:....:...:.-=-:....::....:...=...:.:....:....=...: i
.. -----·------ --<>-Blend #1
--o-- Blend #2
.. +· · · - · · · · · - · . · · · ....... + .. -... -..... -......... -. -..... · · · · · · · · · · · · · · + 1-f:r-- Blend #3
300 400 500 600
Number of Taps
700 800 900 1000
· · ·X· · ·Blend #4
- · ~ · - Blend #5
_.__ Blend #6
· - · +···Blend #7
- ·+·-Blend #8
--&--- Blend #9
--Blend#10
Figure S. Consolidation of Powder Blends as a Function of Taps
·-...,
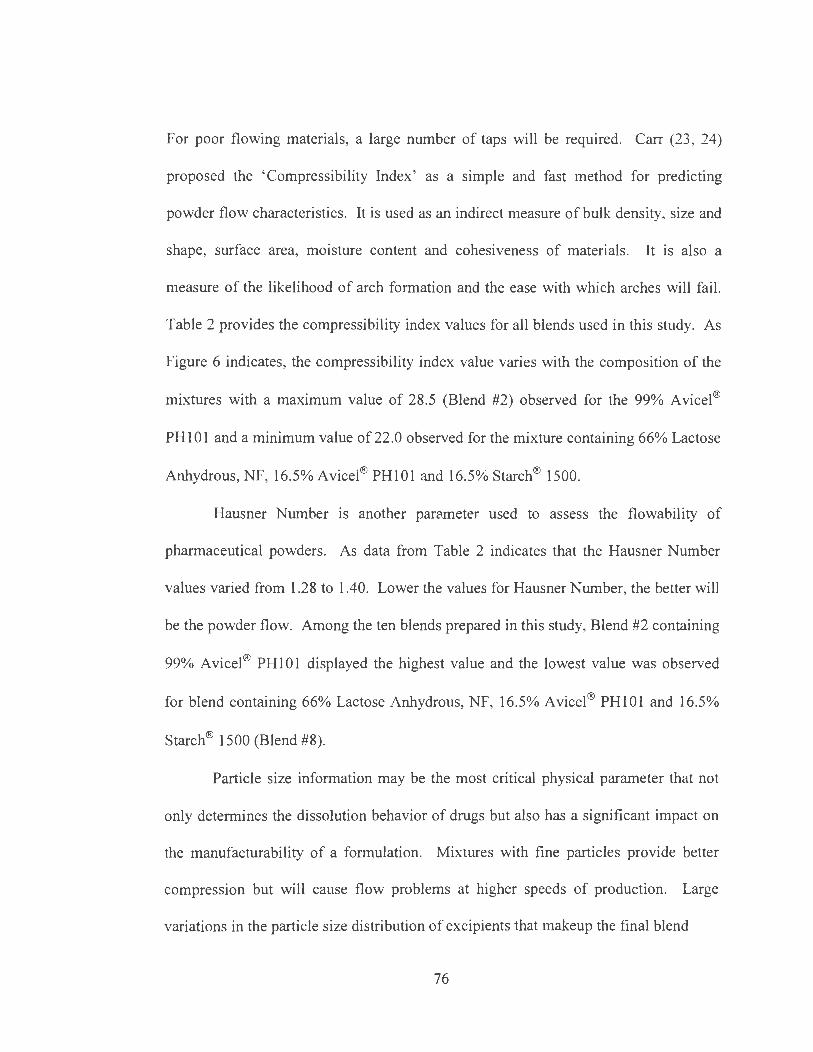
For poor flowing materials, a large number of taps will be required. Carr (23 , 24)
proposed the 'Compressibility Index' as a simple and fast method for predicting
powder flow characteristics. It is used as an indirect measure of bulk density, size and
shape, surface area, moisture content and cohesiveness of materials. It is also a
measure of the likelihood of arch formation and the ease with which arches will fail.
Table 2 provides the compressibility index values for all blends used in this study. As
Figure 6 indicates, the compressibility index value varies with the composition of the
mixtures with a maximum value of 28.5 (Blend #2) observed for the 99% Avicel®
PH101 and a minimum value of22.0 observed for the mixture containing 66% Lactose
Anhydrous, NF, 16.5% Avicel® PH101and16.5% Starch® 1500.
Hausner Number is another parameter used to assess the flowability of
pharmaceutical powders. As data from Table 2 indicates that the Hausner Number
values varied from 1.28 to 1.40. Lower the values for Hausner Number, the better will
be the powder flow. Among the ten blends prepared in this study, Blend #2 containing
99% Avicel® PHlOl displayed the highest value and the lowest value was observed
for blend containing 66% Lactose Anhydrous, NF, 16.5% Avicel® PH101 and 16.5%
Starch® 1500 (Blend #8).
Particle size information may be the most critical physical parameter that not
only determines the dissolution behavior of drugs but also has a significant impact on
the manufacturability of a formulation. Mixtures with fine particles provide better
compression but will cause flow problems at higher speeds of production. Large
variations in the particle size distribution of excipients that makeup the final blend
76
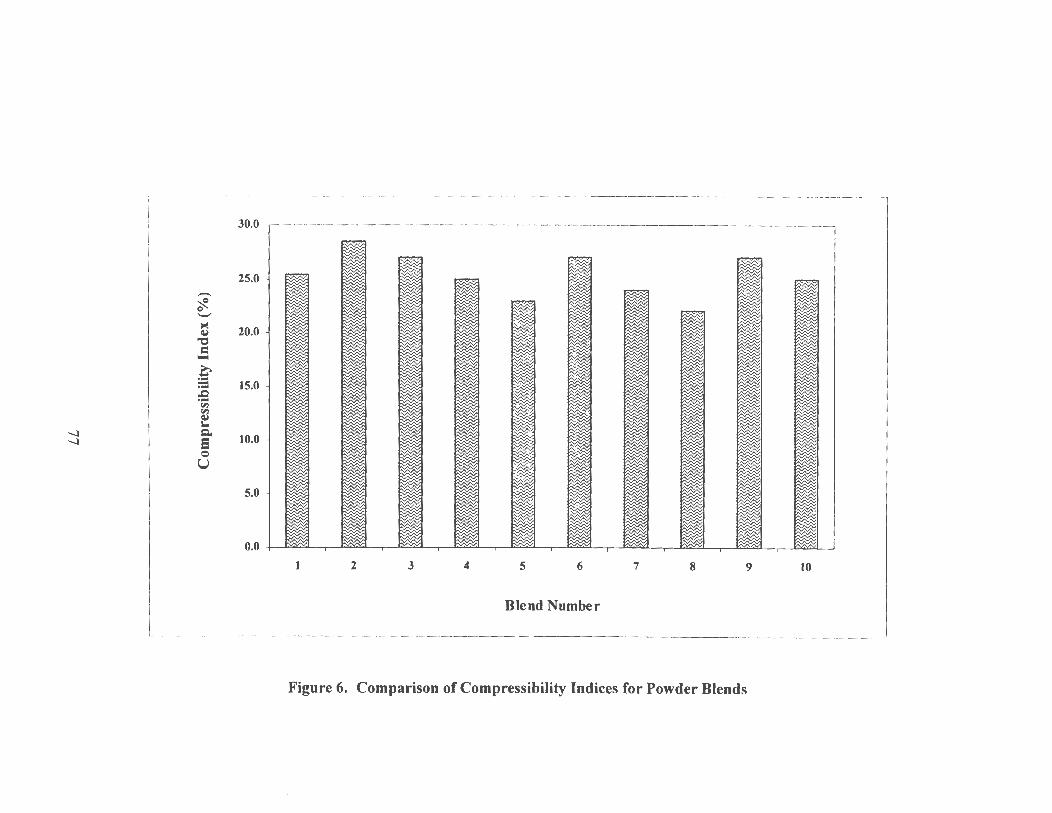
.,..-...,,. ,-
30.0 .--~~~~~~~~~~~~~~~~~~~~~~~~~~~~~~~---,
25.0 ,_..... ~ e ._, I>< I ~ ~ ~ ~ ""' ~ 20.0
"'O
= - I ~ ~ I..~ i== ="%! ~ ~ ~
c =-= 15.0 ,.Q .... <ll <ll ~
'"' -....] I c. 10.0 -....] 8
0 u
5.0
0.0 I l2YX' I ty;y;y;t I tV:Y:£I I f::Y:YXI I ~ I f:Y:Y:Yt I ~ I ~I I ~I I ~I I 2 3 4 5 6 7 8 9 10
Blend Number
Figure 6. Comparison of Compressibility Indices for Powder Blends
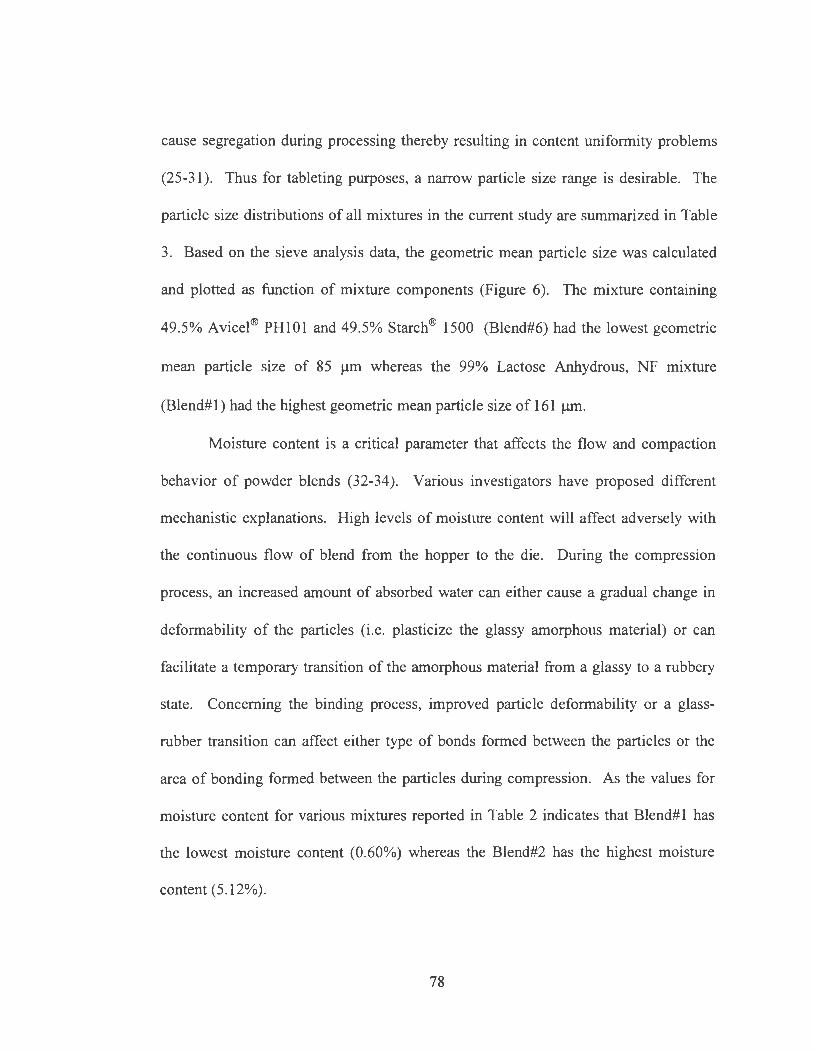
( cause segregation during processing thereby resulting in content uniformity problems
(25-31 ). Thus for tableting purposes, a narrow particle size range is desirable. The
particle size distributions of all mixtures in the current study are summarized in Table
3. Based on the sieve analysis data, the geometric mean particle size was calculated
and plotted as function of mixture components (Figure 6). The mixture containing
49.5% Avicel® PH101 and 49.5% Starch® 1500 (Blend#6) had the lowest geometric
mean particle size of 85 µm whereas the 99% Lactose Anhydrous, NF mixture
(Blend# 1) had the highest geometric mean particle size of 161 µm.
Moisture content is a critical parameter that affects the flow and compaction
behavior of powder blends (32-34). Various investigators have proposed different
mechanistic explanations. High levels of moisture content will affect adversely with
the continuous flow of blend from the hopper to the die. During the compression
process, an increased amount of absorbed water can either cause a gradual change in
deformability of the particles (i.e. plasticize the glassy amorphous material) or can
facilitate a temporary transition of the amorphous material from a glassy to a rubbery
state. Concerning the binding process, improved particle deformability or a glass
rubber transition can affect either type of bonds formed between the particles or the
area of bonding formed between the particles during compression. As the values for
moisture content for various mixtures reported in Table 2 indicates that Blend#l has
the lowest moisture content (0.60%) whereas the Blend#2 has the highest moisture
content (5.12%).
78
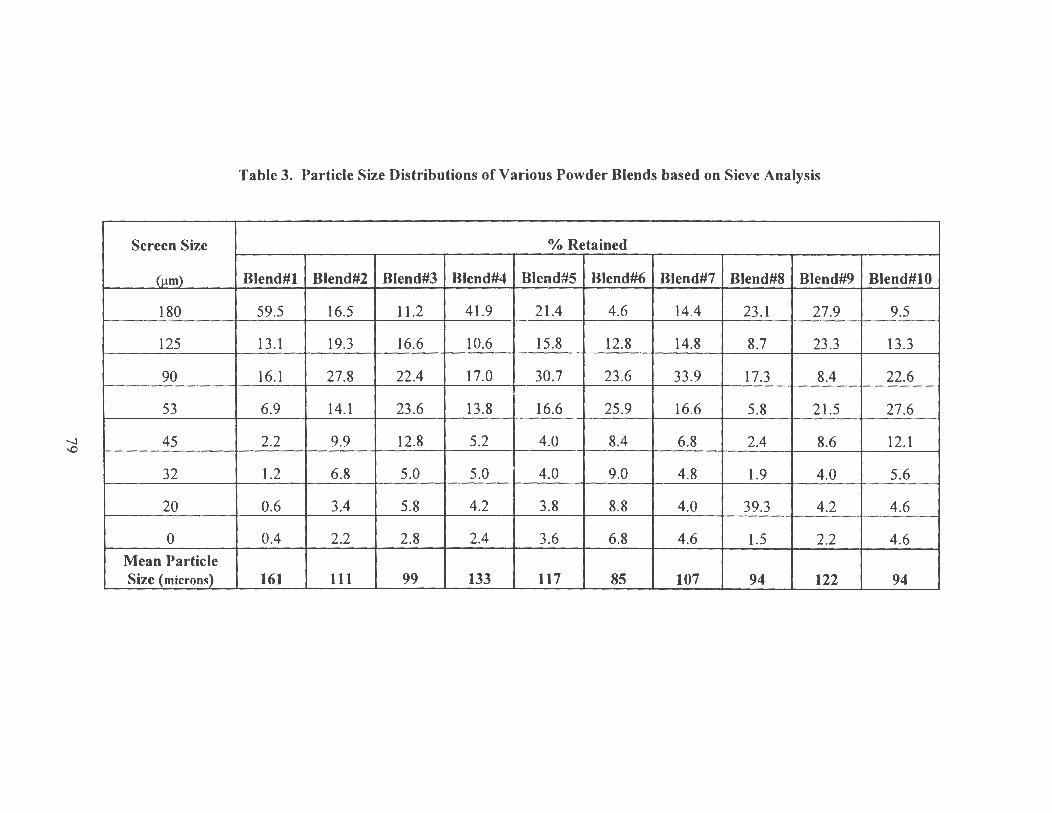
-...J
"°
Screen Size
_fu_m_l
180
125
90
53
45
32
20
0
Mean Particle Size (microntl_
,.---.....
Table 3. Particle Size Distributions of Various Powder Blends based on Sieve Analysis
% Retained
Blend#l Blend#2 Blend#3 Blend#4 Blend#S Blend#6 Blend#7 Blend#8 Blend#9 Blend#lO
59.5 16.5 11.2 41.9 21.4 4.6 14.4 23.l 27.9 9.5
13.1 19.3 16.6 10.6 15.8 12.8 14.8 8.7 23.3 13.3
16.l 27.8 22.4 17.0 30.7 23.6 33.9 17.3 8.4 22.6
6.9 14.l 23.6 13 .8 16.6 25.9 16.6 5.8 21.5 27.6
2.2 9.9 12.8 5.2 4.0 8.4 6.8 2.4 8.6 12. l
1.2 6.8 5.0 5.0 4.0 9.0 4.8 1.9 4.0 5.6
0.6 3.4 5.8 4.2 3.8 8.8 4.0 39.3 4.2 4.6
0.4 2.2 2.8 2.4 3.6 6.8 4.6 1.5 2.2 4.6
161 111 99 133 117 85 107 94 122 94
..........
180
160
,..-._ 140 "' = 0
i.. .:= 120 e .._, ~ 100
.!S 00 ~ 80 ~ "f
60 "' ~ 00 I = 40 0 "' ~
~ 20
0 1 2 3 4 5 6 7 8 9 JO
Blend Number
Figure 7. Geometric Mean Particle Sizes Based on Sieve Analysis for Powder Blends
( The true densities for all the mixtures were determined used helium
pycnometer. Table 2 provides the summary of these results. The true density values
varied from 1.5190 glee for blend#3 (99% Starch® 1500) through 1.6188 glee for
blend#2 (99% Avicel® PH101). These values were used in determining the tablet
porosity values in order to analyze the densification behavior of various experimental
blends.
Characterization of Tablets: Tablets prepared from the blends at varying levels of
compression force (1000 lbs, 2000 lbs, 3000 lbs, 4000 lbs, 5000 lbs, 6000 lbs and
maximum achievable force on the tableting machine were characterized for weight
variation, thickness, hardness, friability loss and disintegration time. The results are
summarized in Tables 4 to 13. The tablet weights measured during the study indicated
that all blends produced tablets with consistent weights and the weight variations are
within the acceptable range. Maximum variability in tablet weight was observed for
the blend containing 99% of Starch® 1500 (Blend#3) and minimum variability was
observed for tablets prepared using Blend#4 which contains Lactose Anhydrous, NF
and Avicel® PH101 at 49.5% level. The tablet weight is considered to be dependent
upon the die fill, compression speed, feeding mechanism and nature of blend (31 , 35,
36). The tablet weight variation observed in the present study may be attributed to the
differences in the flow properties of the blends and also due to the poor binding
properties of the components that make up the tablets.
81
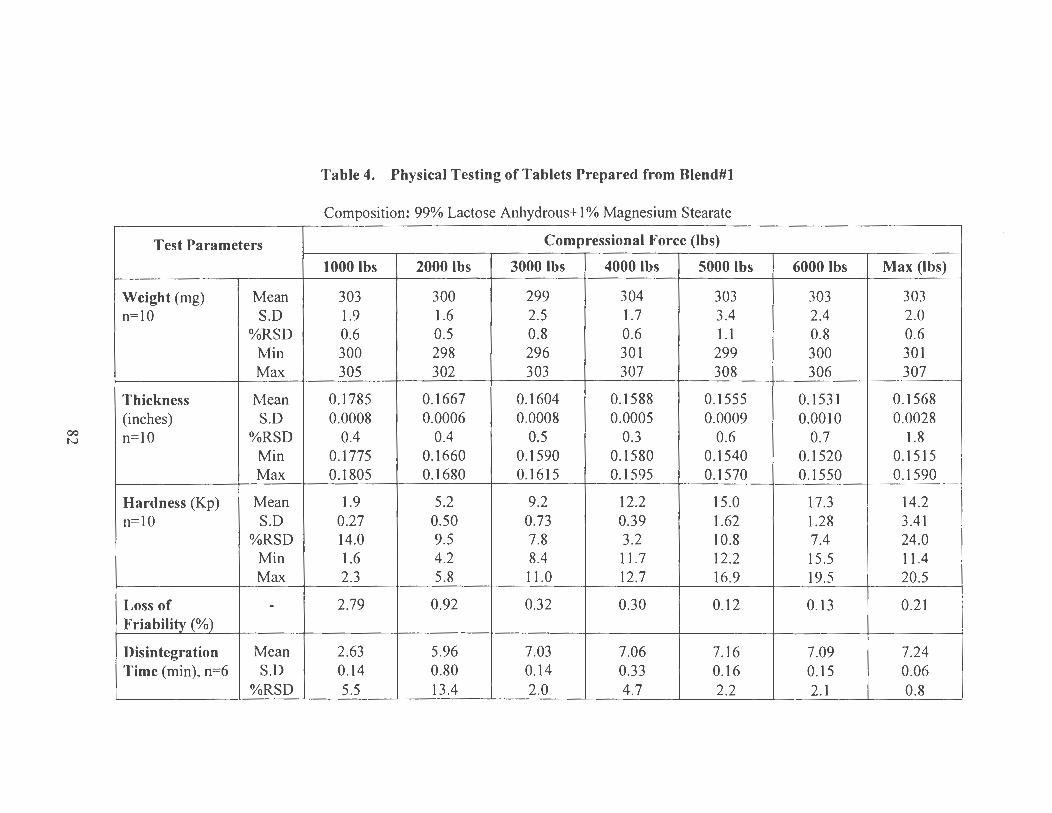
00 N
Test Parameters
Weight (mg) Mean n=lO S.D
%RSD Min Max
Thickness Mean (inches) S.D n=lO %RSD
Min Max
Hardness (Kp) Mean n= lO S.D
%RSD Min Max
Loss of -Friabil!!Y_io/o}_
Disintegration Mean Time (min), n=6 S.D
%RSD
Table 4. Physical Testing of Tablets Prepared from Blend#l
Composition: 99% Lactose Anhydrous+ 1 % Magnesium Stearate
Compressional Force (lbs)
1000 lbs 2000 lbs 3000lbs 4000 lbs SOOOlbs 60001bs Max (lbs)
303 300 299 304 303 303 303 1.9 1.6 2.5 1.7 3.4 2.4 2.0 0.6 0.5 0.8 0.6 1.1 0.8 0.6 300 298 296 301 299 300 301 305 302 303 307 308 306 307
0.1785 0.1667 0.1604 0.1588 0.1555 0.1531 0.1568 0.0008 0.0006 0.0008 0.0005 0.0009 0.0010 0.0028
0.4 0.4 0.5 0.3 0.6 0.7 1.8 0.1775 0.1660 0.1590 0.1580 0.1540 0.1520 0.1515 0.1805 0.1680 0.1615 0.1595 0.1570 0.1550 0.1590
1.9 5.2 9.2 12.2 15.0 17.3 14.2 0.27 0.50 0.73 0.39 1.62 1.28 3.41 14.0 9.5 7.8 3.2 10.8 7.4 24.0 1.6 4.2 8.4 11.7 12.2 15.5 11.4 2.3 5.8 11.0 12.7 16.9 19.5 20.5
2.79 0.92 0.32 0.30 0.12 0.13 0.21
2.63 5.96 7.03 7.06 7.16 7.09 7.24 0.14 0.80 0.14 0.33 0.16 0.15 0.06 5.5 13.4 2.0 4.7 2.2 2.1 0.8
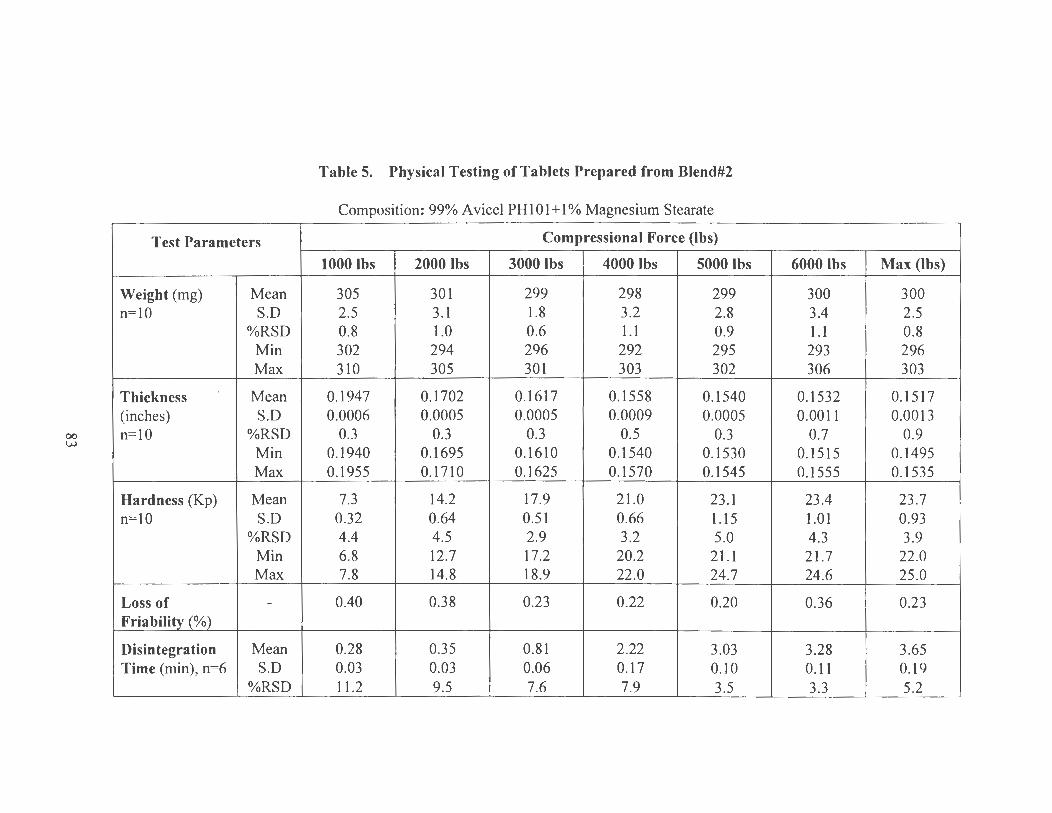
00 w
Test Parameters
Weight (mg) Mean n= lO S.D
%RSD Min Max
Thickness Mean (inches) S.D n= lO %RSD
Min Max
Hardness (Kp) Mean n=lO S.D
%RSD Min Max
Loss of -Friabilityj_o/<l}_
Disintegration Mean Time (min), n=6 S.D
%RSD
~
Table 5. Physical Testing of Tablets Prepared from Blend#2
Composition: 99% A vi eel PH 101+1 % Magnesium Stearate
Compressional Force (lbs)
1000 lbs 20001bs 30001bs 40001bs SOOOlbs 6000 lbs Max (lbs)
305 301 299 298 299 300 300 2.5 3.1 1.8 3.2 2.8 3.4 2.5 0.8 1.0 0.6 1.1 0.9 1.1 0.8 302 294 296 292 295 293 296 310 305 301 303 302 306 303
0.1947 0.1702 0.1617 0.1558 0.1540 0.1532 0.1517 0.0006 0.0005 0.0005 0.0009 0.0005 0.0011 0.0013
0.3 0.3 0.3 0.5 0.3 0.7 0.9 0.1940 0.1695 0.1610 0.1540 0.1530 0.1515 0.1495 0.1955 0.1710 0.1625 0.1570 0.1545 0.1555 0.1535
7.3 14.2 17.9 21.0 23.1 23.4 23.7 0.32 0.64 0.51 0.66 1.15 1.01 0.93 4.4 4.5 2.9 3.2 5.0 4.3 3.9 6.8 12.7 17.2 20.2 21.1 21.7 22.0 7.8 14.8 18.9 22.0 24.7 24.6 25.0
0.40 0.38 0.23 0.22 0.20 0.36 0.23
0.28 0.35 0.81 2.22 3.03 3.28 3.65 0.03 0.03 0.06 0.17 0.10 0.11 0.19 11.2 9.5 7.6 7.9 3.5 3.3 5.2
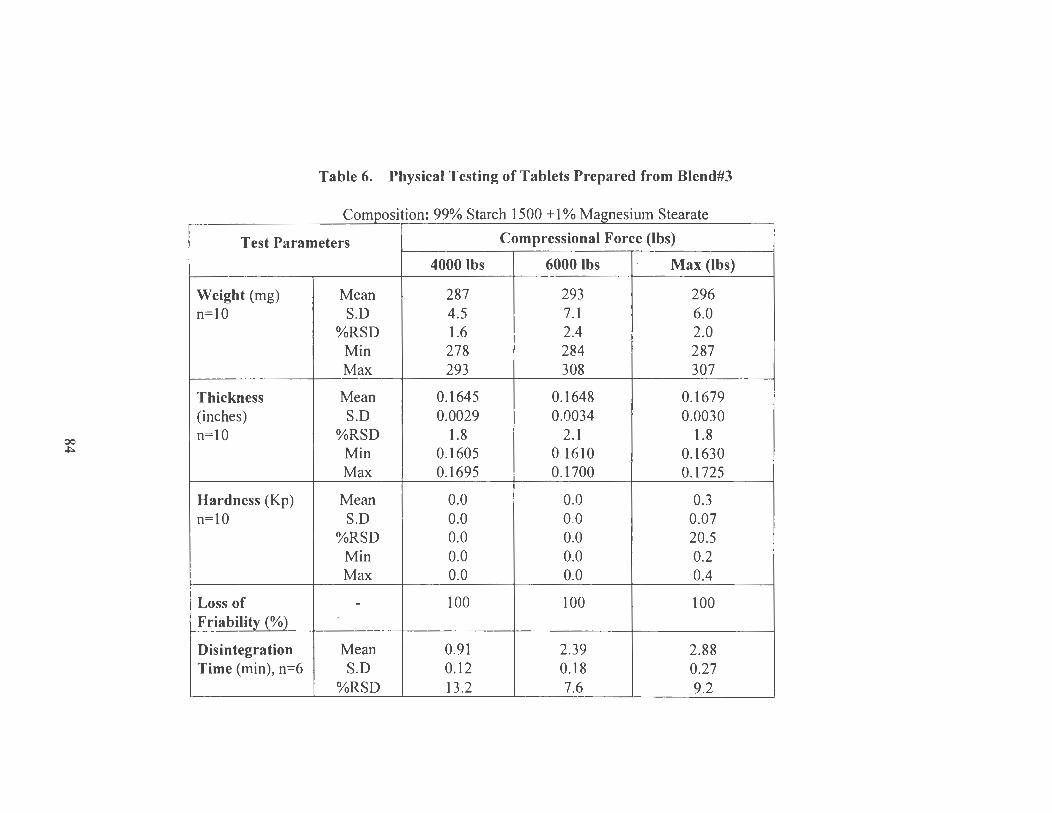
00 ~
~~
Table 6. Physical Testing of Tablets Prepared from Blend#3
c 99% Starch 1500 + 1 % M s Test Parameters Compressional Force (lbs)
40001bs 6000Ibs Max (lbs)
Weight (mg) Mean 287 293 296 n= lO S.D 4.5 7.1 6.0
%RSD 1.6 2.4 2.0 Min 278 284 287 Max 293 308 307
Thickness Mean 0.1645 0.1648 0.1679 (inches) S.D 0.0029 0.0034 0.0030 n=lO %RSD 1.8 2.1 1.8
Min 0.1605 0.1610 0.1630 Max 0.1695 0.1700 0.1725
Hardness (Kp) Mean 0.0 0.0 0.3 n=lO S.D 0.0 0.0 0.07
%RSD 0.0 0.0 20.5 Min 0.0 0.0 0.2 Max 0.0 0.0 0.4
Loss of - 100 100 100 Friabil!!Y_io/tl_
Disintegration Mean 0.91 2.39 2.88 Time (min), n=6 S.D 0.12 0.18 0.27
%RSD 13.2 7.6 9.2
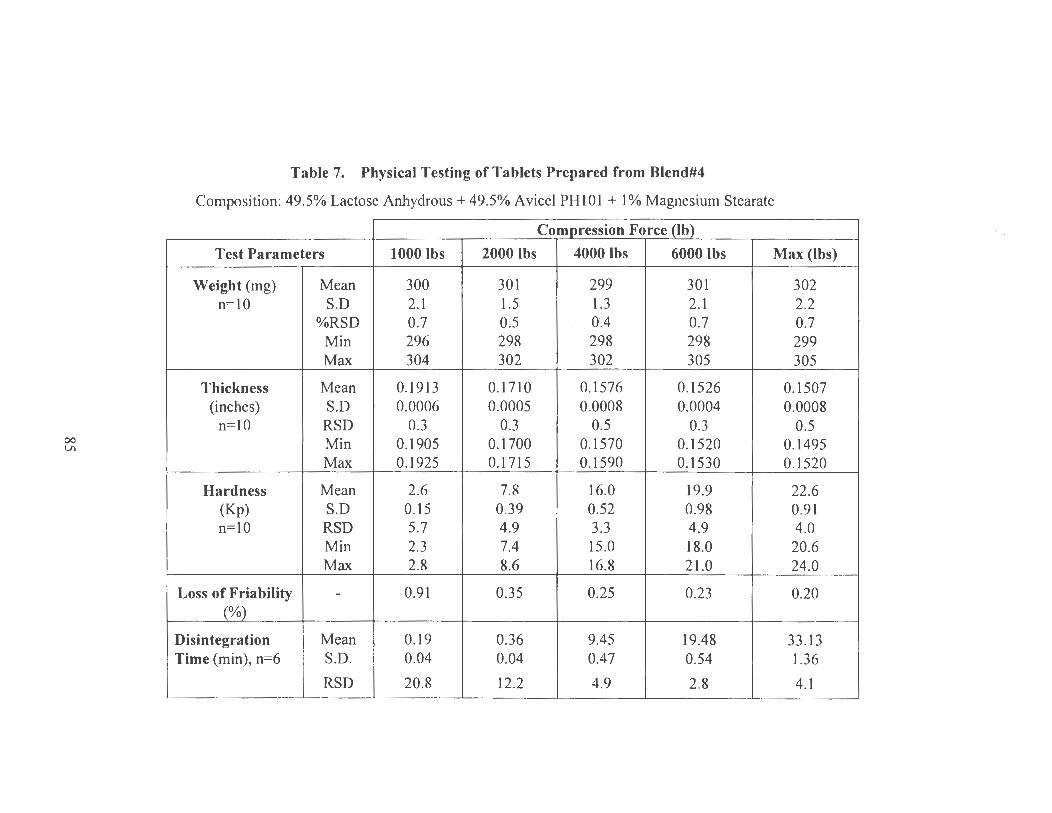
00 VI
Table 7. Physical Testing of Tablets Prepared from Blend#4
Composition: 49 .5% Lactose Anhydrous + 49 .5% A vicel PH 101 + 1 % Magnesium Stearate
Com]!_ression Force J.lbl
Test Parameters 1000 lbs 2000 lbs 40001bs 6000 lbs Max (lbs)
Weight (mg) Mean 300 301 299 301 302 n= lO S.D 2.1 1.5 1.3 2.1 2.2
%RSD 0.7 0.5 OA 0.7 0.7 Min 296 298 298 298 299 Max 304 302 302 305 305
Thickness Mean 0.1913 0.1710 0.1576 0.1526 0.1507 (inches) S.D 0.0006 0.0005 0.0008 0.0004 0.0008
n=lO RSD 0.3 0.3 0.5 0.3 0.5 Min 0.1905 0.1700 0.1570 0.1520 0.1495 Max 0.1925 0.1715 0.1590 0.1530 0.1520
Hardness Mean 2.6 7.8 16.0 19.9 22.6 (Kp) S.D 0.15 0.39 0.52 0.98 0.91 n=lO RSD 5.7 4.9 3.3 4.9 4.0
Min 2.3 7.4 15.0 18.0 20.6 Max 2.8 8.6 16.8 21.0 24.0
Loss of Friability - 0.91 0.35 0.25 0.23 0.20 _{_o/tl
Disintegration Mean 0.19 0.36 9.45 19.48 33.13 Time (min), n=6 S.D. 0.04 0.04 0.47 0.54 1.36
RSD 20.8 12.2 4.9 2.8 4.1
......,
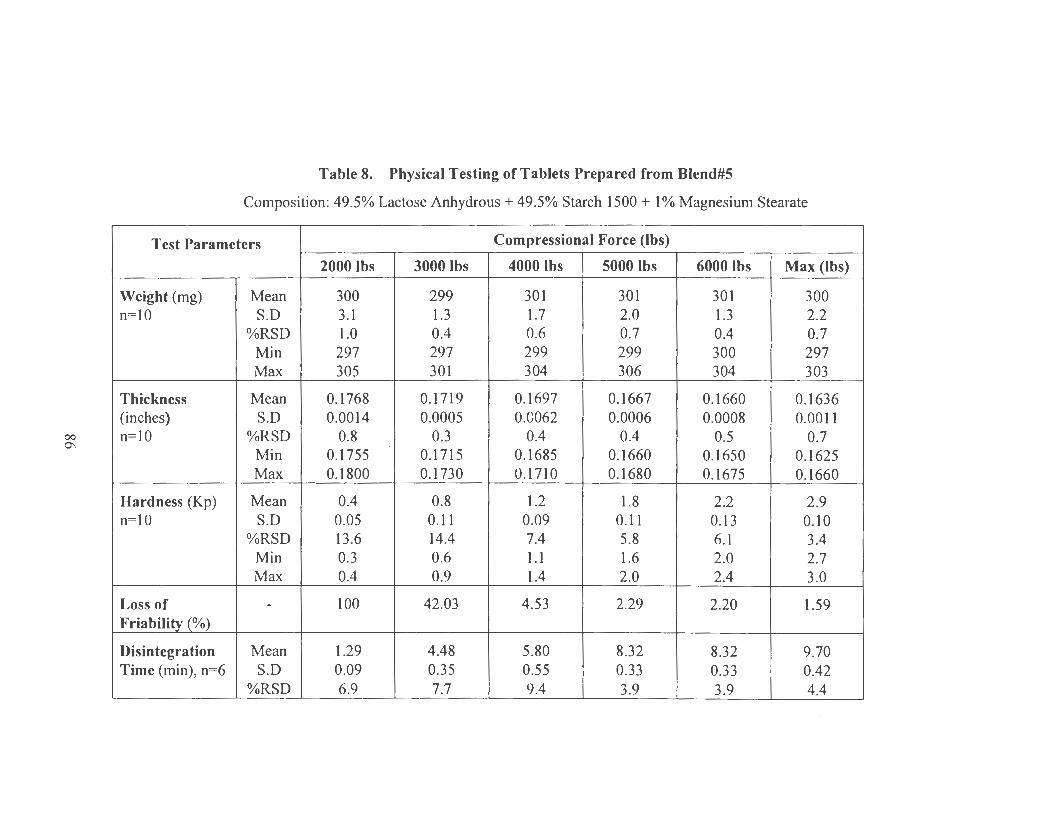
00 0\
Table 8. Physical Testing of Tablets Prepared from Blend#S
Composition: 49 .5% Lactose Anhydrous + 49 .5% Starch 1500 + 1 % Magnesium Stearate
Test Parameters Compressional Force (lbs)
20001bs 30001bs 4000 lbs SOOOlbs 60001bs Max (lbs)
Weight (mg) Mean 300 299 301 301 301 300 n=lO S.D 3.1 1.3 1.7 2.0 1.3 2.2
%RSD 1.0 0.4 0.6 0.7 0.4 0.7 Min 297 297 299 299 300 297 Max 305 301 304 306 304 303
Thickness Mean 0.1768 0.1719 0.1697 0.1667 0.1660 0.1636 (inches) S.D 0.0014 0.0005 0.0062 0.0006 0.0008 0.0011 n=lO %RSD 0.8 0.3 0.4 0.4 0.5 0.7
Min 0.1755 0.1715 0.1685 0.1660 0.1650 0.1625 Max 0.1800 0.1730 0.1710 0.1680 0.1675 0.1660
Hardness (Kp) Mean 0.4 0.8 1.2 1.8 2.2 2.9 n=lO S.D 0.05 0.11 0.09 0.11 0.13 0.10
%RSD 13.6 14.4 7.4 5.8 6.1 3.4 Min 0.3 0.6 1.1 1.6 2.0 2.7 Max 0.4 0.9 1.4 2.0 2.4 3.0
Loss of - 100 42.03 4.53 2.29 2.20 1.59 Friabil!!Yio/tl
Disintegration Mean 1.29 4.48 5.80 8.32 8.32 9.70 Time (min), n=6 S.D 0.09 0.35 0.55 0.33 0.33 0.42
%RSD 6.9 7.7 9.4 3.9 3.9 4.4
-----,,_
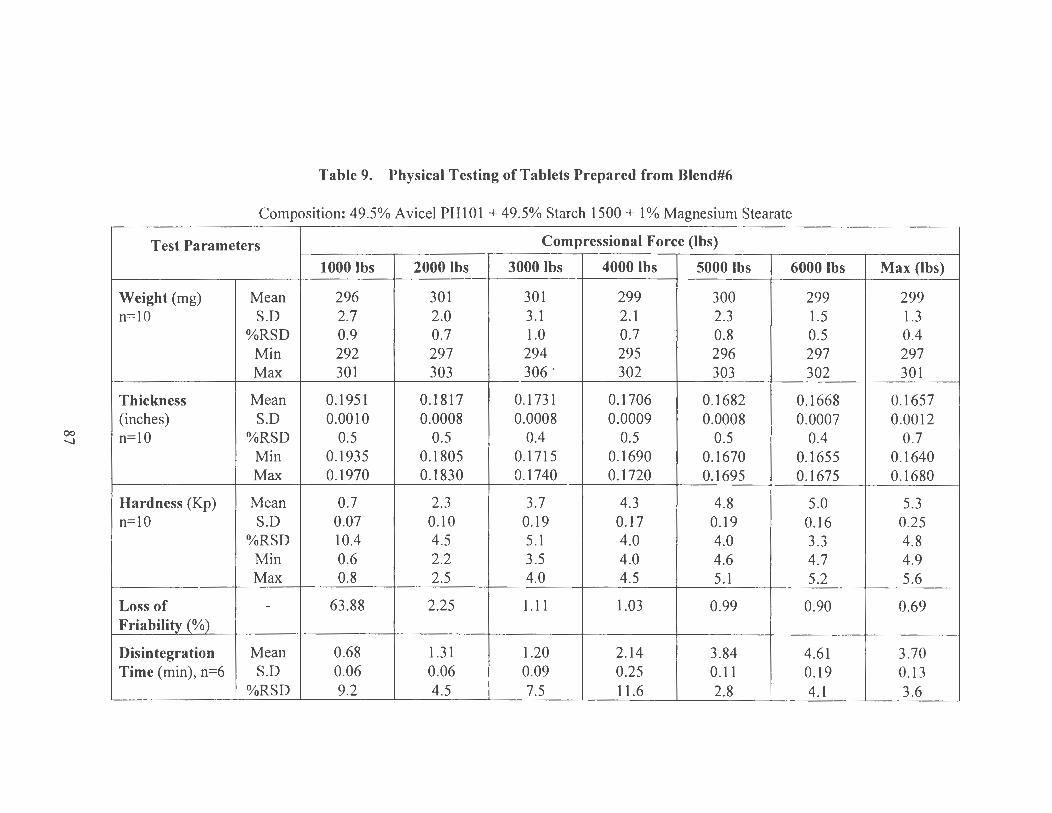
00 -.....)
Table 9. Physical Testing of Tablets Prepared from Blend#6
Composition: 49.5% Avicel PH101+49.5% Starch 1500 + 1 % Magnesium Stearate
Test Parameters Compressional Force (lbs)
1000 lbs 2000 lbs 3000lbs 40001bs SOOOlbs 6000lbs
Weight (mg) Mean 296 301 301 299 300 299 n=lO S.D 2.7 2.0 3.1 2.1 2.3 1.5
%RSD 0.9 0.7 1.0 0.7 0.8 0.5 Min 292 297 294 295 296 297 Max 301 303 306. 302 303 302
Thickness Mean 0.1951 0.1817 0.1731 0.1706 0.1682 0.1668 (inches) S.D 0.0010 0.0008 0.0008 0.0009 0.0008 0.0007 n=lO %RSD 0.5 0.5 0.4 0.5 0.5 0.4
Min 0.1935 0.1805 0.1715 0.1690 0.1670 0.1655 Max 0.1970 0.1830 0.1740 0.1720 0.1695 0.1675
Hardness (Kp) Mean 0.7 2.3 3.7 4.3 4.8 5.0 n=lO S.D 0.07 0.10 0.19 0.17 0.19 0.16
%RSD 10.4 4.5 5.1 4.0 4.0 3.3 Min 0.6 2.2 3.5 4.0 4.6 4.7 Max 0.8 2.5 4.0 4.5 5.1 5.2
Loss of - 63.88 2.25 1.11 1.03 0.99 0.90 Friabili!Y_(_o/e>}_
Disintegration Mean 0.68 1.31 1.20 2.14 3.84 4.61 Time (min), n=6 S.D 0.06 0.06 0.09 0.25 0.11 0.19
%RSD 9.2 4.5 7.5 11.6 2.8 4.1
Max (lbs)
299 1.3 0.4 297 301
0.1657 0.0012
0.7 0.1640 0.1680
5.3 0.25 4.8 4.9 5.6
0.69
3.70 0.13 3.6

00 00
Table 10. Physical Testing of Tablets Prepared from Blend#7
Composition: 33% Lactose Anhydrous+ 33% Avicel PH101+33% Starch 1500 + 1% Magnesium Stearate
Test Parameters Compressional Force (lbs)
lOOOlbs 2000lbs 3000 lbs 40001bs 5000 lbs 6000 lbs
Weight (mg) Mean 300 298 299 299 298 299 n=lO S.D 2.2 2.2 1.5 1.6 2.4 0.9
%RSD 0.7 0.7 0.5 0.5 0.8 0.3 Min 296 295 296 297 295 297 Max 303 302 301 302 302 300
Thickness Mean 0.1937 0.1784 U.1671 0.1627 0.1601 0.1586 (inches) S.D 0.0012 0.0005 0.0005 0.0006 0.0006 0.0005 n=lO %RSD 0.6 0.3 0.3 0.4 0.4 0.3
Min O.I 910 0.1775 0.1665 0.1620 0.1590 0.1575 Max 0.1955 0.1790 0.1680 0.1640 O. I610 O. I 590
Hardness (Kp) Mean 0.4 1.7 3.4 4.9 5.8 6.2 n=lO S.D 0.04 0.15 O.I 7 0.24 O.I8 0.26
%RSD I I. I 8.7 4.9 4.9 3.1 4.2 Min 0.3 1.5 3. I 4.6 5.5 5.6 Max 0.4 2.0 3.6 5.3 6.0 6.5
Loss of - 86.84 1.97 0.77 0.52 0.48 0.43 Friabil!!r.i._o/tl_
Disintegration Mean 0.50 l.I 9 2.59 4.07 6.99 7.24 Time (min), n=6 S.D 0.10 0.36 O.I6 0.24 0.17 0.43
%RSD 21.1 29.8 6.2 5.8 2.5 5.9
-.....
Max (lbs)
299 2.4 0.8 295 303
0.1566 0.0004
0.3 0.1560 0.1570
7.4 0.3I 4.2 6.7 7.9
0.42
7.98 0.14 1.8
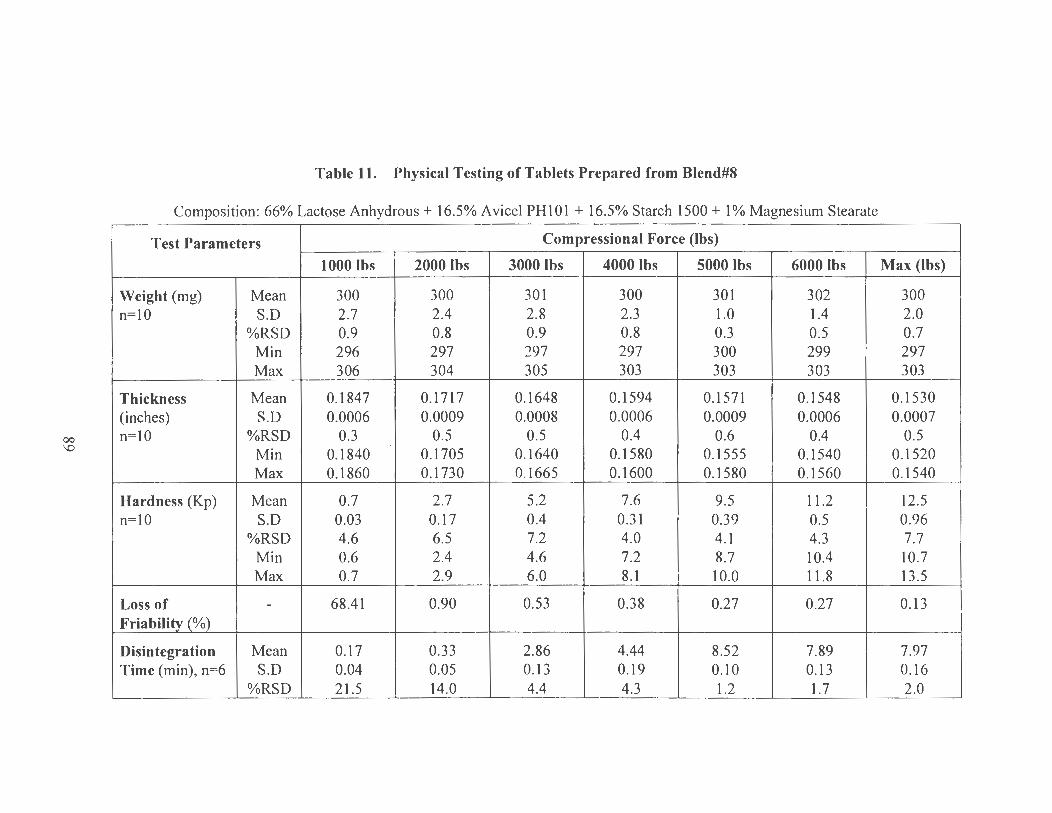
00 \0
Table 11. Physical Testing of Tablets Prepared from Blend#8
Composition: 66% Lactose Anhydrous+ 16.5% A vice! PHI 01 + 16.5% Starch 1500 + 1 % Magnesium Stearate
Test Parameters Compressional Force (lbs)
lOOOlbs 20001bs 30001bs 40001bs SOOOlbs 60001bs
Weight (mg) Mean 300 300 301 300 301 302 n=IO S.D 2.7 2.4 2.8 2.3 1.0 1.4
%RSD 0.9 0.8 0.9 0.8 0.3 0.5 Min 296 297 297 297 300 299 Max 306 304 305 303 303 303
Thickness Mean 0.1847 0.1717 0.1648 0.1594 0.1571 0.1548 (inches) S.D 0.0006 0.0009 0.0008 0.0006 0.0009 0.0006 n=lO %RSD 0.3 0.5 0.5 0.4 0.6 0.4
Min 0.1840 0.1705 0.1640 0.1580 0.1555 0.1540 Max 0.1860 0.1730 0.1665 0.1600 0.1580 0.1560
Hardness (Kp) Mean 0.7 2.7 5.2 7.6 9.5 11.2 n=IO S.D 0.03 0.17 0.4 0.31 0.39 0.5
%RSD 4.6 6.5 7.2 4.0 4.1 4.3 Min 0.6 2.4 4.6 7.2 8.7 10.4 Max 0.7 2.9 6.0 8.1 10.0 11.8
Loss of - 68.41 0.90 0.53 0.38 0.27 0.27 Friabili!Yl_o/o}_
Disintegration Mean 0.17 0.33 2.86 4.44 8.52 7.89 Time (min), n=6 S.D 0.04 0.05 0.13 0.19 0.10 0.13
%RSD 21.5 14.0 4.4 4.3 1.2 1.7
-,
Max (lbs)
300 2.0 0.7 297 303
0.1530 0.0007
0.5 0.1520 0.1540
12.5 0.96 7.7 10.7 13.5
0.13
7.97 0.16 2.0

\0 0
Table 12. Physical Testing of Tablets Prepared from Blend#9
Composition: 16.5% Lactose Anhydrous + 66% A vice! PH 101 + 16.5% Starch 1500 + 1 % Magnesium Stearate
Test Parameters Compressional Force (lbs)
1000 lbs 20001bs 3000Ibs 40001bs 50001bs 6000Ibs
Weight (mg) Mean 299 300 300 302 302 300 n=lO S.D 2.7 1.9 2.7 . 1.8 2.1 2.4
%RSD 0.9 0.6 0.9 0.6 0.7 0.8 Min 294 296 296 298 299 296 Max 303 303 303 304 304 304
Thickness Mean 0.1952 0.1727 0.1628 0.1586 0.1563 0.1548 (inches) S.D 0.0005 0.0006 0.0007
' 0.0008 0.0006 0.0007
n=lO %RSD 0.3 0.4 0.4 0.5 0.4 0.4 Min 0.1945 0.1715 0.1620 0.1575 0.1555 0.1530 Max 0.1960 0.1740 0.1640 0.1600 0.1575 0.1555
Hardness (Kp) Mean 2.2 6.2 10. l 11.6 13. l 13 .8 n=lO S.D 0.14 0.4 0.42 0.29 0.54 0.6
%RSD 6.7 7.2 4.2 2.5 4.1 4.0 Min 2.0 5.6 9.3 11.3 12.2 12.7 Max 2.4 7.0 10.7 12. l 14.0 14.5
Loss of - 1.48 0.56 0.43 0.33 0.33 0.31 Fri ab ili!Yio/tl_
Disintegration Mean 0.23 0.50 3.91 5.05 8.92 10.89 Time (min), n=6 S.D 0.08 0.05 0.08 0.20 0.14 0.13
%RSD 33.8 9.6 2.0 3.9 1.6 1.2
-
Max (lbs)
302 2.3 0.8 297 305
0.1539 0.0006
0.4 0.1530 0.1545
15.6 0.63 4.0 14.6 16.4
0.28
12.63 0.14 1.1
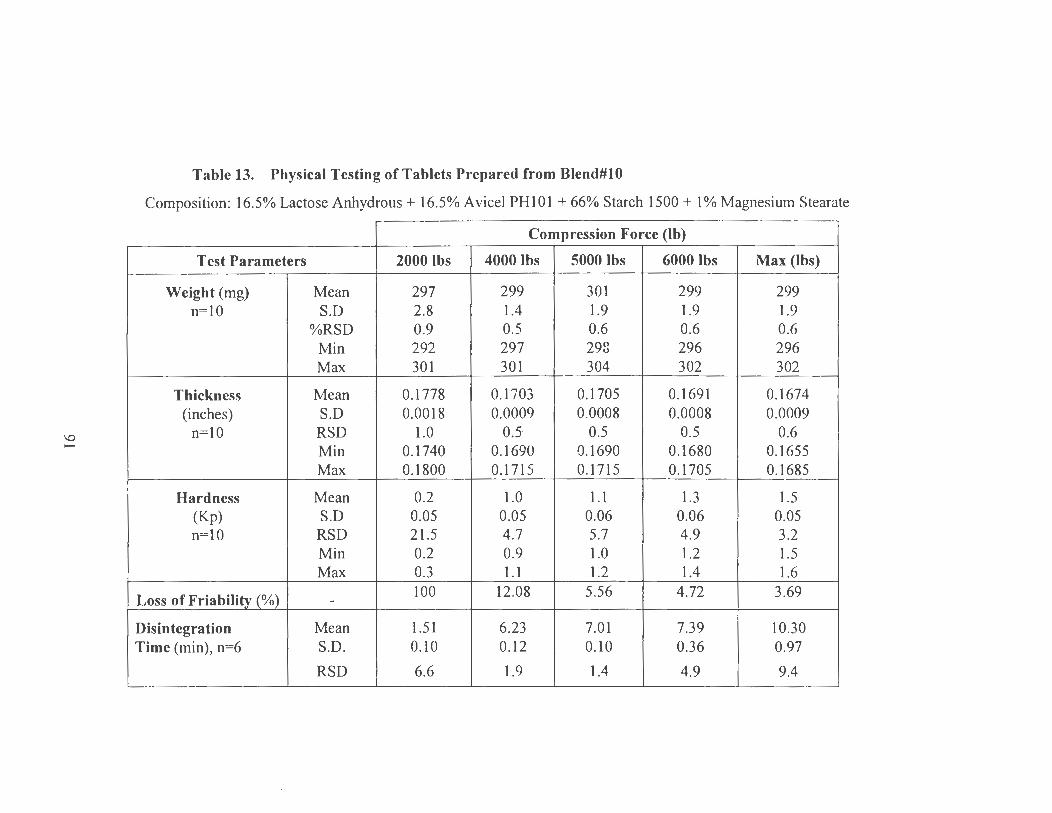
Table 13. Physical Testing of Tablets Prepared from Blend#lO
Composition: 16.5% Lactose Anhydrous + 16.5% A vice! PH 101 + 66% Starch 1500 + 1 % Magnesium Stearate
Compression Force (lb)
Test Parameters 2000lbs 4000lbs 5000 lbs 60001bs Max (lbs)
Weight (mg) Mean 297 299 301 299 299 n=lO S.D 2.8 1.4 1.9 1.9 1.9
%RSD 0.9 0.5 0.6 0.6 0.6 Min 292 297 298 296 296 Max 301 301 304 302 302
Thickness Mean 0.1778 0.1703 0.1705 0.1691 0.1674 (inches) S.D 0.0018 0.0009 0.0008 0.0008 0.0009
\{) n=lO RSD 1.0 05 0.5 0.5 0.6 ......
Min 0.1740 0.1690 0.1690 0.1680 0.1655 Max 0.1800 0.1715 0.1715 0.1705 0.1685
Hardness Mean 0.2 1.0 1.1 1.3 1.5 (Kp) S.D 0.05 0.05 0.06 0.06 0.05 n=lO RSD 21.5 4.7 5.7 4.9 3.2
Min 0.2 0.9 1.0 1.2 1.5 Max 0.3 1.1 1.2 1.4 1.6
Loss of Friabil!!Y__(o/tl_ 100 12.08 5.56 4.72 3.69 -
Disintegration Mean 1.51 6.23 7.01 7.39 10.30 Time (min), n=6 S.D. 0.10 0.12 0.10 0.36 0.97
RSD 6.6 1.9 1.4 4.9 9.4
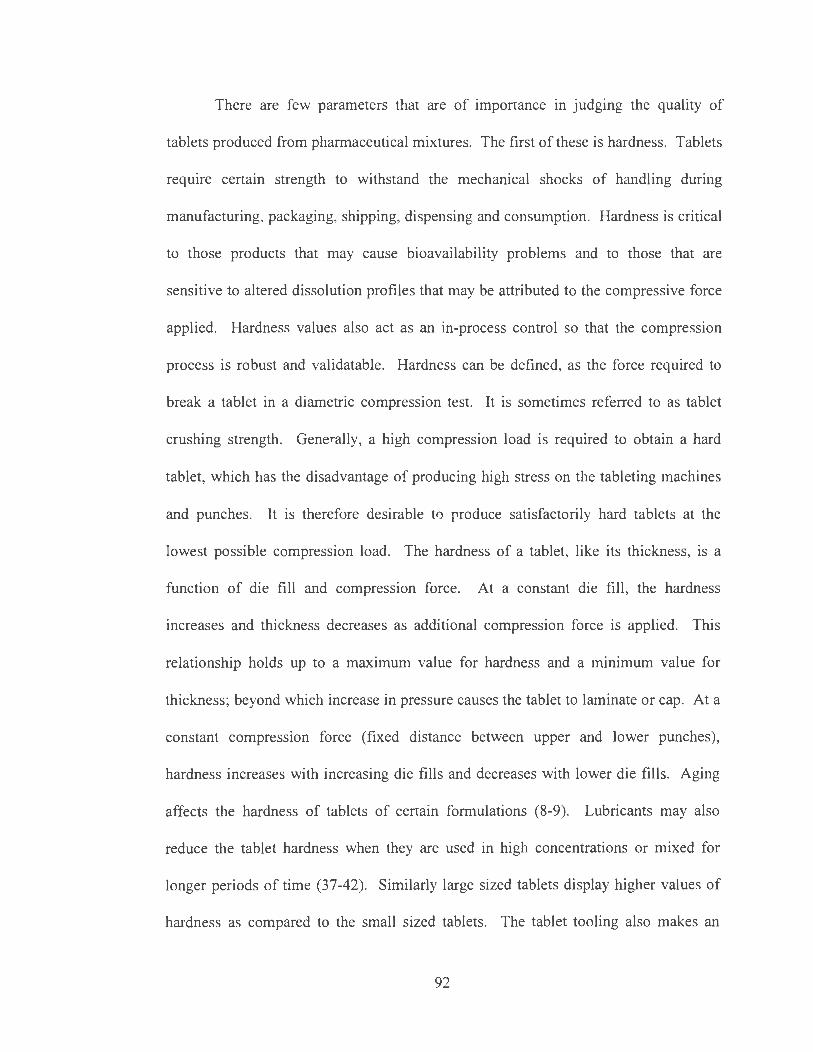
There are few parameters that are of importance in judging the quality of
tablets produced from pharmaceutical mixtures. The first of these is hardness . Tablets
require certain strength to withstand the mechanical shocks of handling during
manufacturing, packaging, shipping, dispensing and consumption. Hardness is critical
to those products that may cause bioavailability problems and to those that are
sensitive to altered dissolution profiles that may be attributed to the compressive force
applied. Hardness values also act as an in-process control so that the compression
process is robust and validatable. Hardness can be defined, as the force required to
break a tablet in a diametric compression test. It is sometimes referred to as tablet
crushing strength. Generally, a high compression load is required to obtain a hard
tablet, which has the disadvantage of producing high stress on the tableting machines
and punches. . It is therefore desirable to produce satisfactorily hard tablets at the
lowest possible compression load. The hardness of a tablet, like its thickness, is a
function of die fill and compression force. At a constant die fill , the hardness
increases and thickness decreases as additional compression force is applied. This
relationship holds up to a maximum value for hardness and a minimum value for
thickness; beyond which increase in pressure causes the tablet to laminate or cap. At a
constant compression force (fixed distance between upper and lower punches),
hardness increases with increasing die fills and decreases with lower die fills. Aging
affects the hardness of tablets of certain formulations (8-9). Lubricants may also
reduce the tablet hardness when they are used in high concentrations or mixed for
longer periods of time (37-42). Similarly large sized tablets display higher values of
hardness as compared to the small sized tablets. The tablet tooling also makes an
92
( impact on the hardness of the tablet. For a given formulation, a flat-faced tool
provides harder tablets than a deep cup tool. For optimum hardness, round tooling is
preferred to the caplet or oval shaped tooling. In the current study all mixtures were
compressed with 12/32" standard concave tooling at target weight of 300 mg. Tables
4 to 13 provide a summary of tablet hardness and thickness values for all the blends at
varying levels of compression force. Figure 8 shows the effect of applied compression
force on tablet hardness as a function of varying composition in the blends. The
Avicel® PHIOl mixture (Blend#2) provided the highest tablet hardness values (7.3-
23.7 Kp) as compared to all other mixtures. Starch® 1500 (Blend#3) provided the
lowest tablet hardness values (0-0.3 Kp). The lactose anhydrous (Blend#l) provided
an intermediate hardness profile (1.9-14.2 Kp) when compared to Avicel® PH101 and
Starch® 1500. It is well documented that Avicel displays excellent compressibility
behavior whereas Starch 1500 shows poor bonding characteristics (8). And also the
presence of magnesium stearate in the formulation adversely affects the tablet hardness
for Starch® 1500 blends. Magnesium stearate is known to have strong negative effects
on the binding properties of excipients, due to the formation of lubricant film on the
particle surface. These observations are in consistent with the findings by other
investigators (8, 37-42). Figure 9 displays the effect of formulation composition on
tablet hardness at 4000 lbs of applied force. It is evident from the graph that as the
amount of Avicel® PHIOl is increased in the mixture, hardness values increased
proportionally with the highest hardness of 21 Kp being observed when the mixture
had 99% of A vicel® PH 101. This could be attributed to the high amount of moisture
content present in the blend (5.12%) (32).
93
25
20 X-_ •••••••••••••••••• - -X
-a. .::t:. -II) gi 15 c "C '-ns = 10 .!
-·--------------· ..... -\0 I .0
~ ns I-
5 .,,.
.,,. ..,. . ·± - .... - . + . - - - . - -+· - ... - - ... - - - ... - - - - -+
..A'
0 I ,.. .----- ~ ' t.
0 1000 2000 3000 4000 5000 6000 7000 8000
Compression Force (lbs)
Figure 8. Effect of Compression Force on Tablet Hardness
9000
---¢---- Blend#1
-o-Blend#2
--tr- Blend#3
· · ~- · ·Blend#4
- -x- - Blend#5
-+-Blend#6
· - + · ·Blend#?
- +- · Blend#8
--+-Blend#9
---Blend#10

(
99.00 0.00 99.00 8: Avicel PH101 C: Starch1500
Tablet Hardness
Figure 9. Effect of Formulation Composition on Tablet Hardness at 4000 lbs of Compression Force
95
The effect of compression force on tablet thickness is described in Figure 10
and Tables 4 to 13. Tablet thickness is dependent on the nature of blend, die fill and
compression force (31 , 35, 36, 43). The higher the applied force, the lower will be the
thickness. However the ·thickness value will reach a constant at which the pore
volume in the tablet is minimum or zero and beyond which application of more force
does not reduce tablet thickness. Among the three excipients, Starch® 1500 tends to
impart more thickness (0.1645"-0.1679") to the tablet followed by Avicel® PH101
(0.1947"-0.1517") and Lactose Anhydrous (0.1785"-1568"). Among all the blends,
the binary mixture of A vicel® PH 101 and Starch® 1500 (Blend#6) provided the
thickest tablets throughout the range of applied forces tested.
Another important characteristic in measuring the strength of a tablet is tablet
friability which should be as low as possible. Tablets that tend to powder, chip, and
fragment may cause problems during manufacturing, coating, packaging and
transportation also adds to tablet weight variation or content uniformity problems.
Friability generally increases as compression load decreases; thus a material that forms
adequately cohesive tablets at a low compression load will also provide acceptably low
friability. Figure 11 and Tables 4 to 13 shows the effect of compression force on the
friability loss for tablets made from the tested blends. Tablets containing Starch® 1500
(Blend#3) displayed the maximum friability loss indicating that Starch® 1500 provided
poor binding strength. Tablets containing Avicel® PHlOl (Blend#2) showed the least
friability loss indicating that it provided an excellent binding mechanism for particles
to be held as coherent tablets. As Figure 11 indicates friability loss is inversely
proportional to the applied compression forces. The increase in friability loss at lower
96
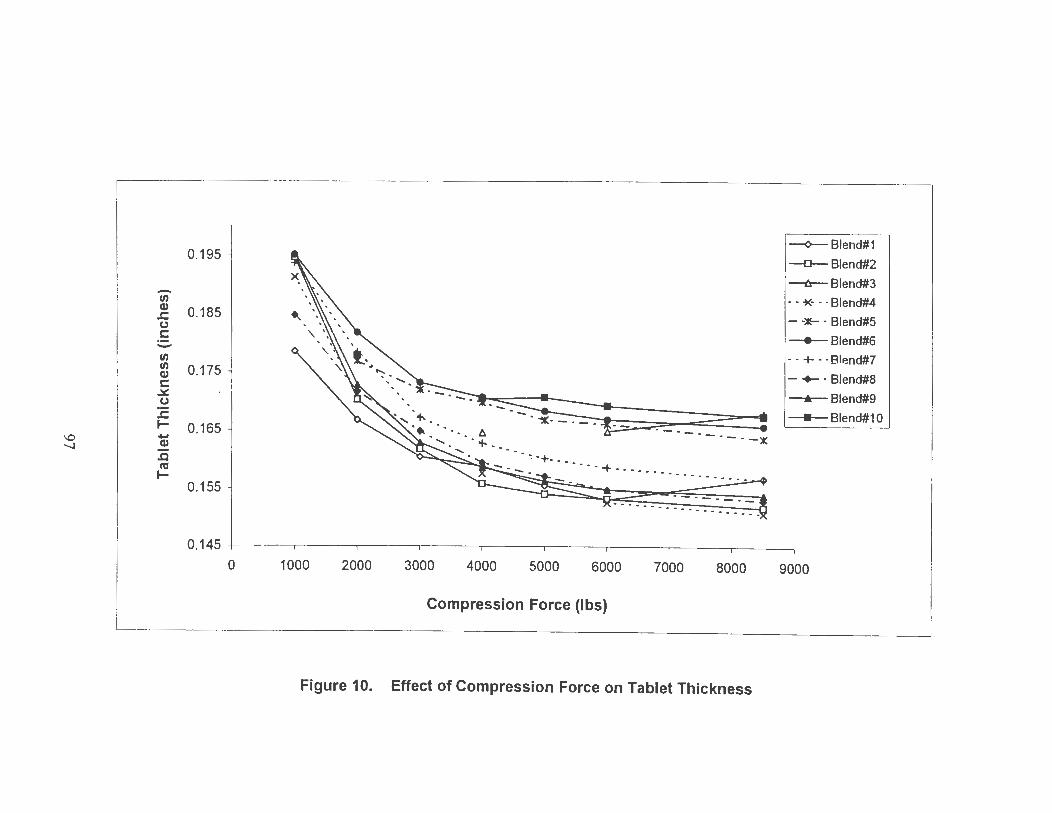
0.195 ~ A 1-<>-- Blend#1
-a-- Blend#2
--tr- Blend#3 -(/) Cl) 0.185
· · ~- · · Blend#4 .c 0 - -:er • Blend#S c - _.,_B!end#6 (/) (/) 0.175
··+· ·Blend#? Cl)
c - +- · Blend#8 .lr:: 0 -+-Blend#9 .c I- 0.165
---Blend#1 O \0 I
.... ---.....) Cl)
. - . - . - . - . -:.:
.c cu I-
0.155 ~ I-••• ......... .. ...... ..
---- --------
0.145 -r----,----,-----,-----,---,---,-----,,----,-----, 0 1000 2000 3000 4000 5000 6000 7000 8000 9000
Compression Force (lbs)
Figure 10. Effect of Compression Force on Tablet Thickness
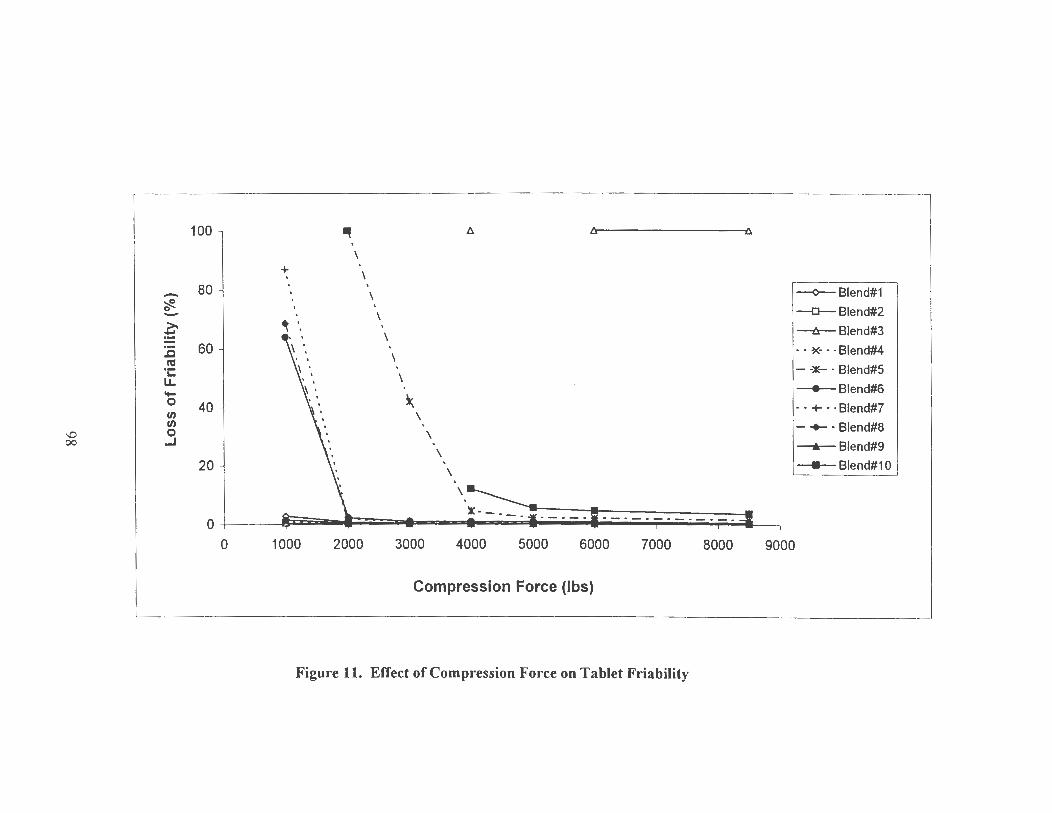
100., " A
\ + \ .
- 80 \ ~Blend#1 ~ .
-o-- Blend#2 0 - \ >- ~ " .
--tr- Blend#3 ~ \ 60 . - - ~- - · Blend#4 .c \ I'd
- -~ - Blend#5 ·c: u. \ .._ -+-Blend#6 0 40 )\ - - + - ·Blend#? I/) \ I/) - +- - Blend#8
\0 I 0 \ 00 ...J -ill- Blend#9
\ 20 . ---- Blend#10 \
\ . -----. -1-------------0 I - - • . !·--- .... -
0 1000 2000 3000 4000 5000 6000 7000 8000 9000
Compression Force (lbs)
Figure 11. Effect of Compression Force on Tablet Friability
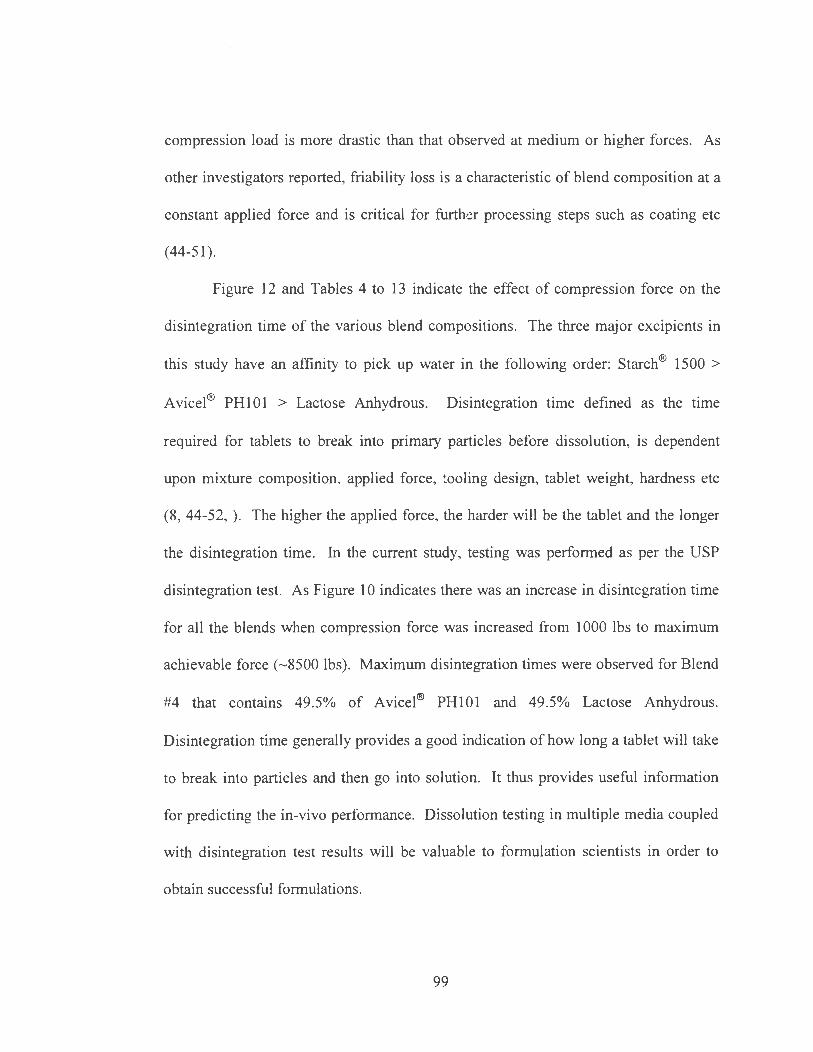
( compression load is more drastic than that observed at medium or higher forces. As
other investigators reported, friability loss is a characteristic of blend composition at a
constant applied force and is critical for further processing steps such as coating etc
( 44-51 ).
Figure 12 and Tables 4 to 13 indicate the effect of compression force on the
disintegration time of the various blend compositions. The three major excipients in
this study have an affinity to pick up water in the following order: Starch® 1500 >
A vicel® PH 101 > Lactose Anhydrous. Disintegration time defined as the time
required for tablets to break into primary particles before dissolution, is dependent
upon mixture composition, applied force, tooling design, tablet weight, hardness etc
(8 , 44-52, ). The higher the applied force, the harder will be the tablet and the longer
the disintegration time. In the current study, testing was performed as per the USP
disintegration test. As Figure 10 indicates there was an increase in disintegration time
for all the blends when compression force was increased from 1000 lbs to maximum
achievable force (-8500 lbs). Maximum disintegration times were observed for Blend
#4 that contains 49.5% of Avicel® PHlOl and 49.5% Lactose Anhydrous.
Disintegration time generally provides a good indication of how long a tablet will take
to break into particles and then go into solution. It thus provides useful information
for predicting the in-vivo performance. Dissolution testing in multiple media coupled
with disintegration test results will be valuable to formulation scientists in order to
obtain successful formulations .
99
35
30 -c:
g 25 (I)
E t= 20 c: 0 :;:;
~ 15 C> (I)
I ..... - c: 0 'iii 10
0
Ci
5
0 0 1000
x'
2000 3000 4000 5000 6000 7000 8000
Compression Force (lbs)
Figure 12. Effect of Compression Force on Tablet Disintegration
x
9000
--¢-----Blend# 1
-O-Blend#2
--tr- Blend# 3
··~-··Blend# 4
- -:.- - Blend# 5
_.._Blend#6
··+··Blend# 7
- +- · Blend# 8
__..,_Blend# 9
----- Blend# 10
-· ....
Analysis of Compression Behavior of Mixtures using Force-Time Profiles:
The process of consolidation involves a reduction in the porosity of a powder
bed. At low pressures, this occurs by rearrangement of the particles, but at the
pressures used in the tableting process, two mechanisms, fragmentation and
deformation achieve porosity reduction. Most materials will consolidate using a
combination of both these mechanisms, but in practice one of the mechanisms will
dominate the other (9, 12, 17, 53). It has been suggested that the more deformation
contributes to the consolidation mechanism of a solid, the more likely is that substance
to show time-dependent compressional properties.
Compression work describes the total amount of mechanical energy needed to
compress a loose powder column into a dense tablet. Three components can be
differentiated in this work: energy to overcome friction, energy consumption in the
expansion of the tablet after maximum compression and finally energy used in
bonding and formation of strong bonds ( 44-5 3 ).
Many parameters influence the powder compaction process (9). Some of these
include stress intensity, speed and application time of the stress, die dimensions, and
the mechanical properties of the powder. Particle size distribution, shape, crystalline
state, interfacial properties, and viscoelastic properties of a powder mixture affect the
mechanical properties of the compacts. Materials that undergo fragmentation show
little change in yield pressure when punch velocity is increased. Such materials do not
show much variation in their behavior when the punch speed or press is changed.
101
Changes in tablet strength brought about by increasing punch speed are fundamentally
due to increased tablet porosity (31 , 35, 36).
It has been hypothesized that interparticulate bonds are formed during the
dwell time, and that the ultimate strength of a tablet depends on these interparticulate
bonds. Thus claims have been made that the longer the dwell time, the better the
quality of tablet, but there is no evidence that the formation of interparticulate bonds is
time-dependent (53 , 54). It should be noted that the radius of the pressure roll has no
effect on the duration of the dwell time.
In the case of compressed powders, the particle surface is the most dynamic
component of structural relaxation, where relaxation is a function of the attractive
forces between individual ·powder particles.
The energy consumption during compression of powders can be classified into
the following stages: i) for arriving at the closest possible proximity of the particles, ii)
by friction between the particles, iii) by friction with the die wall, iv) by plastic
deformation and v) by elastic deformation.
In the current study, compression force-time data was collected usmg an
instrumented rotary tablet press for all the ten mixtures prepared as per the simplex
design described in Table 1. The compression force applied was varied from 1000 lbs
to maximum achievable force (1000 lbs, 2000 lbs, 3000 lbs, 4000 lbs, 5000 lbs, 6000
lbs and maximum achievable force) on the tablet machine. From each upper punch
compaction force-time pulse, parameters such as rise time (10% to 90% of peak
value), fall time (90% to 10% of peak value), pulse width (50% to 50% of peak value),
dwell time (90% to 90% of peak value), contact time (10% to 10% of peak value),
102
force at 10%, force at 50%, force at 90%, maximum force, area to peak, area from
peak and total area were determined. Similarly, from each lower punch ejection force
time pulse, parameters such as rise time (10% to 90% of peak value), fall time (90% to
10% of peak value), pulse width (50% to 50% of peak value), dwell time (90% to 90%
of peak value), contact time (10% to 10% of peak value), force at 10%, force at 50%,
force at 90%, maximum force, area to peak, area from peak and total area were
calculated. Figures 13, 15, 17, 19, 21 , 23, 25, 27, 29 and 31 provide the representative
pulse analysis of various parameters from compaction force-time curves at an applied
compression force of 4000 lbs for Blend#! to #10 respectively. Similarly, Figures 14,
16, 18, 20, 22, 24, 26, 28, 30 and 32 provide the representative pulse analysis of
various parameters from ejection force-time curves at an applied compression force of
4000 lbs for Blend#! to #10 respectively. The upper punch compression data obtained
for all the ten blends with varying proportions of A vicel® PH 101 , Lactose Anhydrous,
NF and Starch® 1500 at compression forces of 1000 lbs, 2000 lbs, 3000 lbs, 4000 lbs,
5000 lbs, 6000 lbs and maximum achievable forces on the tableting machine are
summarized in Tables 14, 15, 16, 17, 18, ·19 and 20, respectively. At the same
compression forces, the lower punch ejection data generated for the ten blends are
summarized in Tables 14, 15, 16, 17, 18, 19 and 20, respectively.
The compression event can be divided into the compress10n and
decompression phase. On rotary tablet press there is dwell time because the punches
do not move actively in a vertical direction when they are with their plane punch head
area under the compression rollers. At the beginning of the compression event the
upper punch is hitting against the compression roller. After reaching its lowest position
103
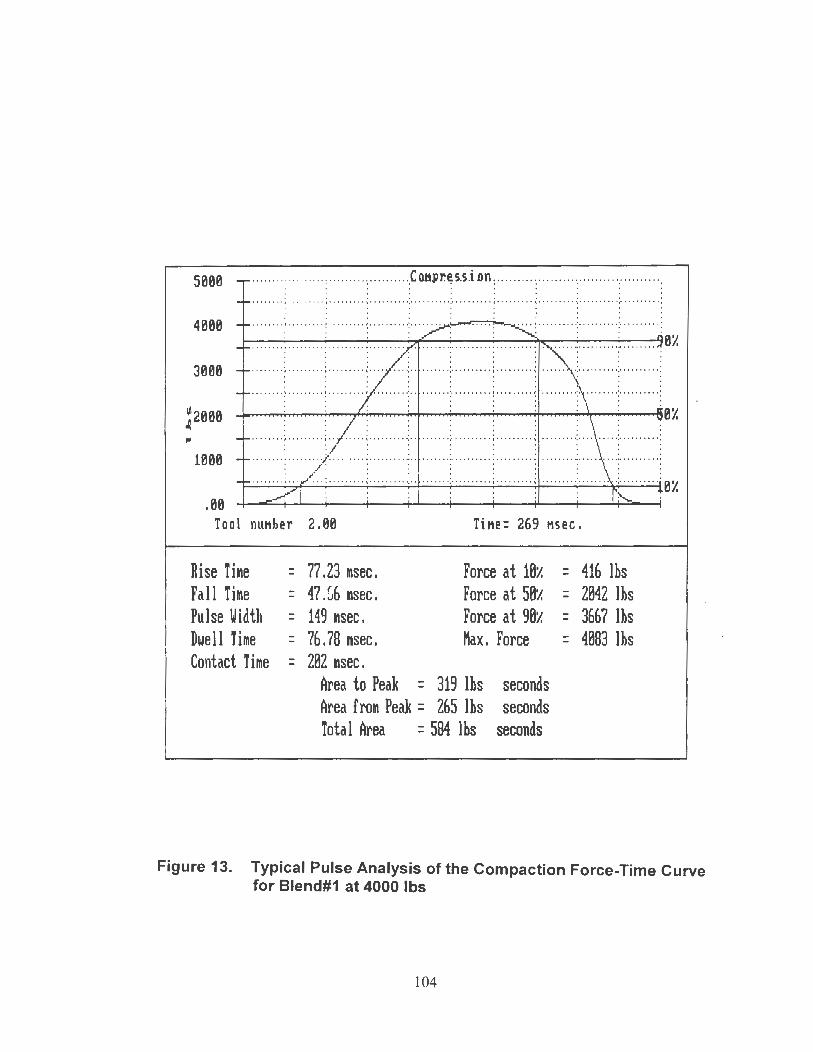
f I
5000 ..................................... Cnt1pr.~s.s.i Dn : ...... ... ., ......... ., . . . ...... ., ......... . ' . ' . . . . . ' . . . . . . . . . ..... ...... .... ... ..... ............ .... .... ........ ... ...... .. ... ... , ......... ., ......... ....... .... . . . . ' . ' . . . . .
4000 ... .. .. . ......... ........ . """""[">~~""""":"""""[" " """ 0:1. ....... ': .... .... . : ..... ' ... : . . . . . . . . . . . . ..... ·~ . ' ....... : .... .. ... : . . .... ~ · ........ ·~ ... ..... .
. . . . . . . . . . . . . . . . . . . . 3000 . ' .. ' .. . ~ . . . ... ... i •....... . \ . . . . . . . . : . . . ... .. . : .....•. . . . i .. .. .. . .. ~ ' . . . . . .: .......... ; .. .. ... ' .. : . . ' . . ' . . . . . . . . . ' . . . . . . . ' . . . .
' ' ' • ' • • ' ~ ' ' • • • • ' • • ~ o • ' • • • ' • ' I ' ' ' ' ' ' ' ' •: • • ' ' ' ' • • • :• ' ' • ' ' ' ' ' o ! ' • ' • ' ' ' ' ' ~ • ' • • ' • • ' •:' ' ' ' ' ' ' ' ':• • • ' ' • • ' • ' : . . ' . . . . . . ~2000
. ' . . . . . . . . . . . . . . . 0:1. ,.. ...•...• i ......... i . . . .... \ ...... . ... :. . . ... . .. : . ... ... . . . i ......... ~ .. . . . . ... :. . . . . .... : ......... . : . . . . . . . . . . . . . . . . . . . .
1000 ....... ·: ...... ·./ ... ..... ~ · . "" ... ~ · ...... . ·:· .... ..... :" ... " .. ~ ..... ". ~· ." . ... ·~ .. " .... ·:
. 00 ··· ·· ·· · ~··· ~: .. ; .. .... ... ~ ....... ... : .. ....... : .......... ; ......... ~ ... ...... : .. ... .... : .......... :8:1. ~ : : : : : : : '.'""- .
Tool nuMhe r 2.00 TiMe= 269 Msec.
Rise Time - 77.23 msec . Force at 10:1. - 416 lbs - -Fall Time - 47.G6 msec. Force at 50:1. - 2042 lbs - -Pulse Width - 149 msec. Force at 90:1. - 3667 lbs - -Dwell Time - 76 .78 msec. Max. Force - 4083 lbs - -Contact Time - 202 msec. -
Area to Peak - 319 lbs seconds -Area from Peak = 265 lbs seconds Total Area = 584 lbs seconds
Figure 13. Typical Pulse Analysis of the Compaction Force-Time Curve for Blend#1 at 4000 lbs
104

(
100.0 .................. ... ................ ·.· .. E.j.e c.i i.o.n .. . .... .. ...... .... .................... .... . . . . . . . . . ..... ... ; ........ . ................ ... ; ... ....... ; ......... . ········ · ....... ... ; .......... : ......... . . . . . . . . . : ........ ; ............................ :····· .. ···:-· .. ···· ·· ....... ............ :· ·· ····· ··:· ······· ..
. : . . ' . . . . . . . . . : . . . . . . . . . . . . . . . . . . . . ' ...... ~·. ' ...... ·~..... . . . . . . . . . . . . . . ...... .. ~· ........ ·:· ... ..... . 80.00
. . : : : .. ' ..... ~ . . . . . . . . . . .... ' . . . . .... ..... : ...... .... ; ........ ' . . . . . . . . . . . ......... ; .......... ; ....... .. . . . ' . 60.00 . . .
~40.00 . . . . .... : .......... ;. ' ' .... . ' . i ' .. . ..... ~ .... ' .... . : .......... ; ... .... ' .. . . . . . . . . . 0:1.
.. . . .. : .... ..... ~... .. ... : ........ ·'~· ........ ·~ ... .... .. : ........ . ~ .. ....... ~ ..... .... ·~ ..... ... . . . . . ' . . . .
. . . . . . i ....... . . i.. . . .... ~ .......... ; . .. . ' .... ; ....... .. . i ......... ~ .......... : .... ...... : ....... .. .
. . : : "-: : : : : 0:1.
20.00
.00 Tool nuMher 2.00 TiMe: 404 ttsec.
Rise Time - 15.97 msec. Force at 10:1. - 5.27 lbs - -Fall Time - 102 msec. Force at 50:1. - 25.82 lbs - -Pulse Y idtli - 130 msec. Force at 90:1. - 46 .38 lbs - -Dwell Time - 67.06 rnsec. Max. Force - 51.65 lbs - -Contact Time - 185 msec. -
Area to Peak - 1.32 lbs seconds -Area from Peak = 5.31 lbs seconds Total Area = 6.63 lbs seconds
Figure 14. Typical Pulse Analysis of the Ejection Force-Time Curve for Blend#1 at 4000 lbs
105
(
5000 ............... .... ...... ..... .. ..... C atipr.~ s.s.i Dn .. .. .. . .. . .. . .. . .. .. ...... ., .. ........ . . . . . . . . . ....... . ········· ..... ... . ········ ··.·· ········.·· ··· ·· ··· ..... .. .. ······· ·· ........ ........... . . . . . . . . . . 4000
. . . . . . . . . 0i! ................. ........ ..... .. ... ............... ······ ··· ········ ··· . ......... ............. .... . . . . . . . . . . . . . . . . . ' . . . . . . . . . . . . . ... . . . . ' ~ . . . . . .... i .. ... .... .: . ' .... ' ... : .. . ' . . . .. :. . • .•.... : ' ...... ' . \ . . . . . . ' .: ........ .. : ...... . . .. : . . 3000 . . . . . . . . . . . . . ~ ......... : . .. ..... . ~ ..•.... .. ·: · . . . .... ·:· . . ...... ! ......... ~. . . . .. .. " . . .. .... ·:· ........ . : . . . . . . . '
........ ; ......... ; ......... ; ............... ........... ; ..... .. .. ; ........ ~ ........ . ~ ........ 0i! . . . . . . . . ' . . . . '
~2000 . . . . . . . . .. ...... , ... ...... , .... ..... , .... ....... ..... .. .... .. , .... ..... , .. ········· ········,········ ··· . . . . . . . . . ' . . . . . . . . . . . . . ················· ······· ···· ··· ····· · ... ......... ............ ... ... ''''''"'' .... .............. . . . . . . . . 1000 ' . . . . . . . . . . '
.00 Tool nuMher 1.00 TiMe: 376 Msec.
Rise Tirne - 104 rnsec. Force at 10i! - 428 lbs - -Fall Tirne - 44.74 rnsec. Force at 50i! - 2099 lbs - -Pulse Widtli - 148 rnsec. Force at 90i! - 3770 lbs - -Dwell Time - 79.51 rnsec. Max. Force - 4198 lbs - -Contact Tirne - 228 111sec. -
Area to Peak - 359 lbs seconds -Area f ro111 Peak = 271 lbs seconds Total Area = 630 lbs seconds
Figure 15. Typical Pulse Analysis of the Compaction Force-Time Curve for Blend#2 at 4000 lbs
106
(
50.00 ............ ...... ...................... Ej.ec.1 i.o.n .. ............ ..... .. .. .. .................. . . . . . ' . . . . . ' . ........ ......... ......... ··········.·· ···· ··············· ... ........ ....... .. ................... . . . ' ' . . . . . . . .
40.00 ........... ..... . ......... ········· ·:······ ·· · ·:·········· .. .. ..... ··· ·······:········· ·:· ····· ···· . . . . . . ' . . . . ........ ......... ......... ....................... ......... .... ..... ............................... . . . . . . . . . . . . . 30.00 . . . . .... .......................................... ........ .............. ..... ... ... ... ..... ..... .. .... . . . . . . . . . . . . . .. .... .. ········ · ......... ··· ··· ··· ·:· ·· ·· ····· :- ····· ···· ......... ····· ·· ···:· ·········:· ····· ····
~20.00 : _. ! : : : ........ ..... ..... .. .. ........................ ... .......... ......... ............................... . . . . . . . . . . . . . . . . ............. ................... .. .......... ....................... ..... ......................... .. . . . . . . . .
10.00 . . . . ............. .... ··· ······ .. .. .... ........ .... .......................... .... ... ... .. ... ........... . . . . .
.00
····· ·· ·· ...... .. .. : ....... .. . : ........... ........... ....... : .......... : ......... ft~ . . . . . 67.
Tool nuMher 1.00 TiMe: 431 Msec.
Rise Tirne Fall Time Pulse Width Dwell Time Contact Time -
12.16 msec. Force at 10:1. 184 msec. Force at 50:1. 78.31 msec. Force at 90:1. 28.05 msec. Hax. Force 225 msec.
Area to Peak - .07 lbs seconds -Area from Peak = .31 lbs seconds Total Area = .38 lbs seconds
- 2.29 lbs -- 4 .15 lbs -- 6.01 lbs -- 6.59 lbs -
Figure 16. Typical Pulse Analysis of the Ejection Force-Time Curve for Blend#2 at 4000 lbs
107
10000 .. ......... .. ........ .. ........ .. .. . :Cn~pr.~s.s.iDn .. .. ..... .. ...... .. : .... ...... : ........ .. . . . . . . . .. .............. . ... ..... . ... ............ .... ...... .. ... ... .... .. ..... .... ..... ... ... ... , ..... .... . . . . . . . . . . . . 8000 .. ... ... .. ....... .... .............. ·:· .... .. .. ·:· ............ .... ... .... ... . ·:· ...... .. ·:· ........ . . . ' . . . . . ... ...... ... ... ..... .. .................... ........ .. .... .. .......... ... ..... ............... .. .. .... . . . ' . . . ' . . . '
6000 ' . . . ... ... .. ·· ····· ·· ... ................................. ... .. ······ ··· .. .......... .... .... ... ... .. ... . . . . . . . . . . . . ...... .. .... ..... ... ..... . ······ ·· ··:· ········ ·:···· ······ .. ..... ,, ····· ···· ·:· ·· ··· ·· ··:· ·· ···· ··· . ' . .
' . . . ....... .. .... ............... _. ....... . :~· : ········ . . .... . ........ . : ........ .. ~ ........ 0X
. . . . ' . . . . . . . . . . . . ' . .... .... , ......... , ......... ··· ··· ······ ········· ····· ········ ' ' ' '\'' .. .. ........... ..... ........ . . . . . . . . . . ' . . . . . . . ' . . . . . . . . 0/. . ,.,
~"" : . , . . . . . . . . ' ''' '' ' ' I ''' ' V" '' I '''' ' ' ' ' ' \ ' ''' ' ' '' '•' ' ' '' ' ' ' ' '.'''''' ''''I'''' ' ''' \' • '• • • • • ' •, ' • • •' • •' •,• • • • • • • • • ' •
2000
.00 . . . ' ' . . . . 8~
Tool mtMher 2.00 TiMe: 269 Msec.
Rise Time - 76.86 msec. Force at 10x - 429 lbs - -Fall Time - 49.90 msec. Force at 50x - 2103 lbs -Pulse Width - 142 msec. Force at 90x - 3776 lbs - -Dwell Time - 71.11 msec. Max. Force - 4205 lbs - -Contact Time - 198 msec. -
Area to Peak . = 316 lbs seconds Area from Peak = 261 lbs seconds Total Area = 577 lbs seconds
Figure 17. Typical Pulse Analysis of the Compaction Force-Time Curve for Blend#3 at 4000 lbs
108
(
50 00 -r- ........................................ Ej.ec:ii.o.n .. ... .................................... . . : : : : : : -+- ·'''.' "'.'''' .. ' '' ... '' ... ' ' ... '' .. ·:·'''''''' ·:·''''''''' .. ' ...... ' ' ''''' '' ·:·' .. ''''' ·:·' ''''' .. ·: . . . . .
40 .00 -+-·· ······~········· .... .. ... ''''''' ' ''~''''''''''~'''''''''' ......... '""''''':··········:· ····· ·· ··: o o I ' o
-+- ·'' ' ''' ·:'''.'' .. ' ' ' '.' ''' ' .. '' .. ''' ~·'' .. ' .. ' ·~'' ' .. '''' '' ' '' .. '' '. ' '.'''' ~·'' .. '''' ·~'''''''' ·: . . . . . 30.00 -+- ········~""'''" '''"'"' ..... .. ... ~ ... ....... : ... .. ..... ,,,,,,, ............ : .......... : .......... : . . . . . . . . . ' ' -+- ·''' ... '.~' .... ' ''' '' ' .. '''' ' .. ' .... '·:·.''' .. '' ·:· '.''''''' ''.''.''' ''''' .. '' ·:·' .. ''''' ·:· '' .. '' ' .. : . . . . .
~2lll llllll -+- ···· · .. . : ......... ,,,, .. ,,, ......... ~ ... ....... ~ ........ . ,,,,,,,,, .. .. ... .. ~ .......... ~ ......... : ft ti .uu ' ' ' ' ' ' ~ . . . . ' . . . . . ' . ... -+-' ' ''' ' ' ''. .. ' ' ' .. '' '' ''' ''.' ' .. '' .. '' ·:·''.'' ' .. ·:·'' ' .. '''' .. '' ' .. .. '.' ' .. ' .. ·:· ' ' .... '' ·:· .. ''' .. ' '; . . . . . .
10 .00 -+- ........ ; ............. ..... """" ' ~":"""':""'."' .................. ~ .......... : ......... ; . . . . . ' . . . . . . -+- "' ' ''' .; .. ''''' .. '. ''' "'' ''.' .... ' .: ... ' .. '.' .:. ' ' ' ... ''' .. '' ..... ' '' ''' ' ... ;. ''.'''' .. : .. ''' .' '' .:
.00 _..d ~ ~ : : : : ~IM
Tool nuMher 3.00 TiMe: 376 Msec.
Rise Time - 2.98 msec. Force at 10i! - .13 lbs - -Fall Time - 68.08 msec. Force at 50i! - .~1 lbs - -Pulse Width - 289 msec. Force at 90i! - 1.10 lbs - -Dwell Time - 236 msec. Hax. Force - 2.93 lbs - -Contact Time - 307 msec. -
Area to Peak· - .04 lbs seconds -Area from Peak = .38 lbs seconds Total Area = .42 lbs seconds
Figure 18. Typical Pulse Analysis of the Ejection Force-Time Curve for Blend#3 at 4000 lbs
109
(
\
5000 ..................................... co.~pr.~s.s .i Dn ....................................... .. . ' . . . . ' . . . . . ................................ ...... .... ........ ... .... ..... ........... ................. ......... . . . . . . . . 4000
. . .
. . . . ....... ·: .... ..... : .... ..... :· ........ ;. . . . . . . ·~ ... ...... ; .. ....... :· ..... ; .......... ; .. ........ 01:
. . . . . . . . . . ' ' . ' . ' ' . . .
3000 . . . . . . . . . . ''' ' '' ' 'l'' ' ' '''' ' I ' ' ' ' ' ' ' ' ' \ ' ' ' '' ' ''''•' •• • • '' '.' ' '' ' ' ' '' ' !'' '' '''''\' '''''' '•''''''''''.''''''''''• . . . . . . . ' . . . . . . . . . . . . . . . . . . . . . . . . . . ~ ......... : ..... .. .. ~ . . . . . . . . ·:. . . . . . . .. :· ..... ' .. ' : ......... ~ . . .... .. ·:. . ...... -:· ... .. .... :
. . . . . . . . . . ~2000
. . . . .,. . . . . . . . . . . . . . . . 01:
. . ' . . . . . . .. .. ... . , ......... ..... ....................... .... .... ..... , ......... , ......... , .. .... ......... .... . . . ' . . . . . . . . . . . . . . . . . . 1000 . . ' . . ' . . . . .... ...................... .. .............. ........ .................. .. .... ........... .. ...... ....... . . ' . . ' . . ' . . . . . . . . . ' . . ' . ' . ' . . .
. . . . . '. · ~ ... '... ' .... ' ... . ~· ..... ... ·:·. '.'. '' ·:· .. .... '.' '. ... .. .... :· ....... ·:· .... ' ... : .......... · 8i!
.00 . . . . . . . .
Tool nl11'1he r 1.00 Ti11e= 296 11sec.
Rise Time - 86.91 msec. Force at 10t: - 406 lbs - -Fall Time - 48.64 msec. Force at 50t: - 1989 lbs - -Pulse Width - 146 msec. Force at 90t: - 3572 lbs - -Dwell Time - 74.53 msec. Hax. Force - 3978 lbs - -Contact Time - 210 msec. -
Area to Peak - 313 lbs seconds -Area from PeaH = 258 lbs seconds Total Area = 571 lbs secon4s
Figure 19. Typical Pulse Analysis of the Compaction Force-Time Curve for Blend#4 at 4000 lbs
110
(
50.00 .......... ..... .. ... ... .. . .. ... .... ., ... E.j.e c.t i.on ... ..... .... .. ..... .. ., .. .. .. .......... ... .. . . . . . . . . . . . ... .... . ··· ·· ·· ·· .... .... . ····· ··· ······ ········· ····· ···· ...... .. . .... ..... . , ... .... ..... .. ...... . . . . . . . . . . . . 40.00 ........ .... ... ....... .... ······ ··· ·:· ·· ······· :· ····· ···· .. .. .... . ·· ·· ····· ·: ··········:······· ··· . . . . . . . . . . . . ..... ....... ..... ...... .. .. .... .. ...... ... .... .... .... ...... ...... .. ...... .. ..... ...... .... .. ..... . . . . . . . . ' . . . . . . . . ...... .. ······ ··· ... ... ... ... .... .. ... ... ...... , ...... ... .. .... ... . ····· ········ ····· ···.····· ··· ·· . . . . 30.00 . . . . . ' . . ... .. ... ········ · .. ... .... ······· · ··:·· ·· ······:······ ·· ·· .... ..... ·· ··· ·····:··· ··· ····:······· ···
: ,_ .I : : : ... .... ..... ... ... ... ... ... ........ -· .... ......... .... ............ ... ..... ...... .............. ... . ' ' o I . . . . 0:1. ~20.00
,..
.00 Tool nuMher 1.00 Title: 430 t1sec .
Rise Time - 13.89 msec. Force at 10:1. - 3.57 lbs - -Fall Time - BB.05 msec. Force at 50:1. - 10.20 lbs - -Pulse Width - 107 msec. Force at 90:1. - 16.82 lbs - -Dwell Time - 52.76 111sec. Max. Force - 18.80 lbs - -Contact Time - 155 msec. -
Area to Peak - .42 lbs seconds -Area from Peak = 1.24 lbs seconds Total Area = 1.65 lbs seconds
Figure 20. Typical Pulse Analysis of the Ejection Force-Time Curve for Blend#4 at 4000 lbs
111
(
5000 .. ......... .... .. ... .... .. ......... fQM))T. S.S.iDn . .... ...... ...... . ...... . .. : .. .... . . .. . . . . .. ... .............. ...... . ·· ··· ·····.· ······ ·· ··· ······ ..... ..... ... ...... ........... .. ... .. . . . . .
4000 ....... ·: ......... :·· ... .. .. :···.. . . ~ · ........ · ~ .. : :s. ~.~:: :: : : ::: : :::::: :·:: :: : : : : :~:::::::: .: 0Y. . . . . . . . '
3000 . . . . . . . . . ........ , .... .. ... .. ....... . , ... . ···,···· ·········· ·· ··· ·· ... ..... , ..... ....... ... .. .... , ..... .. ... . . . . ' . ' . . . . . . . . ' . . . . . . . . . . . . . . . . . • ~ . . .. . .... ! . . . . . . . . ~ . . . . ' . . . ·:· .. . .. . . . ·:· . . . . . . . . . . . . . . . . . . . .. . .. .•• ·:· . ..... ' ' ·:· .. ... ... . : . . . . . . . . . . . . . . . . . . . . . . . 0Y. ~2000
. . . . . . . . . ..... ... , ..... ... .. .... .... , ...... ....... ... .. .... ..... ..... .... ... . , ........ ... .... ... ...... .... ... , . . . . . ' . . . . . . . . . . ' . . . . . . . . .. ....... ..... .. .......... ..... .... ........ ....... ....... .... .... ....... .. ......... ... .. .. .... ...... . . . . . . . . . 1000 . . . . . . . . . . . . . . . . . .
.80
. . . . ;~ . ...... : .... ..... ~ · ....... ·:· ..... ... ·:· .. ....... .... ... .. ~ ·. .. . . . ·:· ... ... .. ·:· ........ ·: 0'l.
Tool nul'lher 3.00 Ti Me: 296 l'lsec,
Rise Time - 72.29 msec. Force at 10Y. - 409 lbs - -Fall Time - 48.63 msec. Force at 50'l. - 2006 lbs - -Pulse W idtJ1 - 138 msec. Force at 90'l. - 3603 lbs - -Dwell Time - 70.25 msec. Max. Force - 4012 lbs - -Contact Time - 191 msec. -
Area to Peak - 274 lbs seconds -Area from Peak = 262 lbs seconds Total Area = 536 lbs seconds
Figure 21. Typical Pulse Analysis of the Compaction Force-Time Curve for Blend#5 at 4000 lbs
112
(
50.00 ............ .......... .. ................ Ej.ec.1 i.on ..... .... .. . ......... ....... ............... . . ' . . . . . . .. ... ... ....... ... .... .. .. ··· ·· ·····:····· ···· ·:··· ·· ·· ··· ...... ... ··· ······ ·:· ··· ······:··· ·· ·· ··· . . . . . . . .
40.00 ····· ··· ···· ····· ..... .... · ·· ···· ···:······· ···:··· ·· ····· ......... ··· · ·· ····:·· ·· ··· ···:·· ····· ··· . . . . . . . . . ' ' . . . . . . . . . . . . . . . . . . .. '..... . ' .. ' ... . ~· .. ... .. . ·~ . . . . . . . . . . ... .... ' .. .... ... ~· ........ ·~ ........ . . . . . ' . . .
30.00 ........ ......... ....... .. .... ...... ;.· ...... .. . ; ..... .... . ... ... .. ... .. ..... . : ..... ..... ; .... ... .. . . . . . . . . . . ' ' . ··· ··· ·· .. ................ ······ ····:·· ·· ······:······ ···· ......... ····· ···· ·: ······· ·· ·:·· ········ . . . . . . ' . . . . . . . . . . . . . . . . . . . . . . . . . . . . . . . . . . . . ~· .... ' ... ·~ ........................... ~· ... .. ... ·~ ........ . . ' . . . ' '
. . . . ~20.00
............... .. .. .. ............ ... ; .......... ; ..... ... ... .............. .. .. ; .... ..... . ; ......... . . . . ' . . . '
10.00 : : . . : : 8'l. ' ' ' ' ' . 0i!
····:·· ·· ····· ·>·········; .. .... ... :····· ·····; ....... .. .: ......... 8~
.00 Tool nuMher 3.00 TiMe= 430 Msec.
Rise Ti111e - 14.27 111sec. Force at 10i! - 3.24 lbs - -Fall Ti111e - 99.27 111sec. Force at 50i! - 6 .47 lbs - -Pulse Width - 116 111sec. Force at 90i! · = 9.70 lbs -Dwell Ti111e - 57 .35 rnsec . Max. Force - 10.74 lbs - -Contact Tirne - 171 msec. -
Area to Peak - .14 lbs seconds -Area from Peak = .67 lbs seconds Total Area = .81 lhs seconds
Figure 22. Typical Pulse Analysis of the Ejection Force-Time Curve for Blend#5 at 4000 lbs
113
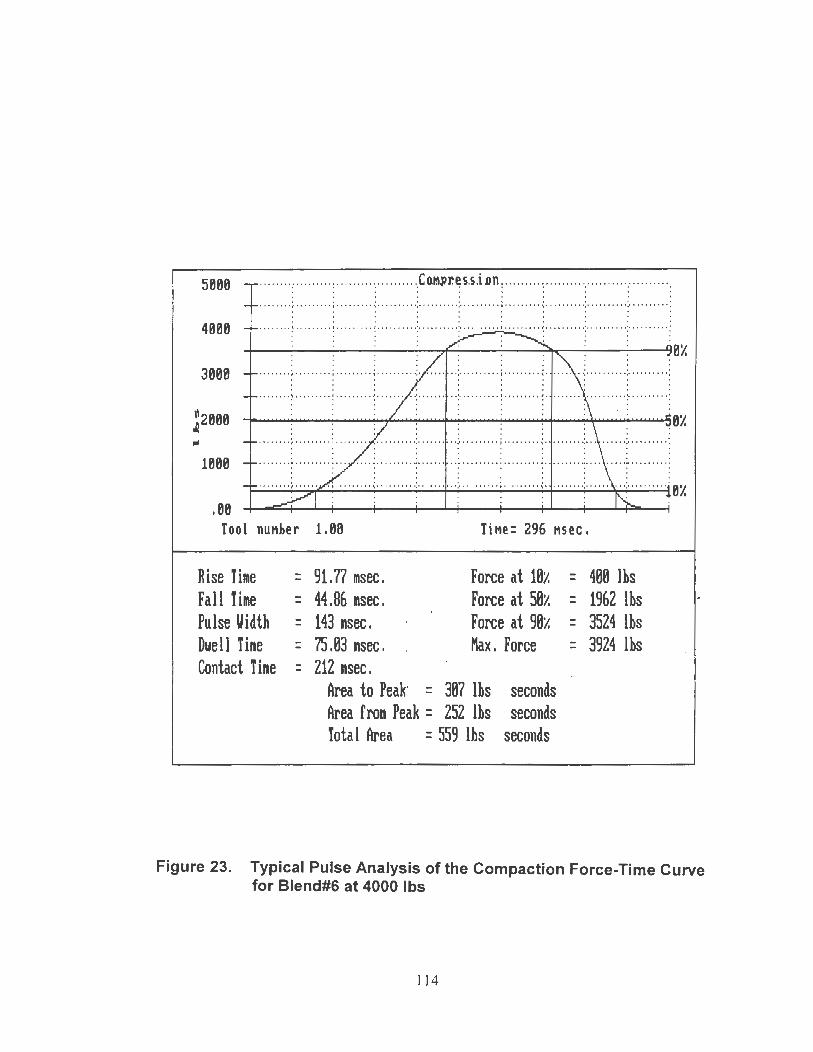
5000 ......... ... ... .................... .,Cnapr.~s.s.iDn ....... .. .............. .. .......... .. ... . . . . ' . . . . . . . ........ ········· ..... ..... ...... .......................... ... ........ ... ............ ... , ... ...... . . . . . . . ' . . . ' . 4000 ........ .. ... ......... ... . ······ ····:······· ···:·· ······· · ......... ··········:······ ····:·· ··· ·····
' . . . . . . . . -+-~_;____~;..._____;~~· --..~~~· ~-:i,...----·~~· ~......,0x
3000 . . . . . ' . . . . ........ , .... ..... , ......... , .............................. , ........ . , .............................. . . . ' . . ' . . . . . . . . . . . . ' . ' . . . . . ' .
. . . . . ' . . ~ ......... ~ . .... . ... ! . . ' ' . . . . ·:. . . . . . . . . :· ' .. ' ' . . .. ! .... ... .. ~ . . . . . . . . ' .. ' ... ... :· .• ' ' ... .. : . ' ' . . . . . . . . . . . . . . . . . . . . . 0X . . . . . . . . . ·· ·· ····1· ··· ·····i··· ·· ··· ····· ·· ···.···· ·· · ......... .... , ... ...... , . ............ ·················· . . . . . . . . . . . . . . . . . . . . . . . . . . . . . ............. ............. ......... ......... . .... ..... ... .... ....... .... ..... .. .... .... ....... .. .. .. . . . ' . . . . . . 1000 . . . ' . . . . . . . . . . . . . .
.00 Tool nuMher 1.00 TiMe: 296 Msec.
Rise Time - 91.77 msec. Force at 10x - 400 lbs - -Fall Time - 44.86 msec. Force at 50% - 1962 lbs - -Pulse Width - 143 msec. Force at 90x - 3524 lbs - -Dwell Time - 75.03 msec. Max. Force - 3924 lbs - -Contact Time - 212 msec. -
Area to Peak - 307 lbs seconds -Area from Peak = 252 lbs seconds Total Area = 559 lbs seconds
Figure 23. Typical Pulse Analysis of the Compaction Force-Time Curve for Blend#6 at 4000 lbs
114
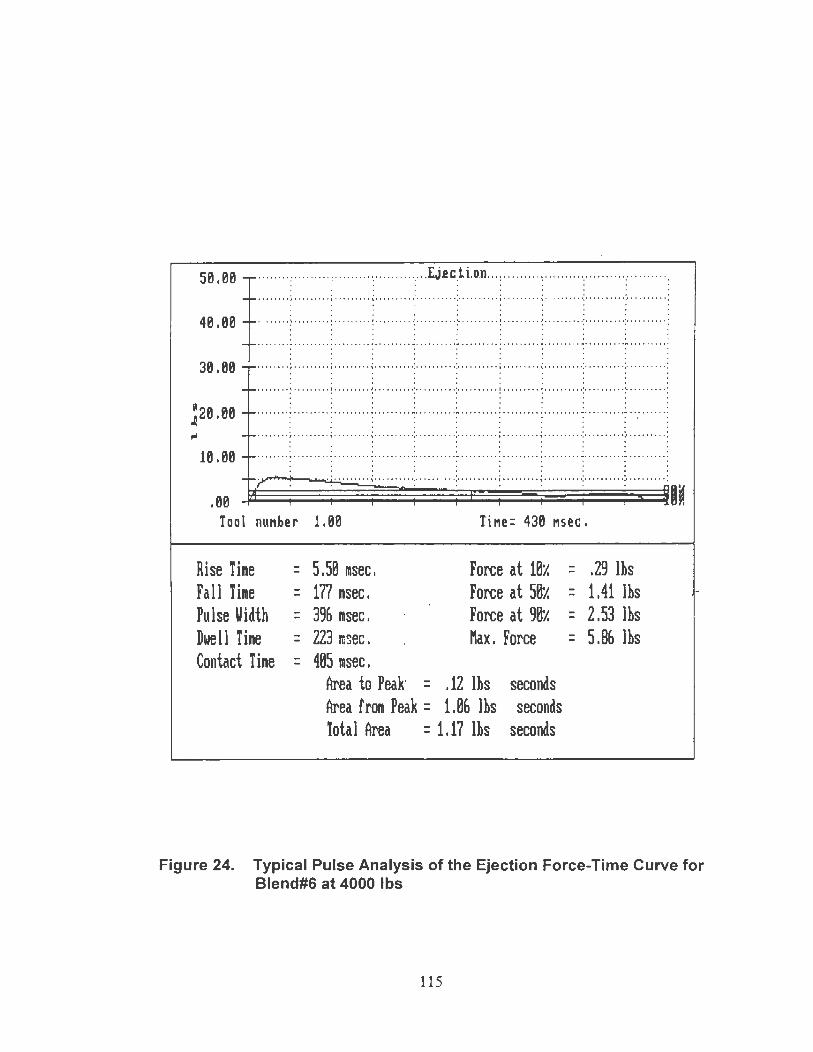
50, 00 -.- · .......... ..... . ..... ............ ":' .. E.j.ec:i i.o.n .. . ............... ... ·:· ........ ·:· .. ... ... ·: . ' . . .
-+- " .................. ... ..... ... .... ·: .. ....... ·:· ...... ......... ...... ..... . ·: ........ . ·:· ......... : . . . . '
40 .00 -+-"""" .......... .. ................ > ...... < .... ........................ . : ..... ..... : .. ...... ..: . . . . .
-+- .... . .. . . .. . . . . . . . . . . .. . . . .. ........ ; ..... .... ·~..... . . . . . . . . . . . . . . .. ...... ~· ..... ... ·~ ......... : . ' . ' . . . . . 30 I 00 -+- " """ """ '" " "'"" """' "·:•"""" ·:"" """ '"" • "' • ""'" ":" """ " :' "" "' ": . . ' . ' . . . . . -+- ..... . . . . . .. . . . .. . . . . . . .. . . ........ ·:· ....... . ·:· . ........ . . . . . . .. . . . .. ..... -:· .. .... .. ·:· ......... : . . . .
~20 .00 -+- ........ .. ......... .. ..... " "'""1'"" " ' "~""" "' .. .. ... .. "" ""'~" """"~".''"" ' ! ,. -+- .... . . . . . . . . . .. . . . . . . . .. . . . ...... .. ·:· ........ ·:· .. . . . . . . . . . . . . . .. . . ....... . ·: · ......... : .. ...... .. :
. . . . . 10 .00 -+- ······" ............................ ; .......... :··· ······ ..... .. .... ....... ~ .... .... ... : ......... ;
' 0 o I 0 . . . . . -+-z .
. 00
. . . . . . . . . . . . . . . . . . . . ·:· ........ ·:· ......... .. ................ ·:· ........ ·:· .. ... .. ~a~ Tool nuMher 1.00 Ti Me: 430 Msec •
Rise Time -- 5.50 msec. Force at 10'.I. - . 29 lbs -Fall Time -- 177 msec. Force at 50'.I. - 1.41 lbs -Pulse Width -- 3% rnsec. Force at 90'.I. - 2.53 lbs -Dwell Time -- 223 msec. Max. Force - 5.B& lbs -Contact Time -- 405 rnsec.
Area to Peak - .12 lbs seconds -Area frorn Peak = 1.0& lbs seconds Total Area = 1.17 lbs seconds
Figure 24. Typical Pulse Analysis of the Ejection Force-Time Curve for Blend#6 at 4000 lbs
115

(
5000 .............................. .. .... :C ntlJ)r.~ s.s.i Dn .. .. .. .. . .. . .. . . .. .. ....... : ......... . . . . . . . ........ .. ....... ... .... .. ··········,•···················· ............ .... .. ................... . . . . . . .
4000 . . .
3000
~2000 ,.. . . . . . . . . . . ........ , .. .. ..... , ....... , ............. . ................. , ......... , ......... , ............... ..... , . . . . . . . . . . . . . . . . . ' .
1000 . ··' . . . . . . . . ·· · ·····:· ·· ·······~ ······· ··:····· : ·· ·~· · · · ·· ··· ~·········:·········: ········~····· ····~·········: . . . . . . . . . . . . . . . . . . . · · ······~·· .... ·.-:······· · ·. ~···· · · · ···:··· ······:··········:·· ··· ····: ·········:······· .. : ..... ... .. ·8i!
.00 . . . . . . . '
Tool nut1her 3.00 Titte: 269 t1sec.
Rise Time - 84.17 msec. Force at 101. - 413 lbs - -Fall Time - 47.00 msec. Force at 501. - 2027 lbs - -Pulse Uidtl1 - 144 msec. Force at 901. - 3640 lbs - -Dwell Tirne - 74.46 msec. Max. Force - 4054 lbs - -Contact Time - 206 msec. -
Area to Peak - 314 lbs seconds -Area from Peak = 258 lbs seconds Total Area = 572 lbs seconds
Figure 25. Typical Pulse Analysis of the Compaction Force-Time Curve for Blend#7 at 4000 lbs
116
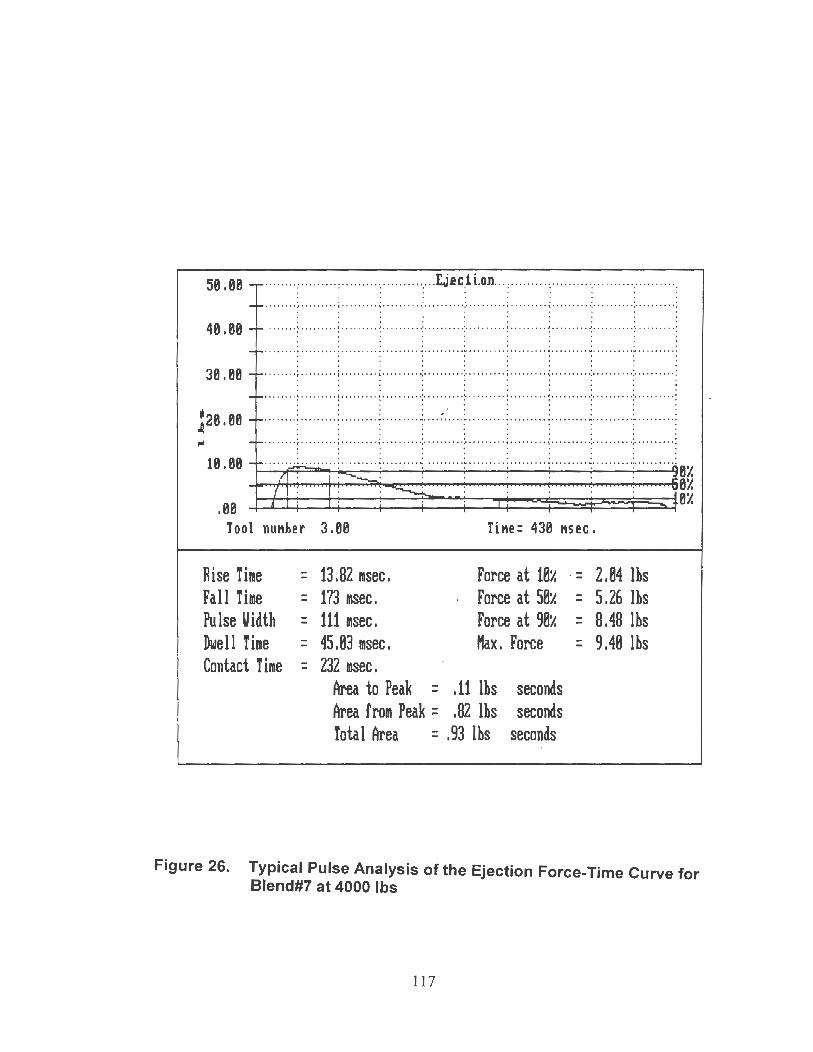
(
50.00 .......... .... ... ........ .. .... ... . ., ... [j.ec.1 i.on ..................... ., ... ...... ., ........ .. . . . . . . . ..... ... .. ....... ...... ... .......... ; .......... : ............... .... .. ... .. ... ; ........ .. : ......... . ' . . . . . . . . . .
40.00 ..... ... ..... .... ..... .... ·· ········:······· ···:· ········· ..... ... . ··········:······ ····:·········· . . . . . . . . . . ........ .. ..... .. ,,,,,,.,, ........ ........ ......... ... ...... .... .. . ............................... . ' . . . ' . . . . . . ........ ......... ......... .. ... .. ... : .. .. ...... ; ................... ...... .... ; ........ .. ; ..... .... . . . . . 30.00 . . . . . . . .
.............. ........... . ·· ·· ······:········ ··:········ ·· ·· ·· ·· ··· ···· ····· ·:·· ········:· ·········
~20 . 00 : I • : : . ... . . ' .. ........ .... .......... ........ ....... .. ......... ....... . ······ ··· ..... ............. ........ ..... . ' . . ' o I I I . . . ' .. ... ... ....... ... ..... ............ . : .. .. ..... . : .... ............... ... ... ... . ; .. ........ ; .. ...... . . . . ' . . . . .
.00 Tool nuMher 3.00 Ti Me: 430 Msec.
Rise Time - 13.82 msec. Force at 10i! - 2.04 lbs - -Fall Time - 173 msec. Force at 50i! - 5.26 lbs - -Pulse Width - 111 msec. Force at 90i! - 8.48 lbs - -Dwell Time - 45.03 msec. Hax. Force - 9 .40 lbs - -Contact Time - 232 msec. -
Area to Peak - .11 lbs seconds -Area from Peak = .82 lbs seconds Total Area = .93 lbs seconds
Figure 26. Typical Pulse Analysis of the Ejection Force-Time Curve for Blend#7 at 4000 lbs
117
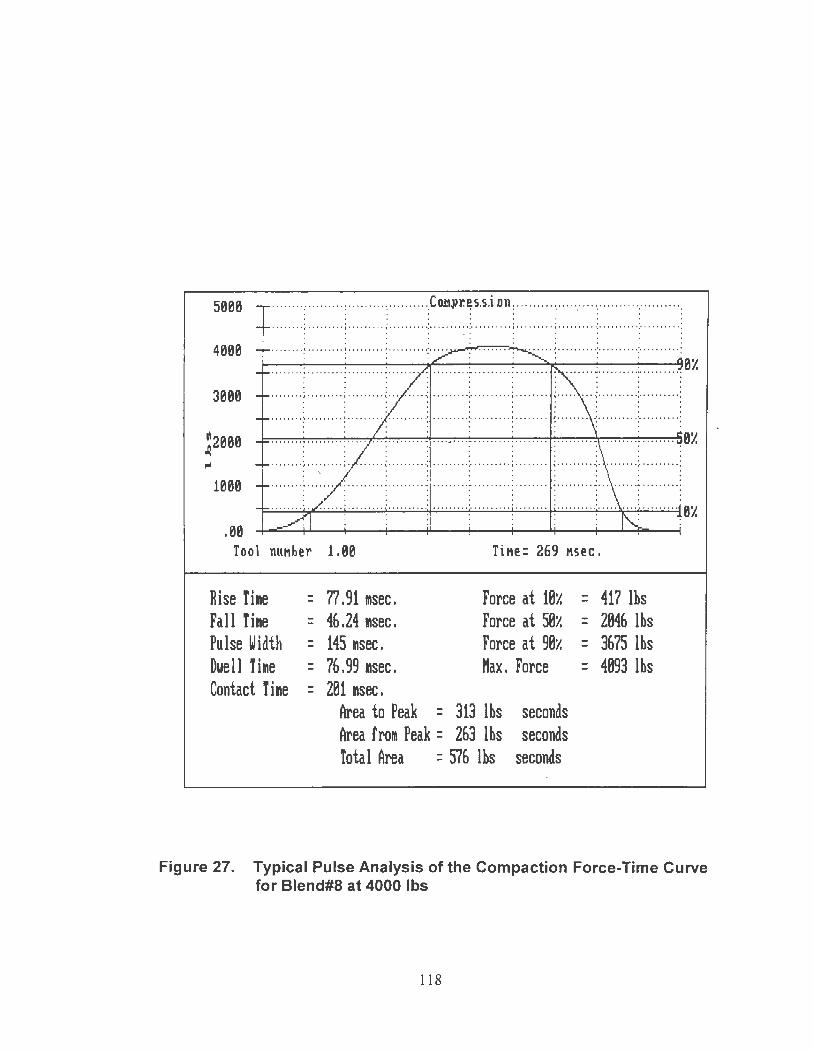
(
5000 .... ...... .... .... .... .. .. ········ }Qt1.pr.~s.s.iDn .... ... .. .. ...... .. ...... ........... . . . ....... .......................... .............. , .......... .... ....... ... ....... ..... ... ..... . . . . . . . .
4000 ....,....,.,~-:-........ . . . . . . . 8/. ... .. ... .. .. .... .... ..... .. .. ..... ... .... .... ................................... .. ...... .. ........ o o I o ' I o o 0 . . ' . . ' . . . . . . . . . . .
3080 . . . . . ' . . . .. ...... , ... ...... , ....... .. , ...... .. ...... ...... .... ... .. ... ..... , ..... ···············.········· ·· . . . . . . . . . . ' . . . . . . . . . . . . . . . . . . . . . . . . ~ ......... ! . . . . . . . . . . . . . . . . . . . ..... . . ·:· .. ...... . ! . . . . . . . . ~. . . . . . . . ·:· ... ' .... ':· . .. . ... . . :
. . ' . ' ' ' . ~2000 . . . . . . . . : ... ..... . : ...... .. : . . . . . . . . . . ........ ~ ......... : .. ...... : ... ... ... - ......... ~ ........ 8/. . . . . ' . . . . . . . . . . . ' . . . . . . . . . . . . . . . . . . .
1080 ······ · ·:···~··· ·; ··· ··· :·· ······ · ......... :· ·········: ····· ·· · :· ·· ······ ·:· ········:····· ·· ···: ········:···· ·7: ·· ·······:········· ······ ···:·········:········ :· ···· ····:··· ······:·· ·· ·····:
. , . . . . . . . . ........ ·. . ... .. : ...... ... :- . . . . . . . . . ..... .. -:· ......... : ........ :- ... .... . ·:- ..... .. -:· ..... .. .. 8/.
.08 __ / . : : : : : : . :
Tool nutther 1.80 Titte: 269 ttsec.
Rise Time - 77.91 msec. Force at 101. - 417 lbs - -Fall Time - 46.24 msec. Force at 501. - 2046 lbs - -Pulse Width - 145 msec. Force at 901. - 3675 lbs - -Dwell Time - 76.99 msec. Max. Force - 4093 lbs - -Contact Tirne - 201 111sec. -
Area to Peak - 313 lbs seconds -Area from Peak = 263 lbs seconds Total Area = 576 lhs seconds
Figure 27. Typical Pulse Analysis of the Compaction Force-Time Curve for Blend#8 at 4000 lbs
118
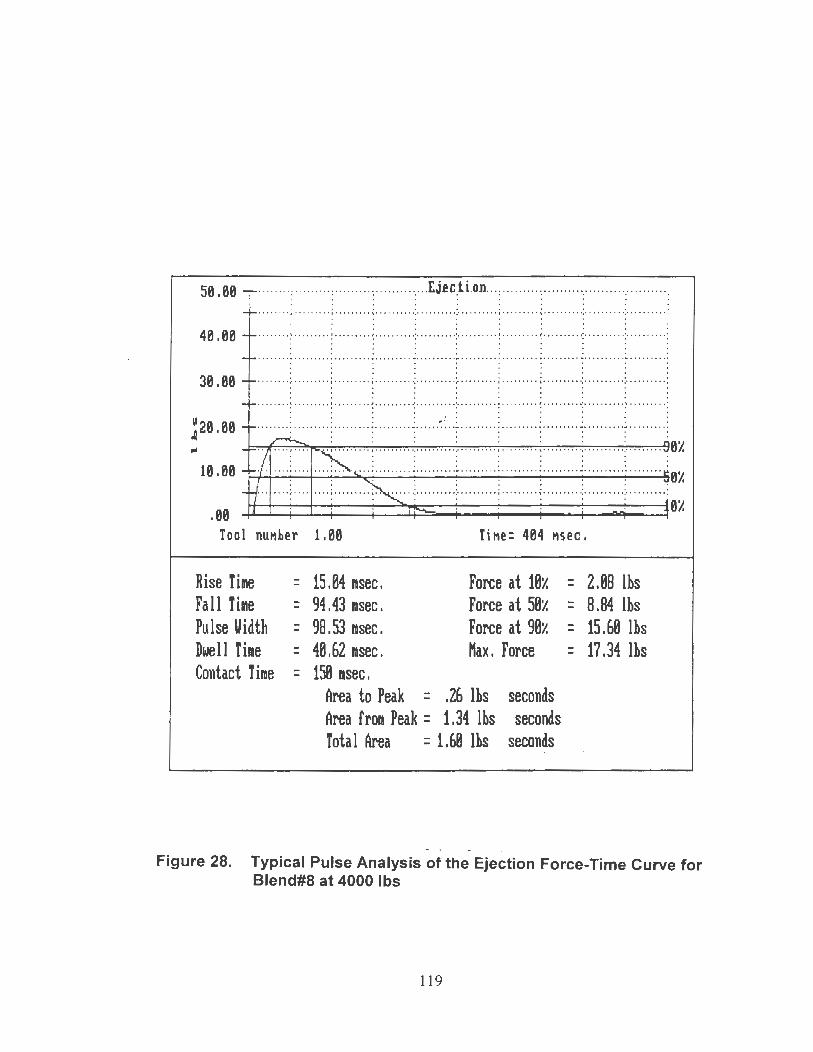
50.00 .......... ......... .. .............. ., ... l:j.ec.1 i.on .... ..... .... .... .... ., .. ....... ., .. ....... . . . . . . . . . . . . . ........... ...... ... ... ... ·············· ····· ··,·· ··· ····· ··· ······ ........................... .... . . . . . . . . .
40.00 . . . . . . . . . . . . . . . . . . . . . . . . . . . . . . ........ ·: .... .. .... :· . ' ... ' . . . . . . . . . . . . . ... .. ... ·: .... ...... ~· ........ . . . . . . . . . . . . . ·· ······ .......... .. .. .. ..... ... ........... .. .... .... ...... .... .......... ... ... .. ... ....... ...... . . . . . . . ' . . . . . . I 0 0 0 ........... .. ... . ............ ...... ...... .. ... ...... .... ...... .. .. . .... .... ..... .. .......... ... .... . . . ' 30.00 . . . . . . .
········ .................. ·· ····· ···:·· ········:·········· ......... ·· ·· ······:· ·········:·········· . . . : ,. J : : : .... ....... .. .... ....... ... ........ ... ... .... .. .. ...... .......... .. ............. ........ .. ....... .. . . . . . . . .
• • • • • • , • • • • ' I ' ••• ' •••• , •• • • ••• ••• : • • ••• ' •••• : •• • •••• • • • 1 •• ••••••• \' •• •• • • ••• : • • •• •••••• :. • • • • • • • • 8i! ~20.00
. . . . . . . . . . . . . . . . . . 10 .00 . . . .
. . . . . . . . . . ' ' ' ' ' ' 'I'"'' ' ' ' ' I' ' ' ' ' " ' ' '\ ' \ ' ' ' ' ' '•' ' ' ' ' ' ' ' ' 'o'' ' '' ' ' ' ' 'I''' ' ' ' '''\' ' ' ''''' ' '.'' ' ''''' ''•'' '' ' ' ' ' ' ' •
.00 . . . . . . . . . 0X
Tool nuMher 1.00 TiMe: 404 Msec.
Rise Time - 15.04 msec. Force at 10x ·- 2.08 lbs - -Fall Time - 94.43 msec. Force at 50x - 8.84 lbs - -Pulse Uidth - 98.53 msec. Force at 90x - 15.60 lbs - -Dwell Ti111e - 40.62 msec. Hax . Force - 17.34 lbs - -Contact Time - 150 111sec. -
Area to Peak - .26 lbs seconds -Area from Peak = 1.34 lbs seconds Total Area = 1.60 lhs seconds
- . Figure 28. Typical Pulse Analysis of the Ejection Force-Time Curve for
Blend#8 at 4000 lbs
119
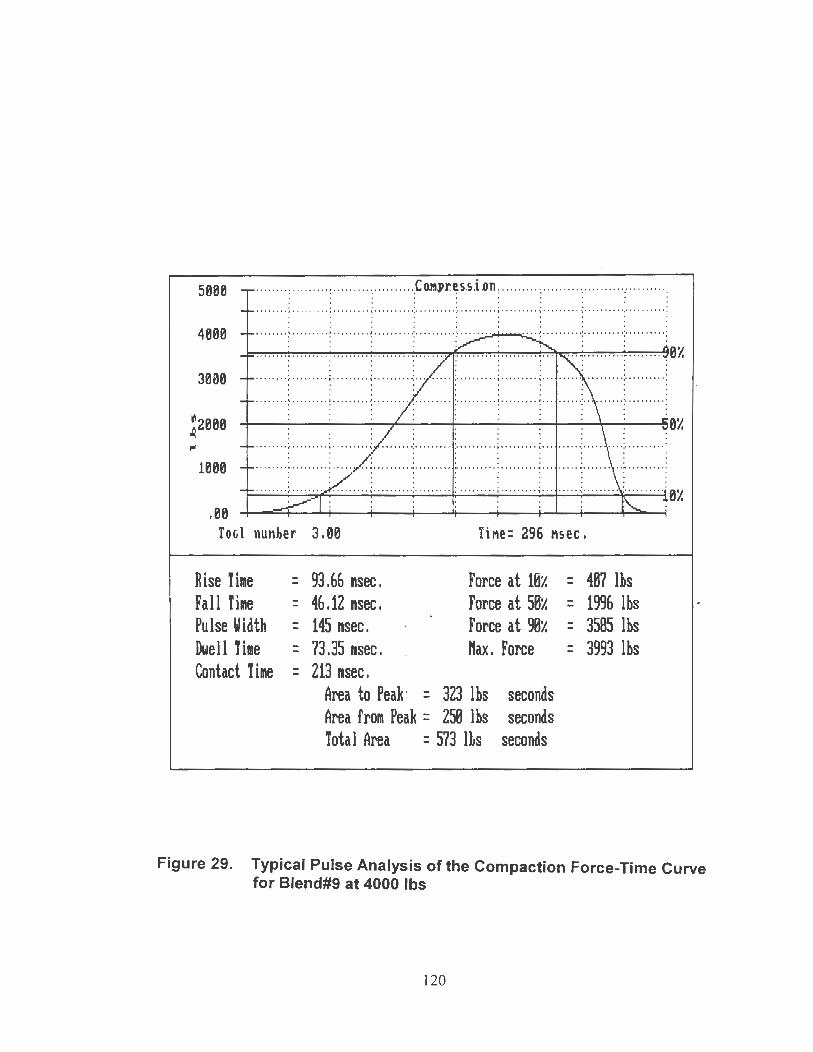
(
5000 ................................... .,Cat11r.~s.s .ian ... .......... .. ...... .... . : ...... .. ..... . . . . . . . . . . . . . ... .. .. . ... .................................................................... .. ................ .. . . ' . . . . . 4000
. . ..... .... ........ ..... .... ··· ····· ··:··· ···· ·· ·:··· ···· ·· ... . ··········:· ·· ·· ·····:·········· . .
. . ' . . . . . . ........ , ......... , ......... , ......... . , .................. ........... \''' .... ... .. ......... ....... . . . . . . . . . . . ' 3000 I o I I o O o t I t . . . . . ' . . .
. . . . . . . . ~ ' .. . ..... ~ . . ....... ! ...... ' . . . ..... ' . . . :· ......... : ...... ' . . ~ . . . . . ' .. ·:. . . ...... :· ..... . ... : . . . . . . . . . . . . . . . . . . . . . . . . . . . . . 0i! ~ 2000 . . . . . . . . . . ..... .. . , ......... , .. ....... , ....... ............... ....... , ......... , ... ············ .. ...... ... .. .. . . . . . ' . . . . . ' . . . . . . . . ' . . . . . . . . ······ ····· ············· .............................................................. ............. . . . . . . . . . . . 1000 . . . . . . . . . . . . . . . . . . .
·· · ·····~······ · · . ····· ··· ·:· ·········:·· ·· ····· :······ ··· ·:···· ·· ···:··· ······:········· : .. .... .. .. · 0~ . . . . . . . . . 00 .+-.....:::::~--J-.j--~--+----i+---+---+-...i...--+--+..:::i----i
Tool nunher 3.00 Ti l'le: 296 l'lsec,
Rise Time - 93.66 111sec. Force at 10~ - 407 lbs - -Fall Tirne - 46 .12 111sec. Force at 50i! - 1996 lbs - -Pulse Width - 145 111sec. Force at 90i! - 3585 lbs - -Dwell Ti111e - 73. 35 rnsec , Max. Force - 3993 lbs - -Contact Time - 213 msec. -
Area to Peak · = 323 lbs seconds Area from Peak = 250 lbs seconds Total Area = 573 lhs seconds
Figure 29. Typical Pulse Analysis of the Compaction Force-Time Curve for Blend#9 at 4000 lbs
120
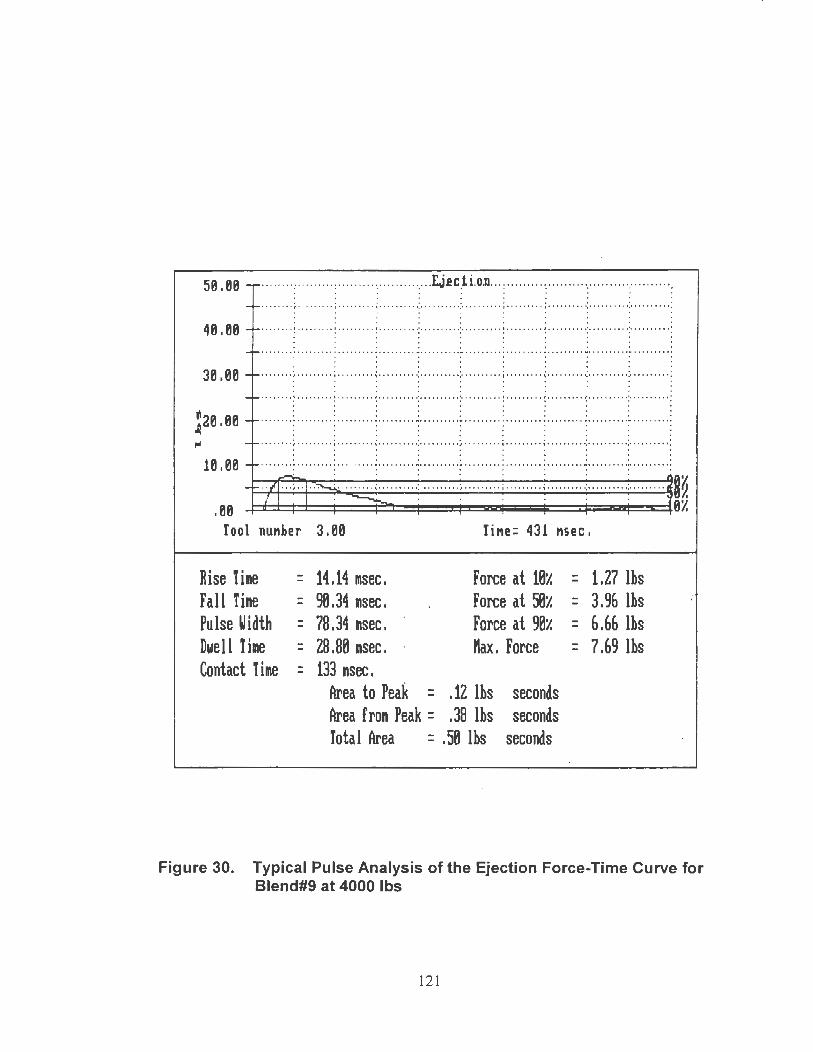
(
\
50 .00 ... .. ...... .. ..... ............ ......... . E.j.ec.ii.on .. ... .... .... ...................... ........ . . . . . . . . . . . . . .......... ......................... .... .... ... ..... ..... ..... ... .. . ......................... ... .... . . . . . . ' . 40.00
. . . . ...... ... ... .... ...... ... . ·· ·· ···· · ·:· ·········:·········· .. ...... . ·· ··· ···· ·:········· ·:·· ······ ·· . . . . . . . . . . . . .. ........... .. .. ... ... ... .............. .......... ............................................ ... .. . . . . ' . . .
' . . 30.00 . . . . ............ ....................................................................................... . . . . . . . . . . . .
........ ··· ····· · .... .. ... ··········:··········:·········· .... ... .. ···· ··· ···:· ·········:······· · ·· . . . . ~20.00
. . . . . . . . .. ..... ..... ... .... ............ .. .. ..... .. ........................ . ...... ............ ........ .. .... . ' . . . . . . . . . . . . . .... ............................................................... ······················· ·· ·· ···· · . . . . . . . . 10 .00 . ' . ........ ......... ... ... .. . .. ..... ...... ...... .... ....... .. .. ..... .. .. ........... .................. . . . ' .
. 00 Tool nuMber 3.00 Ti Me= 431 Msec.
Rise Tirne - 14.14 msec. Force at 10t: - 1.27 lbs - -Fall Time - 90.34 msec. Force at 50t: - 3.% lbs - -Pulse Width - 78.34 msec. Force at 90t: = 6.66 lbs -Dwell Time - 28.80 msec. Hax. Force - 7.69 lbs - -Contact Time - 133 msec. -
Area to Peak - .12 lbs seconds -Area from Peak = .38 lbs seconds Total Area = .50 lbs seconds
Figure 30. Typical Pulse Analysis of the Ejection Force-Time Curve for Blend#9 at 4000 lbs
121
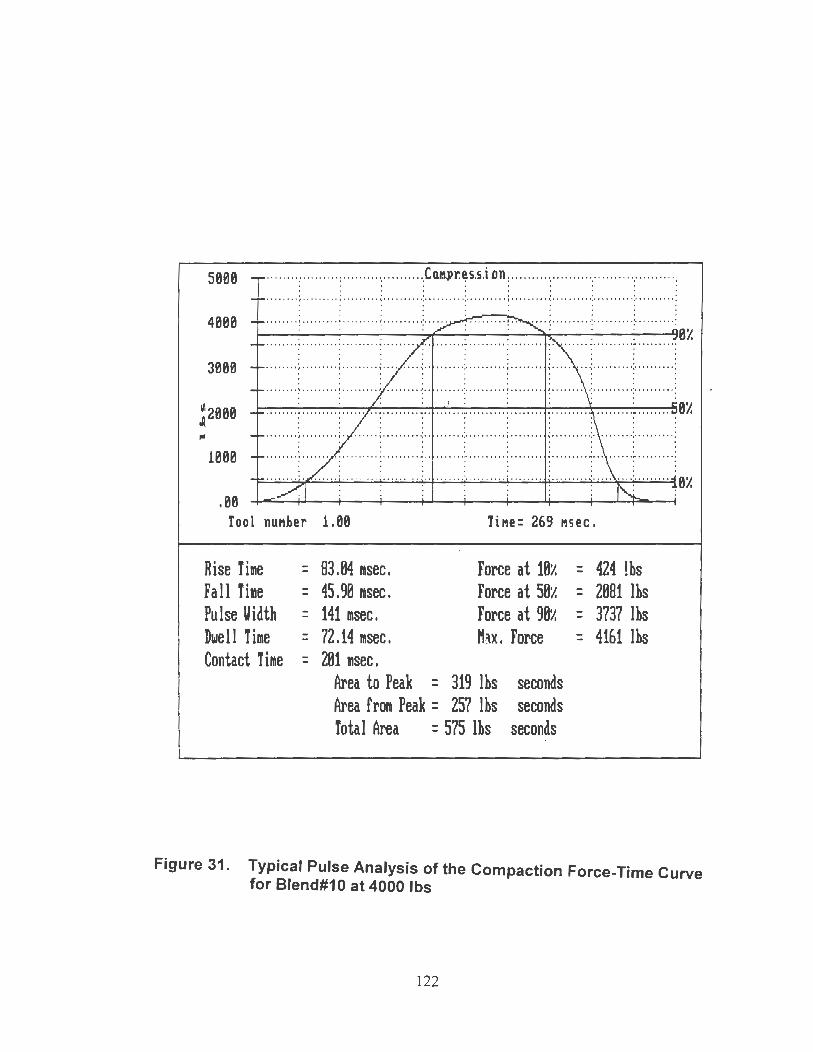
(
5000 .......................... .... ... .... .,C o.~pr.~ s.s.i Dn .. ....... ............................... . . . . . . . . . : . ........ ; ........ . ........ ........... : .......... ; .. .. ........ ..... ...................... ........... . . . . . . . . . . . . 4000 .. ... ... ~.. . . . . . . . . . . . . . . . . . ........ ·:· . . . . . . . . . . . 0X
o o o o o Io o: o o o I' t ot o: O O o O o o o o o: O O O I I 0 0 0
0
o 0 o I o o o o o~ 0 o I I 0 0 0 0 0: 0 0 0 0 0 t I 0 : 0 0 0 0 0 o 0 ~o o o o o 0 t 0 o o~ 'O O o O O O O O:
. ~ : : : : : : : : ...... ' . : ......... : ......... ~ . . . . . ... ·:. . . ...... ~· .. ....... ~ . . . . . . . . ~ . . . . . . . ·:' ...... ' .. :· ......... :
:: : : :::::;::::::·:::::::::: ;: :: ·::···::::: :::·::::::: ::::::::.··· ::::: :' ::::::·•e~ . . . . . . . .
3000
~2000 '"""' '. """"'~' ...... ~ .............. .. ""'""!"""" 1"'""'"j' """"('"""':
................................................... . . ' . . 1000 . : : : : ......... : ........ : ....... ... : ....... -< .......... ex . 00 .4-~..+l---i--+---i-JL_--i---+----1+----+-J....4=-~
Tool nuMher 1.00 Ti Me: 269 Msec,
Rise Tirne - 83.04 rnsec. Force at 10x - 424 !bs - -Fall Time - 45.90 msec. Force at 50x - 2081 lbs - -Pulse Width - 141 rnsec. Force at 90x - 3737 lbs - -Dwe 11 Ti me. - 72 .14 rnsec . M~x. Force - 4161 lbs - -Contact Time - 201 msec. -
Area to Peak - 319 lbs seconds -Area from Peak = 257 lbs seconds Total Area = 575 lbs seconds
Figure 31. Typical Pulse Analysis of the Compaction Force-Time Curve for Blend#10 at 4000 lbs
122
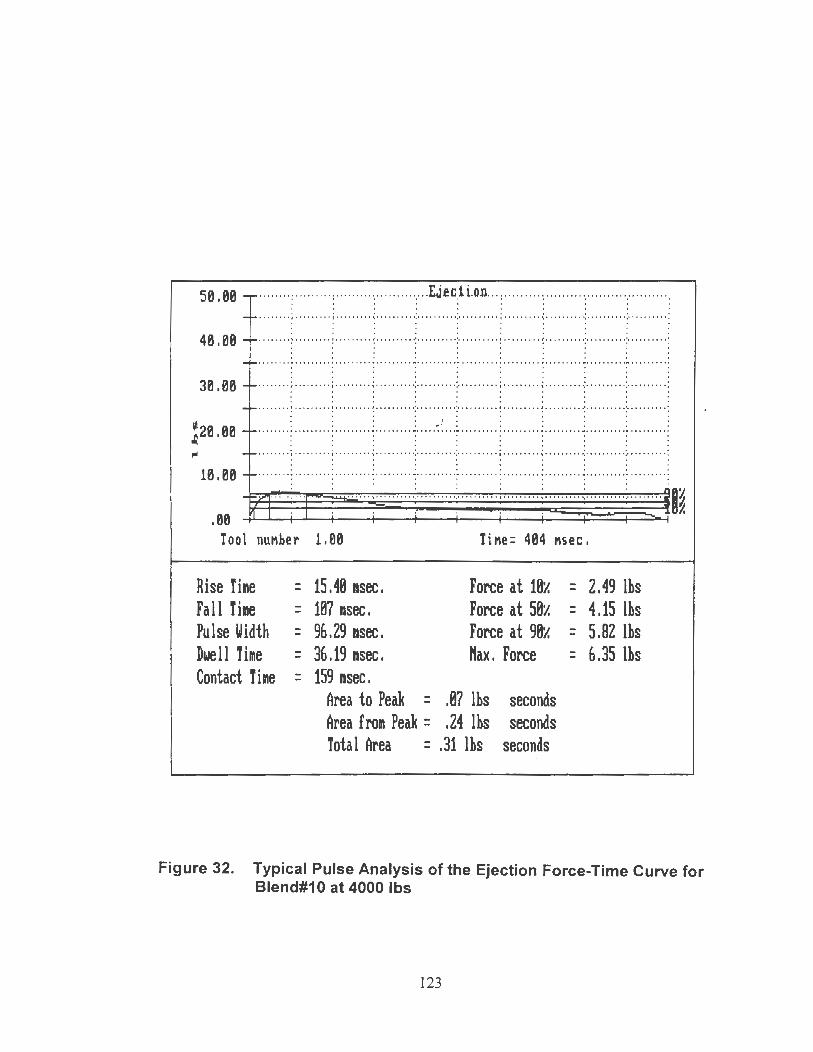
(
50. 00 ......... ...................... ........... ... : .. . Ej.ec:t i.on .............. ....... ·:· ........ ':""' ... ": . . . ' .
-+- ··· ····· ... ...... .. .. ..... ·· ·· ··· ···:··· ··· .. ··:·· ··· ···· · ··· ·· ·· ·· ·· ·· ·· ····:· ·· ·······:·· ········: . ' . . . 40. 00 + · .... ...... ........................ ·> ....... ·!· ......... .... ..... .. .. ... .. ·:· .. .... .. ·:· ... .... <
. . . . . -+- · ........... ......... . .... .... ... . . ~· ... ... .. ·: .. .. ..... . .. .. ..... . ....... ~ · ....... . ·: .. ... ... ·: . . . . . . . . . . 30. 00 -+- · .... . .. .. ........... ... ............ : . ... . .. ... : ... . .. . . ... .... .. .. ... ... ... ·:· ......... : ....... . . ·: . . . . . . . . . -+- .. .. . . . . . .. . . . . . . . . . .. . . . . . ... . .. . . ·:· . .. ..... ·:·. . . . . . .. . .. . . . . . .. . . . .... . . ·:· .. .. .. . . ·:" .. .... . . : . . . . .
~ 20 110 -+- ····"" ...... .. ... .. .. ..... ..... .. : ..... ~ '. ... : .. .... ........... . ...... ... ~ .......... : .. ....... : ~ • ti . . . . . . ' . . . . ' . . .
-+- . .. . . . . . . . . . . . . . . . . . . . . . . . . ....... . ·: · . ...... . ·:· .. . . . . . . . . . . . . . . . . . ........ ·: ....... .. ·:· .... ..... : . . . . . 10 . 00 -+- ...................... ...... .. .. .. . ~ .. .. .... .. : ..... .. .. .. ....... .. ..... .. ~ .. .. .. ... ·: .. ....... ;
: : : : _n~., ~ ..... ,.. . . ······ : ······ ·· ·~ · ·· · · · · · · :···· · ·····.··· ·· · ·· · : ·· · · .............. .. ... .. ..... ~e~
.00 ~ ] . ]
Tool nut'lher 1.00 Til'le= 404 t'lsec.
Rise Time --Fall Time --Pulse Width --Dwell Time --Contact Time --
15.40 111sec . 107 msec. 96.29 msec. 36.19 msec . 159 msec.
Force at 10i! Force at 50i! Force at 90i! Hax. Force
Area to Peak - .07 lbs seconds Area from Peak = .24 lbs seconds Total Area = .31 lbs seconds
- 2.49 lbs - 4.15 lbs - 5.82 lbs - 6 .35 lbs
Figure 32. Typical Pulse Analysis of the Ejection Force-Time Curve for Blend#10 at 4000 lbs
123
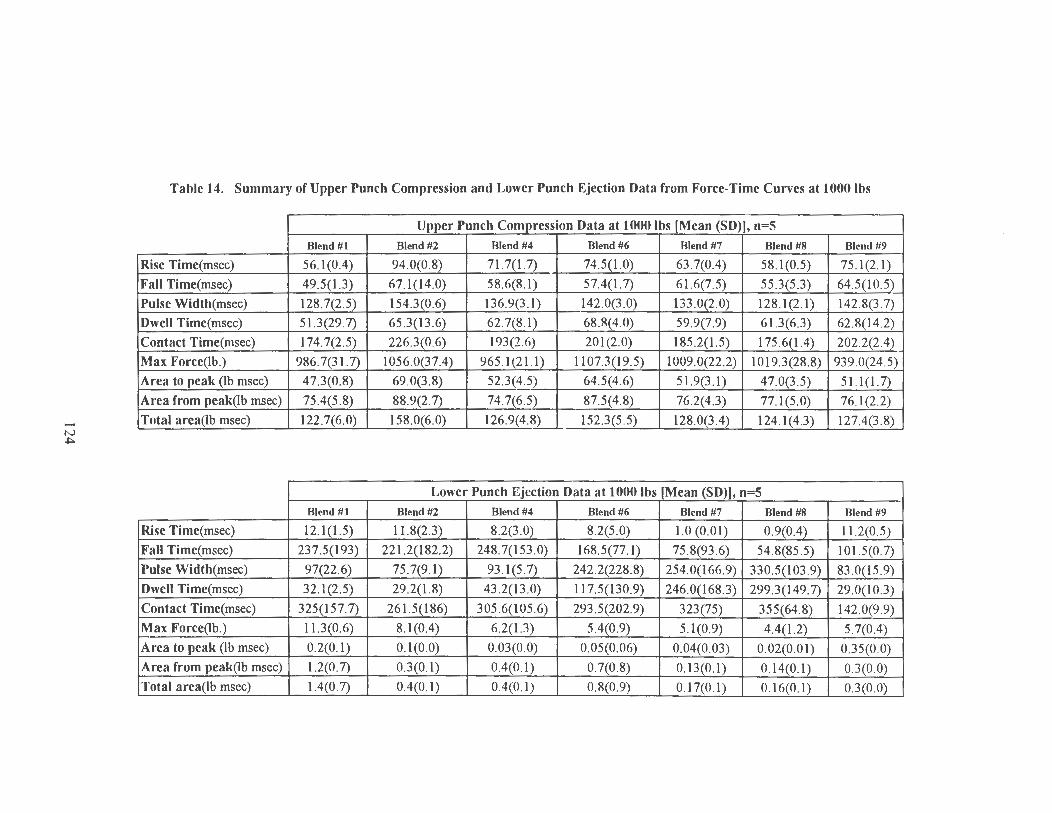
........ N ~
, .......
Table 14. Summary of Upper Punch Compression and Lower Punch Ejection Data from Force-Time Curves at 1000 lbs
Upper Punch Compression Data at 1000 lbs [Mean (SD)], n=5
Blend #1 Blend #2 Blend #4 Blend #6 Blend #7 Blend #8 Blend #9
Rise Time(msec) 56.1(0.4) 94.0(0.8) 71.7(1.7) 74.5(1.0) 63 .7(0.4) 58.1(0.5) 75 .1(2.1)
Fall Time(msec) 49.5(1.3) 67.1(14.0) 58.6(8.1) 57.4(1.7) 61.6(7.5) 55 .3(5.3) 64.5(10.5)
Pulse Width(msec) 128.7(2.5) 154.3(0.6) 136.9(3 .1) 142.0(3 .0) 133.0(2.0) 128.1(2.1) 142.8(3 .7)
Dwell Time(msec) 51.3(29.7) 65 .3(13.6) 62.7(8.1) 68.8(4.0) 59.9(7.9) 61.3(6.3) 62 .8(14.2)
Contact Time(msec) 174.7(2.5) 226.3(0.6) 193(2.6) 201(2.0) 185.2(1.5) 175.6(1.4) 202 .2(2.4)
Max Force(lb.) 986. 7(31. 7) 1056.0(37.4) 965 .1 (21.1) 1107.3(19.5) 1009.0(22.2) 1019.3(28.8) 939.0(24.5)
Area to peak (lb msec) 47.3(0.8) 69 . 0(3 .~ 52.3(4.5) 64.5(4.6) 51.9(3 .1) 47.0(3 .5) 51.1(1.7)
Area from peak(lb msec) 75.4(5 .8) 88.9(212_ 74.7(6.5) 87.5(4.8) 76.2(4.3) 77.1(5 .0l 76.1(2.2)
Total area(lb msec) 122.7(6.0) 158.0(6.0) 126.9(4.8) 152.3(5 .5) 128.0(3.4) 124.1(4.3) 127.4(3 .8)
Lower Punch Ejection Data at 1000 lbs [Mean (SD)], n=5
Blend #1 Blend #2 Blend #4 Blend #6 Blend #7 Blend #8 Blend #9
Rise Time(msec) 12.1(1.5) 11.8(2.3) 8.2(3 .0) 8.2(5.0) 1.0 (0.01) 0.9(0.4) 11 .2(0.5)
Fall Time(msec) 237.5(193) 221.2(182.2) 248.7(153 .0) 168.5(77.1) 75 .8(93 .6) 54.8(85.5) 101.5(0.7)
Pulse Width(msec) 97(22.6) 75 .7(9.1) 93 .1(5.7) 242.2(228.8) 254.0(166.9) 330.5(103.9) 83 .0(15 .9)
Dwell Time(msec) 32.1(2.5) 29.2(1.8) 43 .2(13 .0) 117.5(130.9) 246. 0(168.3) 299.3(149.7) 29.0(10.3)
Contact Time(msec) 325(157.7) 261.5(186) 305 . 6(105 .~ 293 .5(202.9) 323(75) 355(64.8) 142.0(9.9) Max Force(lb.) 11.3(0.6) 8.1(0.4) 6.2(1.3) 5.4(0.9) 5.1(0.9) 4.4(1.2) 5.7(0.4) Area to peak (lb msec) 0.2(0.1) 0.1(0.0) 0.03(0.0) 0.05(0.06) 0.04(0.03) 0.02(0.01) 0.35(0.0) Area from peak(lb msec) 1.2(0.7) 0.3(0.1) 0.4(0.1) 0.7(0.8) 0.13(0.1) 0.14(0.1) 0.3(0.0) Total area(lb msec) 1.4(0.7) 0.4(0.1) 0.4(0.1) 0.8(0.9) 0.17(0.1) 0.16(0.1) 0.3(0.0)
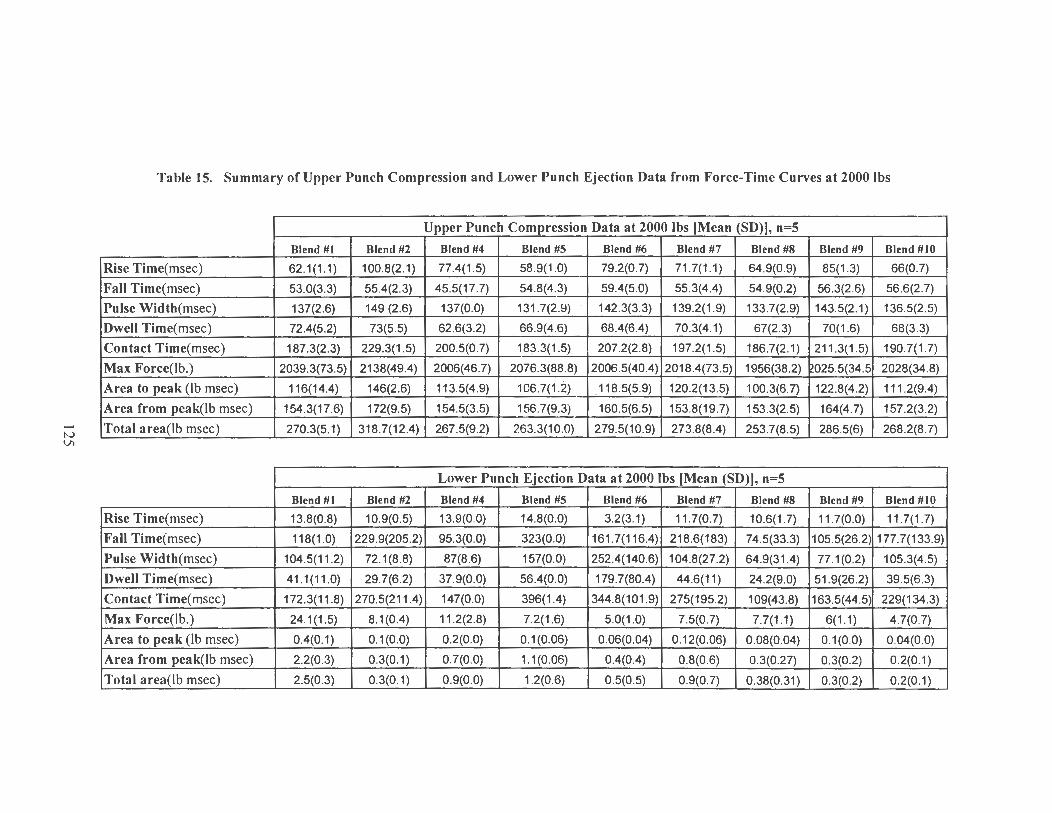
...... N VI
-
Table 15. Summary of Upper Punch Compression and Lower Punch Ejection Data from Force-Time Curves at 2000 lbs
Upper Punch Compression Data at 2000 lbs rMean (SD)], n=S
Blend #1 Blend #2 Blend #4 Blend #5 Blend #6 Blend #7 Blend #8 Blend #9 Blend #10
Rise Time(msec) 62.1(1 .1) 100.8(2.1) 77.4(1 .5) 58.9(1 .0) 79.2(0.7) 71 .7(1 .1) 64.9(0.9) 85(1 .3) 66(0.7)
Fall Time(msec) 53.0(3.3) 55.4(2.3) 45.5(17.7) 54.8(4.3) 59.4(5.0) 55.3(4.4) 54.9(0.2) 56.3(2.6) 56.6(2.7)
Pulse Width(msec) 137(2.6) 149 (2.6) 137(0.0) 131 .7(2.9) . 142.3(3.3) 139.2(1 .9) 133.7(2.9) 143.5(2.1) 136.5(2.5)
Dwell Time(msec) 72.4(5.2) 73(5.5) 62.6(3.2) 66.9(4.6) 68.4(6.4) 70.3(4.1) 67(2.3) 70(1 .6) 68(3.3)
Contact Time(msec) 187.3(2.3) 229.3(1.5) 200.5(0.7) 18;3.3(1 .5) 207.2(2.8) 197.2(1.5) 186.7(2.1) 211.3(1 .5) 190.7(1 .7)
Max Force(lb.) 2039.3(73.5) 2138(49.4) 2006(46.7) 2076.3(88.8) 2006.5(40.4) 2018.4(73.5) 1956(38.2) ~025 . 5(34 .5 2028(34.8)
Area to peak (lb msec) 116(14.4) 146(2.6) 113.5(4.9) 106.7(1 .2) .118.5(5.9) 120.2(13.5) 100.3(6.7) 122.8(4.2) 111 .2(9.4)
Area from peak(lb msec) 154.3(17.6) 172(9.5) 154.5(3.5) 156.7(9.3) 160.5(6.5) 153.8(19. 7) 153.3(2.5) 164(4.7) 157.2(3.2)
Total area(lb msec) 270.3(5.1) 318. 7(12.4) 267.5(9.2) 263.3(10.0) 279.5(10.9) 273.8(8.4) 253.7(8.5) 286.5(6) 268.2(8.7)
Lower Punch Ejection Data at 2000 lbs [Mean (SD)], n=S
Blend #1 Blend #2 Blend #4 Blend #5 Blend #6 Blend #7 Blend #8 Blend #9 Blend #10
Rise Time(msec) 13.8(0.8) 10.9(0.5) 13.9(0.0) 14.8(0.0) 3.2(3.1) 11 .7(0.7) 10.6(1 .7) 11 .7(0.0) 11 .7(1 .7)
Fall Time(msec) 118(1 .0) 229.9(205.2) 95.3(0.0) 323(0.0) 161 .7(116.4) 218.6(183) 74.5(33.3) 105.5(26.2) 177.7(133.9)
Pulse Width(msec) 104.5(11.2) 72.1(8.8) 87(8.6) 157(0.0) 252.4(140.6) 104.8(27.2) 64.9(31.4) 77.1 (0.2) 105.3(4.5)
Dwell Time(msec) 41 .1(11.0) 29.7(6.2) 37.9(0.0) 56.4(0.0) 179.7(80.4) 44.6(11) 24.2(9.0) 51 .9(26.2) 39.5(6.3)
Contact Time(msec) 172.3(11 .8) 270.5(211.4) 147(0.0) 396(1.4) 344.8(101 .9) 275(195.2) 109(43.8) 163.5(44.5) 229(134.3)
Max Force(lb.) 24.1 (1.5) 8.1 (0.4) 11 .2(2.8) 7.2(1.6) 5.0(1 .0) 7.5(0.7) 7.7(1 .1) 6(1 .1) 4.7(0.7)
Area to peak (lb msec) 0.4(0.1) 0.1(0.0) 0.2(0.0) 0.1 (0.06) 0.06(0.04) 0.12(0.06) 0.08(0.04) 0.1(0.0) 0.04(0.0)
Area from peak(lb msec) 2.2(0.3) 0.3(0.1) 0.7(0.0) 1.1 (0.06) 0.4(0.4) 0.8(0.6) 0.3(0.27) 0.3(0.2) 0.2(0.1)
Total area(lb msec) 2.5(0.3) 0.3(0.1) 0.9(0.0) 1.2(0.6) 0.5(0.5) 0.9(0.7) 0.38(0.31) 0.3(0.2) 0.2(0.1)
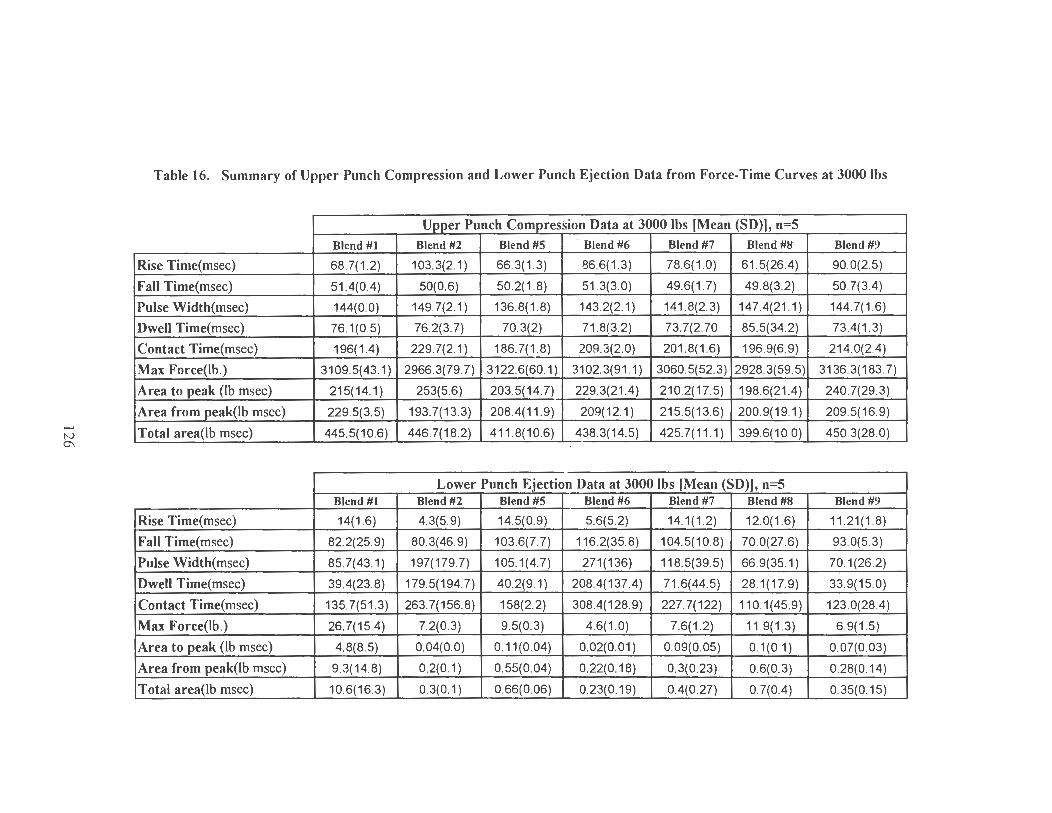
N 0\
-.....,
Table 16. Summary of Upper Punch Compression and Lower Punch Ejection Data from Force-Time Curves at 3000 lbs
Upper Punch Compression Data at 3000 lbs (Mean (SD)], n=S
Blend #1 Blend #2 Blend #5 · Blend #6 Blend #7 Blend #8 Blend #9
Rise Time(msec) 68.7(1 .2) 103.3(2.1) 66.3(1 .3) 86.6(1 .3) 78.6(1 .0) 61 .5(26.4) 90.0(2.5)
Fall Time(msec) 51.4(0.4) 50(0.6) 50.2(1 .8) 51 .3(3.0) 49.6(1 .7) 49.8(3.2) 50.7(3.4)
Pulse Width(msec) 144(0.0) 149.7(2.1) 136.8(1 .8) 143.2(2.1) 141 .8(2.3) 147.4(21 .1) 144.7(1.6)
Dwell Time(msec) 76.1(0.5) 76.2(3.7) 70.3(2) 71 .8(3.2) 73.7(2.70 85.5(34.2) 73.4(1 .3)
Contact Time(msec) 196(1.4) 229.7(2.1) 186.7(1 .8) 209.3(2.0) 201 .8(1 .6) 196.9(6.9) 214.0(2.4)
Max Force(lb.) 3109.5(43.1) 2966.3(79.7) 3122.6(60.1) 3102.3(91 .1) 3060.5(52.3) 2928.3(59.5) 3136.3(183.7)
Area to peak (lb msec) 215(14.1) 253(5.6) 203.5(14.7) 229.3(21.4) 210.2(17.5) 198.6(21.4) 240. 7(29.3)
Area from peak(lb msec) 229.5(3.5) 193.7(13.3) 208.4(11 .9) 209(12.1) 215.5(13.6) 200.9(19.1) 209.5(16.9)
Total area(lb msec) 445.5(10.6) 446.7(18.2) 411 . ~(10 . 6) 438.3(14.5) 425.7(11 .1) 399.6(10.0) 450.3(28.0)
Lower Punch Ejection Data at 3000 lbs (Mean (SD)] , n=S Blend #1 Blend #2 Blend #5 Blend #6 Blend #7 Blend #8 Blend #9
Rise Time(msec) 14(1 .6) 4.3(5.9) 14.5(0.9) 5.6(5.2) 14.1(1.2) 12.0(1 .6) 11 .21(1 .8)
Fall Time(msec) 82.2(25.9) 80.3(46.9) 103.6(7.7) 116.2(35.8) 104.5(10.8) 70.0(27.6) 93.0(5.3)
Pulse Width(msec) 85.7(43.1) 197(179.7) 105.1(4.7) 271(136) 118.5(39.5) 66.9(35.1) 70.1(26.2)
Dwell Time(msec) 39.4(23.8) 179.5(194.7) 40.2(9.1) 208.4(137.4) 71 .6(44.5) 28.1(17.9) 33.9(15.0)
Contact Time(msec) 135. 7(51 .3) 263.7(156.8) 158(2.2) 308.4(128.9) 227.7(122) 110.1(45.9) 123.0(28.4)
Max Force(lb .) 26.7(15.4) 7.2(0.3) 9.5(0.3) 4.6(1 .0) 7.6(1 .2) 11 .9(1 .3) 6.9(1 .5)
Area to peak (lb msec) 4.8(8.5) 0.04(0.0) 0.11(0.04) 0.02(0.01) 0.09(0.05) 0.1(0.1) 0.07(0.03)
Area from peak(lb msec) 9.3(14.8) 0.2(0.1) 0.55(0.04) 0.22(0.18) 0.3(0.23) 0.6(0.3) 0.28(0.14)
Total area(lb msec) 10.6(16.3) 0.3(0.1) 0.66(0.06) 0.23(0.19) 0.4(0.27) 0.7(0.4) 0.35(0.15)
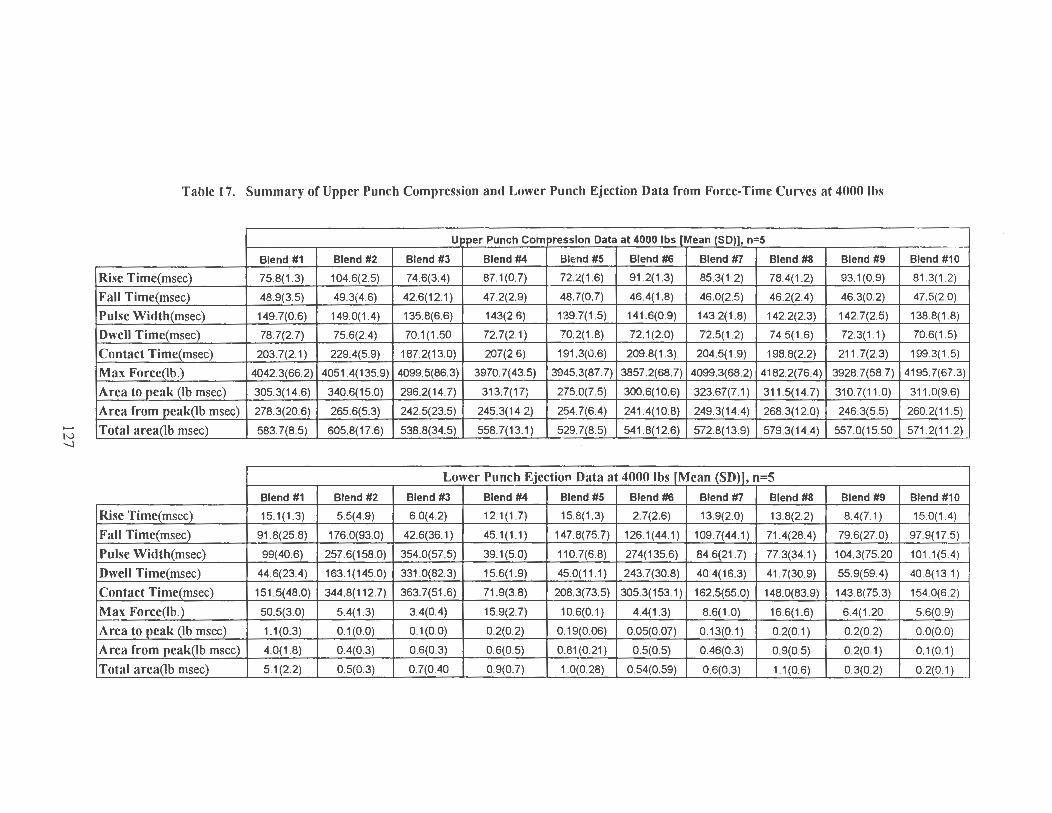
....... N -....l
Table 17. Summary of Upper Punch Compression and Lower Punch Ejection Data from Force-Time Curves at 4000 lhs
U~er Punch Compression Data at 4000 lbs IMean (SD)], n=5
Blend #1 Blend #2 Blend #3 Blend #4 Blend #5 Blend m; Blend #7 Blend #8 Blend #9
ruse Time(msec;[ 75.8(1 .3) 104.6(2.5) 74.6(3.4) 87.1(0.7) 72.2(1 .6) 91 .2(1 .3) 85.3(1 .2) 78.4(1 .2) 93.1(0.9)
Fall Time(_msec}_ 48.9(3.5) 49.3(4.6) 42.6(12.1) 47.2(2.9) 48.7(0.7) 46.4(1 .8) 46.0(2.5) 46.2(2.4) 46.3(0.2)
Pulse Width(msec) 149.7(0.6) 149.0(1 .4) 135.8(6.6) 143(2.6) 139.7(1.5) 141 .6(0.9) 143.2(1 .8) 142.2(2.3) 142.7(2.5)
Dwell Timc(msec) 78.7(2.7) 75.6(2.4) 70.1(1 .50 72.7(2.1) 70.2(1 .8) 72.1(2.0) 72.5(1 .2) 74.5(1 .6) 72.3(1.1)
Contact Time(msec) 203.7(2.1) 229.4(5.9) 187.2(13.0) 207(2.6) 191 .3(0.6) 209.8(1 .3) 204.5(1.9) 198.8(2.2) 211 .7(2.3)
Max Force(lb.) 4042.3(66.2) 4051.4(135.9) 4099.5(86.3) 3970. 7( 43.5) 3945.3(87.7) 3857.2(68.7) 4099.3(68.2) 4182.2(76.4) 3928. 7(58. 7)
Arca to _E_eak (lb msec) 305.3(14.6) 340.6(15.0) 296.2(14.7) 313.7(17) 275.0(7.5) 300.6(10.6) 323.67(7.1) 311 .5(14.7) 310. 7(11 .0)
Area from_p_cak(lb msec) 278.3(20.6) 265.6(5.3) 242.5(23.5) 245.3(14.2) 254.7(6.4) 241 .4(10.8) 249.3(14.4) 268.3(12.0) 246.3(5.5)
Total area(lb msec) 583.7(8.5) 605.8(17.6) 538.8(34.5) 558.7(13.1) 529.7(8.5) 541 .8(12.6) 572.8(13.9) 579.3(14.4) 557.0(15.50
Lower Punch Ejection Data at 4000 lbs lMean (SDll_, n=S
Blend #1 Blend #2 Blend #3 Blend #4 Blend #5 Blend m; Blend #7 Blend #8 Blend #9
ruse Time(mse~ 15.1(1 .3) 5.5(4.9) 6.0(4.2) 12.1 (1 .7) 15.8(1 .3) 2.7(2.6) 13.9(2.0) 13.8(2.2) 8.4(7.1)
Fall Time(mse~ 91 .8(25.8) 176.0(93.0) 42.6(36.1) 45.1(1 .1) 147.8(75.7) 126.1 (44.1) 109.7(44.1) 71.4(28.4) 79.6(27.0)
Pulse Width(msec) 99(40.6) 257.6(158.0) 354.0(57.5) 39.1(5.0) 110.7(6.8) 274(135.6) 84.6(21 .7) 77.3(34.1) 104.3(75.20
Dwell Time(msec) 44.6(23.4) 163.1(145.0) 331 .0(82.3) 15.6(1 .9) 45.0(11.1) 243.7(30.8) 40.4(16.3) 41 .7(30.9) 55.9(59.4)
Contact Time(mse~ 151 .5(48.0) 344.8(112.7) 363.7(51 .6) 71 .9(3.8) 208.3(73.5) 305.3(153.1) 162.5(55.0) 148.0(83.9) 143.8(75.3)
Max Forc~b .) 50.5(3.0) 5.4(1 .3) 3.4(0.4) 15.9(2.7) 10.6(0.1) 4.4(1 .3) 8.6(1.0) 16.6(1 .6) 6.4(1.20
Area to 1!.eak (lb msec) 1.1 (0.3) 0.1(0.0) 0.1(0.0) 0.2(0.2) 0.19(0.06) 0.05(0.07) 0.13(0.1) 0.2(0.1) 0.2(0.2)
Area from _E_eak(lb msec) 4.0(1 .8) 0.4(0.3) 0.6(0.3) 0.6(0.5) 0.81 (0.21) 0.5(0.5) 0.46(0.3) 0.9(0.5) 0.2(0.1)
Total area(lb msec) 5.1 (2.2) 0.5(0.3) 0.7(0.40 0.9(0.7) 1.0(0.28) 0.54(0.59) 0.6(0.3) 1.1(0.6) 0.3(0.2)
,,,.-....
Blend #10
81 .3(1.2)
47.5(2.0)
138.8(1 .8)
70.6(1 .5)
199.3(1 .5)
4195.7(67.3)
311 .0(9.6)
260.2(11 .5)
571 .2(11 .2)
Blend #10
15.0(1.4)
97.9(17.5)
101.1 (5.4)
40.8(13.1)
154.0(6.2)
5.6(0.9)
0.0(0.0)
0.1(0.1)
0.2(0.1)
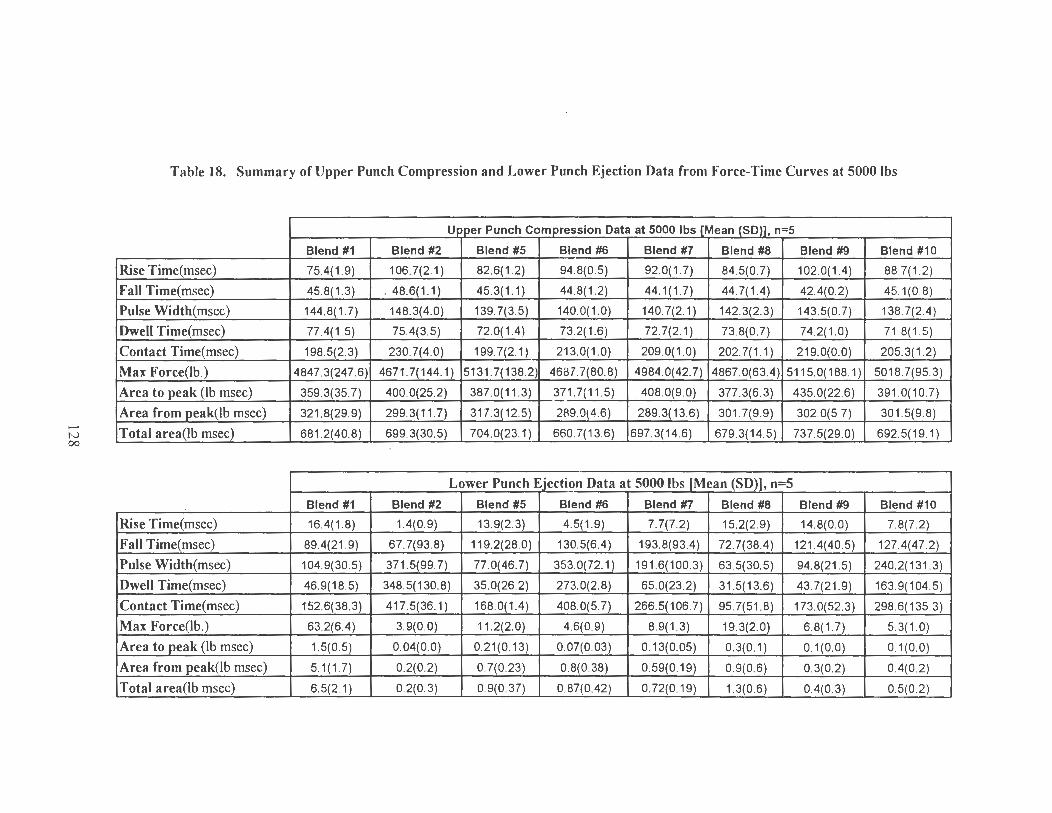
N 00
Table 18. Summary of Upper Punch Compression and Lower Punch Ejection Data from Force-Time Curves at 5000 lbs
U_E_E._er Punch Com_E_ression Data at 5000 lbs l_Mean JSDJ1 n=5
Blend #1 Blend #2 Blend #5 Blend fl6 Blend #7 Blend #8 Blend #9 Blend #10
Rise Time(msec) 75.4(1 .9) 106.7(2.1) 82.6(1.2) 94.8(0.5) 92.0(1.7) 84.5(0.7) 102.0(1.4) 88.7(1 .2)
Fall Time(msec) 45.8(1 .3) . 48.6(1 .1) 45.3(1.1) 44.8(1 .2) 44.1(1 .7) 44.7(1.4) 42.4(0.2) 45.1(0.8)
Pulse Width(msec) 144.8(1.7) 148.3(4.0) 139.7(3.5) 140.0(1 .0) 140.7(2.1) 142.3(2.3) 143.5(0.7) 138.7(2.4)
Dwell Time(msec) 77.4(1 .5) 75.4(3.5) 72.0(1.4) 73.2(1 .6) 72.7(2.1) 73.8(0.7) 74.2(1 .0) 71 .8(1 .5)
Contact Time(msec) 198.5(2.3) 230.7(4.0) 199.7(2.1) 213.0(1 .0) 209.0(1 .0) 202.7(1 .1) 219.0(0.0) 205.3(1 .2)
Max Force(lb.) 4847.3(247.6) 4671 .7(144.1) 5131 . 7(138.2) 4687.7(80.8) 4984.0(42.7) 4867.0(63.4) 5115.0(188.1) 5018.7(95.3)
Area to _£_eak (lb msec) 359. 3(35. 7) 400.0(25.2) 387.0(11 .3) 371 . 7(11 .5) 408.0(9.0) 377.3(6.3) 435.0(22.6) 391.0(10.7)
Area from _£_eak(lb msec) 321 .8(29.9) 299.3(11 .7) 317.3(12.5) 2R9.0(4.6) 289.3(13.6) 301.7(9.9) 302.0(5.7) 301 .5(9.8)
Total area(lb msec) 681.2(40.8) 699.3(30.5) 704.0(23.1) 660.7(13.6) 697.3(14.6) 679.3(14.5) 737.5(29.0) 692.5(19.1)
Lower Punch Ejection Data at 5000 lbs lMean (SD)], n=5
Blend #1 Blend #2 Blend #5 Blend fl6 Blend #7 Blend #8 Blend #9 Blend #10
Rise Time(msec) 16.4(1.8) 1.4(0.9) 13.9(2.3) 4.5(1 .9) 7.7(7.2) 15.2(2.9) 14.8(0.0) 7.8(7.2)
Fall Time(msec) 89.4(21 .9) 67.7(93.8) 119.2(28.0) 130.5(6.4) 193.8(93.4) 72.7(38.4) 121.4(40.5) 127.4(47.2)
Pulse Width(msec) 104.9(30.5) 371 .5(99.7) 77.0(46.7) 353.0(72.1) 191 .6(100.3) 63.5(30.5) 94.8(21 .5) 240.2(131 .3)
Dwell Time(msec) 46.9(18.5) 348.5(130.8) 35.0(26.2) 273.0(2.8) 65.0(23.2) 31 .5(13.6) 43.7(21 .9) 163.9(104.5)
Contact Time(msec) 152.6(38.3) 417.5(36.1) 168.0(1.4) 408.0(5.7) 266.5(106.7) 95. 7(51 .8) 173.0(52.3) 298.6(135.3)
Max Force(lb.) 63.2(6.4) 3.9(0.0) 11 .2(2.0) 4.6(0.9) 8.9(1 .3) 19.3(2.0) 6.8(1 .7) 5.3(1.0)
Area top_eak (lb msec) 1.5(0.5) 0.04(0.0) 0.21(0.13) 0.07(0.03) 0.13(0.05) 0.3(0.1) 0.1(0.0) 0.1(0.0)
Area from peak(lb msec) 5.1(1 .7) 0.2(0.2) 0.7(0.23) 0.8(0.38) 0.59(0.19) 0.9(0.6) 0.3(0.2) 0.4(0.2)
Total area(lb msec) 6.5(2.1) 0.2(0.3) 0.9(0.37) 0.87(0.42) 0.72(0.19) 1.3(0.6) 0.4(0.3) 0.5(0.2)
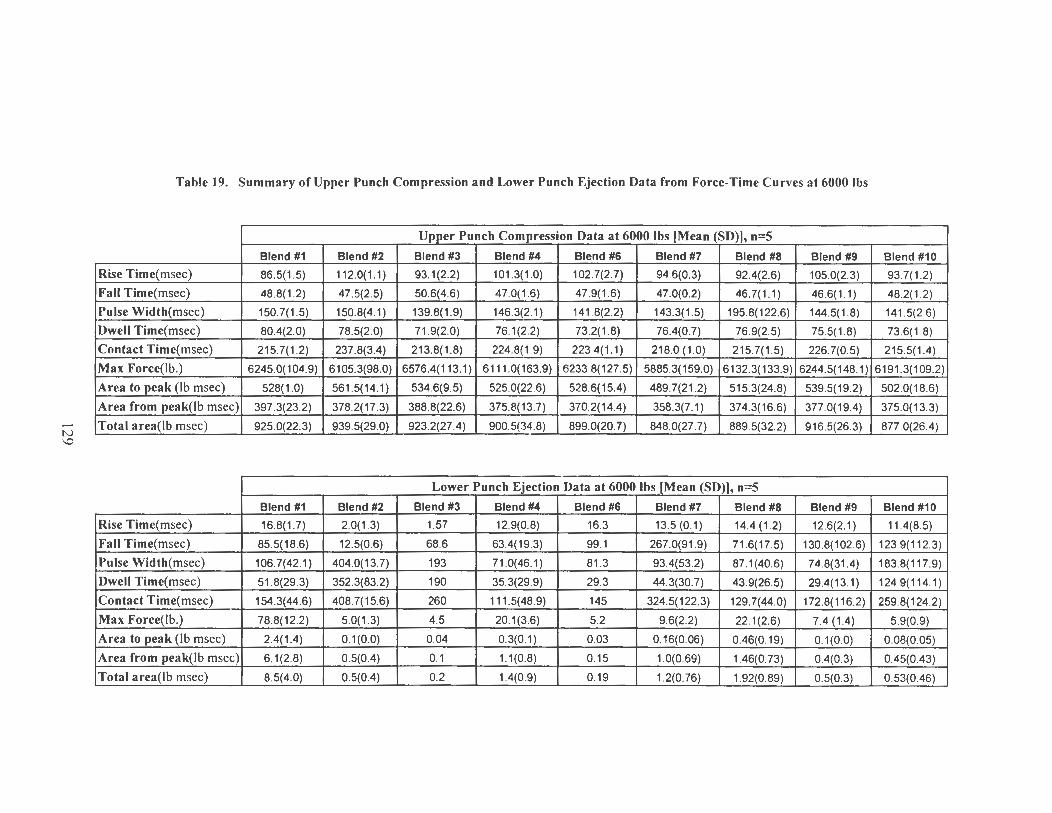
N \D
Table 19. Summary of Upper Punch Compression and Lower Punch Ejection Data from Force-Time Curves at 6000 lbs
U..Ef_er Punch Com_e_ression Data at 6000 lbs !Mean (SD)], n=S
Blend #1 Blend #2 Blend #3 Blend #4 Blend #6 Blend #7 Blend #8 Blend #9
Rise Time(msec) 86.5(1 .5) 112.0(1 .1) 93.1(2.2) 101 .3(1 .0) 102.7(2.7) 94.6(0.3) 92.4(2.6) 105.0(2.3)
Fall Time(msec) 48.8(1 .2) 47.5(2.5) 50.6(4.6) 47.0(1 .6) 47.9(1 .6) 47.0(0.2) 46.7(1 .1) 46.6(1 .1)
Pulse Width(msec) 150.7(1 .5) 150.8(4.1) 139.8(1 .9) 146.3(2.1) 141 .8(2.2) 143.3(1 .5) 195.8(122.6) 144.5(1 .8)
Dwell Time(msec) 80.4(2.0) 78.5(2.0) 71.9(2.0) 76.1(2.2) 73.2(1 .8) 76.4(0.7) 76.9(2.5) 75.5(1 .8)
Contact Time(msec) 215.7(1 .2) 237.8(3.4) 213.8(1 .8) 224.8(1 .9) 223 4(1.1) 218.0 (1 .0) 215.7(1.5) 226.7(0.5)
Max Force(lb.) 6245.0(104.9) 6105.3(98.0) 6576.4( 113.1) 6111 .0(163.9) 6233.8(127.5) 5885.3(159.0) 6132.3(133.9) 6244.5(148.1)
Area to peak (lb msec) 528(1 .0) 561 .5(14.1) 534.6(9.5) 525.0(22.6) 528.6(15.4) 489.7(21 .2) 515.3(24.8) 539.5( 19.2)
Area from peak(lb msec) 397.3(23.2) 378.2(17.3) 388.8(22.6) 375.8(13.7) 370.2(14.4) 358.3(7.1) 374.3(16.6) 377.0(19.4)
Total area(lb msec) 925.0(22.3) 939.5(29.0) 923.2(27.4) 900.5(34.8) 899.0(20.7) 848.0(27.7) 889.5(32.2) 916.5(26.3)
Lower Punch Ejection Data at 6000 lbs [Mean (SD)], n=S
Blend #1 Blend #2 Blend #3 Blend #4 Blend #6 Blend #7 Blend #8 Blend #9
Rise Time(msec) 16.8(1 .7) 2.0(1 .3) 1.57 12.9(0.8) 16.3 13.5 (0 .1) 14.4 (1.2) 12.6(2.1)
Fall Time(msec) 85.5(18.6) 12.5(0.6) 68.6 63.4(19.3) 99.1 267.0(91 .9) 71 .6(17.5) 130.8(102.6)
Pulse Width(msec) 106.7(42.1) 404.0(13.7) 193 71 .0(46.1) 81 .3 93.4(53.2) 87.1(40.6) 74.8(31.4)
Dwell Time(msec) 51 .8(29.3) 352.3(83.2) 190 35.3(29.9) 29.3 44.3(30.7) 43.9(26.5) 29.4(13.1)
Contact Time(msec) 154.3(44.6) 408.7(15.6) 260 111 .5(48.9) 145 324.5(122.3) 129.7(44.0) 172.8(116.2)
Max Force(lb.) 78.8(12.2) 5.0(1 .3) 4.5 20.1(3.6) 5.2 9.6(2.2) 22.1(2.6) 7.4 (1 .4)
Area to peak (lb msec) 2.4(1 .4) 0.1(0.0) 0.04 0.3(0.1) 0.03 0.16(0.06) 0.46(0.19) 0.1(0.0)
Area from peak(lb msec) 6.1(2.8) 0.5(0.4) 0.1 1.1(0.8) 0.15 1.0(0.69) 1.46(0.73) 0.4(0.3)
Total area(lb msec) 8.5(4.0) 0.5(0.4) 0.2 1.4(0.9) 0.19 1.2(0.76) 1.92(0.89) 0.5(0.3)
Blend #10
93.7(1 .2)
48.2(1 .2)
141 .5(2.6)
73.6(1 .8)
215.5(1.4)
6191 .3(109.2)
502.0(18.6)
375.0(13.3)
877.0(26.4)
Blend #10
11.4(8.5)
123.9(112.3)
183.8(117.9)
124.9(114.1)
259.8(124.2)
5.9(0.9)
0.08(0.05)
0.45(0.43)
0.53(0.46)
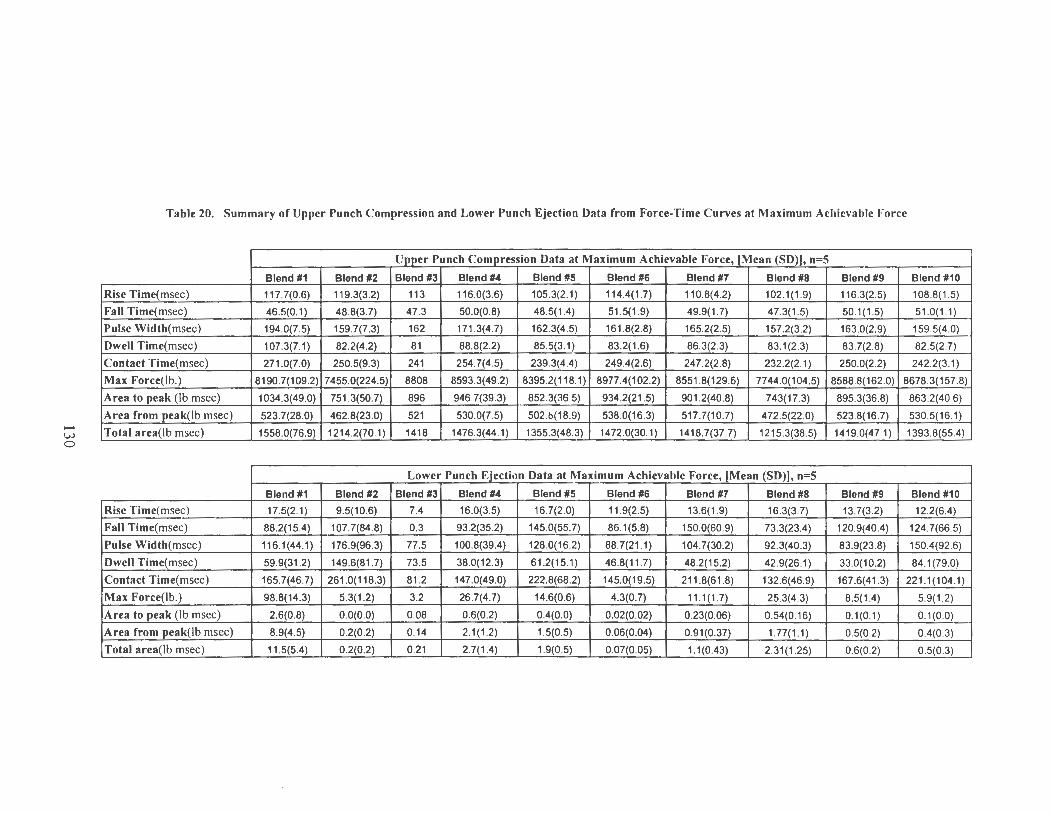
Table 20. Summary of Upper Punch Compression and Lower Punch Ejection Data from Force-Time Curves at Maximum Achievable Force
UHer Punch Com_E.t"ession Data at Maximum Achievable Force, [Mean (SD)), n=S
Blend #1 Blend #2 Blend#3 Blend #4 Blend#S Blend #6 Blend #7 Blend #8 Blend #9 Blend #10
Rise Time(msec) 117.7(0.6) 119.3(3.2) 113 116.0(3.6) 105.3(2.1) 114.4(1 .7) 110.8(4.2) 102.1(1 .9) 116.3(2.5) 108.8(1.5)
Fall Time(msec) 46.5(0.1) 48.8(3.7) 47.3 50.0(0.8) 48.5(1 .4) 51 .5(1 .9) 49.9(1 .7) 47.3(1 .5) 50.1(1 .5) 51 .0(1 .1)
Pulse Width(msec) 194.0(7.5) 159.7(7.3) 162 171 .3(4.7) 162.3(4.5) 161 .8(2.8) 165.2(2.5) 157.2(3.2) 163.0(2.9) 159.5(4.0)
Dwell Time(msec) 107.3(7.1) 82.2(4.2) 81 88.8(2.2) 85.5(3.1) 83.2(1 .6) 86.3(2.3) 83.1(2.3) 83.7(2.8) 82.5(2.7)
Contact Time(msec) 271 .0(7.0) 250.5(9.3) 241 254.7(4.5) 239.3(4.4) 249.4(2 .6) 247.2(2.8) 232 .2(2.1) 250.0(2.2) 242.2(3.1)
Max Force(lb.) 8190.7(109.2) 7 455.0(224.5) 8808 8593.3(49.2) 8395.2(118.1) 8977.4(102.2) 8551 .8(129.6) 77 44.0(104.5) 8588.8(162.0) 8678.3( 157 .8)
Area to peak (lb msec) 1034.3(49.0) 751 .3(50.7) 896 946.7(39.3) 852.3(36.5) 934.2(21 .5) 901.2(40.8) 743(17.3) 895.3(36.8) 863.2(40.6)
Area from peak(lb msec) 523.7(28.0) 462.8(23.0) 521 530.0(7.5) 502.b(18.9) 538.0(16.3) 517.7(10.7) 472.5(22.0) 523.8(16.7) 530.5(16.1)
Total area(lb msec) 1558.0(76.9) 1214.2(70.1) 1418 1476.3(44.1) 1355.3(48.3) 1472.0(30.1) 1418.7(37.7) 1215.3(38.5) 1419.0(47.1) 1393.8(55.4) -I.;.) 0
Lower Punch Election Data at Maximum Achievable Force, (Mean (SD}L n=S
Blend #1 Blend #2 Blend #3 Blend #4 Blend #5 Blend #6 Blend #7 Blend #8 Blend #9 Blend #10
Rise Time(msec) 17.5(2.1) 9.5(10.6) 7.4 16.0(3.5) 16.7(2.0) 11 .9(2.5) 13.6(1 .9) 16.3(3.7) 13.7(3.2) 12.2(6.4)
Fall Time(msec) 88.2(15.4) 107.7(84.8) 0.3 93.2(35.2) 145.0(55.7) 86.1(5.8) 150.0(60.9) 73 .3(23.4) 120.9(40.4) 124. 7(66.5)
Pulse Width(msec) 116.1(44.1) 176.9(96.3) 77.5 100.8(39.4) 128.0(16.2) 88.7(21 .1) 104.7(30.2) 92.3(40.3) 83.9(23.8) 150.4(92.6)
Dwell Time(msec) 59.9(31 .2) 149.6(81 .7) 73.5 38.0(12 .3) 61 .2(15.1) 46.8(11 .7) 48.2(15.2) 42.9(26.1) 33.0(10.2) 84 .1(79.0)
Contact Time(msec) 165.7(46.7) 261 .0(118.3) 81 .2 147.0(49.0) 222.8(68.2) 145.0(19.5) 211 .8(61 .8) 132.6(46.9) 167.6(41.3) 221 .1(104.1)
Max Force(lb.) 98.8(14.3) 5.3(1 .2) 3.2 26.7(4.7) 14.6(0.6) 4.3(0.7) 11.1(1 .7) 25.3(4.3) 8.5(1.4) 5.9(1 .2)
Area to peak (lb msec) 2.6(0.8) 0.0(0.0) 0.08 0.6(0.2) 0.4(0.0) 0.02(0.02) 0.23(0.06) 0.54(0.16) 0.1(0.1) 0.1(0.0)
Area from peak(lb msec) 8.9(4.5) 0.2(0.2) 0.14 2.1(1 .2) 1.5(0.5) 0.06(0.04) 0.91(0.37) 1.77(1 .1) 0.5(0.2) 0.4(0.3)
Total area(lb msec) 11 .5(5.4) 0.2(0.2) 0.21 2.7(1 .4) 1.9(0.5) 0.07(0.05) 1.1(0.43) 2.31(1 .25) 0.6(0.2) 0.5(0.3)
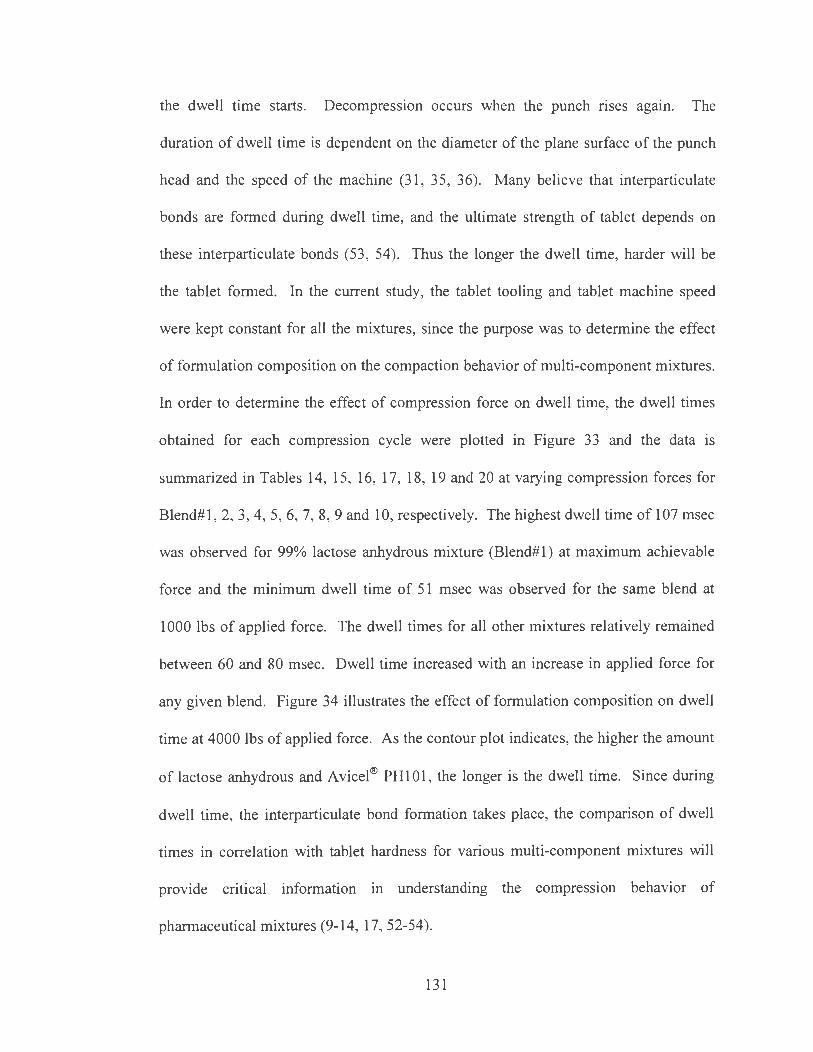
( the dwell time starts. Decompression occurs when the punch rises agam. The
duration of dwell time is dependent on the diameter of the plane surface of the punch
head and the speed of the machine (31 , 35, 36). Many believe that interparticulate
bonds are formed during dwell time, and the ultimate strength of tablet depends on
these interparticulate bonds (53 , 54). Thus the longer the dwell time, harder will be
the tablet formed. In the current study, the tablet tooling and tablet machine speed
were kept constant for all the mixtures, since the purpose was to determine the effect
of formulation composition on the compaction behavior of multi-component mixtures.
In order to determine the effect of compression force on dwell time, the dwell times
obtained for each compression cycle were plotted in Figure 33 and the data is
summarized in Tables 14, 15, 16, 17, 18, 19 and 20 at varying compression forces for
Blend#l , 2, 3, 4, 5, 6, 7, 8, 9 and 10, respectively. The highest dwell time of 107 msec
was observed for 99% lactose anhydrous mixture (Blend#l) at maximum achievable
force and the minimum dwell time of 51 msec was observed for the same blend at
1000 lbs of applied force. The dwell times for all other mixtures relatively remained
between 60 and 80 msec. Dwell time increased with an increase in applied force for
any given blend. Figure 34 illustrates the effect of formulation composition on dwell
time at 4000 lbs of applied force. As the contour plot indicates, the higher the amount
of lactose anhydrous and A vicel® PH 101 , the longer is the dwell time. Since during
dwell time, the interparticulate bond formation takes place, the comparison of dwell
times in correlation with tablet hardness for various multi-component mixtures will
provide critical information in understanding the compression behavior of
pharmaceutical mixtures (9-14, 17, 52-54).
131
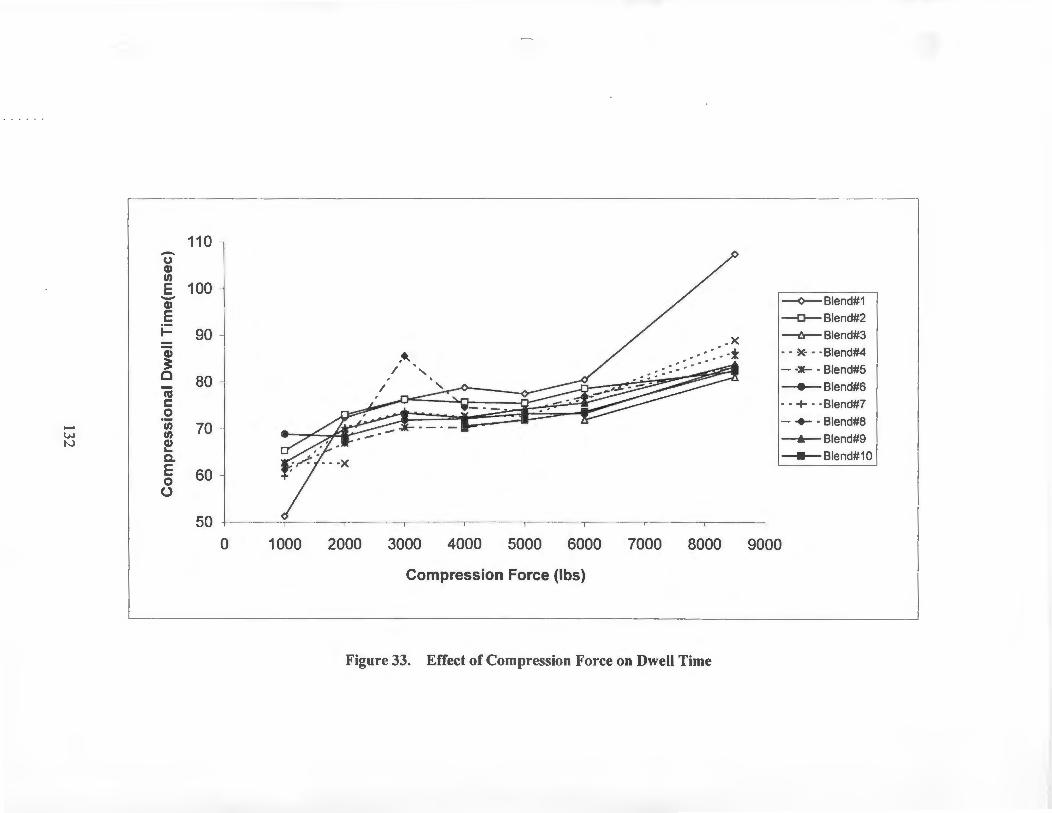
110 -0 Q) (/)
E 100 -Q) ---¢---- Blend#1
E --o-- Blend#2 I- 90 --tr-- Blend#3
Q) - - ~- - · Blend#4
== 0 80 cu
- -:.- - Blend#5
---+-- Blend#6 c: 0
- - + - ·Blend#?
.......
I (/) 70
VJ (/) N Q) ...
a.
- +- - Blend#B
__....,._ Blend#9
----Blend#10 E 60 0 (.)
50 0 1000 2000 3000 4000 5000 6000 7000 8000 9000
Compression Force (lbs)
Figure 33. Effect of Compression Force on Dwell Time
99.00 B: Avicel PH101
0.00
Dwell Time
99.00 C: Starch1500
Figure 34. Effect of Formulation Composition on Dwell Time at 4000 lbs of Compression Force
133
Figure 35 describes the effect of applied force on the total area of compaction
force time pulse. The total area of the compression pulse denotes the total amount of
work done for the compression process as a function of applied pressure. For 10
powder blends studied, the highest total area was observed for 99% Avicel® PH101
blend. Overall, the total amount of work involved increased with the applied force and
this in turn resulted in harder tablets. It is apparent for all blends that the total work
involved in the compression process increased with the applied pressure following a
linear relationship. The higher the work input involved during the compaction of
powder, the stronger the tablet is expected to be formed due to the larger amount of
energy utilized in the formation of bonds. As the compression forces are increased,
the contact areas between particles are also increased. Plastic materials will
permanently deform and create extensive areas of true contact between particles
whereas elastic materials will store energy elastically under compression. During
decompression, the stored elastic energy may disrupt and separate the true contact
areas that were established by compression forces resulting in poor bonding (9-14, 52-
61).
Figure 36 illustrates the effect of compression force on the total area of ejection
pulse. In the current study, compression force or force applied was varied from 1000
lbs to maximum achievable force on the tableting machine. The parameters generated
during ejection cycle were recorded and analyzed. As the ejection force-time data
summarized in Tables 14,15, 16, 17, 18, 19, and 20 and Figure 36 indicate for varying
formulation compositions, the highest amount of work was needed to eject tablets
134
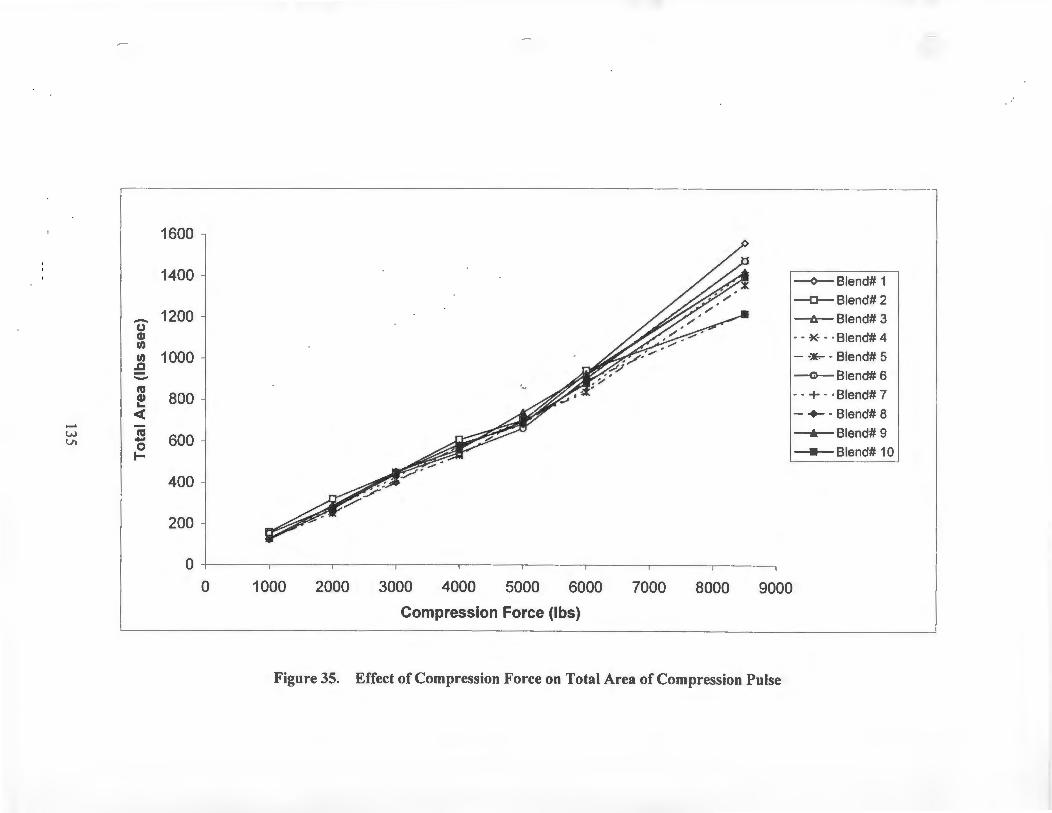
_. w VI
1600
1400
- 1200 0 Q) !/)
!/) 1000 .c -Ctl Q) 800 ~
<(
Ctl 600 -0 .... 400
200
0 0
--
--<>-Blend# 1
-O-Blend#2
--lr- Blend# 3
- - ~- - ·Blend# 4 - _,...._ - Blend# 5
--o-- Blend# 6
- -+ - · Blend# 7
- +- - Blend# 8
-...-Blend#9
-11- Blend# 10
1000 2000 3000 4000 5000 6000 7000 8000 9000
Compression Force (lbs)
Figure 35. Effect of Compression Force on Total Area of Compression Pulse
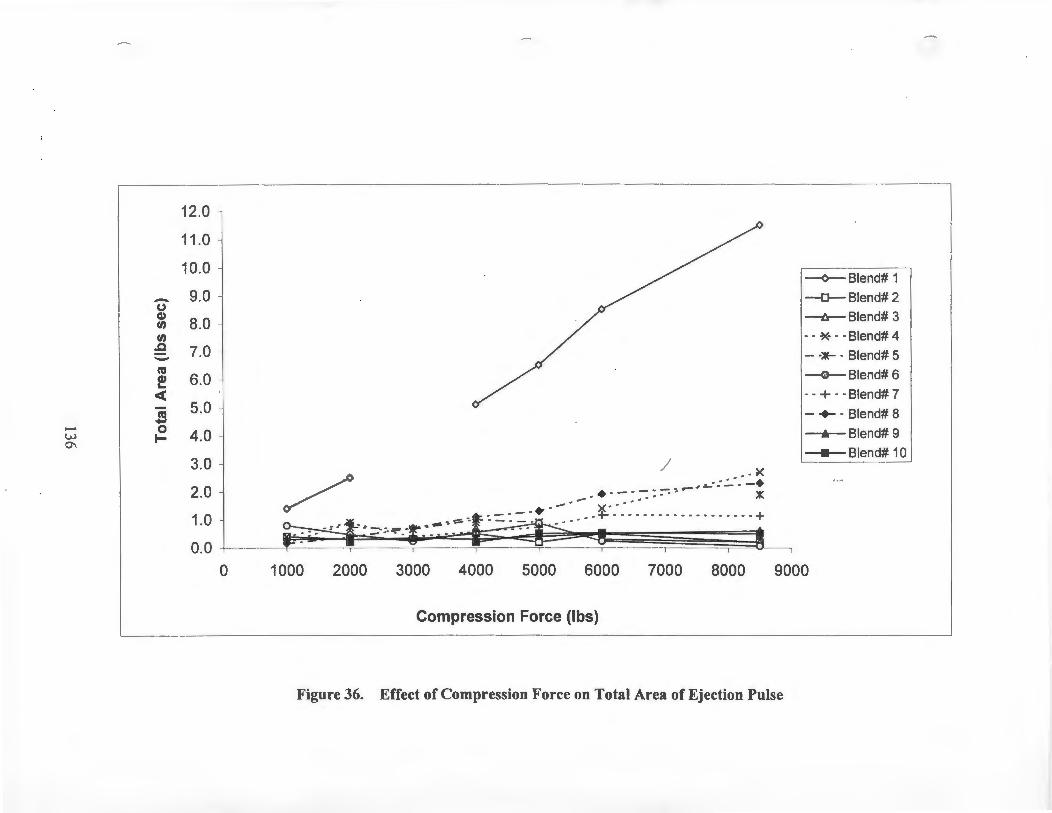
12.0
11.0
10.0
- 9.0 0 Cl)
8.0 If)
If) .c 7.0 -n:J Cl) 6.0 ... < JS
5.0
w
I 0 4.0
0\ t-
3.0
2.0
1.0
0.0 0
/ ••... ><
-···-·~=~·-·~----· x·... x •• ;+.:- ••••••••••••••••••• +
1000 2000 3000 4000 5000 6000 7000 8000
Compression Force {lbs)
~Blend#1
-o-- Blend# 2
-lr- Blend# 3
··*··Blend# 4
- -~ · Blend# 5
~Blend#6
··+··Blend# 7
- +-·Blend# 8
---....-- Blend# 9
---- Blend# 10
9000
Figure 36. Effect of Compression Force on Total Area of Ejection Pulse
,.--,
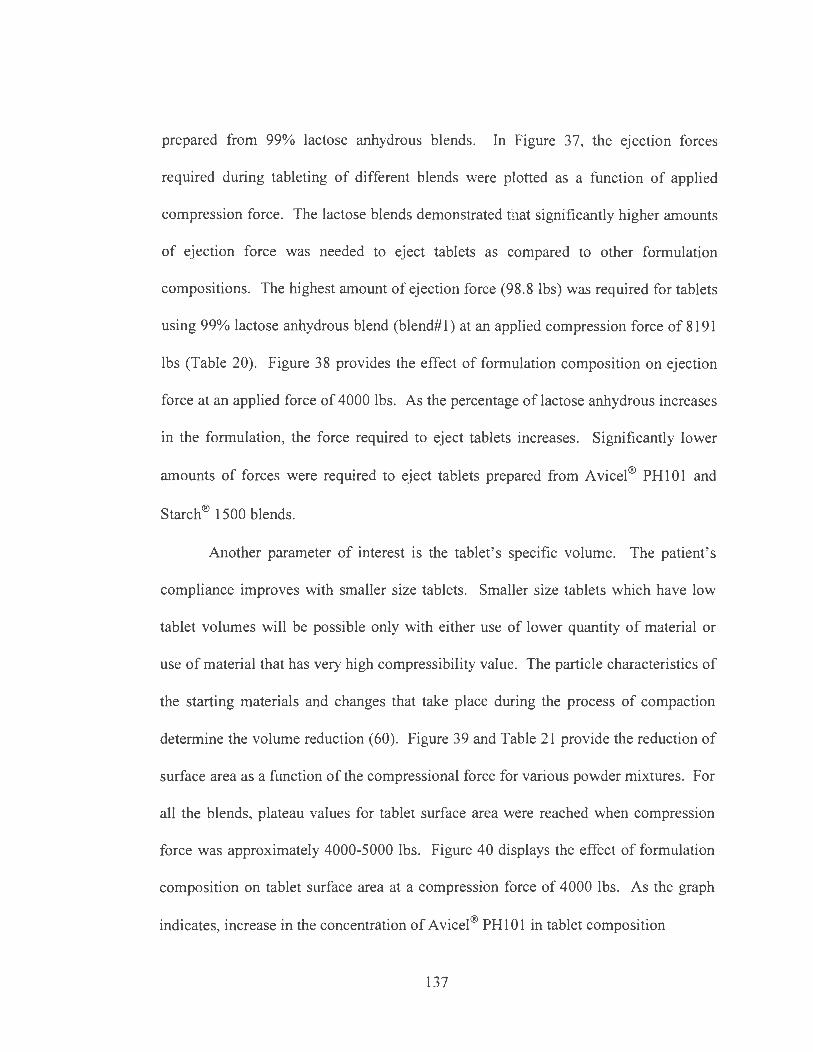
prepared from 99% lactose anhydrous blends. In Figure 37, the ejection forces
required during tableting of different blends were plotted as a function of applied
compression force. The lactose blends demonstrated that significantly higher amounts
of ejection force was needed to eject tablets as compared to other formulation
compositions. The highest amount of ejection force (98.8 lbs) was required for tablets
using 99% lactose anhydrous blend (blend# 1) at an applied compression force of 8191
lbs (Table 20). Figure 38 provides the effect of formulation composition on ejection
force at an applied force of 4000 lbs. As the percentage of lactose anhydrous increases
in the formulation, the force required to eject tablets increases. Significantly lower
amounts of forces were required to eject tablets prepared from Avicel® PHlOl and
Starch® 1500 blends.
Another parameter of interest is the tablet's specific volume. The patient's
compliance improves with smaller size tablets . Smaller size tablets which have low
tablet volumes will be possible only with either use of lower quantity of material or
use of material that has very high compressibility value. The particle characteristics of
the starting materials and changes that take place during the process of compaction
determine the volume reduction (60). Figure 39 and Table 21 provide the reduction of
surface area as a function of the compressional force for various powder mixtures. For
all the blends, plateau values for tablet surface area were reached when compression
force was approximately 4000-5000 lbs. Figure 40 displays the effect of formulation
composition on tablet surface area at a compression force of 4000 lbs. As the graph
indicates, increase in the concentration of Avicel® PHlOl in tablet composition
137
-(/)
.c -Q) (.) '-0 u.. c: 0 .......
I ~ VJ 00
w
100
80
60
40
20 - _.. - - - -~ :-:: : :-- -- -:-- ---=----~ .r,..... - ••
~Blend#1
-o-- Blend#2
---tr-- Blend#3
- - ~- - · Blend#4
- -~ - Blend#5
--o--- Blend#6
- -+ - ·Blend#?
- +- - Blend#8
-+-Blend#9
---Blend#10
0 -1--~~,--~---,~~---.~~-----.~~--.-~~--.-~~--.-~~.,--~----,
0 1000 2000 3000 4000 5000 6000 7000 8000 9000
Compression Force (lbs)
Figure 37. Effect of Compression Force on Ejection Force
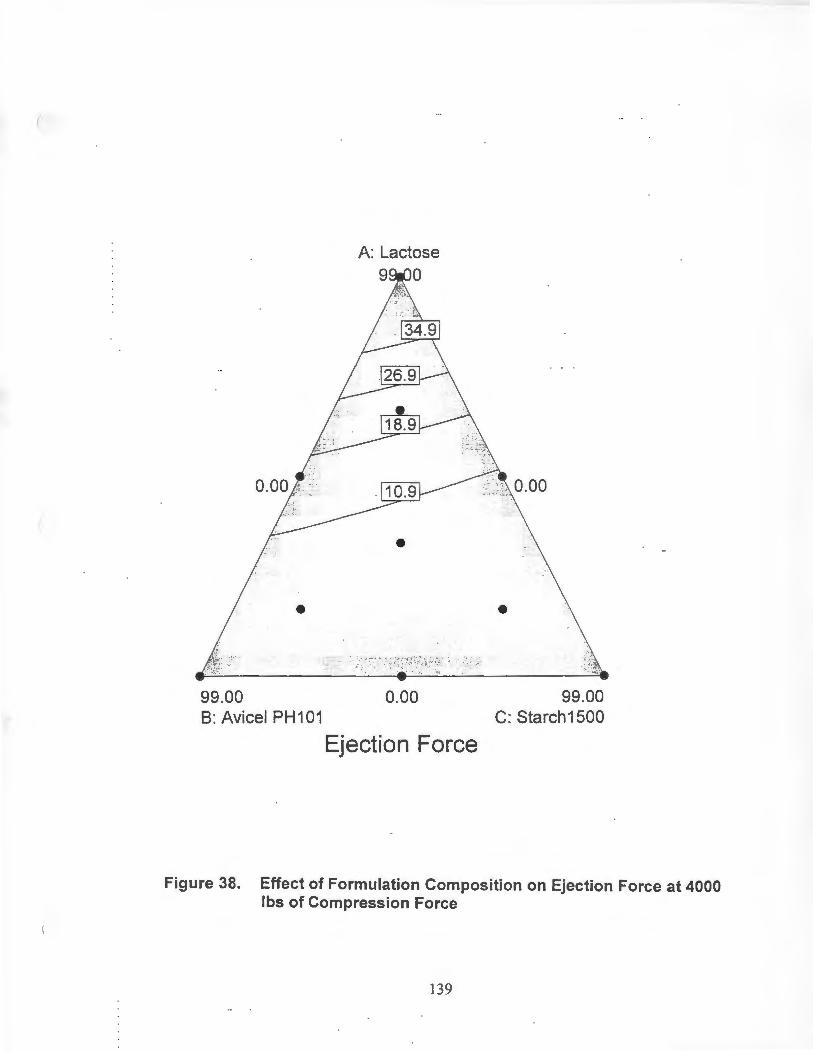
99.00 0.00 8: Avicel PH101
Ejection Force
99.00 C: Starch1500
Figure 38. Effect of Formulation Composition on Ejection Force at 4000 lbs of Compression Force
139
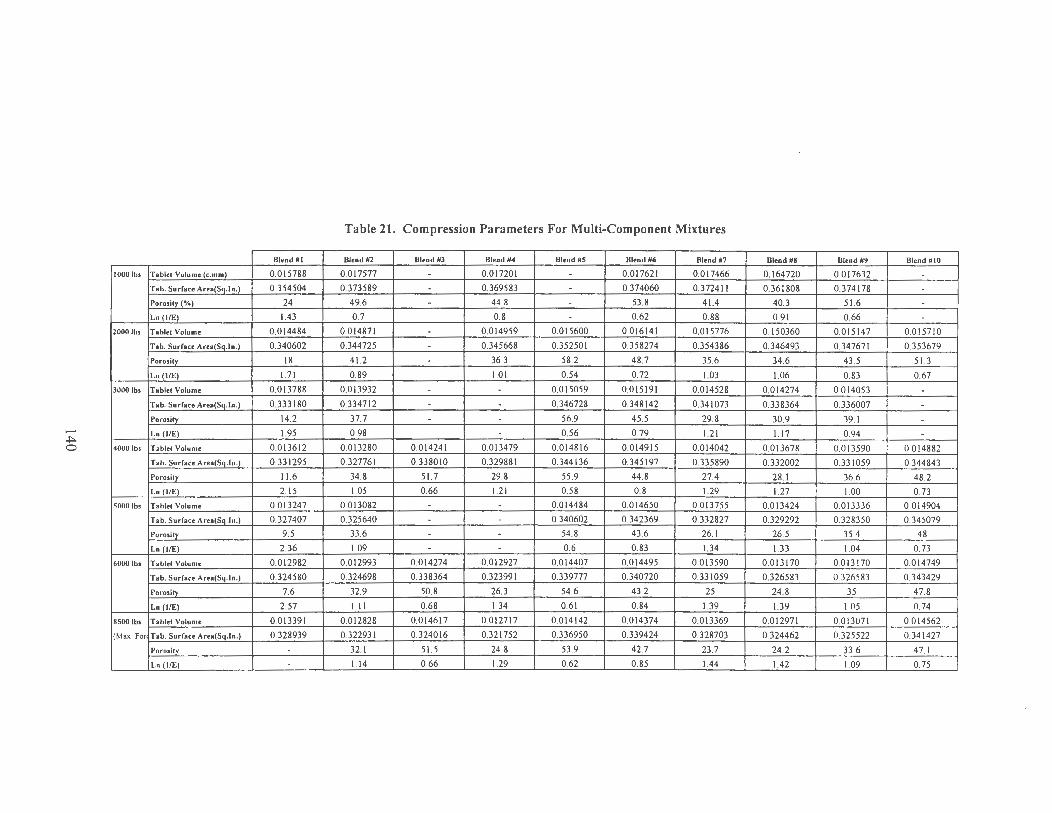
.+:>. 0
1000 lbs
2000 lbs
3000 lbs
4000 lbs
5000 lbs
6000 lbs
8500 lbs
(Max. For
Tablet Volume (c.mm)
Tab. Surface Aru(~ln .)
Porosity(%)
Ln (llE)
Tablet Volume
T•b. Surface Aru(~In.)
Poros.!!r.
Ln (!IE)
T1ble1 Volume
T•b. Surface Aru(~ln.)
Porosi!r_
Ln (llE)
Tablet Volume
Tab. Surface Aru(~ln .)
Porosity
Ln (llE)
Tabler Volume
Tab. Surface Aru(~ln .)
Poros.!!2'...
Ln (l!E)
Tablel Volume
T•b. Surface Aru(~q.ln.)
Poros.!.!r_
Ln_!l!E)
Tablet Volume
Tab. Surface Area(~ln.)
Porositr
Ln (1/E)
Blend #1
0.015788
0.354504
24
1.43
0.014484
0.340602
18
1.71
0.013788
0.333180
14.2
1.95
0.013612
0.331295
11.6
2.15
0.013247
0.327407
9.5
2.36
0.012982
0.324580
7.6
2.57
0.013391
0.328939
--
Table 21. Compression Parameters For Multi-Component Mixtures
Blend #2 Blend #J Blend #4 Blend #5 Blend #6 Blend #7
0.017577 - 0.017201 - 0.017621 0.017466
0.373589 - 0.369583 - 0.374060 0.372411
49.6 - 44.8 - 53.8 41.4
0.7 0.8 - 0.62 0.88
0.014871 - 0.014959 0.015600 0.016141 0.015776
0.344725 - 0.345668 0.352501 0.358274 0.354386
41.2 - 36.3 58.2 48.7 35.6
0.89 1.01 0.54 0.72 I.OJ
0.013932 - - 0.015059 0.015191 0.014528
0.334712 - - 0.346728 0.348142 0.341073
37.7 - - 56.9 45.5 29.8
0.98 - 0.56 0.79 1.21
0.013280 0.014241 0.013479 0.014816 0.014915 0.014042
0.327761 0.338010 0.329881 0.344136 0.345197 0.335890
34.8 51.7 29.8 55 .9 44.8 27.4
1.05 0.66 1.21 0.58 0.8 1.29
0.013082 - - 0.014484 0.014650 0.013755
0.325640 - - 0.340602 0.342369 0.332827
33.6 - - 54.8 43.6 26. I
1.09 - - 0.6 0.83 1.34
0.012993 0.014274 0.012927 0.014407 0.014495 0.013590
0.324698 0.338364 0.323991 0.339777 0.340720 0.331059
32.9 50.8 26.3 54.6 43.2 25
I.II 0.68 1.34 0.61 0.84 1.39
0.012828 0.014617 0.012717 0.014142 0.014374 0.013369
0.322931 0.324016 0.321752 0.336950 0.339424 0.328703
32.1 51.5 24.8 53 .9 42.7 23.7
1.14 0.66 1.29 0.62 0.85 1.44
--...
Blend #8 Blend #9 Blend #10
0.164720 0.017632 -0.361808 0.374178 -
40.3 51.6 -0.91 0.66 -
0.150360 0.015147 0.015710
0.346493 0.347671 0.353679
34.6 43.5 51.3
1.06 0.83 0.67
0.014274 0.014053 -0.338364 0.336007 -
30.9 39.1 -1.17 0.94 -
0.013678 0.013590 0.014882
0.332002 0.331059 0.344843
28.1 36.6 48.2
1.27 1.00 0.73
0.013424 0.013336 0.014904
0.329292 0.328350 0.345079
26.5 35.4 48
1.33 1.04 0.73
0.013170 0.013170 0.014749
0.326583 0.326583 0.343429
24.8 35 47.8
1.39 1.05 0.74
0.012971 0.013071 0.014562
0.324462 0.325522 0.341427
24.2 33 .6 47.1
1.42 1.09 0.75
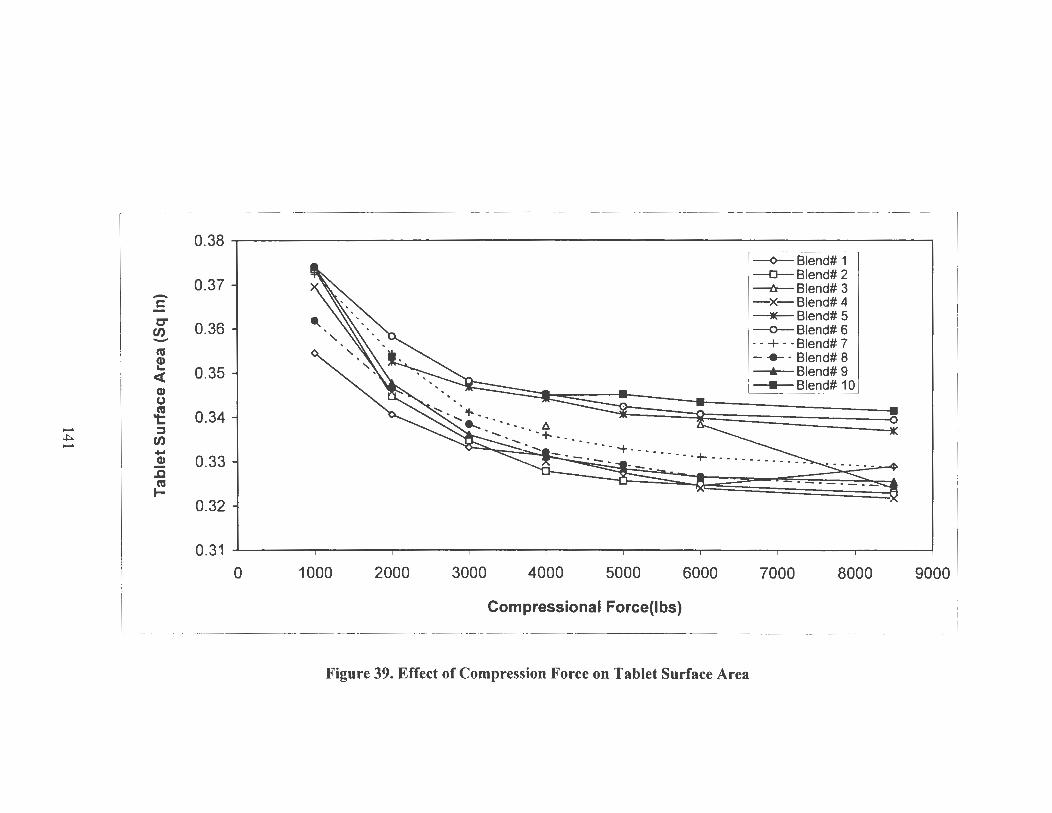
0.38
0.37 -c C"' 0.36 en -cu C1> '- 0.35 <( C1> u ~ 0.34
...... I
:l ~ en - -C1> 0.33
.c cu ~
0.32
0.31 0 1000 2000 3000 4000 5000 6000
Compressional Force(lbs)
Figure 39. Effect of Compression Force on Tablet Surface Area
~Blend#1 --er- Blend# 2 -Ir- Blend# 3 -><-Blend# 4 ------ Blend# 5 ---o- Blend# 6 - -+ - -Blend# 7 - +- - Blend#S -A-- Blend# 9 ---Blend# 10
- -----
7000 8000
--
9000
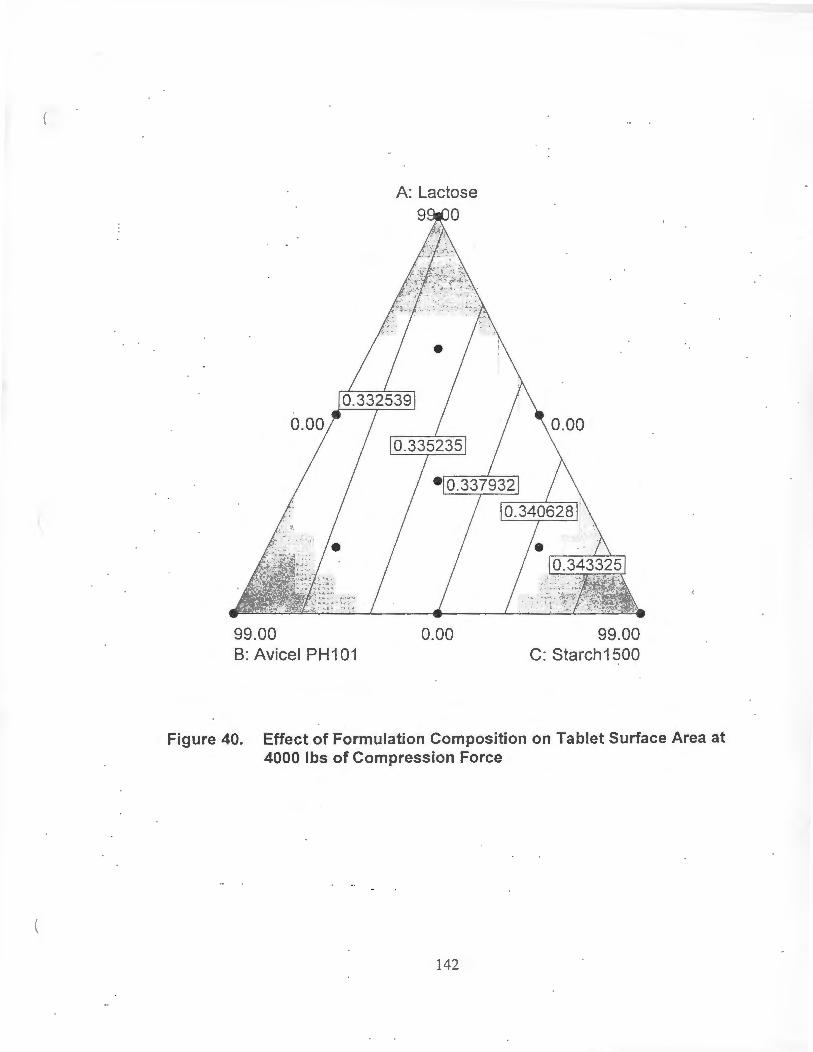
(
99.00 B: Avicel PH101
0.00 99.00 C: Starch1500
Figure 40. Effect of Formulation Composition on Tablet Surface Area at 4000 lbs of Compression Force
142
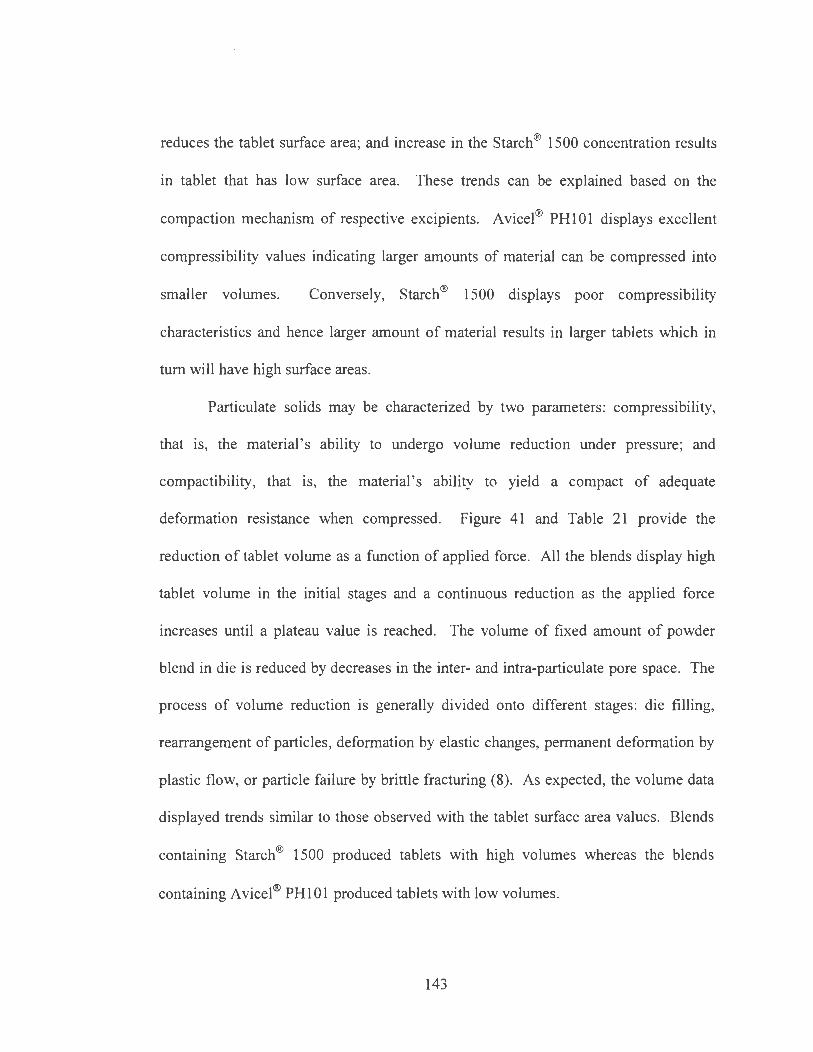
reduces the tablet surface area; and increase in the Starch® 1500 concentration results
in tablet that has low surface area. These trends can be explained based on the
compaction mechanism of respective excipients. Avicel® PH101 displays excellent
compressibility values indicating larger amounts of material can be compressed into
smaller volumes. Conversely, Starch® 1500 displays poor compressibility
characteristics and hence larger amount of material results in larger tablets which in
turn will have high surface areas.
Particulate solids may be characterized by two parameters: compressibility,
that is, the material ' s ability to undergo volume reduction under pressure; and
compactibility, that is, the material ' s ability to yield a compact of adequate
deformation resistance when compressed. Figure 41 and Table 21 provide the
reduction of tablet volume as a function of applied force. All the blends display high
tablet volume in the initial stages and a continuous reduction as the applied force
increases until a plateau value is reached. The volume of fixed amount of powder
blend in die is reduced by decreases in the inter- and intra-particulate pore space. The
process of volume reduction is generally divided onto different stages: die filling,
rearrangement of particles, deformation by elastic changes, permanent deformation by
plastic flow, or particle failure by brittle fracturing (8). As expected, the volume data
displayed trends similar to those observed with the tablet surface area values. Blends
containing Starch® 1500 produced tablets with high volumes whereas the blends
containing A vice!® PHI 01 produced tablets with low volumes.
143
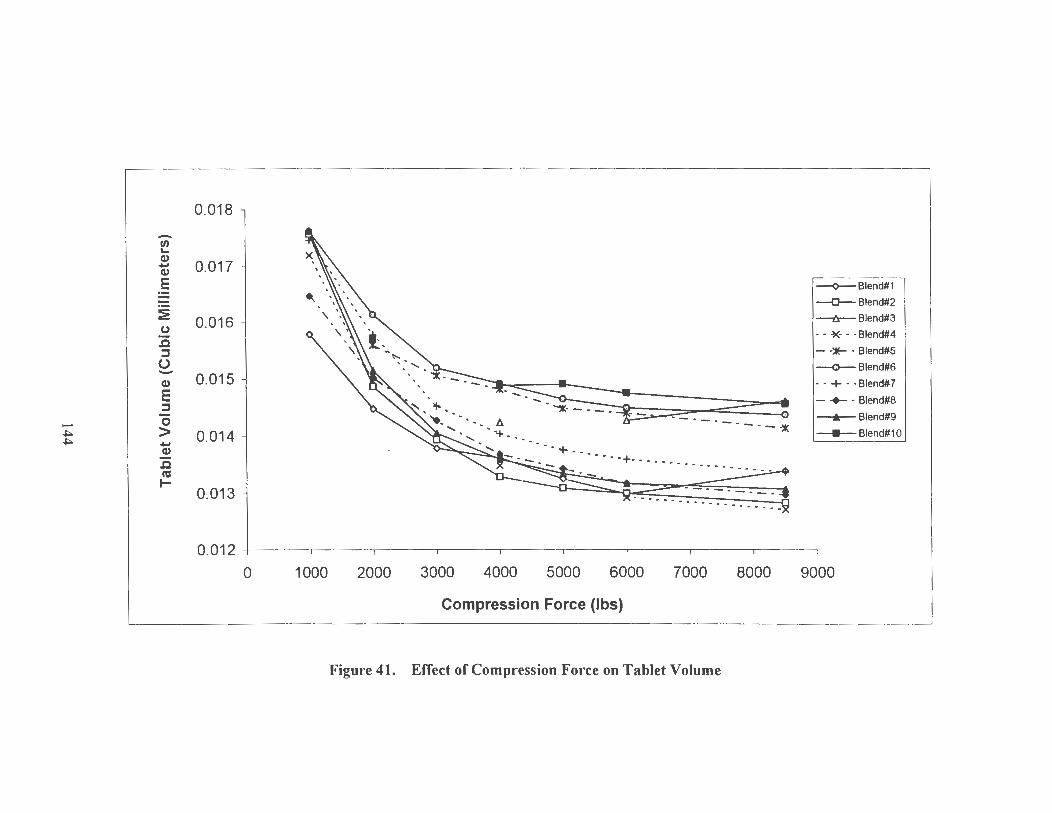
~
0.018
-II) '-(1)
0.017 .... (1)
E I ' .\\ . '\. I--<>- Blend#1
---0-- Blend#2 ~ 0.016 ~Blend#3 u • • ~- • · Blend#4 .c
- ·:Ir · Blend#S :::s () --0-- Blend#6 - 0.015 Q,) · · + · ·Blend#7 E - -+-- • Blend#S :::s 0 ·--- -------:.:: --.-- Blend#9 .......
I ~ > 0.014 ------ Blend#1 O ~ ....
Q,)
.c I ...... '!!'~·-- - - -.. .. - "' - .. cu I-
0.013 I 'JI[ ..........
0.012 -I-----~-~--~--~--~--~--~-~--~
0 1000 2000 3000 4000 5000 6000 7000 8000 9000
Compression Force (lbs)
Figure 41. Effect of Compression Force on Tablet Volume
( This is attributed to the excellent ability of Avicel® PHI 01 to undergo high volume
reduction with applied force as compared to Starch® 1500, which behaves differently
during compaction.
Tablet porosity is the entrapped air in the compacts and provides critical
information how a mixture behaves under pressure. Figure 42 and Table 21 provides
the porosity values for tablets prepared from the various blends as a function of
compression force. Among the ten blends, Blend#5 which contains 49.5% of lactose
anhydrous and 49.5% of Starch 1500 displayed the highest values for porosity. For
Blend#5, increase in compression force from 1000 lbs to-8500 lbs did not affect the
high porosity values significantly. Higher porosity values indicate that blends cannot
deform well to make compacts. The high porosity values are associated with the
amount of Starch 1500 present in the formulation. The blends containing A vice!®
PHlOl has high porosity values initially, but as the applied force increases, the
porosity values drop significantly. 99% lactose anhydrous blend provided tablets with
lowest amount of porosity. Figure 43 shows the effect of formulation composition on
tablet porosity of blends compressed at 4000 lbs of applied force. As graph indicates
that as the concentration of Starch® 1500 increases, the porosity values seem to
mcrease.
Numerous mathematical models describing the change of relative density in a
powder column as a function of the applied pressure have been derived and adopted
from other fields of industry for pharmaceutical compression processes (9-14, 17).
145
-';ft -~ VI 0 ~
0 Q. -C1>
:c ...... ~ I ~ 0\
60
40
20
:IE----
~ --~-----~--- -.-JC
~ .------~------------- -~
. ~---~-:-l .. ....... -··-~-··=:-:::-.x . -.. ·.-:-.-. ., ....... --- ~- ...
~-----:...:.::..:::..:;, ~ ... .......... :.;.:¥
O +-~~-,----~~-,-~~--.~~~.-~~-.-~~-.-~~------,-~~~,--~__,
0 1000 2000 3000 4000 5000 6000 7000 8000 9000
Compression Force (lbs)
Figure 42. Effect of Compression Force on Tablet Porosity
~Blend# 1
-o-- Blend# 2
--Ir- Blend# 3
··~-··Blend# 4
- ·:Ir · Blend# 5
--0-- Blend# 6
··+··Blend# 7
- +- · Blend# 8
-...- Blend# 9
----- Blend# 10
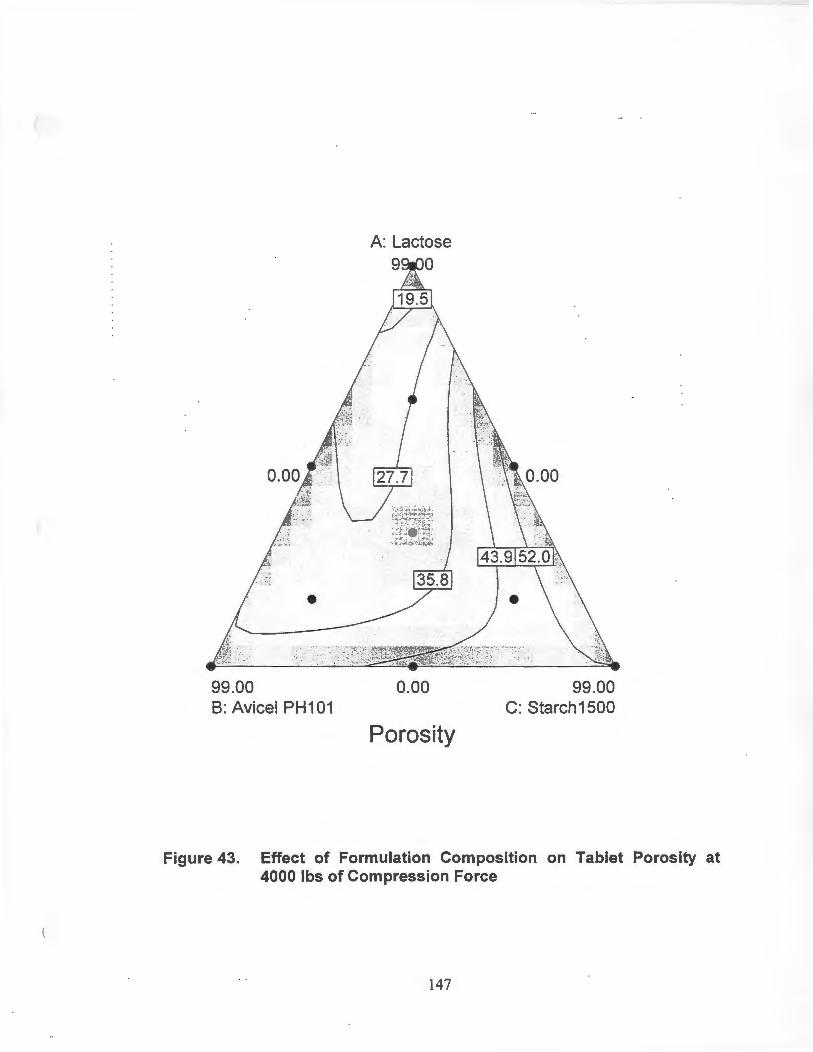
(
99.00 B: Avicel PH101
0.00
Porosity
99.00 C: Starch1500
Figure 43. Effect of Formulation Composition on Tablet Porosity at 4000 lbs of Compression Force
147
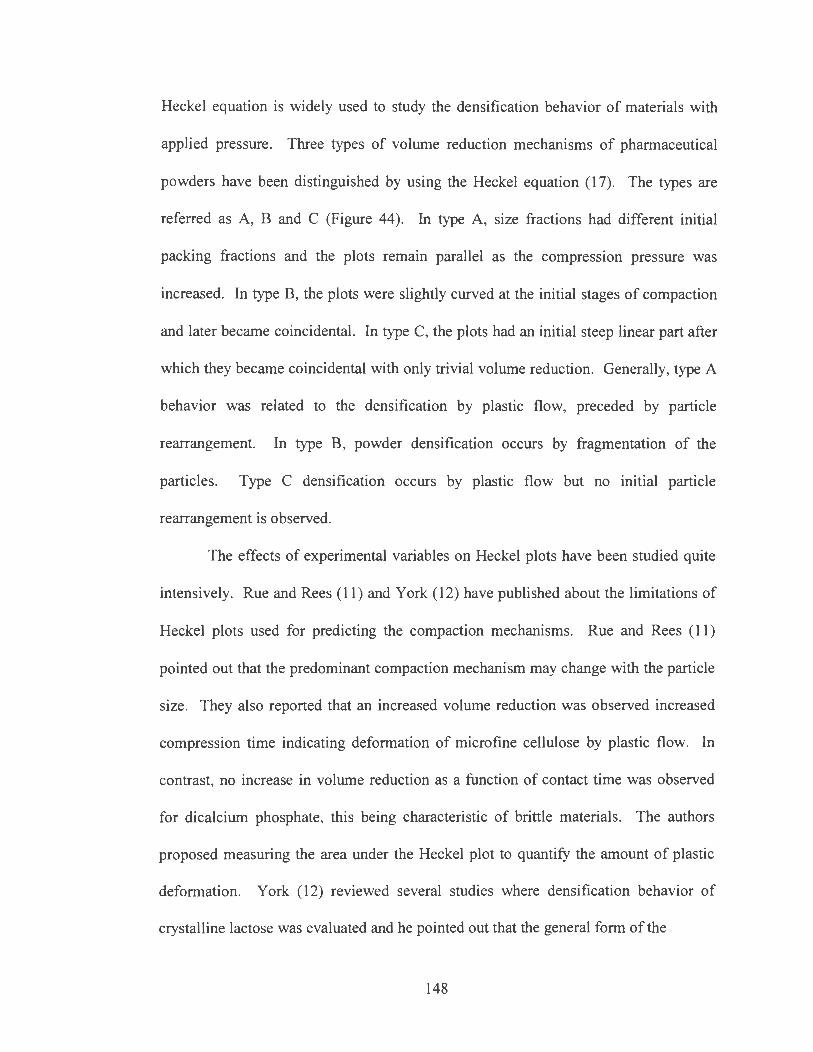
( Heckel equation is widely used to study the densification behavior of materials with
applied pressure. Three types of volume reduction mechanisms of pharmaceutical
powders have been distinguished by using the Heckel equation (17). The types are
referred as A, B and C (Figure 44). In type A, size fractions had different initial
packing fractions and the plots remain parallel as the compression pressure was
increased. In type B, the plots were slightly curved at the initial stages of compaction
and later became coincidental. In type C, the plots had an initial steep linear part after
which they became coincidental with only trivial volume reduction. Generally, type A
behavior was related to the densification by plastic flow, preceded by particle
rearrangement. In type B, powder densification occurs by fragmentation of the
particles. Type C densification occurs by plastic flow but no initial particle
rearrangement is observed.
The effects of experimental variables on Heckel plots have been studied quite
intensively. Rue and Rees (11) and York (12) have published about the limitations of
Heckel plots used for predicting the compaction mechanisms. Rue and Rees (11)
pointed out that the predominant compaction mechanism may change with the particle
size. They also reported that an increased volume reduction was observed increased
compression time indicating deformation of microfine cellulose by plastic flow. In
contrast, no increase in volume reduction as a function of contact time was observed
for dicalcium phosphate, this being characteristic of brittle materials. The authors
proposed measuring the area under the Heckel plot to quantify the amount of plastic
deformation. York (12) reviewed several studies where densification behavior of
crystalline lactose was evaluated and he pointed out that the general form of the
148
(
,.--, ,........ D
I ..-........... ........... ..-...__. c
(A) (B) (C) ,......., ,......., ,,......_ ........ D Cl
..- ...... ........... ...........
~ ........... ...... .__. .__. c c
Compression pressure Compression pressure Compression pressure
Figure 44. Different Types of Compression Behavior Distinguished by the Heckel Equation
149
( Heckel plots was similar in all cases though the numerical values describing the
compression process were dependent on experimental variables. York (12) has listed
several variables such as the state and type of lubrication, rate of compaction, mode of
die filling, contact time, dimensions of tools and techniques used to measure compact
dimensions, all which are necessary to take into account in tableting studies.
Duberg and Nystrom (13) have used the initial curvature of Heckel plots as an
indication of particle fragmentation. Also the correlation coefficient describing the
linearity of the Heckel plots have been used for the same purpose. Thus, nonlinear
plots may indicate fragmentation, and linear plots the deformation by plastic flow.
Also poor packing of powder due to cohesiveness, small particle size and irregular
particle shape may lead to initial curvature in a Heckel plot. In most cases, however,
the rearrangement of the relatively regular particles occurs already at low pressures.
Thus measurements of the nonlinearity could be a useful tool for categorizing
pharmaceutical materials. This is especially true if fragmentation of microcrystalline
particles or aggregates of primary particles are concerned, since they are intensively
fragmented to smaller particles already at low compression pressures and this results in
considerable volume reduction. At higher pressures the volume reduction becomes
more difficult, and is expressed by nonlinear Heckel plots. On the other hand, the
densification due to plastic flow and elastic deformation of particles, and the volume
reduction of a powder column proceed steadily, since according to Heckel function the
porosity reduction occurs exponentially.
Most of the reports on porosity-pressure functions are derived from single
component powders. There are hardly any reports concerning the compression
150
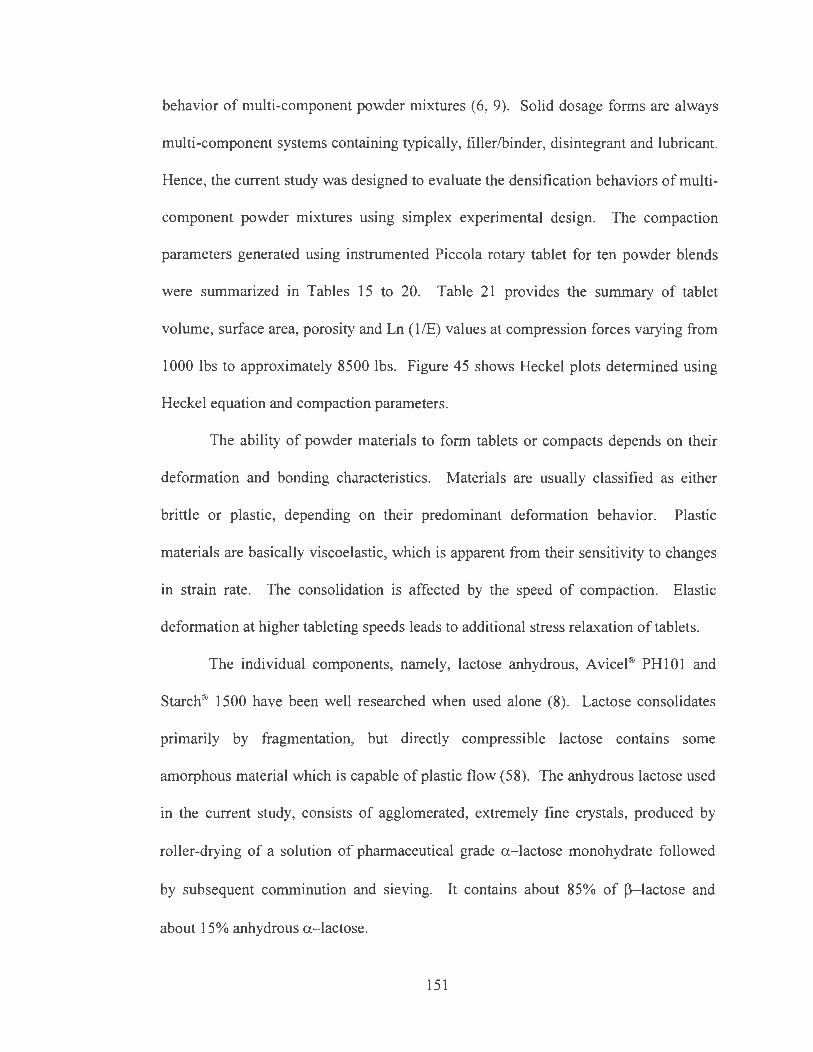
behavior of multi-component powder mixtures (6, 9). Solid dosage forms are always
multi-component systems containing typically, filler/binder, disintegrant and lubricant.
Hence, the current study was designed to evaluate the densification behaviors of multi
component powder mixtures using simplex experimental design. The compaction
parameters generated using instrumented Piccola rotary tablet for ten powder blends
were summarized in Tables 15 to 20. Table 21 provides the summary of tablet
volume, surface area, porosity and Ln (l/E) values at compression forces varying from
1000 lbs to approximately 8500 lbs. Figure 45 shows Heckel plots determined using
Heckel equation and compaction parameters.
The ability of powder materials to form tablets or compacts depends on their
deformation and bonding characteristics. Materials are usually classified as either
brittle or plastic, depending on their . predominant deformation behavior. Plastic
materials are basically viscoelastic, which is apparent from their sensitivity to changes
in strain rate. The consolidation is affected by the speed of compaction. Elastic
deformation at higher tableting speeds leads to additional stress relaxation of tablets.
The individual components, namely, lactose anhydrous, Avicel® PH101 and
Starch® 1500 have been well researched when used alone (8). Lactose consolidates
primarily by fragmentation, but directly compressible lactose contains some
amorphous material which is capable of plastic flow (58). The anhydrous lactose used
in the current study, consists of agglomerated, extremely fine crystals, produced by
roller-drying of a solution of pharmaceutical grade a-lactose monohydrate followed
by subsequent comminution and sieving. It contains about 85% of P-lactose and
about 15% anhydrous a-lactose.
151
........ VI N
3.00
--<>--- Blend#1
-0-81end#2 2.50
--t:r- Blend#3
- - ~- - · Blend#4
2.00 - -:.- - Blend#5
-o-Blend#6
w - - + - ·Blend#? -=.. 1.50 c:
...J
1.00
-+-Blend#8
~~.....,..,~~~~~=-=-.-:.-:-.. :-:.-:.":". ~-.:-:.-:.~--: : : : : ~ __.,._ Blend#9 - · · · - - - - . - - - -- -
0 ----Blend#10
-a.. 11 ..
--------0 0 0
VI _____ .Jill__ - - - - - - •
0.50
0.00 +--------.------,.---------.------,.---------.--------,
0 100 200 300
Compaction Pressure (MPa)
400
Figure 45. Heckel Plots for Statistically Designed Mixtures
500 600
..,..,,,,,
( During compaction, microcrystalline cellulose is thought to undergo stress
relief deformation by several mechanisms. David and Augusburger (1) reported that
microcrystalline cellulose consolidates by two mechanisms: fragmentation and plastic
deformation. At low compression forces, stress relief is dominated by a slight elastic
phase. This has been explained by its hollow microfibrillar structure. At higher force,
there is either further deformation or permanent deformation by nonspecific plastic
flow. Following stress relaxation studies, David and Augusburger (1) suggested that
plastic flow is an important factor affecting the compressibility of microcrystalline
cellulose. Plastic deformation is facilitated by the presence of slip planes, dislocations,
and the small size of the individual microcrystals. The plasticity of microcrystalline
cellulose increases with increasing compressing force, which is accompanied by a
decrease in viscoelasticity. When microcrystalline cellulose tablets are prepared by
wet granulation, there is less plastic deformation in comparison with tablets prepared
by direct compression. Force versus displacement plots on diametric compression to
fracture indicates that A vicel shows stress relief by time-dependent yielding. The
yield pressure increases with punch velocity, because of a reduction in the amount of
plastic deformation caused by the time-dependent nature of plastic flow. This
increase in mean yield pressure at increasing compression speeds is reflected by the
high strain rate sensitivity value for microcrystalline cellulose. Armstrong and Palfrey
(35, 36) show that the reduction in crushing strength at increasing compression speed
is caused by an increased porosity of the compacted powder bed.
153
Strong binding properties of microcrystalline cellulose are caused by hydrogen
bonds between hydrogen groups on the plastically deformed, and adjacent cellulose
particles. The hydrogen bonds on the extremely large surface area are brought into
close contact during plastic deformation. This is the reason for the extremely good
compactability of microcrystalline cellulose, better than that of any other directly
compressible filler-binder. The microcrystalline cellulose (Avicel® PH101) has a very
low brittle fracture index and a very high bonding index, two properties that make it an
excellent tableting excipient. The low brittle fracture index can successfully mask the
brittle properties of drugs, while the low brittle fracture index will overcome the poor
bonding of the active compound. The compactability of microcrystalline cellulose
depends on its moisture content. During plastic deformation, the moisture within the
pores should act as an internal lubricant and facilitate slippage and flow within the
individual microcrytsals. The presence of an optimum amount of water will prevent
elastic recovery by forming bonds through hydrogen bond bridges (8, 53, 54). The
compactibility of microcrystalline cellulose decreases with a reduction of its moisture
content. The strongest compacts are produced when the microcrystalline cellulose
contains 7.3% moisture. The capping tendency of microcrystalline cellulose is
reduced by increasing the moisture content. This is attributed to the strengthening of
interparticle binding forces and the reduction of elastic recovery by lowering the yield
point (8).
Density-stress and stress-relaxation studies show that Starch® 1500 exhibits
extensive, yet slow, plastic deformation during compression. Changes in contact time
during compaction, therefore, have a marked effect on tablet properties (8). Starch®
154
(. 1500 has a slower initial relaxation than anhydrous lactose, but after prolonged time
periods the total relaxation of Starch® 1500 is much greater than that of anhydrous
lactose. As compared with other plastically deforming materials, the strength of
Starch 1500 tablets is low. This effect may be because plastic deformation is too slow
to produce adequate interparticle binding during rapid compression. In addition,
during compaction at high strain rate, a large proportion of the total deformation will
be elastic (8). When elastic and plastic deformation and interparticles binding occur
during compression and when elastic recovery occurs on decompression and ejection,
interparticle bonds are not formed rapidly enough to prevent brittle fracture reducing
tablet strength and possibly causing capping.
Because of its plastic behavior under pressure, Starch® 1500 is extremely
sensitive to mixing with lubricants (37-42). This behavior is confirmed with the
results obtained in this study. Among, the ten mixtures, 99% Starch® 1500 blend
provided low tablet hardness and high tablet friability values. Since Starch® 1500 is
an important component in tablet formulation because of its disintegrant properties
and better flow characteristics, the limitations seen above can be offset by choosing
appropriate amount of other components (Avicel® PHOIOl and lactose anhydrous)
based on trends observed in this study and desired tablet characteristics.
Based on shape of Heckel plots (Figure 45) and comparing with theoretical
curves (Figure 44), we can understand how each blend is behaving during compression
process. Since each blend is a multi-component mixture, it is difficult to precisely
estimate what type of mechanism each blend is following for deformation during
compression. However, since all three major components, Lactose Anhydrous,
155
( Avicel® PHlOl , Starch® 1500 behave differently as described above, the blends seem
to follow the same mechanism as its major component. Similar trends can be seen for
all other compression and tablet parameters.
In summary, compaction parameters were generated for statistically designed
powder mixtures containing Lactose Anhydrous, A vicel® PH 101, Starch® 1500 and
Magnesium Stearate. The powder blends were evaluated and then compressed into
tablets at an applied force of 1000 lbs, 2000 lbs, 3000 lbs, 4000 lbs, 5000 lbs, 6000 lbs
and maximum achievable force on tableting machine (~8500 lbs). The tablets were
characterized. The compression force-time curves and ejection force-time curves were
studied and all critical compression parameters were summarized. Critical parameters
such as tablet volume, surface area, true density, porosity and Ln(l/E) values were
computed and heckle plots wer~ generated. In order to determine the effect of
formulation composition on a specific property, response surface contour plots were
generated to study the trends.
156
CONCLUSIONS
In the current investigation, experimentally designed blends compnsmg
Lactose Anhydrous, Avicel® PH101 , Starch® 1500 and Magnesium Stearate were
evaluated using an instrumented tablet press. Simplex design was utilized to mimic
the actual formulation requirements and ten different blends were prepared using a
high shear mixer. The powder mixtures were compressed at 1000 lbs, 2000 lbs, 3000
lbs, 4000 lbs, 5000 lbs, 6000 lbs and maximum achievable force on tableting machine
(- 8500 lbs). The compression force-time curves and ejection force-time curves were
evaluated and critical compression parameters such as porosity and In (1/E) values and
Heckel plots were determined to understand the compression behavior of the
experimental blends. The compression parameters generated in this study, provide
valuable insights into how multi-component mixtures behave under pressure.
The key findings can be summarized as : 1) Maximum weight variation was
observed for blends containing 99% Starch® 1500 and minimum variation was
observed for blends containing Lactose Anhydrous and AviceI® PH101at49.5% level.
2) 99% Avicel® PHIOl provided the highest tablet hardness values (7.3-23.7 Kp) as
compared to all other mixtures. 99% Starch® 1500 provided the lowest tablet hardness
values (0-0.3 Kp). 99% Lactose Anhydrous provided an intermediate hardness profile
(1.9-14.2 Kp). As the level of Avicel® PH101 in the blend increases, so does the
hardness profile for tablets.
3) Starch® 1500 imparted more thickness to the tablets followed by Avicel® PHIOl
and Lactose Anhydrous.
157
4) Maximum disintegration times were observed for tablets prepared from blend
containing Avicel® PH101 and Lactose Anhydrous at 49.5% level.
5) Maximum dwell time of 107 msec was observed for 99% Lactose Anhydrous at
maximum achievable force (-8500 lbs) and a minimum dwell time of 51 msec was
observed for the same blend at 1000 lbs of applied force .
6) Maximum total area of compression pulse was observed for 99% A vicel® PH 101.
7) The highest amount of ejection force (98.8 lbs) was required for tablets prepared
from 99% Anhydrous Lactose blend.
8) Tablet surface area and volume are dependent upon the amount of Starch® 1500
present in the blend.
9) Tablets from the blend containing 49.5% Anhydrous Lactose and 49.5% Starch®
1500 displayed maximum amount percentage of porosity. It indicates that the blend
can not deform well to make compacts. Presence of Starch® 1500 also resulted in
higher porosity values. Tablets containing A vicel® PH 101 displayed high porosity
values initially (at 1000 lbs) but the porosity was reduced significantly as the applied
force was increased.
10) Heckel plots were generated to elucidate the deformation mechanism of various
blends.
The current findings will help formulation scientist to design and develop a
robust tablet dosage form that meets the predetermined quality attributes and will be
free of typical tableting problems such as hardness variation and weight variations.
158
( Finally, at present only very few investigations comprising multi-component
mixtures were available in literature for compaction process and more studies will
definitely shed more light on the complex process of compaction especially with the
advent of so many new polymeric materials.
159
( REFERENCES
1. David, S. T. and Augusburger, L. L. Plastic flow during compression of directly
compressible fillers and its effects on tablet strength. Journal of Pharmaceutical
Sciences, 66:155-159 (1977).
2. Schmidt, P. C. Tableting characteristics of sorbitol. Pharmaceutical Technology, 7
(11 ):65-72 (1983).
3. Bolhuis, G. K.; Zuurman, K. Tableting properties of experimental and
commercially available lactose granulations for direct compression. Drug
Development and Industrial Pharmacy, 21 (18): 2057-2071 (1995).
4. Zuurman, K., Riepma, K. A., Bolhuis, G.K., Vromans, H. and Lerk, C.F. The
relationship between bulk density and compactibility of lactose granulations.
International Journal of Pharmaceutics, 102: 1-9 (1994).
5. Schmidt, P. C. and Vogel, P. J. Force-time curves of a modern rotary tablet
machine: II. Influence of compression force and tableting speed on the deformation
mechanisms of pharmaceutical substances. Drug Development and Industrial
Pharmacy, 19 (15): 1917-1930 (1993).
6. Celik, M. The past, present and future of tableting technology. Drug Development
and Industrial Pharmacy, 22 (1): 1-10 (1996).
7. Wong, L. W. and Pilpel, N. The effect of shape of fine particles on the formulation
of ordered mixtures. Journal of Pharmacy and Pharmacology, 40: 567-568 (1988).
8. Bolhuis, G. K. and Chowan, Z. T. Materials for direct compaction, In
Pharmaceutical Powder Compaction Technology, Alderborn,G. and Nystrom C.
(Eds.), Marcel Dekker, Inc. , New York, 419-500 (1996).
160
( 9. Paronen, P. and Ilk.ka, J. Pressure-porosity functions. In Pharmaceutical Powder
Compaction Technology, Alderbom,G. and Nystrom C. (Eds.), Marcel Dekker,
Inc. , New York, 55-75 (1996).
10. Kawakita, K. and Ludde, K. H. Some considerations on powder compression
equations. Powder Technology, 4 (2): 61-68 (1971).
11. Rue, J. and Rees, J. E. Limitations of the Heckel relation for predicting powder
compaction mechanisms. Journal of Pharmacy and Pharmacology, 30: 642-643
(1978).
12. York, P. A consideration of experimental variables in the analysis of powder
compaction behaviour. Journal of Pharmacy and Pharmacology, 31(4): 244-246
(1979).
13. Duberg, M. and Nystrom, C. Studies on direct compression of tablets. VI.
Evaluation of methods for the estimation of particle fragmentation during
compaction. Acta Pharmaceutica Suec, 19 (6): 421-436 (1982).
14. Schmidt, P. C. and Vogel, P. J. Force-time curves of a modem rotary tablet
machine: I. Evaluation techniques and characterization of deformation behavior of
pharmaceutical substances. Drug Development and Industrial Pharmacy, 20 (5):
921-934 (1994).
15. Celik, M. and Okutgen, E. Feasibility study for the development of a prospective
compaction functionality test and the establishment of a compaction data bank.
Drug Development and Industrial Pharmacy, 19 (17-18): 2309-2334 (1993).
16. Shangraw, R. F. and Demarest, D. A. Survey of current industrial practices in the
formulation and manufacture of tablets and capsules. Pharmaceutical Technology,
17 (1): 32-44 (1993).
161
( 17. Heckel, R. W. Density-pressure relationships m powder compaction. Trans
Metallurgy Society, AIME, 221 :671-675 (1961).
18. Scheffe, H. The simplex-centroid design for experiments with mixtures. Journal of
Royal Statistical Society, B25: 235-263 (1963).
19. Scheffe, H. Experiments with mixtures. Journal of Royal Statistical Society, B20:
344-360 (1958).
20. Gorman, J. W. and Hinman, J. E. Simplex lattice designs for multicomponent
systems. Technometrics, 4: 463-487 (1962).
21. Statgraphics®Plus for Windows, Version 2.0, Manugistics, Inc., Rockville,
Maryland, USA.
22. Design-Expert®, Version 6.0, Stat-Ease, Inc., MN, USA.
23 . Carr, R. L. Classifying flow properties of solids. Chemical Engineering, 72: 69
(1965).
24. Carr, R. L. Evaluating flow properties of solids. Chemical Engineering, 72: 163-
168 (1965).
25. Johnson, M. C. R. The effect of particle size upon mixture homogeneity.
Pharmaceutica Acta Helvetiae , 50 (3): 60-63 (1975).
26. Williams, J.C. and Khan, M. I. The mixing and segregation of particulate solids of
different particle size. The Chemical Engineer, January, 19-25 (1973).
27. Chowhan, Z. T. Segregation of particulate solids-Part I. Pharmaceutical
Technology, 19: 56-70 (1995).
162
( 28. Chowhan, Z. T. Segregation of particulate solids-Part II Pharmaceutical
Technology, 19: 80-94 (1995).
29. Andres, C., Ndiaye, A., Thomas, C., Tromelin, A., Chaillot, B. and Pourcelot, Y.
Influence of the parameters molecular structure and granularity on the
compactibility of a powder. Drug Development and Industrial Pharmacy, 21(16):
1875-1885 (1995).
30. Pilpel, S. and Esezobo, S. Effects of applied load and particle size on the
plastoelasticity and tablet strength of some directly compressible powders. Journal
of Pharmacy and Pharmacology, 39: 303 - 304 (1987).
31. Katikaneni, P.R., Upadrashta, S. M., Rowlings, C. E., Neau, S. H. and Hileman G.
A. Consolidation of ethylcellulose: effect of particle size, press speed, and
lubricants. International Journal of Pharmaceutics, 117: 13-21 (1995).
32. Amidon, G. E and Houghton, M. E. The effect of moisture on the mechanical and
powder flow properties of microcrystalline cellulose. Pharmaceutical Research,
12: 923-929 (1995).
33. Shotton, E. J. and Harb, N. The effect of humidity and temperature on the cohesion
of powders. Journal of Pharmacy and Pharmacology, 18: 175-178 (1966).
34. Nokhodchi, A., Rubinstein, M. H., Larhrib, H. and Guyot, J. C. The effect of
moisture content on the energies involved in the compaction of ibuprofen
International Journal of Pharmaceutics, 120: 13-20 (1995).
35. Armstrong, N. A. Considerations of compression speed in tablet manufacture.
Pharmaceutical Technology, 14 (9): 106-116 (1990).
163
( 36. Armstrong, N. A. and Palfrey, L. P. The effect of machine speed on the
consolidation of four directly compressible tablet diluents. Journal of Pharmacy
and Pharmacology, 41 : 149-151 (1989).
37. Delacourte, A., Guyot, J. C., Colombo, P. and Catellani, P. L. Effectiveness of
lubricants and lubrication mechanism in tablet technology. Drug Development and
Industrial Pharmacy, 21 (19): 2187-2199 (1995).
38. Johansson, M. E. Investigations of mixing time dependence of the lubricating
properties of granular and powdered magnesium stearate. Acta Pharmaceutica
Suec 22: 343-350 (1985).
39. Ragnarsson, G. , Holzer, A. W., and Sjogren, J. The influence of mixing time and
colloidal silica on the lubricating properties of magnesium stearate. International
Journal of Pharmaceutics, 3: 127-131 (1979).
40. Khan, K. A., Musikabhumma, P. and Rubinstein, M. H. The effect of mixing time
of magnesium stearate on the tabletting properties of dried microcrystalline
cellulose. Pharmaceutica Acta Helvetiae, 58: 109-111 (1983).
41 . Rizk, S., Guyot, J.C. , Duru, C. and Gaudy, D. Influence of lubricant properties on
compression behavior and drug dissolution rate of scleroglucan hydrophilic matrix.
International Journal of Pharmaceutics, 126: 57-63(1995).
42. Velasco, V. , Munoz-Ruiz, A. , Mondero, C. and Jimenez-Castellanos, R. Force
displacement parameters of maltodextrins after the addition of lubricants
International Journal of Pharmaceutics, 152: 111-120 (1997).
43. Garcia, T. , Elsheimer, B. , Tarczynski, F. Examination of components of variance
for a production scale, low dose powder blend and resulting tablets. Drug
Development and Industrial Pharmacy, 21 (18): 2035-2045 (1995).
164
( 44. Jetzer, W. , Leuenberger, and Sucker, H. Compressibility and compactability of
powder mixtures. Pharmaceutical Technology 7(11): 33-48 (1983).
45 . York, P. and Pilpel, N. The tensile strength and compression behavior of lactose,
four fatty acids, and their mixtures in relation to tableting. Journal of Pharmacy
and Pharmacology, 25 (Supplement):lP-1 lP (1973).
46. Karehill , P.G., Glazer, M. and Nystrom C. Studies on direct compress10n of
tablets. XXXIII. The importance of surface roughness for the compactibility of
some directly compressible materials with different bonding and volume reduction
properties. International Journal of Pharmaceutics, 64: 35-43 (1990).
47. Hersey, J. A. , Rees, J. E. and Cole, E. T. Density changes in lactose tablets.
Journal of Pharmaceutical Sciences, 62: 2060 (1973).
48 . Asano, T. , Tsubuku, S. , Sugawara, S. , Miyajima, M., Sato, H. , Yuasa, H. and
Kanaya, Y. Changes in volume and compression energy upon compression of
calcium silicate tablets. Drug Development and Industrial Pharmacy, 23 (7): 679-
685 (1997).
49. Juppo, A. M. , Kervinen, L., Yliruusi, J. and Eristofferson, E. Compression of
lactose, glucose, and mannitol granules. Journal of Pharmacy and Pharmacology,
47: 543- 549 (1995).
50. Bodmeier, R. Tableting of coated pellets. European Journal of Pharmaceutics and
Biopharmaceutics, 43: 1-8 (1997).
51. Torrado, J. J. and Augsburger, L. L. Effect of different excipients on the tableting
of coated particles. International Journal of Pharmaceutics, 106: 149-155 ( 1994 ).
165
52. Ferrari, F. , Bertoni, M. , Bonferoni, M. C. , Rossi, S. , Caramella, C. and Nystrom,
C. Investigation on bonding and disintegration properties of pharmaceutical
materials. International Journal of Pharmaceutics 136: 71 - 79 (1996).
53 . Luangtana-Anan, M. and Fell, J. T. Bonding mechanisms m tableting.
International Journal of Pharmaceutics, 60: 197-202 (1990).
54. Hiestand, E. N. Powders: Particle-particle interactions. Journal of Pharmaceutical
Sciences, 55 (12):1325-1344 (1966).
55. Pilpel, N.; Igwilo, C. I. and Malamataris, S. Effects of molecular coatings on the
compression and tableting of some pharmaceutical powders. International Journal
of Pharmaceutics, 68: 157-166 (1991).
56. Konkel, P. and Mielck, J.B. A compaction study of directly compressible vitamin
preparations for the development of a chewable tablet: Part I" Pharmaceutical
Technology. 16 (3): 138-146 (1992).
57. Doldan, C., Souto, C., Concheiro, A., Martinez-Pacheco, R. and Gomez-Amoza, J.
L. Dicalcium phosphate dihydrate and anhydrous dicalcium phosphate for direct
compression: A comparative study. International Journal of Pharmaceutics, 124:
69-74(1995).
58 . Hsu, S. H.; Tsai, T. R.; Chuo, W. H. and Cham, T. M. Evaluation of Era-tab as a
direct compression excipient. Drug Development and Industrial Pharmacy, 23 (7):
711-716 (1997).
59. Udeala, 0. K., Chukwu, A."Compaction behavior of Musol: A new direct
compression vehicle. Drug Development and Industrial Pharmacy, 15 (4): 533-
548 (1989).
166
60. Zuurman, K. , Riepma, K.A.; Bolhuis, G.K. , Vromans, H. and Lerk, C. F. The
relationship between bulk density and compactibilty of lactose granulations.
International Journal of Pharmaceutics, 102: 1-9 (1994).
61. Wikberg, M. and Alderbom, G. Compression characteristics of granulated
materials. III. The relationship between air permeability and mechanical strength of
tablets of some lactose granulations. International Journal of Pharmaceutics, 63:
23-27 (1990).
167
(
MANUSCRIPT III
EFFECT OF FORMULATION COMPONENTS AND MANUFACTURING
PROCESS ON THE ELECTROSTATIC BEHAVIOR OF
PHARMACEUTICAL POWDERS
168
( ABSTRACT
The unit processes involved in preparation of pharmaceutical solid dosage forms
include sieving, milling, mixing and compression. All these processes involve use of
large amounts of shear forces and may result in generation of electrostatic charges on
the powders. In turn the induced charges on the powders may adversely affect powder
flow and packing behavior, fill uniformity, dose uniformity and drug-carrier particle
separation on actuation. The mechanism of development of electrical charges on
powders and their behavior is complex and remains largely unexplored. The current
study is designed to investigate the significance of static charges generated on
pharmaceutical powders during the processing of solid dosage forms. The objectives
of this study are . to determine the effect of formulation components
(lubricants/glidants) and process parameters (mixing time, mixer type and batch size)
on the electrostatic charges generated during the blending of pharmaceutical materials.
The effect of high shear mixing on the electrical properties of pharmaceutical materials
including pregelatinized starch (Starch l SOO), microcrystalline cellulose (A vice!®
PH 101) and a cimetidine containing formulation was determined. Various
lubricants/glidants such as magnesium stearate, stearic acid, colloidal silicon dioxide
(Cab-0-Sil MS) and sodium stearyl fumarate (Pruv®) were evaluated on
triboelectrification of electronegative and electropositive materials. When evaluated
individually, cimetidine displayed electropositive charge whereas all the other
excipients displayed electronegative charges. Cab-0-Sil MS was found to be the most
electronegative whereas stearic acid was found to be the least electronegative among
the excipients examined. Based on the results obtained in this study, when Starch
169
( 1500 was blended with 1 % lubricant/glidant in a Collette Gral 10 High Shear Mixer,
the lubricants/glidants can be arranged as follows in decreasing order of their ability to
reduce the static charges produced during the blending process: magnesium stearate >
Pruv® > stearic acid> Cab-0-Sil MS. For Avicel® PHlOl blends, the antistatic effect
of the same agents can be arranged in decreasing order as: magnesium stearate >
stearic acid > Pruv® > Cab-0-Sil MS. The antistatic effect was reduced when the
mixing time with lubricants increased from 1 minute to 3 minutes. The antistatic
effect of lubricants/glidants was dependent on the electrical charge behavior of the
materials studied. The mixer design and type played an important role in determining
the electrostatic charges of powder blends in pharmaceutical processing. Powders
blended in Collette Gral 10 High Shear Mixer produced more electrostatic charges as
compared to those blended in a Kitchen Aid Planetary Mixer. The triboelectrification
of the blend in a high shear mixer decreased with an increase in the batch size from 0.5
kg to 2.5 kg.
Key words: triboelectrification; electrical charge; pharmaceutical powder; high shear
mixing; lubricant; glidant; antistatic effect; microcrystalline cellulose; pregelatinized
starch; cimetidine; magnesium stearate; stearic acid; colloidal silicon dioxide; sodium
stearyl fumarate.
170
( INTRODUCTION
Pharmaceutical powders tend to acquire electrical charges during processmg
operations such as milling, mixing, micronization, sieving, compaction, spray drying
and congealing, coating, transfer of material from one place to another and packaging
(1). The induced charges on powders may cause problems with the efficient operation
of processing equipment, uniform mixing of formulation components, flowability of
powder blends in high speed machines, drug content uniformity, and accurate delivery
of powders from drug delivery systems, fire hazards, and explosion hazards and may
affect the quality of dosage forms. Although the accumulation of electrical charge on
solid and solid-liquid systems is one of the earliest physical phenomena known, the
significance of these electrical charges on powders in pharmaceutical processing
remains largely unexplored (2-3). Drug substances and pharmaceutical excipients can
be classified as electropositive, electronegative or neutral depending on the charge
behavior on powder particles. Table 1 provides the examples of commonly used
pharmaceutical materials and their electrical behavior.
'Static electrification' by definition includes all processes that produce segregation
of positive and negative electrical charges by mechanical actions operating through
contact, impact, or friction between two surfaces, or by rupture or by separation of
solid and liquid surfaces (1-3). 'Static charge' results from contact of 'true surfaces'
and not from friction. Such a net static charge may be electropositive or
electronegative and is derived from a complex bipolar system.
171
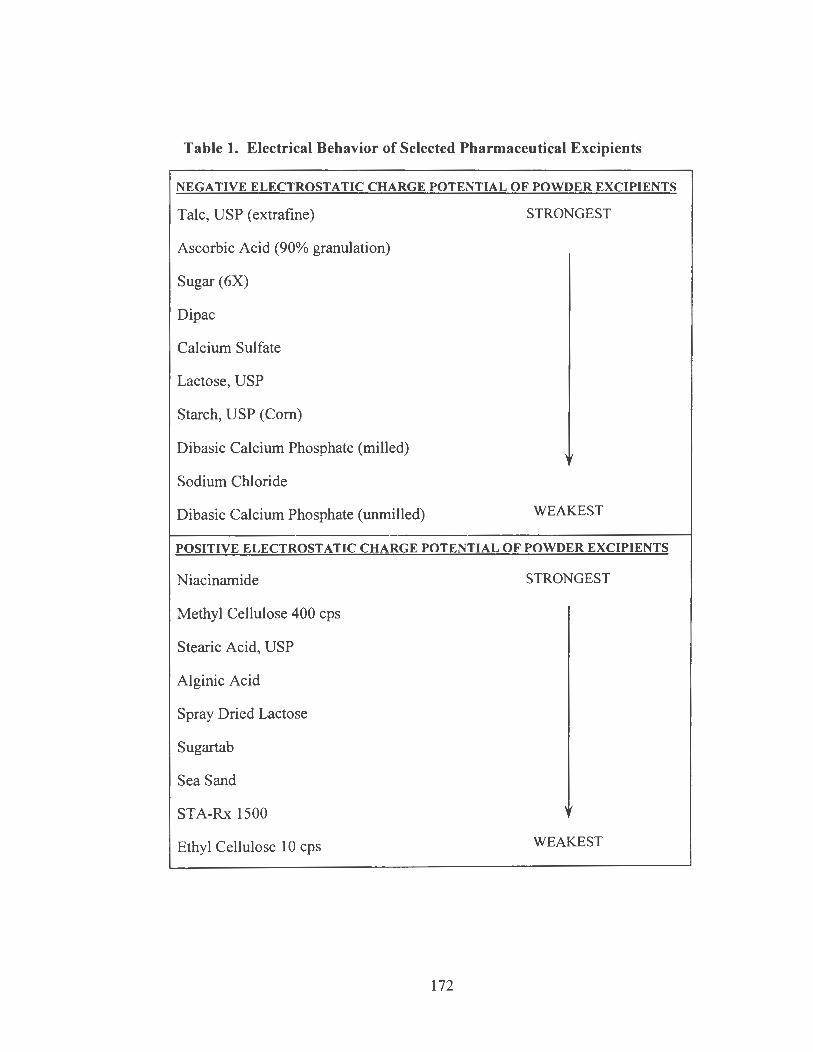
Table 1. Electrical Behavior of Selected Pharmaceutical Excipients
NEGATIVE ELECTROSTATIC CHARGE POTENTIAL OF POWDER EXCIPIENTS
Talc, USP (extrafine) STRONGEST
Ascorbic Acid (90% granulation)
Sugar (6X)
Dipac
Calcium Sulfate
Lactose, USP
Starch, USP (Com)
Dibasic Calcium Phosphate (milled)
Sodium Chloride
Dibasic Calcium Phosphate (unmilled) WEAKEST
POSITIVE ELECTROSTATIC CHARGE POTENTIAL OF POWDER EXCIPIENTS
Niacinamide
Methyl Cellulose 400 cps
Stearic Acid, USP
Alginic Acid
Spray Dried Lactose
Sugartab
Sea Sand
STA-Rx 1500
Ethyl Cellulose 10 cps
172
STRONGEST
\Ii
WEAKEST
The transfer of charge that talces place when two materials collide or are
rubbed together is called triboelectrification (2). Triboelectrification is similar to,
though not the same as, contact electrification, which occurs when two materials are
brought together and then separated, resulting in a transfer of charge between the two
materials. Triboelectrification is a more complicated form of contact electrification in
which there is also transverse motion. Triboelectrification causes a transfer of charge
leading to a buildup of static charge. Static electricity is the result and
triboelectrification is the cause. There are two approaches that can be used for
quantifying and measuring triboelectric phenomena. The first approach is to measure
the results of static accumulation i.e. the buildup of charge due to many charge
transfers on powder particles. The majority of the research into this phenomenon has
been performed using this approach. The second approach is to measure the charge
transfer directly as it talces place ( 4-5). The advantage of second approach is that it is
more accurate and can be used as a tool to monitor the flow of solids during material
transfer.
In pharmaceutical operations, the triboelectrification or contact charging is
influenced by several factors such as particle size and shape, and the electrical
properties of the formulation components, surface properties of particles, nature of the
last contact surface, contact area and frequency, surface purity, and atmospheric
conditions (6-9). Triboelectrification remams a challenge, as some materials are
sensitive to electrostatic charging at atmospheric conditions, while other materials are
not. Also, triboelectrification can be completely characterized only if the true area of
contact is known (1). The true area of contact depends on the surface roughness as
173
( well as contact pressure. The process of triboelectrification is a complex phenomenon
and is not yet fully understood in pharmaceutical processing. Most pharmaceutical
powders are organic crystals, which behave as insulators under ambient conditions.
These systems are complex and less well defined when compared to conductors and
however, similar theoretical considerations can be extrapolated to explain the
electrostatic behavior of pharmaceutical systems (10). The work function of a
substance is defined as the difference in the energy state between the outermost
electrons or Fermi level, and a reference source. When two dissimilar substances
come into contact, transfer of electrons occurs as to equalize the Fermi level energies.
A contact potential or electrostatic charge is produced, and this is the difference
between the work functions. It is this adhesion energy, with electric force
contributions from London- Van der Waals and surface tension interactions, as well as
Coulomb interactions, which must be overcome in order to allow free movement of
powder particles.
During dry powder handling operations, particles make frequent contact with
different surfaces, such as surface of other particles, metallic surfaces of the handling
equipment and surfaces of the processing equipment (1). The process of contact
electrification thus charges the powder particles with either positive or negative
charge. The dynamic behavior of charged particles depends largely on the charges
present on the powder particles. On contact with surfaces in the neighborhood,
charged particles adhere by a combination of electrostatic and Van der Waal forces .
Once a particle is charged during handling, the charge is transferred at the particle
contact point and will redistribute itself over the surface electrostatic forces. The rate
174
( at which this redistribution proceeds depends upon the electrical relaxation time of the
particle material. Charged particles set up electrostatic fields, which influence particle
trajectories and powder dynamics. Such charged particles are subject to extreme
attractive forces and may adhere strongly to surfaces. This powder adhesion can be
very problematic in processing and cleaning operations. The practical significance of
electrostatic charge measurements is more critical for aerosol formulations intended
for nasal and inhalation dosage forms. The charges on the powders affect powder flow
and packing behavior, fill uniformity, dose uniformity and drug-carrier particle
separation on actuation. Addition of antistatic agents is one approach that can be used
to overcome these problems in the pharmaceutical industry. Another approach is
selection of each excipient in the formulation based on the electrical properties of
individual components so that final formulation can display neutral charge during
processmg.
Although it has been recognized that triboelectrification can be a senous
problem in handling of pharmaceutical powders, only a few reports have been
published so far. The significance of electrostatic charges in pharmaceutical
formulation development and process development remains largely unexplored. The
purpose of this investigation was to enhance the understanding of triboelectrification
process during blending of pharmaceutical materials for solid dosage forms. The
objectives of this study were: 1) to evaluate the electrostatic nature of various
pharmaceutical powders, 2) to determine the mixing time effect on triboelectrification
process in a high shear mixer, 3) to understand the effect of mixer type and batch size
175
( on static charging of pharmaceutical materials and 4) to compare the antistatic effect
of different lubricants/glidants on electronegative and electropositive materials.
176
( METHODOLOGY
Materials: The materials used in this study were cimetidine, USP (Agvar
Chemicals, USA), microcrystalline cellulose, NF (Avicel® PHIOl) (FMC Inc., USA),
pregelatinized starch, NF (Starch 1500) (Colorcon Inc. , USA), anhydrous lactose, NF
(Sheffield Products, USA), magnesium stearate, NF (Mallinckrodt Co., USA), sodium
stearyl fumarate, NF (Pruv®) (Mendell, USA), stearic acid, NF (Witco Corp. , USA)
and colloidal silicon dioxide, NF (Cab-0-Sil M5) (Cabot Corp. , USA).
The equipment used includes Collette Gral 10 High Shear Mixer (Collette,
USA), Kitchen Aid Planetary Mixer (Kitchen Aid, USA) and Faraday Cup connected
to NanoCoulomb Meter (Monroe Electronics, USA).
Methods
Preparation of Powder Blends: Selected pharmaceutical materials namely,
microcrystalline cellulose (Avicel® PH101), pregelatinized starch (Starch 1500) and a
cimetidine formulation containing active, Avicel® PHIOl , Starch 1500 and anhydrous
lactose in the ratio of 69: 10: 10: 10 were evaluated for electrostatic behavior during
blending process in a high shear mixer. Lubricants/glidants such as magnesium
stearate, sodium stearyl fumarate, NF (Pruv®), stearic acid, and colloidal silicon
dioxide, NF (Cab-0-Sil M5) were added to the pre-blends to evaluate their antistatic
effect. The selected material(s) were screened through a 30-mesh hand screen and
were mixed in a Collette Gral I 0 High Shear Mixer for 10 minutes at a mixer arm
speed of 660 rpm and a chopper speed of 3000 rpm. Lubricant/glidant at 1 % w/w
level was added to the pre-blend and the mixing was continued for an additional 3
177
( minutes. The batch size of 0.5 kg was used for all the experiments in order to evaluate
the antistatic effect of various lubricants/glidants. The electrostatic charges on powder
blends were measured after 0, 5, 10, 11 , 12 and 13 minutes of mixing.
Mixer load will also affect the blending efficiency during preparation of
powder mixtures. In order to determine the effect of batch size on electrostatic
charging of powders in a high shear mixer, Starch 1500 at batch sizes of 0.5 kg and 2.5
kg was blended in a Collette Gral 10 High Shear Mixer. The charge developed on
powder was monitored after 0, 5, 10, 15 and 20 minutes of mixing.
In a blending operation, mixing efficiency is dependent on the design and type
of mixing vessel used for processing. In order to determine the effect of mixer type on
triboelectric charging, Starch 1500 was blended in a Collette Gral 10 High Shear
Mixer (capacity - 7 liters) and in a Kitchen Aid Planetary Mixer (capacity- 2.5 liters)
keeping the batch size constant (0.5 kg). The charge developed on powder was
monitored after 0, 5, 10, 15 and 20 minutes of mixing.
Measurement of Electrostatic Charges: Electrostatic charges on powder particles
were measured using the Faraday Cup connected to an electrometer (11). The
experimental set up is shown in Figure 1. The Faraday Cup consists of 6-inch can
inserted in another can and the two cans were insulated from one another with a teflon
block. The inner can which is a static charge detector was connected to an
electrometer, NanoCoulomb Electrometer (Model:253 , Monroe Electronics, Inc. ,
USA) via a coaxial cable. The electrometer is capable of measuring charges in the
range of 2x10-12 - 2x10⁻⁷ Coulombs. At predetermined intervals, the powder samples
178
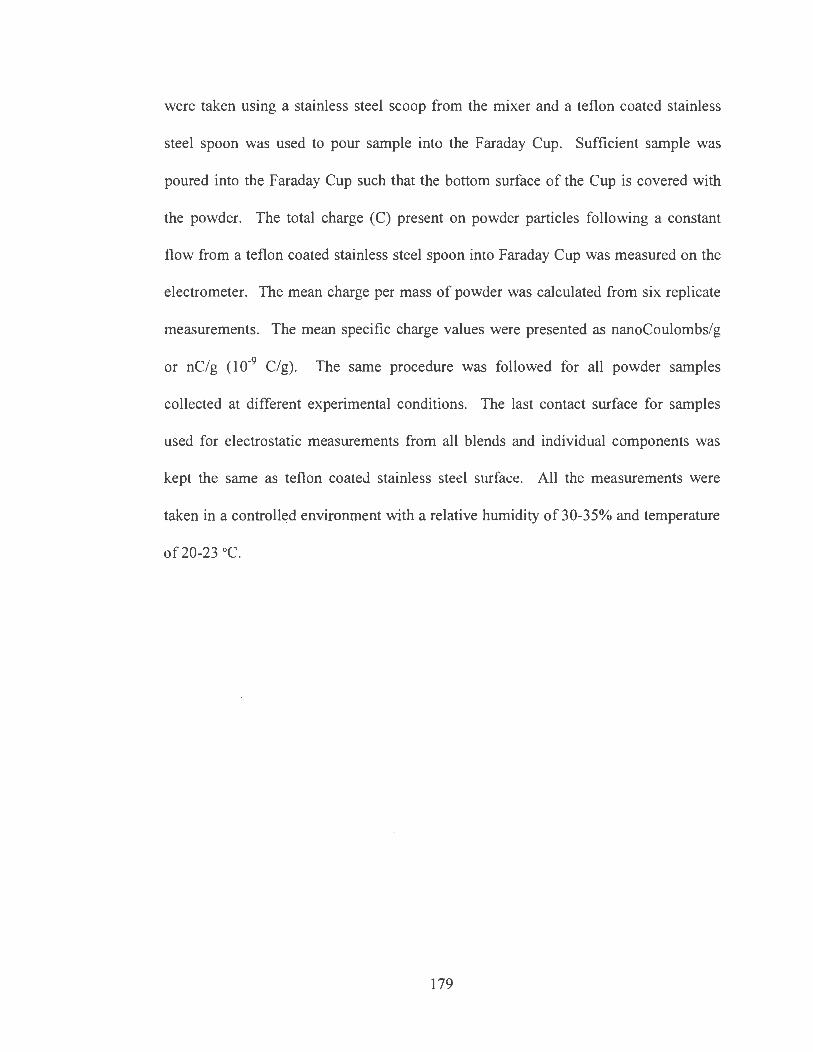
were taken using a stainless steel scoop from the mixer and a teflon coated stainless
steel spoon was used to pour sample into the Faraday Cup. Sufficient sample was
poured into the Faraday Cup such that the bottom surface of the Cup is covered with
the powder. The total charge (C) present on powder particles following a constant
flow from a teflon coated stainless steel spoon into Faraday Cup was measured on the
electrometer. The mean charge per mass of powder was calculated from six replicate
measurements. The mean specific charge values were presented as nanoCoulombs/g
or nC/g (10-9 C/g). The same procedure was followed for all powder samples
collected at different experimental conditions. The last contact surface for samples
used for electrostatic mea5urements from all blends and individual components was
kept the same as teflon coated stainless steel surface. All the measurements were
taken in a controlled environment with a relative humidity of 30-35% and temperature
of20-23 °C.
179
\
0 0
0
Powder sample
Faraday Cup O O ----- (Brass)
....---- 0 0 ---:_ ____ ___,
0
0 0 0
Insulator (Teflon Block)
Coaxial Cable
Electro meter
I CD I 0 0
Figure 1. Experimental Set-Up for Measurement of Electrostatic Charges on
Pharmaceutical Powders
180
RESULTS AND DISCUSSION
Typical processing of phannaceutical dosage forms involves different stages
such as sieving, milling, mixing, and transfer of powder blend from hopper to the die,
and compaction (3). All these stages involve close interaction of particles of various
formulation components along with those of active material(s). Since
triboelectrification is a surface contact phenomenon and phannaceutical powders tend
to acquire electrical charges during various stages involved in the preparation of
dosage forms, electrostatic forces associated with dry powders have been identified as
playing a significant role in cohesion/adhesion (12-14). The accumulated static charge
on the surface of powder particles contributes to 'demixing'. This may cause flow and
segregation problems which are detrimental to the content uniformity of the
formulation as well as deteriorates powder flow and compaction properties. The
induced charge on powders also causes problems in the efficient operation of
processing equipment, flowability of powder blends from hopper to die table in high
speed machines and affects the quality of dosage forms.
In order to investigate the effect of triboelectrification during the mixing
process of phannaceutical materials, the commonly used excipients: microcrystalline
cellulose (Avicel® PHIOl) - filler/diluent, pregelatinized starch (Starch 1500) -
disintegrant, and a cimetidine tablet formulation containing active, A vicel® PH I 0 I,
Starch 1500, lactose anhydrous and lubricant/glidant were evaluated using a high shear
mixer.
The individual components used in the study were evaluated for electrical
properties using a Faraday Cup connected to an electrometer and the results are
181
(
(
summarized in Table 2. The specific charge (nC/g) was calculated for each material
and the results represent the mean and standard deviation of six replicate readings.
Table 2 shows that different charging tendencies exist for different materials. The data
indicates that all the excipients evaluated in this study displayed negative charges
except the drug substance, cimetidine, USP which showed a positive charge. Among
the excipients studied, Cab-0-Sil MS displayed the highest electronegative charge (-
53 .488 nC/g) as compared to stearic acid, which showed the least amount of
electronegative charge (-0.115 nC/g).
182
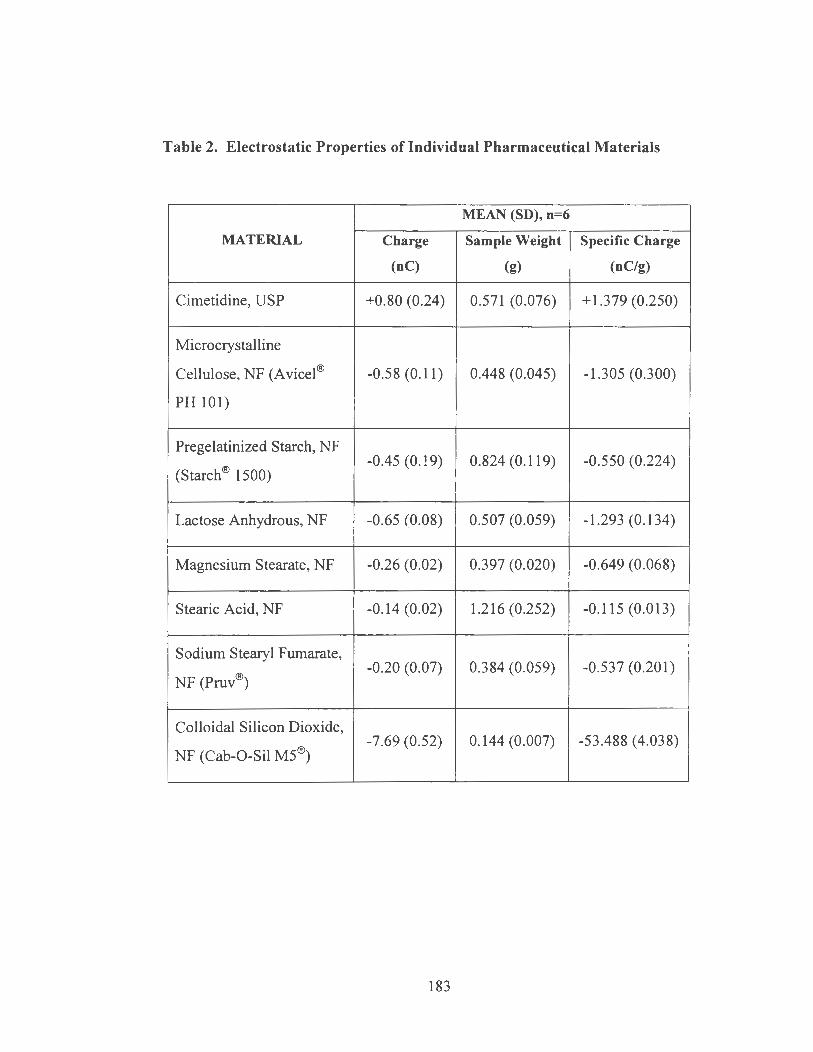
r
Table 2. Electrostatic Properties of Individual Pharmaceutical Materials
MEAN (SD), n=6
MATERIAL Charge Sample Weight Specific Charge
(nC) (g) (nC/g)
Cimetidine, USP +0.80 (0.24) 0.571 (0.076) +1.379 (0.250)
Microcrystalline
Cellulose, NF (A vicel® -0.58 (0.11) 0.448 (0.045) -1.305 (0.300)
PH 101)
Pregelatinized Starch, NF
(Starch® 1500) -0.45 (0.19) 0.824 (0.119) -0.550 (0.224)
Lactose Anhydrous, NF -0.65 (0.08) 0.507 (0.059) -1.293 (0.134)
Magnesium Stearate, NF -0.26 (0.02) 0.397 (0.020) -0.649 (0.068)
Stearic Acid, NF -0.14 (0.02) 1.216 (0.252) -0.115 (0.013)
Sodium Stearyl Fumarate,
NF (Pruv®) -0.20 (0.07) 0.384 (0.059) -0.537 (0.201)
Colloidal Silicon Dioxide,
NF (Cab-0-Sil MS®) -7.69 (0.52) 0.144 (0.007) -53.488 (4.038)
183
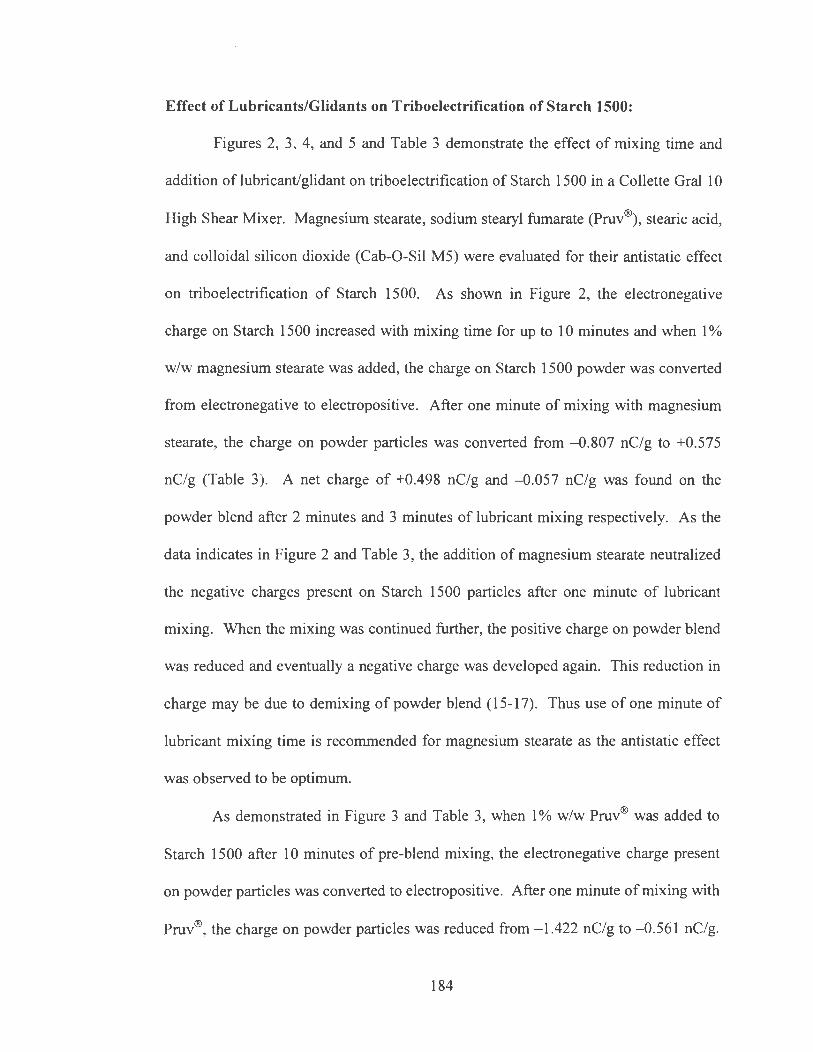
( Effect of Lubricants/Glidants on Triboelectrification of Starch 1500:
Figures 2, 3, 4, and 5 and Table 3 demonstrate the effect of mixing time and
addition of lubricant/glidant on triboelectrification of Starch 1500 in a Collette Gral 1 O
High Shear Mixer. Magnesium stearate, sodium stearyl fumarate (Pruv®), stearic acid,
and colloidal silicon dioxide (Cab-0-Sil MS) were evaluated for their antistatic effect
on triboelectrification of Starch 1500. As shown in Figure 2, the electronegative
charge on Starch 1500 increased with mixing time for up to 10 minutes and when 1 %
w/w magnesium stearate was added, the charge on Starch 1500 powder was converted
from electronegative to electropositive. After one minute of mixing with magnesium
stearate, the charge on powder particles was converted from -0.807 nC/g to +0.575
nC/g (Table 3). : A net charge of +0.498 nC/g and -0.057 nC/g was found on the
powder blend after 2 minutes and 3 minutes of lubricant mixing respectively. As the
data indicates in Figure 2 and Table 3, the addition of magnesium stearate neutralized
the negative charges present on Starch 1500 particles after one minute of lubricant
mixing. When the mixing was continued further, the positive charge on powder blend
was reduced and eventually a negative charge was developed again. This reduction in
charge may be due to demixing of powder blend ( 15-17). Thus use of one minute of
lubricant mixing time is recommended for magnesium stearate as the antistatic effect
was observed to be optimum.
As demonstrated in Figure 3 and Table 3, when 1 % w/w Pruv® was added to
Starch 1500 after 10 minutes of pre-blend mixing, the electronegative charge present
on powder particles was converted to electropositive. After one minute of mixing with
Pruv®, the charge on powder particles was reduced from -1.422 nC/g to -0.561 nC/g.
184
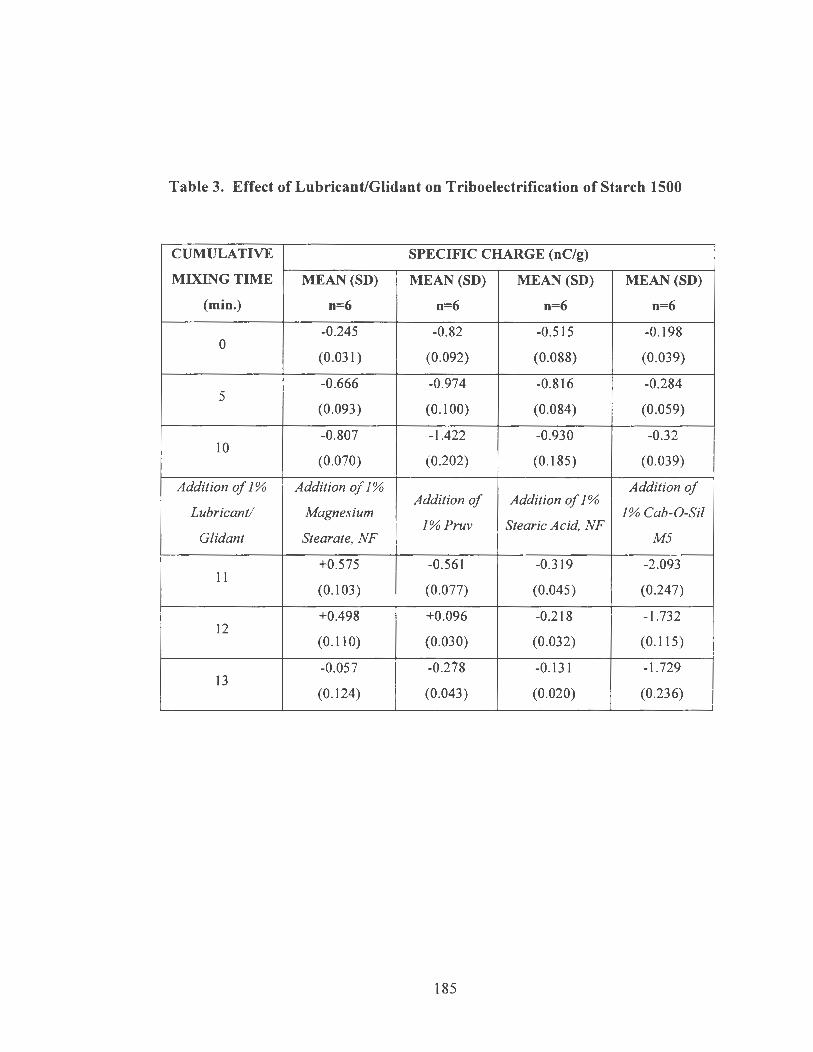
(
Table 3. Effect of Lubricant/Glidant on Triboelectrification of Starch 1500
CUMULATIVE SPECIFIC CHARGE (nC/g)
MIXING TIME MEAN(SD) MEAN (SD) MEAN (SD) MEAN (SD)
(min.) n=6 n=6 n=6 n=6
-0.245 -0.82 -0.515 -0.198 0
(0.031) (0.092) (0.088) (0.039)
-0.666 -0.974 -0.816 -0.284 5
(0.093) (0.100) (0.084) (0.059)
-0.807 -1.422 -0.930 -0.32 10
(0.070) (0.202) (0.185) (0.039)
Addition of 1% Addition of 1% Addition of Addition of 1%
Addition of
Lubricant/ Magnesium 1% Cab-0-Sil / %Pruv Stearic Acid, NF
Glidant Stearate, NF M5
+0.575 -0.561 -0.319 -2.093 11
(0.103) (0.077) (0.045) (0.247)
+0.498 +0.096 -0.218 -1.732 12
(0.110) (0.030) (0.032) (0.115)
-0.057 -0.278 -0.131 -1.729 13
(0.124) (0.043) (0.020) (0.236)
185
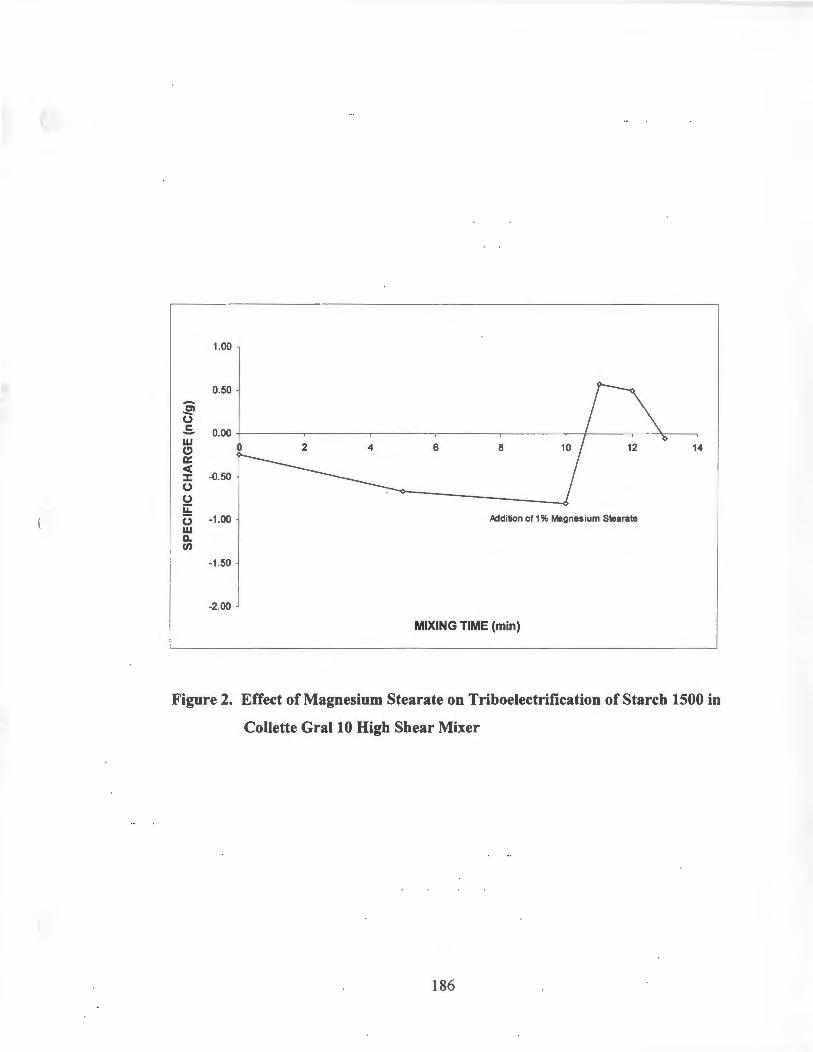
1.00
0.50 -.e> u .s 0.00 w 2 4 6 8 14 (!) a: < -0.50 J: u S::2 LL (3 -1 .00 Add ition of 1 % Magnes ium Stearate w D. Cl)
-1.50
-2.00
MIXING TIME (min)
Figure 2. Effect of Magnesium Stearate on Triboelectrification of Starch 1500 in
Collette Gral 10 High Shear Mixer
186
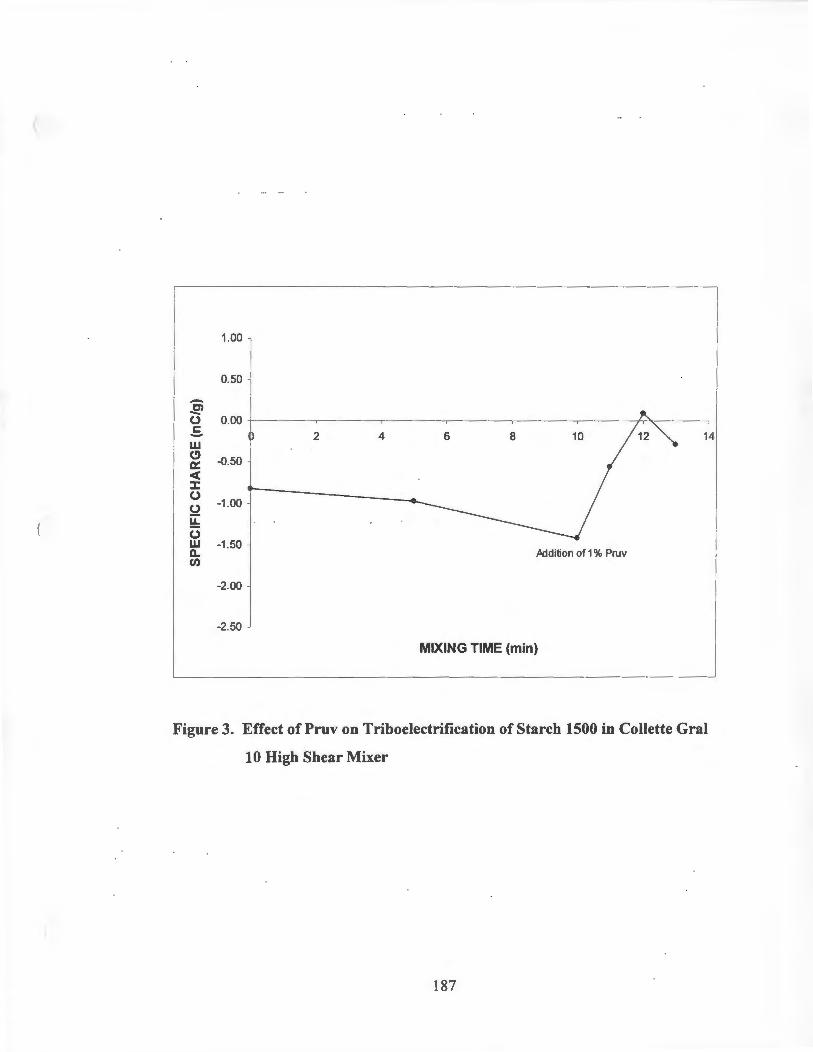
(
(
100 1 0.50
-.E> 0 0.00 .E. 2 4 6 8 10 14 w C> -0.50 0::: < :I: 0
-1 .00 ~ ~ 0 w -1 .50 c.. Pddition of 1 % Pruv
"' -2.00
-2.50
MIXING TIME (min)
Figure 3. Effect of Pruv on Triboelectrification of Starch 1500 in Collette Gral
10 High Shear Mixer
187
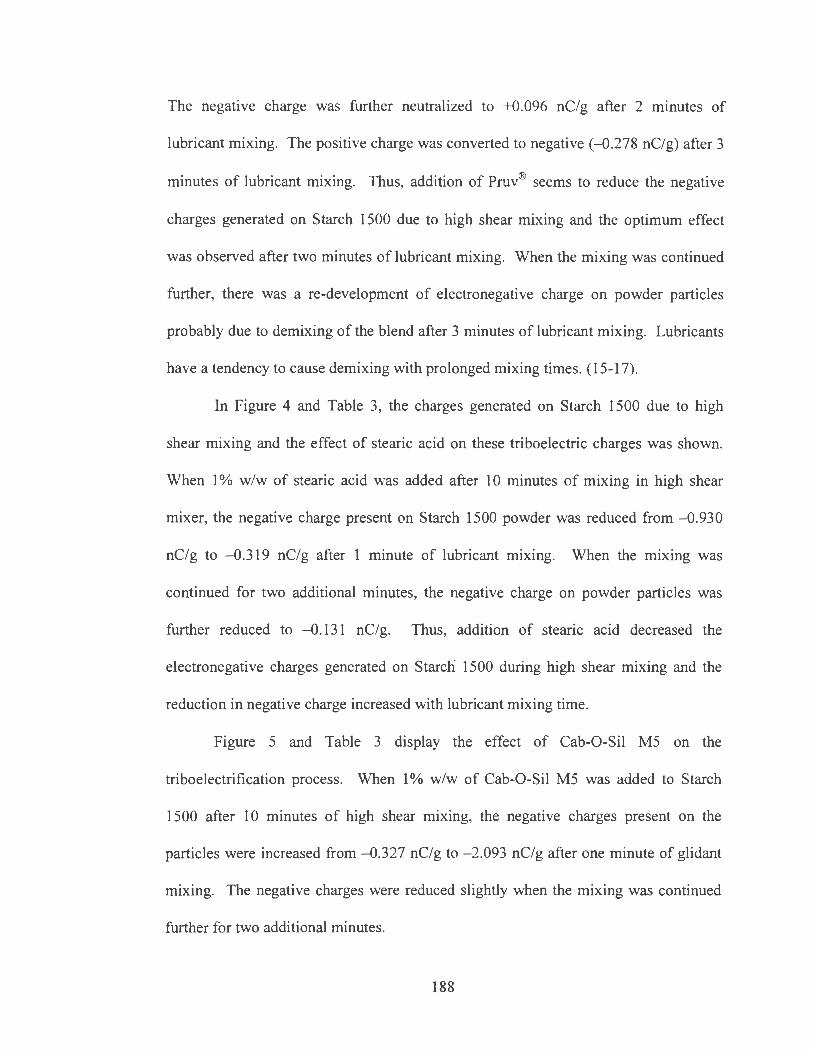
The negative charge was further neutralized to +0.096 nC/g after 2 minutes of
lubricant mixing. The positive charge was converted to negative (-0.278 nC/g) after 3
minutes of lubricant mixing. Thus, addition of Pruv® seems to reduce the negative
charges generated on Starch lSOO due to high shear mixing and the optimum effect
was observed after two minutes of lubricant mixing. When the mixing was continued
further, there was a re-development of electronegative charge on powder particles
probably due to demixing of the blend after 3 minutes of lubricant mixing. Lubricants
have a tendency to cause demixing with prolonged mixing times. (1 S-17).
In Figure 4 and Table 3, the charges generated on Starch 1 SOO due to high
shear mixing and the effect of stearic acid on these triboelectric charges was shown.
When 1 % w/w of stearic acid was added after 10 minutes of mixing in high shear
mixer, the negative charge present on. Starch l SOO powder was reduced from -0.930
nC/g to -0.319 nC/g after 1 minute of lubricant mixing. When the mixing was
continued for two additional minutes, the negative charge on powder particles was
further reduced to -0.131 nC/g. Thus, addition of stearic acid decreased the
electronegative charges generated on Starch 1 SOO during high shear mixing and the
reduction in negative charge increased with lubricant mixing time.
Figure S and Table 3 display the effect of Cab-0-Sil MS on the
triboelectrification process. When 1 % w/w of Cab-0-Sil MS was added to Starch
1 SOO after 10 minutes of high shear mixing, the negative charges present on the
particles were increased from -0.327 nC/g to -2.093 nC/g after one minute of glidant
mixing. The negative charges were reduced slightly when the mixing was continued
further for two additional minutes.
188
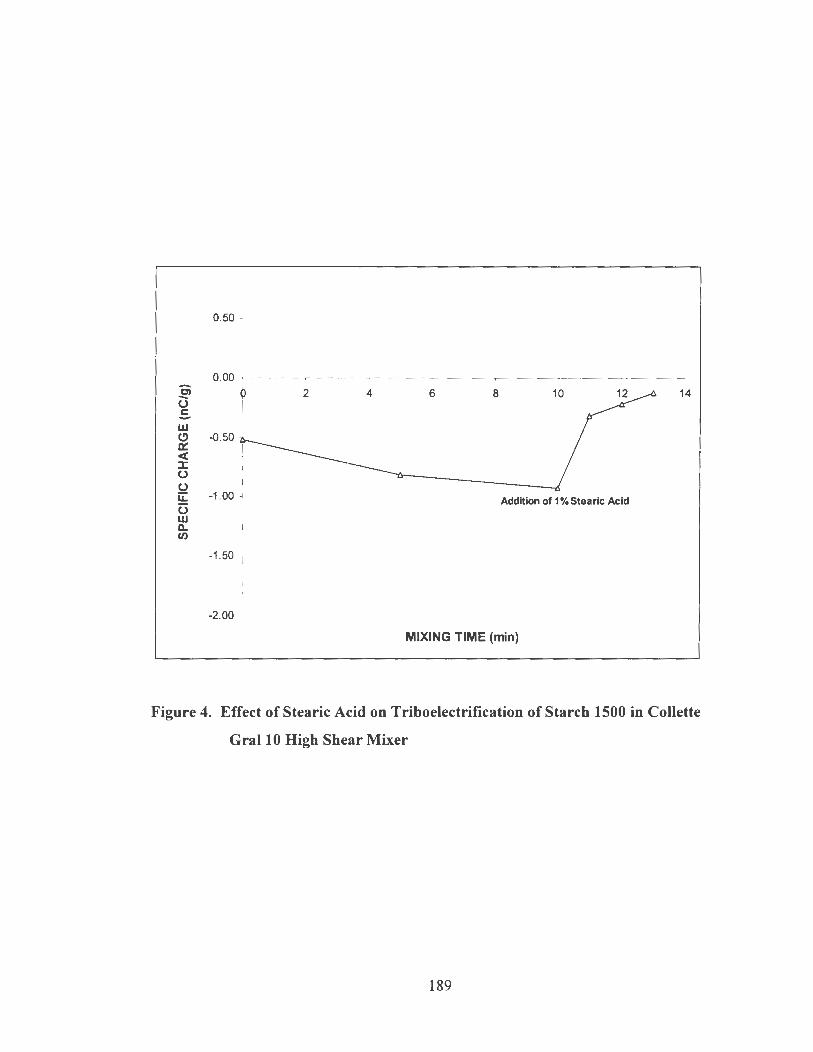
0.50
0.00 c; 2 4 6 8 14 -(.) .s w (!) -0.50 a::: ~ :c (.)
(.)
u::: -1 .00 Addition of 1 % Stearic Acid u w 0.. (/)
-1 .50
-2.00
MIXING TIME (min)
Figure 4. Effect of Stearic Acid on Triboelectrification of Starch 1500 in Collette
Gral 10 High Shear Mixer
189
(
0 .50
0 .00 +-----..------.------,----~---~---.,.-----,
~ (.) .s -0.50
w (.!) 0:::
~ -1 .00 (.)
(.)
u: u -1 .50 w 0.. en
-2 .00
-2 .50
2 4 6 8 10 12
Addition of 1 % Cab-0-Sil MS
MIXING TIME (min)
Figure 5. Effect of Cab-0-Sil MS on Triboelectrification of Starch 1500 in
Collette Gral 10 High Shear Mixer
190
14
(
Thus, addition of Cab-0-Sil MS to Starch 1 SOO significantly increased the
electronegative charges present on the powder blend. Increased mixing with Cab-0-
Sil MS® had a marginal effect on the net negative charges present on the powder
blend.
Starch 1 SOO particles displayed electronegative behavior initially when the last
contact with the powder sample was the teflon coated stainless steel surface. The
electronegative charge present on Starch 1 SOO increased with mixing time in Collette
Gral 10 High Shear Mixer when compared to the initial charge. The addition of
magnesium stearate and Pruv® neutralized the negative charges generated during
mixing process. Stearic acid reduced the negative charges generated on Starch 1 SOO
after initial mi~ing but the effect was not .as significant as either magnesium stearate or
Pruv®. Addition of Cab-0-Sil MS as glidant increased the net negative charges
present on the powder particles as compared to the initial charge present on the
particles. Based on the antistatic effect on Starch 1 SOO, the lubricants/glidants can be
arranged in the following order: magnesium stearate > Pruv® > stearic acid> Cab-0-
Sil MS.The maximum antistatic effect was observed for magnesium stearate and
Pruv® after one minute of lubricant mixing. Increase in mixing time seems to reduce
the antistatic effect of these lubricants. The mixing time seems to have marginal effect
when the additive was either stearic acid or Cab-0-Sil MS.
191
Effect of Lubricants/Glidants on Triboelectrification of AviceI® PHlOl: I \
A vice!® PH 101 is commonly used as a filler in solid dosage forms. It displays
high compressibility but poor flow properties due to a fine particle size distribution. In
the current study, the antistatic effect of magnesium stearate, sodium stearyl fumarate
(Pruv®), stearic acid, and colloidal silicon dioxide (Cab-0-Sil MS) was evaluated on
the triboelectrification of A vice I® PH 101 during a high shear mixing process. The
results are summarized in Table 4 and data plotted as a function of mixing time in
Figures 6, 7, 8, and 9. The graphs display the effect of mixing time on
triboelectrification of AviceI® PH101 and the effect of lubricant/glidant on electrical
nature of Avicel® PHlOJ. during high shear mixing.
As shown in Figure 6 and Table 4, the electronegative charge on A vice!®
PH101 increased with mixing time up to 10 minutes and when 1% w/w magnesium
stearate was added to the blend, the negative charge present on powder was
significantly neutralized. After one minute of mixing with magnesium stearate, the
charge on powder particles was reduced from -1.920 nC/g to -0.992 nC/g (Table 4).
After 2 minutes of mixing, a net positive charge of +0.124 nC/g was observed. When
mixing was continued for one more minute, then there was a redevelopment of
negative charge (-0.260 nC/g) on powder particles indicating demixing of blend. As
the data indicates in Figure 6, the addition of magnesium stearate neutralized the
negative charges generated on A vice I® PH 101 particles due to triboelectrification
during mixing process. Magnesium stearate acts as lubricant by forming a thin film on
the primary particles. Thus the particle size distributions of individual components in
a formulation play significant role in electrical behavior of final blends (18-19).
192
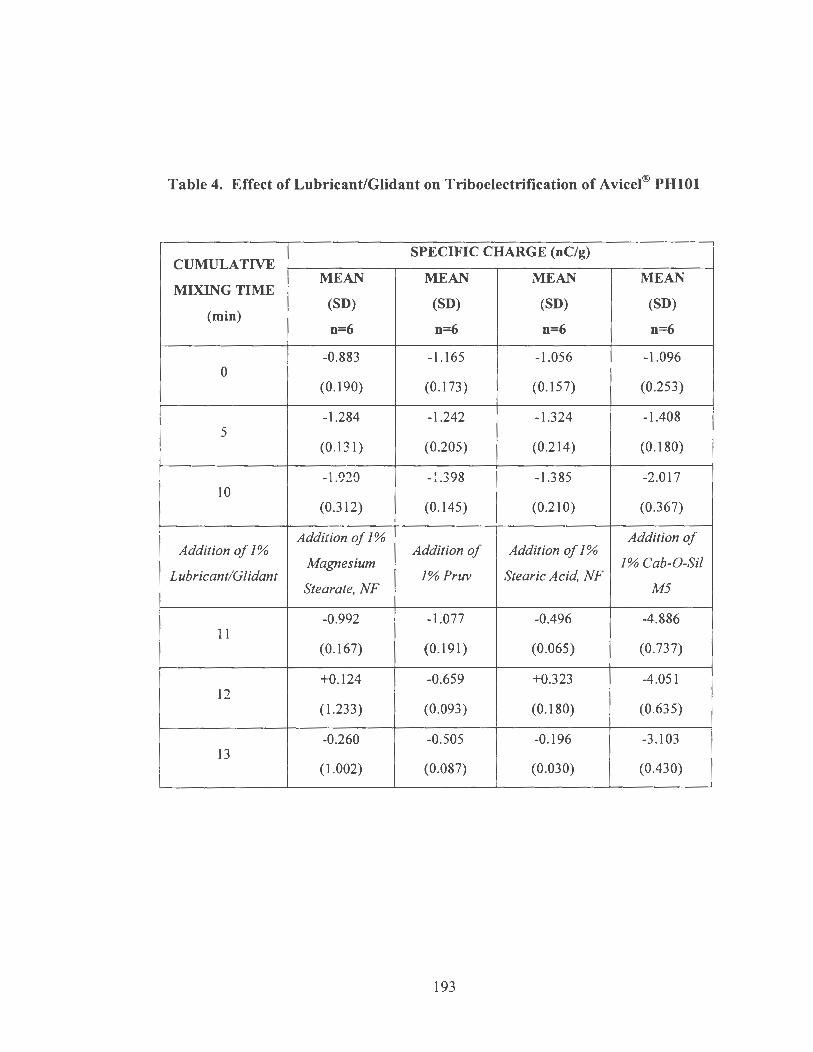
Table 4. Effect of Lubricant/Glidant on Triboelectrification of Avicel® PHlOl
CUMULATIVE SPECIFIC CHARGE (nC/g)
MEAN MEAN MEAN MEAN MIXING TIME
(min) (SD) (SD) (SD) (SD)
n=6 n=6 n=6 n=6
-0.883 -1.165 -1.056 -1.096 0
(0.190) (0.173) (0.157) (0.253)
-1.284 -1.242 -1.324 -1.408 5
(0.131) (0.205) (0.214) (0.180)
-1.920 -1.398 -1.385 -2.017 10
I (0.312) (0.145) (0.210) (0.367)
Addition of 1% Addition of 1%
Addition of Addition of 1% Addition of
Magnesium 1% Cab-0-Sil Lubricant/Glidant 1%Pruv Stearic Acid, NF
Stearate, NF M5
-0.992 -1.077 -0.496 -4.886 11
(0.167) (0.191) (0.065) (0.737)
+0.124 -0.659 +0.323 -4.051 12
(l.233) (0.093) (0.180) (0.635)
-0.260 -0.505 -0.196 -3 .103 13
(l.002) (0.087) (0.030) (0.430)
\
193
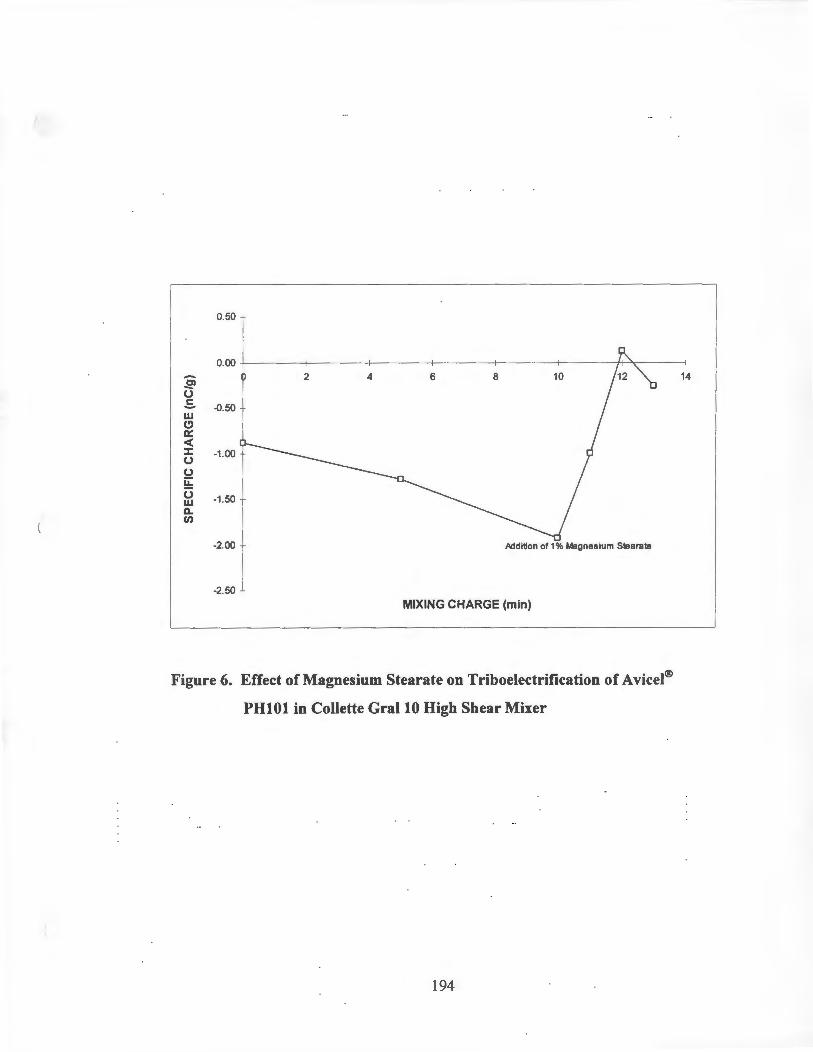
(
-.El u .s w (!) a::: <( ::c u u u::: u w a.. (/)
0.50
-2.50
.Addition of 1 % Magnesium Stea rate
MIXING CHARGE (min)
Figure 6. Effect of Magnesium Stearate on Triboelectrification of A vicel®
PH101 in Collette Gral 10 High Shear Mixer
194
(
(
Since Avicel® PH101 consists of fine particles, it took longer time for antistatic agent
to neutralize the charges present on Avicel® PH101 as compared to that was observed
for Starch 1500. The maximum antistatic effect of magnesium stearate on A vicel®
PH 101 was seen after two minutes of mixing. When the mixing was continued
further, the antistatic effect seems to diminish probably due to demixing of powder
blend (15-17).
As demonstrated in Figure 7, when 1 % w/w Pruv® was added to A vicel®
PH 101 after 10 minutes of high shear mixing, the electronegative charge present on
powder particles was reduced from -1.398 nC/g to -1.077 nC/g after 1 minute of
mixing with Pruv® (Table 4). The negative charge was further reduced to -0.659 nC/g
and -0.505 nC/g after 2 minutes and 3 minutes of lubricant mixing, respectively.
Thus, addition of Pmv® seems to reduce the negative charges generated on A vicel®
PH 101 due to high shear mixing. The antistatic effect of Pruv® on A vicel® PH 101
increased with an increase in the mixing time.
Figure 8 shows the effect of stearic acid on the triboelectric charges generated
on A vicel® PH 101 due to high shear mixing. When 1 % w/w of stearic acid was added
after 10 minutes of mixing, the negative charge present on Avicel® PHlOl powder was
reduced from -1.385 nC/g to -0.496 nC/g after 1 minute of lubricant mixing (Table 4).
When the mixing was continued further for another minute, then the electronegative
charges present on powder particles were converted to electropositive (from -0.496
nC/g to +0.323 nC/g). The negative charges reappear after 3 minutes of lubricant
mixing.
195
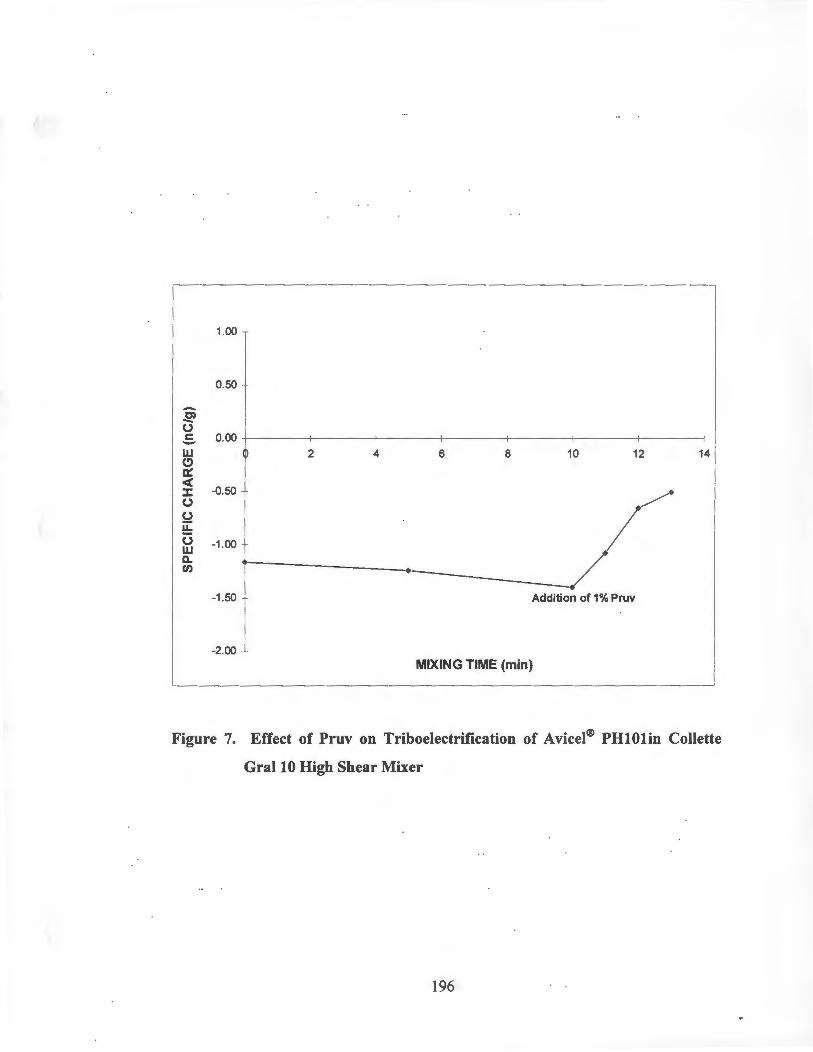
I l
1.00
0.50
-C> -0 .s 0.00 w ~ 2 4 6 8 10 12 14 (!) a:: <(
-0.50 :I: /. 0
~ I ~ 0 -1.00 w ll.. • _/· rn ·-
-1.50 Addition of 1% Pruv
-2.00 MIXING TIME (min)
Figure 7. Effect of Pruv on Triboelectrification of AviceI® PHlOlin Collette
Gral 10 High Shear Mixer
196
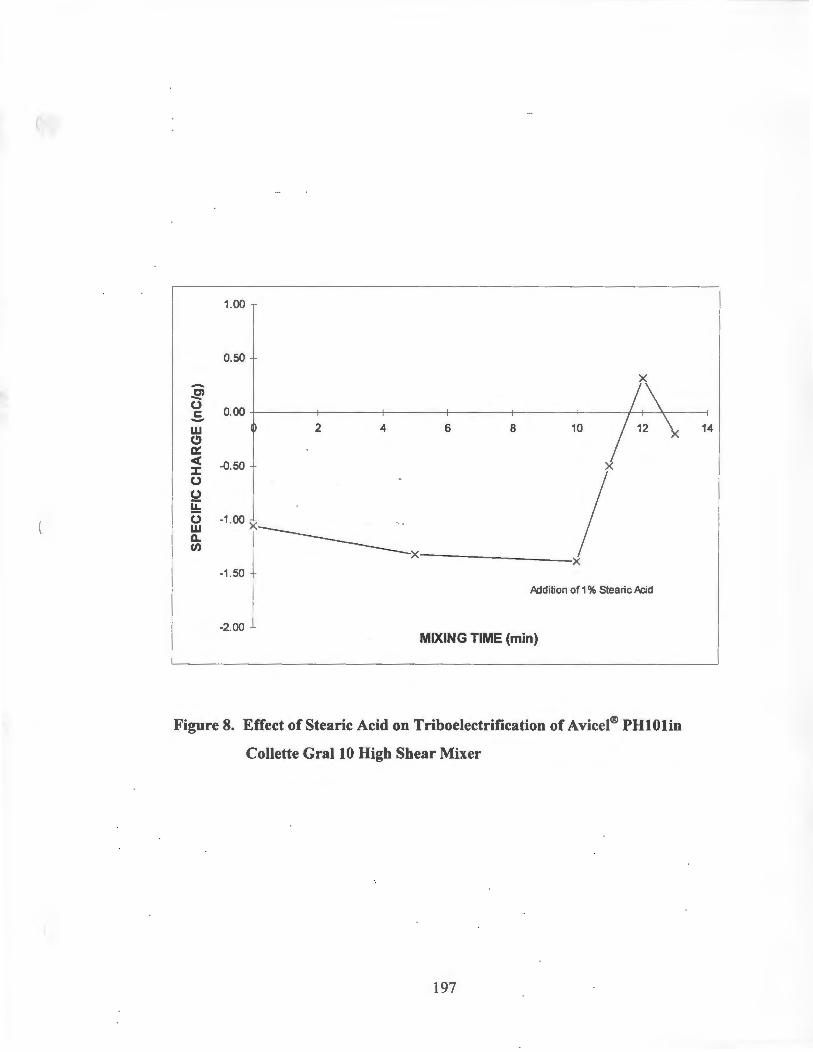
(
w C> c:::: c( :::c (J
~ !:!: (J w c..
"'
1.00
0.50
2 4
-0.50
-1 .00 x .. ---------1.50
-2.00
x
6 8 10
x
x ~~~~~~~~-x
Pildition of 1 % Stearic .Acid
MIXING TIME (min)
Figure 8. Effect of Stearic Acid on Triboelectrification of Avicel® PHlOlin
Collette Gral 10 High Shear Mixer
197
14
(
(
Thus, addition of stearic acid decreased the electronegative nature of A vicel®
PH101 and the reduction in negative charge increased with lubricant mixing time for
up to two minutes.
Figure 9 demonstrates the electrical charges present on Avicel® PH101 as a
function of mixing time and the effect of Cab-0-Sil MS on the triboelectrification
process. When 1% w/w of Cab-0-Sil MS was added to Avicel® PHlOl after 10
minutes of high shear mixing, the negative charges present on the particles were
significantly increased from -2.017 nC/g to -4.886 nC/g after one minute of mixing
(Table 4). The negative charges were reduced to -4.0Sl nC/g and to -3.103 nC/g
when the mixing was continued for 2 and 3 minutes respectively. Thus, addition of
Cab-0-Sil MS as glidant to Avicel® PHlOl significantly increased the amount of
electronegative charges .present 0n the powder blend. Increased mixing with Cab-0-
Sil MS had a reducing effect on the overall negative charges present on the powder
blend. However, addition of Cab-0-Sil MS has resulted in increasing the net
electronegative charges present on Avicel® PH101 powder.
Avicel® PH101 displayed electronegative behavior initially when the last
contact with powder sample was a teflon coated stainless steel surface. The
electronegative charge present on Avicel® PH101 increased with mixing time (up to
10 minutes) in Collette Gral 10 High Shear Mixer when compared to the initial charge.
The addition of magnesium stearate, Pruv® and stearic acid resulted in reduction of the
negative charges generated during mixing process. Addition of Cab-0-Sil MS as
glidant increased the net negative charges present on the powder particles as compared
to the initial charge present on the particle. Additional mixing however reduced the
198
(
(
1.00
0.00 - 2 4 6 8 10 12 14 .El (.)
-1.00 .s w (!) a::: -2.00 c( :I: (.)
(.) -3.00 !;!;; (.) w c.. -4.00 (/)
-5.00 .Addition of 1 % Cab-0-Sil M5
-<l .00
MIXING TIME (min)
Figure 9. Effect of Cab-0-Sil MS on Triboelectrification of Avicel® PHlOl in
Collette Gral 10 High Shear Mixer
199
negative charges marginally. The antistatic agents can be arranged in the following
order based on their decreasing order of effectiveness to reduce electrostatic charges:
magnesium stearate > stearic acid> Pruv® > Cab-0-Sil MS. The maximum antistatic
effect was observed for magnesium stearate and stearic acid after two minutes of
lubricant mixing. Increase in mixing time seems to increase the antistatic effect of
Pruv® and Cab-0-Sil MS. The mixing time had an adverse effect when the additive
was either stearic acid or magnesium stearate (1 S-17).
200
Effect of Lubricants/Glidants on Triboelectrification of Cimetidine Formulation:
A typical tablet formulation contains active ingredient, filler, binder,
disintegrant and lubricant/glidant. In this study an attempt was made to determine the
electrostatic charges present on cimetidine tablet formulation as a function of mixing
time in a high shear mixer and also evaluate the effect of antistatic agents. A
cimetidine formulation was prepared consisting of 69% cimetidine, USP, 10% A vice!®
PH 101 , 10% Starch 1 SOO, 10% lactose anhydrous and 1 % lubricant or glidant. When
evaluated independently the drug displayed electropositive charge and all the
excipients used in formulation showed electronegative charge (Table 2). Figure 10
and Table S indicate that the pre-blend displayed an electropositive charge of + 1.269
nC/g prior to mixing. After 5 and 10 minutes of mixing, the charges on blend were
reduced to +0.884 nC/g and +0.917 nC/g, respectively. Magnesium stearate was
added at 1 % w/w to the pre-blend after 10 minutes of mixing in order to evaluate its
antistatic effect (Table S and Figure 10). After mixing for 1 minute with magnesium
stearate, the electrostatic charge on the pre-blend was reduced from +0.917 nC/g to
+0.834 nC/g. A net charge of +0.69S nC/g and +0.908 nC/g were recorded for blend
after 2 and 3 minutes of lubricant mixing. Thus the addition of magnesium stearate
showed an antistatic effect by reducing the net electropositive charges present on
cimetidine formulation. The maximum antistatic effect was observed after two
minutes of lubricant mixing.
In another experiment, Cab-0-Sil MS, a commonly used glidant was added to
cimetidine composition after 10 minutes of high shear mixing. The results were
presented in Table S and Figure 11. After mixing for 1 minute with Cab-0-Sil MS the
201
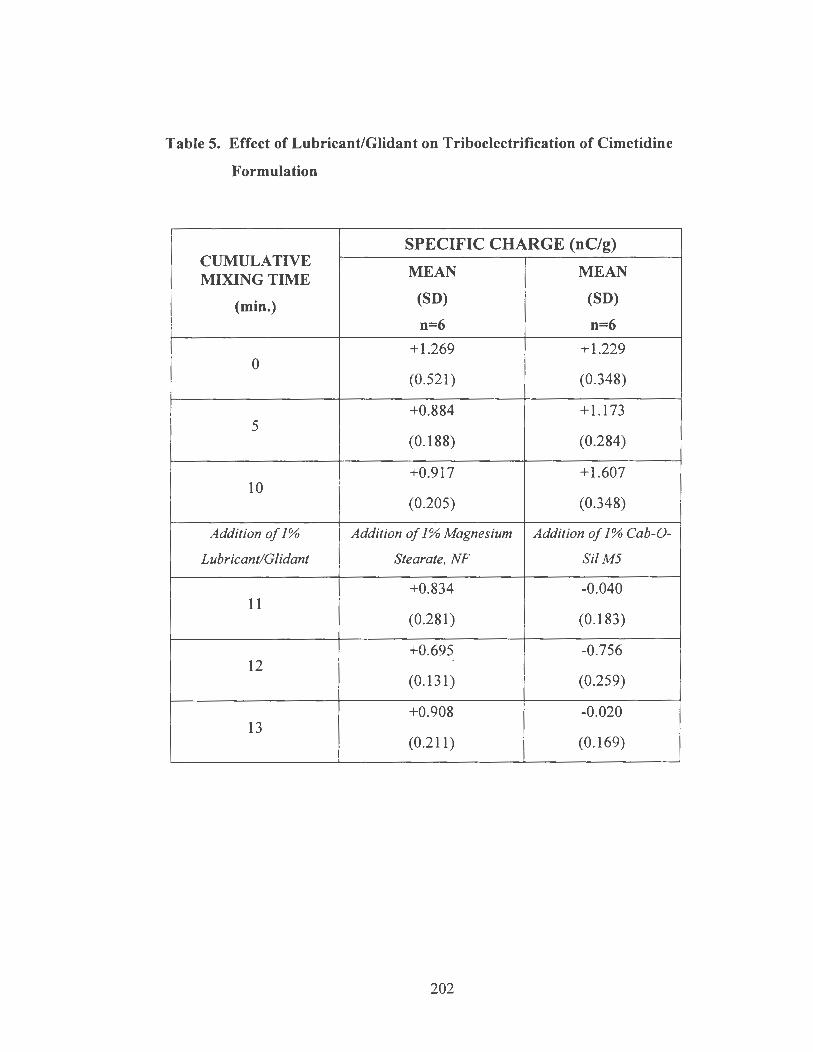
Table 5. Effect of Lubricant/Glidant on Triboelectrification of Cimetidine
Formulation
SPECIFIC CHARGE (nC/g) CUMULATIVE
MEAN MEAN MDCTNGTIME
(min.) (SD) (SD)
n=6 n=6
+1.269 +l.229 0
(0.521) (0.348)
+0.884 + 1.173 5
(0.188) (0.284)
+0.917 + 1.607 10
(0.205) (0.348)
Addition of 1% Addition of 1% Magnesium Addition of 1% Cab-0-
Lubricant/Glidant Stearate, NF Si/M5
+0.834 -0.040 11
(0.281) (0.183)
+0.695 -0.756 12
(0.131) (0.259)
+0.908 -0.020 13
(0.211) (0.169)
202
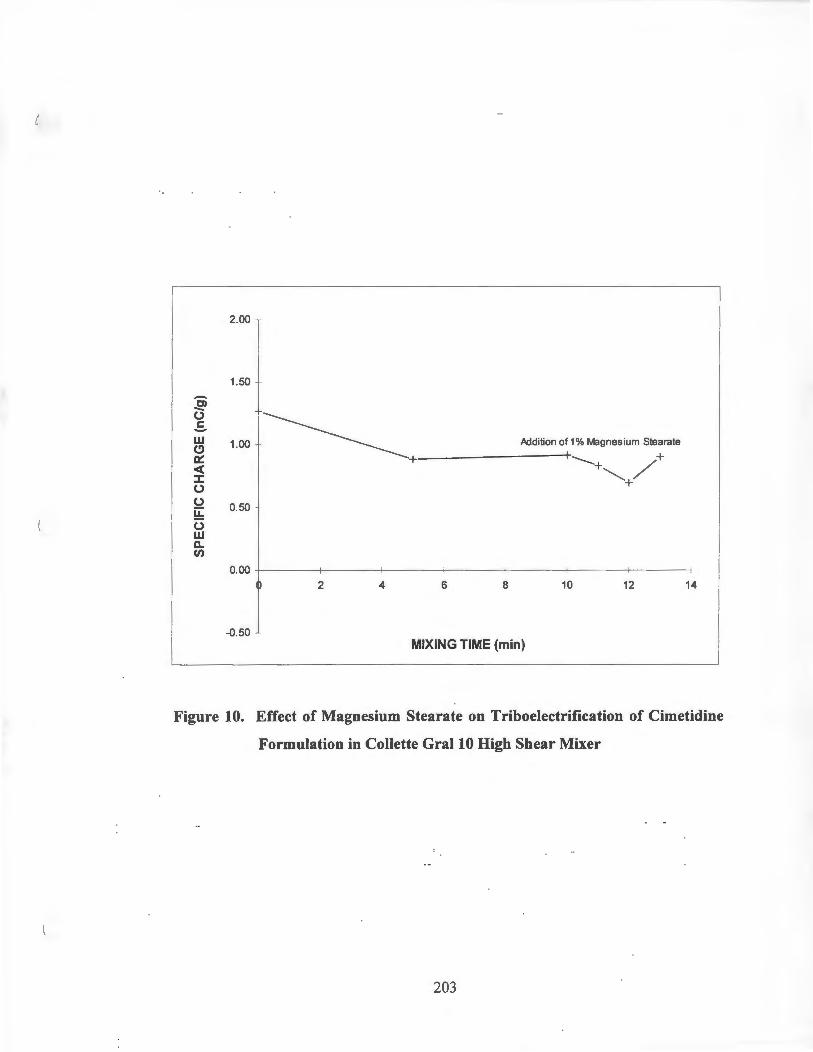
(
-.E> 0 .s w (!) a: < :::c 0
~ !:!:: 0 w n. CJ)
2.00 I 1.50
1.00 ~ Pddition of 1 % Magnesium Stearate ~+~~~~~~~~-- /+ +~
+
0.50
0.00 +-------l------+------1----1------1----_,__----l
~ 2 4 6 8 10 12 14
-0.50 MIXING TIME (min)
Figure 10. Effect of Magnesium Stearate on Triboelectrification of Cimetidine
Formulation in Collette Gral 10 High Shear Mixer
203
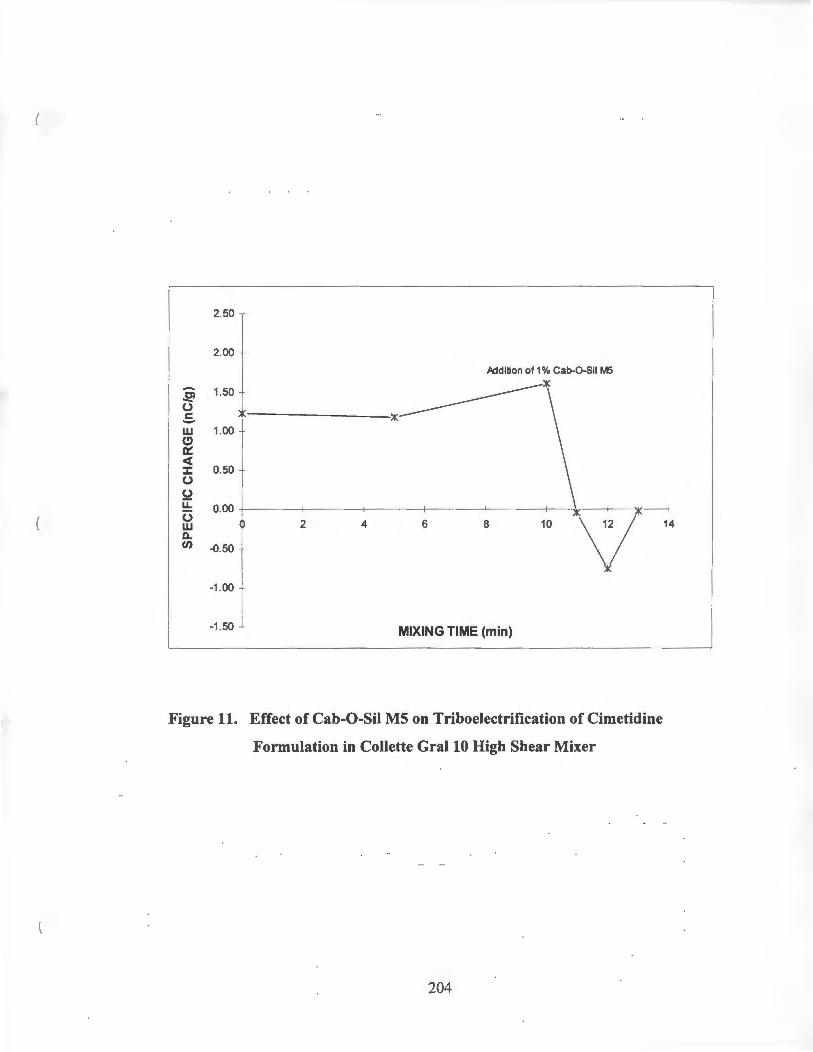
(
2.50
2.00
A::ldition of 1 % Cab-0-Sil M5
- 1.50 ~ u .s w 1.00 (!) 0::: < ::c 0.50 u 2 LL 0.00 u w a. (/) -0.50
-1.00
-1 .50 MIXING TIME (min)
Figure 11. Effect of Cab-0-Sil MS on Triboelectrification of Cimetidine
Formulation in Collette Gral 10 High Shear Mixer
204
( charge on cimetidine blend has been reduced from + 1.607 nC/g to -0.040 nC/g. The
charge was further reduced to -0.756 nC/g after mixing for an additional minute.
When the mixing was continued for a total of 3 minutes with the glidant, a net charge
of -0.020 nC/g was observed on cimetidine blend. Thus, when compared with
magnesium stearate, Cab-0-Sil M5 had a more substantial antistatic effect on the
positive charges present on the cimetidine blend. The addition of Cab-0-Sil M5
neutralized the electropositive nature of cimetidine formulation after one minute of
mixing. The antistatic effect seems to be optimum with two minutes of mixing.
There are many factors that contribute to the interaction of solids (12-14, 18-
22). The interaction between two particles 'is dependent upon the surface to interfacial
energy change that occurs when the solids come into contact. The surface energy of a
solid rarely is homogenous. Therefore, the energy change at the true areas of contact
will not be a single function of the true area of contact but will vary with the nature of
the exact portions of the two solid surfaces in contact. The area of true contact
between individual particles is dependent on the particle shape, size, distribution,
roughness, the compressive force at the interface, the shear to which the sample has
been subjected, and the mechanical properties of the particles. Most organic solids are
insulators. Unless their surface is made conducting by additives such as
lubricants/glidants, the solid particles will charge on contact. The resulting
electrostatic attractions may be large thereby affecting the powder flow and
compression operations.
205
(
(
Staniforth et al. (23-26) have demonstrated that contact and frictional
electrification can be used to develop surface charges on drug and excipient powders.
These surface charges can be optimized to facilitate the formation of ordered mixes
and to minimize their segregation tendency. The last contact surface for charge
measurement is critical as glass, plastic and brass behave differently for the same
material. It has been demonstrated that dry powders with similar charges are less
stable than those with dissimilar charges. Further drug-excipient blends with like
charges are less stable than those with opposite charges. Stability in this case implies a
tendency to segregate on standing.
The results obtained in the current study clearly indicate that the lubricants
have a higher anti-static effect on the negatively charged materials where as glidant
has a high anti-static effect on positively charged powders indicating that it is possible
to select formulation components so that final formulation is not prone to high static
charging.
Gold and Palermo (27) provides an interesting comparison of mechanisms
proposed for of tablet lubricants and antistatic agents. In manufacture of tablets, the
primary function of lubricants is to reduce the friction between the tablet-die wall
interface during tablet formation and ejection. The reduction in friction occurs by
mechanism of fluid and boundary lubrication. In fluid lubrication, the two surfaces are
separated by a finite layer of fluid lubricant. Boundary lubrication results from the
adherence of polar portions of molecules with long carbon chains to the metal
surfaces. Lubricants may also function to improve the flow characteristics of powder
blends and to prevent sticking to the punch faces.
206
(
( .
Antistatic agents function by reducing friction or by increasing conductance or
by both mechanisms. A material added to reduce friction may not be an efficient agent
for mitigating static accumulation, as the generation of static charges is thought to
arise from contact rather than friction. Surfaces may be made electrically conductive
by utilizing antistatic agents which have polar or hygroscopic properties.
207
( Effect of Mixer Type on Triboelectrification of Starch 1500:
The design and size of a mixing vessel has significant impact on generation of
electrostatic charges on powders as they affect the shearing forces that are applied on
particles (31-32). Generally, in blending of pharmaceutical materials, two types of
mixers are used in order to obtain homogeneous mixtures. These include high shear
mixers such as Collette Gral and low shear mixers such as V-blenders. The high shear
mixers are preferred due to their high process efficiencies as compared to the low
shear mixers. In the current study, two types of high shear mixers were evaluated for
their effect on triboelectrification process on Starch 1500. The two mixers evaluated
were: the Collette Gral 10 High Shear Mixer with a capacity of 7 liters and the Kitchen
Aid Planetary Mixer with a capacity of 2.5 liters. A batch size of 0.5 kg was used for
both mixers. For Collette Gral 10 High Shear Mixer, the speed settings for mixer
blade and chopper were set at 660 rpm and 3000 rpm respectively. For the Kitchen
Aid Planetary Mixer, the mixer blade was set at 94 rpm. The Starch 1500 powder was
mixed for a total period of 20 minutes in both mixers. Figure 12 and Table 6 show the
effect of mixer type on triboelectrification of Starch 1500 as a function of mixing time.
In both the mixers, Starch 1500 displayed electronegative behavior prior to initiation
of mixing process. As mixing progressed, in both mixers, the electronegative charges
present on Starch 1500 powder particles increased as a function of mixing time. In the
Kitchen Aid Planetary Mixer, the negative charges were increased from -0.615 nC/g
to -0.945 nC/g after 20 minutes of mixing (Table 6). In the Collette Gral 10 High
Shear Mixer, the negative charges present on Starch 1500 were increased from -0.186
nC/g to -1.023 nC/g after 20 minutes of mixing. As the data indicates, the Collette
208
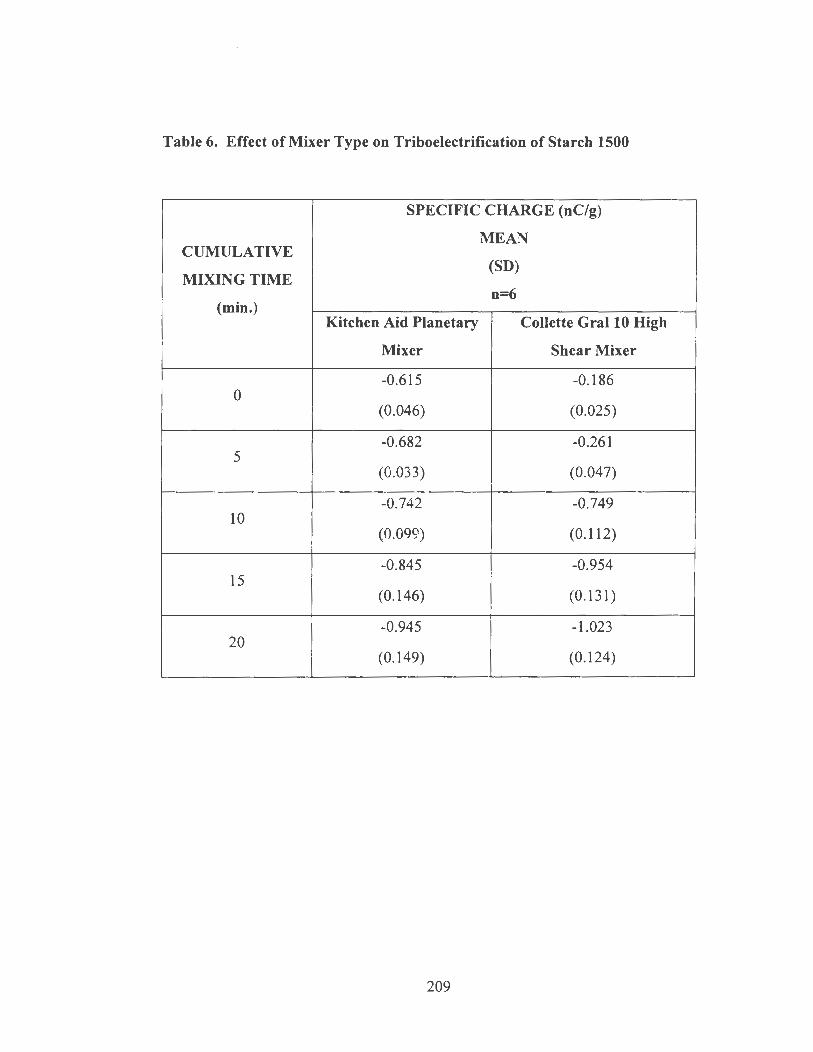
( Table 6. Effect of Mixer Type on Triboelectrification of Starch 1500
SPECIFIC CHARGE (nC/g)
MEAN CUMULATIVE
MIXING TIME (SD)
n=6 (min.)
Kitchen Aid Planetary Collette Gral 10 High
Mixer Shear Mixer
-0.615 -0.186 0
(0.046) (0.025)
-0.682 -0.261 5
(0.033) (0.047)
-0.742 -0.749 10
(0.099) (0.112)
-0.845 -0.954 15
(0.146) (0.131)
-0.945 -1.023 20
(0.149) (0.124)
209
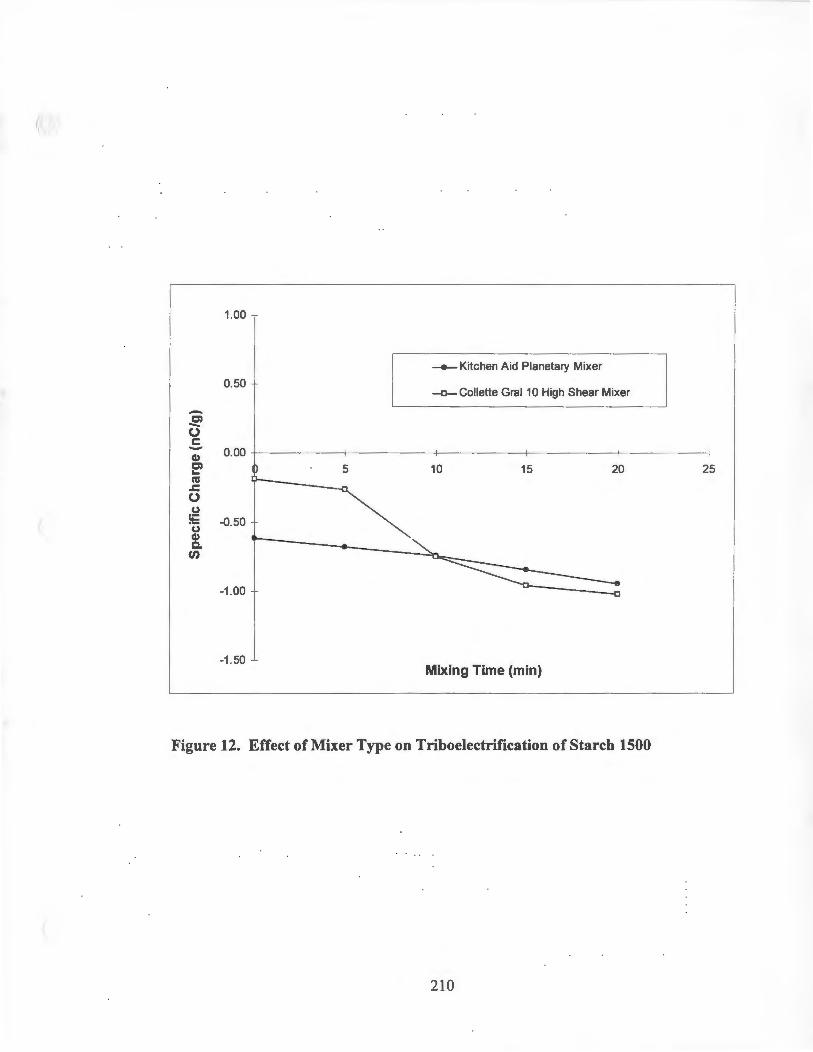
1.00
- Kitchen Aid Planetary Mixer
0.50 -0-Collette Gral 10 High Shear Mixer
-Cl -(J c: - 0.00 Q) Cl 5 10 15 20 25 .... ni
.s::.
~ 0 (.J
!E -0.50 (.J Q) Q. en
-1.00
-1.50 Mixing Time (min)
Figure 12. Effect of Mixer Type on Triboelectrification of Starch 1500
210
( Gral 10 High Shear Mixer had a more substantial effect on the electronegative nature
of Starch 1500 as compared to the Kitchen Aid Planetary Mixer. This is attributed to
the higher effective shear and higher efficiency of the Collette Gral 10 High Shear
Mixer as compared to the Kitchen Aid Planetary Mixer (Figure 12). The design of
Collette Gral 10 High Shear Mixer i.e. presence of two mixing blades as compared to
one present in Kitchen Aid Planetary Mixer and the larger size of the mixer also
contributed to increased particle-particle interactions resulting in generation of high
electrostatic charges.
. .
211
Effect of Batch Size on Triboelectrification of Starch 1500:
Batch size is a critical parameter in pharmaceutical processing as it affects
directly the efficiency of mixing operation (31-32). In order to evaluate the batch size
effect on triboelectrification of Starch 1500 in Collette Gral 10 High Shear Mixer,
batch sizes of 0.5 kg and 2.5 kg were investigated. For both batch sizes, the same
speed settings of mixer (660 rpm) and chopper (3000 rpm) were used and the batches
were mixed for a total of 20 minutes. As shown in Figure 13 and Table 7, the initial
charge found on Starch 1500 for both batches was electronegative. The charge for 0.5
kg batch increased from -0.186 nC/g to -1.023 nC/g after 20 minutes of mixing. For
2.5 kg batch, the negative charge was found to increase from -0.806 nC/g to -1.273
nC/g after 20 minutes of mixing. For both batch sizes, the negative charges seem to
increase as a function of mixing time. The triboelectrification observed for 0.5 kg
batch seems to be more profound as compared to the one seen for 2.5 kg batch. This
can be explained based on the fact that under same processing conditions, the 0.5 kg
batch received more shearing energy relative to mass of powder present in the mixer as
compared to the 2.5 kg batch. The 0.5 kg batch was fluidized more in the mixer vessel
due to large available area as compared to the bigger batch (2.5 kg). The high frequent
particle movement of powders could be the reason for the higher triboelectric effect
that was seen with the small batch size as compared to the large batch size. Thus the
triboelectrification of Starch 1500 due to high shear mixing decreased with an increase
in the batch size from 0.5 kg to 2.5 kg.
212
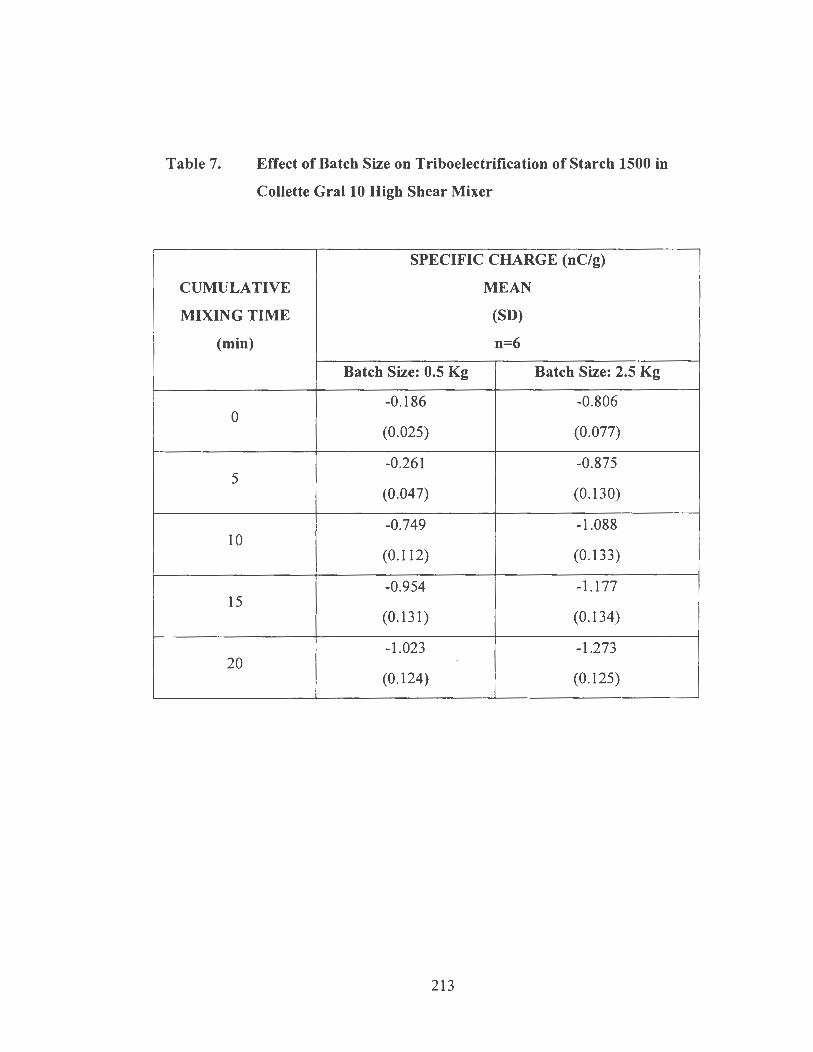
(
Table 7. Effect of Batch Size on Triboelectrification of Starch 1500 in
Collette Gral 10 High Shear Mixer
SPECIFIC CHARGE (nC/g)
CUMULATIVE MEAN
MIXING TIME (SD)
(min) n=6
Batch Size: 0.5 Kg Batch Size: 2.5 Kg
-0.186 -0.806 0
(0.025) (0.077)
-0.261 -0.875 5
(0.047) (0.130)
-0.749 -1.088 10
(0.112) (0.133)
-0.954 -1.177 15
(0.131) (0.134)
-1.023 -1.273 20
(0.124) (0.125)
213
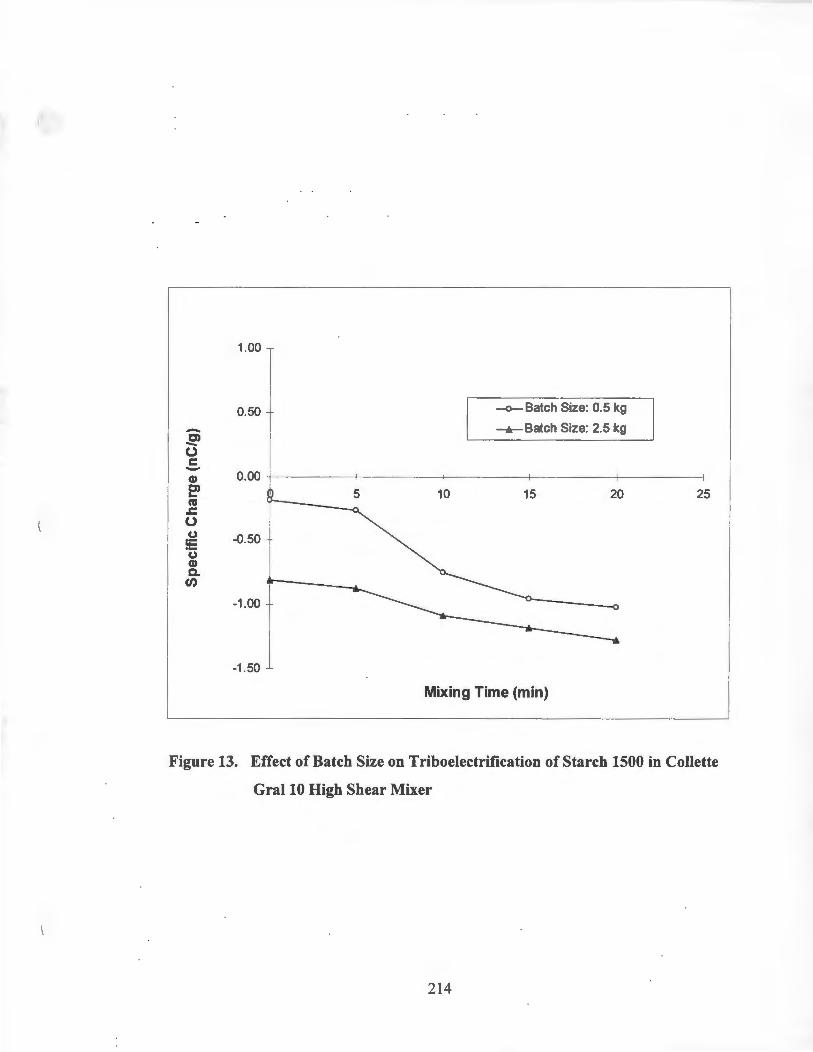
(
(
1.00
0.50 -o- Batch Size: 0.5 kg
- ---...- Batch Size: 2.5 kg C> -0 c: -Cl) 0.00 C> 5 10 15 20 25 .._ ns
.s::. 0 (.)
-0.50 !E (.) Cl) c. en
-1 .00
-1 .50
Mixing Time (min)
Figure 13. Effect of Batch Size on Triboelectrification of Starch 1500 in Collette
Gral 10 High Shear Mixer
214
( These preliminary findings showed significant differences m charging
propensity among drug and different excipient materials that have relevance in
formulation, manufacture and use. The results also illustrate the complexities and
difficulties when conducting charging experiments with different materials. As data in
Tables 2-7 indicate that there is a high degree of variation associated with electrostatic
measurements. These variations can be explained based on: complex and bi-polar
nature of triboelectrification process, chemical nature of test material, particle size and
shape, surface properties of test material, nature of last contact surface, contact area
and frequency, surface purity, relaxation nature, mode of charge decay, atmospheric
conditions such as . humidity, temperature, sampling plan, sample handling and
instrumental variation (6-9). The limitation of these measurements is the reliance on
the final net specific charge value (28-30). It will be useful to measure charge
continuously during triboelectrification process (2).
Though there is high variation in static measurements, the charging tendencies
in the materials investigated clearly provide useful information that can be utilized in
selecting formulation components. It has been demonstrated in this study that by
measurement of static charges present on drugs/excipients during developmental stage,
triboelectrification can be used to obtain stable blends that have low segregation
tendencies. Results also indicated that choice of process equipment such as type of
mixer, processing conditions such as mixing time and batch size play significant role
in electrostatic charging.
215
(' CONCLUSIONS
When evaluated individually, cimetidine displayed electropositive charge
whereas all other excipients displayed electronegative charges. Cab-0-Sil MS was
found to be the most electronegative whereas stearic acid was found to be the least
electronegative among excipients studied. The dry mixing of A vicel® PH 101 and
Starch l SOO in a Collette Oral 10 High Shear Mixer caused an increase in the
electronegative charges probably due to the frictional and shearing forces, modified
particle behavior such as particle size reduction and increased particle-particle
interactions. Four excipients namely, magnesium stearate, sodium stearyl fumarate
(Pruv®), stearic acid and colloidal silicon dioxide (Cab-0-Sil MS) were evaluated for
antistatic effects.
Addition of magnesium stearate to Starch lSOO and Avicel® PH101 after 10
minutes of high shear mixing resulted in neutralization of electrostatic charges present
on the powder particles. Pruv neutralized the negative electrostatic charges more on
Starch lSOO particles as compared to Avicel® PH101. The antistatic effect of stearic
acid is more profound on Avicel® PHlOl as compared to Starch lSOO. Addition of
Cab-0-Sil MS caused an increase in the electronegative charges of both Avicel®
PH 101 and Starch 1 SOO. As the mixing time with lubricants/glidants increased from 1
minute to 3 minutes, the antistatic effect seems to reduce. Based on this study, when
A vicel® PH 101 was blended with 1 % lubricant/glidant in a Collette Gral 10 High
Shear Mixer, the additives can be arranged as follows in the decreasing order of their
ability to reduce the static charges produced during the blending process: magnesium
216
( stearate > Pruv® > stearic acid> Cab-0-Sil M5. When Starch 1500 was blended with
1 % lubricant/glidant in a Collette Gral 10 High Shear Mixer, the antistatic
effectiveness of additives can be arranged in the decreasing order as: magnesmm
stearate > stearic acid> Pruv® > Cab-0-Sil M5.
The cimetidine tablet formulation containing electropositive active ingredient
( cimetidine, USP) and four electronegative excipients: Avicel® PHI 01, Starch 1500,
anhydrous lactose and lubricant/glidant in the ratio of 69: 10: 10: 10: 1 was evaluated for
electrostatic measurements. Mixing for 10 minutes a high shear mixer without
lubricant/glidant did not neutralize the charges present on powder particles. But
addition of 1 % Cab-0-Sil M5 significantly reduced the positive charges present on the
cimetidine blend and neutralizrd the charges after two minutes of mixing. Magnesium
Stearate showed marginal reduction of elcctropositive charges present on the
cimetidine powder blend.
The mixer design and size play critical role in determining the homogeneity of
blends in pharmaceutical processing. In the current study, two types of mixers:
Collette Gral 10 High Shear Mixer (capacity-7 liters) and Kitchen Aid Planetary Mixer
( capacity-2.5 liters) were evaluated for triboelectrification of Starch 1500. Mixing of
Starch 1500 in the Collette Gral 10 High Shear Mixer resulted in generation of more
electronegative charges as compared to the mixing in the Kitchen Aid Planetary
Mixer. This is attributed to the higher effective shear and higher efficiency of the
Collette Gral 10 High Shear Mixer as compared to the Kitchen Aid Planetary Mixer.
In both cases, the increased mixing time resulted in increased electrostatic charges.
217
( In order to evaluate the batch size effect on electrostatic charging of Starch
1500 in a high shear mixer, two batch sizes of 0.5 kg and 2.5 kg were investigated.
The triboelectrification of Starch 1500 due to high shear mixing decreased with an
increase in the batch size from 0.5 kg to 2.5 kg. The larger and more frequent particle
movement of powders could be the reason for high triboelectric effect that was seen
with the small batch size as compared to the large batch size.
These preliminary findings showed that significant differences in charging
propensities existed among drug and different excipient materials. The charging
tendencies in the materials investigated clearly provide useful information that can
utilized in selecting formulation components prior to development. By measuring
static charges present on drngs/excipients during developmental stage, formulation
scientist can utilize triboelectrification process to obtain powder blends that have low
segregation.
Since there are numerous factors that may affect the triboelectrification process
and further investigations are warranted to fully understand its mechanism. Results
from this study will enable further detailed investigations of triboelectrification of
powders to be undertaken which will definitely aid the formulation scientists in
formulating a stable and desired product.
218
(
(
REFERENCES
1. Bailey, A. G. Electrostatic phenomena during powder handling. Powder
Technology, 37: 71-85 (1984).
2. Dechene, R. L. and Averdieck, W. J. Triboelectricity: A parameter for solids flow
measurement. Powder and Bulk Engineering, 11-13, June 1987.
3. Lachman. L. and Lin. S. N., Electrostatic characteristics of pharmaceutical solids
and packaging materials I: Design of testing equipment and preliminary findings .
Journal of Pharmaceutical Sciences, 57 (3): 504-510 (1968).
4. Gajewski, J. Charge measurement of dust particles in motion. Part II. Journal of
Electrostatics, 15: 67-69 (1984).
5. Kittaka, Masui and Murata. A method for measuring the charging tendency of
powders in pneumatic conveyance through metal pipes. Journal of Electrostatics,
6 (1979).
6. Bailey, A. G. Charging of solids and powders. Journal of Electrostatics, 30: 167-
180 (1993).
7. Kulvanich, P. and Stewart, P. J. Influence of relative humidity on adhesive
properties of a model interactive system. Journal of Pharmacy and Pharmacology,
40: 453-458 (1988).
8. Kulvanich, P. and Stewart, P. J. An evaluation of the air stream Faraday cage in the
electrostatic charge measurement of interactive drug systems. International
Journal of Pharmaceutics, 36: 243-252 (1987).
219
9. Jashnani, R. N. , Byron, P. R. and Dalby, R. N. Tetsing of dry powder aerosol
formulations in different environmental conditions. International Journal of
Pharmaceutics, 113: 125-130 (1995).
10. Peart, J., Staniforth, J. N. and Meakin, B. J. Electrostatic charge interactions in
pharmaceutical dry powder aerosols. Instrumental Physics Conference Series, No.
143: 271-274 (1995).
11. Secker, E. and Chubb, J. N. Instrumentation for electrostatic measurements
Journal of Electrostatics, 16: 1-19 (1984).
12. Hiestand, E. N. Powders: Particle-particle interactions. Journal of Pharmaceutical
Sciences, 55(12):1325-1344 (1966).
13. Hartley, P. A., Parfitt, G. D. ,.and Pollack, L. B. The role of the Van der Waals
force in the agglomeration of powders containing subrnicron particles. Powder
Technology, 42: 35-46 (1985).
14. Buckton, G. The estimation and application of surface energy data for powdered
systems. Drug Development and Industrial Pharmacy, 18: 1149-1167 (1992).
15 . Johansson, M. E. Investigations of mixing time dependence of the lubricating
properties of granular and powdered magnesium stearate. Acta Pharmaceutica
Suec 22: 343-350 (1985).
16. Ragnarsson, G. , Holzer, A. W., and Sjogren, J. The influence of mixing time and
colloidal silica on the lubricating properties of magnesium stearate. International
Journal of Pharmaceutics, 3: 127-131 (1979).
17. Khan, K. A. , Musikabhurnma, P. and Rubinstein, M. H. The effect of mixing time
of magnesium stearate on the tabletting properties of dried microcrystalline
cellulose. Pharmaceutica Acta Helvetiae , 58: 109-111 (1983).
220
(
(
18. Johnson, M. C. R. The effect of particle size upon mixture homogeneity.
Pharmaceutica Acta Helvetiae , 50 (3): 60-63 (1975).
19. Williams, J. C. and Khan, M. I. The mixing and segregation of particulate solids of
different particle size. The Chemical Engineer, January, 19-25 (1973).
20. Otsuka, A. , Iida, K., Danjo, K. and Sunada, H. Measurement of adhesive force
between particles. III. Effect of particle shape and surface asperity. Chemical
Pharmaceutical Bulletin, 36: 741-749 (1988).
21. Wong, L. W. and Pilpel, N. The effect of shape of fine particles on the formulation
of ordered mixtures. Journal of Pharmacy and Pharmacology, 40: 567-568 (1988).
22. Shotton, E. J. and Harb, N. The effect of humidity and temperature on the cohesion
of powders. Journal of Pharmacy and Pharmacology, 18: 175-178 (1966).
23. Staniforth, J. N .. and Rees, J. E. Electrostatic charge interactions in ordered powder
mixes. Journal of Pharmacy and Pharmacology, 34: 69-76 (1982).
24. Staniforth, J. N. and Rees, J. E. Powder mixing by triboelectrification. Powder
Technology, 30: 255-256 (1981 ).
25 . Staniforth, J. N. and Rees, J. E. Effect of vibration time, frequency and
acceleration on drug content uniformity. Journal of Pharmacy and Pharmacology,
34: 700-706 (1981).
26. Staniforth, J. N. The effect of frictional charges on flow properties of direct
compression tableting excipients. International Journal of Pharmaceutics, 11:
109-117 (1982).
27. Gold, G. and Palermo, B. T. Hopper flow characteristics of tabletting material II.
Tablet lubricants. Journal of Pharmaceutical Sciences, 54 (10): 1517-1519 (1965).
221
(
(
28. Carter, P. A., Rowley, G., Fletcher, E. J. and Stylianopoulos, V. Measurement of
electrostatic charge decay in pharmaceutical powders and polymer materials used
in dry powder inhaler devices. Drug Development and Industrial Pharmacy, 24
(11): 1083-1088 (1998).
29. Carter, P. A., Rowley, G., Fletcher, E. J. and Hill, E. A. An experimental
investigation of triboelectrification in cohesive and non-cohesive pharmaceutical
powders. Drug Development and Industrial Pharmacy, 18 (14): 1505-1526 (1992).
30. Lopez, J. M. and Peleg, M. Linearization of electrostatic charge and charge decay
curves of powders. Ibid., 42: 217-223 (1985).
31. Hersey, J. A., Cook, P., Smyth, M., Bishop, E. A. and Clarke, E. A. Homogeneity
of multicomponent powder mixtures. Journal of Pharmaceutical Sciences, 63(3):
408-411 (1974).
32. Fuller, W. 0. Mixing up a batch: Batch mixer types and selection tips. Powder and
Bulk Engineering, January, 48-66 (1998).
222
( BIBLIOGRAPHY
Abouzied, A. Z. M. and Fuerstenau, D. W. Effect of mixing aids on the transport
behavior of particulate solids. Powder Technology, 23: 261-271 (1979).
Amidon, G. E and Houghton, M. E. The effect of moisture on the mechanical and
powder flow properties of microcrystalline cellulose. Pharmaceutical Research,
12: 923-929 (1995).
Amidon, G. E. and Houghton, M. E. Powder flow testing in preformulation and
formulation development. Pharmaceutical Manufacturing, July, 21-31 (1985).
Amidon, G. E. Physical and mechanical property characterization of powders. In
Brittain, H.G. (Ed.), Physical Characterization of Pharmaceutical Solids, Marcel
Dekker, Inc., New York, 2~1-319 (1995).
Andres, C., Ndiaye, A., Thomas, C., Tromelin, A., Chaillot, B. and Pourcelot, Y.
Influence of the paran1eters molecular structure and granularity on the
compactibility of a powder. Drug Development and Industrial Pharmacy, 21(16):
1875-1885 (1995).
Armstrong, N. A. and Palfrey, L. P. The effect of machine speed on the
consolidation of four directly compressible tablet diluents. Journal of Pharmacy
and Pharmacology, 41: 149-151 (1989).
Armstrong, N. A. Considerations of compression speed in tablet manufacture.
Pharmaceutical Technology, 14 (9): 106-116 (1990).
Asano, T., Tsubuku, S., Sugawara, S. , Miyajima, M., Sato, H., Yuasa, H. and
Kanaya, Y. Changes in volume and compression energy upon compression of
calcium silicate tablets. Drug Development and Industrial Pharmacy, 23 (7): 679-
685 (1997).
223
( Bailey, A. G. Charging of solids and powders. Journal of Electrostatics, 30: 167-
180 (1993).
Bailey, A. G. Electrostatic phenomena during powder handling. Powder
Technology, 37: 71-85 (1984).
Bodmeier, R. Tableting of coated pellets. European Journal of Pharmaceutics and
Biopharmaceutics, 43: 1-8 (1997).
Bolhuis, G. K. and Chowan, Z. T. Materials for direct compaction, In
Pharmaceutical Powder Compaction Technology, Alderbom,G. and Nystrom C.
(Eds.), Marcel Dekker, Inc. , New York, 419-500 (1996).
Bolhuis, G. K.; Zuurman, K. Tableting properties of experimental and
commercially available lactose granulations for direct compression. Drug
Development and Industrial Pharmacy, 21 (18): 2057-2071 (1995).
Buckton, G. The estimation and application of surface energy data for powdered
systems. Drug Development and Industrial Pharmacy, 18: 1149-1167 (1992).
Buslik, D. A proposed universal homogeneity and mixing index. Powder
Technology, 1: 111-116 (1973).
Carr, R. L. Classifying flow properties of solids. Chemical Engineering, 12: 69
(1965).
Carr, R. L. Evaluating flow properties of solids. Chemical Engineering, 72: 163-
168 (1965).
Carr, R. L. Particle behavior storage and flow. British Journal of Chemical
Engineering, 15: 1541 (1970).
Carson J. W. and Marinelli, J. Characterize bulk solids to ensure smooth flow.
Chemical Engineering, April, 78-90 (1994).
224
( Carter, P. A. , Rowley, G. , Fletcher, E. J. and Hill, E. A. An experimental
investigation of triboelectrification in cohesive and non-cohesive pharmaceutical
powders. Drug Development and Industrial Pharmacy, 18 (14): 1505-1526 (1992).
Carter, P. A. , Rowley, G., Fletcher, E. J. and Stylianopoulos, V. Measurement of
electrostatic charge decay in pharmaceutical powders and polymer materials used
in dry powder inhaler devices. Drug Development and Industrial Pharmacy, 24
(11 ): 1083-1088 (1998).
Celik, M. and Okutgen, E. Feasibility study for the development of a prospective
compaction functionality test and the establishment of a compaction data bank.
Drug Development and Industrial Pharmacy, 19 (17-18): 2309-2334 (1993).
Celik, M. The past, present and future of tableting technology. Drug Development
and Industrial Pharmacy, 22 (1 ): 1-10 (1996).
Chowhan, Z. T. and Chi, L. Drug-excipient interactions resulting from powder
mixing III: Solid state properties and their effect on drug dissolution. Journal of
Pharmaceutical Sciences, 75(6): 534-541 (1986).
Chowhan, Z. T. Segregation of particulate solids-Part I. Pharmaceutical
Technology, 19: 56-70 (1995).
Chowhan, Z. T. Segregation of particulate solids-Part II Pharmaceutical
Technology, 19: 80-94 (1995).
Cooke, M. H., Stephens, D. J. and Bridgwater, J. Powder mixing- A literature
survey. Powder Technology, 15: 1-20 (1976).
David, S. T. and Augusburger, L. L. Plastic flow during compression of directly
compressible fillers and its effects on tablet strength. Journal of Pharmaceutical
Sciences, 66:155-159 (1977).
225
( de Villiers, M. M. Description of the kinetics of the deagglomeration of drug
particle agglomerates during powder mixing. International Journal of
Pharmaceutics, 151:1-6 (1997).
Dechene, R. L. and Averdieck, W. J. Triboelectricity: A parameter for solids flow
measurement. Powder and Bulk Engineering, 11-13, June 1987.
Delacourte, A., Guyot, J. C., Colombo, P. and Catellani, P. L. Effectiveness of
lubricants and lubrication mechanism in tablet technology. Drug Development and
Industrial Pharmacy, 21 (19): 2187-2199 (1995).
Design-Expert®, Version 6.0, Stat-Ease, Inc., MN, USA.
Doldan, C., Souto, C., Concheiro, A., Martinez-Pacheco, R. and Gomez-Amoza, J.
L. Dicalcium phosphate dihydrate and anhydrous dicalcium phosphate for direct
compression: A comparative study. International Journal of Pharmaceutics, 124:
69-74(1995).
Duberg, M. and Nystrom, C. Studies on direct compression of tablets. VI.
Evaluation of methods for the estimation of particle fragmentation during
compaction. Acta Pharmaceutica Suec, 19 (6): 421-436 (1982).
Ferrari, F., Bertoni, M., Bonferoni, M. C., Rossi, S., Caramella, C. and Nystrom,
C. Investigation on bonding and disintegration properties of pharmaceutical
materials. International Journal of Pharmaceutics 136: 71 - 79 (1996).
Fuller, W. 0 . Mixing up a batch: Batch mixer types and selection tips. Powder and
Bulk Engineering, January, 48-66 ( 1998).
Gajewski, J. Charge measurement of dust particles in motion. Part II. Journal of
Electrostatics, 15: 67-69 (1984).
Garcia, T., Elsheimer, B., Tarczynski, F. Examination of components of variance
for a production scale, low dose powder blend and resulting tablets . Drug
Development and Industrial Pharmacy, 21 (18): 2035-2045 (1995).
226
(
(
Gold, G. and Palermo, B. T. Hopper flow characteristics of tabletting material II.
Tablet lubricants. Journal of Pharmaceutical Sciences, 54 (10): 1517-1519 (1965).
Gorman, J. W. and Hinman, J. E. Simplex lattice designs for multicomponent
systems. Technometrics, 4: 463-487 (1962).
Hartley, P. A., Parfitt, G. D. , and Pollack, L. B. The role of the Van der Waals
force in the agglomeration of powders containing submicron particles. Powder
Technology, 42: 35-46 (1985).
Heckel, R. W. Density-pressure relationships m powder compaction. Trans
Metallurgy Society, AIME, 221:671-675 (1961).
Hersey, J. A., Cook, P., Smyth, M., Bishop, E. A. and Clarke, E. A. Homogeneity
of multicomponent powder mixtures. Journal of Pharmaceutical Sciences, 63(3):
408-411 (1974).
Hersey, J. A., Rees, J. E. and_ Cole, E. T. Density changes in lactose tablets.
Journal of Pharmaceutical Sciences, 62: 2060 (1973).
Hiestand, E. N. Powders: Particle-particle interactions. Journal of Pharmaceutical
Sciences, 55(12): 1325-1344 (1966).
Hsu, S. H.; Tsai, T. R.; Chuo, W. H. anq Cham, T. M. Evaluation of Era-tab as a
direct compression excipient. Drug Development and Industrial Pharmacy, 23 (7):
711-716 (1997).
Jashnani, R. N., Byron, P. R. and Dalby, R. N. Tetsing of dry powder aerosol
formulations in different environmental conditions. International Journal of
Pharmaceutics, 113: 125-130 (1995).
Jetzer, W., Leuenberger, and Sucker, H. Compressibility and compactability of
powder mixtures. Pharmaceutical Technology 7(11): 33-48 (1983).
227
( Johanson, J. R. Predicting segregation of bimodal particle mixtures using the flow
properties of bulk solids. Pharmaceutical Technology, 20: 46-57 (1996).
Johansson, M. E. Investigations of mixing time dependence of the lubricating
properties of granular and powdered magnesium stearate. Acta Pharmaceutica
Suec 22: 343-350 (1985).
Johnson, M. C. R. The effect of particle size upon mixture homogeneity.
Pharmaceutica Acta Helvetiae, 50 (3): 60-63 (1975).
Juppo, A. M., Kervinen, L., Yliruusi, J. and Eristofferson, E. Compression of
lactose, glucose, and mannitol granules. Journal of Pharmacy and Pharmacology,
47: 543-549 (1995).
Karehill, P.G., Glazer, M. and Nystrom C. Studies on direct compression of
tablets. XXXIII. The importance of surface roughness for the compactibility of
some directly compressible materials with different bonding and volume reduction
properties. International Journal ·of Pharmaceutics, 64: 35-43 (1990).
Katikaneni, P. R., Upadrashta, S. M., Rawlings, C. E., Neau, S. H. and Hileman G.
A. Consolidation of ethylcellulose: effect of particle size, press speed, and
lubricants. International Journal of Pharmaceutics, 117: 13-21 (1995).
Kawakita, K. and Ludde, K. H. Some considerations on powder compression
equations. Powder Technology, 4 (2): 61-68 (1971).
Khan, K. A., Musikabhumrna, P. and Rubinstein, M. H. The effect of mixing time
of magnesium stearate on the tabletting properties of dried microcrystalline
cellulose. Pharmaceutica Acta Helvetiae , 58: 109-111 (1983).
Kittaka, Masui and Murata. A method for measuring the charging tendency of
powders in pneumatic conveyance through metal pipes. Journal of Electrostatics,
6(1979).
228
(
I
\
Konkel, P. and Mielck, J. B. A compaction study of directly compressible vitamin
preparations for the development of a chewable tablet: Part I" Pharmaceutical
Technology. 16 (3): 138-146 (1992).
Kulvanich, P. and Stewart, P. J. An evaluation of the air stream Faraday cage in
the electrostatic charge measurement of interactive drug systems. International
Journal of Pharmaceutics, 36: 243-252 (1987).
Kulvanich, P. and Stewart, P. J. Influence of relative humidity on adhesive
properties of a model interactive system. Journal of Pharmacy and Pharmacology,
40: 453-458 (1988).
Kumar, V., Sunder, N. and Potdar, A. Critical factors in developing
pharmaceutical formulations - An overview, Part I. Pharmaceutical Technology,
16: 94-102 (1992).
Kumar, V. , Sunder, N. and Potdar, A. Critical factors in developing
pharmaceutical formulations - An overview, Part II. Pharmaceutical Technology,
16: 86-92 (1992).
Lachman. L. and Lin. S. N. , Electrostatic characteristics of pharmaceutical solids
and packaging materials I: Design of testing equipment and preliminary findings.
Journal of Pharmaceutical Sciences, 57 (3): 504-510 (1968).
Lopez, J. M. and Peleg, M. Linearization of electrostatic charge and charge decay
curves of powders. Ibid., 42: 217-223 (1985).
Luangtana-Anan, M. and Fell, J. T. Bonding mechanisms m tableting.
International Journal of Pharmaceutics, 60: 197-202 ( 1990).
Nokhodchi, A., Rubinstein, M. H., Larhrib, H. and Guyot, J. C. The effect of
moisture content on the energies involved in the compaction of ibuprofen
International Journal of Pharmaceutics, 120: 13-20 (1995).
229
(
Otsuka, A., Iida, K., Danjo, K. and Sunada, H. Measurement of adhesive force
between particles. III. Effect of particle shape and surface asperity. Chemical
Pharmaceutical Bulletin, 36: 741-749 (1988).
Paronen, P. and Ilkka, J. Pressure-porosity functions . In Pharmaceutical Powder
Compaction Technology, Alderborn,G. and Nystrom C. (Eds.), Marcel Dekker,
Inc., New York, 55-75 (1996).
Peart, J. , Staniforth, J. N. and Meakin, B. J. Electrostatic charge interactions in
pharmaceutical dry powder aerosols. Instrumental Physics Conference Series, No.
143: 271-274 (1995).
Pilpel, N.; Igwilo, C. I. and Malamataris, S. Effects of molecular coatings on the
compression and tableting of some pharmaceutical powders. International Journal
of Pharmaceutics, 68: 157-166 (1991).
Pilpel, S. and Esezobo, S. Effects of applied load and particle size on the
plastoelasticity and tablet strength of some directly compressible powders. Journal
of Pharmacy and Pharmacology, 39: 303 - 304 (1987).
Ragnarsson, G. , Holzer, A. W. , and Sjogren, J. The influence of mixing time and
colloidal silica on the lubricating properties of magnesium stearate. International
Journal of Pharmaceutics, 3: 127-131 (1979).
Ragnarsson, G., Holzer, A. W. , and Sjogren, J. The influence of mixing time and
colloidal silica on the lubricating properties of magnesium stearate. International
Journal of Pharmaceutics, 3: 127-131 (1979).
Rizk, S. , Guyot, J.C. , Duru, C. and Gaudy, D. Influence of lubricant properties on
compression behavior and drug dissolution rate of scleroglucan hydrophilic
matrix. International Journal of Pharmaceutics, 126: 57-63(1995).
Rue, J. and Rees, J. E. Limitations of the Heckel relation for predicting powder
compaction mechanisms. Journal of Pharmacy and Pharmacology, 30: 642-643
(1978).
230
(
I
Scheffe, H. Experiments with mixtures. Journal of Royal Statistical Society, B20:
344-360 (1958).
Scheffe, H. The simplex-centroid design for experiments with mixtures. Journal of
Royal Statistical Society, B25: 235-263 (1963).
Schmidt, P. C. and Vogel, P. J. Force-time curves of a modem rotary tablet
machine: II. Influence of compression force and tableting speed on the
deformation mechanisms of pharmaceutical substances. Drug Development and
Industrial Pharmacy, 19 (15): 1917-1930 (1993).
Schmidt, P. C. and Vogel, P. J. Force-time curves of a modem rotary tablet
machine: I. Evaluation techniques and characterization of deformation behavior of
pharmaceutical substances. Drug Development and Industrial Pharmacy, 20 (5):
921-934 (1994).
Schmidt, P. C. Tableting characteristics of sorbitol. Pharmaceutical Technology, 7
(11):65-72 (1983).
Schwartz, J. B. and O'Connor, R. E. Optimization techniques in pharmaceutical
formulation and processing. In Banker, G.S. and Rhodes, C.T. (Eds.), Modern
Pharmaceutics, 3rd Edition, Marcel Dekker, Inc., New York, 727-772 (1996).
Secker, E. and Chubb, J. N. Instrumentation for electrostatic measurements
Journal of Electrostatics, 16: 1-19 (1984).
Shangraw, R. F. and Demarest, D. A. Survey of current industrial practices in the
formulation and manufacture of tablets and capsules. Pharmaceutical Technology,
17 (1): 32-44 (1993).
Sheskey, P. J. and Dasbach, T. P. Evaluation of various polymers as dry binders in
the preparation of an immediate release tablet formulation by roller compaction.
Pharmaceutical Technology, 19: 98-112 (1995).
231
\
Shotton, E. J. and Harb, N. The effect of humidity and temperature on the cohesion
of powders. Journal of Pharmacy and Pharmacology, 18: 175-178 (1966).
Sindel, U., Schweiger, A. and Zimmermann, I. Determination of the optimum
mixing time for a mixture of lactose and colloidal silicon dioxide. Journal of
Pharmaceutical Sciences, 87 ( 4): 524-526 (1998).
Spendley, W., Hext, G. R. and Hinsworth, F. R. Sequential application of simplex
designs in optimization and evolutionary operation. Technometrics, 4: 441-461
(1962).
Stamm, A. Process and dosage form controls: Formulation factors . Drug
Development and Industrial Pharmacy, 15: 965-974 (1989).
Staniforth, J. N. and Rees, J. E. Effect of vibration time, frequency and
acceleration on drug content uniformity. Journal of Pharmacy and Pharmacology,
34: 700-706 (1981).
Staniforth, J. N. and Ree8, J.E. Electrostatic charge interactions in ordered powder
mixes. Journal of Pharmacy and Pharmacology, 34: 69-76 (1982).
Staniforth, J. N. and Rees, J. E. Powder mixing by triboelectrification. Powder
Technology, 30: 255-256 (1981).
Staniforth, J. N. The effect of frictional charges on flow properties of direct
compression tableting excipients. International Journal of Pharmaceutics, 11 :
109-117 ( 1982).
Staniforth, P. T. and Berry, R. E. R. A general flowability index for powders,
Powder Technology, 8: 243 (1973).
Statgraphics®Plus for Windows, Version 2.0, Manugistics, Inc., Rockville,
Maryland, USA.
232
(
(
Stetsko, G. Statistical experimental design and its application to pharmaceutical
development problems. Drug Development and Industrial Pharmacy, 12: 1109-
1123 (1986).
Torrado, J. J. and Augsburger, L. L. Effect of different excipients on the tableting
of coated particles. International Journal of Pharmaceutics, 106: 149-155 (1994).
Udeala, 0 . K. , Chukwu, A."Compaction behavior of Musol: A new direct
compression vehicle. Drug Development and Industrial Pharmacy, 15 (4): 533-
548 (1989).
Vachon, M. G. and Chulia, D. The use of particle characteristics to elucidate mix
homogeneity in binary powder blends. Drug Development and Industrial
Pharmacy, 24(10): 961-971 (1998).
Velasco, M. V.~ Munoz-Ruiz, A., Monedero, M. C. and Jimenez-Castellanos, M.
R. Study of flowability of powders. Effect of the addition of lubricants. Drug
Development and Industrial Pharmacy, 21(20): 2385-2391 (1995).
Velasco, V., Munoz-Ruiz, A., Mondero, C. and Jimenez-Castellanos, R. Force
displacement parameters of maltodextrins after the addition of lubricants
International Journal of Pharmaceutics, 152: 111-120 (1997).
Waters, A. J. Solving flow problems: How to select a bin retrofit. Powder and
Bulk Engineering, November, 45-55 (1997).
Wikberg, M. and Alderbom, G. Compression characteristics of granulated
materials. III. The relationship between air permeability and mechanical strength
of tablets of some lactose granulations. International Journal of Pharmaceutics,
63: 23-27 (1990).
Williams, J. C. and Khan, M. I. The mixing and segregation of particulate solids of
different particle size. The Chemical Engineer, January, 19-25 (1973).
233
(
(
Wong, L. W. and Pilpel, N. The effect of shape of fine particles on the formulation
of ordered mixtures. Journal of Pharmacy and Pharmacology, 40: 567-568 (1988).
York, P. A consideration of experimental variables in the analysis of powder
compaction behaviour. Journal of Pharmacy and Pharmacology, 31(4): 244-246
(1979).
York, P. and Pilpel, N. The tensile strength and compression behavior of lactose,
four fatty acids, and their mixtures in relation to tableting. Journal of Pharmacy
and Pharmacology, 25 (Supplement):lP-1 lP (1973).
Zuurman, G. K. Bolhuis and H. Vromans. Effect of binder on the relationship
between bulk density and compactibility of lactose granulations. International
Journal of Pharmaceutics, 119: 65-69 (1995).
Zuurman, K., Riepma, K. A., Bolhuis, G.K. , Vromans, H. and Lerk, C.F. The
relationship between bulk density and compactibility of lactose granulations.
International Journal of Pharmaceutics, 102: 1-9 (1994).
234